|
2019 |
2020 |
2021 |
2022 |
2023 |
2024 |
|
Males |
Females |
Total |
Males |
Females |
Total |
Males |
Females |
Total |
Males |
Females |
Total |
Males |
Females |
Total |
Males |
Females |
Total |
| Arab countries |
835 |
965 |
1,800 |
826 |
996 |
1,822 |
821 |
1,068 |
1,889 |
693 |
1,029 |
1,722 |
434 |
996 |
1,430 |
412 |
1,026 |
1,438 |
| Non‐Arab Asian countries |
190 |
280 |
470 |
184 |
278 |
462 |
194 |
299 |
493 |
168 |
284 |
452 |
122 |
280 |
402 |
116 |
294 |
410 |
| Non‐Arab African countries |
4 |
7 |
11 |
4 |
10 |
14 |
4 |
14 |
18 |
3 |
13 |
16 |
1 |
100 |
11 |
1 |
11 |
12 |
| Europe |
35 |
26 |
61 |
33 |
23 |
56 |
35 |
24 |
59 |
40 |
23 |
63 |
37 |
24 |
61 |
41 |
30 |
71 |
| North America |
46 |
22 |
68 |
50 |
22 |
72 |
55 |
27 |
82 |
50 |
21 |
71 |
27 |
22 |
49 |
27 |
18 |
45 |
| South and Central America |
11 |
5 |
16 |
10 |
5 |
15 |
10 |
6 |
16 |
12 |
6 |
18 |
16 |
2 |
18 |
14 |
2 |
16 |
| Australia and Pacific |
8 |
6 |
14 |
9 |
6 |
15 |
9 |
6 |
15 |
5 |
5 |
10 |
6 |
3 |
9 |
5 |
4 |
9 |
| Other |
0 |
0 |
0 |
0 |
0 |
0 |
0 |
0 |
0 |
0 |
0 |
0 |
0 |
0 |
0 |
0 |
0 |
|
| Total |
1,129 |
1,311 |
2,440 |
1,116 |
1,340 |
2,456 |
1,128 |
1,444 |
2,572 |
971 |
1,381 |
2,352 |
643 |
1,337 |
1,980 |
616 |
1,385 |
2,001 |
Source: Central Statistical Bureau, Migration Statistics Bulletin, given years.
ANNEXED NOTE
1. Definitions
Ministry of Interior’s (Directorate of Migration’s) annual records of residency permits granted to foreign residents by type/ purpose
of permit, sex and regional origin of holder.
Data presented in the table are stock data: non-national residents holding a residence permit on December 31st, the given year
(residencies delivered for the first time a given year+residencies renewed that year)
The present figures include permits delivered for the purpose of residing in Kuwait, as a self-sponsored resident.
Self residence permit: Expatriates may sponsor themselves under article 24 of the regulations and obtain a residence for two
to five years under several conditions, among which: being aged 60 and more, having worked no less than 25 years in Kuwait,
owning a capital of 10,000 KD at least; holding a certificate of good conduct, effectively reside in Kuwait, etc.
This form of residence can be renewed upon expiry. Self-sponsored expatriates may sponsor their wives and children.
As of 2026, residency conditions underwent reforms:
https://www.fragomen.com/insights/kuwait-new-immigration-rules-increase-residency-and-visa-stay-periods-clarify-visit-visa-conversion-relax-passport-requirements-increase-fees.html
Residency procedures do not apply to GCC nationals and to Bidouns (stateless residents of Kuwait).
The table thus excludes the Bidouns, the non-Kuwaiti GCC citizens and those in irregular situation.
2. Institution which provides data
Central Statistical Bureau (CSB), Ministry of Planning.
3. Period of data coverage
December 31st, given years.
4. Data availability
The present data is taken from the “Migration Statistics” reports, published annually by the CSB.
The report (in Arabic and English, PDF format with Excel tables) is available on CSB’s website
(Population Statistics, then Migration Statistics)
https://www.csb.gov.kw/Pages/Statistics_en?ID=56&ParentCatID=1
https://www.csb.gov.kw/Pages/Statistics?ID=56&ParentCatID=1
Date of access: 01 July 2026.
GLMM and GRC cannot guarantee that the link to access the source will not change;
that the information will not be removed from the website it was obtained from;
that no geo-blockages will be imposed; or that the information will not be available for any another reason.
Keywords: Kuwait, Foreign Population, Legal Document, Residence Conditions, Sponsorship, Asia, Africa, Europe, North America, South America, Oceania
|
2019 |
2020 |
2021 |
2022 |
2023 |
2024 |
|
Males |
Females |
Total |
Males |
Females |
Total |
Males |
Females |
Total |
Males |
Females |
Total |
Males |
Females |
Total |
Males |
Females |
Total |
| Arab countries |
130,873 |
208,720 |
339,593 |
128,923 |
203,358 |
332,281 |
124,092 |
193,578 |
317,670 |
128,970 |
203,646 |
332,616 |
127,957 |
199,809 |
327,766 |
140,764 |
222,034 |
362,798 |
| Non‐Arab Asian countries |
63,436 |
120,943 |
184,379 |
61,564 |
114,795 |
176,359 |
59,386 |
106,171 |
165,557 |
61,334 |
109,909 |
171,243 |
57,914 |
102,797 |
160,711 |
59,082 |
105,909 |
164,991 |
| Non‐Arab African countries |
604 |
1,350 |
1,954 |
559 |
1,260 |
1,819 |
583 |
1,154 |
1,737 |
633 |
1,278 |
1,911 |
615 |
1,236 |
1,851 |
687 |
1,301 |
1,988 |
| Europe |
1,804 |
3,301 |
5,105 |
1,688 |
3,056 |
4,744 |
1,629 |
2,894 |
4,523 |
1,704 |
2,968 |
4,672 |
1,570 |
2,713 |
4,283 |
1,704 |
2,948 |
4,652 |
| North America |
4,111 |
5,091 |
9,202 |
4,048 |
4,916 |
8,964 |
3,967 |
4,689 |
8,656 |
3,970 |
4,812 |
8,782 |
3,734 |
4,467 |
8,201 |
3,848 |
4,587 |
8,435 |
| South and Central America |
288 |
580 |
868 |
275 |
518 |
793 |
268 |
469 |
737 |
297 |
521 |
818 |
305 |
483 |
788 |
342 |
529 |
871 |
| Australia and Pacific |
299 |
429 |
728 |
282 |
416 |
698 |
273 |
384 |
657 |
256 |
356 |
612 |
249 |
326 |
575 |
277 |
359 |
636 |
| Other |
0 |
1 |
1 |
0 |
1 |
1 |
0 |
0 |
0 |
0 |
0 |
0 |
0 |
0 |
0 |
0 |
0 |
0 |
| Total |
201,415 |
340,415 |
541,830 |
197,339 |
328,320 |
525,659 |
190,198 |
309,339 |
499,537 |
197,164 |
323,490 |
520,654 |
192,344 |
311,831 |
504,175 |
206,704 |
337,667 |
544,371 |
Source: Central Statistical Bureau, Migration Statistics Bulletin, given years.
ANNEXED NOTE
1. Definitions
Ministry of Interior’s (Directorate of Migration’s) annual records of residency permits granted to foreign residents by type/ purpose of permit, sex and regional origin of holder.
Data presented in the table are stock data: non-national residents holding a residence permit on December 31st, the given year
(residencies delivered for the first time a given year+residencies renewed that year)
Residencies are valid for 1 to 5 years.
The present figures include permits delivered for the purpose of residing in Kuwait, as a worker’s family member.
Spouse, children or elderly dependent relatives can only be sponsored by holders of visas n°17 (governmental employment) and 18 (private sector employment)
providing the expatriate holds a legal residency and meets the salary requirements.
A working wife cannot sponsor her husband as a dependent. Sons over the age of 21 years cannot be sponsored as dependents,
though adult unmarried daughters and parents may be permitted. Dependent family members are not allowed to work on a Dependent Visa.
Every foreign resident including new born babies must hold a residency permit.
Residency procedures do not apply to GCC nationals and to Bidouns (stateless residents of Kuwait).
The table thus excludes the Bidouns, the non-Kuwaiti GCC citizens and those in irregular situation.
Permits 17, 18, 19 and 20 are only granted after Ministry of Labour issues a work permit.
2. Institution which provides data
Central Statistical Bureau (CSB), Ministry of Planning.
3. Period of data coverage
December 31st, given years.
4. Data availability
The present data is taken from the “Migration Statistics” reports, published annually by the CSB.
The report (in Arabic and English, PDF format with Excel tables) is available on CSB’s website
(Population Statistics, then Migration Statistics)
https://www.csb.gov.kw/Pages/Statistics_en?ID=56&ParentCatID=1
https://www.csb.gov.kw/Pages/Statistics?ID=56&ParentCatID=1
Date of access: 01 July 2026.
GLMM and GRC cannot guarantee that the link to access the source will not change;
that the information will not be removed from the website it was obtained from;
that no geo-blockages will be imposed; or that the information will not be available for any another reason.
Keywords: Kuwait, Foreign Population, Employment, Legal Document, Residence Conditions, Family Reunification, Asia, Africa, Europe, North America, South America, Oceania
|
2019 |
2020 |
2021 |
2022 |
2023 |
2024 |
|
Males |
Females |
Total |
Males |
Females |
Total |
Males |
Females |
Total |
Males |
Females |
Total |
Males |
Females |
Total |
Males |
Females |
Total |
| Arab countries |
192 |
14 |
206 |
194 |
14 |
208 |
328 |
21 |
349 |
441 |
22 |
463 |
547 |
24 |
571 |
850 |
32 |
882 |
| Non‐Arab Asian countries |
115 |
3 |
118 |
115 |
3 |
118 |
186 |
9 |
195 |
240 |
9 |
249 |
301 |
10 |
311 |
426 |
15 |
441 |
| Non‐Arab African countries |
0 |
0 |
0 |
0 |
0 |
0 |
0 |
0 |
0 |
0 |
0 |
0 |
1 |
0 |
1 |
2 |
0 |
2 |
| Europe |
4 |
2 |
6 |
4 |
2 |
6 |
8 |
2 |
10 |
7 |
3 |
10 |
12 |
3 |
15 |
20 |
4 |
24 |
| North America |
17 |
1 |
18 |
20 |
0 |
20 |
35 |
2 |
37 |
38 |
1 |
39 |
57 |
3 |
60 |
65 |
3 |
68 |
| South and Central America |
5 |
0 |
5 |
5 |
0 |
5 |
7 |
1 |
8 |
8 |
2 |
10 |
10 |
2 |
12 |
13 |
2 |
15 |
| Australia and Pacific |
1 |
0 |
1 |
1 |
0 |
1 |
2 |
0 |
2 |
2 |
0 |
2 |
2 |
0 |
2 |
5 |
2 |
7 |
| Other |
0 |
0 |
0 |
0 |
0 |
0 |
0 |
0 |
0 |
0 |
0 |
0 |
0 |
0 |
0 |
0 |
0 |
0 |
| Total |
334 |
20 |
354 |
339 |
19 |
358 |
566 |
35 |
601 |
736 |
37 |
773 |
930 |
42 |
972 |
1,381 |
58 |
1,439 |
Source: Central Statistical Bureau, Migration Statistics Bulletin, given years.
ANNEXED NOTE
1. Definitions
Data taken from Ministry of Interior’s (Directorate of Migration’s) annual records of residency permits granted to foreign residents by type/ purpose of permit, sex and regional origin of holder.
Data presented in the table are stock data: non-national residents holding a residence permit on December 31st, the given year
(residencies delivered for the first time a given year+residencies renewed that year)
The present figures include permits delivered for the purpose of working as a freelancer in Kuwait.
New rules fpr freelance visas have been announced in February 2026:
https://eiglaw.com/kuwait-announces-new-freelance-residency-permit-allowing-foreign-workers-to-work-independently/
Residency procedures do not apply to GCC nationals and to Bidouns (stateless residents of Kuwait).
The table thus excludes the Bidouns, the non-Kuwaiti GCC citizens and those in irregular situation.
Permits 17, 18, 19 and 20 are only granted after Ministry of Labour issues a work permit.
2. Institution which provides data
Central Statistical Bureau (CSB), Ministry of Planning.
3. Period of data coverage
December 31st, given years.
4. Data availability
The present data is taken from the “Migration Statistics” reports, published annually by the CSB.
The report (in Arabic and English, PDF format with Excel tables) is available on CSB’s website
(Population Statistics, then Migration Statistics)
https://www.csb.gov.kw/Pages/Statistics_en?ID=56&ParentCatID=1
https://www.csb.gov.kw/Pages/Statistics?ID=56&ParentCatID=1
Date of access: 01 July 2026.
GLMM and GRC cannot guarantee that the link to access the source will not change;
that the information will not be removed from the website it was obtained from;
that no geo-blockages will be imposed; or that the information will not be available for any another reason.
Keywords: Kuwait, Foreign Population, Employment, Legal Document, Residence Conditions, Asia, Africa, Europe, North America, South America, Oceania
|
2019 |
2020 |
2021 |
2022 |
2023 |
2024 |
| Arab countries |
3,590 |
3,383 |
3,362 |
3,763 |
3,645 |
3,291 |
| Non‐Arab Asian countries |
694,698 |
639,276 |
570,857 |
732,319 |
765,077 |
712,890 |
| Non‐Arab African countries |
33,080 |
24,681 |
17,138 |
17,073 |
17,354 |
19,551 |
| Europe |
3 |
4 |
6 |
4 |
3 |
3 |
| North America |
0 |
0 |
0 |
0 |
0 |
0 |
| South and Central America |
4 |
4 |
4 |
5 |
6 |
4 |
| Australia and Pacific |
1 |
2 |
1 |
1 |
1 |
1 |
| Other |
0 |
0 |
0 |
0 |
0 |
0 |
| Total |
731,376 |
667,350 |
591,368 |
753,165 |
786,086 |
735,740 |
Source: Central Statistical Bureau, Migration Statistics Bulletin, given years.
ANNEXED NOTE
1. Definitions
Data taken from Ministry of Interior’s (Directorate of Migration’s) annual records of residency permits granted to foreign residents by type/ purpose of permit, sex and regional origin of holder.
The present figures include permits delivered for the purpose of working in the domestic sector in Kuwait (as cleaner, driver, cook, domestic gardener, shepherd, nannie, etc.).
The data presented in the table are stock data: all the non-national residents holding a residence permit , valid and/or effective
until the issuance of the Bulletin, on December 31st of the given year.
Residency procedures do not apply to GCC nationals and to Bidouns (stateless residents of Kuwait).
The table thus excludes the Bidouns, the non-Kuwaiti GCC citizens and those in irregular situation.
Permits 17, 18, 19 and 20 are only granted after Ministry of Labour issues a work permit.
2. Institution which provides data
Central Statistical Bureau (CSB), Ministry of Planning.
3. Period of data coverage
December 31st, given years.
4. Data availability
The present data is taken from the “Migration Statistics” reports, published annually by the CSB.
The report (in Arabic and English, PDF format with Excel tables) is available on CSB’s website (Population Statistics, then Migration Statistics)
https://www.csb.gov.kw/Pages/Statistics_en?ID=56&ParentCatID=1
https://www.csb.gov.kw/Pages/Statistics?ID=56&ParentCatID=1
Date of access: 15 June 2026.
GLMM and GRC cannot guarantee that the link to access the source will not change;
that the information will not be removed from the website it was obtained from;
that no geo-blockages will be imposed; or that the information will not be available for any another reason.
Keywords: Kuwait, Foreign Population, Employment, Domestic Workers, Legal Document, Residence Conditions, Asia, Africa, Europe, North America, South America, Oceania
|
2019 |
2020 |
2021 |
2022 |
2023 |
2024 |
|
Males |
Females |
Males |
Females |
Males |
Females |
Males |
Females |
Males |
Females |
Males |
Females |
| Arab countries |
3,403 |
187 |
3,210 |
173 |
3,204 |
158 |
3,612 |
151 |
3,504 |
141 |
3,151 |
140 |
| Non‐Arab Asian countries |
347,133 |
347,565 |
321,707 |
317,569 |
289,284 |
281,573 |
341,180 |
391,139 |
356,821 |
408,256 |
319,322 |
393,568 |
| Non‐Arab African countries |
3,268 |
29,812 |
2,722 |
21,959 |
2,297 |
14,841 |
2,690 |
14,383 |
3,057 |
14,297 |
3,203 |
16,348 |
| Europe |
2 |
1 |
1 |
3 |
2 |
4 |
1 |
3 |
1 |
2 |
0 |
3 |
| North America |
0 |
0 |
0 |
0 |
0 |
0 |
0 |
0 |
0 |
0 |
0 |
0 |
| South and Central America |
4 |
0 |
4 |
0 |
4 |
0 |
4 |
1 |
4 |
2 |
2 |
2 |
| Australia and Pacific |
0 |
1 |
1 |
1 |
1 |
0 |
1 |
0 |
1 |
0 |
1 |
0 |
| Other |
0 |
0 |
0 |
0 |
0 |
0 |
0 |
0 |
0 |
0 |
0 |
0 |
| Total |
353,810 |
377,566 |
327,645 |
339,705 |
294,792 |
296,576 |
347,488 |
405,677 |
363,388 |
422,698 |
325,679 |
410,061 |
Source: Central Statistical Bureau, Migration Statistics Bulletin, given years.
ANNEXED NOTE
1. Definitions
Data taken from Ministry of Interior’s (Directorate of Migration’s) annual records of residency permits granted to foreign residents by type/ purpose of permit, sex and regional origin of holder.
The present figures include permits delivered for the purpose of working in the domestic sector in Kuwait (as cleaner, driver, cook, domestic gardener, shepherd, nannie, etc.).
The data presented in the table are stock data: all the non-national residents holding a residence permit , valid and/or effective until the issuance of the Bulletin, on December 31st of the given year.
Residency procedures do not apply to GCC nationals and to Bidouns (stateless residents of Kuwait).
The table thus excludes the Bidouns, the non-Kuwaiti GCC citizens and those in irregular situation.
Permits 17, 18, 19 and 20 are only granted after Ministry of Labour issues a work permit.
2. Institution which provides data
Central Statistical Bureau (CSB), Ministry of Planning.
3. Period of data coverage
December 31st, given years.
4. Data availability
The present data is taken from the “Migration Statistics” reports, published annually by the CSB.
The report (in Arabic and English, PDF format with Excel tables) is available on CSB’s website (Population Statistics, then Migration Statistics)
https://www.csb.gov.kw/Pages/Statistics_en?ID=56&ParentCatID=1
https://www.csb.gov.kw/Pages/Statistics?ID=56&ParentCatID=1
Date of access: 15 June 2026.
GLMM and GRC cannot guarantee that the link to access the source will not change;
that the information will not be removed from the website it was obtained from;
that no geo-blockages will be imposed; or that the information will not be available for any another reason.
Keywords: Kuwait, Foreign Population, Employment, Domestic Workers, Legal Document, Residence Conditions, Asia, Africa, Europe, North America, South America, Oceania
|
2019 |
2020 |
2021 |
2022 |
2023 |
2024 |
|
Males |
Females |
Total |
Males |
Females |
Total |
Males |
Females |
Total |
Males |
Females |
Total |
Males |
Females |
Total |
Males |
Females |
Total |
| Arab countries |
37,003 |
19,309 |
56,312 |
34,865 |
18,878 |
53,743 |
33,542 |
18,454 |
51,996 |
33,634 |
18,766 |
52,400 |
33,485 |
18,324 |
51,809 |
33,495 |
18,578 |
52,073 |
| Non‐Arab Asian countries |
28,609 |
18,368 |
46,977 |
26,277 |
17,670 |
43,947 |
24,885 |
17,526 |
42,411 |
24,652 |
18,300 |
42,952 |
24,098 |
18,107 |
42,205 |
23,666 |
18,475 |
42,141 |
| Non‐Arab African countries |
351 |
146 |
497 |
321 |
152 |
473 |
322 |
142 |
464 |
346 |
143 |
489 |
343 |
146 |
489 |
346 |
144 |
490 |
| Europe |
598 |
413 |
1,011 |
544 |
369 |
913 |
509 |
296 |
805 |
605 |
298 |
903 |
650 |
296 |
946 |
659 |
277 |
936 |
| North America |
856 |
183 |
1,039 |
803 |
187 |
990 |
813 |
196 |
1,009 |
814 |
201 |
1,015 |
803 |
212 |
1,015 |
862 |
230 |
1,092 |
| South and Central America |
59 |
22 |
81 |
51 |
23 |
74 |
46 |
22 |
68 |
52 |
19 |
71 |
52 |
25 |
77 |
56 |
29 |
85 |
| Australia and Pacific |
44 |
9 |
53 |
40 |
9 |
49 |
42 |
6 |
48 |
41 |
8 |
49 |
41 |
10 |
51 |
40 |
10 |
50 |
| Other |
0 |
0 |
0 |
0 |
0 |
0 |
0 |
2 |
2 |
0 |
1 |
1 |
0 |
0 |
0 |
0 |
1 |
1 |
| Total |
67,520 |
38,450 |
105,970 |
62,901 |
37,288 |
100,189 |
60,159 |
36,644 |
96,803 |
60,144 |
37,736 |
97,880 |
59,472 |
37,120 |
96,592 |
59,124 |
37,744 |
96,868 |
Source: Central Statistical Bureau, Migration Statistics Bulletin, given years.
ANNEXED NOTE
1. Definitions
Data taken from Ministry of Interior’s (Directorate of Migration’s) annual records of residency permits granted to foreign residents by type/ purpos of permit, sex and regional origin of holder.
The present figures include permits delivered for the purpose of working in the governmental sector in Kuwait.
The data presented in the table are stock data: all the non-national residents holding a residence permit , valid and/or effective
until the issuance of the Bulletin, on December 31st of the given year.
Residency procedures do not apply to GCC nationals and to Bidouns (stateless residents of Kuwait).
The table thus excludes the Bidouns, the non-Kuwaiti GCC citizens and those in irregular situation.
Permits 17, 18, 19 and 20 are only granted after Ministry of Labour issues a work permit.
2. Institution which provides data
Central Statistical Bureau (CSB), Ministry of Planning.
3. Period of data coverage
December 31st, given years.
4. Data availability
The present data is taken from the “Migration Statistics” reports, published annually by the CSB.
The report (in Arabic and English, PDF format with Excel tables) is available on CSB’s website (Population Statistics, then Migration Statistics)
https://www.csb.gov.kw/Pages/Statistics_en?ID=56&ParentCatID=1
https://www.csb.gov.kw/Pages/Statistics?ID=56&ParentCatID=1
Date of access: 15 June 2026.
GLMM and GRC cannot guarantee that the link to access the source will not change;
that the information will not be removed from the website it was obtained from;
that no geo-blockages will be imposed; or that the information will not be available for any another reason.
Keywords: Kuwait, Foreign Population, Employment, Legal Document, Residence Conditions
|
2019 |
2020 |
2021 |
2022 |
2023 |
2024 |
| Arab countries |
576,804 |
539,583 |
505,881 |
552,510 |
557,322 |
566,620 |
| Non‐Arab Asian countries |
944,661 |
822,386 |
722,500 |
836,695 |
913,787 |
988,151 |
| Non‐Arab African countries |
8,766 |
7,787 |
7,296 |
10,932 |
15,082 |
23,315 |
| Europe |
7,077 |
6,000 |
5,432 |
5,724 |
5,833 |
5,889 |
| North America |
8,390 |
7,223 |
6,387 |
7,188 |
7,274 |
7,448 |
| South and Central America |
886 |
800 |
756 |
921 |
1,009 |
1,049 |
| Australia and Pacific |
621 |
557 |
483 |
473 |
469 |
496 |
| Other |
0 |
0 |
0 |
0 |
0 |
0 |
| Total |
1,547,205 |
1,384,336 |
1,248,735 |
1,414,443 |
1,500,776 |
1,592,968 |
Source: Central Statistical Bureau, Migration Statistics Bulletin, given years.
ANNEXED NOTE
1. Definitions
Data taken from Ministry of Interior’s (Directorate of Migration’s) annual records of residency permits granted to foreign residents by type/ purpose of permit, sex and regional origin of holder.
The data presented in the table are stock data: all the non-national residents holding a residence permit to work in the private sector, valid and/or effective until the issuance of the Bulletin, on December 31st of the given year,
Residency procedures do not apply to GCC nationals and to Bidouns (stateless residents of Kuwait).
The table thus excludes the Bidouns, the non-Kuwaiti GCC citizens and those in irregular situation.
Dependent permit: spouse, children or elderly dependent relatives can join visa holder (sponsor) in Kuwait,
if the expatriate has obtained a residency and meets the salary requirements.
A working wife cannot sponsor her husband as a dependent. Sons over the age of 21 years cannot be sponsored as dependents,
though adult daughters and parents may be permitted. Dependent family members are not allowed to work on a Dependent Visa.
Every foreign resident including new born babies must hold a residency permit.
Self residence permit: Expatriates may sponsor themselves under article 24 of the regulations and obtain a residence for two
to five years under several conditions, among which: being aged 60 and more, having worked no less than 25 years in Kuwait,
owning a capital of 10,000 KD at least; holding a certificate of good conduct, effectively reside in Kuwait, etc.
This form of residence can be renewed upon expiry. Self-sponsored expatriates may sponsor their wives and children.
Permits 17, 18, 19 and 20 are only granted after Ministry of Labour issues a work permit.
2. Institution which provides data
Central Statistical Bureau (CSB), Ministry of Planning.
3. Period of data coverage
December 31st, given years.
4. Data availability
The present data is taken from the “Migration Statistics” reports, published annually by the CSB.
The report (in Arabic and English, PDF format with Excel tables) is available on CSB’s website
(Population Statistics, then Migration Statistics)
https://www.csb.gov.kw/Pages/Statistics_en?ID=56&ParentCatID=1
https://www.csb.gov.kw/Pages/Statistics?ID=56&ParentCatID=1
Date of access: 15 June 2026.
GLMM and GRC cannot guarantee that the link to access the source will not change;
that the information will not be removed from the website it was obtained from;
that no geo-blockages will be imposed; or that the information will not be available for any another reason.
Keywords: Kuwait, Foreign Population, Employment, Legal Document, Residence Conditions
|
2019 |
2020 |
2021 |
2022 |
2023 |
2024 |
| Arab countries |
538,791 |
502,682 |
468,023 |
510,700 |
511,003 |
516,114 |
| Non‐Arab Asian countries |
857,629 |
741,213 |
646,865 |
746,837 |
810,296 |
873,449 |
| Non‐Arab African countries |
6,259 |
5,529 |
5,156 |
8,092 |
11,234 |
17,726 |
| Europe |
4,883 |
4,127 |
3,561 |
3,683 |
3,684 |
3,724 |
| North America |
6,192 |
5,320 |
4,580 |
5,228 |
5,174 |
5,308 |
| South and Central America |
675 |
592 |
553 |
673 |
722 |
732 |
| Australia and Pacific |
471 |
431 |
358 |
339 |
336 |
362 |
| Other |
0 |
0 |
0 |
0 |
0 |
0 |
| Total |
1,414,900 |
1,259,894 |
1,129,096 |
1,275,552 |
1,342,449 |
1,417,415 |
Source: Central Statistical Bureau, Migration Statistics Bulletin, given years.
ANNEXED NOTE
1. Definitions
Data taken from Ministry of Interior’s (Directorate of Migration’s) annual records of residency permits granted to foreign residents by type/ purpose of permit, sex and regional origin of holder.
The data presented in the table are stock data: all the non-national residents holding a residence permit to work in the private sector, valid and/or effective until the issuance of the Bulletin, on December 31st of the given year,
Residency procedures do not apply to GCC nationals and to Bidouns (stateless residents of Kuwait).
The table thus excludes the Bidouns, the non-Kuwaiti GCC citizens and those in irregular situation.
Dependent permit: spouse, children or elderly dependent relatives can join visa holder (sponsor) in Kuwait,if the expatriate has obtained a residency and meets the salary requirements.
A working wife cannot sponsor her husband as a dependent. Sons over the age of 21 years cannot be sponsored as dependents,
though adult daughters and parents may be permitted. Dependent family members are not allowed to work on a Dependent Visa.
Every foreign resident including new born babies must hold a residency permit.
Self residence permit: Expatriates may sponsor themselves under article 24 of the regulations and obtain a residence for two
to five years under several conditions, among which: being aged 60 and more, having worked no less than 25 years in Kuwait,
owning a capital of 10,000 KD at least; holding a certificate of good conduct, effectively reside in Kuwait, etc.
This form of residence can be renewed upon expiry. Self-sponsored expatriates may sponsor their wives and children.
Permits 17, 18, 19 and 20 are only granted after Ministry of Labour issues a work permit.
2. Institution which provides data
Central Statistical Bureau (CSB), Ministry of Planning.
3. Period of data coverage
December 31st, given years.
4. Data availability
The present data is taken from the “Migration Statistics” reports, published annually by the CSB.
The report (in Arabic and English, PDF format with Excel tables) is available on CSB’s website
(Population Statistics, then Migration Statistics)
https://www.csb.gov.kw/Pages/Statistics_en?ID=56&ParentCatID=1
https://www.csb.gov.kw/Pages/Statistics?ID=56&ParentCatID=1
Date of access: 15 June 2026.
GLMM and GRC cannot guarantee that the link to access the source will not change;
that the information will not be removed from the website it was obtained from;
that no geo-blockages will be imposed; or that the information will not be available for any another reason.
Keywords: Kuwait, Foreign Population, Employment, Legal Document, Residence Conditions
|
2019 |
2020 |
2021 |
2022 |
2023 |
2024 |
| Arab countries |
38,013 |
36,901 |
37,858 |
41,810 |
46,319 |
50,506 |
| Non‐Arab Asian countries |
87,032 |
81,173 |
75,635 |
89,858 |
103,491 |
114,702 |
| Non‐Arab African countries |
2,507 |
2,258 |
2,140 |
2,840 |
3,848 |
5,589 |
| Europe |
2,194 |
1,873 |
1,871 |
2,041 |
2,149 |
2,165 |
| North America |
2,198 |
1,903 |
1,807 |
1,960 |
2,100 |
2,140 |
| South and Central America |
211 |
208 |
203 |
248 |
287 |
317 |
| Australia and Pacific |
150 |
126 |
125 |
134 |
133 |
134 |
| Other |
0 |
0 |
0 |
0 |
0 |
0 |
| Total |
132,305 |
124,442 |
119,639 |
138,891 |
158,327 |
175,553 |
Source: Central Statistical Bureau, Migration Statistics Bulletin, given years.
ANNEXED NOTE
1. Definitions
Data taken from Ministry of Interior’s (Directorate of Migration’s) annual records of residency permits granted to foreign residents by type/ purpose of permit, sex and regional origin of holder.
The data presented in the table are stock data: all the non-national residents holding a residence permit to work in the private sector, valid and/or effective until the issuance of the Bulletin, on December 31st of the given year,
Residency procedures do not apply to GCC nationals and to Bidouns (stateless residents of Kuwait).
The table thus excludes the Bidouns, the non-Kuwaiti GCC citizens and those in irregular situation.
Dependent permit: spouse, children or elderly dependent relatives can join visa holder (sponsor) in Kuwait,if the expatriate has obtained a residency and meets the salary requirements.
A working wife cannot sponsor her husband as a dependent. Sons over the age of 21 years cannot be sponsored as dependents,
though adult daughters and parents may be permitted. Dependent family members are not allowed to work on a Dependent Visa.
Every foreign resident including new born babies must hold a residency permit.
Self residence permit: Expatriates may sponsor themselves under article 24 of the regulations and obtain a residence for two
to five years under several conditions, among which: being aged 60 and more, having worked no less than 25 years in Kuwait,
owning a capital of 10,000 KD at least; holding a certificate of good conduct, effectively reside in Kuwait, etc.
This form of residence can be renewed upon expiry. Self-sponsored expatriates may sponsor their wives and children.
Permits 17, 18, 19 and 20 are only granted after Ministry of Labour issues a work permit.
2. Institution which provides data
Central Statistical Bureau (CSB), Ministry of Planning.
3. Period of data coverage
December 31st, given years.
4. Data availability
The present data is taken from the “Migration Statistics” reports, published annually by the CSB.
The report (in Arabic and English, PDF format with Excel tables) is available on CSB’s website (Population Statistics, then Migration Statistics)
https://www.csb.gov.kw/Pages/Statistics_en?ID=56&ParentCatID=1
https://www.csb.gov.kw/Pages/Statistics?ID=56&ParentCatID=1
Date of access: 15 June 2026.
GLMM and GRC cannot guarantee that the link to access the source will not change;
that the information will not be removed from the website it was obtained from;
that no geo-blockages will be imposed; or that the information will not be available for any another reason.
Keywords: Kuwait, Foreign Population, Employment, Legal Document, Residence Conditions
|
2017 |
2018 |
2019 |
2020 |
2021 |
2022 |
2023 |
2024 |
| Arab countries |
651,246 |
686,601 |
690,455 |
670,747 |
630,047 |
678,087 |
676,964 |
694,817 |
| Non‐Arab Asian countries |
1,251,440 |
1,311,673 |
1,310,185 |
1,151,263 |
1,020,961 |
1,174,599 |
1,249,759 |
1,276,256 |
| Non‐Arab African countries |
8,791 |
9,864 |
10,728 |
9,382 |
8,527 |
11,991 |
15,511 |
22,221 |
| Europe |
7,643 |
7,683 |
6,823 |
6,412 |
5,756 |
6,054 |
5,979 |
6,167 |
| North America |
11,707 |
11,731 |
10,484 |
10,242 |
9,452 |
10,101 |
9,796 |
10,110 |
| South and Central America |
837 |
999 |
1,008 |
937 |
888 |
1,046 |
1,109 |
1,159 |
| Australia and Pacific |
864 |
853 |
788 |
764 |
685 |
646 |
637 |
690 |
| Other |
1 |
1 |
1 |
0 |
0 |
0 |
0 |
0 |
| Total |
1,932,529 |
2,029,405 |
2,030,472 |
1,849,747 |
1,676,316 |
1,882,524 |
1,959,755 |
2,011,420 |
Source: Central Statistical Bureau, Migration Statistics Bulletin, given years.
ANNEXED NOTE
1. Definitions
Data taken from Ministry of Interior’s (Directorate of Migration’s) annual records of residency permits granted to foreign residents by type/ purpose of permit, sex and regional origin of holder.
The data presented in the table are stock data: all the non-national residents holding a residence permit valid and/or effective until the issuance of the Bulletin,
on December 31st of the given year,
EXCEPT the numbers of holders of permit n°14 (temporary residents), which are not available before 2019 and were not included in this table.
The present figures include permits delivered for all other purposes of stay in Kuwait:
1- Labour in all sectors: governmental sector (n°17); private sector (n°18); business (freelance) (n°19) and domestic sector (n°20)
2- Residence: as family dependent (permit n°22); studies (n°23) and self-residence (n°24).
Residency procedures do not apply to GCC nationals and to Bidouns (stateless residents of Kuwait).
The table thus excludes the Bidouns, the non-Kuwaiti GCC citizens and those in irregular situation.
Dependent permit: spouse, children or elderly dependent relatives can join visa holder (sponsor) in Kuwait,
if the expatriate has obtained a residency and meets the salary requirements.
A working wife cannot sponsor her husband as a dependent. Sons over the age of 21 years cannot be sponsored as dependents,
though adult daughters and parents may be permitted. Dependent family members are not allowed to work on a Dependent Visa.
Every foreign resident including new born babies must hold a residency permit.
Self residence permit: Expatriates may sponsor themselves under article 24 of the regulations and obtain a residence for two
to five years under several conditions, among which: being aged 60 and more, having worked no less than 25 years in Kuwait,
owning a capital of 10,000 KD at least; holding a certificate of good conduct, effectively reside in Kuwait, etc.
This form of residence can be renewed upon expiry. Self-sponsored expatriates may sponsor their wives and children.
Permits 17, 18, 19 and 20 are only granted after Ministry of Labour issues a work permit.
2. Institution which provides data
Central Statistical Bureau (CSB), Ministry of Planning.
3. Period of data coverage
December 31st, given years.
4. Data availability
The present data is taken from the “Migration Statistics” reports, published annually by the CSB.
The report (in Arabic and English, PDF format with Excel tables) is available on CSB’s website
(Population Statistics, then Migration Statistics)
https://www.csb.gov.kw/Pages/Statistics_en?ID=56&ParentCatID=1
https://www.csb.gov.kw/Pages/Statistics?ID=56&ParentCatID=1
Date of access: 29 May 2026.
GLMM and GRC cannot guarantee that the link to access the source will not change;
that the information will not be removed from the website it was obtained from;
that no geo-blockages will be imposed; or that the information will not be available for any another reason.
Keywords: Kuwait, Foreign Population, Employment, Legal Document, Residence Conditions, Family Reunification
|
2017 |
2018 |
2019 |
2020 |
2021 |
2022 |
2023 |
2024 |
| Arab countries |
264,923 |
265,660 |
287,920 |
260,345 |
251,164 |
265,443 |
265,630 |
292,334 |
| Non‐Arab Asian countries |
524,479 |
537,377 |
561,491 |
531,552 |
481,261 |
609,571 |
633,051 |
633,078 |
| Non‐Arab African countries |
38,463 |
43,914 |
33,911 |
25,710 |
18,339 |
18,714 |
19,599 |
23,451 |
| Europe |
5,922 |
6,043 |
6,477 |
5,336 |
5,098 |
5,344 |
5,204 |
5,442 |
| North America |
7,372 |
7,492 |
8,234 |
7,028 |
6,721 |
6,995 |
6,804 |
6,978 |
| South and Central America |
662 |
747 |
853 |
755 |
702 |
798 |
801 |
881 |
| Australia and Pacific |
603 |
616 |
631 |
558 |
521 |
509 |
472 |
509 |
| Other |
2 |
1 |
0 |
1 |
2 |
1 |
0 |
1 |
| Total |
842,426 |
861,850 |
899,517 |
831,285 |
763,808 |
907,375 |
931,561 |
962,674 |
Source: Central Statistical Bureau, Migration Statistics Bulletin, given years.
ANNEXED NOTE
1. Definitions
Data taken from Ministry of Interior’s (Directorate of Migration’s) annual records of residency permits granted to foreign residents by type/ purpose of permit, sex and regional origin of holder.
The data presented in the table are stock data: all the non-national residents holding a residence permit valid and/or effective until the issuance of the Bulletin, on December 31st of the given year,
EXCEPT the numbers of holders of permit n°14 (temporary residents), which are not available before 2019 and were not included in this table.
The present figures include permits delivered for all other purposes of stay in Kuwait:
1- Labour in all sectors: governmental sector (n°17); private sector (n°18); business (freelance) (n°19) and domestic sector (n°20)
2- Residence: as family dependent (permit n°22); studies (n°23) and self-residence (n°24).
Residency procedures do not apply to GCC nationals and to Bidouns (stateless residents of Kuwait).
The table thus excludes the Bidouns, the non-Kuwaiti GCC citizens and those in irregular situation.
Dependent permit: spouse, children or elderly dependent relatives can join visa holder (sponsor) in Kuwait,
if the expatriate has obtained a residency and meets the salary requirements.
A working wife cannot sponsor her husband as a dependent. Sons over the age of 21 years cannot be sponsored as dependents,
though adult daughters and parents may be permitted. Dependent family members are not allowed to work on a Dependent Visa.
Every foreign resident including new born babies must hold a residency permit.
Self residence permit: Expatriates may sponsor themselves under article 24 of the regulations and obtain a residence for two
to five years under several conditions, among which: being aged 60 and more, having worked no less than 25 years in Kuwait,
owning a capital of 10,000 KD at least; holding a certificate of good conduct, effectively reside in Kuwait, etc.
This form of residence can be renewed upon expiry. Self-sponsored expatriates may sponsor their wives and children.
Permits 17, 18, 19 and 20 are only granted after Ministry of Labour issues a work permit.
2. Institution which provides data
Central Statistical Bureau (CSB), Ministry of Planning.
3. Period of data coverage
December 31st, given years.
4. Data availability
The present data is taken from the “Migration Statistics” reports, published annually by the CSB.
The report (in Arabic and English, PDF format with Excel tables) is available on CSB’s website
(Population Statistics, then Migration Statistics)
https://www.csb.gov.kw/Pages/Statistics_en?ID=56&ParentCatID=1
https://www.csb.gov.kw/Pages/Statistics?ID=56&ParentCatID=1
Date of access: 29 May 2026.
GLMM and GRC cannot guarantee that the link to access the source will not change;
that the information will not be removed from the website it was obtained from;
that no geo-blockages will be imposed; or that the information will not be available for any another reason.
Keywords: Kuwait, Foreign Population, Employment, Legal Document, Residence Conditions, Family Reunification
|
2011 |
2012 |
2013 |
2014 |
2015 |
2016 |
2017 |
2018 |
2019 |
2020 |
2021 |
2022 |
2023 |
2024 |
| Arab countries |
722,575 |
750,426 |
802,213 |
837,363 |
877,959 |
898,660 |
916,169 |
952,261 |
978,375 |
931,092 |
881,211 |
943,530 |
942,594 |
987,151 |
| Non‐Arab Asian countries |
1,338,340 |
1,391,040 |
1,458,161 |
1,525,083 |
1,620,129 |
1,714,717 |
1,775,919 |
1,849,050 |
1,871,676 |
1,682,815 |
1,502,222 |
1,784,170 |
1,882,810 |
1,909,334 |
| Non‐Arab African countries |
73,403 |
83,144 |
93,004 |
73,300 |
61,070 |
49,634 |
47,254 |
53,778 |
44,639 |
35,092 |
26,866 |
30,705 |
35,110 |
45,672 |
| Europe |
10,216 |
10,554 |
10,921 |
11,443 |
12,081 |
12,482 |
13,565 |
13,726 |
13,300 |
11,748 |
10,854 |
11,398 |
11,183 |
11,609 |
| North America |
19,191 |
19,311 |
18,244 |
18,297 |
18,403 |
18,860 |
19,079 |
19,223 |
18,718 |
17,270 |
16,173 |
17,096 |
16,600 |
17,088 |
| South and Central America |
1,121 |
1,131 |
1,109 |
1,104 |
1,179 |
1,343 |
1,499 |
1,746 |
1,861 |
1,692 |
1,590 |
1,844 |
1,910 |
2,040 |
| Australia and Pacific |
1,416 |
1,408 |
1,426 |
1,419 |
1,452 |
1,495 |
1,467 |
1,469 |
1,419 |
1,322 |
1,206 |
1,155 |
1,109 |
1,199 |
| Other |
13 |
13 |
11 |
9 |
3 |
4 |
3 |
2 |
1 |
1 |
2 |
1 |
0 |
1 |
| Total |
2,166,275 |
2,257,027 |
2,385,089 |
2,468,018 |
2,592,276 |
2,697,195 |
2,774,955 |
2,891,255 |
2,929,989 |
2,681,032 |
2,440,124 |
2,789,899 |
2,891,316 |
2,974,094 |
Source: Central Statistical Bureau, Migration Statistics Bulletin, given years.
ANNEXED NOTE
1. Definitions
Data taken from Ministry of Interior’s (Directorate of Migration’s) annual records of residency permits granted to foreign residents by type/ purpose of permit, sex and regional origin of holder.
The data presented in the table are stock data: all the non-national residents holding a residence permit valid and/or effective until the issuance of the Bulletin,
on December 31st of the given year,
EXCEPT the numbers of holders of permit n°14 (temporary residents), which are not available before 2019 and were not included in this table.
The present figures include permits delivered for all other purposes of stay in Kuwait:
1- Labour in all sectors: governmental sector (n°17); private sector (n°18); business (freelance) (n°19) and domestic sector (n°20)
2- Residence: as family dependent (permit n°22); studies (n°23) and self-residence (n°24).
Residency procedures do not apply to GCC nationals and to Bidouns (stateless residents of Kuwait).
The table thus excludes the Bidouns, the non-Kuwaiti GCC citizens and those in irregular situation.
Dependent permit: spouse, children or elderly dependent relatives can join visa holder (sponsor) in Kuwait,
if the expatriate has obtained a residency and meets the salary requirements.
A working wife cannot sponsor her husband as a dependent. Sons over the age of 21 years cannot be sponsored as dependents,
though adult daughters and parents may be permitted. Dependent family members are not allowed to work on a Dependent Visa.
Every foreign resident including new born babies must hold a residency permit.
Self residence permit: Expatriates may sponsor themselves under article 24 of the regulations and obtain a residence for two
to five years under several conditions, among which: being aged 60 and more, having worked no less than 25 years in Kuwait,
owning a capital of 10,000 KD at least; holding a certificate of good conduct, effectively reside in Kuwait, etc.
This form of residence can be renewed upon expiry. Self-sponsored expatriates may sponsor their wives and children.
Permits 17, 18, 19 and 20 are only granted after Ministry of Labour issues a work permit.
2. Institution which provides data
Central Statistical Bureau (CSB), Ministry of Planning.
3. Period of data coverage
December 31st, given years.
4. Data availability
The present data is taken from the “Migration Statistics” reports, published annually by the CSB.
The report (in Arabic and English, PDF format with Excel tables) is available on CSB’s website
(Population Statistics, then Migration Statistics)
https://www.csb.gov.kw/Pages/Statistics_en?ID=56&ParentCatID=1
https://www.csb.gov.kw/Pages/Statistics?ID=56&ParentCatID=1
Date of access: 29 May 2026.
GLMM and GRC cannot guarantee that the link to access the source will not change;
that the information will not be removed from the website it was obtained from;
that no geo-blockages will be imposed; or that the information will not be available for any another reason.
Keywords: Kuwait, Foreign Population, Employment, Legal Document, Residence Conditions, Family Reunification
| Migration status (Purpose of permit) |
Reference number of permits |
Type of permit |
2015 |
2016 |
2017 |
2018 |
2019 |
2020 |
2021 |
2022 |
2023 |
2024 |
|
work
|
17 |
Government sector |
107,710 |
109,714 |
110,245 |
107,657 |
105,970 |
100,189 |
96,803 |
97,880 |
96,592 |
96,868 |
| 18 |
Private sector |
1,293,578 |
1,373,378 |
1,442,608 |
1,531,234 |
1,547,205 |
1,384,336 |
1,248,735 |
1,414,443 |
1,500,776 |
1,592,968 |
| 19 |
Business |
383 |
369 |
359 |
360 |
354 |
358 |
601 |
773 |
972 |
1,439 |
| 20 |
Domestic work |
651,386 |
666,422 |
677,592 |
707,061 |
731,376 |
667,350 |
591,368 |
753,165 |
786,086 |
735,740 |
|
residence
|
22 |
Dependent |
536,326 |
544,150 |
540,904 |
541,630 |
541,830 |
525,659 |
499,537 |
520,654 |
504,175 |
544,371 |
| 23 |
Study |
630 |
865 |
861 |
869 |
814 |
684 |
508 |
632 |
735 |
707 |
| 24 |
Self-residence |
2,263 |
2,297 |
2,386 |
2,444 |
2,440 |
2,456 |
2,572 |
2,352 |
1,980 |
2,001 |
| Total residencies 1 year and more |
2,592,276 |
2,697,195 |
2,774,955 |
2,891,255 |
2,929,989 |
2,681,032 |
2,440,124 |
2,789,899 |
2,891,316 |
2,974,094 |
| Temporary |
14 |
Temporary residence |
n.a. |
n.a. |
n.a. |
n.a. |
70,624 |
65,407 |
80,177 |
48,714 |
47,538 |
50,694 |
|
|
|
|
n.a. |
n.a. |
n.a. |
n.a. |
3,000,613 |
2,746,439 |
2,520,301 |
2,838,613 |
2,938,854 |
3,024,788 |
Source: Central Statistical Bureau, Migration Statistics Bulletin, given years.
ANNEXED NOTE
1. Definitions
Data taken from Ministry of Interior’s (Directorate of Migration’s) annual records of residency permits granted to foreign residents by type/ purpose of permit, sex and regional origin of holder.
The data presented in the table are stock data: all the non-national residents holding a residence permit on December 31st, the given year.
The present figures include permits delivered for all purposes of stay in Kuwait:
1- Labour in all sectors: governmental sector (n°17); private sector (n°18); business (freelance) (n°19) and domestic sector (n°20)
2- Residence: as family dependent (permit n°22); studies (n°23) and self-residence (n°24).
Residency procedures do not apply to GCC nationals and to Bidouns (stateless residents of Kuwait).
The table thus excludes the Bidouns, the non-Kuwaiti GCC citizens and those in irregular situation.
The number of holders of permit n°14 (temporary residents) is not available before 2019.
Dependent permit: spouse, children or elderly dependent relatives can join visa holder (sponsor) in Kuwait,
if the expatriate has obtained a residency and meets the salary requirements.
A working wife cannot sponsor her husband as a dependent. Sons over the age of 21 years cannot be sponsored as dependents,
though adult daughters and parents may be permitted. Dependent family members are not allowed to work on a Dependent Visa.
Every foreign resident including new born babies must hold a residency permit.
Self residence permit: Expatriates may sponsor themselves under article 24 of the regulations and obtain a residence for two
to five years under several conditions, among which: being aged 60 and more, having worked no less than 25 years in Kuwait,
owning a capital of 10,000 KD at least; holding a certificate of good conduct, effectively reside in Kuwait, etc.
This form of residence can be renewed upon expiry. Self-sponsored expatriates may sponsor their wives and children.
Permits 17, 18, 19 and 20 are only granted after Ministry of Labour issues a work permit.
2. Institution which provides data
Central Statistical Bureau (CSB), Ministry of Planning.
3. Period of data coverage
December 31st, given years.
4. Data availability
The present data is taken from the “Migration Statistics” reports, published annually by the CSB.
The report (in Arabic and English, PDF format with Excel tables) is available on CSB’s website
(Population Statistics, then Migration Statistics)
https://www.csb.gov.kw/Pages/Statistics_en?ID=56&ParentCatID=1
https://www.csb.gov.kw/Pages/Statistics?ID=56&ParentCatID=1
Date of access: 29 May 2026.
GLMM and GRC cannot guarantee that the link to access the source will not change;
that the information will not be removed from the website it was obtained from;
that no geo-blockages will be imposed; or that the information will not be available for any another reason.
Keywords: Kuwait, Foreign Population, Employment, Legal Document, Residence Conditions, Family Reunification
| Migration status (Purpose of permit) |
Reference number of permits |
Type of permit |
2015 |
2016 |
2017 |
2018 |
2019 |
2020 |
2021 |
2022 |
2023 |
2024 |
|
work
|
17 |
Government sector |
68,372 |
69,213 |
69,955 |
68,481 |
67,520 |
62,901 |
60,159 |
60,144 |
59,472 |
59,124 |
| 18 |
Private sector |
1,184,327 |
1,259,620 |
1,323,096 |
1,405,123 |
1,414,900 |
1,259,894 |
1,129,096 |
1,275,552 |
1,342,449 |
1,417,415 |
| 19 |
Business |
365 |
351 |
339 |
344 |
334 |
339 |
566 |
736 |
930 |
1,381 |
| 20 |
Domestic work |
288,153 |
312,735 |
337,009 |
352,234 |
353,810 |
327,645 |
294,792 |
347,488 |
363,388 |
325,679 |
|
residence
|
22 |
Dependent |
196,654 |
199,858 |
200,327 |
201,393 |
201,415 |
197,339 |
190,198 |
197,164 |
192,344 |
206,704 |
| 23 |
Study |
459 |
651 |
632 |
643 |
603 |
513 |
377 |
469 |
529 |
501 |
| 24 |
Self-residence |
1,149 |
1,148 |
1,171 |
1,187 |
1,129 |
1,116 |
1,128 |
971 |
643 |
616 |
| Total residencies 1 year and more |
1,739,479 |
1,843,576 |
1,932,529 |
2,029,405 |
2,039,711 |
1,849,747 |
1,676,316 |
1,882,524 |
1,959,755 |
2,011,420 |
| Temporary |
14 |
Temporary residence |
n.a. |
n.a. |
n.a. |
n.a. |
58,281 |
50,520 |
62,667 |
37,243 |
37,624 |
36,426 |
|
|
|
|
n.a. |
n.a. |
n.a. |
n.a. |
2,097,992 |
1,900,267 |
1,738,983 |
1,919,767 |
1,997,379 |
2,047,846 |
Source: Central Statistical Bureau, Migration Statistics Bulletin, given years.
ANNEXED NOTE
1. Definitions
Data taken from Ministry of Interior’s (Directorate of Migration’s) annual records of residency permits granted to foreign residents by type/ purpose of permit, sex and regional origin of holder.
The data presented in the table are stock data: all the non-national residents holding a residence permit on December 31st, the given year.
The present figures include permits delivered for all purposes of stay in Kuwait:
1- Labour in all sectors: governmental sector (n°17); private sector (n°18); business (freelance) (n°19) and domestic sector (n°20)
2- Residence: as family dependent (permit n°22); studies (n°23) and self-residence (n°24).
Residency procedures do not apply to GCC nationals and to Bidouns (stateless residents of Kuwait).
The table thus excludes the Bidouns, the non-Kuwaiti GCC citizens and those in irregular situation.
The number of holders of permit n°14 (temporary residents) is not available before 2019.
Dependent permit: spouse, children or elderly dependent relatives can join visa holder (sponsor) in Kuwait,
if the expatriate has obtained a residency and meets the salary requirements.
A working wife cannot sponsor her husband as a dependent. Sons over the age of 21 years cannot be sponsored as dependents,
though adult daughters and parents may be permitted. Dependent family members are not allowed to work on a Dependent Visa.
Every foreign resident including new born babies must hold a residency permit.
Self residence permit: Expatriates may sponsor themselves under article 24 of the regulations and obtain a residence for two
to five years under several conditions, among which: being aged 60 and more, having worked no less than 25 years in Kuwait,
owning a capital of 10,000 KD at least; holding a certificate of good conduct, effectively reside in Kuwait, etc.
This form of residence can be renewed upon expiry. Self-sponsored expatriates may sponsor their wives and children.
Permits 17, 18, 19 and 20 are only granted after Ministry of Labour issues a work permit.
2. Institution which provides data
Central Statistical Bureau (CSB), Ministry of Planning.
3. Period of data coverage
December 31st, given years.
4. Data availability
The present data is taken from the “Migration Statistics” reports, published annually by the CSB.
The report (in Arabic and English, PDF format with Excel tables) is available on CSB’s website
(Population Statistics, then Migration Statistics)
https://www.csb.gov.kw/Pages/Statistics_en?ID=56&ParentCatID=1
https://www.csb.gov.kw/Pages/Statistics?ID=56&ParentCatID=1
Date of access: 29 May 2026.
GLMM and GRC cannot guarantee that the link to access the source will not change;
that the information will not be removed from the website it was obtained from;
that no geo-blockages will be imposed; or that the information will not be available for any another reason.
Keywords: Kuwait, Foreign Population, Employment, Legal Document, Residence Conditions, Family Reunification
| Migration status (Purpose of permit) |
Reference number of permits |
Type of permit |
2015 |
2016 |
2017 |
2018 |
2019 |
2020 |
2021 |
2022 |
2023 |
2024 |
|
work
|
17 |
Government sector |
39,338 |
40,501 |
40,290 |
39,176 |
38,450 |
37,288 |
36,644 |
37,736 |
37,120 |
37,744 |
| 18 |
Private sector |
109,251 |
113,758 |
119,512 |
126,111 |
132,305 |
124,442 |
119,639 |
138,891 |
158,327 |
175,553 |
| 19 |
Business |
18 |
18 |
20 |
16 |
20 |
19 |
35 |
37 |
42 |
58 |
| 20 |
Domestic work |
363,233 |
353,687 |
340,583 |
354,827 |
377,566 |
339,705 |
296,576 |
405,677 |
422,698 |
410,061 |
|
residence
|
22 |
Dependent |
339,672 |
344,292 |
340,577 |
340,237 |
340,415 |
328,320 |
309,339 |
323,490 |
311,831 |
337,667 |
| 23 |
Study |
171 |
214 |
229 |
226 |
211 |
171 |
131 |
163 |
206 |
206 |
| 24 |
Self-residence |
1,114 |
1,149 |
1,215 |
1,257 |
1,311 |
1,340 |
1,444 |
1,381 |
1,337 |
1,385 |
| Total residencies 1 year and more |
852,797 |
853,619 |
842,426 |
861,850 |
890,278 |
831,285 |
763,808 |
907,375 |
931,561 |
962,674 |
| Temporary |
14 |
Temporary re
sidence |
n.a. |
n.a. |
n.a. |
n.a. |
12,343 |
14,887 |
17,510 |
11,471 |
9,914 |
14,268 |
|
|
|
|
n.a. |
n.a. |
n.a. |
n.a. |
902,621 |
846,172 |
781,318 |
918,846 |
941,475 |
976,942 |
Source: Central Statistical Bureau, Migration Statistics Bulletin, given years.
ANNEXED NOTE
1. Definitions
Data taken from Ministry of Interior’s (Directorate of Migration’s) annual records of residency permits granted to foreign residents by type/ purpose of permit, sex and regional origin of holder.
The data presented in the table are stock data: all the non-national residents holding a residence permit on December 31st, the given year.
The present figures include permits delivered for all purposes of stay in Kuwait:
1- Labour in all sectors: governmental sector (n°17); private sector (n°18); business (freelance) (n°19) and domestic sector (n°20)
2- Residence: as family dependent (permit n°22); studies (n°23) and self-residence (n°24).
Residency procedures do not apply to GCC nationals and to Bidouns (stateless residents of Kuwait).
The table thus excludes the Bidouns, the non-Kuwaiti GCC citizens and those in irregular situation.
The number of holders of permit n°14 (temporary residents) is not available before 2019.
Dependent permit: spouse, children or elderly dependent relatives can join visa holder (sponsor) in Kuwait,
if the expatriate has obtained a residency and meets the salary requirements.
A working wife cannot sponsor her husband as a dependent. Sons over the age of 21 years cannot be sponsored as dependents,
though adult daughters and parents may be permitted. Dependent family members are not allowed to work on a Dependent Visa.
Every foreign resident including new born babies must hold a residency permit.
Self residence permit: Expatriates may sponsor themselves under article 24 of the regulations and obtain a residence for two
to five years under several conditions, among which: being aged 60 and more, having worked no less than 25 years in Kuwait,
owning a capital of 10,000 KD at least; holding a certificate of good conduct, effectively reside in Kuwait, etc.
This form of residence can be renewed upon expiry. Self-sponsored expatriates may sponsor their wives and children.
Permits 17, 18, 19 and 20 are only granted after Ministry of Labour issues a work permit.
2. Institution which provides data
Central Statistical Bureau (CSB), Ministry of Planning.
3. Period of data coverage
December 31st, given years.
4. Data availability
The present data is taken from the “Migration Statistics” reports, published annually by the CSB.
The report (in Arabic and English, PDF format with Excel tables) is available on CSB’s website
(Population Statistics, then Migration Statistics)
https://www.csb.gov.kw/Pages/Statistics_en?ID=56&ParentCatID=1
https://www.csb.gov.kw/Pages/Statistics?ID=56&ParentCatID=1
Date of access: 29 May 2026.
GLMM and GRC cannot guarantee that the link to access the source will not change;
that the information will not be removed from the website it was obtained from;
that no geo-blockages will be imposed; or that the information will not be available for any another reason.
Keywords: Kuwait, Foreign Population, Employment, Legal Document, Residence Conditions, Family Reunification
|
Qataris |
Non-Qataris |
Total |
|
Males |
Females |
Total |
Males |
Females |
Total |
Males |
Females |
Total |
| Illiterate |
0 |
0 |
0 |
14,064 |
33 |
14,097 |
14,064 |
33 |
14,097 |
| Read & Write |
502 |
114 |
616 |
164,728 |
10,912 |
175,640 |
165,230 |
11,026 |
176,256 |
| Literacy |
0 |
0 |
0 |
187 |
0 |
187 |
187 |
0 |
187 |
| Primary |
2,516 |
835 |
3,351 |
348,102 |
16,606 |
364,708 |
350,618 |
17,441 |
368,059 |
| Preparatory |
6,740 |
1,568 |
8,308 |
461,300 |
46,871 |
508,171 |
468,040 |
48,439 |
516,479 |
| Vocational Training |
0 |
0 |
0 |
3,500 |
242 |
3,742 |
3,500 |
242 |
3,742 |
| Secondary |
27,434 |
17,094 |
44,528 |
293,782 |
71,586 |
365,368 |
321,216 |
88,680 |
409,896 |
| Diploma |
1,286 |
1,219 |
2,505 |
82,612 |
17,861 |
100,473 |
83,898 |
19,080 |
102,978 |
| University |
30,538 |
28,119 |
58,657 |
374,331 |
141,128 |
515,459 |
404,869 |
169,247 |
574,116 |
| Higher Diploma |
1,599 |
937 |
2,536 |
4,979 |
5,966 |
10,945 |
6,578 |
6,903 |
13,481 |
| M.A / M.Sc. |
2,808 |
1,864 |
4,672 |
28,333 |
15,443 |
43,776 |
31,141 |
17,307 |
48,448 |
| Ph.D. |
1,495 |
809 |
2,304 |
8,400 |
2,063 |
10,463 |
9,895 |
2,872 |
12,767 |
| Total |
74,918 |
52,559 |
127,477 |
1,784,318 |
328,711 |
2,113,029 |
1,859,236 |
381,270 |
2,240,506 |
Source: Annual Bulletin of Labour Force Sample Survey 2024
ANNEXED NOTE
1. Technical Notes and Definitions
The data is taken from Labour Force Survey 2024 (yearly synthesis)
Sampling frame : Population Census 2020.
Sample size: 65,253 persons, in 10,560 households: 1- Qatari households; 2- Non-Qatari regular (non-collective) households;
3- Non-Qatari small collective households or labour gatherings (2 – 6 persons); 4- Non-Qatari large collective households or large labour gatherings (7 persons or more).
The collective households are a group of persons not related to each other and sharing living conditions in a residential unit, I.e. labour camps, students living boarding
schools, nurses in hospitals… etc. The survey covered the small collective households (includes less than 7 persons) and large collective households (includes 7 persons or more).
Data Collection: The sample was divided into equal parts to collect data monthly. Each month 1/3 of the quarterly data were collected during the first two weeks of the month.
Reference period for the labour force data: the week prior to data collection day.
The survey does not cover short periods accommodation, i.e. hotels.
The present data includes the active population, i.e. employed and unemployed.
Labour force: People in working age including employed and unemployed.
Employed population:
Persons aged 15 years an above, who during the week preceding the survey:
a) Perform a work for a wage, salary, profits or household gains, whether it was in cash or in kind.
b) Are temporarily not employed, however, they still have an official relation with their work
Unemployed population:
All persons aged 15 years and over who were, during the week preceding the survey, without work and were willing to work and looking seriously for work.
These are:
First time unemployed: They are the persons who never worked previously, and were during the week preceding the survey looking actively for work.
Unemployed who previously worked: They are the persons with previous experience work and during the week preceding the survey were actively looking for work.
The present data does not include persons seeking work for the first time
Education level: highest level completed.
Classification used: the Directory of Standard Classification of Education, based on UNESCO’s International Standard Classification of Education (ISCED).
2. Institution which provides data
National Planning Council (NPC), formerly the Planning and Statistics Authority (PSA)
https://www.npc.qa/en/pages/default.aspx
https://www.npc.qa/ar/pages/default.aspx
3. Data availability
Annual and quarterly bulletins of Labour Force Surveys reports can be downloaded from NPC’s website, in PDF and/or Excel formats:
https://www.npc.qa/en/statistics/pages/subjectdetails.aspx
Last date of access: 21 May 2026.
GLMM and GRC cannot guarantee that the link to access the source will not change;
that the information will not be removed from the website it was obtained from;
that no geo-blockages will be imposed; or that the information will not be available for any another reason.
Keywords: Qatar, Labour Market, Employment, Female Employment, National & Foreign Labour, National Labour, Foreign Labour, Education
| that no geo-blockages will be imposed; or that the information will not be available for any another reason. |
Qataris |
Non-Qataris |
Total |
|
Males |
Females |
Males |
Females |
Males |
Females |
| Government Department |
52,986 |
35,736 |
59,258 |
18,033 |
112,244 |
53,769 |
| Government Company/ Corporation |
8,403 |
7,425 |
45,949 |
18,325 |
54,352 |
25,750 |
| Mixed |
6,610 |
4,844 |
23,869 |
3,858 |
30,479 |
8,702 |
| Private |
6,142 |
4,081 |
1,580,170 |
185,480 |
1,586,312 |
189,561 |
Diplomatic/International/
Regional |
321 |
98 |
4,591 |
2,152 |
4,912 |
2,250 |
| Non profit |
456 |
375 |
1,753 |
386 |
2,209 |
761 |
| Domestic |
0 |
0 |
68,728 |
100,477 |
68,728 |
100,477 |
| Total |
74,918 |
52,559 |
1,784,318 |
328,711 |
1,859,236 |
381,270 |
Source: Annual Bulletin of Labour Force Sample Survey 2024
ANNEXED NOTE
The data is taken from Labour Force Survey 2024 (yearly synthesis)
Sampling frame : Population Census 2020.
Sample size: 65,253 persons, in 10,560 households: 1- Qatari households; 2- Non-Qatari regular (non-collective) households;
3- Non-Qatari small collective households or labour gatherings (2 – 6 persons); 4- Non-Qatari large collective households or large labour gatherings (7 persons or more).
The collective households are a group of persons not related to each other and sharing living conditions in a residential unit, I.e. labour camps, students living boarding
schools, nurses in hospitals… etc. The survey covered the small collective households (includes less than 7 persons) and large collective households (includes 7 persons or more).
Data Collection: The sample was divided into equal parts to collect data monthly. Each month 1/3 of the quarterly data were collected during the first two weeks of the month.
Reference period for the labour force data: the week prior to data collection day.
The survey does not cover short periods accommodation, i.e. hotels.
The present data includes the active population, i.e. employed and unemployed.
Labour force: People in working age including employed and unemployed.
Employed population:
Persons aged 15 years an above, who during the week preceding the survey:
Definition of sectors of activity:
a) Governmental department:
Government bodies engaged in administrative or service activities, such as ministries, public schools, public health centers, and hospitals.
b) Government corporation/company:
Companies engaged in productive activities whose capital is entirely owned by government, such as Central Bank of Qatar, Qatar Petroleum.
c) Private:
Establishments owned by individuals or a group of individuals either Qatari nationals or non-Qataris, whether natural or legal personalities.
d) Mixed:
Establishments in which the government shares capital with another party, whether national (such as Qatar National Bank) or foreign (such as Gulf Air Corporation).
e) Diplomatic/International/Regional:
Establishments engaged in diplomatic or consulate activities on behalf of other countries or those belonging to regional or international organizations.
f) Domestic sector:
Includes all those working in a household for a salary, either males or females, such as housemaids, cooks, drivers, and gardeners.
2. Institution which provides data
National Planning Council (NPC), formerly the Planning and Statistics Authority (PSA)
https://www.npc.qa/en/pages/default.aspx
https://www.npc.qa/ar/pages/default.aspx
3. Data availability
Annual and quarterly bulletins of Labour Force Surveys reports can be downloaded from NPC’s website, in PDF and/or Excel formats:
https://www.npc.qa/en/statistics/pages/subjectdetails.aspx
Last date of access: 21 May 2026.
GLMM and GRC cannot guarantee that the link to access the source will not change;
that the information will not be removed from the website it was obtained from;
that no geo-blockages will be imposed; or that the information will not be available for any another reason.
Keywords: Qatar, Employment, National Labour, Foreign Labour
|
Qataris |
Non-Qataris |
Total |
| Government Department |
88,722 |
77,291 |
166,013 |
| Government Company/ Corporation |
15,828 |
64,274 |
80,102 |
| Mixed |
11,454 |
27,727 |
39,181 |
| Private |
10,223 |
1,765,650 |
1,775,873 |
Diplomatic/International/
Regional |
419 |
6,743 |
7,162 |
| Non profit |
831 |
2,139 |
2,970 |
| Domestic |
0 |
169,205 |
169,205 |
| Total |
127,477 |
2,113,029 |
2,240,506 |
Source: Annual Bulletin of Labour Force Sample Survey 2024
ANNEXED NOTE
1. Technical Notes and Definitions
The data is taken from Labour Force Survey 2024 (yearly synthesis)
Sampling frame : Population Census 2020.
Sample size: 65,253 persons, in 10,560 households: 1- Qatari households; 2- Non-Qatari regular (non-collective) households;
3- Non-Qatari small collective households or labour gatherings (2 – 6 persons); 4- Non-Qatari large collective households or large labour gatherings (7 persons or more).
The collective households are a group of persons not related to each other and sharing living conditions in a residential unit, I.e. labour camps, students living boarding
schools, nurses in hospitals… etc. The survey covered the small collective households (includes less than 7 persons) and large collective households (includes 7 persons or more).
Data Collection: The sample was divided into equal parts to collect data monthly. Each month 1/3 of the quarterly data were collected during the first two weeks of the month.
Reference period for the labour force data: the week prior to data collection day.
The survey does not cover short periods accommodation, i.e. hotels.
The present data includes the active population, i.e. employed and unemployed.
Labour force: People in working age including employed and unemployed.
Employed population:
Persons aged 15 years an above, who during the week preceding the survey:
a) Perform a work for a wage, salary, profits or household gains, whether it was in cash or in kind.
b) Are temporarily not employed, however, they still have an official relation with their work
Unemployed population:
All persons aged 15 years and over who were, during the week preceding the survey, without work and were willing to work and looking seriously for work.
These are:
First time unemployed: They are the persons who never worked previously, and were during the week preceding the survey looking actively for work.
Unemployed who previously worked: They are the persons with previous experience work and during the week preceding the survey were actively looking for work.
The present data does not include persons seeking work for the first time
Definition of sectors of activity:
a) Governmental department:
Government bodies engaged in administrative or service activities, such as ministries, public schools, public health centers, and hospitals.
b) Government corporation/company:
Companies engaged in productive activities whose capital is entirely owned by government, such as Central Bank of Qatar, Qatar Petroleum.
c) Private:
Establishments owned by individuals or a group of individuals either Qatari nationals or non-Qataris, whether natural or legal personalities.
d) Mixed:
Establishments in which the government shares capital with another party, whether national (such as Qatar National Bank) or foreign (such as Gulf Air Corporation).
e) Diplomatic/International/Regional:
Establishments engaged in diplomatic or consulate activities on behalf of other countries or those belonging to regional or international organizations.
f) Domestic sector:
Includes all those working in a household for a salary, either males or females, such as housemaids, cooks, drivers, and gardeners.
2. Institution which provides data
National Planning Council (NPC), formerly the Planning and Statistics Authority (PSA)
https://www.npc.qa/en/pages/default.aspx
https://www.npc.qa/ar/pages/default.aspx
3. Data availability
Annual and quarterly bulletins of Labour Force Surveys reports can be downloaded from NPC’s website, in PDF and/or Excel formats:
https://www.npc.qa/en/statistics/pages/subjectdetails.aspx
Last date of access: 21 May 2026.
GLMM and GRC cannot guarantee that the link to access the source will not change;
that the information will not be removed from the website it was obtained from;
that no geo-blockages will be imposed; or that the information will not be available for any another reason.
Keywords: Qatar, Employment, National Labour, Foreign Labour
|
Qataris |
Non-Qataris |
Total |
|
Males |
Females |
Total |
Males |
Females |
Total |
Males |
Females |
Total |
| Employer |
2,865 |
312 |
3,177 |
3,997 |
387 |
4,384 |
6,862 |
699 |
7,561 |
| Own Account Worker |
49 |
0 |
49 |
1,241 |
0 |
1,241 |
1,290 |
0 |
1,290 |
| Employee |
72,004 |
52,247 |
124,251 |
1,779,080 |
328,324 |
2,107,404 |
1,851,084 |
380,571 |
2,231,655 |
| Total |
74,918 |
52,559 |
127,477 |
1,784,318 |
328,711 |
2,113,029 |
1,859,236 |
381,270 |
2,240,506 |
Source: Annual Bulletin of Labour Force Sample Survey 2024
ANNEXED NOTE
1. Technical Notes and Definitions
The data is taken from Labour Force Survey 2024 (yearly synthesis)
Sampling frame : Population Census 2020.
Sample size: 65,253 persons, in 10,560 households: 1- Qatari households; 2- Non-Qatari regular (non-collective) households;
3- Non-Qatari small collective households or labour gatherings (2 – 6 persons); 4- Non-Qatari large collective households or large labour gatherings (7 persons or more).
The collective households are a group of persons not related to each other and sharing living conditions in a residential unit, I.e. labour camps, students living boarding
schools, nurses in hospitals… etc. The survey covered the small collective households (includes less than 7 persons) and large collective households (includes 7 persons or more).
Data Collection: The sample was divided into equal parts to collect data monthly. Each month 1/3 of the quarterly data were collected during the first two weeks of the month.
Reference period for the labour force data: the week prior to data collection day.
The survey does not cover short periods accommodation, i.e. hotels.
Labour force: People in working age including employed and unemployed.
Employed population:
Persons aged 15 years an above, who during the week preceding the survey:
a) Perform a work for a wage, salary, profits or household gains, whether it was in cash or in kind.
b) Are temporarily not employed, however, they still have an official relation with their work
Unemployed population:
All persons aged 15 years and over who were, during the week preceding the survey, without work and were willing to work and looking seriously for work.
These are:
First time unemployed: They are the persons who never worked previously, and were during the week preceding the survey looking actively for work.
Unemployed who previously worked: They are the persons with previous experience work and during the week preceding the survey were actively looking for work.
Data does not include those seeking employment for the first time.
Classification used: The International Classification of Status in Employment (ICSE)
a) Employers are those workers who, working on their own account or with one or a few partners, hold the type of job defined as a “self-employment” and have engaged one or more persons to work for them in their business as “employees”.
b) Own-account workers are those workers who, working on their own account or with one or more partners, hold the type of job defined as a “self-employment”, and have not engaged on a continuous basis any “employees”.
c) Employees are all those workers who hold the type of job defined as “paid employment”.
2. Institution which provides data
National Planning Council (NPC), formerly the Planning and Statistics Authority (PSA)
https://www.npc.qa/en/pages/default.aspx
https://www.npc.qa/ar/pages/default.aspx
3. Data availability
Annual and quarterly bulletins of Labour Force Surveys reports can be downloaded from NPC’s website, in PDF and/or Excel formats:
https://www.npc.qa/en/statistics/pages/subjectdetails.aspx
Last date of access: 05 May 2026.
GLMM and GRC cannot guarantee that the link to access the source will not change;
that the information will not be removed from the website it was obtained from;
that no geo-blockages will be imposed; or that the information will not be available for any another reason.
Keywords: Qatar, Employment, National Labour, Foreign Labour
|
Qataris |
Non-Qataris |
Total |
|
Males |
Females |
Males |
Females |
Males |
Females |
| Agriculture, forestry and fishing |
65 |
0 |
40,049 |
0 |
40,114 |
0 |
| Mining and quarrying |
5,292 |
1,942 |
26,098 |
2,348 |
31,390 |
4,290 |
| Manufacturing |
1,520 |
408 |
108,485 |
2,269 |
110,005 |
2,677 |
| Electricity, gas, steam and air conditioning supply |
1,227 |
1,333 |
13,208 |
1,782 |
14,435 |
3,115 |
| Water supply; sewerage, waste management and remediation activities |
529 |
304 |
6,027 |
72 |
6,556 |
376 |
| Construction |
1,403 |
179 |
693,271 |
8,085 |
694,674 |
8,264 |
| Wholesale and retail trade; repair of motor vehicles and motorcycles |
1,296 |
810 |
227,282 |
27,212 |
228,578 |
28,022 |
| Transportation and storage |
1,874 |
1,820 |
130,478 |
19,894 |
132,352 |
21,714 |
| Accommodation and food service activities |
300 |
799 |
73,840 |
21,939 |
74,140 |
22,738 |
| Information and communication |
2,095 |
1,569 |
17,094 |
5,239 |
19,189 |
6,808 |
| Financial and insurance activities |
2,781 |
3,118 |
17,352 |
7,475 |
20,133 |
10,593 |
| Real estate activities |
475 |
242 |
18,993 |
2,345 |
19,468 |
2,587 |
| Professional, scientific and technical activities |
261 |
214 |
26,398 |
5,248 |
26,659 |
5,462 |
| Administrative and support service activities |
340 |
357 |
166,508 |
30,815 |
166,848 |
31,172 |
| Public administration and defence; compulsory social security |
46,965 |
19,736 |
42,062 |
5,023 |
89,027 |
24,759 |
| Education |
2,972 |
12,321 |
28,784 |
34,469 |
31,756 |
46,790 |
| Human health and social work activities |
3,710 |
6,038 |
52,606 |
45,579 |
56,316 |
51,617 |
| Arts, entertainment and recreation |
1,394 |
1,223 |
8,486 |
2,962 |
9,880 |
4,185 |
| Other service activities |
98 |
48 |
13,978 |
3,326 |
14,076 |
3,374 |
| Activities of households as employers; undifferentiated goods- and services-producing activities of households for own use |
0 |
0 |
68,728 |
100,477 |
68,728 |
100,477 |
| Activities of extraterritorial organizations and bodies |
321 |
98 |
4,591 |
2,152 |
4,912 |
2,250 |
| Total |
74,918 |
52,559 |
1,784,318 |
328,711 |
1,859,236 |
381,270 |
Source: Annual Bulletin of Labour Force Sample Survey 2024
ANNEXED NOTE
1. Technical Notes and Definitions
The data is taken from Labour Force Survey 2024 (yearly synthesis)
Sampling frame : Population Census 2020.
Sample size: 65,253 persons, in 10,560 households: 1- Qatari households; 2- Non-Qatari regular (non-collective) households;
3- Non-Qatari small collective households or labour gatherings (2 – 6 persons); 4- Non-Qatari large collective households or large labour gatherings (7 persons or more).
The collective households are a group of persons not related to each other and sharing living conditions in a residential unit, I.e. labour camps, students living boarding
schools, nurses in hospitals… etc. The survey covered the small collective households (includes less than 7 persons) and large collective households (includes 7 persons or more).
Data Collection: The sample was divided into equal parts to collect data monthly. Each month 1/3 of the quarterly data were collected during the first two weeks of the month.
Reference period for the labour force data: the week prior to data collection day.
The survey does not cover short periods accommodation, i.e. hotels.
Labour force: People in working age including employed and unemployed.
Employed population:
Persons aged 15 years an above, who during the week preceding the survey:
a) Perform a work for a wage, salary, profits or household gains, whether it was in cash or in kind.
b) Are temporarily not employed, however, they still have an official relation with their work
Unemployed population:
All persons aged 15 years and over who were, during the week preceding the survey, without work and were willing to work and looking seriously for work.
These are:
First time unemployed: They are the persons who never worked previously, and were during the week preceding the survey looking actively for work.
Unemployed who previously worked: They are the persons with previous experience work and during the week preceding the survey were actively looking for work.
Data does not include those seeking employment for the first time.
Classification of activities used: ISIC-Rev.4.
2. Institution which provides data
National Planning Council (NPC), formerly the Planning and Statistics Authority (PSA)
https://www.npc.qa/en/pages/default.aspx
https://www.npc.qa/ar/pages/default.aspx
3. Data availability
Annual and quarterly bulletins of Labour Force Surveys reports can be downloaded from NPC’s website, in PDF and/or Excel formats:
https://www.npc.qa/en/statistics/pages/subjectdetails.aspx
Last date of access: 05 May 2026.
GLMM and GRC cannot guarantee that the link to access the source will not change;
that the information will not be removed from the website it was obtained from;
that no geo-blockages will be imposed; or that the information will not be available for any another reason.
Keywords: Qatar, Employment, Female Employment, National Labour, Foreign Labour
|
Qataris |
Non-Qataris |
Total |
| Agriculture, forestry and fishing |
65 |
40,049 |
40,114 |
| Mining and quarrying |
7,234 |
28,446 |
35,680 |
| Manufacturing |
1,928 |
110,754 |
112,682 |
| Electricity, gas, steam and air conditioning supply |
2,560 |
14,990 |
17,550 |
| Water supply; sewerage, waste management and remediation activities |
833 |
6,099 |
6,932 |
| Construction |
1,582 |
701,356 |
702,938 |
| Wholesale and retail trade; repair of motor vehicles and motorcycles |
2,106 |
254,494 |
256,600 |
| Transportation and storage |
3,694 |
150,372 |
154,066 |
| Accommodation and food service activities |
1,099 |
95,779 |
96,878 |
| Information and communication |
3,664 |
22,333 |
25,997 |
| Financial and insurance activities |
5,899 |
24,827 |
30,726 |
| Real estate activities |
717 |
21,338 |
22,055 |
| Professional, scientific and technical activities |
475 |
31,646 |
32,121 |
| Administrative and support service activities |
697 |
197,323 |
198,020 |
| Public administration and defence; compulsory social security |
66,701 |
47,085 |
113,786 |
| Education |
15,293 |
63,253 |
78,546 |
| Human health and social work activities |
9,748 |
98,185 |
107,933 |
| Arts, entertainment and recreation |
2,617 |
11,448 |
14,065 |
| Other service activities |
146 |
17,304 |
17,450 |
| Activities of households as employers; undifferentiated goods- and services-producing activities of households for own use |
0 |
169,205 |
169,205 |
| Activities of extraterritorial organizations and bodies |
419 |
6,743 |
7,162 |
| Total |
127,477 |
2,113,029 |
2,240,506 |
Source: Annual Bulletin of Labour Force Sample Survey 2024
ANNEXED NOTE
1. Technical Notes and Definitions
The data is taken from Labour Force Survey 2024 (yearly synthesis)
Sampling frame : Population Census 2020.
Sample size: 65,253 persons, in 10,560 households: 1- Qatari households; 2- Non-Qatari regular (non-collective) households;
3- Non-Qatari small collective households or labour gatherings (2 – 6 persons); 4- Non-Qatari large collective households or large labour gatherings (7 persons or more).
The collective households are a group of persons not related to each other and sharing living conditions in a residential unit, I.e. labour camps, students living boarding
schools, nurses in hospitals… etc. The survey covered the small collective households (includes less than 7 persons) and large collective households (includes 7 persons or more).
Data Collection: The sample was divided into equal parts to collect data monthly. Each month 1/3 of the quarterly data were collected during the first two weeks of the month.
Reference period for the labour force data: the week prior to data collection day.
The survey does not cover short periods accommodation, i.e. hotels.
Labour force: People in working age including employed and unemployed.
Employed population:
Persons aged 15 years an above, who during the week preceding the survey:
a) Perform a work for a wage, salary, profits or household gains, whether it was in cash or in kind.
b) Are temporarily not employed, however, they still have an official relation with their work
Unemployed population:
All persons aged 15 years and over who were, during the week preceding the survey, without work and were willing to work and looking seriously for work.
These are:
First time unemployed: They are the persons who never worked previously, and were during the week preceding the survey looking actively for work.
Unemployed who previously worked: They are the persons with previous experience work and during the week preceding the survey were actively looking for work.
Data does not include those seeking employment for the first time.
Classification of activities used: ISIC-Rev.4.
2. Institution which provides data
National Planning Council (NPC), formerly the Planning and Statistics Authority (PSA)
https://www.npc.qa/en/pages/default.aspx
https://www.npc.qa/ar/pages/default.aspx
3. Data availability
Annual and quarterly bulletins of Labour Force Surveys reports can be downloaded from NPC’s website, in PDF and/or Excel formats:
https://www.npc.qa/en/statistics/pages/subjectdetails.aspx
Last date of access: 05 May 2026.
GLMM and GRC cannot guarantee that the link to access the source will not change;
that the information will not be removed from the website it was obtained from;
that no geo-blockages will be imposed; or that the information will not be available for any another reason.
Keywords: Qatar, Employment, National Labour, Foreign Labour
|
Qataris |
Non-Qataris |
Total |
|
Males |
Females |
Total |
Males |
Females |
Total |
Males |
Females |
Total |
| Legislators, Senior Officials and Managers |
39 |
39 |
39 |
45 |
43 |
45 |
42 |
40 |
42 |
| Professionals |
38 |
38 |
38 |
44 |
42 |
43 |
42 |
40 |
41 |
| Technicians and Associate Professionals |
39 |
39 |
39 |
46 |
45 |
46 |
44 |
42 |
43 |
| Clerks |
38 |
38 |
38 |
45 |
44 |
45 |
42 |
40 |
41 |
| Service Workers and Shop and Market Sales Workers |
39 |
39 |
39 |
49 |
47 |
48 |
48 |
46 |
48 |
| Skilled Agricultural and Fishery Workers |
0 |
0 |
0 |
49 |
0 |
49 |
49 |
0 |
49 |
| Craft and Related Trades Workers |
39 |
0 |
39 |
49 |
49 |
49 |
49 |
49 |
49 |
| Plant and Machine Operators and Assemblers |
39 |
0 |
39 |
50 |
50 |
50 |
50 |
50 |
50 |
| Elementary Occupations |
39 |
39 |
39 |
50 |
51 |
50 |
50 |
51 |
50 |
| Total |
39 |
38 |
39 |
48 |
48 |
48 |
47 |
45 |
46 |
Source: Annual Bulletin of Labour Force Sample Survey 2024
ANNEXED NOTE
1. Technical Notes and Definitions
The data is taken from Labour Force Survey 2024 (yearly synthesis)
Sampling frame : Population Census 2020.
Sample size: 65,253 persons, in 10,560 households: 1- Qatari households; 2- Non-Qatari regular (non-collective) households;
3- Non-Qatari small collective households or labour gatherings (2 – 6 persons); 4- Non-Qatari large collective households or large labour gatherings (7 persons or more).
The collective households are a group of persons not related to each other and sharing living conditions in a residential unit, I.e. labour camps, students living boarding
schools, nurses in hospitals… etc. The survey covered the small collective households (includes less than 7 persons) and large collective households (includes 7 persons or more).
Data Collection: The sample was divided into equal parts to collect data monthly. Each month 1/3 of the quarterly data were collected during the first two weeks of the month.
Reference period for the labour force data: the week prior to data collection day.
The survey does not cover short periods accommodation, i.e. hotels.
Employed population:
Persons aged 15 years an above, who during the week preceding the survey:
a) Perform a work for a wage, salary, profits or household gains, whether it was in cash or in kind.
b) Are temporarily not employed, however, they still have an official relation with their work
Hours worked during survey week: The number of hours actually worked during the survey week, including normal scheduled hours and additional hours (overtime).
“Average hours worked” is the average over all persons at work in each nationality, sex and occupation category.
Classification of occupations used: ISCO-88.
2. Institution which provides data
National Planning Council (NPC), formerly the Planning and Statistics Authority (PSA)
https://www.npc.qa/en/pages/default.aspx
https://www.npc.qa/ar/pages/default.aspx
3. Data availability
Annual and quarterly bulletins of Labour Force Surveys reports can be downloaded from NPC’s website, in PDF and/or Excel formats:
https://www.npc.qa/en/statistics/pages/subjectdetails.aspx
Last date of access: 05 May 2026.
GLMM and GRC cannot guarantee that the link to access the source will not change;
that the information will not be removed from the website it was obtained from;
that no geo-blockages will be imposed; or that the information will not be available for any another reason.
Keywords: Qatar, Labour Market, Employment, Female Employment, National & Foreign Labour, National Labour, Foreign Labour, Work Conditions
|
Qataris |
Non-Qataris |
Total |
|
Males |
Females |
Males |
Females |
Males |
Females |
| Legislators, Senior Officials and Managers |
10,359 |
3,664 |
43,573 |
4,492 |
53,932 |
8,156 |
| Professionals |
19,010 |
24,325 |
194,427 |
101,501 |
213,437 |
125,826 |
| Technicians and Associate Professionals |
14,082 |
5,821 |
164,927 |
34,170 |
179,009 |
39,991 |
| Clerks |
23,697 |
16,948 |
117,664 |
38,302 |
141,361 |
55,250 |
| Service Workers and Shop and Market Sales Workers |
2,408 |
1,350 |
165,652 |
57,582 |
168,060 |
58,932 |
| Skilled Agricultural and Fishery Workers |
0 |
0 |
32,126 |
0 |
32,126 |
0 |
| Craft and Related Trades Workers |
2,648 |
0 |
556,751 |
1,529 |
559,399 |
1,529 |
| Plant and Machine Operators and Assemblers |
1,671 |
0 |
298,864 |
517 |
300,535 |
517 |
| Elementary Occupations |
1,043 |
451 |
210,334 |
90,618 |
211,377 |
91,069 |
| Total |
74,918 |
52,559 |
1,784,318 |
328,711 |
1,859,236 |
381,270 |
Source: Annual Bulletin of Labour Force Sample Survey 2024
ANNEXED NOTE
1. Technical Notes and Definitions
The data is taken from Labour Force Survey 2024 (yearly synthesis)
Sampling frame : Population Census 2020.
Sample size: 65,253 persons, in 10,560 households: 1- Qatari households; 2- Non-Qatari regular (non-collective) households;
3- Non-Qatari small collective households or labour gatherings (2 – 6 persons); 4- Non-Qatari large collective households or large labour gatherings (7 persons or more).
The collective households are a group of persons not related to each other and sharing living conditions in a residential unit, I.e. labour camps, students living boarding
schools, nurses in hospitals… etc. The survey covered the small collective households (includes less than 7 persons) and large collective households (includes 7 persons or more).
Data Collection: The sample was divided into equal parts to collect data monthly. Each month 1/3 of the quarterly data were collected during the first two weeks of the month.
Reference period for the labour force data: the week prior to data collection day.
The survey does not cover short periods accommodation, i.e. hotels.
Labour force: People in working age including employed and unemployed.
Employed population:
Persons aged 15 years an above, who during the week preceding the survey:
a) Perform a work for a wage, salary, profits or household gains, whether it was in cash or in kind.
b) Are temporarily not employed, however, they still have an official relation with their work
Unemployed population:
All persons aged 15 years and over who were, during the week preceding the survey, without work and were willing to work and looking seriously for work.
These are:
First time unemployed: They are the persons who never worked previously, and were during the week preceding the survey looking actively for work.
Unemployed who previously worked: They are the persons with previous experience work and during the week preceding the survey were actively looking for work.
Data does not include those seeking employment for the first time.
Classification of occupations used: ISCO-88.
2. Institution which provides data
National Planning Council (NPC), formerly the Planning and Statistics Authority (PSA)
https://www.npc.qa/en/pages/default.aspx
https://www.npc.qa/ar/pages/default.aspx
3. Data availability
Annual and quarterly bulletins of Labour Force Surveys reports can be downloaded from NPC’s website, in PDF and/or Excel formats:
https://www.npc.qa/en/statistics/pages/subjectdetails.aspx
Last date of access: 05 May 2026.
GLMM and GRC cannot guarantee that the link to access the source will not change;
that the information will not be removed from the website it was obtained from;
that no geo-blockages will be imposed; or that the information will not be available for any another reason.
Keywords: Qatar, Employment, Female Employment, National Labour, Foreign Labour
|
Qataris |
Non-Qataris |
Total |
| Legislators, Senior Officials and Managers |
14,023 |
48,065 |
62,088 |
| Professionals |
43,335 |
295,928 |
339,263 |
| Technicians and Associate Professionals |
19,903 |
199,097 |
219,000 |
| Clerks |
40,645 |
155,966 |
196,611 |
| Service Workers and Shop and Market Sales Workers |
3,758 |
223,234 |
226,992 |
| Skilled Agricultural and Fishery Workers |
0 |
32,126 |
32,126 |
| Craft and Related Trades Workers |
2,648 |
558,280 |
560,928 |
| Plant and Machine Operators and Assemblers |
1,671 |
299,381 |
301,052 |
| Elementary Occupations |
1,494 |
300,952 |
302,446 |
| Total |
127,477 |
2,113,029 |
2,240,506 |
Source: Annual Bulletin of Labour Force Sample Survey 2024
ANNEXED NOTE
1. Technical Notes and Definitions
The data is taken from Labour Force Survey 2024 (yearly synthesis)
Sampling frame : Population Census 2020.
Sample size: 65,253 persons, in 10,560 households: 1- Qatari households; 2- Non-Qatari regular (non-collective) households;
3- Non-Qatari small collective households or labour gatherings (2 – 6 persons); 4- Non-Qatari large collective households or large labour gatherings (7 persons or more).
The collective households are a group of persons not related to each other and sharing living conditions in a residential unit, I.e. labour camps, students living boarding
schools, nurses in hospitals… etc. The survey covered the small collective households (includes less than 7 persons) and large collective households (includes 7 persons or more).
Data Collection: The sample was divided into equal parts to collect data monthly. Each month 1/3 of the quarterly data were collected during the first two weeks of the month.
Reference period for the labour force data: the week prior to data collection day.
The survey does not cover short periods accommodation, i.e. hotels.
Labour force: People in working age including employed and unemployed.
Employed population:
Persons aged 15 years an above, who during the week preceding the survey:
a) Perform a work for a wage, salary, profits or household gains, whether it was in cash or in kind.
b) Are temporarily not employed, however, they still have an official relation with their work
Unemployed population:
All persons aged 15 years and over who were, during the week preceding the survey, without work and were willing to work and looking seriously for work.
These are:
First time unemployed: They are the persons who never worked previously, and were during the week preceding the survey looking actively for work.
Unemployed who previously worked: They are the persons with previous experience work and during the week preceding the survey were actively looking for work.
Data does not include those seeking employment for the first time.
Classification of occupations used: ISCO-88.
2. Institution which provides data
National Planning Council (NPC), formerly the Planning and Statistics Authority (PSA)
https://www.npc.qa/en/pages/default.aspx
https://www.npc.qa/ar/pages/default.aspx
3. Data availability
Annual and quarterly bulletins of Labour Force Surveys reports can be downloaded from NPC’s website, in PDF and/or Excel formats:
https://www.npc.qa/en/statistics/pages/subjectdetails.aspx
Last date of access: 05 May 2026.
GLMM and GRC cannot guarantee that the link to access the source will not change;
that the information will not be removed from the website it was obtained from;
that no geo-blockages will be imposed; or that the information will not be available for any another reason.
Keywords: Qatar, Employment, National Labour, Foreign Labour
|
Qataris |
Non-Qataris |
Total |
| 2006 |
58,131 |
473,002 |
531,133 |
| 2007 |
61,545 |
766,038 |
827,583 |
| 2008 |
67,585 |
1,100,316 |
1,167,901 |
| 2009 |
70,644 |
1,190,827 |
1,261,471 |
| 2010* |
71,076 |
1,199,107 |
1,270,183 |
| 2011 |
74,373 |
1,195,872 |
1,270,245 |
| 2012 |
82,601 |
1,257,981 |
1,340,582 |
| 2013 |
91,133 |
1,448,007 |
1,539,140 |
| 2014 |
93,484 |
1,593,187 |
1,686,671 |
| 2015 |
98,423 |
1,855,015 |
1,953,438 |
| 2016 |
101,417 |
1,950,996 |
2,052,413 |
| 2017 |
103,916 |
1,950,271 |
2,054,187 |
| 2018 |
106,038 |
1,988,328 |
2,094,366 |
| 2019 |
107,487 |
2,000,214 |
2,107,701 |
| 2020 |
110,285 |
2,018,481 |
2,128,766 |
| 2021 |
115,438 |
1,905,729 |
2,021,167 |
| 2022 |
120,770 |
2,009,119 |
2,129,889 |
| 2023 |
124,227 |
2,055,220 |
2,179,447 |
| 2024 |
127,349 |
2,112,589 |
2,239,938 |
Source: National Planning Council (NPC). Annual Bulletins of Labour Force Sample Surveys, 2006 to 2009 and 2011 to 2024; *: census 2010
ANNEXED NOTE
1. Technical Notes and Definitions
The data is taken from the Annual Bulletins of Labour Force Sample Surveys (yearly syntheses, given years, except 2010)
Labour force Sample Surveys:
The Statistics Authority conducted the first labor Force Sample Survey in 2001. Starting from 2006, the execution of these surveys came to be on annual basis.
Since 2013, data has been collected on a monthly basis and published every 3 months.
Sampling frame : Population Censuses 2010, 2015 and 2020.
Sample size since 2020: 65,253 persons, in 10,560 households: 1- Qatari households; 2- Non-Qatari regular (non-collective) households;
3- Non-Qatari small collective households or labour gatherings (2 – 6 persons); 4- Non-Qatari large collective households or large labour gatherings (7 persons or more).
The collective households are a group of persons not related to each other and sharing living conditions in a residential unit, I.e. labour camps, students living boarding
schools, nurses in hospitals… etc. The survey covered the small collective households (includes less than 7 persons) and large collective households (includes 7 persons or more).
Data Collection: Labour Force Survey data are collected on a monthly basis, and based on field surveys.
Reference period for the labour force data: the week prior to data collection day.
The survey does not cover short periods accommodation, i.e. hotels.
Population of reference: employed population (all sectors).
Employed population:
Persons aged 15 years and above, who during the week preceding the survey:
a) Perform a work for a wage, salary, profits or household gains, whether it was in cash or in kind.
b) Are temporarily not employed, however, they still have an official relation with their work
2. Institution which provides data
National Planning Council (NPC), formerly the Planning and Statistics Authority (PSA)
https://www.npc.qa/en/pages/default.aspx
https://www.npc.qa/ar/pages/default.aspx
3. Data availability
Annual and quarterly bulletins of Labour Force Surveys reports can be downloaded from NPC’s website, in PDF and/or Excel formats:
https://www.npc.qa/en/statistics/pages/subjectdetails.aspx#
Last date of access: 27 April 2026.
GLMM and GRC cannot guarantee that the link to access the source will not change;
that the information will not be removed from the website it was obtained from;
that no geo-blockages will be imposed; or that the information will not be available for any another reason.
Keywords: Qatar, Employment, National Labour, Foreign Labour
|
Qataris |
Non-Qataris |
Total |
|
Males |
Females |
Males |
Females |
Males |
Females |
| 2006 |
38,684 |
19,447 |
415,235 |
57,767 |
453,919 |
77,214 |
| 2007 |
40,322 |
21,223 |
686,430 |
79,608 |
726,752 |
100,831 |
| 2008 |
42,770 |
24,815 |
1,002,388 |
97,928 |
1,045,158 |
122,743 |
| 2009 |
45,242 |
25,402 |
1,092,844 |
97,983 |
1,138,086 |
123,385 |
| 2010* |
46,168 |
24,908 |
1,070,973 |
128,134 |
1,117,141 |
153,042 |
| 2011 |
49,228 |
25,145 |
1,068,083 |
127,789 |
1,117,311 |
152,934 |
| 2012 |
55,609 |
26,992 |
1,117,577 |
140,404 |
1,173,186 |
167,396 |
| 2013 |
60,877 |
30,256 |
1,284,838 |
163,169 |
1,345,715 |
193,425 |
| 2014 |
62,202 |
31,282 |
1,419,940 |
173,247 |
1,482,142 |
204,529 |
| 2015 |
64,101 |
34,322 |
1,628,620 |
226,395 |
1,692,721 |
260,717 |
| 2016 |
65,023 |
36,394 |
1,716,529 |
234,467 |
1,781,552 |
270,861 |
| 2017 |
66,859 |
37,057 |
1,711,444 |
238,827 |
1,778,303 |
275,884 |
| 2018 |
67,610 |
38,428 |
1,742,169 |
246,159 |
1,809,779 |
284,587 |
| 2019 |
68,210 |
39,277 |
1,754,752 |
245,462 |
1,822,962 |
284,739 |
| 2020 |
70,047 |
40,238 |
1,765,660 |
252,821 |
1,835,707 |
293,059 |
| 2021 |
70,247 |
45,191 |
1,643,097 |
262,632 |
1,713,344 |
307,823 |
| 2022 |
72,086 |
48,684 |
1,705,016 |
304,103 |
1,777,102 |
352,787 |
| 2023 |
73,529 |
50,698 |
1,725,507 |
329,713 |
1,799,036 |
380,411 |
| 2024 |
74,854 |
52,495 |
1,784,020 |
328,569 |
1,858,874 |
381,064 |
Source: National Planning Council (NPC). Annual Bulletins of Labour Force Sample Surveys, 2006 to 2009 and 2011 to 2024; *: census 2010
ANNEXED NOTE
1. Technical Notes and Definitions
The data is taken from the Annual Bulletins of Labour Force Sample Surveys (yearly syntheses, given years, except 2010)
Labour force Sample Surveys:
The Statistics Authority conducted the first labor Force Sample Survey in 2001. Starting from 2006, the execution of these surveys came to be on annual basis.
Since 2013, data has been collected on a monthly basis and published every 3 months.
Sampling frame : Population Censuses 2010, 2015 and 2020.
Sample size since 2020: 65,253 persons, in 10,560 households: 1- Qatari households; 2- Non-Qatari regular (non-collective) households;
3- Non-Qatari small collective households or labour gatherings (2 – 6 persons); 4- Non-Qatari large collective households or large labour gatherings (7 persons or more).
The collective households are a group of persons not related to each other and sharing living conditions in a residential unit, I.e. labour camps, students living boarding
schools, nurses in hospitals… etc. The survey covered the small collective households (includes less than 7 persons) and large collective households (includes 7 persons or more).
Data Collection: Labour Force Survey data are collected on a monthly basis, and based on field surveys.
Reference period for the labour force data: the week prior to data collection day.
The survey does not cover short periods accommodation, i.e. hotels.
Population of reference: employed population (all sectors).
Employed population:
Persons aged 15 years and above, who during the week preceding the survey:
a) Perform a work for a wage, salary, profits or household gains, whether it was in cash or in kind.
b) Are temporarily not employed, however, they still have an official relation with their work
2. Institution which provides data
National Planning Council (NPC), formerly the Planning and Statistics Authority (PSA)
https://www.npc.qa/en/pages/default.aspx
https://www.npc.qa/ar/pages/default.aspx
3. Data availability
Annual and quarterly bulletins of Labour Force Surveys reports can be downloaded from NPC’s website, in PDF and/or Excel formats:
https://www.npc.qa/en/statistics/pages/subjectdetails.aspx#
Last date of access: 27 April 2026.
GLMM and GRC cannot guarantee that the link to access the source will not change;
that the information will not be removed from the website it was obtained from;
that no geo-blockages will be imposed; or that the information will not be available for any another reason.
Keywords: Qatar, Employment, Female Employment, National Labour, Foreign Labour
|
|
Bahrain |
|
|
Kuwait |
|
|
Oman |
|
|
Qatar |
|
|
|
|
UAE |
|
Total pop. employed in private sector |
Non-nationals employed in private sector |
% non-nationals in private sector |
Total pop. employed in private sector |
Non-nationals employed in private sector |
% non-nationals in private sector |
Total pop. employed in private sector |
Non-nationals employed in private sector |
% non-nationals in private sector |
Total labour force in private sector |
Non-nationals in private sector |
% non-nationals in private sector |
Total pop. employed in private sector |
Non-nationals employed in private sector |
% non-nationals in private sector |
Total pop. employed in private sector |
| 2015 |
546,572 |
445,374 |
81.5 |
1,480,249 |
1,410,010 |
95.3 |
1,583,462 |
1,373,842 |
86.8 |
1,511,627 |
1,499,956 |
99.2 |
10,140,936 |
8,416,681 |
83.0 |
NA |
| 2016 |
611,229 |
509,062 |
83.3 |
1,580,347 |
1,509,087 |
95.5 |
1,728,019 |
1,504,936 |
87.1 |
1,602,630 |
1,592,577 |
99.4 |
10,168,137 |
8,492,965 |
83.5 |
NA |
| 2017 |
599,714 |
495,912 |
82.7 |
1,638,020 |
1,566,782 |
95.7 |
1,741,496 |
1,502,808 |
86.3 |
1,606,550 |
1,596,340 |
99.4 |
9,701,960 |
7,928,287 |
81.7 |
NA |
| 2018 |
608,220 |
503,006 |
82.7 |
1,698,528 |
1,625,589 |
95.7 |
1,687,285 |
1,435,153 |
85.1 |
1,652,818 |
1,642,498 |
99.4 |
8,599,487 |
6,895,514 |
80.2 |
NA |
| 2019 |
605,824 |
498,999 |
82.4 |
1,714,063 |
1,640,830 |
95.7 |
1,626,288 |
1,363,955 |
83.9 |
1,661,807 |
1,651,951 |
99.4 |
8,138,590 |
6,437,886 |
79.1 |
NA |
| 2020 |
564,641 |
460,022 |
81.5 |
1,567,114 |
1,494,133 |
95.3 |
1,468,057 |
1,115,322 |
76.0 |
1,710,948 |
1,702,251 |
99.5 |
8,026,901 |
6,280,145 |
78.2 |
NA |
| 2021 |
507,978 |
411,129 |
80.9 |
1,434,824 |
1,362,602 |
95.0 |
1,482,180 |
1,107,574 |
74.7 |
1,593,673 |
1,584,118 |
99.4 |
8,084,253 |
6,174,178 |
76.4 |
NA |
| 2022 |
560,037 |
459,986 |
82.1 |
1,572,384 |
1,500,551 |
95.4 |
1,742,955 |
1,359,776 |
78.0 |
1,675,213 |
1,665,285 |
99.4 |
9,422,233 |
7,227,688 |
76.7 |
NA |
| 2023 |
560,290 |
458,768 |
81.9 |
1,656,955 |
1,584,125 |
95.6 |
1,853,973 |
1,454,170 |
78.4 |
1,721,695 |
1,710,971 |
99.4 |
10,292,270 |
7,991,679 |
77.6 |
NA |
| 2024 |
NA |
NA |
NA |
1,739,735 |
1,665,994 |
95.8 |
1,837,840 |
1,433,124 |
78.0 |
1,775,873 |
1,765,650 |
99.4 |
11,837,519 |
9,429,359 |
79.7 |
NA |
Sources: national institutes of statistics and relevant national institutions
1- Definitions and remarks:
Non-nationals are:
1- persons bearing nationality of a foreign State other than the GCC State of residence, or bearing
no proof of nationality from any given state
(stateless persons and holders of refugee status and travel document in a third country);
2- Holders of residence permit residing in the given GCC country at date of census, as per definition
of residence used in each of the countries.
Unless stated otherwise (if specific categories of workers are excluded from statistics, for instance),
employment refers to: all persons of working age (15 and above), who during a reference period
worked to produce goods or provide services for pay (cash or kind) or worked for profit from their
own (or partially owned) business or worked without pay in the family business or with other
individuals. It also includes those who have a temporary absence from a job during the reference
period due to vacation or illness or any other reason.
Figures refer to workers employed in the private sector.
Reference period: end of year
Q4 of quarterly data published for Bahrain (until 2020), Kuwait, Saudi Arabia
Annual data published for Oman, Qatar, UAE, and Bahrain (2021- ).
Bahrain (until 2020):
Labour Market Regulation Authority (LMRA). Bahrain Labour Market Indicators (BLMI), Q4 2022,
https://blmi.lmra.gov.bh/2022/12/mi_dashboard.xml
Employment data include all civilian employed persons in the private and public sectors (insured, uninsured and self-employed) and domestic workers.
Since Q1 2010, LMRA has been using data from LMRA Expat management System (EMS) to produce the total number of foreign worker employment in public and private sectors.
These include data taken from the Social Insurance Organisation (SIO), Pension Fund Commission (PFC), and Civil Service Bureau (CSB) monthly data files to LMRA
Private Sector for Non-Bahraini workers refers to the sum of “Commercial” and “Non-Commercial, Non-Government” (NCNG) sectors of LMRA’s EMS system.
No data on employment by sector after Q2 2023 in LMRA statistics.
2021-2023 data: IGA, Labour Force 2021, 2022, 2023.
https://www.data.gov.bh/pages/homepage/
Data for the Labour Force publication is taken from SIO records, Bahrain’s official social insurance authority.
As of 20 April 2026, no data is available beyond 2023.
Kuwait: Central Statistical Bureau. Integrated Database – LMIS, Q4 data, 2015 to 2024.
https://lmis.csb.gov.kw/
Data are taken from administrative records. The Public Authority for Manpower (PAM) maintains statistics on workers in the private sector.
Oman: National Center for Statistics and Information (NCSI). Statistical Yearbook 2025, Chapter “Employment”
https://www.ncsi.gov.om/publications
https://api.ncsi.gov.om/uploads/pdfs/publicationpdf1765273616.pdf
“Private sector” includes Private, Communal and Other Sectors.
2020 and after: employment data published in the Yearbooks is taken from National Registration system (includes insured and uninsured employees).
Qatar: National Planning Council (NPC), formerly Planning and Statistics Authority. Annual Bulletins of Labour Force Sample Surveys 2015 to 2023
https://www.npc.qa/en/statistics/pages/subjectdetails.aspx
Population of reference: labour force.
Labour Force Survey data are collected on a monthly basis, and based on field surveys.
Saudi Arabia: General Authority for Statistics (GAStat). Labour Market Statistics (2017-20222) and Register-based Labour Market Statistics (2023-2024), Q4 data.
2023-2025: available at:
https://www.stats.gov.sa/en/statistics-tabs/-/categories/417515?tab=436312&category=417515
Before 2023: available in the “archived data”:
https://www.stats.gov.sa/en/statistics?index=1317550
“social statistics”, and “labour force”
https://www.stats.gov.sa/en/statistics-tabs?tab=436312&category=1333429
2015-2016: Saudi Arabia Central Bank (SAMA). Yearly statistics
https://www.sama.gov.sa/en-US/EconomicReports/Pages/report.aspx?cid=127
The data is taken from the administrative records of subscribers to the General Organization of Social Insurance (GOSI).
Population of reference: workers employed in the private sector, registered with the GOSI.
UAE: No data available on total employed population by sector.
Last accessed: 20 April 2026
GLMM and GRC cannot guarantee that the link to access the source will not change;
that the information will not be removed from the website it was obtained from;
that no geo-blockages will be imposed; or that the information will not be available for any another reason.
Keywords: Bahrain, Kuwait, Oman, Qatar, Saudi Arabia, United Arab Emirates, Employment, Female Employment, Labour Market, National & Foreign Labour
|
Nationality
|
|
In the labour force |
Outside the labour force |
Grand Total
|
|
Employed
|
Unemployed |
Total in labour force
|
Housewife
|
Student
|
Disabled
|
Retired
|
Other
|
Total
|
|
Seeking work for 1st time |
Unpd. with previous employment |
| Qatari |
Males |
74,854 |
80 |
64 |
74,998 |
0 |
23,413 |
1,682 |
11,532 |
1,992 |
38,619 |
113,617 |
|
Females |
52,495 |
241 |
64 |
52,800 |
28,479 |
29,447 |
1,102 |
6,909 |
1,276 |
67,213 |
120,013 |
|
Total |
127,349 |
321 |
128 |
127,798 |
28,479 |
52,860 |
2,784 |
18,441 |
3,268 |
105,832 |
233,630 |
| Non-Qatari |
Males |
1,784,020 |
1,014 |
298 |
1,785,332 |
0 |
44,503 |
480 |
0 |
3,610 |
48,593 |
1,833,925 |
|
Females |
328,569 |
974 |
142 |
329,685 |
106,879 |
43,121 |
1,036 |
0 |
1,826 |
152,862 |
482,547 |
|
Total |
2,112,589 |
1,988 |
440 |
2,115,017 |
106,879 |
87,624 |
1,516 |
0 |
5,436 |
201,455 |
2,316,472 |
| Total |
Males |
1,858,874 |
1,094 |
362 |
1,860,330 |
0 |
67,916 |
2,162 |
11,532 |
5,602 |
87,212 |
1,947,542 |
|
Females |
381,064 |
1,215 |
206 |
382,485 |
135,358 |
72,568 |
2,138 |
6,909 |
3,102 |
220,075 |
602,560 |
|
Total |
2,239,938 |
2,309 |
568 |
2,242,815 |
135,358 |
140,484 |
4,300 |
18,441 |
8,704 |
307,287 |
2,550,102 |
Source: NPC. Annual Bulletin of Labor Force Sample survey 2024
ANNEXED NOTE
1. Technical Notes and Definitions
The data is taken from Annual Bulletin of Labour Force Sample Survey 2024 (yearly synthesis)
Sampling frame of LFS 2024: Census of Population, Housing, and Establishments 2020.
Sample size: 65,253 persons, in 10,560 households: 1- Qatari households; 2- Non-Qatari regular (non-collective) households;
3- Non-Qatari small collective households or labour gatherings (2 – 6 persons); 4- Non-Qatari large collective households or large labour gatherings (7 persons or more).
Data Collection: Labour Force Survey data are collected on a monthly basis, and based on field surveys.
Reference period for the labour force data: the week prior to data collection day.
Population of reference: all Qatari and non-Qatari households present in Qatar on the night of survey, living in normal and collective households.
The collective households are a group of persons not related to each other and sharing living conditions in a residential unit, I.e. labour camps, students living in boarding
schools, nurses in hospitals… etc. The survey covered the small collective households (includes less than 7 persons) and large collective households (includes 7 persons or more).
The survey does not cover short periods accommodation, i.e. hotels.
Relation to labour force (for persons aged 15 and above)
In the labour force (= economically active).
1) Employed.
All persons aged 15 years and above, who during the week preceding the survey:
a) Perform a work for a wage, salary, profits or household gains, whether it was in cash or in kind.
b) Are temporarily not employed, however, they still have an official relation with their work
2) Unemployed.
All persons aged 15 years and over who were, during the week preceding the survey, without employment, willing to work and looking seriously for a job.
There is a distinction between two kinds of unemployed persons:
a) First time unemployed: They are the persons who never worked previously, and were during the week preceding the survey looking actively for work.
b) Unemployed who previously worked: They are the persons with a work experience, who during the week preceding the survey were actively looking for a job
Outside the labour force (=economically inactive):
Full-time student: The person (15 years or older) enrolled in any educational institution as a full-time persistent student with purpose of attaining an academic degree, irrespective of whether the schooling hours are in the morning or evening. Any trainee enrolled in vocational training institutes is regarded as a full-time student.
Retired: The person who does not look for a job during the week preceding the survey and gets a fixed pension for work he/she had joined before
Disabled: The person (15 years or older) who is not capable of work due to illness, handicap or old age.
Others: Those able to work but not willing to, not enrolled in education, as well as any other cases encountered by the enumerator other than the above mentioned.
2. Institution which provides data
National Planning Council (NPC), formerly the Planning and Statistics Authority (PSA)
https://www.npc.qa/en/pages/default.aspx
https://www.npc.qa/ar/pages/default.aspx
3. Data availability
The Statistics Authority conducted the first labour Force Sample Survey in 2001. Starting from 2006, the execution of these surveys came to be on annual basis, and on a quarterly basis since 2013.
Annual and quarterly bulletins of Labour Force Surveys reports can be downloaded from NPC’s website, in PDF and/or Excel formats:
https://www.npc.qa/en/statistics/pages/subjectdetails.aspx#
Labour Force Sample Survey 2024:
https://www.npc.qa/_layouts/15/download.aspx?SourceUrl=https%3A%2F%2Fwww.npc.qa%2Fen%2Fstatistics%2FStatistical%20Releases%2FSocial%2FLabor%20Force%2FLabor_Force_Sample_Survey_2024_AE.xlsx
Last date of access: 04 April 2026.
GLMM and GRC cannot guarantee that the link to access the source will not change;
that the information will not be removed from the website it was obtained from;
that no geo-blockages will be imposed; or that the information will not be available for any another reason.
Keywords: Qatar, Labour Market, Employment, Unemployment, Female Employment, National & Foreign Labour, National Labour, Foreign Labour
|
Total population |
Annual growth rates (%) |
|
males |
females |
total |
males |
females |
total |
| 1986 |
250,328 |
123,067 |
373,395 |
|
|
|
| 1987 |
256,844 |
127,006 |
383,850 |
2.6 |
3.2 |
2.8 |
| 1988 |
263,958 |
131,251 |
395,209 |
2.7 |
3.3 |
2.9 |
| 1989 |
271,685 |
135,886 |
407,571 |
2.9 |
3.5 |
3.1 |
| 1990 |
279,800 |
140,979 |
420,779 |
2.9 |
3.7 |
3.2 |
| 1991 |
288,600 |
145,772 |
434,372 |
3.1 |
3.3 |
3.2 |
| 1992 |
297,992 |
150,579 |
448,571 |
3.2 |
3.2 |
3.2 |
| 1993 |
308,458 |
155,509 |
463,967 |
3.5 |
3.2 |
3.4 |
| 1994 |
319,379 |
160,951 |
480,330 |
3.5 |
3.4 |
3.5 |
| 1995 |
331,111 |
166,440 |
497,551 |
3.6 |
3.4 |
3.5 |
| 1996 |
343,472 |
172,104 |
515,576 |
3.7 |
3.3 |
3.6 |
| 1997 |
353,787 |
182,687 |
536,474 |
3.0 |
6.0 |
4.0 |
| 1998 |
370,742 |
190,248 |
560,990 |
4.7 |
4.1 |
4.5 |
| 1999 |
388,602 |
198,168 |
586,770 |
4.7 |
4.1 |
4.5 |
| 2000 |
407,148 |
206,821 |
613,969 |
4.7 |
4.3 |
4.5 |
| 2001 |
427,316 |
216,048 |
643,364 |
4.8 |
4.4 |
4.7 |
| 2002 |
450,351 |
226,147 |
676,498 |
5.3 |
4.6 |
5.0 |
| 2003 |
476,513 |
237,346 |
713,859 |
5.6 |
4.8 |
5.4 |
| 2004 |
546,116 |
251,943 |
798,059 |
13.6 |
6.0 |
11.1 |
| 2005 |
637,070 |
269,053 |
906,123 |
15.4 |
6.6 |
12.7 |
| 2006 |
754,298 |
288,649 |
1,042,947 |
16.9 |
7.0 |
14.1 |
| 2007 |
905,747 |
312,503 |
1,218,250 |
18.3 |
7.9 |
15.5 |
| 2008 |
1,111,176 |
337,303 |
1,448,479 |
20.4 |
7.6 |
17.3 |
| 2009 |
1,265,146 |
373,480 |
1,638,626 |
13.0 |
10.2 |
12.3 |
| 2010 |
1,296,110 |
414,988 |
1,715,098 |
2.4 |
10.5 |
4.6 |
| 2011 |
1,288,590 |
444,127 |
1,732,717 |
-0.6 |
6.8 |
1.0 |
| 2012 |
1,355,199 |
477,704 |
1,832,903 |
5.0 |
7.3 |
5.6 |
| 2013 |
1,477,632 |
526,068 |
2,003,700 |
8.6 |
9.6 |
8.9 |
| 2014 |
1,652,037 |
564,143 |
2,216,180 |
11.2 |
7.0 |
10.1 |
| 2015 |
1,840,643 |
597,147 |
2,437,790 |
10.8 |
5.7 |
9.5 |
| 2016 |
1,975,536 |
642,098 |
2,617,634 |
7.1 |
7.3 |
7.1 |
| 2017 |
2,046,047 |
678,559 |
2,724,606 |
3.5 |
5.5 |
4.0 |
| 2018 |
2,048,206 |
711,964 |
2,760,170 |
0.1 |
4.8 |
1.3 |
| 2019 |
2,064,276 |
734,926 |
2,799,202 |
0.8 |
3.2 |
1.4 |
| 2020 |
2,025,902 |
807,777 |
2,833,679 |
-1.9 |
9.5 |
1.2 |
| 2021 |
1,970,649 |
777,513 |
2,748,162 |
-2.8 |
-3.8 |
-3.1 |
| 2022 |
2,121,336 |
810,905 |
2,932,241 |
7.4 |
4.2 |
6.5 |
| 2023 |
2,206,546 |
856,459 |
3,063,005 |
3.9 |
5.5 |
4.4 |
| 2024 |
2,215,203 |
928,288 |
3,143,491 |
0.4 |
8.1 |
2.6 |
Source: Planning and Statistics Authority (PSA)/ National Planning Council (NPC)
ANNEXED NOTE
1. Characteristics of data and definitions
The table provides intercensal estimates of Qatar’s total resident population (nationals and non-nationals) based on census results (1986; 1997; 2004; 2010, 2015 and 2020),
The standard age- group component methodology is used to provide population size in the base month (May) in five-year age groups.
The calculation is carried out by separate estimates for males and females separately in five-year age groups for Qataris and non-Qataris individually according to the following assumptions:
a. The population growth rate between the end of April and the end of May is the population growth rate for June. This rate is applied to estimate the population on June 30 of each year.
B. The relative distribution of population by single of age at the end of May is the same at the end of June after making estimates for each 5-year age group.
See the full “methodology” section in the “Population” section of the publication.
Annual growth rates: author’s calculation.
2. Institution which provides data
Planning and Statistics Authority (PSA)/National Planning Council (NPC)
https://www.npc.qa/en/pages/default.aspx
3. Period of data coverage:
mid-year estimates, given years.
4. Data availability
The population data is available in the Population and Social Statistics Bulletin (Annual issues).
https://www.npc.qa/en/statistics/pages/subjectdetails.aspx#
Date of access: 4 April 2026
GLMM and GRC cannot guarantee that the link to access the source will not change;
that the information will not be removed from the website it was obtained from;
that no geo-blockages will be imposed; or that the information will not be available for any another reason.
Keywords: Qatar, Foreign & National Populations
|
Total population |
Annual growth rates (%) |
| 1986 |
373,395 |
|
| 1987 |
383,850 |
2.8 |
| 1988 |
395,209 |
2.9 |
| 1989 |
407,571 |
3.1 |
| 1990 |
420,779 |
3.2 |
| 1991 |
434,372 |
3.2 |
| 1992 |
448,571 |
3.2 |
| 1993 |
463,967 |
3.4 |
| 1994 |
480,330 |
3.5 |
| 1995 |
497,551 |
3.5 |
| 1996 |
515,576 |
3.6 |
| 1997 |
536,474 |
4.0 |
| 1998 |
560,990 |
4.5 |
| 1999 |
586,770 |
4.5 |
| 2000 |
613,969 |
4.5 |
| 2001 |
643,364 |
4.7 |
| 2002 |
676,498 |
5.0 |
| 2003 |
713,859 |
5.4 |
| 2004 |
798,059 |
11.1 |
| 2005 |
906,123 |
12.7 |
| 2006 |
1,042,947 |
14.1 |
| 2007 |
1,218,250 |
15.5 |
| 2008 |
1,448,479 |
17.3 |
| 2009 |
1,638,626 |
12.3 |
| 2010 |
1,715,098 |
4.6 |
| 2011 |
1,732,717 |
1.0 |
| 2012 |
1,832,903 |
5.6 |
| 2013 |
2,003,700 |
8.9 |
| 2014 |
2,216,180 |
10.1 |
| 2015 |
2,437,790 |
9.5 |
| 2016 |
2,617,634 |
7.1 |
| 2017 |
2,724,606 |
4.0 |
| 2018 |
2,760,170 |
1.3 |
| 2019 |
2,799,202 |
1.4 |
| 2020 |
2,833,679 |
1.2 |
| 2021 |
2,748,162 |
-3.1 |
| 2022 |
2,932,241 |
6.5 |
| 2023 |
3,063,005 |
4.4 |
| 2024 |
3,143,491 |
2.6 |
Source: Planning and Statistics Authority (PSA)/ Na
tional Planning Council (NPC)
ANNEXED NOTE
1. Characteristics of data and definitions
The table provides intercensal estimates of Qatar’s total resident population (nationals and non-nationals) based on census results (1986; 1997; 2004; 2010, 2015 and 2020),
The standard age- group component methodology is used to provide population size in the base month (May) in five-year age groups.
The calculation is carried out by separate estimates for males and females separately in five-year age groups for Qataris and non-Qataris individually according to the following assumptions:
a. The population growth rate between the end of April and the end of May is the population growth rate for June. This rate is applied to estimate the population on June 30 of each year.
B. The relative distrib4. Data availability ution of population by single of age at the end of May is the same at the end of June after making estimates for each 5-year age group.
See the full “methodology” section in the “Population” section of the publication.
Annual growth rates: author’s calculation.
2. Institution which provides data
Planning and Statistics Authority (PSA)/National Planning Council (NPC)
https://www.npc.qa/en/pages/default.aspx
3. Period of data coverage:
mid-year estimates, given years.
4. Data availability
The population data is available in the Population and Social Statistics Bulletin (Annual issues).
https://www.npc.qa/en/statistics/pages/subjectdetails.aspx#
Date of access: 4 April 2026
GLMM and GRC cannot guarantee that the link to access the source will not change;
that the information will not be removed from the website it was obtained from;
that no geo-blockages will be imposed; or that the information will not be available for any another reason.
Keywords: Qatar, Foreign & National Populations
|
Bahrain |
Kuwait* |
Oman |
Qatar |
Saudi Arabia |
UAE |
| 2010 |
1,228,543 |
3,582,054 |
2,773,479 |
1,715,098 |
23,978,487 |
6,965,488 |
| 2011 |
1,195,020 |
3,697,292 |
3,543,595 |
1,732,717 |
25,091,867 |
7,243,588 |
| 2012 |
1,208,964 |
3,823,728 |
3,622,997 |
1,832,903 |
26,168,861 |
7,539,307 |
| 2013 |
1,253,191 |
3,965,144 |
3,855,206 |
2,003,700 |
27,624,004 |
7,846,755 |
| 2014 |
1,314,562 |
4,091,993 |
3,992,893 |
2,216,180 |
28,309,273 |
8,272,124 |
| 2015 |
1,370,322 |
4,239,006 |
4,159,102 |
2,437,790 |
29,816,382 |
8,738,350 |
| 2016 |
1,423,726 |
4,411,124 |
4,413,309 |
2,617,634 |
30,954,198 |
9,131,839 |
| 2017 |
1,501,116 |
4,500,476 |
4,558,847 |
2,724,606 |
30,977,355 |
9,314,611 |
| 2018 |
1,503,091 |
4,621,638 |
4,592,759 |
2,760,170 |
30,196,281 |
9,378,791 |
| 2019 |
1,483,756 |
4,776,407 |
4,618,268 |
2,799,202 |
30,063,799 |
9,512,778 |
| 2020 |
1,472,204 |
4,670,713 |
4,578,016 |
2,833,679 |
31,552,510 |
9,289,297 |
| 2021 |
1,504,365 |
4,385,717 |
4,479,373 |
2,748,162 |
30,784,383 |
9,861,007 |
| 2022 |
1,524,693 |
4,793,568 |
4,728,372 |
2,932,241 |
32,175,224 |
10,288,946 |
| 2023 |
1,577,059 |
4,913,271 |
5,079,514 |
3,063,005 |
33,702,731 |
10,678,556 |
| 2024 |
1,588,670 |
4,881,254 |
5,203,674 |
3,143,491 |
35,300,280 |
11,294,243 |
*: end of year figures
Sources:
(1) Bahrain: for detailed sources and metadata please visit:
https://gulfmigration.grc.net/bahrain-population-estimates-by-nationality-bahraini-non-bahraini-1991-dec-2024/
(2) Kuwait: for detailed sources and metadata please visit:
https://gulfmigration.grc.net/kuwait-population-by-nationality-kuwaiti-non-kuwaiti-1990-dec-2024/
(3) Oman: for detailed sources and metadata please visit:
https://gulfmigration.grc.net/oman-mid-year-population-by-nationality-omani-non-omani-2000-2024/
(4) Qatar: for detailed sources and metadata please visit:
https://gulfmigration.grc.net/qatar-estimates-of-total-population-by-sex-and-annual-demographic-growth-rates-1986-2023/
(5) Saudi Arabia: for detailed sources and metadata please visit:
https://gulfmigration.grc.net/saudi-arabia-population-by-nationality-saudi-non-saudi-sex-and-age-group-2024-2/
(6) UAE: for detailed sources and metadata please visit:
https://gulfmigration.grc.net/uae-total-population-residing-in-the-uae-and-demographic-growth-rates-2000-2024/
Last date of access: 28 March 2026.
GLMM and GRC cannot guarantee that the link to access the source will not change;
that the information will not be removed from the website it was obtained from;
that no geo-blockages will be imposed; or that the information will not be available for any another reason.
Keywords: Bahrain, Kuwait, Oman, Qatar, Saudi Arabia, United Arab Emirates, Foreign & National Populations
|
Total |
Nationals |
Non-nationals |
% nationals |
% foreign nationals |
| Bahrain |
1,588,670 |
739,736 |
848,934 |
46.6 |
53.4 |
| Kuwait* |
4,881,254 |
1,566,168 |
3,315,086 |
32.1 |
67.9 |
| Oman |
5,203,674 |
2,955,171 |
2,248,503 |
56.8 |
43.2 |
| Qatar |
3,143,491 |
N.A. |
N.A. |
N.A. |
N.A. |
| Saudi Arabia |
35,300,280 |
19,635,258 |
15,665,022 |
55.6 |
44.4 |
| UAE |
11,294,243 |
N.A. |
N.A. |
N.A. |
N.A. |
| Total |
61,411,612 |
N.A. |
N.A. |
N.A. |
N.A. |
Sources: National institutes of statistics (see below).
*: end of year figures
N.A.: No data available as of 28 March 2026.
(1) Bahrain: for detailed sources and metadata please visit:
https://gulfmigration.grc.net/bahrain-population-estimates-by-nationality-bahraini-non-bahraini-1991-dec-2024/
(2) Kuwait: for detailed sources and metadata please visit:
https://gulfmigration.grc.net/kuwait-population-by-nationality-kuwaiti-non-kuwaiti-1990-dec-2024/
(3) Oman: for detailed sources and metadata please visit:
https://gulfmigration.grc.net/oman-mid-year-population-by-nationality-omani-non-omani-2000-2024/
(4) Qatar: No total population data (all age groups) broken down by nationality are officially published.
As of 28 March 2026, the sources previously used to calculate estimates of total populations disaggregated by nationality are unavailable.
For the methodology of previous estimates, see:
https://gulfmigration.grc.net/qatar-population-by-nationality-qatari-non-qatari-at-dates-of-censuses-1970-2020/.
(5) Saudi Arabia: for detailed sources and metadata please visit:
https://gulfmigration.grc.net/saudi-arabia-population-by-nationality-saudi-non-saudi-sex-and-age-group-2024-2/
(6) UAE: No population data broken down by nationality are officially published.
As of 28 March 2026, the sources previously used to calculate estimates of total populations disaggregated by nationality are unavailable.
For the methodology of these estimates, see:
https://gulfmigration.grc.net/uae-a-methodology-for-estimating-the-emirati-and-non-emirati-populations-2010-2022/
Last date of access: 28 March 2026.
GLMM and GRC cannot guarantee that the link to access the source will not change;
that the information will not be removed from the website it was obtained from;
that no geo-blockages will be imposed; or that the information will not be available for any another reason.
Keywords: Bahrain, Kuwait, Oman, Qatar, Saudi Arabia, United Arab Emirates, Foreign & National Populations
|
Country
|
Total population |
Nationals |
Foreign nationals |
% nationals |
% foreign nationals |
| Males |
Females |
Males |
Females |
Males |
Females |
Males |
Females |
Males |
Females |
| Bahrain |
985,092 |
603,578 |
374,701 |
365,035 |
610,391 |
238,543 |
38.0 |
60.5 |
62.0 |
39.5 |
| Kuwait* |
2,987,971 |
1,893,283 |
773,304 |
792,864 |
2,214,667 |
1,100,419 |
25.9 |
41.9 |
74.1 |
58.1 |
| Oman |
3,200,999 |
2,002,675 |
1,487,094 |
1,468,077 |
1,713,905 |
534,598 |
46.5 |
73.3 |
53.5 |
26.7 |
| Qatar |
NA |
NA |
NA |
NA |
NA |
NA |
NA |
NA |
NA |
NA |
| Saudi Arabia |
21,916,172 |
13,384,108 |
9,827,595 |
9,807,663 |
12,088,577 |
3,576,445 |
44.8 |
73.3 |
55.2 |
26.7 |
| UAE |
NA |
NA |
NA |
NA |
NA |
NA |
NA |
NA |
NA |
NA |
| Total |
NA |
NA |
NA |
NA |
NA |
NA |
NA |
NA |
NA |
NA |
Sources: National institutes of statistics (see below).
*: end of year figures
N.A.: No data available as of 28 March 2026.
(1) Bahrain: for detailed sources and metadata please visit:
https://gulfmigration.grc.net/bahrain-population-estimates-by-nationality-bahraini-non-bahraini-1991-dec-2024/
(2) Kuwait: for detailed sources and metadata please visit:
https://gulfmigration.grc.net/kuwait-population-by-nationality-kuwaiti-non-kuwaiti-1990-dec-2024/
(3) Oman: for detailed sources and metadata please visit:
https://gulfmigration.grc.net/oman-mid-year-population-by-nationality-omani-non-omani-2000-2024/
(4) Qatar: No total population data (all age groups) broken down by nationality are officially published.
As of 28 March 2026, the sources previously used to calculate estimates of total populations disaggregated by nationality are unavailable.
For the methodology of previous estimates, see:
https://gulfmigration.grc.net/qatar-population-by-nationality-qatari-non-qatari-at-dates-of-censuses-1970-2020/.
(5) Saudi Arabia: for detailed sources and metadata please visit:
https://gulfmigration.grc.net/saudi-arabia-population-by-nationality-saudi-non-saudi-sex-and-age-group-2024-2/
(6) UAE: No population data broken down by nationality are officially published.
As of 28 March 2026, the sources previously used to calculate estimates of total populations disaggregated by nationality are unavailable.
For the methodology of these estimates, see:
https://gulfmigration.grc.net/uae-a-methodology-for-estimating-the-emirati-and-non-emirati-populations-2010-2022/
Last date of access: 28 March 2026.
GLMM and GRC cannot guarantee that the link to access the source will not change;
that the information will not be removed from the website it was obtained from;
that no geo-blockages will be imposed; or that the information will not be available for any another reason.
Keywords: Bahrain, Kuwait, Oman, Qatar, Saudi Arabia, United Arab Emirates, Foreign & National Populations
|
Kuwaitis |
Non-Kuwaitis |
Total |
| Year |
Male |
Female |
Male |
Female |
Male |
Female |
| 1990 |
286,299 |
292,212 |
944,585 |
628,584 |
1,230,884 |
920,796 |
| 1993 |
325,892 |
331,601 |
682,161 |
305,973 |
1,008,053 |
637,574 |
| 1995 |
351,314 |
356,801 |
841,320 |
409,359 |
1,192,634 |
766,160 |
| 1996 |
363,476 |
368,927 |
914,327 |
447,159 |
1,277,803 |
816,086 |
| 1997 |
n.a. |
n.a. |
n.a. |
n.a. |
n.a. |
n.a. |
| 1998 |
388,687 |
397,323 |
1,002,718 |
482,137 |
1,391,405 |
879,460 |
| 1999 |
401,433 |
410,822 |
970,865 |
471,834 |
1,372,298 |
882,656 |
| 2000 |
415,613 |
426,177 |
927,023 |
448,445 |
1,342,636 |
874,622 |
| 2001 |
429,209 |
441,074 |
960,390 |
478,429 |
1,389,599 |
919,503 |
| 2002 |
442,310 |
455,975 |
1,020,913 |
500,730 |
1,463,223 |
956,705 |
| 2003 |
456,226 |
471,460 |
1,098,878 |
520,120 |
1,555,104 |
991,580 |
| 2004 |
469,327 |
486,907 |
1,240,267 |
557,155 |
1,709,594 |
1,044,062 |
| 2005 |
486,089 |
506,128 |
1,391,322 |
607,650 |
1,877,411 |
1,113,778 |
| 2006 |
501,148 |
522,168 |
1,510,818 |
648,826 |
2,011,966 |
1,170,994 |
| 2007 |
516,631 |
537,966 |
1,615,273 |
729,767 |
2,131,904 |
1,267,733 |
| 2008 |
532,566 |
554,985 |
1,618,766 |
735,496 |
2,151,332 |
1,290,481 |
| 2009 |
548,290 |
570,620 |
1,591,935 |
774,036 |
2,140,225 |
1,344,656 |
| 2010 |
563,631 |
584,712 |
1,586,716 |
846,995 |
2,150,347 |
1,431,707 |
| 2011 |
580,558 |
602,616 |
1,641,135 |
872,983 |
2,221,693 |
1,475,599 |
| 2012 |
595,365 |
617,071 |
1,705,468 |
905,824 |
2,300,833 |
1,522,895 |
| 2013 |
610,545 |
631,954 |
1,772,413 |
950,232 |
2,382,958 |
1,582,186 |
| 2014 |
626,256 |
649,601 |
1,855,279 |
960,857 |
2,481,535 |
1,610,458 |
| 2015 |
641,282 |
666,323 |
1,964,264 |
967,137 |
2,605,546 |
1,633,460 |
| 2016 |
656,084 |
681,609 |
2,089,302 |
984,129 |
2,745,386 |
1,665,738 |
| 2017 |
671,012 |
699,001 |
2,167,409 |
963,054 |
2,838,421 |
1,662,055 |
| 2018 |
686,475 |
716,638 |
2,253,768 |
964,757 |
2,940,243 |
1,681,395 |
| 2019 |
700,742 |
731,303 |
2,303,549 |
1,040,813 |
3,004,291 |
1,772,116 |
| 2020 |
714,936 |
745,034 |
2,177,731 |
1,033,012 |
2,892,667 |
1,778,046 |
| 2021 |
729,638 |
759,078 |
1,941,628 |
955,373 |
2,671,266 |
1,714,451 |
| 2022 |
744,238 |
772,838 |
2,188,819 |
1,087,673 |
2,933,057 |
1,860,511 |
| 2023 |
758,716 |
787,065 |
2,262,500 |
1,104,990 |
3,021,216 |
1,892,055 |
| 2024 |
773,304 |
792,864 |
2,214,667 |
1,100,419 |
2,987,971 |
1,893,283 |
Source: PACI and CSB
ANNEXED NOTE
1. Characteristics of data and definitions
1990-2020: The source of data used is the Public Authority for Civil Information (PACI), an independant government body in charge of :
1- centralising all population and labour force data in order to manage a fully computerised population register
2- issuing mandatory civil identification cards to every resident of the country, regardless of age and nationality.
The other source of demographic and socioeconomic data on Kuwait is the Central Statistical Office (CSO), operating within the Planning Ministry. The CSO has conducted ten population and housing censuses since its inception in 1957.
Since 1995 a marked discrepancy was witnessed between PACI’s and CSO’s population figures. PACI’s database is connected electronically with other administrations and bodies registering demographic events and professional/ residency issues (births and death; departures and arrivals; end of service, residency and ID deliveries, etc.).
PACI’s records of residents’ movements is thus regularly updated, which limits the risk of population overcount. Therefore, it is more likely that residents were undercounted during CSO- Ministry of Planning’
s census operations (see: Shah, N. Population of Kuwait. Structure and Dynamics, Kuwait: Kuwait University Academic Publication Council, 2010, chapter 1).
(a) Kuwaiti: the Kuwaiti nationality rests upon a document of Kuwaiti nationality or a certificate proving Kuwaiti nationality issued by the Ministry of Interior of Kuwait.
(b) Non-Kuwaiti: his/ her nationality is determined by the name of the State which issued the passport. The foreign national also entered Kuwait legally and has a stamp of residence.
This category includes the Bidoon, a category of stateless persons living in the Emirate. Kuwait’s Bidoon population originates from three broad categories:
1) those whose ancestors failed to apply for nationality or lacked necessary documentation at the time of Kuwait’s independence in 1961;
2) those recruited to work in Kuwait’s army or police force during the 1960s who permanently settled in Kuwait, along with their families;
3) children of Kuwaiti mothers and stateless or foreign fathers (see Human Rights Watch. Prisoners of the Past. Kuwaiti Bidun and the Burden of Statelessness, June 2011, p. 3).
(The children of Kuwaiti mothers and non-Kuwaiti fathers (with specific nationality) inherit the father’s nationality. They are stateless if the father is stateless).
2021: census data. 2021 census was conducted based on administrative sourcess.
https://census.csb.gov.kw/index_EN
https://census.csb.gov.kw/
2021- : CSB publishes population and other statistics, based on the results of census 2021.
Estimates of Kuwaiti population are based on natural increase (births-deaths) during the year.
Estimates of non-Kuwaiti population are based on natural increase, arrival and departures during the year.
Date of reference: end of year.
2. Institution which provides data
The Public Authority for Civil Information (PACI)
The Central Statistical Bureau
https://www.csb.gov.kw/Default
3. Period of data coverage: 31 December
The database is updated twice a year and the website presents only the most recent data.
4. Data availability
1990-2019: The statistics section of PACI’s website
http://www.paci.gov.kw/en/
http://www.paci.gov.kw/
provides population and socio-economic data b
roken down by nationality (Kuwaiti/ non-Kuwaiti). Some data are displayed by nationality groups.
Analytical tables and data crosstabulations are available for download in PDF, html, .png and Excel (.csv) formats.
PACI website and statistics has been inaccessible from outside Kuwait since 2019.
2021- : Central Statistical Bureau (CSB)
https://www.csb.gov.kw/Default
Section “Statistics and Bulletins”; “Population Statistics”; and “Population estimates”
https://www.csb.gov.kw/Pages/Statistics_en?ID=67&ParentCatID=1
Population estimates are also available in CBS Annual Statistical Abstracts (section “General Statistics”)
https://www.csb.gov.kw/Pages/Statistics_en.aspx?ID=18&ParentCatID=2
Dec. 2024: Last population data available as of 14 March 2026.
Last date of access: 14 March 2026.
GLMM and GRC cannot guarantee that the link to access the source will not change;
that the information will not be removed from the website it was obtained from;
that no geo-blockages will be imposed; or that the information will not be available for any another reason.
Kuwait, National Population, Foreign Population
|
Bahrain |
Kuwait* |
Oman |
Qatar |
Saudi Arabia |
UAE |
| 2010 |
657,856 |
2,433,691 |
816,143 |
N.A. |
9,932,323 |
6,003,140 |
| 2011 |
610,332 |
2,514,107 |
1,530,437 |
N.A. |
10,749,738 |
6,250,690 |
| 2012 |
609,335 |
2,611,292 |
1,530,437 |
N.A. |
11,485,315 |
6,514,991 |
| 2013 |
638,361 |
2,722,645 |
1,683,204 |
N.A. |
12,544,603 |
6,790,777 |
| 2014 |
683,818 |
2,816,136 |
1,732,188 |
N.A. |
12,774,237 |
7,184,260 |
| 2015 |
722,487 |
2,931,401 |
1,814,156 |
N.A. |
13,848,311 |
7,618,340 |
| 2016 |
759,019 |
3,073,431 |
1,986,226 |
N.A. |
14,598,886 |
7,979,782 |
| 2017 |
823,610 |
3,130,463 |
2,054,594 |
N.A. |
14,280,375 |
8,131,525 |
| 2018 |
813,377 |
3,218,525 |
2,013,523 |
N.A. |
13,110,645 |
8,164,997 |
| 2019 |
781,929 |
3,344,362 |
1,962,815 |
N.A. |
12,556,628 |
8,268,140 |
| 2020 |
758,941 |
3,210,743 |
1,858,516 |
N.A. |
13,573,923 |
8,014,862 |
| 2021 |
784,624 |
2,897,001 |
1,712,565 |
N.A. |
12,403,714 |
8,557,624 |
| 2022 |
835,525 |
3,276,492 |
1,894,657 |
N.A. |
13,382,962 |
8,957,263 |
| 2023 |
849,707 |
3,367,490 |
2,183,967 |
N.A. |
14,456,802 |
N.A. |
| 2024 |
848,934 |
3,315,086 |
2,248,503 |
N.A. |
15,665,022 |
N.A. |
*: end of year figures
N.A.: No data available as of 24 March 2026.
Sources:
(1) Bahrain: for detailed sources and metadata please visit:
https://gulfmigration.grc.net/bahrain-population-estimates-by-nationality-bahraini-non-bahraini-1991-dec-2024/
(2) Kuwait: for detailed sources and metadata please visit:
https://gulfmigration.grc.net/kuwait-population-by-nationality-kuwaiti-non-kuwaiti-1990-dec-2024/
(3) Oman: for detailed sources and metadata please visit:
https://gulfmigration.grc.net/oman-mid-year-population-by-nationality-omani-non-omani-2000-2024/
(4) Qatar: No total population data (all age groups) broken down by nationality are officially published.
(5) Saudi Arabia: for detailed sources and metadata please visit:
https://gulfmigration.grc.net/saudi-arabia-population-by-nationality-saudi-non-saudi-sex-and-age-group-2024-2/
(6) UAE: No population data broken down by nationality are officially published.
These figures are GLMM estimates.
For the methodology of these estimates, see:
https://gulfmigration.grc.net/uae-a-methodology-for-estimating-the-emirati-and-non-emirati-populations-2010-2022/
As of 24 March 2026, no vital statistics (births and deaths data) disaggregated by nationality are available on FCSC’s website for 2023 and 2024.
It is therefore impossible to update our disaggregated population estimates beyond 2022.
Last date of access: 24 March 2026.
GLMM and GRC cannot guarantee that the link to access the source will not change;
that the information will not be removed from the website it was obtained from;
that no geo-blockages will be imposed; or that the information will not be available for any another reason.
Keywords: Bahrain, Kuwait, Oman, Qatar, Saudi Arabia, United Arab Emirates, Foreign & National Populations
|
Bahrain |
Kuwait* |
Oman |
Qatar |
Saudi Arabia |
UAE |
| 2010 |
570,687 |
1,148,363 |
1,957,336 |
N.A. |
14,046,164 |
962,348 |
| 2011 |
584,688 |
1,183,185 |
2,013,158 |
N.A. |
14,342,129 |
992,898 |
| 2012 |
599,629 |
1,212,436 |
2,092,560 |
N.A. |
14,683,546 |
1,024,316 |
| 2013 |
614,830 |
1,242,499 |
2,172,002 |
N.A. |
15,079,401 |
1,055,978 |
| 2014 |
630,744 |
1,275,857 |
2,260,705 |
N.A. |
15,535,036 |
1,087,864 |
| 2015 |
647,835 |
1,307,605 |
2,344,646 |
N.A. |
15,968,071 |
1,120,010 |
| 2016 |
664,707 |
1,337,693 |
2,427,083 |
N.A. |
16,355,312 |
1,152,057 |
| 2017 |
677,506 |
1,370,013 |
2,504,253 |
N.A. |
16,696,980 |
1,183,086 |
| 2018 |
689,714 |
1,403,113 |
2,579,236 |
N.A. |
17,085,636 |
1,213,794 |
| 2019 |
701,827 |
1,432,045 |
2,655,453 |
N.A. |
17,507,171 |
1,244,638 |
| 2020 |
713,263 |
1,459,970 |
2,719,500 |
N.A. |
17,978,587 |
1,274,435 |
| 2021 |
719,741 |
1,488,716 |
2,766,808 |
N.A. |
18,380,669 |
1,303,383 |
| 2022 |
721,657 |
1,517,076 |
2,833,715 |
N.A. |
18,792,262 |
1,331,683 |
| 2023 |
727,352 |
1,545,781 |
2,895,547 |
N.A. |
19,245,929 |
N.A. |
| 2024 |
739,736 |
1,566,168 |
2,955,171 |
N.A. |
19,635,258 |
N.A. |
*: end of year figures
N.A.: No data available as of 24 March 2026.
Sources:
(1) Bahrain: for detailed sources and metadata please visit:
https://gulfmigration.grc.net/bahrain-population-estimates-by-nationality-bahraini-non-bahraini-1991-dec-2024/
(2) Kuwait: for detailed sources and metadata please visit:
https://gulfmigration.grc.net/kuwait-population-by-nationality-kuwaiti-non-kuwaiti-1990-dec-2024/
(3) Oman: for detailed sources and metadata please visit:
https://gulfmigration.grc.net/oman-mid-year-population-by-nationality-omani-non-omani-2000-2024/
(4) Qatar: No total population data (all age groups) broken down by nationality are officially published.
(5) Saudi Arabia: for detailed sources and metadata please visit:
https://gulfmigration.grc.net/saudi-arabia-population-by-nationality-saudi-non-saudi-sex-and-age-group-2024-2/
(6) UAE: No population data broken down by nationality are officially published.
These figures are GLMM estimates.
For the methodology of these estimates, see:
https://gulfmigration.grc.net/uae-a-methodology-for-estimating-the-emirati-and-non-emirati-populations-2010-2022/
As of 24 March 2026, no vital statistics (births and deaths data) disaggregated by nationality are available on FCSC’s website for 2023 and 2024.
It is therefore impossible to update our disaggregated population estimates beyond 2022.
Last date of access: 24 March 2026.
GLMM and GRC cannot guarantee that the link to access the source will not change;
that the information will not be removed from the website it was obtained from;
that no geo-blockages will be imposed; or that the information will not be available for any another reason.
Keywords: Bahrain, Kuwait, Oman, Qatar, Saudi Arabia, United Arab Emirates, Foreign & National Populations
| Year |
Kuwaitis |
Non-Kuwaitis |
Total |
| 1990 |
578,511 |
1,573,169 |
2,151,680 |
| 1993 |
657,493 |
988,134 |
1,645,627 |
| 1995 |
708,115 |
1,250,679 |
1,958,794 |
| 1996 |
732,403 |
1,361,486 |
2,093,889 |
| 1998 |
786,010 |
1,484,855 |
2,270,865 |
| 1999 |
812,255 |
1,442,699 |
2,254,954 |
| 2000 |
841,790 |
1,375,468 |
2,217,258 |
| 2001 |
870,283 |
1,438,819 |
2,309,102 |
| 2002 |
898,285 |
1,521,643 |
2,419,928 |
| 2003 |
927,686 |
1,618,998 |
2,546,684 |
| 2004 |
956,234 |
1,797,422 |
2,753,656 |
| 2005 |
992,217 |
1,998,972 |
2,991,189 |
| 2006 |
1,023,316 |
2,159,644 |
3,182,960 |
| 2007 |
1,054,598 |
2,345,039 |
3,399,637 |
| 2008 |
1,087,552 |
2,354,261 |
3,441,813 |
| 2009 |
1,118,911 |
2,365,970 |
3,484,881 |
| 2010 |
1,148,363 |
2,433,691 |
3,582,054 |
| 2011 |
1,183,185 |
2,514,107 |
3,697,292 |
| 2012 |
1,212,436 |
2,611,292 |
3,823,728 |
| 2013 |
1,242,499 |
2,722,645 |
3,965,144 |
| 2014 |
1,275,857 |
2,816,136 |
4,091,993 |
| 2015 |
1,307,605 |
2,931,401 |
4,239,006 |
| 2016 |
1,337,693 |
3,073,431 |
4,411,124 |
| 2017 |
1,370,013 |
3,130,463 |
4,500,476 |
| 2018 |
1,403,113 |
3,218,525 |
4,621,638 |
| 2019 |
1,432,045 |
3,344,362 |
4,776,407 |
| 2020 |
1,459,970 |
3,210,743 |
4,670,713 |
| 2021 |
1,488,716 |
2,897,001 |
4,385,717 |
| 2022 |
1,517,076 |
3,276,492 |
4,793,568 |
| 2023 |
1,545,781 |
3,367,490 |
4,913,271 |
| 2024 |
1,566,168 |
3,315,086 |
4,881,254
|
Source: PACI and CSB
ANNEXED NOTE
1. Characteristics of data and definitions
1990-2020: The source of data used is the Public Authority for Civil Information (PACI), an independant government body in charge of :
1- centralising all population and labour force data in order to manage a fully computerised population register
2- issuing mandatory civil identification cards to every resident of the country, regardless of age and nationality.
The other source of demographic and socioeconomic data on Kuwait is the Central Statistical Office (CSO), operating within the Planning Ministry. The CSO has conducted ten population and housing censuses since its inc
PACI’s records of residents’ movements is thus regularly updated, which limits the risk of population overcount. Therefore, it is more likely that residents were undercounted during CSO- Ministry of Planning’s census operations (see: Shah, N. Population of Kuwait. Structure and Dynamics, Kuwait: Kuwait University Academic Publication Council, 2010, chapter 1).
(a) Kuwaiti: the Kuwaiti nationality rests upon a document of Kuwaiti nationality or a certificate proving Kuwaiti nationality issued by the Ministry of Interior of Kuwait.
(b) Non-Kuwaiti: his/ her nationality is determined by the name of the State which issued the passport. The foreign national also entered Kuwait legally and has a stamp of residence.
This category includes the Bidoon, a category of stateless persons living in the Emirate. Kuwait’s Bidoon population originates from three broad categories:
1) those whose ancestors failed to apply for nationality or lacked necessary documentation at the time of Kuwait’s independence in 1961;
2) those recruited to work in Kuwait’s army or police force during the 1960s who permanently settled in Kuwait, along with their families;
3) children of Kuwaiti mothers and stateless or foreign fathers (see Human Rights Watch. Prisoners of the Past. Kuwaiti Bidun and the Burden of Statelessness, June 2011, p. 3).(The children of Kuwaiti mothers and non-Kuwaiti fathers (with specific nationality) inherit the father’s nationality. They are stateless if the father is stateless).
2021: census data. 2021 census was conducted based on administrative sourcess.
https://census.csb.gov.kw/index_EN
https://census.csb.gov.kw/
2021– : CSB publishes population and other statistics, based on the results of census 2021.
Estimates of Kuwaiti population are based on natural increase (births-deaths) during the year.
Estimates of non-Kuwaiti population are based on natural increase, arrival and departures during the year.
Date of reference: end of year.
2. Institution which provides data
The Public Authority for Civil Information (PACI)
The Central Statistical Bureau
https://www.csb.gov.kw/Default
3. Period of data coverage: 31 December
The database is updated twice a year and the website presents only the most recent data.
4. Data availability
1990-2019: The statistics section of PACI’s website
http://www.paci.gov.kw/en/
http://www.paci.gov.kw/
provides population and socio-economic data broken down by nationality (Kuwaiti/ non-Kuwaiti). Some data are displayed by nationality groups.
Analytical tables and data crosstabulations are available for download in PDF, html, .png and Excel (.csv) formats.
PACI website and statistics has been inaccessible from outside Kuwait since 2019.
2021- : Central Statistical Bureau (CSB)
https://www.csb.gov.kw/Default
Section “Statistics and Bulletins”; “Population Statistics”; and “Population estimates”
https://www.csb.gov.kw/Pages/Statistics_en?ID=67&ParentCatID=1
Population estimates are also available in CBS Annual Statistical Abstracts (section “General Statistics”)
https://www.csb.gov.kw/Pages/Statistics_en.aspx?ID=18&ParentCatID=2
Dec. 2024: Last population data available as of 14 March 2026.
Last date of access: 14 March 2026.
GLMM and GRC cannot guarantee that the link to access the source will not change;
that the information will not be removed from the website it was obtained from;
that no geo-blockages will be imposed; or that the information will not be available for any another reason.
Kuwait, National Population, Foreign Population
|
Bahrainis |
Non-Bahrainis |
Total |
|
Males |
Females |
Males |
Females |
Males |
Females |
| 1991-06 |
161,959 |
158,430 |
128,862 |
53,801 |
290,821 |
212,231 |
| 1992-06 |
165,932 |
162,294 |
132,967 |
55,265 |
298,899 |
217,559 |
| 1993-06 |
169,973 |
166,278 |
136,615 |
57,359 |
306,588 |
223,637 |
| 1994-06 |
174,108 |
170,371 |
140,366 |
59,521 |
314,474 |
229,892 |
| 1995-06 |
178,328 |
174,572 |
144,227 |
61,752 |
322,555 |
236,324 |
| 1996-06 |
182,648 |
178,882 |
148,207 |
64,055 |
330,855 |
242,937 |
| 1997-06 |
187,065 |
183,312 |
152,307 |
66,431 |
339,372 |
249,743 |
| 1998-06 |
191,577 |
187,858 |
156,523 |
68,884 |
348,100 |
256,742 |
| 1999-06 |
196,190 |
192,524 |
160,866 |
71,409 |
357,056 |
263,933 |
| 2000-06 |
200,903 |
197,318 |
165,344 |
74,017 |
366,247 |
271,335 |
| 2001-06 |
206,909 |
202,710 |
179,802 |
71,895 |
386,711 |
274,605 |
| 2002-06 |
215,813 |
211,433 |
202,383 |
80,924 |
418,196 |
292,357 |
| 2003-06 |
225,099 |
220,531 |
227,800 |
91,087 |
452,899 |
311,618 |
| 2004-06 |
234,786 |
230,021 |
256,408 |
102,526 |
491,194 |
332,547 |
| 2005-06 |
244,890 |
239,920 |
288,610 |
115,402 |
533,500 |
355,322 |
| 2006-06 |
255,428 |
250,244 |
324,856 |
129,896 |
580,284 |
380,140 |
| 2007-06 |
266,419 |
261,013 |
365,654 |
146,209 |
632,073 |
407,222 |
| 2008-06 |
273,612 |
267,975 |
402,978 |
158,931 |
676,590 |
426,906 |
| 2009-06 |
282,011 |
276,000 |
449,986 |
170,418 |
731,997 |
446,418 |
| 2010-06 |
288,452 |
282,235 |
475,905 |
181,951 |
764,357 |
464,186 |
| 2011-06 |
295,878 |
288,810 |
445,605 |
164,727 |
741,483 |
453,537 |
| 2012-06 |
305,354 |
294,275 |
455,095 |
154,240 |
760,449 |
448,515 |
| 2013-06 |
312,945 |
301,885 |
475,436 |
162,925 |
788,381 |
464,810 |
| 2014-06 |
320,839 |
309,905 |
485,648 |
198,170 |
806,487 |
508,075 |
| 2015-06 |
328,887 |
318,948 |
517,478 |
205,009 |
846,365 |
523,957 |
| 2016-06 |
336,834 |
327,873 |
551,555 |
207,464 |
888,389 |
535,337 |
| 2017-06 |
343,340 |
334,166 |
607,972 |
215,638 |
951,312 |
549,804 |
| 2018-06 |
349,661 |
340,053 |
597,203 |
216,174 |
946,864 |
556,227 |
| 2019-06 |
355,633 |
346,194 |
564,931 |
216,998 |
920,564 |
563,192 |
| 2020-06 |
361,979 |
351,284 |
563,057 |
195,884 |
925,036 |
547,168 |
| 2021-06 |
365,083 |
354,658 |
560,664 |
223,960 |
925,747 |
578,618 |
| 2022-06 |
361,587 |
352,424 |
585,450 |
225,232 |
947,037 |
577,656 |
| 2022-12 |
365,501 |
356,156 |
603,605 |
231,920 |
969,106 |
588,076 |
| 2023-06 |
368,448 |
358,904 |
611,427 |
238,280 |
979,875 |
597,184 |
| 2023-12 |
371,357 |
361,892 |
608,495 |
242,190 |
979,852 |
604,082 |
| 2024-06 |
374,701 |
365,035 |
610,391 |
238,543 |
985,092 |
603,578 |
| 2024-12 |
375,941 |
366,293 |
611,888 |
240,532 |
987,829 |
606,825 |
Source: Information & eGovernment Authority (IGA), Open Data Portal
ANNEXED NOTE
1. Technical Notes and Definitions
The table provides intercensal estimates of Bahrain’s total resident population (nationals and non-nationals)
Period of reference: mid-year, unless stated otherwise
In October 2015, the Bahraini e-Government Authority merged with the Central Informatics Organization to form the
Information and e-Government Authority (IGA), which manages and oversees all national digital assets.
The IGA maintains, and is part of, the Government Data Network, established in 1994, which links together 300 governmental entities.
Reference dates of censuses:
| 1941 |
|
| 1950 |
March 1950 |
| 1959 |
May 1959 |
| 1965 |
|
| 1971 |
April 1971 |
| 1981 |
n.d. |
| 1991 |
n.d. |
| 2001 |
|
| 2010 |
|
| 2020 |
|
Censuses’ implementation methods:
Until 1981: field enumeration (household survey)+de jure methodology, i.e. counting persons using their usual place of residence irrespective of where are they at census times
1991; 2001: field enumeration (household survey)+ first use of administrative records
2010: mixed census, based on both administrative records and a household survey sample of 15,000 Bahraini and non-Bahraini households.
2020 census was conducted solely on the basis of administrative records on the de jure population of the Kingdom.
Population of reference: all individuals (nationals and non-nationals) usually present within the State’s borders during time of reference.
Nationality of the person is defined by the passport used to enter the country. A Non-Bahraini is considered as such depending on the passport used to enter the country (or obtain the visa)
2. Institution which provides data
Information & eGovernment Authority (IGA)
3. Data availability
Published results of past censuses 1941 and 2001 are the only ones available online, as of February 2026.
Some datasets from census 2020 and the present intercensal population estimates are available on IGA’s Bahrain Open Data Portal, in the “Population” section”:
https://bahrain.opendatasoft.com/pages/homepage/
https://bahrain.opendatasoft.com/explore/?refine.theme=Population&disjunctive.theme&sort=modified
Dec. 2024: Last population data available as of 14 March 2026.
Date of access: 14 March 2026
GLMM and GRC cannot guarantee that the link to access the source will not change;
that the information will not be removed from the website it was obtained from;
that no geo-blockages will be imposed; or that the information will not be available for any another reason.
Keywords: Bahrain, National Population, Foreign Population
|
Bahrainis |
Non-Bahrainis |
Total |
| 1991-06 |
320,389 |
182,663 |
503,052 |
| 1992-06 |
328,226 |
188,232 |
516,458 |
| 1993-06 |
336,251 |
193,974 |
530,225 |
| 1994-06 |
344,479 |
199,887 |
544,366 |
| 1995-06 |
352,900 |
205,979 |
558,879 |
| 1996-06 |
361,530 |
212,262 |
573,792 |
| 1997-06 |
370,377 |
218,738 |
589,115 |
| 1998-06 |
379,435 |
225,407 |
604,842 |
| 1999-06 |
388,714 |
232,275 |
620,989 |
| 2000-06 |
398,221 |
239,361 |
637,582 |
| 2001-06 |
409,619 |
251,697 |
661,316 |
| 2002-06 |
427,246 |
283,307 |
710,553 |
| 2003-06 |
445,630 |
318,887 |
764,517 |
| 2004-06 |
464,807 |
358,934 |
823,741 |
| 2005-06 |
484,810 |
404,012 |
888,822 |
| 2006-06 |
505,672 |
454,752 |
960,424 |
| 2007-06 |
527,432 |
511,863 |
1,039,295 |
| 2008-06 |
541,587 |
561,909 |
1,103,496 |
| 2009-06 |
558,011 |
620,404 |
1,178,415 |
| 2010-06 |
570,687 |
657,856 |
1,228,543 |
| 2011-06 |
584,688 |
610,332 |
1,195,020 |
| 2012-06 |
599,629 |
609,335 |
1,208,964 |
| 2013-06 |
614,830 |
638,361 |
1,253,191 |
| 2014-06 |
630,744 |
683,818 |
1,314,562 |
| 2015-06 |
647,835 |
722,487 |
1,370,322 |
| 2016-06 |
664,707 |
759,019 |
1,423,726 |
| 2017-06 |
677,506 |
823,610 |
1,501,116 |
| 2018-06 |
689,714 |
813,377 |
1,503,091 |
| 2019-06 |
701,827 |
781,929 |
1,483,756 |
| 2020-06 |
713,263 |
758,941 |
1,472,204 |
| 2021-06 |
719,741 |
784,624 |
1,504,365 |
| 2022-06 |
714,011 |
810,682 |
1,524,693 |
| 2022-12 |
721,657 |
835,525 |
1,557,182 |
| 2023-06 |
727,352 |
849,707 |
1,577,059 |
| 2023-12 |
733,249 |
850,685 |
1,583,934 |
| 2024-06 |
739,736 |
848,934 |
1,588,670 |
| 2024-12 |
742,234 |
852,420 |
1,594,654 |
Source: Information & eGovernment Authority (IGA), Open Data Portal
ANNEXED NOTE
1. Technical Notes and Definitions
The table provides intercensal estimates of Bahrain’s total resident population (nationals and non-nationals)
Period of reference: mid-year, unless stated otherwise
In October 2015, the Bahraini e-Government Authority merged with the Central Informatics Organization to form the Information and e-Government Authority (IGA), which manages and oversees all national digital assets.
The IGA maintains, and is part of, the Government Data Network, established in 1994, which links together 300 governmental entities.
Reference dates of censuses:
| 1941 |
|
| 1950 |
March 1950 |
| 1959 |
May 1959 |
| 1965 |
|
| 1971 |
April 1971 |
| 1981 |
n.d. |
| 1991 |
n.d. |
| 2001 |
April 7th, 2001 |
| 2010 |
April 27th, 2010 |
| 2020 |
|
Censuses’ implementation methods:
Until 1981: field enumeration (household survey)+de jure methodology, i.e. counting persons using their usual place of residence irrespective of where are they at census times
1991; 2001: field enumeration (household survey)+ first use of administrative records
2010: mixed census, based on both administrative records and a household survey sample of 15,000 Bahraini and non-Bahraini households.
2020 census was conducted solely on the basis of administrative records on the de jure population of the Kingdom.
Population of reference: all individuals (nationals and non-nationals) usually present within the State’s borders during time of reference.
Nationality of the person is defined by the passport used to enter the country. A Non-Bahraini is considered as such depending on the passport used to enter the country (or obtain the visa)
2. Institution which provides data
Information & eGovernment Authority (IGA)
3. Data availability
Published results of past censuses 1941 and 2001 are the only ones available online, as of February 2026.
Some datasets from census 2020 and the present intercensal population estimates are available on IGA’s Bahrain Open Data Portal, in the “Population” section”:
https://bahrain.opendatasoft.com/pages/homepage/
https://bahrain.opendatasoft.com/explore/?refine.theme=Population&disjunctive.theme&sort=modified
Dec. 2024: Last population data available as of 14 March 2026.
Date of access: 14 March 2026
GLMM and GRC cannot guarantee that the link to access the source will not change;
that the information will not be removed from the website it was obtained from;
that no geo-blockages will be imposed; or that the information will not be available for any another reason.
Keywords: Bahrain, National Population, Foreign Population
|
Males |
Females |
Total |
Sex ratio
(men for 100 women) |
| 2000 |
2,249,793 |
919,429 |
3,169,222 |
245 |
| 2001 |
2,372,568 |
973,271 |
3,345,839 |
244 |
| 2002 |
2,514,249 |
1,031,752 |
3,546,001 |
244 |
| 2003 |
2,739,191 |
1,126,470 |
3,865,661 |
243 |
| 2004 |
2,979,251 |
1,250,607 |
4,229,858 |
238 |
| 2005 |
3,206,550 |
1,378,878 |
4,585,428 |
233 |
| 2006 |
3,398,181 |
1,511,601 |
4,909,782 |
225 |
| 2007 |
3,842,795 |
1,752,357 |
5,595,152 |
219 |
| 2008 |
4,429,652 |
2,068,246 |
6,497,898 |
214 |
| 2009 |
4,574,201 |
2,199,987 |
6,774,188 |
208 |
| 2010 |
4,655,257 |
2,310,231 |
6,965,488 |
202 |
| 2011 |
4,793,049 |
2,450,539 |
7,243,588 |
196 |
| 2012 |
4,937,649 |
2,601,658 |
7,539,307 |
190 |
| 2013 |
5,129,965 |
2,716,790 |
7,846,755 |
189 |
| 2014 |
5,396,717 |
2,875,407 |
8,272,124 |
188 |
| 2015 |
5,690,481 |
3,047,869 |
8,738,350 |
187 |
| 2016 |
5,931,800 |
3,200,039 |
9,131,839 |
185 |
| 2017 |
6,037,711 |
3,276,900 |
9,314,611 |
184 |
| 2018 |
6,064,682 |
3,314,109 |
9,378,791 |
183 |
| 2019 |
6,139,696 |
3,373,082 |
9,512,778 |
182 |
| 2020 |
5,984,973 |
3,304,324 |
9,289,297 |
181 |
| 2021 |
6,325,310 |
3,535,697 |
9,861,007 |
179 |
| 2022 |
6,595,692 |
3,693,254 |
10,288,946 |
179 |
| 2023 |
6,842,905 |
3,835,651 |
10,678,556 |
178 |
| 2024 |
7,235,074 |
4,059,169 |
11,294,243 |
178 |
Source: Federal Competitiveness and Statistics Centre
(*): Preliminary data
ANNEXED NOTE
1. Characteristics of data
Definition: Population count is the total count of all persons living within the boundaries of the country
at a specific time with their demographic characteristics from the official administrative records of the country.
Source of the estimate: administrative records
Period of reference: not stated.
Data disaggregated by nationality (Emirati/ non-Emirati) are unavailable in published statistics.
2. Institution which provides data
Federal Competitiveness and Statistics Centre (FCSC)
https://fcsc.gov.ae/
3. Data availability
The data is taken from the “Demography and Social” section of FCSC’s website
“Population”, then “Population estimates”.
https://fcsc.gov.ae/uae-stat-sub-category/?label=Population%20Estimates&value=0%7CPopulation%20Estimates%23POP_ES%23
Date of access: 06 March 2026.
GLMM and GRC cannot guarantee that the link to access the source will not change;
that the information will not be removed from the website it was obtained from;
that no geo-blockages will be imposed; or that the information will not be available for any another reason.
Keywords: United Arab Emirates, Population
|
Total population |
Demographic growth rates (%, year-on-year) |
| 2000 |
3,169,222 |
|
| 2001 |
3,345,839 |
5.4 |
| 2002 |
3,546,001 |
5.8 |
| 2003 |
3,865,661 |
8.6 |
| 2004 |
4,229,858 |
9.0 |
| 2005 |
4,585,428 |
8.1 |
| 2006 |
4,909,782 |
6.8 |
| 2007 |
5,595,152 |
13.1 |
| 2008 |
6,497,898 |
15.0 |
| 2009 |
6,774,188 |
4.2 |
| 2010 |
6,965,488 |
2.8 |
| 2011 |
7,243,588 |
3.9 |
| 2012 |
7,539,307 |
4.0 |
| 2013 |
7,846,755 |
4.0 |
| 2014 |
8,272,124 |
5.3 |
| 2015 |
8,738,350 |
5.5 |
| 2016 |
9,131,839 |
4.4 |
| 2017 |
9,314,611 |
2.0 |
| 2018 |
9,378,791 |
0.7 |
| 2019 |
9,512,778 |
1.4 |
| 2020 |
9,289,297 |
-2.4 |
| 2021 |
9,861,007 |
6.0 |
| 2022 |
10,288,946 |
4.2 |
| 2023 |
10,678,556 |
3.7 |
| 2024 |
11,294,243 |
5.6 |
Source: Federal Competitiveness and Statistics Centre
ANNEXED NOTE
1. Characteristics of data
Definition: Population count is the total count of all persons living within the boundaries of the country
at a specific time with their demographic characteristics from the official administrative records of the country.
Source of the estimate: administrative records
Period of reference: not stated.
Data disaggregated by nationality (Emirati/ non-Emirati) are unavailable in published statistics.
2. Institution which provides data
Federal Competitiveness and Statistics Centre (FCSC)
https://fcsc.gov.ae/
3. Data availability
The data is taken from the “Demography and Social” section of FCSC’s website
“Population”, then “Population estimates”.
https://fcsc.gov.ae/uae-stat-sub-category/?label=Population%20Estimates&value=0%7CPopulation%20Estimates%23POP_ES%23
Date of access: 06 March 2026.
GLMM and GRC cannot guarantee that the link to access the source will not change;
that the information will not be removed from the website it was obtained from;
that no geo-blockages will be imposed; or that the information will not be available for any another reason.
Keywords: United Arab Emirates, Population
|
Emiratis |
Non-Emiratis |
Total |
|
Males |
Females |
Total |
Males |
Females |
Total |
Males |
Females |
Total |
| Managers |
NA |
NA |
NA |
NA |
NA |
NA |
11.4% |
11.8% |
11.5% |
| Professionals |
NA |
NA |
NA |
NA |
NA |
NA |
11.8% |
24.3% |
14.7% |
| Technicians and Associate Professionals |
NA |
NA |
NA |
NA |
NA |
NA |
9.6% |
13.4% |
10.5% |
| Clerical Support Workers |
NA |
NA |
NA |
NA |
NA |
NA |
4.1% |
8.6% |
5.1% |
| Services and Sales Workers |
NA |
NA |
NA |
NA |
NA |
NA |
14.5% |
10.8% |
13.7% |
| Skilled Agriculteral, Forestry and Fishery Workers |
NA |
NA |
NA |
NA |
NA |
NA |
1.3% |
0.0% |
1.0% |
| Craft and Related Trades Workers |
NA |
NA |
NA |
NA |
NA |
NA |
19.7% |
0.5% |
15.3% |
| Plant and Machine Operators and Assemblers |
NA |
NA |
NA |
NA |
NA |
NA |
8.8% |
0.7% |
7.0% |
| Elementary Occupations |
NA |
NA |
NA |
NA |
NA |
NA |
17.0% |
26.6% |
19.2% |
| Not Stated |
NA |
NA |
NA |
NA |
NA |
NA |
1.7% |
3.2% |
2.0% |
| Total |
NA |
NA |
NA |
NA |
NA |
NA |
100.0% |
100.0% |
100.0% |
Source: Federal Competitiveness and Statistitics Center (FCSC), Labour Force Survey 2023
ANNEXED NOTE
1. Characteristics of data, definitions and population counting operations in the UAE
Since 2016, the UAE Federal Competitiveness and Statistitics Center (FCSC)
resumed the implementation of Labour Force Surveys. The last one was conducted in 2009.
Methodology:
Labour Force Surveys are based on field surveys.
Definition of employed person:
“15 years old and above, who have worked in the week prior the interview at least one hour for payment”.
No more metadata and methodological indications for the current Labour Force Surveys are available.
https://fcsc.gov.ae/methodology/
Classification of occupations used: International Standard of Occupation ISCO 08
Since 2020, Labour Force Surveys’ publications stopped including data disaggregated by nationality (national/non-national).
2. Institution which provides data
Federal Competitiveness and Statistics Centre (FCSC)
https://fcsc.gov.ae/
3. Data availability
The data is taken from the “Demography and Social” section of FCSC’s website
https://fcsc.gov.ae/#report-tvDetails
then “labour force”
https://fcsc.gov.ae/uae-stat-sub-category/?label=Labor%20Force&value=0%7CLabour%20Force%23LFS_LF%23
The results of 2008, 2009, 2016 to 2023 Labour Force Surveys are available (in Excel format) inthe section
2023 report: last year available on FCSC website as of the date of reference below.
Last date of access: 06 March 2026.
Keywords: United Arab Emirates, Labour Market, Employment, Female Employment
GLMM and GRC cannot guarantee that the link to access the source will not change;
that the information will not be removed from the website it was obtained from;
that no geo-blockages will be imposed; or that the information will not be available for any another reason.
|
|
Ministry of Health |
Other Government Sector |
Private Sector |
Total |
|
|
Saudis |
Non-Saudis |
Total |
Saudis |
Non-Saudis |
Total |
Saudis |
Non-Saudis |
Total |
Saudis |
Non-Saudis |
Total |
|
Physicians
|
Male |
20,772 |
20,396 |
41,168 |
9,242 |
6,276 |
15,518 |
2,918 |
20,340 |
23,258 |
32,932 |
47,012 |
79,944 |
| Female |
15,151 |
11,084 |
26,235 |
5,680 |
2,194 |
7,874 |
1,396 |
14,323 |
15,719 |
22,227 |
27,601 |
49,828 |
| Total |
35,923 |
31,480 |
67,403 |
14,922 |
8,470 |
23,392 |
4,314 |
34,663 |
38,977 |
55,159 |
74,613 |
129,772 |
|
Dentists
|
Male |
4,776 |
490 |
5,266 |
1,903 |
364 |
2,267 |
3,819 |
7,272 |
11,091 |
10,498 |
8,126 |
18,624 |
| Female |
3,849 |
216 |
4,065 |
1,683 |
234 |
1,917 |
3,568 |
5,577 |
9,145 |
9,100 |
6,027 |
15,127 |
| Total |
8,625 |
706 |
9,331 |
3,586 |
598 |
4,184 |
7,387 |
12,849 |
20,236 |
19,598 |
14,153 |
33,751 |
|
Nurses
|
Male |
27,511 |
1,665 |
29,176 |
13,878 |
3,819 |
17,697 |
5,638 |
11,648 |
17,286 |
47,027 |
17,132 |
64,159 |
| Female |
48,235 |
39,711 |
87,946 |
8,007 |
23,047 |
31,054 |
2,876 |
57,301 |
60,177 |
59,118 |
120,059 |
179,177 |
| Total |
75,746 |
41,376 |
117,122 |
21,885 |
26,866 |
48,751 |
8,514 |
68,949 |
77,463 |
106,145 |
137,191 |
243,336 |
|
Midwives
|
Male |
0 |
0 |
0 |
0 |
0 |
0 |
0 |
0 |
0 |
0 |
0 |
0 |
| Female |
1,448 |
960 |
2,408 |
229 |
693 |
922 |
44 |
2,765 |
2,809 |
1,721 |
4,418 |
6,139 |
| Total |
1,448 |
960 |
2,408 |
229 |
693 |
922 |
44 |
2,765 |
2,809 |
1,721 |
4,418 |
6,139 |
|
Pharmacists
|
Male |
3,103 |
55 |
3,158 |
2,047 |
229 |
2,276 |
6,394 |
21,966 |
28,360 |
11,544 |
22,250 |
33,794 |
| Female |
2,139 |
94 |
2,233 |
2,006 |
234 |
2,240 |
6,594 |
1,995 |
8,589 |
10,739 |
2,323 |
13,062 |
| Total |
5,242 |
149 |
5,391 |
4,053 |
463 |
4,516 |
12,988 |
23,961 |
36,949 |
22,283 |
24,573 |
46,856 |
|
Allied Health Professionals
|
Male |
61,704 |
862 |
62,566 |
19,333 |
1,236 |
20,569 |
25,126 |
11,188 |
36,314 |
106,163 |
13,286 |
119,449 |
| Female |
34,158 |
1,601 |
35,759 |
13,557 |
2,303 |
15,860 |
40,498 |
10,494 |
50,992 |
88,213 |
14,398 |
102,611 |
| Total |
95,862 |
2,463 |
98,325 |
32,890 |
3,539 |
36,429 |
65,624 |
21,682 |
87,306 |
194,376 |
27,684 |
222,060 |
|
Total
|
Male |
117,866 |
23,468 |
141,334 |
46,403 |
11,924 |
58,327 |
43,895 |
72,414 |
116,309 |
208,164 |
107,806 |
315,970 |
| Female |
104,980 |
53,666 |
158,646 |
31,162 |
28,705 |
59,867 |
54,976 |
92,455 |
147,431 |
191,118 |
174,826 |
365,944 |
| Total |
222,846 |
77,134 |
299,980 |
77,565 |
40,629 |
118,194 |
98,871 |
164,869 |
263,740 |
399,282 |
282,632 |
681,914 |
Source: Ministry of Health, Statistical Yearbook 2024
1. Characteristics of data
These data are employment counts of health personnel working in various sectors (MoH, other governmental, private) as recorded in administrative workforce data.
Data on healthcare establishments and workforce are based on administrative records from multiple official sources, including:
Ministry of Health (MoH); Saudi Commission for Health Specialties (SCFHS- the official regulatory/licensing body responsible for accrediting
and licensing health professionals to practice in Saudi Arabia); Other governmental entities (e.g., Ministry of Defense, National Guard, Ministry of Interior).
2. Institution which provides data
Ministry of Health
https://www.moh.gov.sa/en/pages/default.aspx
3. Data availability
MoH’s Annual Statistical Yearbooks are available in the Ministry’s website Open Data Portal, in PDF and Excel formats
https://www.moh.gov.sa/en/Ministry/OpenData/Pages/default.aspx
Open Data Library:
https://www.moh.gov.sa/en/ministry/opendata/pages/open-data-library.aspx
Annual Statistical Yearbooks:
https://www.moh.gov.sa/en/ministry/statistics/book/pages/default.aspx
https://www.moh.gov.sa/ministry/statistics/book/pages/default.aspx
Data on health personnels are published in the “Health Resources” chapter
A processing of the Ministry of Health data is published annually by GAStat since 2023:
(“social statistics”, then “Health Statistics”, then “Healthcare Establishments and Workforce Statistics”)
https://www.stats.gov.sa/en/statistics-tabs?tab=436312&category=2968800
Last date of access: 26 January 2026.
Keywords: Employment, Saudi Arabia, National & Foreign Labour, Highly-Skilled Labour
GLMM and GRC cannot guarantee that the link to access the source will not change;
that the information will not be removed from the website it was obtained from;
that no geo-blockages will be imposed; or that the information will not be available for any another reason.
|
|
2017 |
2018 |
2019 |
2020 |
2021 |
2022 |
2023 |
2024 |
|
Ministry of Health
|
Saudis |
55,471 |
65,515 |
67,949 |
68,859 |
70,937 |
76,963 |
83,652 |
95,862 |
| Non-Saudis |
4,175 |
4,015 |
3,335 |
2,979 |
2,748 |
2,674 |
2,613 |
2,463 |
| Total |
59,646 |
69,530 |
71,284 |
71,838 |
73,685 |
79,637 |
86,265 |
98,325 |
|
Other Government Sector
|
Saudis |
22,147 |
23,628 |
19,616 |
20,549 |
20,965 |
20,389 |
24,890 |
32,890 |
| Non-Saudis |
8,067 |
7,229 |
6,416 |
6,492 |
5,654 |
4,123 |
4,419 |
3,539 |
| Total |
30,214 |
30,857 |
26,032 |
27,041 |
26,619 |
24,512 |
29,309 |
36,429 |
|
Private Sector
|
Saudis |
5,940 |
7,800 |
8,575 |
10,364 |
14,838 |
17,875 |
21,072 |
65,624 |
| Non-Saudis |
16,061 |
16,125 |
17,728 |
14,730 |
15,861 |
16,338 |
17,042 |
21,682 |
| Total |
22,001 |
23,925 |
26,303 |
25,094 |
30,699 |
34,213 |
38,114 |
87,306 |
|
Total
|
Saudis |
83,558 |
96,943 |
96,140 |
99,772 |
106,740 |
115,227 |
129,614 |
194,376 |
| Non-Saudis |
28,303 |
27,369 |
27,479 |
24,201 |
24,263 |
23,135 |
24,074 |
27,684 |
| Total |
111,861 |
124,312 |
123,619 |
123,973 |
131,003 |
138,362 |
153,688 |
222,060 |
Source: Ministry of Health, Statistical Yearbooks, given years
1. Characteristics of data
These data are employment counts of health personnel working in various sectors (MoH, other governmental, private) as recorded in administrative workforce data.
Data on healthcare establishments and workforce are based on administrative records from multiple official sources, including:
Ministry of Health (MoH); Saudi Commission for Health Specialties (SCFHS- the official regulatory/licensing body responsible for accrediting
and licensing health professionals to practice in Saudi Arabia); Other governmental entities (e.g., Ministry of Defense, National Guard, Ministry of Interior).
In Saudi Arabia, the regulatory framework recognizes a broad group of health practitioners (excluding physicians, dentists and nurses) as allied health professionals,
such as technicians and clinical specialists who provide services in areas like laboratory science, imaging, physiotherapy, rehabilitation, nutrition, and other applied health sciences.
These practitioners are licensed and classified by SCFHS to practice in the Kingdom.
2. Institution which provides data
Ministry of Health
https://www.moh.gov.sa/en/pages/default.aspx
3. Data availability
MoH’s Annual Statistical Yearbooks are available in the Ministry’s website Open Data Portal, in PDF and Excel formats
https://www.moh.gov.sa/en/Ministry/OpenData/Pages/default.aspx
Open Data Library:
https://www.moh.gov.sa/en/ministry/opendata/pages/open-data-library.aspx
Annual Statistical Yearbooks:
https://www.moh.gov.sa/en/ministry/statistics/book/pages/default.aspx
https://www.moh.gov.sa/ministry/statistics/book/pages/default.aspx
Data on health personnels are published in the “Health Resources” chapter
A processing of the Ministry of Health data is published annually by GAStat since 2023:
(“social statistics”, then “Health Statistics”, then “Healthcare Establishments and Workforce Statistics”)
https://www.stats.gov.sa/en/statistics-tabs?tab=436312&category=2968800
Last date of access: 26 January 2026.
Keywords: Employment, Saudi Arabia, National & Foreign Labour, Highly-Skilled Labour
GLMM and GRC cannot guarantee that the link to access the source will not change;
that the information will not be removed from the website it was obtained from;
that no geo-blockages will be imposed; or that the information will not be available for any another reason.
|
|
2017 |
2018 |
2019 |
2020 |
2021 |
2022 |
2023 |
2024 |
|
Ministry of Health
|
Saudis |
3,589 |
3,740 |
3,930 |
4,214 |
4,266 |
4,527 |
4,681 |
5,242 |
| Non-Saudis |
264 |
266 |
291 |
144 |
131 |
119 |
92 |
149 |
| Total |
3,853 |
4,006 |
4,221 |
4,358 |
4,397 |
4,646 |
4,773 |
5,391 |
|
Other Government Sector
|
Saudis |
1,558 |
1,908 |
2,336 |
2,194 |
2,375 |
2,050 |
2,946 |
4,053 |
| Non-Saudis |
746 |
744 |
604 |
566 |
539 |
412 |
440 |
463 |
| Total |
2,304 |
2,652 |
2,940 |
2,760 |
2,914 |
2,462 |
3,386 |
4,516 |
|
Private Sector
|
Saudis |
1,130 |
1,438 |
1,582 |
3,286 |
5,417 |
7,394 |
7,671 |
12,988 |
| Non-Saudis |
21,025 |
21,029 |
23,129 |
17,125 |
18,112 |
19,538 |
20,980 |
23,961 |
| Total |
22,155 |
22,467 |
24,711 |
20,411 |
23,529 |
26,932 |
28,651 |
36,949 |
|
Total
|
Saudis |
6,277 |
7,086 |
7,848 |
9,694 |
12,058 |
13,971 |
15,298 |
22,283 |
| Non-Saudis |
22,035 |
22,039 |
24,024 |
17,835 |
18,782 |
20,069 |
21,512 |
24,573 |
| Total |
28,312 |
29,125 |
31,872 |
27,529 |
30,840 |
34,040 |
36,810 |
46,856 |
Source: Ministry of Health, Statistical Yearbooks, given years
1. Characteristics of data
These data are employment counts of health personnel working in various sectors (MoH, other governmental, private) as recorded in administrative workforce data.
Data on healthcare establishments and workforce are based on administrative records from multiple official sources, including:
Ministry of Health (MoH); Saudi Commission for Health Specialties (SCFHS- the official regulatory/licensing body responsible for accrediting
and licensing health professionals to practice in Saudi Arabia); Other governmental entities (e.g., Ministry of Defense, National Guard, Ministry of Interior).
2. Institution which provides data
Ministry of Health
https://www.moh.gov.sa/en/pages/default.aspx
3. Data availability
MoH’s Annual Statistical Yearbooks are available in the Ministry’s website Open Data Portal, in PDF and Excel formats
https://www.moh.gov.sa/en/Ministry/OpenData/Pages/default.aspx
Open Data Library:
https://www.moh.gov.sa/en/ministry/opendata/pages/open-data-library.aspx
Annual Statistical Yearbooks:
https://www.moh.gov.sa/en/ministry/statistics/book/pages/default.aspx
https://www.moh.gov.sa/ministry/statistics/book/pages/default.aspx
Data on health personnels are published in the “Health Resources” chapter
A processing of the Ministry of Health data is published annually by GAStat since 2023:
(“social statistics”, then “Health Statistics”, then “Healthcare Establishments and Workforce Statistics”)
https://www.stats.gov.sa/en/statistics-tabs?tab=436312&category=2968800
Last date of access: 26 January 2026.
Keywords: Employment, Saudi Arabia, National & Foreign Labour, Highly-Skilled Labour
GLMM and GRC cannot guarantee that the link to access the source will not change;
that the information will not be removed from the website it was obtained from;
that no geo-blockages will be imposed; or that the information will not be available for any another reason.
|
|
2017 |
2018 |
2019 |
2020 |
2021 |
2022 |
2023 |
2024 |
|
Ministry of Health
|
Saudis |
967 |
981 |
997 |
1,053 |
1,128 |
1,187 |
1,206 |
1,448 |
| Non-Saudis |
481 |
492 |
501 |
538 |
533 |
468 |
483 |
960 |
| Total |
1,448 |
1,473 |
1,498 |
1,591 |
1,661 |
1,655 |
1,689 |
2,408 |
|
Other Government Sector
|
Saudis |
100 |
123 |
138 |
136 |
127 |
139 |
157 |
229 |
| Non-Saudis |
555 |
579 |
480 |
463 |
473 |
460 |
475 |
693 |
| Total |
655 |
702 |
618 |
599 |
600 |
599 |
632 |
922 |
|
Private Sector
|
Saudis |
54 |
55 |
58 |
65 |
59 |
36 |
29 |
44 |
| Non-Saudis |
1,424 |
1,764 |
1,932 |
2,248 |
2,374 |
2,381 |
2,647 |
2,765 |
| Total |
1,478 |
1,819 |
1,990 |
2,313 |
2,433 |
2,417 |
2,676 |
2,809 |
|
Total
|
Saudis |
|
1,159 |
1,193 |
1,254 |
1,314 |
1,362 |
1,392 |
1,721 |
| Non-Saudis |
|
2,835 |
2,913 |
3,249 |
3,380 |
3,309 |
3,605 |
4,418 |
| Total |
|
3,994 |
4,106 |
4,503 |
4,694 |
4,671 |
4,997 |
6,139 |
Source: Ministry of Health, Statistical Yearbooks, given years
1. Characteristics of data
These data are employment counts of health personnel working in various sectors (MoH, other governmental, private) as recorded in administrative workforce data.
Data on healthcare establishments and workforce are based on administrative records from multiple official sources, including:
Ministry of Health (MoH); Saudi Commission for Health Specialties (SCFHS- the official regulatory/licensing body responsible for accrediting
and licensing health professionals to practice in Saudi Arabia); Other governmental entities (e.g., Ministry of Defense, National Guard, Ministry of Interior).
2. Institution which provides data
Ministry of Health
https://www.moh.gov.sa/en/pages/default.aspx
3. Data availability
MoH’s Annual Statistical Yearbooks are available in the Ministry’s website Open Data Portal, in PDF and Excel formats
https://www.moh.gov.sa/en/Ministry/OpenData/Pages/default.aspx
Open Data Library:
https://www.moh.gov.sa/en/ministry/opendata/pages/open-data-library.aspx
Annual Statistical Yearbooks:
https://www.moh.gov.sa/en/ministry/statistics/book/pages/default.aspx
https://www.moh.gov.sa/ministry/statistics/book/pages/default.aspx
Data on health personnels are published in the “Health Resources” chapter
A processing of the Ministry of Health data is published annually by GAStat since 2023:
(“social statistics”, then “Health Statistics”, then “Healthcare Establishments and Workforce Statistics”)
https://www.stats.gov.sa/en/statistics-tabs?tab=436312&category=2968800
Last date of access: 26 January 2026.
Keywords: Employment, Saudi Arabia, National & Foreign Labour, Highly-Skilled Labour
GLMM and GRC cannot guarantee that the link to access the source will not change;
that the information will not be removed from the website it was obtained from;
that no geo-blockages will be imposed; or that the information will not be available for any another reason.
|
|
2017 |
2018 |
2019 |
2020 |
2021 |
2022 |
2023 |
2024 |
|
Ministry of Health
|
Saudis |
59,273 |
61,704 |
62,888 |
66,236 |
67,061 |
69,850 |
72,323 |
75,746 |
| Non-Saudis |
43,269 |
42,296 |
42,706 |
40,019 |
39,282 |
34,378 |
36,430 |
41,376 |
| Total |
102,542 |
104,000 |
105,594 |
106,255 |
106,343 |
104,228 |
108,753 |
117,122 |
|
Other Government Sector
|
Saudis |
5,056 |
5,810 |
13,540 |
13,592 |
14,145 |
15,219 |
17,602 |
21,885 |
| Non-Saudis |
30,097 |
29,185 |
30,030 |
30,096 |
28,318 |
24,979 |
26,424 |
26,866 |
| Total |
35,153 |
34,995 |
43,570 |
43,688 |
42,463 |
40,198 |
44,026 |
48,751 |
|
Private Sector
|
Saudis |
2,625 |
2,070 |
2,284 |
3,262 |
3,274 |
3,211 |
4,096 |
8,514 |
| Non-Saudis |
41,792 |
39,506 |
43,459 |
38,993 |
44,715 |
48,250 |
56,235 |
68,949 |
| Total |
44,417 |
41,576 |
45,743 |
42,255 |
47,989 |
51,461 |
60,331 |
77,463 |
|
Total
|
Saudis |
66,954 |
69,584 |
78,712 |
83,090 |
84,480 |
88,280 |
94,021 |
106,145 |
| Non-Saudis |
115,158 |
110,987 |
116,195 |
109,108 |
112,315 |
107,607 |
119,089 |
137,191 |
| Total |
182,112 |
180,571 |
194,907 |
192,198 |
196,795 |
195,887 |
213,110 |
243,336 |
Source: Ministry of Health, Statistical Yearbooks, given years
1. Characteristics of data
These data are employment counts of health personnel working in various sectors (MoH, other governmental, private) as recorded in administrative workforce data.
Data on healthcare establishments and workforce are based on administrative records from multiple official sources, including:
Ministry of Health (MoH); Saudi Commission for Health Specialties (SCFHS- the official regulatory/licensing body responsible for accrediting and licensing health professionals to practice in Saudi Arabia); Other governmental entities (e.g., Ministry of Defense, National Guard, Ministry of Interior).
2. Institution which provides data
Ministry of Health
https://www.moh.gov.sa/en/pages/default.aspx
3. Data availability
MoH’s Annual Statistical Yearbooks are available in the Ministry’s website Open Data Portal, in PDF and Excel formats
https://www.moh.gov.sa/en/Ministry/OpenData/Pages/default.aspx
Open Data Library:
https://www.moh.gov.sa/en/ministry/opendata/pages/open-data-library.aspx
Annual Statistical Yearbooks:
https://www.moh.gov.sa/en/ministry/statistics/book/pages/default.aspx
https://www.moh.gov.sa/ministry/statistics/book/pages/default.aspx
Data on health personnels are published in the “Health Resources” chapter
A processing of the Ministry of Health data is published annually by GAStat since 2023:
(“social statistics”, then “Health Statistics”, then “Healthcare Establishments and Workforce Statistics”)
https://www.stats.gov.sa/en/statistics-tabs?tab=436312&category=2968800
Last date of access: 26 January 2026.
Keywords: Employment, Saudi Arabia, National & Foreign Labour, Highly-Skilled Labour
GLMM and GRC cannot guarantee that the link to access the source will not change;
that the information will not be removed from the website it was obtained from;
that no geo-blockages will be imposed; or that the information will not be available for any another reason.
|
|
Ministry of Health |
Other Government Sector |
Private Sector |
Total |
|
|
Saudis |
Non-Saudis |
Total |
Saudis |
Non-Saudis |
Total |
Saudis |
Non-Saudis |
Total |
Saudis |
Non-Saudis |
Total |
|
Physicians
|
Male |
17,709 |
18,524 |
36,233 |
7,351 |
6,306 |
13,657 |
5,317 |
17,054 |
22,371 |
30,377 |
41,884 |
72,261 |
| Female |
12,251 |
9,776 |
22,027 |
4,157 |
1,989 |
6,146 |
1,702 |
11,164 |
12,866 |
18,110 |
22,929 |
41,039 |
| Total |
29,960 |
28,300 |
58,260 |
11,508 |
8,295 |
19,803 |
7,019 |
28,218 |
35,237 |
48,487 |
64,813 |
113,300 |
|
Dentists
|
Male |
3,911 |
412 |
4,323 |
980 |
256 |
1,236 |
2,960 |
6,651 |
9,611 |
7,851 |
7,319 |
15,170 |
| Female |
2,616 |
117 |
2,733 |
898 |
104 |
1,002 |
2,594 |
4,471 |
7,065 |
6,108 |
4,692 |
10,800 |
| Total |
6,527 |
529 |
7,056 |
1,878 |
360 |
2,238 |
5,554 |
11,122 |
16,676 |
13,959 |
12,011 |
25,970 |
|
Nurses
|
Male |
27,203 |
1,646 |
28,849 |
8,956 |
3,859 |
12,815 |
1,739 |
7,856 |
9,595 |
37,898 |
13,361 |
51,259 |
| Female |
45,120 |
34,784 |
79,904 |
8,646 |
22,565 |
31,211 |
2,357 |
48,379 |
50,736 |
56,123 |
105,728 |
161,851 |
| Total |
72,323 |
36,430 |
108,753 |
17,602 |
26,424 |
44,026 |
4,096 |
56,235 |
60,331 |
94,021 |
119,089 |
213,110 |
|
Midwives
|
Male |
0 |
0 |
0 |
0 |
0 |
0 |
0 |
0 |
0 |
0 |
0 |
0 |
| Female |
1,206 |
483 |
1,689 |
157 |
475 |
632 |
29 |
2,647 |
2,676 |
1,392 |
3,605 |
4,997 |
| Total |
1,206 |
483 |
1,689 |
157 |
475 |
632 |
29 |
2,647 |
2,676 |
1,392 |
3,605 |
4,997 |
|
Pharmacists
|
Male |
2,766 |
47 |
2,813 |
1,458 |
225 |
1,683 |
3,702 |
19,855 |
23,557 |
7,926 |
20,127 |
28,053 |
| Female |
1,915 |
45 |
1,960 |
1,488 |
215 |
1,703 |
3,969 |
1,125 |
5,094 |
7,372 |
1,385 |
8,757 |
| Total |
4,681 |
92 |
4,773 |
2,946 |
440 |
3,386 |
7,671 |
20,980 |
28,651 |
15,298 |
21,512 |
36,810 |
|
Allied Health Professionals
|
Male |
58,417 |
857 |
59,274 |
15,240 |
1,556 |
16,796 |
7,119 |
9,397 |
16,516 |
80,776 |
11,810 |
92,586 |
| Female |
25,235 |
1,756 |
26,991 |
9,650 |
2,863 |
12,513 |
13,953 |
7,645 |
21,598 |
48,838 |
12,264 |
61,102 |
| Total |
83,652 |
2,613 |
86,265 |
24,890 |
4,419 |
29,309 |
21,072 |
17,042 |
38,114 |
129,614 |
24,074 |
153,688 |
|
Total
|
Male |
110,006 |
21,486 |
131,492 |
33,985 |
12,202 |
46,187 |
20,837 |
60,813 |
81,650 |
164,828 |
94,501 |
259,329 |
| Female |
88,343 |
46,961 |
135,304 |
24,996 |
28,211 |
53,207 |
24,604 |
75,431 |
100,035 |
137,943 |
150,603 |
288,546 |
| Total |
198,349 |
68,447 |
266,796 |
58,981 |
40,413 |
99,394 |
45,441 |
136,244 |
181,685 |
302,771 |
245,104 |
547,875 |
Source: Ministry of Health, Statistical Yearbook 2023
1. Characteristics of data
These data are employment counts of health personnel working in various sectors (MoH, other governmental, private) as recorded in administrative workforce data.
Data on healthcare establishments and workforce are based on administrative records from multiple official sources, including:
Ministry of Health (MoH); Saudi Commission for Health Specialties (SCFHS- the official regulatory/licensing body responsible for accrediting
and licensing health professionals to practice in Saudi Arabia); Other governmental entities (e.g., Ministry of Defense, National Guard, Ministry of Interior).
2. Institution which provides data
Ministry of Health
https://www.moh.gov.sa/en/pages/default.aspx
3. Data availability
MoH’s Annual Statistical Yearbooks are available in the Ministry’s website Open Data Portal, in PDF and Excel formats
https://www.moh.gov.sa/en/Ministry/OpenData/Pages/default.aspx
Open Data Library:
https://www.moh.gov.sa/en/ministry/opendata/pages/open-data-library.aspx
Annual Statistical Yearbooks:
https://www.moh.gov.sa/en/ministry/statistics/book/pages/default.aspx
https://www.moh.gov.sa/ministry/statistics/book/pages/default.aspx
Data on health personnels are published in the “Health Resources” chapter
A processing of the Ministry of Health data is published annually by GAStat since 2023:
(“social statistics”, then “Health Statistics”, then “Healthcare Establishments and Workforce Statistics”)
https://www.stats.gov.sa/en/statistics-tabs?tab=436312&category=2968800
Last date of access: 26 January 2026.
Keywords: Employment, Saudi Arabia, National & Foreign Labour, Highly-Skilled Labour
GLMM and GRC cannot guarantee that the link to access the source will not change;
that the information will not be removed from the website it was obtained from;
that no geo-blockages will be imposed; or that the information will not be available for any another reason.
|
|
Ministry of Health |
Other Government Sector |
Private Sector |
Total |
|
|
Saudis |
Non-Saudis |
Total |
Saudis |
Non-Saudis |
Total |
Saudis |
Non-Saudis |
Total |
Saudis |
Non-Saudis |
Total |
|
Physicians
|
Male |
15,651 |
19,257 |
34,908 |
7,380 |
5,968 |
13,348 |
3,726 |
15,652 |
19,378 |
26,757 |
40,877 |
67,634 |
| Female |
10,693 |
9,886 |
20,579 |
4,429 |
1,867 |
6,296 |
1,130 |
9,693 |
10,823 |
16,252 |
21,446 |
37,698 |
| Total |
26,344 |
29,143 |
55,487 |
11,809 |
7,835 |
19,644 |
4,856 |
25,345 |
30,201 |
43,009 |
62,323 |
105,332 |
|
Dentists
|
Male |
3,943 |
439 |
4,382 |
820 |
223 |
1,043 |
2,433 |
6,114 |
8,547 |
7,196 |
6,776 |
13,972 |
| Female |
2,650 |
121 |
2,771 |
721 |
89 |
810 |
2,213 |
4,131 |
6,344 |
5,584 |
4,341 |
9,925 |
| Total |
6,593 |
560 |
7,153 |
1,541 |
312 |
1,853 |
4,646 |
10,245 |
14,891 |
12,780 |
11,117 |
23,897 |
|
Nurses
|
Male |
26,760 |
1,489 |
28,249 |
8,267 |
3,487 |
11,754 |
1,324 |
6,544 |
7,868 |
36,351 |
11,520 |
47,871 |
| Female |
43,090 |
32,889 |
75,979 |
6,952 |
21,492 |
28,444 |
1,887 |
41,706 |
43,593 |
51,929 |
96,087 |
148,016 |
| Total |
69,850 |
34,378 |
104,228 |
15,219 |
24,979 |
40,198 |
3,211 |
48,250 |
51,461 |
88,280 |
107,607 |
195,887 |
|
Midwives
|
Male |
0 |
0 |
0 |
0 |
0 |
0 |
0 |
0 |
0 |
0 |
0 |
0 |
| Female |
1,187 |
468 |
1,655 |
139 |
460 |
599 |
36 |
2,381 |
2,417 |
1,362 |
3,309 |
4,671 |
| Total |
1,187 |
468 |
1,655 |
139 |
460 |
599 |
36 |
2,381 |
2,417 |
1,362 |
3,309 |
4,671 |
|
Pharmacists
|
Male |
2,738 |
43 |
2,781 |
1,114 |
195 |
1,309 |
3,630 |
18,515 |
22,145 |
7,482 |
18,753 |
26,235 |
| Female |
1,789 |
76 |
1,865 |
936 |
217 |
1,153 |
3,764 |
1,023 |
4,787 |
6,489 |
1,316 |
7,805 |
| Total |
4,527 |
119 |
4,646 |
2,050 |
412 |
2,462 |
7,394 |
19,538 |
26,932 |
13,971 |
20,069 |
34,040 |
|
Allied Health Professionals
|
Male |
55,805 |
1,057 |
56,862 |
12,712 |
1,581 |
14,293 |
6,309 |
9,034 |
15,343 |
74,826 |
11,672 |
86,498 |
| Female |
21,158 |
1,617 |
22,775 |
7,677 |
2,542 |
10,219 |
11,566 |
7,304 |
18,870 |
40,401 |
11,463 |
51,864 |
| Total |
76,963 |
2,674 |
79,637 |
20,389 |
4,123 |
24,512 |
17,875 |
16,338 |
34,213 |
115,227 |
23,135 |
138,362 |
|
Total
|
Male |
104,897 |
22,285 |
127,182 |
30,293 |
11,454 |
41,747 |
17,422 |
55,859 |
73,281 |
152,612 |
89,598 |
242,210 |
| Female |
80,567 |
45,057 |
125,624 |
20,854 |
26,667 |
47,521 |
20,596 |
66,238 |
86,834 |
122,017 |
137,962 |
259,979 |
| Total |
185,464 |
67,342 |
252,806 |
51,147 |
38,121 |
89,268 |
38,018 |
122,097 |
160,115 |
274,629 |
227,560 |
502,189 |
Source: Ministry of Health, Statistical Yearbook 2022
1. Characteristics of data
These data are employment counts of health personnel working in various sectors (MoH, other governmental, private) as recorded in administrative workforce data.
Data on healthcare establishments and workforce are based on administrative records from multiple official sources, including:
Ministry of Health (MoH); Saudi Commission for Health Specialties (SCFHS- the official regulatory/licensing body responsible for accrediting
and licensing health professionals to practice in Saudi Arabia); Other governmental entities (e.g., Ministry of Defense, National Guard, Ministry of Interior).
2. Institution which provides data
Ministry of Health
https://www.moh.gov.sa/en/pages/default.aspx
3. Data availability
MoH’s Annual Statistical Yearbooks are available in the Ministry’s website Open Data Portal, in PDF and Excel formats
https://www.moh.gov.sa/en/Ministry/OpenData/Pages/default.aspx
Open Data Library:
https://www.moh.gov.sa/en/ministry/opendata/pages/open-data-library.aspx
Annual Statistical Yearbooks:
https://www.moh.gov.sa/en/ministry/statistics/book/pages/default.aspx
https://www.moh.gov.sa/ministry/statistics/book/pages/default.aspx
Data on health personnels are published in the “Health Resources” chapter
A processing of the Ministry of Health data is published annually by GAStat since 2023:
(“social statistics”, then “Health Statistics”, then “Healthcare Establishments and Workforce Statistics”)
https://www.stats.gov.sa/en/statistics-tabs?tab=436312&category=2968800
Last date of access: 26 January 2026.
Keywords: Employment, Saudi Arabia, National & Foreign Labour, Highly-Skilled Labour
GLMM and GRC cannot guarantee that the link to access the source will not change;
that the information will not be removed from the website it was obtained from;
that no geo-blockages will be imposed; or that the information will not be available for any another reason.
|
|
2017 |
2018 |
2019 |
2020 |
2021 |
2022 |
2023 |
2024 |
|
Ministry of Health
|
Saudis |
13,411 |
16,706 |
19,615 |
20,311 |
23,585 |
26,344 |
29,960 |
35,923 |
| Non-Saudis |
29,198 |
28,865 |
29,524 |
29,754 |
29,735 |
29,143 |
28,300 |
31,480 |
| Total |
42,609 |
45,571 |
49,139 |
50,065 |
53,320 |
55,487 |
58,260 |
67,403 |
|
Other Government Sector
|
Saudis |
8,158 |
9,316 |
9,364 |
11,201 |
9,721 |
11,809 |
11,508 |
14,922 |
| Non-Saudis |
8,188 |
8,839 |
9,098 |
9,033 |
8,409 |
7,835 |
8,295 |
8,470 |
| Total |
16,346 |
18,155 |
18,462 |
20,234 |
18,130 |
19,644 |
19,803 |
23,392 |
|
Private Sector
|
Saudis |
1,803 |
1,968 |
2,165 |
5,382 |
3,876 |
4,856 |
7,019 |
4,314 |
| Non-Saudis |
21,617 |
22,329 |
24,567 |
19,655 |
24,291 |
25,345 |
28,218 |
34,663 |
| Total |
23,420 |
24,297 |
26,732 |
25,037 |
28,167 |
30,201 |
35,237 |
38,977 |
|
Total
|
Saudis |
23,372 |
27,990 |
31,144 |
36,894 |
37,182 |
43,009 |
48,487 |
55,159 |
| Non-Saudis |
59,003 |
60,033 |
63,189 |
58,442 |
62,435 |
62,323 |
64,813 |
74,613 |
| Total |
82,375 |
88,023 |
94,333 |
95,336 |
99,617 |
105,332 |
113,300 |
129,772 |
Source: Ministry of Health, Statistical Yearbooks, given years
1. Characteristics of data
These data are employment counts of health personnel working in various sectors (MoH, other governmental, private) as recorded in administrative workforce data.
Data on healthcare establishments and workforce are based on administrative records from multiple official sources, including:
Ministry of Health (MoH); Saudi Commission for Health Specialties (SCFHS- the official regulatory/licensing body responsible for accrediting
and licensing health professionals to practice in Saudi Arabia); Other governmental entities (e.g., Ministry of Defense, National Guard, Ministry of Interior).
2. Institution which provides data
Ministry of Health
https://www.moh.gov.sa/en/pages/default.aspx
3. Data availability
MoH’s Annual Statistical Yearbooks are available in the Ministry’s website Open Data Portal, in PDF and Excel formats
https://www.moh.gov.sa/en/Ministry/OpenData/Pages/default.aspx
Open Data Library:
https://www.moh.gov.sa/en/ministry/opendata/pages/open-data-library.aspx
Annual Statistical Yearbooks:
https://www.moh.gov.sa/en/ministry/statistics/book/pages/default.aspx
https://www.moh.gov.sa/ministry/statistics/book/pages/default.aspx
Data on health personnels are published in the “Health Resources” chapter
A processing of the Ministry of Health data is published annually by GAStat since 2023:
(“social statistics”, then “Health Statistics”, then “Healthcare Establishments and Workforce Statistics”)
https://www.stats.gov.sa/en/statistics-tabs?tab=436312&category=2968800
Last date of access: 26 January 2026.
Keywords: Employment, Saudi Arabia, National & Foreign Labour, Highly-Skilled Labour
GLMM and GRC cannot guarantee that the link to access the source will not change;
that the information will not be removed from the website it was obtained from;
that no geo-blockages will be imposed; or that the information will not be available for any another reason.
|
|
2017 |
2018 |
2019 |
2020 |
2021 |
2022 |
2023 |
2024 |
|
Ministry of Health
|
Saudis |
3,349 |
3,546 |
4,270 |
5,227 |
6,220 |
6,593 |
6,527 |
8,625 |
| Non-Saudis |
647 |
591 |
573 |
588 |
590 |
560 |
529 |
706 |
| Total |
3,996 |
4,137 |
4,843 |
5,815 |
6,810 |
7,153 |
7,056 |
9,331 |
|
Other Government Sector
|
Saudis |
965 |
1,128 |
1,424 |
1,460 |
1,679 |
1,541 |
1,878 |
3,586 |
| Non-Saudis |
318 |
303 |
261 |
308 |
319 |
312 |
360 |
598 |
| Total |
1,283 |
1,431 |
1,685 |
1,768 |
1,998 |
1,853 |
2,238 |
4,184 |
|
Private Sector
|
Saudis |
1,219 |
1,734 |
1,904 |
3,051 |
4,221 |
4,646 |
5,554 |
7,387 |
| Non-Saudis |
9,201 |
9,450 |
10,381 |
8,988 |
9,710 |
10,245 |
11,122 |
12,849 |
| Total |
10,420 |
11,184 |
12,285 |
12,039 |
13,931 |
14,891 |
16,676 |
20,236 |
|
Total
|
Saudis |
5,533 |
6,408 |
7,598 |
9,738 |
12,120 |
12,780 |
13,959 |
19,598 |
| Non-Saudis |
10,166 |
10,344 |
11,215 |
9,884 |
10,619 |
11,117 |
12,011 |
14,153 |
| Total |
15,699 |
16,752 |
18,813 |
19,622 |
22,739 |
23,897 |
25,970 |
33,751 |
Source: Ministry of Health, Statistical Yearbooks, given years
1. Characteristics of data
These data are employment counts of health personnel working in various sectors (MoH, other governmental, private) as recorded in administrative workforce data.
Data on healthcare establishments and workforce are based on administrative records from multiple official sources, including:
Ministry of Health (MoH); Saudi Commission for Health Specialties (SCFHS- the official regulatory/licensing body responsible for accrediting
and licensing health professionals to practice in Saudi Arabia); Other governmental entities (e.g., Ministry of Defense, National Guard, Ministry of Interior).
2. Institution which provides data
Ministry of Health
https://www.moh.gov.sa/en/pages/default.aspx
3. Data availability
MoH’s Annual Statistical Yearbooks are available in the Ministry’s website Open Data Portal, in PDF and Excel formats
https://www.moh.gov.sa/en/Ministry/OpenData/Pages/default.aspx
Open Data Library:
https://www.moh.gov.sa/en/ministry/opendata/pages/open-data-library.aspx
Annual Statistical Yearbooks:
https://www.moh.gov.sa/en/ministry/statistics/book/pages/default.aspx
https://www.moh.gov.sa/ministry/statistics/book/pages/default.aspx
Data on health personnels are published in the “Health Resources” chapter
A processing of the Ministry of Health data is published annually by GAStat since 2023:
(“social statistics”, then “Health Statistics”, then “Healthcare Establishments and Workforce Statistics”)
https://www.stats.gov.sa/en/statistics-tabs?tab=436312&category=2968800
Last date of access: 26 January 2026.
Keywords: Employment, Saudi Arabia, National & Foreign Labour, Highly-Skilled Labour
GLMM and GRC cannot guarantee that the link to access the source will not change;
that the information will not be removed from the website it was obtained from;
that no geo-blockages will be imposed; or that the information will not be available for any another reason.
|
Agriculture, forestry and fishing |
Mining and quarrying |
Manufacturing |
Electricity, gas, steam and air conditioning supply |
Water supply; sewerage, waste management and remediation activities |
Construction |
Wholesale and retail trade; repair of motor vehicles and motorcycles |
Transportation and storage |
Accommodation and food service activities |
Information and communication |
Financial and insurance activities |
Real estate activities |
Professional, scientific and technical activities |
Administrative and support service activities |
Public administration and defence; compulsory social security |
Education |
Human health and social work activities |
Arts, entertainment and recreation |
Other service activities |
Activities of households as employer; Activities of extraterritorial organizations and bodies; undifferentiated goods- and services-producing activities of households for own use |
Activities of extraterritorial organizations and bodies |
Not specified |
Total |
| Q1 2021 |
89,866 |
64,007 |
626,216 |
37,403 |
18,487 |
1,803,570 |
1,426,482 |
192,230 |
308,053 |
38,608 |
12,839 |
25,182 |
88,617 |
883,841 |
70,341 |
62,365 |
229,046 |
18,432 |
174,281 |
110 |
404 |
131,412 |
6,301,792 |
| Q2 2021 |
103,627 |
173,230 |
827,037 |
78,442 |
23,578 |
2,029,594 |
1,828,219 |
260,938 |
381,488 |
78,762 |
76,810 |
38,134 |
131,885 |
976,024 |
264,295 |
122,705 |
436,670 |
28,124 |
210,010 |
145 |
1,575 |
118,878 |
8,190,170 |
| Q3 2021 |
102,094 |
173,224 |
830,836 |
77,763 |
23,221 |
1,996,612 |
1,813,880 |
264,794 |
390,819 |
80,821 |
77,191 |
39,207 |
133,323 |
946,426 |
272,991 |
135,359 |
444,930 |
29,325 |
208,242 |
148 |
1,627 |
115,552 |
8,158,385 |
| Q4 2021 |
106,710 |
176,650 |
852,925 |
78,129 |
23,850 |
2,058,439 |
1,790,879 |
281,064 |
555,301 |
82,149 |
77,924 |
39,303 |
138,157 |
977,737 |
295,173 |
140,899 |
470,352 |
29,992 |
209,986 |
224 |
1,748 |
143,717 |
8,531,308 |
| Q1 2022 |
132,269 |
171,620 |
892,895 |
79,442 |
29,025 |
2,152,344 |
1,820,040 |
319,753 |
671,247 |
84,090 |
79,815 |
39,807 |
153,113 |
1,012,678 |
297,192 |
146,434 |
407,099 |
31,667 |
244,155 |
246 |
1,854 |
329,694 |
9,096,479 |
| Q2 2022 |
181,046 |
142,153 |
943,887 |
40,157 |
87,941 |
2,453,723 |
1,719,838 |
406,735 |
653,310 |
123,491 |
88,780 |
66,181 |
196,824 |
1,141,367 |
264,775 |
171,808 |
413,245 |
29,288 |
257,284 |
106 |
844 |
158,839 |
9,541,622 |
| Q3 2022 |
NA |
NA |
NA |
NA |
NA |
NA |
NA |
NA |
NA |
NA |
NA |
NA |
NA |
NA |
NA |
NA |
NA |
NA |
NA |
NA |
NA |
NA |
NA |
| Q4 2022 |
354,795 |
141,816 |
1,033,933 |
39,390 |
106,556 |
2,460,230 |
1,626,050 |
439,565 |
675,154 |
123,331 |
91,291 |
54,627 |
213,687 |
1,175,278 |
266,467 |
180,694 |
440,396 |
32,338 |
237,962 |
94 |
859 |
228,525 |
9,923,038 |
| Q1 2023 |
521,309 |
146,455 |
1,086,782 |
39,011 |
122,329 |
2,540,702 |
1,653,550 |
459,542 |
694,182 |
123,307 |
92,274 |
55,674 |
225,340 |
1,204,832 |
267,708 |
184,775 |
452,352 |
33,509 |
239,385 |
85 |
838 |
295,094 |
10,439,035 |
| Q2 2023 |
540,603 |
157,758 |
1,123,456 |
38,498 |
129,086 |
2,541,815 |
1,629,081 |
467,109 |
686,139 |
118,538 |
92,610 |
54,738 |
228,288 |
1,168,552 |
271,363 |
177,190 |
443,553 |
32,748 |
235,915 |
89 |
830 |
357,127 |
10,495,086 |
| Q3 2023 |
139,654 |
160,780 |
1,184,551 |
38,418 |
152,013 |
2,608,274 |
1,621,497 |
494,242 |
686,468 |
106,607 |
93,314 |
53,671 |
234,837 |
1,130,332 |
278,501 |
194,591 |
448,359 |
32,242 |
234,478 |
88 |
833 |
919,238 |
10,812,988 |
| Q4 2023 |
142,402 |
166,204 |
1,211,398 |
39,317 |
156,994 |
2,617,187 |
1,616,873 |
503,243 |
673,976 |
104,389 |
95,184 |
52,808 |
242,103 |
1,110,940 |
284,829 |
197,448 |
448,222 |
32,069 |
230,526 |
86 |
473 |
916,062 |
10,842,733 |
| Q1 2024 |
164,292 |
173,925 |
1,298,422 |
40,294 |
138,035 |
2,816,018 |
1,647,023 |
550,184 |
681,367 |
110,795 |
96,478 |
54,389 |
250,588 |
1,156,985 |
289,434 |
202,219 |
453,900 |
32,572 |
242,973 |
83 |
487 |
992,969 |
11,393,432 |
| Q2 2024 |
203,475 |
186,826 |
1,341,920 |
46,151 |
168,219 |
2,894,564 |
1,648,970 |
566,981 |
679,540 |
111,735 |
96,916 |
53,981 |
255,021 |
1,170,302 |
282,128 |
188,489 |
448,912 |
32,671 |
250,886 |
77 |
497 |
1,078,502 |
11,706,763 |
| Q3 2024 |
204,897 |
197,474 |
1,386,764 |
46,674 |
173,128 |
2,972,737 |
1,644,350 |
592,765 |
673,835 |
113,119 |
98,607 |
53,303 |
263,531 |
1,196,249 |
289,351 |
207,694 |
457,315 |
33,166 |
253,536 |
90 |
495 |
1,149,578 |
12,008,658 |
| Q4 2024 |
290,672 |
220,458 |
1,515,096 |
49,100 |
180,363 |
3,246,657 |
1,732,029 |
756,106 |
708,196 |
120,389 |
100,115 |
55,646 |
273,228 |
1,237,396 |
295,254 |
294,727 |
463,194 |
40,961 |
273,158 |
102 |
396 |
585,242 |
12,438,485 |
| Q1 2025 |
341,690 |
218,088 |
1,576,431 |
49,862 |
179,481 |
3,396,663 |
1,753,708 |
780,243 |
714,084 |
122,356 |
101,500 |
56,703 |
277,561 |
1,267,077 |
300,533 |
292,239 |
466,499 |
41,689 |
281,093 |
109 |
393 |
580,785 |
12,798,787 |
| Q2 2025 |
344,871 |
217,630 |
1,590,165 |
50,249 |
178,993 |
3,444,075 |
1,748,275 |
783,583 |
708,803 |
124,357 |
102,413 |
57,136 |
279,433 |
1,268,184 |
304,390 |
279,110 |
464,078 |
41,947 |
279,477 |
113 |
399 |
603,934 |
12,871,615 |
| Q3 2025 |
253,180 |
203,902 |
1,482,452 |
42,568 |
96,453 |
3,412,388 |
1,827,205 |
827,919 |
730,292 |
176,619 |
106,727 |
75,887 |
291,530 |
1,420,733 |
300,829 |
321,900 |
495,426 |
47,940 |
305,985 |
115 |
389 |
806,330 |
13,226,769 |
Source: Register-based Labour Market Statistics, General Authority for Statistics (GAStat)
1. Data collection methodology
LFS were first conducted in 2001 and became bi-annual after 2006. Data were collected through nationally
representative household sample surveys, which sampling was based on most recent censuses.
Since 2016, Labour Force Surveys have been conducted and published on a quarterly basis, based on a
household telephone survey conducted by GAStat. Employment data extracted from administrative records
were also introduced as a complement to the results of Labour Force Surveys in Labour Market Statistics’
publications, starting on Q1 2017.
The present data is taken from administrative records.
Population of reference: workers subject to the rule of the General Organization of Social Insurance (GOSI):
a. contributors on the job who are subject to social insurance laws and regulations in the private and government sector;
b. new contributors, and contributors who terminated their contribution to social insurance during the quarter.
Figures of workers in Labor Market statistics which were derived from administrative records do not include the following categories:
1-Workers in the military and security sectors
2- Workers who are not registered in the civil service, social insurance (GOSI) and domestic workers’ records, which include:
– Saudis working for their own businesses and are not subjected to the labor regulations, also, not registered in social insurance,
such as those who work in delivery through electronic apps
– Saudi employers who work in establishments and not registered in the social insurance
– Non-Saudi staff working in foreign international, political or military missions
3- Non-Saudi employees who come to the Kingdom for work that normally takes less than three months to be completed.
Definitions and categories used by GAStat in Labour Markets Statistics (employment; unemployment;
occupation and activity sectors, etc.) are based on international standards:
For LFS methodology and definitions, see metadata section in report, and:
https://database.stats.gov.sa/Methodologies/En_Documents/03_Labor%20Market%20Bulletin%20Methodology,%20Fourth%20Quarter%202020%20_%20General%20Authority%20for%20Statistics.pdf
https://database.stats.gov.sa/Methodologies/En_Documents/03_Labor%20Market%20Bulletin%20Methodology,%20Fourth%20Quarter%202020%20_%20General%20Authority%20for%20Statistics.pdf
Classification of economic activities: Saudi Classification of Economic Activities, based on the International Standard Industrial Classification of all economic activities (ISIC4)
https://www.stats.gov.sa/en/classifications
2. Institution which provides data
General Authority for Statistics (GAStat)
3. Data availability
Since 2021, GAStat has been publishing separately the employment data taken from administrative records,
and unemployment/inactivity data as well as general indicators, calculated from the results of the field
interviews conducted by GAStat (Labour Force Survey).
The time-series was built using the quarterly Register-based Labour Market Statistics for given quarters
2023-2025: available at:
https://www.stats.gov.sa/en/statistics-tabs/-/categories/417515?tab=436312&category=417515
Before 2023: available in the “archived data”:
https://www.stats.gov.sa/en/statistics?index=1317550
“social statistics”, and “labour force”
https://www.stats.gov.sa/en/statistics-tabs?tab=436312&category=1333429
Last date of access: 26 January 2026.
Keywords: Employment, Saudi Arabia, National & Foreign Labour
GLMM and GRC cannot guarantee that the link to access the source will not change;
that the information will not be removed from the website it was obtained from;
that no geo-blockages will be imposed; or that the information will not be available for any another reason.
|
Agriculture, forestry and fishing |
Mining and quarrying |
Manufacturing |
Electricity, gas, steam and air conditioning supply |
Water supply; sewerage, waste management and remediation activities |
Construction |
Wholesale and retail trade; repair of motor vehicles and motorcycles |
Transportation and storage |
Accommodation and food service activities |
Information and communication |
Financial and insurance activities |
Real estate activities |
Professional, scientific and technical activities |
Administrative and support service activities |
Public administration and defence; compulsory social security |
Education |
Human health and social work activities |
Arts, entertainment and recreation |
Other service activities |
Activities of households as employer; Activities of extraterritorial organizations and bodies; undifferentiated goods- and services-producing activities of households for own use |
Activities of extraterritorial organizations and bodies |
Not specified |
Total |
| Q1 2021 |
16,434 |
111,099 |
211,568 |
40,952 |
5,122 |
311,944 |
446,094 |
66,144 |
78,333 |
40,986 |
63,629 |
13,049 |
44,394 |
139,343 |
176,561 |
70,741 |
200,122 |
8,715 |
41,284 |
32 |
1,052 |
1,845 |
2,089,443 |
| Q2 2021 |
16,266 |
111,003 |
213,760 |
41,032 |
5,272 |
286,699 |
445,969 |
67,453 |
74,799 |
41,119 |
64,199 |
13,581 |
44,560 |
131,967 |
186,072 |
64,313 |
202,540 |
9,287 |
42,481 |
31 |
1,155 |
1,780 |
2,065,338 |
| Q3 2021 |
16,288 |
111,765 |
218,854 |
41,242 |
5,336 |
290,900 |
460,134 |
70,977 |
79,822 |
42,329 |
64,642 |
14,444 |
46,420 |
138,444 |
193,476 |
74,797 |
209,095 |
10,296 |
43,352 |
29 |
1,208 |
1,458 |
2,135,308 |
| Q4 2021 |
16,527 |
114,420 |
225,917 |
41,596 |
5,567 |
302,768 |
460,682 |
75,606 |
115,570 |
44,093 |
65,029 |
14,883 |
49,857 |
140,659 |
211,419 |
80,054 |
219,344 |
10,435 |
43,627 |
28 |
1,314 |
1,417 |
2,240,812 |
| Q1 2022 |
17,545 |
113,400 |
235,198 |
42,065 |
7,440 |
318,228 |
481,745 |
86,032 |
149,260 |
45,927 |
66,454 |
15,741 |
58,115 |
151,336 |
217,604 |
85,456 |
203,730 |
11,317 |
45,143 |
23 |
1,416 |
20,315 |
2,373,490 |
| Q2 2022 |
22,812 |
101,644 |
235,459 |
33,641 |
18,351 |
347,865 |
431,257 |
107,796 |
141,452 |
73,918 |
71,940 |
24,677 |
84,006 |
189,804 |
201,819 |
96,668 |
201,222 |
10,666 |
41,985 |
7 |
594 |
5,370 |
2,442,953 |
| Q3 2022 |
NA |
NA |
NA |
NA |
NA |
NA |
NA |
NA |
NA |
NA |
NA |
NA |
NA |
NA |
NA |
NA |
NA |
NA |
NA |
NA |
NA |
NA |
NA |
| Q4 2022 |
25,528 |
105,217 |
255,544 |
33,170 |
20,399 |
369,532 |
420,283 |
119,572 |
150,110 |
76,714 |
75,001 |
22,925 |
105,783 |
210,350 |
205,996 |
104,945 |
213,943 |
12,898 |
41,853 |
6 |
616 |
11,030 |
2,581,415 |
| Q1 2023 |
26,194 |
107,031 |
276,313 |
32,695 |
21,415 |
368,016 |
424,734 |
124,173 |
151,043 |
75,783 |
75,752 |
23,438 |
113,405 |
205,473 |
209,334 |
106,346 |
218,978 |
13,245 |
41,170 |
7 |
606 |
16,037 |
2,631,188 |
| Q2 2023 |
23,744 |
110,356 |
295,968 |
32,120 |
21,876 |
365,366 |
418,320 |
127,304 |
149,910 |
72,282 |
76,323 |
22,853 |
115,304 |
198,553 |
213,359 |
97,894 |
215,787 |
13,146 |
41,818 |
8 |
605 |
18,308 |
2,631,204 |
| Q3 2023 |
19,576 |
111,606 |
324,340 |
31,581 |
25,171 |
380,329 |
413,349 |
130,760 |
149,285 |
61,123 |
76,772 |
22,207 |
118,852 |
191,886 |
221,569 |
110,781 |
222,718 |
13,246 |
41,982 |
12 |
615 |
29,037 |
2,696,797 |
| Q4 2023 |
20,737 |
114,264 |
344,800 |
31,694 |
26,976 |
383,785 |
411,501 |
132,670 |
147,425 |
59,389 |
78,582 |
21,656 |
122,074 |
191,894 |
228,276 |
111,806 |
225,779 |
13,560 |
41,824 |
15 |
275 |
29,448 |
2,738,430 |
| Q1 2024 |
20,800 |
115,960 |
358,716 |
31,494 |
22,660 |
397,613 |
405,746 |
137,440 |
143,828 |
62,968 |
79,611 |
21,685 |
124,267 |
191,069 |
232,997 |
111,648 |
227,989 |
13,744 |
41,983 |
14 |
278 |
28,175 |
2,770,685 |
| Q2 2024 |
24,294 |
118,180 |
370,106 |
33,648 |
34,838 |
400,320 |
396,519 |
137,391 |
141,094 |
63,220 |
80,071 |
21,424 |
125,817 |
184,883 |
224,681 |
99,197 |
224,253 |
13,785 |
42,518 |
18 |
284 |
35,879 |
2,772,420 |
| Q3 2024 |
23,941 |
119,694 |
379,981 |
33,513 |
35,760 |
410,273 |
391,102 |
141,228 |
137,053 |
63,984 |
81,715 |
21,146 |
131,526 |
186,654 |
232,226 |
114,745 |
232,126 |
14,085 |
42,371 |
22 |
284 |
36,810 |
2,830,239 |
| Q4 2024 |
30,187 |
123,583 |
404,875 |
34,493 |
36,671 |
426,068 |
395,093 |
148,261 |
138,371 |
65,718 |
82,952 |
21,350 |
133,975 |
192,456 |
237,908 |
113,818 |
237,170 |
15,267 |
43,732 |
43 |
278 |
11,503 |
2,893,772 |
| Q1 2025 |
32,364 |
122,979 |
408,164 |
34,625 |
36,645 |
434,440 |
392,019 |
151,111 |
137,153 |
67,436 |
84,296 |
21,932 |
135,926 |
191,971 |
243,205 |
112,356 |
238,680 |
15,452 |
43,903 |
50 |
277 |
10,916 |
2,915,900 |
| Q2 2025 |
32,575 |
122,700 |
411,849 |
34,814 |
36,716 |
449,158 |
394,775 |
155,754 |
139,514 |
69,163 |
85,340 |
22,194 |
137,539 |
196,019 |
244,656 |
104,162 |
237,255 |
15,933 |
45,277 |
53 |
283 |
23,247 |
2,958,976 |
| Q3 2025 |
20,824 |
115,280 |
347,264 |
33,325 |
22,395 |
419,541 |
406,914 |
165,341 |
141,903 |
99,766 |
88,018 |
29,011 |
137,664 |
246,605 |
241,538 |
140,402 |
256,974 |
18,194 |
44,348 |
52 |
282 |
28,477 |
3,004,118 |
Source: Register-based Labour Market Statistics, General Authority for Statistics (GAStat)
1. Data collection methodology
LFS were first conducted in 2001 and became bi-annual after 2006. Data were collected through nationally
representative household sample surveys, which sampling was based on most recent censuses.
Since 2016, Labour Force Surveys have been conducted and published on a quarterly basis, based on a
household telephone survey conducted by GAStat. Employment data extracted from administrative records
were also introduced as a complement to the results of Labour Force Surveys in Labour Market Statistics’
publications, starting on Q1 2017.
The present data is taken from administrative records.
Population of reference: workers subject to the rule of the General Organization of Social Insurance (GOSI):
a. contributors on the job who are subject to social insurance laws and regulations in the private and government sector;
b. new contributors, and contributors who terminated their contribution to social insurance during the quarter.
Figures of workers in Labor Market statistics which were derived from administrative records do not include the following categories:
1-Workers in the military and security sectors
2- Workers who are not registered in the civil service, social insurance (GOSI) and domestic workers’ records, which include:
– Saudis working for their own businesses and are not subjected to the labor regulations, also, not registered in social insurance,
such as those who work in delivery through electronic apps
– Saudi employers who work in establishments and not registered in the social insurance
– Non-Saudi staff working in foreign international, political or military missions
3- Non-Saudi employees who come to the Kingdom for work that normally takes less than three months to be completed.
Definitions and categories used by GAStat in Labour Markets Statistics (employment; unemployment;
occupation and activity sectors, etc.) are based on international standards:
For LFS methodology and definitions, see metadata section in report, and:
https://database.stats.gov.sa/Methodologies/En_Documents/03_Labor%20Market%20Bulletin%20Methodology,%20Fourth%20Quarter%202020%20_%20General%20Authority%20for%20Statistics.pdf
https://database.stats.gov.sa/Methodologies/En_Documents/03_Labor%20Market%20Bulletin%20Methodology,%20Fourth%20Quarter%202020%20_%20General%20Authority%20for%20Statistics.pdf
Classification of economic activities: Saudi Classification of Economic Activities, based on the International Standard Industrial Classification of all economic activities (ISIC4)
https://www.stats.gov.sa/en/classifications
2. Institution which provides data
General Authority for Statistics (GAStat)
3. Data availability
Since 2021, GAStat has been publishing separately the employment data taken from administrative records,
and unemployment/inactivity data as well as general indicators, calculated from the results of the field
interviews conducted by GAStat (Labour Force Survey).
The time-series was built using the quarterly Register-based Labour Market Statistics for given quarters
2023-2025: available at:
https://www.stats.gov.sa/en/statistics-tabs/-/categories/417515?tab=436312&category=417515
Before 2023: available in the “archived data”:
https://www.stats.gov.sa/en/statistics?index=1317550
“social statistics”, and “labour force”
https://www.stats.gov.sa/en/statistics-tabs?tab=436312&category=1333429
Last date of access: 26 January 2026.
Keywords: Employment, Saudi Arabia, National & Foreign Labour
GLMM and GRC cannot guarantee that the link to access the source will not change;
that the information will not be removed from the website it was obtained from;
that no geo-blockages will be imposed; or that the information will not be available for any another reason.
|
Agriculture, forestry and fishing |
Mining and quarrying |
Manufacturing |
Electricity, gas, steam and air conditioning supply |
Water supply; sewerage, waste management and remediation activities |
Construction |
Wholesale and retail trade; repair of motor vehicles and motorcycles |
Transportation and storage |
Accommodation and food service activities |
Information and communication |
Financial and insurance activities |
Real estate activities |
Professional, scientific and technical activities |
Administrative and support service activities |
Public administration and defence; compulsory social security |
Education |
Human health and social work activities |
Arts, entertainment and recreation |
Other service activities |
Activities of households as employer; Activities of extraterritorial organizations and bodies; undifferentiated goods- and services-producing activities of households for own use |
Activities of extraterritorial organizations and bodies |
Not specified |
Total |
| Q1 2021 |
89,866 |
64,007 |
626,216 |
37,403 |
18,487 |
1,803,570 |
1,426,482 |
192,230 |
308,053 |
38,608 |
12,839 |
25,182 |
88,617 |
883,841 |
70,341 |
62,365 |
229,046 |
18,432 |
174,281 |
110 |
404 |
131,412 |
6,301,792 |
| Q2 2021 |
87,361 |
62,227 |
613,277 |
37,410 |
18,306 |
1,742,895 |
1,382,250 |
193,485 |
306,689 |
37,643 |
12,611 |
24,553 |
87,325 |
844,057 |
78,223 |
58,392 |
234,130 |
18,837 |
167,529 |
114 |
420 |
117,098 |
6,124,832 |
| Q3 2021 |
85,806 |
61,459 |
611,982 |
36,521 |
17,885 |
1,705,712 |
1,353,746 |
193,817 |
310,997 |
38,492 |
12,549 |
24,763 |
86,903 |
807,982 |
79,515 |
60,562 |
235,835 |
19,029 |
164,890 |
119 |
419 |
114,094 |
6,023,077 |
| Q4 2021 |
90,183 |
62,230 |
627,008 |
36,533 |
18,283 |
1,755,671 |
1,330,197 |
205,458 |
439,731 |
38,056 |
12,895 |
24,420 |
88,300 |
837,078 |
83,754 |
60,845 |
251,008 |
19,557 |
166,359 |
196 |
434 |
142,300 |
6,290,496 |
| Q1 2022 |
114,724 |
58,220 |
657,697 |
37,377 |
21,585 |
1,834,116 |
1,338,295 |
233,721 |
521,987 |
38,163 |
13,361 |
24,066 |
94,998 |
861,342 |
79,588 |
60,978 |
203,369 |
20,350 |
199,012 |
223 |
438 |
309,379 |
6,722,989 |
| Q2 2022 |
158,234 |
40,509 |
708,428 |
6,516 |
69,590 |
2,105,858 |
1,288,581 |
298,939 |
511,858 |
49,573 |
16,840 |
41,504 |
112,818 |
951,563 |
62,956 |
75,140 |
212,023 |
18,622 |
215,299 |
99 |
250 |
153,469 |
7,098,669 |
| Q3 2022 |
NA |
NA |
NA |
NA |
NA |
NA |
NA |
NA |
NA |
NA |
NA |
NA |
NA |
NA |
NA |
NA |
NA |
NA |
NA |
NA |
NA |
NA |
NA |
| Q4 2022 |
329,267 |
36,599 |
778,389 |
6,220 |
86,157 |
2,090,698 |
1,205,767 |
319,993 |
525,044 |
46,617 |
16,290 |
31,702 |
107,904 |
964,928 |
60,471 |
75,749 |
226,453 |
19,440 |
196,109 |
88 |
243 |
217,495 |
7,341,623 |
| Q1 2023 |
495,115 |
39,424 |
810,469 |
6,316 |
100,914 |
2,172,686 |
1,228,816 |
335,369 |
543,139 |
47,524 |
16,522 |
32,236 |
111,935 |
999,359 |
58,374 |
78,429 |
233,374 |
20,264 |
198,215 |
78 |
232 |
279,057 |
7,807,847 |
| Q2 2023 |
516,859 |
47,402 |
827,488 |
6,378 |
107,210 |
2,176,449 |
1,210,761 |
339,805 |
536,229 |
46,256 |
16,287 |
31,885 |
112,984 |
969,999 |
58,004 |
79,296 |
227,766 |
19,602 |
194,097 |
81 |
225 |
338,819 |
7,863,882 |
| Q3 2023 |
120,078 |
49,174 |
860,211 |
6,837 |
126,842 |
2,227,945 |
1,208,148 |
363,482 |
537,183 |
45,484 |
16,542 |
31,464 |
115,985 |
938,446 |
56,932 |
83,810 |
225,641 |
18,996 |
192,496 |
76 |
218 |
890,201 |
8,116,191 |
| Q4 2023 |
121,665 |
51,940 |
866,598 |
7,623 |
130,018 |
2,233,402 |
1,205,372 |
370,573 |
526,551 |
45,000 |
16,602 |
31,152 |
120,029 |
919,046 |
56,553 |
85,642 |
222,443 |
18,509 |
188,702 |
71 |
198 |
886,614 |
8,104,303 |
| Q1 2024 |
143,492 |
57,965 |
939,706 |
8,800 |
115,375 |
2,418,405 |
1,241,277 |
412,744 |
537,539 |
47,827 |
16,867 |
32,704 |
126,321 |
965,916 |
56,437 |
90,571 |
225,911 |
18,828 |
200,990 |
69 |
209 |
964,794 |
8,622,747 |
| Q2 2024 |
179,181 |
68,646 |
971,814 |
12,503 |
133,381 |
2,494,244 |
1,252,451 |
429,590 |
538,446 |
48,515 |
16,845 |
32,557 |
129,204 |
985,419 |
57,447 |
89,292 |
224,659 |
18,886 |
208,368 |
59 |
213 |
1,042,623 |
8,934,343 |
| Q3 2024 |
180,956 |
77,780 |
1,006,783 |
13,161 |
137,368 |
2,562,464 |
1,253,248 |
451,537 |
536,782 |
49,135 |
16,892 |
32,157 |
132,005 |
1,009,595 |
57,125 |
92,949 |
225,189 |
19,081 |
211,165 |
68 |
211 |
1,112,768 |
9,178,419 |
| Q4 2024 |
260,485 |
96,875 |
1,110,221 |
14,607 |
143,692 |
2,820,589 |
1,336,936 |
607,845 |
569,825 |
54,671 |
17,163 |
34,296 |
139,253 |
1,044,940 |
57,346 |
180,909 |
226,024 |
25,694 |
229,426 |
59 |
118 |
573,739 |
9,544,713 |
| Q1 2025 |
309,326 |
95,109 |
1,168,267 |
15,237 |
142,836 |
2,962,223 |
1,361,689 |
629,132 |
576,931 |
54,920 |
17,204 |
34,771 |
141,635 |
1,075,106 |
57,328 |
179,883 |
227,819 |
26,237 |
237,190 |
59 |
116 |
569,869 |
9,882,887 |
| Q2 2025 |
312,296 |
94,930 |
1,178,316 |
15,435 |
142,277 |
2,994,917 |
1,353,500 |
627,829 |
569,289 |
55,194 |
17,073 |
34,942 |
141,894 |
1,072,165 |
59,734 |
174,948 |
226,823 |
26,014 |
234,200 |
60 |
116 |
580,687 |
9,912,639 |
| Q3 2025 |
232,356 |
88,622 |
1,135,188 |
9,243 |
74,058 |
2,992,847 |
1,420,291 |
662,578 |
588,389 |
76,853 |
18,709 |
46,876 |
153,866 |
1,174,128 |
59,291 |
181,498 |
238,452 |
29,746 |
261,637 |
63 |
107 |
777,853 |
10,222,651 |
Source: Register-based Labour Market Statistics, General Authority for Statistics (GAStat)
1. Data collection methodology
LFS were first conducted in 2001 and became bi-annual after 2006. Data were collected through nationally
representative household sample surveys, which sampling was based on most recent censuses.
Since 2016, Labour Force Surveys have been conducted and published on a quarterly basis, based on a
household telephone survey conducted by GAStat. Employment data extracted from administrative records
were also introduced as a complement to the results of Labour Force Surveys in Labour Market Statistics’
publications, starting on Q1 2017.
The present data is taken from administrative records.
Population of reference: workers subject to the rule of the General Organization of Social Insurance (GOSI):
a. contributors on the job who are subject to social insurance laws and regulations in the private and government sector;
b. new contributors, and contributors who terminated their contribution to social insurance during the quarter.
1-Workers in the military and security sectors
2- Workers who are not registered in the civil service, social insurance (GOSI) and domestic workers’ records, which include:
– Saudis working for their own businesses and are not subjected to the labor regulations, also, not registered in social insurance,such as those who work in delivery through electronic apps
– Saudi employers who work in establishments and not registered in the social insurance
– Non-Saudi staff working in foreign international, political or military missions
3- Non-Saudi employees who come to the Kingdom for work that normally takes less than three months to be completed.
Definitions and categories used by GAStat in Labour Markets Statistics (employment; unemployment;
occupation and activity sectors, etc.) are based on international standards:
For LFS methodology and definitions, see metadata section in report, and:
https://database.stats.gov.sa/Methodologies/En_Documents/03_Labor%20Market%20Bulletin%20Methodology,%20Fourth%20Quarter%202020%20_%20General%20Authority%20for%20Statistics.pdf
https://database.stats.gov.sa/Methodologies/En_Documents/03_Labor%20Market%20Bulletin%20Methodology,%20Fourth%20Quarter%202020%20_%20General%20Authority%20for%20Statistics.pdf
Classification of economic activities: Saudi Classification of Economic Activities, based on the International Standard Industrial Classification of all economic activities (ISIC4)
https://www.stats.gov.sa/en/classifications
2. Institution which provides data
General Authority for Statistics (GAStat)
3. Data availability
Since 2021, GAStat has been publishing separately the employment data taken from administrative records,and unemployment/inactivity data as well as general indicators, calculated from the results of the field interviews conducted by GAStat (Labour Force Survey).
The time-series was built using the quarterly Register-based Labour Market Statistics for given quarters
2023-2025: available at:
https://www.stats.gov.sa/en/statistics-tabs/-/categories/417515?tab=436312&category=417515
Before 2023: available in the “archived data”:
https://www.stats.gov.sa/en/statistics?index=1317550
“social statistics”, and “labour force”
https://www.stats.gov.sa/en/statistics-tabs?tab=436312&category=1333429
Last date of access: 26 January 2026.
Keywords: Employment, Saudi Arabia, National & Foreign Labour
GLMM and GRC cannot guarantee that the link to access the source will not change;
that the information will not be removed from the website it was obtained from;
that no geo-blockages will be imposed; or that the information will not be available for any another reason.
|
Managers |
Professionals |
Technicians and associate professionals |
Clerical support workers |
Service and sales workers |
Skilled agricultural, forestry and fishery workers |
Craft and related trades workers |
Plant and machine operators, and assemblers |
Elementary occupations |
Other Occupations |
Not specified |
Total |
| Q1 2021 |
171,170 |
441,456 |
426,127 |
476,471 |
274,526 |
1,436 |
42,153 |
71,695 |
134,410 |
37,979 |
12,020 |
2,089,443 |
| Q2 2021 |
N.A. |
N.A. |
N.A. |
N.A. |
N.A. |
N.A. |
N.A. |
N.A. |
N.A. |
N.A. |
N.A. |
N.A. |
| Q3 2021 |
174,655 |
476,951 |
426,307 |
469,195 |
294,921 |
1,386 |
42,992 |
73,584 |
134,833 |
38,417 |
2,067 |
2,135,308 |
| Q4 2021 |
178,279 |
542,698 |
441,778 |
469,128 |
310,589 |
1,427 |
44,001 |
75,335 |
136,359 |
41,218 |
0 |
2,240,812 |
| Q1 2022 |
160,094 |
467,095 |
365,196 |
374,126 |
265,893 |
1,047 |
33,087 |
60,527 |
102,343 |
544,082 |
0 |
2,373,490 |
| Q2 2022 |
171,786 |
487,938 |
372,246 |
396,166 |
272,745 |
1,024 |
38,163 |
59,311 |
97,466 |
546,108 |
0 |
2,442,953 |
| Q3 2022 |
N.A. |
N.A. |
N.A. |
N.A. |
N.A. |
N.A. |
N.A. |
N.A. |
N.A. |
N.A. |
N.A. |
N.A. |
| Q4 2022 |
224,625 |
699,468 |
419,946 |
532,094 |
339,027 |
1,650 |
47,953 |
78,179 |
136,319 |
102,154 |
0 |
2,581,415 |
| Q1 2023 |
229,566 |
724,064 |
432,897 |
535,763 |
342,902 |
1,592 |
48,172 |
78,484 |
142,487 |
95,261 |
0 |
2,631,188 |
| Q2 2023 |
226,320 |
734,689 |
438,509 |
530,661 |
339,689 |
1,597 |
48,324 |
78,613 |
139,752 |
93,050 |
0 |
2,631,204 |
| Q3 2023 |
232,999 |
788,396 |
452,029 |
531,559 |
348,242 |
1,598 |
48,975 |
78,451 |
124,377 |
90,171 |
0 |
2,696,797 |
| Q4 2023 |
238,405 |
811,369 |
463,192 |
539,406 |
347,917 |
1,606 |
50,418 |
79,375 |
121,991 |
84,751 |
0 |
2,738,430 |
| Q1 2024 |
242,139 |
836,756 |
470,379 |
541,860 |
347,906 |
1,581 |
51,147 |
79,147 |
119,089 |
80,681 |
0 |
2,770,685 |
| Q2 2024 |
244,929 |
823,212 |
517,519 |
559,927 |
339,705 |
1,575 |
51,346 |
70,105 |
125,805 |
38,297 |
0 |
2,772,420 |
| Q3 2024 |
247,023 |
876,449 |
522,529 |
557,755 |
342,202 |
1,721 |
50,907 |
70,197 |
123,272 |
38,184 |
0 |
2,830,239 |
| Q4 2024 |
253,229 |
911,583 |
537,169 |
564,531 |
343,289 |
1,726 |
52,072 |
71,141 |
121,052 |
37,980 |
0 |
2,893,772 |
| Q1 2025 |
255,228 |
931,328 |
540,022 |
565,995 |
342,245 |
1,707 |
54,038 |
71,040 |
116,385 |
37,912 |
0 |
2,915,900 |
| Q2 2025 |
266,901 |
943,372 |
547,821 |
578,814 |
340,672 |
1,719 |
54,867 |
71,715 |
115,262 |
37,833 |
0 |
2,958,976 |
| Q3 2025 |
262,220 |
985,069 |
555,146 |
574,599 |
345,285 |
1,742 |
57,152 |
71,412 |
113,670 |
37,823 |
0 |
3,004,118 |
Source: Register-based Labour Market Statistics, General Authority for Statistics (GAStat)
1. Data collection methodology
LFS were first conducted in 2001 and became bi-annual after 2006. Data were collected through nationally
representative household sample surveys, which sampling was based on most recent censuses.
Since 2016, Labour Force Surveys have been conducted and published on a quarterly basis, based on a
household telephone survey conducted by GAStat. Employment data extracted from administrative records
were also introduced as a complement to the results of Labour Force Surveys in Labour Market Statistics’
publications, starting on Q1 2017.
The present data is taken from administrative records.
Population of reference: workers subject to the rule of the General Organization of Social Insurance (GOSI):
a. contributors on the job who are subject to social insurance laws and regulations in the private and government sector;
b. new contributors, and contributors who terminated their contribution to social insurance during the quarter.
Figures of workers in Labor Market statistics which were derived from administrative records do not include the following category:
1-Workers in the military and security sectors
2- Workers who are not registered in the civil service, social insurance (GOSI) and domestic workers’ records, which include:
– Saudis working for their own businesses and are not subjected to the labor regulations, also, not registered in social insurance,
such as those who work in delivery through electronic apps
– Saudi employers who work in establishments and not registered in the social insurance
– Non-Saudi staff working in foreign international, political or military missions
3- Non-Saudi employees who come to the Kingdom for work that normally takes less than three months to be completed.
Definitions and categories used by GAStat in Labour Markets Statistics (employment; unemployment;
occupation and activity sectors, etc.) are based on international standards:
For LFS methodology and definitions, see metadata section in report, and:
https://database.stats.gov.sa/Methodologies/En_Documents/03_Labor%20Market%20Bulletin%20Methodology,%20Fourth%20Quarter%202020%20_%20General%20Authority%20for%20Statistics.pdf
https://database.stats.gov.sa/Methodologies/En_Documents/03_Labor%20Market%20Bulletin%20Methodology,%20Fourth%20Quarter%202020%20_%20General%20Authority%20for%20Statistics.pdf
Classification of occupations: Saudi classification of occupations, based on ISCO-08.
https://www.stats.gov.sa/en/classifications
This classification was adopted in Q1 2021.
2. Institution which provides data
General Authority for Statistics (GAStat)
3. Data availability
Since 2021, GAStat has been publishing separately the employment data taken from administrative records,
and unemployment/inactivity data as well as general indicators, calculated from the results of the field
interviews conducted by GAStat (Labour Force Survey).
The time-series was built using the quarterly Register-based Labour Market Statistics for given quarters
2023-2025: available at:
https://www.stats.gov.sa/en/statistics-tabs/-/categories/417515?tab=436312&category=417515
Before 2023: available in the “archived data”:
https://www.stats.gov.sa/en/statistics?index=1317550
“social statistics”, and “labour force”
https://www.stats.gov.sa/en/statistics-tabs?tab=436312&category=1333429
Last date of access: 26 January 2026.
Keywords: Employment, Female Employment, Saudi Arabia, National & Foreign Labour, Highly Skilled Labour, Low-Skilled Labour
GLMM and GRC cannot guarantee that the link to access the source will not change;
that the information will not be removed from the website it was obtained from;
that no geo-blockages will be imposed; or that the information will not be available for any another reason.
|
Managers |
Professionals |
Technicians and associate professionals |
Clerical support workers |
Service and sales workers |
Skilled agricultural, forestry and fishery workers |
Craft and related trades workers |
Plant and machine operators, and assemblers |
Elementary occupations |
Other Occupations |
Not specified |
Total |
| Q1 2021 |
59,593 |
411,122 |
546,134 |
53,384 |
291,042 |
39,023 |
1,003,685 |
699,046 |
3,178,852 |
998 |
18,913 |
6,301,792 |
| Q2 2021 |
N.A. |
N.A. |
N.A. |
N.A. |
N.A. |
N.A. |
N.A. |
N.A. |
N.A. |
N.A. |
N.A. |
N.A. |
| Q3 2021 |
58,084 |
414,710 |
513,198 |
49,460 |
268,399 |
35,973 |
893,833 |
644,503 |
3,018,243 |
933 |
125,741 |
6,023,077 |
| Q4 2021 |
59,943 |
430,871 |
519,965 |
48,845 |
279,740 |
42,967 |
905,384 |
685,202 |
3,305,055 |
12,524 |
0 |
6,290,496 |
| Q1 2022 |
56,578 |
427,052 |
468,542 |
43,931 |
288,338 |
40,388 |
832,316 |
644,041 |
3,575,105 |
346,698 |
0 |
6,722,989 |
| Q2 2022 |
60,605 |
443,652 |
465,679 |
43,134 |
358,485 |
23,923 |
866,260 |
679,059 |
3,521,264 |
636,608 |
0 |
7,098,669 |
| Q3 2022 |
N.A. |
N.A. |
N.A. |
N.A. |
N.A. |
N.A. |
N.A. |
N.A. |
N.A. |
N.A. |
N.A. |
N.A. |
| Q4 2022 |
72,390 |
476,672 |
466,276 |
41,084 |
377,223 |
24,655 |
925,634 |
736,219 |
4,175,442 |
46,028 |
0 |
7,341,623 |
| Q1 2023 |
86,267 |
637,863 |
527,690 |
49,311 |
477,037 |
32,113 |
1,109,393 |
951,124 |
3,879,858 |
57,191 |
0 |
7,807,847 |
| Q2 2023 |
88,204 |
636,038 |
524,435 |
48,764 |
481,255 |
30,941 |
1,112,592 |
960,110 |
3,926,310 |
55,233 |
0 |
7,863,882 |
| Q3 2023 |
97,626 |
683,932 |
525,704 |
47,423 |
513,460 |
29,828 |
1,227,008 |
992,940 |
3,951,596 |
46,674 |
0 |
8,116,191 |
| Q4 2023 |
101,704 |
695,349 |
520,995 |
48,307 |
519,819 |
29,209 |
1,219,812 |
997,973 |
3,928,787 |
42,348 |
0 |
8,104,303 |
| Q1 2024 |
112,483 |
728,790 |
537,090 |
48,906 |
554,999 |
26,061 |
1,249,368 |
1,077,856 |
4,248,284 |
38,910 |
0 |
8,622,747 |
| Q2 2024 |
117,229 |
747,254 |
549,211 |
50,184 |
571,991 |
32,613 |
1,255,352 |
1,119,151 |
4,454,259 |
37,099 |
0 |
8,934,343 |
| Q3 2024 |
122,788 |
768,421 |
556,135 |
51,172 |
583,407 |
33,598 |
1,245,444 |
1,158,355 |
4,625,076 |
34,023 |
0 |
9,178,419 |
| Q4 2024 |
128,916 |
791,859 |
585,931 |
51,311 |
597,509 |
33,679 |
1,246,231 |
1,200,514 |
4,897,848 |
10,915 |
0 |
9,544,713 |
| Q1 2025 |
133,567 |
807,823 |
590,778 |
52,580 |
611,852 |
33,429 |
1,250,151 |
1,233,514 |
5,158,320 |
10,873 |
0 |
9,882,887 |
| Q2 2025 |
134,968 |
807,798 |
583,864 |
54,444 |
606,518 |
29,751 |
1,229,445 |
1,230,482 |
5,224,867 |
10,502 |
0 |
9,912,639 |
| Q3 2025 |
141,302 |
843,502 |
587,159 |
56,012 |
625,818 |
21,229 |
1,227,098 |
1,262,485 |
5,450,861 |
7,185 |
0 |
10,222,651 |
Source: Register-based Labour Market Statistics, General Authority for Statistics (GAStat)
1. Data collection methodology
LFS were first conducted in 2001 and became bi-annual after 2006. Data were collected through nationally
representative household sample surveys, which sampling was based on most recent censuses.
Since 2016, Labour Force Surveys have been conducted and published on a quarterly basis, based on a
household telephone survey conducted by GAStat. Employment data extracted from administrative records
were also introduced as a complement to the results of Labour Force Surveys in Labour Market Statistics’
publications, starting on Q1 2017.
The present data is taken from administrative records.
Population of reference: workers subject to the rule of the General Organization of Social Insurance (GOSI):
a. contributors on the job who are subject to social insurance laws and regulations in the private and government sector;
b. new contributors, and contributors who terminated their contribution to social insurance during the quarter.
Figures of workers in Labor Market statistics which were derived from administrative records do not include the following category:
1-Workers in the military and security sectors
2- Workers who are not registered in the civil service, social insurance (GOSI) and domestic workers’ records, which include:
– Saudis working for their own businesses and are not subjected to the labor regulations, also, not registered in social insurance,
such as those who work in delivery through electronic apps
– Saudi employers who work in establishments and not registered in the social insurance
– Non-Saudi staff working in foreign international, political or military missions
3- Non-Saudi employees who come to the Kingdom for work that normally takes less than three months to be completed.
Definitions and categories used by GAStat in Labour Markets Statistics (employment; unemployment;
occupation and activity sectors, etc.) are based on international standards:
For LFS methodology and definitions, see metadata section in report, and:
https://database.stats.gov.sa/Methodologies/En_Documents/03_Labor%20Market%20Bulletin%20Methodology,%20Fourth%20Quarter%202020%20_%20General%20Authority%20for%20Statistics.pdf
https://database.stats.gov.sa/Methodologies/En_Documents/03_Labor%20Market%20Bulletin%20Methodology,%20Fourth%20Quarter%202020%20_%20General%20Authority%20for%20Statistics.pdf
Classification of occupations: Saudi classification of occupations, based on ISCO-08.
https://www.stats.gov.sa/en/classifications
This classification was adopted in Q1 2021.
2. Institution which provides data
General Authority for Statistics (GAStat)
3. Data availability
Since 2021, GAStat has been publishing separately the employment data taken from administrative records,
and unemployment/inactivity data as well as general indicators, calculated from the results of the field
interviews conducted by GAStat (Labour Force Survey).
The time-series was built using the quarterly Register-based Labour Market Statistics for given quarters
2023-2025: available at:
https://www.stats.gov.sa/en/statistics-tabs/-/categories/417515?tab=436312&category=417515
Before 2023: available in the “archived data”:
https://www.stats.gov.sa/en/statistics?index=1317550
“social statistics”, and “labour force”
https://www.stats.gov.sa/en/statistics-tabs?tab=436312&category=1333429
Last date of access: 26 January 2026.
Keywords: Employment, Female Employment, Saudi Arabia, National & Foreign Labour, Highly Skilled Labour, Low-Skilled Labour
GLMM and GRC cannot guarantee that the link to access the source will not change;
that the information will not be removed from the website it was obtained from;
that no geo-blockages will be imposed; or that the information will not be available for any another reason.
|
Managers |
Professionals |
Technicians and associate professionals |
Clerical support workers |
Service and sales workers |
Skilled agricultural, forestry and fishery workers |
Craft and related trades workers |
Plant and machine operators, and assemblers |
Elementary occupations |
Other Occupations |
Not specified |
Total |
| Q1 2021 |
230,763 |
852,578 |
972,261 |
529,855 |
565,568 |
40,459 |
1,045,838 |
770,741 |
3,313,262 |
38,977 |
30,933 |
8,391,235 |
| Q2 2021 |
N.A. |
N.A. |
N.A. |
N.A. |
N.A. |
N.A. |
N.A. |
N.A. |
N.A. |
N.A. |
N.A. |
N.A. |
| Q3 2021 |
232,739 |
891,661 |
939,505 |
518,655 |
563,320 |
37,359 |
936,825 |
718,087 |
3,153,076 |
39,350 |
127,808 |
8,158,385 |
| Q4 2021 |
238,222 |
973,569 |
961,743 |
517,973 |
590,329 |
44,394 |
949,385 |
760,537 |
3,441,414 |
53,742 |
0 |
8,531,308 |
| Q1 2022 |
216,672 |
894,147 |
833,738 |
418,057 |
554,231 |
41,435 |
865,403 |
704,568 |
3,677,448 |
890,780 |
0 |
9,096,479 |
| Q2 2022 |
232,391 |
931,590 |
837,925 |
439,300 |
631,230 |
24,947 |
904,423 |
738,370 |
3,618,730 |
1,182,716 |
0 |
9,541,622 |
| Q3 2022 |
N.A. |
N.A. |
N.A. |
N.A. |
N.A. |
N.A. |
N.A. |
N.A. |
N.A. |
N.A. |
N.A. |
N.A. |
| Q4 2022 |
297,015 |
1,176,140 |
886,222 |
573,178 |
716,250 |
26,305 |
973,587 |
814,398 |
4,311,761 |
148,182 |
0 |
9,923,038 |
| Q1 2023 |
315,833 |
1,361,927 |
960,587 |
585,074 |
819,939 |
33,705 |
1,157,565 |
1,029,608 |
4,022,345 |
152,452 |
0 |
10,439,035 |
| Q2 2023 |
314,524 |
1,370,727 |
962,944 |
579,425 |
820,944 |
32,538 |
1,160,916 |
1,038,723 |
4,066,062 |
148,283 |
0 |
10,495,086 |
| Q3 2023 |
330,625 |
1,472,328 |
977,733 |
578,982 |
861,702 |
31,426 |
1,275,983 |
1,071,391 |
4,075,973 |
136,845 |
0 |
10,812,988 |
| Q4 2023 |
340,109 |
1,506,718 |
984,187 |
587,713 |
867,736 |
30,815 |
1,270,230 |
1,077,348 |
4,050,778 |
127,099 |
0 |
10,842,733 |
| Q1 2024 |
354,622 |
1,565,546 |
1,007,469 |
590,766 |
902,905 |
27,642 |
1,300,515 |
1,157,003 |
4,367,373 |
119,591 |
0 |
11,393,432 |
| Q2 2024 |
362,158 |
1,570,466 |
1,066,730 |
610,111 |
911,696 |
34,188 |
1,306,698 |
1,189,256 |
4,580,064 |
75,396 |
0 |
11,706,763 |
| Q3 2024 |
369,811 |
1,644,870 |
1,078,664 |
608,927 |
925,609 |
35,319 |
1,296,351 |
1,228,552 |
4,748,348 |
72,207 |
0 |
12,008,658 |
| Q4 2024 |
382,145 |
1,703,442 |
1,123,100 |
615,842 |
940,798 |
35,405 |
1,298,303 |
1,271,655 |
5,018,900 |
48,895 |
0 |
12,438,485 |
| Q1 2025 |
388,795 |
1,739,151 |
1,130,800 |
618,575 |
954,097 |
35,136 |
1,304,189 |
1,304,554 |
5,274,705 |
48,785 |
0 |
12,798,787 |
| Q2 2025 |
401,869 |
1,751,170 |
1,131,685 |
633,258 |
947,190 |
31,470 |
1,284,312 |
1,302,197 |
5,340,129 |
48,335 |
0 |
12,871,615 |
| Q3 2025 |
403,522 |
1,828,571 |
1,142,305 |
630,611 |
971,103 |
22,971 |
1,284,250 |
1,333,897 |
5,564,531 |
45,008 |
0 |
13,226,769 |
Source: Register-based Labour Market Statistics, General Authority for Statistics (GAStat)
1. Data collection methodology
LFS were first conducted in 2001 and became bi-annual after 2006. Data were collected through nationally
representative household sample surveys, which sampling was based on most recent censuses.
Since 2016, Labour Force Surveys have been conducted and published on a quarterly basis, based on a
household telephone survey conducted by GAStat. Employment data extracted from administrative records
were also introduced as a complement to the results of Labour Force Surveys in Labour Market Statistics’
publications, starting on Q1 2017.
The present data is taken from administrative records.
Population of reference: workers subject to the rule of the General Organization of Social Insurance (GOSI):
a. contributors on the job who are subject to social insurance laws and regulations in the private and government sector;
b. new contributors, and contributors who terminated their contribution to social insurance during the quarter.
Figures of workers in Labor Market statistics which were derived from administrative records do not include the following category:
1-Workers in the military and security sectors
2- Workers who are not registered in the civil service, social insurance (GOSI) and domestic workers’ records, which include:
– Saudis working for their own businesses and are not subjected to the labor regulations, also, not registered in social insurance,
such as those who work in delivery through electronic apps
– Saudi employers who work in establishments and not registered in the social insurance
– Non-Saudi staff working in foreign international, political or military missions
3- Non-Saudi employees who come to the Kingdom for work that normally takes less than three months to be completed.
Definitions and categories used by GAStat in Labour Markets Statistics (employment; unemployment;
occupation and activity sectors, etc.) are based on international standards:
For LFS methodology and definitions, see metadata section in report, and:
https://database.stats.gov.sa/Methodologies/En_Documents/03_Labor%20Market%20Bulletin%20Methodology,%20Fourth%20Quarter%202020%20_%20General%20Authority%20for%20Statistics.pdf
https://database.stats.gov.sa/Methodologies/En_Documents/03_Labor%20Market%20Bulletin%20Methodology,%20Fourth%20Quarter%202020%20_%20General%20Authority%20for%20Statistics.pdf
Classification of occupations: Saudi classification of occupations, based on ISCO-08.
https://www.stats.gov.sa/en/classifications
This classification was adopted in Q1 2021.
2. Institution which provides data
General Authority for Statistics (GAStat)
3. Data availability
Since 2021, GAStat has been publishing separately the employment data taken from administrative records,
and unemployment/inactivity data as well as general indicators, calculated from the results of the field
interviews conducted by GAStat (Labour Force Survey).
The time-series was built using the quarterly Register-based Labour Market Statistics for given quarters
2023-2025: available at:
https://www.stats.gov.sa/en/statistics-tabs/-/categories/417515?tab=436312&category=417515
Before 2023: available in the “archived data”:
https://www.stats.gov.sa/en/statistics?index=1317550
“social statistics”, and “labour force”
https://www.stats.gov.sa/en/statistics-tabs?tab=436312&category=1333429
Last date of access: 26 January 2026.
Keywords: Employment, Female Employment, Saudi Arabia, National & Foreign Labour, Highly Skilled Labour, Low-Skilled Labour
GLMM and GRC cannot guarantee that the link to access the source will not change;
that the information will not be removed from the website it was obtained from;
that no geo-blockages will be imposed; or that the information will not be available for any another reason.
|
Saudis |
Non Saudis |
Total |
| Males |
Females |
Total |
Males |
Females |
Total |
Males |
Females |
Total |
| 2021 |
65.1 |
33.3 |
49.1 |
92.9 |
38.0 |
81.0 |
81.6 |
34.6 |
64.5 |
| 2022 |
66.3 |
35.1 |
50.7 |
93.1 |
32.7 |
80.6 |
82.7 |
34.4 |
65.6 |
| 2023 |
66.1 |
35.2 |
50.8 |
94.2 |
33.3 |
81.6 |
83.6 |
34.6 |
66.6 |
| 2024 |
66.4 |
35.9 |
51.2 |
93.4 |
28.3 |
80.0 |
83.6 |
33.5 |
66.3 |
Source: Labour Market Statistics, General Authority for Statistics (GAStat)
1. Data collection methodology and definitions used
Labour Force Surveys were first conducted in 2001 and became bi-annual after 2006. Data were collected through nationally representative household sample surveys, which sampling was based on most recent censuses.
Since 2016, Labour Force Surveys have been conducted and published on a quarterly basis, based onthe following sources:
1. Household telephone surveys conducted by GAStat.
2. Employment data extracted from administrative records, introduced as a complement to the results of Labour Force Surveys in Labour Market Statistics’ publications, starting on Q1 2017.
Types of data by source:
1. Household Telephone Surveys:
Estimates of labor force, characteristics of the unemployed and inactive
The survey provides estimates of the working-age populations (aged 15 years and above), inside and outside the labour force, the characteristics of the inactive and unemployed populations), and supplies the data to calculate key indicators of labour market such as the unemployment and the labour force participation rates.
2. Administrative records:
– Ministry of Human Resources and Social Development (MHRSD)
(formerly Ministry of Labour and Social Development):
Supplies data on:
Employees on the job Subject to the rules and regulations of the Civil Service
– General Organization of Social Insurance (GOSI):
Supplies data on:
a. contributors on the job who are subject to social insurance laws and regulations in the private and government sector;
b. new contributors, and contributors who terminated their contribution to social insurance during the quarter.
– National Information Center (NIC):
Supplies data on:
a. domestic workers.
The present data is based on estimates drawn from the results of the quarterly Labour Force Survey,
revised on the basis of the results of census 2022.
LFS results are published as rates only. Numerical estimates are unavailable.
Definitions:
Population in the labour force:
Individuals (15 years and above) who contribute or are ready to contribute to the production of
commodities and services during the reference period of the survey. The labour force includes the
employed and unemployed populations.
Population outside the labour force:
Individuals (15 years and above) who is not classified as part of the labour force because they do not
work, do not seek a job, are unable to work, or are not ready to work during the survey reference period.
For example: Students, housewives, retired persons who do not work, individuals unable or unwilling to
work, or who do not look for a job for other reasons.
Labour force participation rate = (total labour force ÷ total population of working age (aged 15 years and over)) x 100
As of July 2024, Labour Force Survey data from Q1 2021 to Q1 2024 were revised and backcasted, based on 2022 population census results.
Therefore, the present rates may differ from earlier estimates based on previous Labour Force Surveys’ sampling base.
Technical note on backcasting:
https://database.stats.gov.sa/Methodologies/En_Documents/40_Technical%20Note%20Population%20Back%20Casting.PDF
Definitions and categories used by GAStat in Labour Markets Statistics (employment; unemployment; occupation and activity sectors, etc.) are based on international standards:
For LFS methodology and definitions, see:
https://www.stats.gov.sa/en/w/lfs-1
https://www.stats.gov.sa/w/lfs-1
2. Institution which provides data
General Authority for Statistics (GAStat)
3. Data availability
Since 2021, GAStat has been publishing separately the employment data taken from administrative records,
and unemployment/inactivity data as well as general indicators, calculated from the results of the field
interviews conducted by GAStat (Labour Force Survey).
The present time-series was taken from the Labour Market Statistics- Q4, 2024 (Excel and PDF formats)
https://www.stats.gov.sa/en/statistics-tabs?tab=436312&category=417515
https://www.stats.gov.sa/statistics-tabs?tab=436312&category=417515
Quarterly Register-based Labour Market Statistics reports are accessible from:
https://www.stats.gov.sa/en/statistics?index=119025
https://www.stats.gov.sa/statistics?index=119025.
Date of access: 20 January 2026.
Keywords: Employment, Unemployment, Female Employment, Saudi Arabia, National & Foreign Labour
GLMM and GRC cannot guarantee that the link to access the source will not change;
that the information will not be removed from the website it was obtained from;
that no geo-blockages will be imposed; or that the information will not be available for any another reason.
|
Saudis |
Non Saudis |
Total |
| Males |
Females |
Total |
Males |
Females |
Total |
Males |
Females |
Total |
| 2021 Q1 |
64.8 |
31.9 |
48.3 |
93.6 |
38.5 |
82.0 |
82.2 |
33.8 |
64.8 |
| 2021 Q2 |
65.0 |
32.1 |
48.5 |
92.8 |
38.5 |
81.0 |
81.4 |
33.9 |
64.1 |
| 2021 Q3 |
65.1 |
34.3 |
49.6 |
92.7 |
41.0 |
81.2 |
81.2 |
36.2 |
64.6 |
| 2021 Q4 |
65.6 |
34.7 |
50.1 |
92.6 |
34.0 |
79.8 |
81.5 |
34.5 |
64.4 |
| 2022 Q1 |
65.1 |
33.3 |
49.1 |
91.6 |
33.4 |
79.3 |
81.0 |
33.3 |
63.9 |
| 2022 Q2 |
66.5 |
35.1 |
50.8 |
92.9 |
32.5 |
80.4 |
82.6 |
34.3 |
65.4 |
| 2022 Q3 |
66.3 |
36.5 |
51.4 |
93.9 |
32.8 |
81.1 |
83.2 |
35.4 |
66.3 |
| 2022 Q4 |
67.3 |
35.5 |
51.5 |
94.0 |
32.1 |
81.3 |
83.8 |
34.5 |
66.5 |
| 2023 Q1 |
67.1 |
35.5 |
51.4 |
93.9 |
34.8 |
81.9 |
83.8 |
35.3 |
66.9 |
| 2023 Q2 |
66.3 |
34.8 |
50.7 |
93.5 |
31.9 |
80.8 |
83.2 |
33.9 |
66.1 |
| 2023 Q3 |
65.7 |
35.4 |
50.8 |
93.8 |
32.6 |
81.2 |
83.2 |
34.6 |
66.4 |
| 2023 Q4 |
65.4 |
35.0 |
50.4 |
95.3 |
33.8 |
82.5 |
84.1 |
34.6 |
67.0 |
| 2024 Q1 |
66.4 |
35.8 |
51.4 |
93.3 |
28.3 |
79.6 |
83.2 |
33.4 |
66.0 |
| 2024 Q2 |
66.3 |
35.4 |
50.8 |
93.4 |
28.9 |
80.3 |
83.6 |
33.4 |
66.2 |
| 2024 Q3 |
66.9 |
36.2 |
51.5 |
93.6 |
27.9 |
80.2 |
84.0 |
33.6 |
66.6 |
| 2024 Q4 |
66.2 |
36.0 |
51.1 |
93.2 |
27.9 |
79.9 |
83.6 |
33.5 |
66.4 |
| 2025 Q1 |
66.4 |
36.3 |
51.3 |
94.6 |
36.7 |
82.7 |
84.7 |
36.5 |
68.2 |
| 2025 Q2 |
64.0 |
34.5 |
49.2 |
93.9 |
37.1 |
82.4 |
83.5 |
35.4 |
67.1 |
| 2025 Q3 |
64.3 |
33.7 |
49.0 |
94.0 |
35.1 |
82.1 |
83.8 |
34.2 |
66.9 |
Source: Labour Market Statistics, General Authority for Statistics (GAStat)
1. Data collection methodology and definitions used
Labour Force Surveys were first conducted in 2001 and became bi-annual after 2006. Data were collected through nationally representative household sample surveys, which sampling was based on most recent censuses.
Since 2016, Labour Force Surveys have been conducted and published on a quarterly basis, based onthe following sources:
1. Household telephone surveys conducted by GAStat.
2. Employment data extracted from administrative records, introduced as a complement to the results of
Labour Force Surveys in Labour Market Statistics’ publications, starting on Q1 2017.
Types of data by source:
1. Household Telephone Surveys:
Estimates of labor force, characteristics of the unemployed and inactive
The survey provides estimates of the working-age populations (aged 15 years and
above), inside and outside the labour force, the characteristics of the inactive and
unemployed populations), and supplies the data to calculate key indicators of labour market such as
the unemployment and the labour force participation rates.
2. Administrative records:
– Ministry of Human Resources and Social Development (MHRSD)
(formerly Ministry of Labour and Social Development):
Supplies data on:
Employees on the job Subject to the rules and regulations of the Civil Service
– General Organization of Social Insurance (GOSI):
Supplies data on:
a. contributors on the job who are subject to social insurance laws and regulations in the private
and government sector;
b. new contributors, and contributors who terminated their contribution to social insurance during the quarter.
– National Information Center (NIC):
Supplies data on:
a. domestic workers.
The present data is based on estimates drawn from the results of the quarterly Labour Force Survey,
revised on the basis of the results of census 2022.
LFS results are published as rates only. Numerical estimates are unavailable.
Definitions:
Population in the labour force:
Individuals (15 years and above) who contribute or are ready to contribute to the production of
commodities and services during the reference period of the survey. The labour force includes the
employed and unemployed populations.
Population outside the labour force:
Individuals (15 years and above) who is not classified as part of the labour force because they do not
work, do not seek a job, are unable to work, or are not ready to work during the survey reference period.
For example: Students, housewives, retired persons who do not work, individuals unable or unwilling to
work, or who do not look for a job for other reasons.
Labour force participation rate = (total labour force ÷ total population of working age (aged 15 years and over)) x 100
As of July 2024, Labour Force Survey data from Q1 2021 to Q1 2024 were revised and backcasted, based on 2022 population census results.
Therefore, the present rates may differ from earlier estimates based on previous Labour Force Surveys’ sampling base.
Technical note on backcasting:
https://database.stats.gov.sa/Methodologies/En_Documents/40_Technical%20Note%20Population%20Back%20Casting.PDF
Definitions and categories used by GAStat in Labour Markets Statistics (employment; unemployment;
occupation and activity sectors, etc.) are based on international standards:
For LFS methodology and definitions, see:
https://www.stats.gov.sa/en/w/lfs-1
https://www.stats.gov.sa/w/lfs-1
2. Institution which provides data
General Authority for Statistics (GAStat)
3. Data availability
Since 2021, GAStat has been publishing separately the employment data taken from administrative records,
and unemployment/inactivity data as well as general indicators, calculated from the results of the field
interviews conducted by GAStat (Labour Force Survey).
The present time-series was taken from the Labour Market Statistics- Q4, 2024 (Excel and PDF formats)
https://www.stats.gov.sa/en/statistics-tabs?tab=436312&category=417515
https://www.stats.gov.sa/statistics-tabs?tab=436312&category=417515
Quarterly Register-based Labour Market Statistics reports are accessible from:
https://www.stats.gov.sa/en/statistics?index=119025
https://www.stats.gov.sa/statistics?index=119025.
Date of access: 20 January 2026.
Keywords: Employment, Unemployment, Female Employment, Saudi Arabia, National & Foreign Labour
GLMM and GRC cannot guarantee that the link to access the source will not change;
that the information will not be removed from the website it was obtained from;
that no geo-blockages will be imposed; or that the information will not be available for any another reason.
|
|
Saudis |
Non-Saudis |
Total |
| Males |
Females |
Total |
Males |
Females |
Total |
Males |
Females |
Total |
| 2017 Q1 |
2,021,865 |
1,017,080 |
3,038,945 |
9,859,039 |
991,153 |
10,850,192 |
11,880,904 |
2,008,233 |
13,889,137 |
| 2017 Q2 |
2,029,786 |
1,022,663 |
3,052,449 |
9,777,916 |
1,010,793 |
10,788,709 |
11,807,702 |
2,033,456 |
13,841,158 |
| 2017 Q3 |
2,035,745 |
1,027,999 |
3,063,744 |
9,674,729 |
1,019,591 |
10,694,320 |
11,710,474 |
2,047,590 |
13,758,064 |
| 2017 Q4 |
2,080,601 |
1,083,245 |
3,163,846 |
9,442,163 |
975,132 |
10,417,295 |
11,522,764 |
2,058,377 |
13,581,141 |
| 2018 Q1 |
2,067,976 |
1,082,433 |
3,150,409 |
9,231,869 |
951,235 |
10,183,104 |
11,299,845 |
2,033,668 |
13,333,513 |
| 2018 Q2 |
2,053,189 |
1,072,154 |
3,125,343 |
8,927,862 |
964,861 |
9,892,723 |
10,981,051 |
2,037,015 |
13,018,066 |
| 2018 Q3 |
2,043,585 |
1,066,402 |
3,109,987 |
8,622,890 |
955,165 |
9,578,055 |
10,666,475 |
2,021,567 |
12,688,042 |
| 2018 Q4 |
2,040,742 |
1,070,457 |
3,111,199 |
8,356,943 |
1,072,476 |
9,429,419 |
10,397,685 |
2,142,933 |
12,540,618 |
| 2019 Q1 |
2,036,142 |
1,075,887 |
3,112,029 |
8,458,199 |
1,195,013 |
9,653,212 |
10,494,341 |
2,270,900 |
12,765,241 |
| 2019 Q2 |
2,027,964 |
1,062,284 |
3,090,248 |
8,529,419 |
1,237,365 |
9,766,784 |
10,557,383 |
2,299,649 |
12,857,032 |
| 2019 Q3 |
2,023,910 |
1,076,902 |
3,100,812 |
8,572,339 |
1,254,757 |
9,827,096 |
10,596,249 |
2,331,659 |
12,927,908 |
| 2019 Q4 |
2,054,858 |
1,115,414 |
3,170,272 |
8,792,516 |
1,428,187 |
10,220,703 |
10,847,374 |
2,543,601 |
13,390,975 |
| 2020 Q1 |
2,066,553 |
1,136,870 |
3,203,423 |
9,092,998 |
1,339,191 |
10,432,189 |
11,159,551 |
2,476,061 |
13,635,612 |
| 2020 Q2 |
2,055,767 |
1,115,655 |
3,171,422 |
9,101,286 |
1,357,746 |
10,459,032 |
11,157,053 |
2,473,401 |
13,630,454 |
| 2020 Q3 |
2,100,702 |
1,152,574 |
3,253,276 |
8,866,940 |
1,334,922 |
10,201,862 |
10,967,642 |
2,487,496 |
13,455,138 |
| 2020 Q4 |
2,079,331 |
1,172,867 |
3,252,198 |
8,753,985 |
1,312,515 |
10,066,500 |
10,833,316 |
2,485,382 |
13,318,698 |
| 2021 Q1 |
2,081,446 |
1,225,152 |
3,306,598 |
8,773,896 |
1,403,319 |
10,177,215 |
10,855,342 |
2,628,471 |
13,483,813 |
| 2021 Q2 |
2,098,831 |
1,181,183 |
3,280,014 |
8,449,536 |
1,170,338 |
9,619,874 |
10,548,367 |
2,351,521 |
12,899,888 |
| 2021 Q3 |
2,127,551 |
1,215,287 |
3,342,838 |
8,244,566 |
1,118,241 |
9,362,807 |
10,372,117 |
2,333,528 |
12,705,645 |
| 2021 Q4 |
2,180,320 |
1,269,737 |
3,450,057 |
8,481,117 |
1,114,064 |
9,595,181 |
10,661,437 |
2,383,801 |
13,045,238 |
| 2022 Q1 |
2,233,351 |
1,338,525 |
3,571,876 |
8,971,450 |
1,187,323 |
10,158,773 |
11,204,801 |
2,525,848 |
13,730,649 |
| 2022 Q2 |
2,262,535 |
1,375,609 |
3,638,144 |
9,320,979 |
1,210,640 |
10,531,619 |
11,583,514 |
2,586,249 |
14,169,763 |
| 2022 Q3 |
2,274,628 |
1,417,858 |
3,692,486 |
9,593,551 |
1,304,906 |
10,898,457 |
11,868,179 |
2,722,764 |
14,590,943 |
| 2022 Q4 |
2,300,070 |
1,470,561 |
3,770,631 |
9,672,933 |
1,314,794 |
10,987,727 |
11,973,003 |
2,785,355 |
14,758,358 |
| 2023 Q1 |
2,354,750 |
1,515,731 |
3,870,481 |
10,137,453 |
1,355,438 |
11,492,891 |
12,492,203 |
2,871,169 |
15,363,372 |
| 2023 Q2 |
2,338,735 |
1,518,362 |
3,857,097 |
10,202,131 |
1,395,840 |
11,597,971 |
12,540,866 |
2,914,202 |
15,455,068 |
| 2023 Q3 |
2,357,785 |
1,563,536 |
3,921,321 |
10,461,593 |
1,435,240 |
11,896,833 |
12,819,378 |
2,998,776 |
15,818,154 |
| 2023 Q4 |
2,333,023 |
1,582,224 |
3,915,247 |
10,482,543 |
1,489,714 |
11,972,257 |
12,815,566 |
3,071,938 |
15,887,504 |
| 2024 Q1 |
2,338,857 |
1,599,711 |
3,938,568 |
10,985,203 |
1,592,431 |
12,577,634 |
13,324,060 |
3,192,142 |
16,516,202 |
| 2024 Q2 |
2,339,984 |
1,591,476 |
3,931,460 |
11,263,627 |
1,668,972 |
12,932,599 |
13,603,611 |
3,260,448 |
16,864,059 |
| 2024 Q3 |
2,362,772 |
1,627,885 |
3,990,657 |
11,474,582 |
1,716,096 |
13,190,678 |
13,837,354 |
3,343,981 |
17,181,335 |
| 2024 Q4 |
2,393,923 |
1,660,560 |
4,054,483 |
11,828,151 |
1,789,636 |
13,617,787 |
14,222,074 |
3,450,196 |
17,672,270 |
| 2025 Q1 |
2,400,680 |
1,668,133 |
4,068,813 |
12,142,831 |
1,877,759 |
14,020,590 |
14,543,511 |
3,545,892 |
18,089,403 |
| 2025 Q2 |
2,421,432 |
1,681,803 |
4,103,235 |
12,168,530 |
1,907,605 |
14,076,135 |
14,589,962 |
3,589,408 |
18,179,370 |
| 2025 Q3 |
2,436,136 |
1,709,060 |
4,145,196 |
12,450,975 |
1,948,094 |
14,399,069 |
14,887,111 |
3,657,154 |
18,544,265 |
Source: Register-based Labour Market Statistics, General Authority for Statistics (GAStat)
1. Data collection methodology
LFS were first conducted in 2001 and became bi-annual after 2006. Data were collected through nationally representative household sample surveys, which sampling was based on most recent censuses.
Since 2016, Labour Force Surveys have been conducted and published on a quarterly basis, based on a household telephone survey conducted by GAStat. Employment data extracted from administrative records were also introduced as a complement to the results of Labour Force Surveys in Labour Market Statistics’ publications, starting on Q1 2017.
The present data is taken from administrative records.
Population of reference: Workers registered in the General Organization of Social Insurance (GOSI), in civil service and as domestic workers, in the governmental, public, private and domestic sectors.
GAStat Register-based Labour Market Statistics: administrative records
Estimates of figures and characteristics of employment in Saudi Arabia are taken from administrative records from the following institutions:
– Ministry of Human Resources and Social Development (MHRSD)
(formerly Ministry of Labour and Social Development):
Supplies data on:
Employees on the job subject to the rules and regulations of the Civil Service (government sector)
– General Organization of Social Insurance (GOSI):
Supplies data on:
a. contributors on the job who are subject to social insurance laws and regulations in the private and public sectors;
b. new contributors, and contributors who terminated their contribution to social insurance during the quarter.
– National Information Center (NIC):
Supplies data on domestic workers (data owner: MHRSD).
Figures of workers in Register-based Labor Market statistics which were derived from administrative records do not include the following category:
1-Workers in the military and security sectors
2- Workers who are not registered in the civil service, social insurance (GOSI) and domestic workers’ records, which include:
– Saudis working for their own businesses and are not subjected to the labor regulations, also, not registered in social insurance, such as those who work in delivery through electronic apps
– Saudi employers who work in establishments and not registered in the social insurance
– Non-Saudi staff working in foreign international, political or military missions
3- Non-Saudi employees who come to the Kingdom for work that normally takes less than three months to be completed.
Definitions and categories used by GAStat in Labour Markets Statistics (employment; unemployment;
occupation and activity sectors, etc.) are based on international standards:
For LFS methodology and definitions, see metadata section in report, and:
https://database.stats.gov.sa/Methodologies/En_Documents/03_Labor%20Market%20Bulletin%20Methodology,%20Fourth%20Quarter%202020%20_%20General%20Authority%20for%20Statistics.pdf
https://database.stats.gov.sa/Methodologies/En_Documents/03_Labor%20Market%20Bulletin%20Methodology,%20Fourth%20Quarter%202020%20_%20General%20Authority%20for%20Statistics.pdf
2. Institution which provides data
General Authority for Statistics (GAStat)
3. Data availability
Since 2021, GAStat has been publishing separately the employment data taken from administrative records,
and unemployment/inactivity data as well as general indicators, calculated from the results of the field
interviews conducted by GAStat (Labour Force Survey).
The time-series was built using the quarterly Register-based Labour Market Statistics for given quarters
2023-2024: available at:
https://www.stats.gov.sa/en/statistics-tabs?tab=436312&category=124074
Before 2023: available in the “archived data”:
https://www.stats.gov.sa/en/statistics?index=1317550
“social statistics”, and “labour force”
https://www.stats.gov.sa/en/statistics-tabs?tab=436312&category=1333429
Last date of access: 20 January 2026.
Keywords: Employment, Female Employment, Saudi Arabia, National & Foreign Labour
GLMM and GRC cannot guarantee that the link to access the source will not change;
that the information will not be removed from the website it was obtained from;
that no geo-blockages will be imposed; or that the information will not be available for any another reason.
|
Qataris |
Non-Qataris |
Total |
| 2015 |
11,671 |
1,499,956 |
1,511,627 |
| 2016 |
10,053 |
1,592,577 |
1,602,630 |
| 2017 |
10,210 |
1,596,340 |
1,606,550 |
| 2018 |
10,320 |
1,642,498 |
1,652,818 |
| 2019 |
9,856 |
1,651,951 |
1,661,807 |
| 2020 |
8,511 |
1,607,387 |
1,615,898 |
| 2021 |
9,555 |
1,584,118 |
1,593,673 |
| 2022 |
9,928 |
1,665,285 |
1,675,213 |
| 2023 |
10,724 |
1,710,971 |
1,721,695 |
| 2024 |
NA |
NA |
NA |
Source: National Planning Council (NPC). Annual Bulletins of Labour Force Sample Surveys 2015 to 2023
ANNEXED NOTE
1. Technical Notes and Definitions
The data is taken from the Annual Bulletins of Labour Force Sample Surveys 2015 to 2023 (yearly syntheses)
Sampling frame : Population Censuses 2010, 2015 and 2020.
Sample size since 2020: 65,253 persons, in 10,560 households: 1- Qatari households; 2- Non-Qatari regular (non-collective) households;
3- Non-Qatari small collective households or labour gatherings (2 – 6 persons); 4- Non-Qatari large collective households or large labour gatherings (7 persons or more).
The collective households are a group of persons not related to each other and sharing living conditions in a residential unit, I.e. labour camps, students living boarding schools, nurses in hospitals… etc. The survey covered the small collective households (includes less than 7 persons) and large collective households (includes 7 persons or more).
Data Collection: Labour Force Survey data are collected on a monthly basis, and based on field surveys.
Reference period for the labour force data: the week prior to data collection day.
The survey does not cover short periods accommodation, i.e. hotels.
Employed population:
Persons aged 15 years an above, who during the week preceding the survey:
a) Perform a work for a wage, salary, profits or household gains, whether it was in cash or in kind.
b) Are temporarily not employed, however, they still have an official relation with their work
Population of reference: labour force in the private sector, except for 2020 (employed population)
2. Institution which provides data
National Planning Council (NPC), formerly the Planning and Statistics Authority (PSA)
https://www.npc.qa/en/pages/default.aspx
https://www.npc.qa/ar/pages/default.aspx
3. Data availability
Annual and quarterly bulletins of Labour Force Surveys reports can be downloaded from NPC’s website, in PDF and/or Excel formats:
https://www.npc.qa/en/statistics/pages/subjectdetails.aspx#
The Annual Bulletin of Labour Force Survey 2024 is unavailable as of 27 December 2025.
Last date of access: December 2025.
GLMM and GRC cannot guarantee that the link to access the source will not change;
that the information will not be removed from the website it was obtained from;
that no geo-blockages will be imposed; or that the information will not be available for any another reason.
Keywords: Qatar, Employment, Female Employment, National Labour, Foreign Labour
|
Qataris |
Non-Qataris |
Total |
|
Males |
Females |
Males |
Females |
Males |
Females |
| 2015 |
7,517 |
4,154 |
1,412,777 |
87,179 |
1,420,294 |
91,333 |
| 2016 |
5,685 |
4,368 |
1,497,088 |
95,489 |
1,502,773 |
99,857 |
| 2017 |
5,910 |
4,300 |
1,498,130 |
98,210 |
1,504,040 |
102,510 |
| 2018 |
6,175 |
4,145 |
1,537,024 |
105,474 |
1,543,199 |
109,619 |
| 2019 |
6,197 |
3,659 |
1,549,772 |
102,179 |
1,555,969 |
105,838 |
| 2020 |
5,270 |
3,241 |
1,459,967 |
147,420 |
1,465,237 |
150,661 |
| 2021 |
5,921 |
3,634 |
1,453,991 |
130,127 |
1,459,912 |
133,761 |
| 2022 |
5,666 |
4,262 |
1,504,757 |
160,528 |
1,510,423 |
164,790 |
| 2023 |
6,509 |
4,215 |
1,524,920 |
186,051 |
1,531,429 |
190,266 |
| 2024 |
NA |
NA |
NA |
NA |
NA |
NA |
Source: National Planning Council (NPC). Annual Bulletins of Labour Force Sample Surveys 2015 to 2023
ANNEXED NOTE
1. Technical Notes and Definitions
The data is taken from the Annual Bulletins of Labour Force Sample Surveys 2015 to 2023 (yearly syntheses)
Sampling frame : Population Censuses 2010, 2015 and 2020.
Sample size since 2020: 65,253 persons, in 10,560 households: 1- Qatari households; 2- Non-Qatari regular (non-collective) households;
3- Non-Qatari small collective households or labour gatherings (2 – 6 persons); 4- Non-Qatari large collective households or large labour gatherings (7 persons or more).
The collective households are a group of persons not related to each other and sharing living conditions in a residential unit, I.e. labour camps, students living boarding schools, nurses in hospitals… etc. The survey covered the small collective households (includes less than 7 persons) and large collective households (includes 7 persons or more).
Data Collection: Labour Force Survey data are collected on a monthly basis, and based on field surveys.
Reference period for the labour force data: the week prior to data collection day.
The survey does not cover short periods accommodation, i.e. hotels.
Employed population:
Persons aged 15 years an above, who during the week preceding the survey:
a) Perform a work for a wage, salary, profits or household gains, whether it was in cash or in kind.
b) Are temporarily not employed, however, they still have an official relation with their work
Population of reference: labour force in the private sector, except for 2020 (employed population)
2. Institution which provides data
National Planning Council (NPC), formerly the Planning and Statistics Authority (PSA)
https://www.npc.qa/en/pages/default.aspx
https://www.npc.qa/ar/pages/default.aspx
3. Data availability
Annual and quarterly bulletins of Labour Force Surveys reports can be downloaded from NPC’s website, in PDF and/or Excel formats:
https://www.npc.qa/en/statistics/pages/subjectdetails.aspx#
The Annual Bulletin of Labour Force Survey 2024 is unavailable as of 27 December 2025.
Last date of access: December 2025.
GLMM and GRC cannot guarantee that the link to access the source will not change;
that the information will not be removed from the website it was obtained from;
that no geo-blockages will be imposed; or that the information will not be available for any another reason.
Keywords: Qatar, Employment, Female Employment, National Labour, Foreign Labour
|
Bahrain |
|
Kuwait |
|
|
Oman |
|
|
Qatar |
|
|
Arabie Saoudite |
UAE |
|
Males |
Females |
Total |
Males |
Females |
Total |
Males |
Females |
Total |
Males |
Females |
Total |
Males |
Females |
Total |
Males |
Females |
Total |
| 2015 |
482,263 |
64,309 |
546,572 |
1,328,307 |
151,942 |
1,480,249 |
1,501,783 |
81,679 |
1,583,462 |
1,420,294 |
91,333 |
1,511,627 |
NA |
NA |
NA |
4,309,434 |
424,851 |
4,734,285 |
| 2016 |
544,404 |
66,825 |
611,229 |
1,422,982 |
157,365 |
1,580,347 |
1,638,478 |
89,541 |
1,728,019 |
1,502,773 |
99,857 |
1,602,630 |
NA |
NA |
NA |
4,404,163 |
447,419 |
4,851,582 |
| 2017 |
528,854 |
70,860 |
599,714 |
1,475,338 |
162,682 |
1,638,020 |
1,642,361 |
99,135 |
1,741,496 |
1,504,040 |
102,510 |
1,606,550 |
NA |
NA |
NA |
4,539,473 |
473,161 |
5,012,634 |
| 2018 |
533,679 |
74,541 |
608,220 |
1,529,783 |
168,766 |
1,698,549 |
1,582,368 |
104,917 |
1,687,285 |
1,543,199 |
109,619 |
1,652,818 |
7,842,830 |
756,657 |
8,599,487 |
4,491,771 |
488,501 |
4,980,272 |
| 2019 |
528,412 |
77,412 |
605,824 |
1,538,184 |
175,879 |
1,714,063 |
1,514,008 |
112,280 |
1,626,288 |
1,555,969 |
105,838 |
1,661,807 |
7,353,681 |
784,909 |
8,138,590 |
4,569,274 |
525,133 |
5,094,407 |
| 2020 |
492,063 |
72,644 |
564,707 |
1,398,092 |
169,022 |
1,567,114 |
1,335,192 |
132,865 |
1,468,057 |
1,465,237 |
150,661 |
1,615,898 |
7,204,939 |
821,962 |
8,026,901 |
4,292,692 |
506,504 |
4,799,196 |
| 2021 |
482,190 |
75,673 |
557,863 |
1,270,371 |
164,453 |
1,434,824 |
1,334,099 |
148,081 |
1,482,180 |
1,459,912 |
133,761 |
1,593,673 |
7,160,076 |
924,177 |
8,084,253 |
4,359,741 |
550,369 |
4,910,110 |
| 2022 |
526,791 |
82,756 |
609,547 |
1,391,153 |
181,231 |
1,572,384 |
1,581,704 |
161,251 |
1,742,955 |
1,510,423 |
164,790 |
1,675,213 |
8,279,279 |
1,142,954 |
9,422,233 |
4,916,810 |
659,645 |
5,576,455 |
| 2023 |
NA |
NA |
NA |
1,456,419 |
200,536 |
1,656,955 |
1,676,943 |
177,030 |
1,853,973 |
1,531,429 |
190,266 |
1,721,695 |
9,029,273 |
1,262,997 |
10,292,270 |
NA |
NA |
NA |
| 2024 |
NA |
NA |
NA |
1,521,311 |
218,424 |
1,739,735 |
1,656,416 |
181,424 |
1,837,840 |
NA |
NA |
NA |
10,406,818 |
1,430,701 |
11,837,519 |
NA |
NA |
NA |
Sources: national institutes of statistics and relevant national institutions
1- Definitions and remarks:
Non-nationals are:
1- persons bearing nationality of a foreign State other than the GCC State of residence, or bearing no proof of nationality from any given state
(stateless persons and holders of refugee status and travel document in a third country);
2- Holders of residence permit residing in the given GCC country at date of census, as per definition of residence used in each of the countries.
Unless stated otherwise (if specific categories of workers are excluded from statistics, for instance), employment refers to: all persons of working age (15 and above), who during a reference period worked to produce goods or provide services for pay (cash or kind) or worked for profit from their own (or partially owned) business or worked without pay in the family business or with other individuals. It also includes those who have a temporary absence from a job during the reference period due to vacation or illness or any other reason.
Figures refer to workers employed in the private sector.
Reference period: end of year
Q4 of quarterly data published for Bahrain, Kuwait, Saudi Arabia
Annual data published for Oman, Qatar, UAE.
Bahrain: Labour Market Regulation Authority (LMRA). Bahrain Labour Market Indicators (BLMI), Q4 2022,
https://blmi.lmra.gov.bh/2022/12/mi_dashboard.xml
Employment data include all civilian employed persons in the private and public sectors (insured, uninsured and self-employed) and domestic workers.
Since Q1 2010, LMRA has been using data from LMRA Expat management System (EMS) to produce the total number of foreign worker employment in public and private sectors.
No data on employment after Q2 2023 in LMRA statistics.
Kuwait: Central Statistical Bureau. Integrated Database – LMIS, Q4 data, 2015 to 2024.
https://lmis.csb.gov.kw/
Data are taken from administrative records. The Public Authority for Manpower (PAM) maintains statistics on workers in the private sector.
Oman: National Center for Statistics and Information (NCSI). Statistical Yearbook 2025, Chapter “Employment”
https://www.ncsi.gov.om/Elibrary/LibraryContentDoc/bar_bar_Statistical%20Year%20Book%202024%20Issue%2052_a0f3084d-42a7-4183-83c0-3c9e603f89b5.pdf
https://www.ncsi.gov.om/Pages/Publications.aspx
“Private sector” includes Private, Communal and Other Sectors.
2020 and after: employment data is taken from National Registration system (includes insured and uninsured employees).
Qatar: National Planning Council (NPC), formerly Planning and Statistics Authority. Annual Bulletins of Labour Force Sample Surveys 2015 to 2023
https://www.npc.qa/en/statistics/pages/subjectdetails.aspx
Population of reference: labour force, except for 2020 (employed population)
Labour Force Survey data are collected on a monthly basis, and based on field surveys.
Annual Bulletin of Labour Force Survey 2024 unavailable as of 17 November 2025.
Saudi Arabia: General Authority for Statistics (GAStat). Labour Market Statistics (2017-20222) and Register-based Labour Market Statistics (2023-2024), Q4 data.
2023-2025: available at:
https://www.stats.gov.sa/en/statistics-tabs/-/categories/417515?tab=436312&category=417515
Before 2023: available in the “archived data”:
https://www.stats.gov.sa/en/statistics?index=1317550
“social statistics”, and “labour force”
https://www.stats.gov.sa/en/statistics-tabs?tab=436312&category=1333429
2015-2016: Saudi Arabia Central Bank (SAMA). Yearly statistics
https://www.sama.gov.sa/en-US/EconomicReports/Pages/report.aspx?cid=127
From 2017 onwards, the data is taken from the administrative records of subscribers to the General Organization of Social Insurance (GOSI).
Population of reference: workers employed in the private sector, registered with the GOSI.
Data for 2015 and 2016 were not included, to keep consistency of sources.
UAE: Ministry of Human Resources and Emiratisation (MoHRE), Open Data section
https://www.mohre.gov.ae/en/open-data/statistical-report
https://bayanat.ae/en/Datasets?subtopic=x5RFL7NcnLlf6cZVROr2UQs92UUJIeNXozZ3_zb-1pk
Total population (nationals+non-nationals) employed in private sector, registered as private sector employee by MoHRE.
See:https://gulfmigration.grc.net/uae-total-labour-force-in-the-private-sector-by-occupation-2011-2022/
Estimates for total employed population for years 2020 and beyond no longer available to the public as of November 2025.
Last accessed: 17 November 2025
GLMM and GRC cannot guarantee that the link to access the source will not change;
that the information will not be removed from the website it was obtained from;
that no geo-blockages will be imposed; or that the information will not be available for any another reason.
Keywords: Bahrain, Kuwait, Oman, Qatar, Saudi Arabia, United Arab Emirates, Employment, Female Employment, Labour Market, National & Foreign Labour
|
|
Bahrain |
|
|
Kuwait |
|
|
Oman |
|
|
Qatar |
|
|
Arabie Saoudite |
|
UAE |
|
Males |
Females |
Total |
Males |
Females |
Total |
Males |
Females |
Total |
Males |
Females |
Total |
Males |
Females |
Total |
Males |
Females |
Total |
| 2015 |
411,093 |
34,281 |
445,374 |
1,294,088 |
115,922 |
1,410,010 |
1,342,408 |
31,434 |
1,373,842 |
1,412,777 |
87,179 |
1,499,956 |
NA |
NA |
NA |
NA |
NA |
NA |
| 2016 |
473,169 |
35,893 |
509,062 |
1,387,950 |
121,137 |
1,509,087 |
1,469,483 |
35,453 |
1,504,936 |
1,497,088 |
95,489 |
1,592,577 |
NA |
NA |
NA |
NA |
NA |
NA |
| 2017 |
457,024 |
38,888 |
495,912 |
1,440,153 |
126,629 |
1,566,782 |
1,464,340 |
38,468 |
1,502,808 |
1,498,130 |
98,210 |
1,596,340 |
NA |
NA |
NA |
NA |
NA |
NA |
| 2018 |
461,656 |
41,350 |
503,006 |
1,493,772 |
131,817 |
1,625,589 |
1,395,278 |
39,875 |
1,435,153 |
1,537,024 |
105,474 |
1,642,498 |
6,681,256 |
214,258 |
6,895,514 |
NA |
NA |
NA |
| 2019 |
455,867 |
43,132 |
498,999 |
1,501,843 |
138,987 |
1,640,830 |
1,322,240 |
41,715 |
1,363,955 |
1,549,772 |
102,179 |
1,651,951 |
6,211,869 |
226,017 |
6,437,886 |
NA |
NA |
NA |
| 2020 |
421,048 |
38,974 |
460,022 |
1,361,740 |
132,393 |
1,494,133 |
1,078,982 |
36,340 |
1,115,322 |
1,459,967 |
147,420 |
1,607,387 |
6,057,344 |
222,801 |
6,280,145 |
NA |
NA |
NA |
| 2021 |
408,298 |
40,187 |
448,485 |
1,233,774 |
128,828 |
1,362,602 |
1,067,974 |
39,600 |
1,107,574 |
1,453,991 |
130,127 |
1,584,118 |
5,935,882 |
238,296 |
6,174,178 |
NA |
NA |
NA |
| 2022 |
450,676 |
45,642 |
496,318 |
1,354,090 |
146,461 |
1,500,551 |
1,314,124 |
45,652 |
1,359,776 |
1,504,757 |
160,528 |
1,665,285 |
6,945,931 |
281,757 |
7,227,688 |
NA |
NA |
NA |
| 2023 |
NA |
NA |
NA |
1,418,668 |
165,457 |
1,584,125 |
1,401,609 |
52,561 |
1,454,170 |
1,524,920 |
186,051 |
1,710,971 |
7,671,779 |
319,900 |
7,991,679 |
NA |
NA |
NA |
| 2024 |
NA |
NA |
NA |
1,482,606 |
183,388 |
1,665,994 |
1,374,759 |
58,365 |
1,433,124 |
NA |
NA |
NA |
8,995,587 |
433,772 |
9,429,359 |
NA |
NA |
NA |
Sources: national institutes of statistics and relevant national institutions
1- Definitions and remarks:
Non-nationals are:
1- persons bearing nationality of a foreign State other than the GCC State of residence, or bearing no proof of nationality from any given state
(stateless persons and holders of refugee status and travel document in a third country);
2- Holders of residence permit residing in the given GCC country at date of census, as per definition of residence used in each of the countries.
Unless stated otherwise (if specific categories of workers are excluded from statistics, for instance), employment refers to: all persons of working age (15 and above), who during a reference period worked to produce goods or provide services for pay (cash or kind) or worked for profit from their own (or partially owned) business or worked without pay in the family business or with other individuals. It also includes those who have a temporary absence from a job during the reference period due to vacation or illness or any other reason.
Figures refer to workers employed in the private sector.
Reference period: end of year
Q4 of quarterly data published for Bahrain, Kuwait, Saudi Arabia
Annual data published for Oman, Qatar, UAE.
Bahrain: Labour Market Regulation Authority (LMRA). Bahrain Labour Market Indicators (BLMI), Q4 2022,
https://blmi.lmra.gov.bh/2022/12/mi_dashboard.xml
Employment data include all civilian employed persons in the private and public sectors (insured, uninsured and self-employed) and domestic workers.
Since Q1 2010, LMRA has been using data from LMRA Expat management System (EMS) to produce the total number of foreign worker employment in public and private sectors.
No data on employment after Q2 2023 in LMRA statistics.
Kuwait: Central Statistical Bureau. Integrated Database – LMIS, Q4 data, 2015 to 2024.
https://lmis.csb.gov.kw/
Data are taken from administrative records. The Public Authority for Manpower (PAM) maintains statistics on workers in the private sector.
Oman: National Center for Statistics and Information (NCSI). Statistical Yearbook 2025, Chapter “Employment”
https://www.ncsi.gov.om/Elibrary/LibraryContentDoc/bar_bar_Statistical%20Year%20Book%202024%20Issue%2052_a0f3084d-42a7-4183-83c0-3c9e603f89b5.pdf
https://www.ncsi.gov.om/Pages/Publications.aspx
“Private sector” includes Private, Communal and Other Sectors.
2020 and after: employment data is taken from National Registration system (includes insured and uninsured employees).
Qatar: National Planning Council (NPC), formerly Planning and Statistics Authority. Annual Bulletins of Labour Force Sample Surveys 2015 to 2023
https://www.npc.qa/en/statistics/pages/subjectdetails.aspx
Population of reference: labour force, except for 2020 (employed population)
Labour Force Survey data are collected on a monthly basis, and based on field surveys.
Annual Bulletin of Labour Force Survey 2024 unavailable as of 17 November 2025.
Source 2020 data: census 2020.
Saudi Arabia: General Authority for Statistics (GAStat). Labour Market Statistics (2017-20222) and Register-based Labour Market Statistics (2023-2024), Q4 data.
2023-2025: available at:
https://www.stats.gov.sa/en/statistics-tabs/-/categories/417515?tab=436312&category=417515
Before 2023: available in the “archived data”:
https://www.stats.gov.sa/en/statistics?index=1317550
“social statistics”, and “labour force”
https://www.stats.gov.sa/en/statistics-tabs?tab=436312&category=1333429
2015-2016: Saudi Arabia Central Bank (SAMA). Yearly statistics
https://www.sama.gov.sa/en-US/EconomicReports/Pages/report.aspx?cid=127
From 2017 onwards, the data is taken from the administrative records of subscribers to the General Organization of Social Insurance (GOSI).
Population of reference: workers employed in the private sector, registered with the GOSI.
Data for 2015 and 2016 were not included, to keep consistency of sources.
UAE: Ministry of Human Resources and Emiratisation (MoHRE), Labour Market Information System.
Figures disaggregated by nationality or permitting estimates are not available.
No numerical data available since 2021 (percent distributions only).
Last accessed: 17 November 2025
GLMM and GRC cannot guarantee that the link to access the source will not change;
that the information will not be removed from the website it was obtained from;
that no geo-blockages will be imposed; or that the information will not be available for any another reason.
Keywords: Bahrain, Kuwait, Oman, Qatar, Saudi Arabia, United Arab Emirates, Employment, Female Employment, Labour Market, National & Foreign Labour
|
|
Bahrain |
|
|
Kuwait |
|
|
Oman |
|
|
Qatar |
|
|
Arabie Saoudite |
UAE |
|
Males |
Females |
Total |
Males |
Females |
Total |
Males |
Females |
Total |
Males |
Females |
Total |
Males |
Females |
Total |
Males |
Females |
Total |
| 2015 |
71,170 |
30,028 |
101,198 |
34,219 |
36,020 |
70,239 |
159,375 |
50,245 |
209,620 |
7,517 |
4,154 |
11,671 |
NA |
NA |
NA |
NA |
NA |
NA |
| 2016 |
71,235 |
30,932 |
102,167 |
35,032 |
36,228 |
71,260 |
168,995 |
54,088 |
223,083 |
5,685 |
4,368 |
10,053 |
NA |
NA |
NA |
NA |
NA |
NA |
| 2017 |
71,830 |
31,972 |
103,802 |
35,185 |
36,053 |
71,238 |
178,021 |
60,667 |
238,688 |
5,910 |
4,300 |
10,210 |
NA |
NA |
NA |
NA |
NA |
NA |
| 2018 |
72,023 |
33,191 |
105,214 |
36,011 |
36,949 |
72,960 |
187,090 |
65,042 |
252,132 |
6,175 |
4,145 |
10,320 |
1,161,574 |
542,399 |
1,703,973 |
NA |
NA |
NA |
| 2019 |
72,545 |
34,280 |
106,825 |
36,341 |
36,892 |
73,233 |
191,768 |
70,565 |
262,333 |
6,197 |
3,659 |
9,856 |
1,141,812 |
558,892 |
1,700,704 |
NA |
NA |
NA |
| 2020 |
71,015 |
33,670 |
104,685 |
36,352 |
36,629 |
72,981 |
256,210 |
96,525 |
352,735 |
5,270 |
3,241 |
8,511 |
1,147,595 |
599,161 |
1,746,756 |
NA |
NA |
34,510 |
| 2021 |
73,892 |
35,486 |
109,378 |
36,597 |
35,625 |
72,222 |
266,125 |
108,481 |
374,606 |
5,921 |
3,634 |
9,555 |
1,224,194 |
685,881 |
1,910,075 |
NA |
NA |
37,569 |
| 2022 |
76,115 |
37,114 |
113,229 |
37,063 |
34,770 |
71,833 |
267,580 |
115,599 |
383,179 |
5,666 |
4,262 |
9,928 |
1,333,348 |
861,197 |
2,194,545 |
NA |
NA |
60,136 |
| 2023 |
NA |
NA |
NA |
37,751 |
35,079 |
72,830 |
275,334 |
124,469 |
399,803 |
6,509 |
4,215 |
10,724 |
1,357,494 |
943,097 |
2,300,591 |
NA |
NA |
91,773 |
| 2024 |
NA |
NA |
NA |
38,705 |
35,036 |
73,741 |
281,657 |
123,059 |
404,716 |
NA |
NA |
NA |
1,411,231 |
996,929 |
2,408,160 |
NA |
NA |
131,883 |
Sources: national institutes of statistics and relevant national institutions
1- Definitions and remarks:
Non-nationals are:
1- persons bearing nationality of a foreign State other than the GCC State of residence, or bearing no proof of nationality from any given state
(stateless persons and holders of refugee status and travel document in a third country);
2- Holders of residence permit residing in the given GCC country at date of census, as per definition of residence used in each of the countries.
Unless stated otherwise (if specific categories of workers are excluded from statistics, for instance), employment refers to: all persons of working age (15 and above), who during a reference period worked to produce goods or provide services for pay (cash or kind) or worked for profit from their own (or partially owned) business or worked without pay in the family business or with other individuals. It also includes those who have a temporary absence from a job during the reference period due to vacation or illness or any other reason.
Figures refer to workers employed in the private sector.
Reference period: end of year
Q4 of quarterly data published for Bahrain, Kuwait, Saudi Arabia
Annual data published for Oman, Qatar, UAE.
Bahrain: Labour Market Regulation Authority (LMRA). Bahrain Labour Market Indicators (BLMI), Q4 2022,
https://blmi.lmra.gov.bh/2022/12/mi_dashboard.xml
Employment data include all civilian employed persons in the private and public sectors (insured, uninsured and self-employed) and domestic workers.
Since Q1 2010, LMRA has been using data from LMRA Expat management System (EMS) to produce the total number of foreign worker employment in public and private sectors.
No data on employment after Q2 2023 in LMRA statistics.
Kuwait: Central Statistical Bureau. Integrated Database – LMIS, Q4 data, 2015 to 2024.
https://lmis.csb.gov.kw/
Data are taken from administrative records. The Public Authority for Manpower (PAM) maintains statistics on workers in the private sector.
Oman: National Center for Statistics and Information (NCSI). Statistical Yearbook 2025, Chapter “Employment”
https://www.ncsi.gov.om/Elibrary/LibraryContentDoc/bar_bar_Statistical%20Year%20Book%202024%20Issue%2052_a0f3084d-42a7-4183-83c0-3c9e603f89b5.pdf
https://www.ncsi.gov.om/Pages/Publications.aspx
“Private sector” includes Private, Communal and Other Sectors.
2020 and after: employment data is taken from National Registration system (includes insured and uninsured employees).
Qatar: National Planning Council (NPC), formerly Planning and Statistics Authority. Annual Bulletins of Labour Force Sample Surveys 2015 to 2023
https://www.npc.qa/en/statistics/pages/subjectdetails.aspx
Population of reference: labour force, except for 2020 (employed population)
Labour Force Survey data are collected on a monthly basis, and based on field surveys.
Annual Bulletin of Labour Force Survey 2024 unavailable as of 17 November 2025.
Source 2020 data: census 2020.
Saudi Arabia: General Authority for Statistics (GAStat). Labour Market Statistics (2017-20222) and Register-based Labour Market Statistics (2023-2024), Q4 data.
2023-2025: available at:
https://www.stats.gov.sa/en/statistics-tabs/-/categories/417515?tab=436312&category=417515
Before 2023: available in the “archived data”:
https://www.stats.gov.sa/en/statistics?index=1317550
“social statistics”, and “labour force”
https://www.stats.gov.sa/en/statistics-tabs?tab=436312&category=1333429
2015-2016: Saudi Arabia Central Bank (SAMA). Yearly statistics
https://www.sama.gov.sa/en-US/EconomicReports/Pages/report.aspx?cid=127
From 2017 onwards, the data is taken from the administrative records of subscribers to the General Organization of Social Insurance (GOSI).
Population of reference: workers employed in the private sector, registered with the GOSI.
Data for 2015 and 2016 were not included, to keep consistency of sources.
UAE: Ministry of Human Resources and Emiratisation (MoHRE), “Open Data”; “Statistical Reports” section
https://www.mohre.gov.ae/assets/download/f13f2c67/Employment%20by%20Gender%202020%20-%202024_638941250942160725.xlsx.aspx
https://www.mohre.gov.ae/en/open-data/statistical-report
Definition: Total number of Emirati nationals officially registered and actively employed in private sector establishments during a specific period.
Based on ministry data and official labor systems.
Figures disaggregated by sex or figures for previous years are not available.
Last accessed: 17 November 2025
GLMM and GRC cannot guarantee that the link to access the source will not change;
that the information will not be removed from the website it was obtained from;
that no geo-blockages will be imposed; or that the information will not be available for any another reason.
Keywords: Bahrain, Kuwait, Oman, Qatar, Saudi Arabia, United Arab Emirates, Employment, Female Employment, Labour Market, National & Foreign Labour
|
Total employed population |
| Government Sector |
Private Sector |
Domestic Sector |
All sectors |
| Males |
Females |
Total |
Males |
Females |
Total |
Males |
Females |
Total |
Males |
Females |
Total |
| 2010 |
104,325 |
59,657 |
163,982 |
985,631 |
54,294 |
1,039,925 |
20,739 |
72,682 |
93,421 |
1,110,695 |
186,633 |
1,297,328 |
| 2011 |
111,689 |
72,751 |
184,440 |
1,124,884 |
56,485 |
1,181,369 |
21,245 |
86,417 |
107,662 |
1,257,818 |
215,653 |
1,473,471 |
| 2012 |
117,099 |
77,227 |
194,326 |
1,302,175 |
60,191 |
1,362,366 |
22,322 |
103,560 |
125,882 |
1,441,596 |
240,978 |
1,682,574 |
| 2013 |
125,673 |
85,456 |
211,129 |
1,440,952 |
73,339 |
1,514,291 |
24,078 |
114,627 |
138,705 |
1,590,703 |
273,422 |
1,864,125 |
| 2014 |
133,383 |
92,450 |
225,833 |
1,393,385 |
74,338 |
1,467,723 |
109,017 |
131,163 |
240,180 |
1,635,785 |
297,951 |
1,933,736 |
| 2015 |
135,487 |
93,980 |
229,467 |
1,501,783 |
81,679 |
1,583,462 |
120,433 |
141,763 |
262,196 |
1,757,703 |
317,422 |
2,075,125 |
| 2016 |
138,480 |
95,081 |
233,561 |
1,638,478 |
89,541 |
1,728,019 |
134,296 |
148,747 |
283,043 |
1,911,254 |
333,369 |
2,244,623 |
| 2017 |
136,690 |
95,373 |
232,063 |
1,642,361 |
99,135 |
1,741,496 |
137,355 |
155,526 |
292,881 |
1,916,406 |
350,034 |
2,266,440 |
| 2018 |
135,694 |
95,205 |
230,899 |
1,582,368 |
104,917 |
1,687,285 |
136,431 |
158,129 |
294,560 |
1,854,493 |
358,251 |
2,212,744 |
| 2019 |
140,178 |
97,185 |
237,363 |
1,514,008 |
112,280 |
1,626,288 |
135,256 |
158,900 |
294,156 |
1,789,442 |
368,365 |
2,157,807 |
| 2020 |
291,476 |
101,708 |
393,184 |
1,335,192 |
132,865 |
1,468,057 |
155,205 |
147,554 |
302,759 |
1,781,873 |
382,127 |
2,164,000 |
| 2021 |
289,931 |
102,941 |
392,872 |
1,334,099 |
148,081 |
1,482,180 |
149,044 |
134,523 |
283,567 |
1,773,074 |
385,545 |
2,158,619 |
| 2022 |
295,944 |
111,550 |
407,494 |
1,581,704 |
161,251 |
1,742,955 |
182,224 |
176,450 |
358,674 |
2,059,872 |
449,251 |
2,509,123 |
| 2023 |
300,489 |
120,545 |
421,034 |
1,676,943 |
177,030 |
1,853,973 |
210,052 |
195,393 |
405,445 |
2,187,484 |
492,968 |
2,680,452 |
| 2024 |
314,880 |
119,909 |
434,789 |
1,656,416 |
181,424 |
1,837,840 |
188,439 |
206,461 |
394,900 |
2,159,735 |
507,794 |
2,667,529 |
Source: NCSI. Statistical Yearbooks, 2009 to 2025
ANNEXED NOTE
1. Technical Notes and Definitions
Data for the governmental sector exclude Security and Defense personnels.
Private sector includes Private, Communal and Other Sectors.
Omanis in the private sector are registered with the Public Authority for Social Insurance (PASI).
2020 and after: employment data is taken from National Registration system (includes insured and uninsured employees).
2. Institution which provides data
National Center for Statistics and Information (NCSI)
3. Data availability
The data on employment by sector and nationality is available in NCSI’s Statistical Yearbooks (chapter “Employment”)
https://api.ncsi.gov.om/uploads/pdfs/publicationpdf1763023139.pdf
https://www.ncsi.gov.om/publications?page=1&classification=2#
Last date of access: November 2025
GLMM and GRC cannot guarantee that the link to access the source will not change;
that the information will not be removed from the website it was obtained from;
that no geo-blockages will be imposed; or that the information will not be available for any another reason.
Keywords: Oman, National Labour, Foreign Labour, Employment, Female Employment, Labour Market, National & Foreign Labour, Domestic Workers
|
Omanis |
| Government Sector |
Private Sector |
Domestic Sector |
All sectors |
| Males |
Females |
Total |
Males |
Females |
Total |
Males |
Females |
Total |
Males |
Females |
Total |
| 2010 |
88,483 |
51,887 |
140,370 |
143,482 |
34,234 |
177,716 |
|
|
|
231,965 |
86,121 |
318,086 |
| 2011 |
94,639 |
64,619 |
159,258 |
139,878 |
34,563 |
174,441 |
0 |
0 |
0 |
234,517 |
99,182 |
333,699 |
| 2012 |
98,604 |
68,200 |
166,804 |
136,818 |
35,248 |
172,066 |
0 |
0 |
0 |
235,422 |
103,448 |
338,870 |
| 2013 |
106,281 |
74,456 |
180,737 |
143,860 |
38,000 |
181,860 |
0 |
0 |
0 |
250,141 |
112,456 |
362,597 |
| 2014 |
112,847 |
79,375 |
192,222 |
152,959 |
44,551 |
197,510 |
0 |
0 |
0 |
265,806 |
123,926 |
389,732 |
| 2015 |
114,133 |
79,832 |
193,965 |
159,375 |
50,245 |
209,620 |
0 |
0 |
0 |
273,508 |
130,077 |
403,585 |
| 2016 |
114,566 |
81,371 |
195,937 |
168,995 |
54,088 |
223,083 |
0 |
0 |
0 |
283,561 |
135,459 |
419,020 |
| 2017 |
113,642 |
82,038 |
195,680 |
178,021 |
60,667 |
238,688 |
0 |
0 |
0 |
291,663 |
142,705 |
434,368 |
| 2018 |
113,087 |
82,394 |
195,481 |
187,090 |
65,042 |
252,132 |
0 |
0 |
0 |
300,177 |
147,436 |
447,613 |
| 2019 |
118,257 |
84,636 |
202,893 |
191,768 |
70,565 |
262,333 |
0 |
0 |
0 |
310,025 |
155,201 |
465,226 |
| 2020 |
261,015 |
88,257 |
349,272 |
256,210 |
96,525 |
352,735 |
32,027 |
18,690 |
50,717 |
549,252 |
203,472 |
752,724 |
| 2021 |
262,067 |
89,164 |
351,231 |
266,125 |
108,481 |
374,606 |
29,693 |
18,256 |
47,949 |
557,885 |
215,901 |
773,786 |
| 2022 |
267,786 |
95,652 |
363,438 |
267,580 |
115,599 |
383,179 |
34,704 |
20,494 |
55,198 |
570,070 |
231,745 |
801,815 |
| 2023 |
271,687 |
105,169 |
376,856 |
275,334 |
124,469 |
399,803 |
55,534 |
21,011 |
76,545 |
602,555 |
250,649 |
853,204 |
| 2024 |
286,895 |
105,126 |
392,021 |
281,657 |
123,059 |
404,716 |
40,829 |
21,037 |
61,866 |
609,381 |
249,222 |
858,603 |
Source: NCSI. Statistical Yearbooks, 2009 to 2025
ANNEXED NOTE
1. Technical Notes and Definitions
Data for the governmental sector exclude Security and Defense personnels.
Private sector includes Private, Communal and Other Sectors.
Omanis in the private sector are registered with the Public Authority for Social Insurance (PASI).
2020 and after: employment data is taken from National Registration system (includes insured and uninsured employees).
2. Institution which provides data
National Center for Statistics and Information (NCSI)
3. Data availability
The data on employment by sector and nationality is available in NCSI’s Statistical Yearbooks (chapter “Employment”)
https://api.ncsi.gov.om/uploads/pdfs/publicationpdf1763023139.pdf
https://www.ncsi.gov.om/publications?page=1&classification=2#
Last date of access: November 2025
GLMM and GRC cannot guarantee that the link to access the source will not change;
that the information will not be removed from the website it was obtained from;
that no geo-blockages will be imposed; or that the information will not be available for any another reason.
Keywords: Oman, National Labour, Foreign Labour, Employment, Female Employment, Labour Market, National & Foreign Labour, Domestic Workers
|
Non-Omanis |
| Government Sector |
Private Sector |
Domestic Sector |
All sectors |
| Males |
Females |
Total |
Males |
Females |
Total |
Males |
Females |
Total |
Males |
Females |
Total |
| 2010 |
15,842 |
7,770 |
23,612 |
842,149 |
20,060 |
862,209 |
20,739 |
72,682 |
93,421 |
878,730 |
100,512 |
979,242 |
| 2011 |
17,050 |
8,132 |
25,182 |
985,006 |
21,922 |
1,006,928 |
21,245 |
86,417 |
107,662 |
1,023,301 |
116,471 |
1,139,772 |
| 2012 |
18,495 |
9,027 |
27,522 |
1,165,357 |
24,943 |
1,190,300 |
22,322 |
103,560 |
125,882 |
1,206,174 |
137,530 |
1,343,704 |
| 2013 |
19,392 |
11,000 |
30,392 |
1,297,092 |
35,339 |
1,332,431 |
24,078 |
114,627 |
138,705 |
1,340,562 |
160,966 |
1,501,528 |
| 2014 |
20,536 |
13,075 |
33,611 |
1,240,426 |
29,787 |
1,270,213 |
109,017 |
131,163 |
240,180 |
1,369,979 |
174,025 |
1,544,004 |
| 2015 |
21,354 |
14,148 |
35,502 |
1,342,408 |
31,434 |
1,373,842 |
120,433 |
141,763 |
262,196 |
1,484,195 |
187,345 |
1,671,540 |
| 2016 |
23,914 |
13,710 |
37,624 |
1,469,483 |
35,453 |
1,504,936 |
134,296 |
148,747 |
283,043 |
1,627,693 |
197,910 |
1,825,603 |
| 2017 |
23,048 |
13,335 |
36,383 |
1,464,340 |
38,468 |
1,502,808 |
137,355 |
155,526 |
292,881 |
1,624,743 |
207,329 |
1,832,072 |
| 2018 |
22,607 |
12,811 |
35,418 |
1,395,278 |
39,875 |
1,435,153 |
136,431 |
158,129 |
294,560 |
1,554,316 |
210,815 |
1,765,131 |
| 2019 |
21,921 |
12,549 |
34,470 |
1,322,240 |
41,715 |
1,363,955 |
135,256 |
158,900 |
294,156 |
1,479,417 |
213,164 |
1,692,581 |
| 2020 |
30,461 |
13,451 |
43,912 |
1,078,982 |
36,340 |
1,115,322 |
123,178 |
128,864 |
252,042 |
1,232,621 |
178,655 |
1,411,276 |
| 2021 |
27,864 |
13,777 |
41,641 |
1,067,974 |
39,600 |
1,107,574 |
119,351 |
116,267 |
235,618 |
1,215,189 |
169,644 |
1,384,833 |
| 2022 |
28,158 |
15,898 |
44,056 |
1,314,124 |
45,652 |
1,359,776 |
147,520 |
155,956 |
303,476 |
1,489,802 |
217,506 |
1,707,308 |
| 2023 |
28,802 |
15,376 |
44,178 |
1,401,609 |
52,561 |
1,454,170 |
154,518 |
174,382 |
328,900 |
1,584,929 |
242,319 |
1,827,248 |
| 2024 |
27,985 |
14,783 |
42,768 |
1,374,759 |
58,365 |
1,433,124 |
147,610 |
185,424 |
333,034 |
1,550,354 |
258,572 |
1,808,926 |
Source: NCSI. Statistical Yearbooks, 2009 to 2025
ANNEXED NOTE
1. Technical Notes and Definitions
Data for the governmental sector exclude Security and Defense personnels.
Private sector includes Private, Communal and Other Sectors.
Omanis in the private sector are registered with the Public Authority for Social Insurance (PASI).
2020 and after: employment data is taken from National Registration system (includes insured and uninsured employees).
2. Institution which provides data
National Center for Statistics and Information (NCSI)
3. Data availability
The data on employment by sector and nationality is available in NCSI’s Statistical Yearbooks (chapter “Employment”)
https://api.ncsi.gov.om/uploads/pdfs/publicationpdf1763023139.pdf
https://www.ncsi.gov.om/publications?page=1&classification=2#
Last date of access: November 2025
GLMM and GRC cannot guarantee that the link to access the source will not change;
that the information will not be removed from the website it was obtained from;
that no geo-blockages will be imposed; or that the information will not be available for any another reason.
Keywords: Oman, National Labour, Foreign Labour, Employment, Female Employment, Labour Market, National & Foreign Labour, Domestic Workers
| GOSI covers: |
Saudis |
Non-Saudis |
Total |
| Males |
Females |
Males |
Females |
Males |
Females |
| 2018 Q3 |
1,173,765 |
545,059 |
6,916,213 |
212,441 |
8,089,978 |
757,500 |
| 2018 Q4 |
1,161,574 |
542,399 |
6,681,256 |
214,258 |
7,842,830 |
756,657 |
| 2019 Q1 |
1,155,790 |
543,893 |
6,491,437 |
218,479 |
7,647,227 |
762,372 |
| 2019 Q2 |
1,141,246 |
529,654 |
6,359,454 |
218,707 |
7,500,700 |
748,361 |
| 2019 Q3 |
1,131,730 |
539,580 |
6,296,806 |
223,677 |
7,428,536 |
763,257 |
| 2019 Q4 |
1,141,812 |
558,892 |
6,211,869 |
226,017 |
7,353,681 |
784,909 |
| 2020 Q1 |
1,145,617 |
571,533 |
6,430,513 |
240,731 |
7,576,130 |
812,264 |
| 2020 Q2 |
1,130,829 |
547,264 |
6,405,151 |
240,785 |
7,535,980 |
788,049 |
| 2020 Q3 |
1,174,253 |
585,305 |
6,181,159 |
227,899 |
7,355,412 |
813,204 |
| 2020 Q4 |
1,147,595 |
599,161 |
6,057,344 |
222,801 |
7,204,939 |
821,962 |
| 2021 Q1 |
1,151,916 |
649,770 |
5,996,923 |
225,226 |
7,148,839 |
874,996 |
| 2021 Q2 |
1,163,402 |
602,677 |
5,805,720 |
223,327 |
6,969,122 |
826,004 |
| 2021 Q3 |
1,188,509 |
638,281 |
5,693,322 |
224,551 |
6,881,831 |
862,832 |
| 2021 Q4 |
1,224,194 |
685,881 |
5,935,882 |
238,296 |
7,160,076 |
924,177 |
| 2022 Q1 |
1,280,782 |
752,272 |
6,350,854 |
257,713 |
7,631,636 |
1,009,985 |
| 2022 Q2 |
1,307,157 |
786,686 |
6,713,866 |
271,201 |
8,021,023 |
1,057,887 |
| 2022 Q3 |
1,317,564 |
823,446 |
6,883,203 |
278,370 |
8,200,767 |
1,101,816 |
| 2022 Q4 |
1,333,348 |
861,197 |
6,945,931 |
281,757 |
8,279,279 |
1,142,954 |
| 2023 Q1 |
1,343,642 |
890,410 |
7,387,389 |
306,759 |
8,731,031 |
1,197,169 |
| 2023 Q2 |
1,331,746 |
894,144 |
7,441,121 |
308,674 |
8,772,867 |
1,202,818 |
| 2023 Q3 |
1,345,536 |
927,254 |
7,684,147 |
318,922 |
9,029,683 |
1,246,176 |
| 2023 Q4 |
1,357,494 |
943,097 |
7,671,779 |
319,900 |
9,029,273 |
1,262,997 |
| 2024 Q1 |
1,364,419 |
957,997 |
8,159,474 |
351,358 |
9,523,893 |
1,309,355 |
| 2024 Q2 |
1,367,322 |
950,472 |
8,441,208 |
380,107 |
9,808,530 |
1,330,579 |
| 2024 Q3 |
1,385,460 |
974,623 |
8,654,049 |
410,423 |
10,039,509 |
1,385,046 |
| 2024 Q4 |
1,411,231 |
996,929 |
8,995,587 |
433,772 |
10,406,818 |
1,430,701 |
| 2025 Q1 |
1,420,345 |
1,002,935 |
9,313,296 |
453,763 |
10,733,641 |
1,456,698 |
| 2025 Q2 |
1,443,372 |
1,018,535 |
9,344,790 |
449,844 |
10,788,162 |
1,468,379 |
Source: Register-based Labour Market Statistics, General Authority for Statistics (GAStat)
1. Data collection methodology
LFS were first conducted in 2001 and became bi-annual after 2006. Data were collected through nationally
representative household sample surveys, which sampling was based on most recent censuses.
Since 2016, Labour Force Surveys have been conducted and published on a quarterly basis, based on a
household telephone survey conducted by GAStat. Employment data extracted from administrative records
were also introduced as a complement to the results of Labour Force Surveys in Labour Market Statistics’
publications, starting on Q1 2017.
The present data is taken from the administrative records of subscribers to the General Organization of Social Insurance (GOSI).
Population of reference: workers employed in the private sector, registered with the GOSI.
GOSI covers:
a. contributors on the job who are subject to social insurance laws and regulations, employed in the private sector;
b. contributors on the job who are subject to social insurance laws and regulations, employed in the public (government) sector;
c. new contributors, and contributors who terminated their contribution to social insurance during the quarter.
Figures of workers in Labor Market statistics which were derived from administrative records do not include the following categories:
1-Workers in the military and security sectors
2- Workers who are not registered in the civil service, social insurance (GOSI) and domestic workers’ records, which include:
– Saudis working for their own businesses and are not subjected to the labor regulations, also, not registered in social insurance,
such as those who work in delivery through electronic apps
– Saudi employers who work in establishments and not registered in the social insurance
– Non-Saudi staff working in foreign international, political or military missions
3- Non-Saudi employees who come to the Kingdom for work that normally takes less than three months to be completed.
GOSI data for the first quarter of 2023 has been updated from the number of subscriptions to the number of subscribers.
Definitions and categories used by GAStat in Labour Markets Statistics (employment; unemployment;
occupation and activity sectors, etc.) are based on international standards:
For LFS methodology and definitions, see metadata section in report, and:
https://database.stats.gov.sa/Methodologies/En_Documents/03_Labor%20Market%20Bulletin%20Methodology,%20Fourth%20Quarter%202020%20_%20General%20Authority%20for%20Statistics.pdf
https://database.stats.gov.sa/Methodologies/En_Documents/03_Labor%20Market%20Bulletin%20Methodology,%20Fourth%20Quarter%202020%20_%20General%20Authority%20for%20Statistics.pdf
Classification of economic activities: Saudi Classification of Economic Activities, based on the International Standard Industrial Classification of all economic activities (ISIC4)
https://www.stats.gov.sa/en/classifications
2. Institution which provides data
General Authority for Statistics (GAStat)
3. Data availability
Since 2021, GAStat has been publishing separately the employment data taken from administrative records,
and unemployment/inactivity data as well as general indicators, calculated from the results of the field
interviews conducted by GAStat (Labour Force Survey).
The time-series was built using the quarterly Register-based Labour Market Statistics for given quarters
2023-2025: available at:
https://www.stats.gov.sa/en/statistics-tabs/-/categories/417515?tab=436312&category=417515
Before 2023: available in the “archived data”:
https://www.stats.gov.sa/en/statistics?index=1317550
“social statistics”, and “labour force”
https://www.stats.gov.sa/en/statistics-tabs?tab=436312&category=1333429
No data on employed by sector available before Q2 2018.
Last date of access: 17 November 2025.
Keywords: Employment, Saudi Arabia, National & Foreign Labour, Female Employment
GLMM and GRC cannot guarantee that the link to access the source will not change;
that the information will not be removed from the website it was obtained from;
that no geo-blockages will be imposed; or that the information will not be available for any another reason.
|
Saudis |
Non-Saudis |
Total |
| 2018 Q3 |
1,718,824 |
7,128,654 |
8,847,478 |
| 2018 Q4 |
1,703,973 |
6,895,514 |
8,599,487 |
| 2019 Q1 |
1,699,683 |
6,709,916 |
8,409,599 |
| 2019 Q2 |
1,670,900 |
6,578,161 |
8,249,061 |
| 2019 Q3 |
1,671,310 |
6,520,483 |
8,191,793 |
| 2019 Q4 |
1,700,704 |
6,437,886 |
8,138,590 |
| 2020 Q1 |
1,717,150 |
6,671,244 |
8,388,394 |
| 2020 Q2 |
1,678,093 |
6,645,936 |
8,324,029 |
| 2020 Q3 |
1,759,558 |
6,409,058 |
8,168,616 |
| 2020 Q4 |
1,746,756 |
6,280,145 |
8,026,901 |
| 2021 Q1 |
1,801,686 |
6,222,149 |
8,023,835 |
| 2021 Q2 |
1,766,079 |
6,029,047 |
7,795,126 |
| 2021 Q3 |
1,826,790 |
5,917,873 |
7,744,663 |
| 2021 Q4 |
1,910,075 |
6,174,178 |
8,084,253 |
| 2022 Q1 |
2,033,054 |
6,608,567 |
8,641,621 |
| 2022 Q2 |
2,093,843 |
6,985,067 |
9,078,910 |
| 2022 Q3 |
2,141,010 |
7,161,573 |
9,302,583 |
| 2022 Q4 |
2,194,545 |
7,227,688 |
9,422,233 |
| 2023 Q1 |
2,234,052 |
7,694,148 |
9,928,200 |
| 2023 Q2 |
2,225,890 |
7,749,795 |
9,975,685 |
| 2023 Q3 |
2,272,790 |
8,003,069 |
10,275,859 |
| 2023 Q4 |
2,300,591 |
7,991,679 |
10,292,270 |
| 2024 Q1 |
2,322,416 |
8,510,832 |
10,833,248 |
| 2024 Q2 |
2,317,794 |
8,821,315 |
11,139,109 |
| 2024 Q3 |
2,360,083 |
9,064,472 |
11,424,555 |
| 2024 Q4 |
2,408,160 |
9,429,359 |
11,837,519 |
| 2025 Q1 |
2,423,280 |
9,767,059 |
12,190,339 |
| 2025 Q2 |
2,461,907 |
9,794,634 |
12,256,541 |
Source: Register-based Labour Market Statistics, General Authority for Statistics (GAStat)
1. Data collection methodology
LFS were first conducted in 2001 and became bi-annual after 2006. Data were collected through nationally
representative household sample surveys, which sampling was based on most recent censuses.
Since 2016, Labour Force Surveys have been conducted and published on a quarterly basis, based on a
household telephone survey conducted by GAStat. Employment data extracted from administrative records
were also introduced as a complement to the results of Labour Force Surveys in Labour Market Statistics’
publications, starting on Q1 2017.
The present data is taken from the administrative records of subscribers to the General Organization of Social Insurance (GOSI).
Population of reference: workers employed in the private sector, subject to the rule of the GOSI.
GOSI covers:
a. contributors on the job who are subject to social insurance laws and regulations, employed in the private sector;
b. contributors on the job who are subject to social insurance laws and regulations, employed in the public (government) sector;
c. new contributors, and contributors who terminated their contribution to social insurance during the quarter.
GOSI data for the first quarter of 2023 has been updated from the number of subscriptions to the number of subscribers.
Figures of workers in Labor Market statistics which were derived from administrative records do not include the following categories:
1-Workers in the military and security sectors
2- Workers who are not registered in the civil service, social insurance (GOSI) and domestic workers’ records, which include:
– Saudis working for their own businesses and are not subjected to the labor regulations, also, not registered in social insurance,
such as those who work in delivery through electronic apps
– Saudi employers who work in establishments and not registered in the social insurance
– Non-Saudi staff working in foreign international, political or military missions
3- Non-Saudi employees who come to the Kingdom for work that normally takes less than three months to be completed.
Definitions and categories used by GAStat in Labour Markets Statistics (employment; unemployment;
occupation and activity sectors, etc.) are based on international standards:
For LFS methodology and definitions, see metadata section in report, and:
https://database.stats.gov.sa/Methodologies/En_Documents/03_Labor%20Market%20Bulletin%20Methodology,%20Fourth%20Quarter%202020%20_%20General%20Authority%20for%20Statistics.pdf
https://database.stats.gov.sa/Methodologies/En_Documents/03_Labor%20Market%20Bulletin%20Methodology,%20Fourth%20Quarter%202020%20_%20General%20Authority%20for%20Statistics.pdf
Classification of economic activities: Saudi Classification of Economic Activities, based on the International Standard Industrial Classification of all economic activities (ISIC4)
https://www.stats.gov.sa/en/classifications
2. Institution which provides data
General Authority for Statistics (GAStat)
3. Data availability
Since 2021, GAStat has been publishing separately the employment data taken from administrative records,
and unemployment/inactivity data as well as general indicators, calculated from the results of the field
interviews conducted by GAStat (Labour Force Survey).
The time-series was built using the quarterly Register-based Labour Market Statistics for given quarters
2023-2025: available at:
https://www.stats.gov.sa/en/statistics-tabs/-/categories/417515?tab=436312&category=417515
Before 2023: available in the “archived data”:
https://www.stats.gov.sa/en/statistics?index=1317550
“social statistics”, and “labour force”
https://www.stats.gov.sa/en/statistics-tabs?tab=436312&category=1333429
No data on employed by sector available before Q2 2018.
Last date of access: 17 November 2025.
Keywords: Employment, Saudi Arabia, National & Foreign Labour
GLMM and GRC cannot guarantee that the link to access the source will not change;
that the information will not be removed from the website it was obtained from;
that no geo-blockages will be imposed; or that the information will not be available for any another reason.
|
Qataris |
Non-Qataris |
Total |
|
Males |
Females |
Total |
Males |
Females |
Total |
Males |
Females |
Total |
| Employer |
2,800 |
298 |
3,098 |
3,694 |
378 |
4,072 |
6,494 |
676 |
7,170 |
| Own Account Worker |
91 |
0 |
91 |
1,124 |
0 |
1,124 |
1,215 |
0 |
1,215 |
| Employee |
70,701 |
50,400 |
121,101 |
1,720,986 |
329,461 |
2,050,447 |
1,791,687 |
379,861 |
2,171,548 |
| Total |
73,592 |
50,698 |
124,290 |
1,725,804 |
329,839 |
2,055,643 |
1,799,396 |
380,537 |
2,179,933 |
Source: Annual Bulletin of Labour Force Sample Survey 2023
ANNEXED NOTE
1. Technical Notes and Definitions
The data is taken from Labour Force Survey 2023 (yearly synthesis)
Sampling frame : Population Census 2020.
Sample size: 65,253 persons, in 10,560 households: 1- Qatari households; 2- Non-Qatari regular (non-collective) households;
3- Non-Qatari small collective households or labour gatherings (2 – 6 persons); 4- Non-Qatari large collective households or large labour gatherings (7 persons or more).
The collective households are a group of persons not related to each other and sharing living conditions in a residential unit, I.e. labour camps, students living boarding schools, nurses in hospitals… etc. The survey covered the small collective households (includes less than 7 persons) and large collective households (includes 7 persons or more).
Data Collection: The sample was divided into equal parts to collect data monthly. Each month 1/3 of the quarterly data were collected during the first two weeks of the month.
Reference period for the labour force data: the week prior to data collection day.
The survey does not cover short periods accommodation, i.e. hotels.
The present data includes active population, i.e. employed and unemployed. It does not include persons seeking work for the first time
Classification used: The International Classification of Status in Employment (ICSE)
a) Employers are those workers who, working on their own account or with one or a few partners, hold the type of job defined as a “self-employment” and have engaged one or more persons to work for them in their business as “employees”.
b) Own-account workers are those workers who, working on their own account or with one or more partners, hold the type of job defined as a “self-employment”, and have not engaged on a continuous basis any “employees”.
c) Employees are all those workers who hold the type of job defined as “paid employment”.
2. Institution which provides data
National Planning Council (NPC), formerly the Planning and Statistics Authority (PSA)
https://www.npc.qa/en/pages/default.aspx
https://www.npc.qa/ar/pages/default.aspx
3. Data availability
Annual and quarterly bulletins of Labour Force Surveys reports can be downloaded from NPC’s website, in PDF and/or Excel formats:
https://www.npc.qa/en/statistics/pages/subjectdetails.aspx#
Last date of access: October 2025.
GLMM and GRC cannot guarantee that the link to access the source will not change;
that the information will not be removed from the website it was obtained from;
that no geo-blockages will be imposed; or that the information will not be available for any another reason.
Keywords: Qatar, Employment, Female Employment, National Labour, Foreign Labour
|
Qataris |
Non-Qataris |
Total |
|
Males |
Females |
Total |
Males |
Females |
Total |
Males |
Females |
Total |
| Legislators, Senior Officials and Managers |
38 |
38 |
38 |
46 |
42 |
45 |
42 |
39 |
41 |
| Professionals |
38 |
38 |
38 |
43 |
39 |
42 |
42 |
39 |
41 |
| Technicians and Associate Professionals |
38 |
38 |
38 |
46 |
41 |
45 |
44 |
40 |
43 |
| Clerks |
39 |
38 |
39 |
45 |
41 |
44 |
42 |
39 |
41 |
| Service Workers and Shop and Market Sales Workers |
39 |
38 |
38 |
49 |
44 |
47 |
48 |
44 |
47 |
| Skilled Agricultural and Fishery Workers |
0 |
0 |
0 |
51 |
0 |
51 |
51 |
0 |
51 |
| Craft and Related Trades Workers |
39 |
0 |
39 |
50 |
47 |
50 |
50 |
47 |
50 |
| Plant and Machine Operators And Assemblers |
40 |
0 |
40 |
50 |
49 |
50 |
49 |
49 |
49 |
| Elementary Occupations |
39 |
38 |
39 |
51 |
50 |
51 |
50 |
50 |
50 |
| Total |
38 |
38 |
38 |
48 |
46 |
48 |
47 |
44 |
46 |
Source: Annual Bulletin of Labour Force Sample Survey 2023
ANNEXED NOTE
1. Technical Notes and Definitions
The data is taken from Labour Force Survey 2023 (yearly synthesis)
Sampling frame : Population Census 2020.
Sample size: 65,253 persons, in 10,560 households: 1- Qatari households; 2- Non-Qatari regular (non-collective) households;
3- Non-Qatari small collective households or labour gatherings (2 – 6 persons); 4- Non-Qatari large collective households or large labour gatherings (7 persons or more).
The collective households are a group of persons not related to each other and sharing living conditions in a residential unit, I.e. labour camps, students living boarding schools, nurses in hospitals… etc. The survey covered the small collective households (includes less than 7 persons) and large collective households (includes 7 persons or more).
Data Collection: The sample was divided into equal parts to collect data monthly. Each month 1/3 of the quarterly data were collected during the first two weeks of the month.
Reference period for the labour force data: the week prior to data collection day.
The survey does not cover short periods accommodation, i.e. hotels.
Hours worked during survey week: The number of hours actually worked during the survey week, including normal scheduled hours and additional hours (overtime).
“Average hours worked” is the average over all persons at work.
Classification of occupations used: ISCO-88.
2. Institution which provides data
National Planning Council (NPC), formerly the Planning and Statistics Authority (PSA)
https://www.npc.qa/en/pages/default.aspx
https://www.npc.qa/ar/pages/default.aspx
3. Data availability
Annual and quarterly bulletins of Labour Force Surveys reports can be downloaded from NPC’s website, in PDF and/or Excel formats:
https://www.npc.qa/en/statistics/pages/subjectdetails.aspx#
Last date of access: October 2025.
GLMM and GRC cannot guarantee that the link to access the source will not change;
that the information will not be removed from the website it was obtained from;
that no geo-blockages will be imposed; or that the information will not be available for any another reason.
Keywords: Qatar, Labour Market, Employment, Female Employment, National & Foreign Labour, National Labour, Foreign Labour, Work Conditions
|
Qataris |
Non-Qataris |
Total |
|
Males |
Females |
Total |
Males |
Females |
Total |
Males |
Females |
Total |
| Legislators, Senior Officials and Managers |
10,004 |
3,639 |
13,643 |
42,084 |
4,487 |
46,571 |
52,088 |
8,126 |
60,214 |
| Professionals |
18,108 |
22,357 |
40,465 |
188,466 |
97,628 |
286,094 |
206,574 |
119,985 |
326,559 |
| Technicians and Associate Professionals |
13,409 |
5,581 |
18,990 |
155,078 |
32,599 |
187,677 |
168,487 |
38,180 |
206,667 |
| Clerks |
23,696 |
16,214 |
39,910 |
110,887 |
40,732 |
151,619 |
134,583 |
56,946 |
191,529 |
| Service Workers and Shop and Market Sales Workers |
2,385 |
1,037 |
3,422 |
146,127 |
59,628 |
205,755 |
148,512 |
60,665 |
209,177 |
| Skilled Agricultural and Fishery Workers |
0 |
0 |
0 |
31,000 |
0 |
31,000 |
31,000 |
0 |
31,000 |
| Craft and Related Trades Workers |
2,603 |
0 |
2,603 |
536,599 |
826 |
537,425 |
539,202 |
826 |
540,028 |
| Plant and Machine Operators And Assemblers |
1,619 |
0 |
1,619 |
278,692 |
254 |
278,946 |
280,311 |
254 |
280,565 |
| Elementary Occupations |
1,005 |
439 |
1,444 |
202,788 |
88,945 |
291,733 |
203,793 |
89,384 |
293,177 |
| Total |
72,829 |
49,267 |
122,096 |
1,691,721 |
325,099 |
2,016,820 |
1,764,550 |
374,366 |
2,138,916 |
Source: Annual Bulletin of Labour Force Sample Survey 2023
ANNEXED NOTE
1. Technical Notes and Definitions
The data is taken from Labour Force Survey 2023 (yearly synthesis)
Sampling frame : Population Census 2020.
Sample size: 65,253 persons, in 10,560 households: 1- Qatari households; 2- Non-Qatari regular (non-collective) households;
3- Non-Qatari small collective households or labour gatherings (2 – 6 persons); 4- Non-Qatari large collective households or large labour gatherings (7 persons or more).
The collective households are a group of persons not related to each other and sharing living conditions in a residential unit, I.e. labour camps, students living boarding schools, nurses in hospitals… etc. The survey covered the small collective households (includes less than 7 persons) and large collective households (includes 7 persons or more).
Data Collection: The sample was divided into equal parts to collect data monthly. Each month 1/3 of the quarterly data were collected during the first two weeks of the month.
Reference period for the labour force data: the week prior to data collection day.
The survey does not cover short periods accommodation, i.e. hotels.
Employed population:
Persons aged 15 years an above, who during the week preceding the survey:
a) Perform a work for a wage, salary, profits or household gains, whether it was in cash or in kind.
b) Are temporarily not employed, however, they still have an official relation with their work
Classification of occupations used: ISCO-88.
2. Institution which provides data
National Planning Council (NPC), formerly the Planning and Statistics Authority (PSA)
https://www.npc.qa/en/pages/default.aspx
https://www.npc.qa/ar/pages/default.aspx
3. Data availability
Annual and quarterly bulletins of Labour Force Surveys reports can be downloaded from NPC’s website, in PDF and/or Excel formats:
https://www.npc.qa/en/statistics/pages/subjectdetails.aspx#
Last date of access: October 2025.
GLMM and GRC cannot guarantee that the link to access the source will not change;
that the information will not be removed from the website it was obtained from;
that no geo-blockages will be imposed; or that the information will not be available for any another reason.
Keywords: Qatar, Employment, Female Employment, National Labour, Foreign Labour
|
Qataris |
Non-Qataris |
Total |
|
Males |
Females |
Total |
Males |
Females |
Total |
Males |
Females |
Total |
| 2012 |
68.1 |
34.6 |
51.3 |
97.7 |
58.4 |
90.7 |
95.7 |
52.4 |
86.5 |
| 2013 |
70.0 |
34.7 |
52.1 |
97.9 |
59.0 |
91.1 |
96.2 |
53.1 |
87.2 |
| 2014 |
68.9 |
35.0 |
51.9 |
97.8 |
59.4 |
91.3 |
96.1 |
53.7 |
87.6 |
| 2015 |
68.6 |
36.1 |
52.1 |
97.8 |
64.9 |
92.1 |
96.3 |
58.7 |
88.6 |
| 2016 |
68.5 |
36.9 |
52.4 |
98.0 |
65.6 |
92.5 |
96.4 |
59.4 |
89.1 |
| 2017 |
68.2 |
36.7 |
52.2 |
97.6 |
64.5 |
91.8 |
96.1 |
58.5 |
88.4 |
| 2018 |
68.1 |
37.1 |
52.2 |
97.6 |
64.2 |
91.7 |
96.0 |
58.5 |
88.3 |
| 2019 |
67.9 |
37.6 |
52.4 |
97.5 |
63.7 |
91.5 |
96.0 |
58.2 |
88.2 |
| 2020 |
66.4 |
37.0 |
51.5 |
97.5 |
64.3 |
91.5 |
95.8 |
58.4 |
88.0 |
| 2021 |
66.7 |
42.0 |
54.2 |
97.2 |
64.2 |
90.8 |
95.4 |
59.6 |
87.4 |
| 2022 |
66.1 |
42.9 |
54.3 |
97.1 |
66.4 |
90.8 |
95.3 |
61.7 |
87.4 |
| 2023 |
66.0 |
43.5 |
54.4 |
97.3 |
68.4 |
91.1 |
95.4 |
63.5 |
87.7 |
Source: Annual Bulletins of Labour Force Sample Surveys 2017 and 2023
ANNEXED NOTE
1. Technical Notes and Definitions
Censuses:
Sampling frame of LFS 2022 and 2023: Population Census 2020.
Sample size: 65,253 persons, in 10,560 households: 1- Qatari households; 2- Non-Qatari regular (non-collective) households;
3- Non-Qatari small collective households or labour gatherings (2 – 6 persons); 4- Non-Qatari large collective households or large labour gatherings (7 persons or more).
The collective households are a group of persons not related to each other and sharing living conditions in a residential unit, I.e. labour camps, students living boarding
schools, nurses in hospitals… etc. The survey covered the small collective households (includes less than 7 persons) and large collective households (includes 7 persons or more).
Data Collection: The sample was divided into equal parts to collect data monthly. Each month 1/3 of the quarterly data were collected during the first two weeks of the month.
Reference period for the labour force data: the week prior to data collection day.
The present data includes active population, i.e. employed and unemployed. It does not include persons seeking work for the first time
2. Institution which provides data
National Planning Council (NPC), formerly the Planning and Statistics Authority (PSA)
https://www.npc.qa/en/pages/default.aspx
https://www.npc.qa/ar/pages/default.aspx
3. Data availability
Annual and quarterly bulletins of Labour Force Surveys reports can be downloaded from NPC’s website, in PDF and/or Excel formats:
https://www.npc.qa/en/statistics/pages/subjectdetails.aspx#
Last date of access: October 2025
GLMM and GRC cannot guarantee that the link to access the source will not change;
that the information will not be removed from the website it was obtained from;
that no geo-blockages will be imposed; or that the information will not be available for any another reason.
Keywords: Qatar, National & Foreign Labour, National Labour, Foreign Labour, Female Employment
|
|
Qataris |
Non-Qataris |
Total |
| 2015 |
Q1 |
98,454 |
1,716,244 |
1,814,698 |
| Q2 |
98,550 |
1,752,629 |
1,851,179 |
| Q3 |
99,143 |
1,764,494 |
1,863,637 |
| Q4 |
99,912 |
1,811,960 |
1,911,872 |
| 2016 |
Q1 |
100,632 |
1,900,882 |
2,001,514 |
| Q2 |
100,912 |
1,870,792 |
1,971,704 |
| Q3 |
101,187 |
1,972,517 |
2,073,704 |
| Q4 |
101,517 |
1,946,142 |
2,047,659 |
| 2017 |
Q1 |
101,844 |
2,004,114 |
2,105,958 |
| Q2 |
102,137 |
1,880,254 |
1,982,391 |
| Q3 |
102,448 |
1,943,297 |
2,045,745 |
| Q4 |
102,885 |
1,944,463 |
2,047,348 |
| 2018 |
Q1 |
104,430 |
1,972,116 |
2,076,546 |
| Q2 |
104,866 |
1,890,655 |
1,995,521 |
| Q3 |
105,808 |
2,017,178 |
2,122,986 |
| Q4 |
106,761 |
1,984,460 |
2,091,221 |
| 2019 |
Q1 |
107,725 |
2,040,780 |
2,148,505 |
| Q2 |
108,471 |
1,940,916 |
2,049,387 |
| Q3 |
108,658 |
1,946,356 |
2,055,014 |
| Q4 |
108,970 |
2,020,311 |
2,129,281 |
| 2020 |
Q1 |
109,665 |
2,063,050 |
2,172,715 |
| Q2 |
109,989 |
2,058,255 |
2,168,244 |
| Q3 |
110,681 |
2,015,815 |
2,126,496 |
| Q4 |
110,891 |
1,984,000 |
2,094,891 |
| 2021 |
Q1 |
110,877 |
1,940,667 |
2,051,544 |
| Q2 |
117,119 |
1,902,039 |
2,019,158 |
| Q3 |
117,890 |
1,847,256 |
1,965,146 |
| Q4 |
118,234 |
1,950,885 |
2,069,119 |
| 2022 |
Q1 |
118,345 |
1,966,616 |
2,084,961 |
| Q2 |
118,596 |
1,948,375 |
2,066,971 |
| Q3 |
118,759 |
1,982,204 |
2,100,963 |
| Q4 |
119,183 |
2,044,064 |
2,163,247 |
| 2023 |
Q1 |
120,394 |
2,070,551 |
2,190,945 |
| Q2 |
121,262 |
1,999,067 |
2,120,329 |
| Q3 |
123,120 |
2,031,657 |
2,154,777 |
| Q4 |
124,640 |
2,118,986 |
2,243,626 |
| 2024 |
Q1 |
125,402 |
2,147,884 |
2,278,286 |
| Q2 |
N.A. |
N.A. |
N.A. |
| Q3 |
N.A. |
N.A. |
N.A. |
| Q4 |
127,199 |
2,156,340 |
2,283,539 |
Source: Quarterly Bulletins of Labour Force Sample Surveys, Q1 2015-Q4 2024
ANNEXED NOTE
1. Technical Notes and Definitions
Censuses:
Reference period for census 2015: the night of 20 to 21 April 2015.
Reference period for census 2020: December 2020 (administrative records-based census).
Population of reference: all individuals (nationals and non-nationals) present within the State’s borders during time of reference, including in labour camps.
Labour force Sample Surveys:
The Statistics Authority conducted the first labor Force Sample Survey in 2001. Starting from 2006, the execution of these surveys came to be on annual basis.
Since 2013, data has been collected on a monthly basis and published every 3 months.
| Labour Force Sample Surveys |
Sampling frame |
Sample size |
Reference period/ periodicity of data collection |
| households |
individuals |
| 2015 |
Census 2010 |
6,953 |
44,756 |
Monthly |
| 2016 |
Census 2010 |
9,199 |
60,016 |
Monthly |
| 2017 |
Census 2015 |
9,200 |
60,278 |
Monthly |
| 2018 |
Census 2015 |
9,200 |
60,238 |
Monthly |
| 2019 |
Census 2015 |
8,445 |
54,948 |
Monthly |
| 2020 |
Census 2015 |
9,200 |
60,024 |
Monthly |
| 2021 |
Census 2015 |
9,200 |
59,997 |
Monthly |
| 2022 |
Census 2020 |
10,560 |
65,253 |
Monthly |
| 2023 |
Census 2020 |
10,560 |
65,253 |
Monthly |
| 2024 |
Census 2020 |
10,560 |
|
Monthly |
Reference period for the labor force data: the week prior to the reference date for data collection.
Population of reference: sample of Qatari and non-Qatari households of the following types: i. Qatari households; ii. Non-Qatari households;
iii. Small labor gatherings; iv. Large labor gatherings, present in Qatar on the night of survey/ periods of reference
The collective households are a group of persons not related to each other and sharing living conditions in a residential unit, I.e. labor camps, students living
nurses in hospitals… etc. The survey covered the small collective households (includes less than 7 persons) and large collective households (includes 7 persons or
The survey does not cover short periods accommodation, i.e. hotels.
Employed population:
Persons aged 15 years an above, who during the week preceding the survey:
a) Perform a work for a wage, salary, profits or household gains, whether it was in cash or in kind.
b) Are temporarily not employed, however, they still have an official relation with their work
2. Institution which provides data
National Planning Council (NPC), formerly the Planning and Statistics Authority (PSA)
https://www.npc.qa/en/pages/default.aspx
https://www.npc.qa/ar/pages/default.aspx
3. Data availability
Annual and quarterly bulletins of Labour Force Surveys reports can be downloaded from NPC’s website, in PDF and/or Excel formats:
https://www.npc.qa/en/statistics/pages/subjectdetails.aspx#
Last date of access: October 2025.
GLMM and GRC cannot guarantee that the link to access the source will not change;
that the information will not be removed from the website it was obtained from;
that no geo-blockages will be imposed; or that the information will not be available for any another reason.
Keywords: Qatar, Employment, Female Employment, National Labour, Foreign Labour
|
|
Qataris |
Non-Qataris |
Total |
|
|
Males |
Females |
Males |
Females |
Males |
Females |
| 2015 |
Q1 |
63,672 |
34,782 |
1,512,750 |
203,494 |
1,576,422 |
238,276 |
| Q2 |
63,701 |
34,849 |
1,537,381 |
215,248 |
1,601,082 |
250,097 |
| Q3 |
64,045 |
35,098 |
1,543,587 |
220,907 |
1,607,632 |
256,005 |
| Q4 |
64,401 |
35,511 |
1,589,420 |
222,540 |
1,653,821 |
258,051 |
| 2016 |
Q1 |
64,568 |
36,064 |
1,673,766 |
227,116 |
1,738,334 |
263,180 |
| Q2 |
64,680 |
36,232 |
1,656,326 |
214,466 |
1,721,006 |
250,698 |
| Q3 |
64,794 |
36,393 |
1,729,025 |
243,492 |
1,793,819 |
279,885 |
| Q4 |
64,980 |
36,537 |
1,702,775 |
243,367 |
1,767,755 |
279,904 |
| 2017 |
Q1 |
65,070 |
36,774 |
1,759,439 |
244,675 |
1,824,509 |
281,449 |
| Q2 |
65,208 |
36,929 |
1,653,030 |
227,224 |
1,718,238 |
264,153 |
| Q3 |
65,384 |
37,064 |
1,702,556 |
240,741 |
1,767,940 |
277,805 |
| Q4 |
65,550 |
37,335 |
1,703,538 |
240,925 |
1,769,088 |
278,260 |
| 2018 |
Q1 |
66,875 |
37,555 |
1,722,465 |
249,651 |
1,789,340 |
287,206 |
| Q2 |
67,032 |
37,834 |
1,672,953 |
217,702 |
1,739,985 |
255,536 |
| Q3 |
67,556 |
38,252 |
1,764,971 |
252,207 |
1,832,527 |
290,459 |
| Q4 |
68,058 |
38,703 |
1,729,354 |
255,106 |
1,797,412 |
293,809 |
| 2019 |
Q1 |
68,744 |
38,981 |
1,764,221 |
276,559 |
1,832,965 |
315,540 |
| Q2 |
69,084 |
39,387 |
1,705,781 |
235,135 |
1,774,865 |
274,522 |
| Q3 |
69,216 |
39,442 |
1,707,637 |
238,719 |
1,776,853 |
278,161 |
| Q4 |
69,360 |
39,610 |
1,777,385 |
242,926 |
1,846,745 |
282,536 |
| 2020 |
Q1 |
69,750 |
39,915 |
1,800,313 |
262,737 |
1,870,063 |
302,652 |
| Q2 |
69,930 |
40,059 |
1,805,323 |
252,932 |
1,875,253 |
292,991 |
| Q3 |
70,274 |
40,407 |
1,765,856 |
249,959 |
1,836,130 |
290,366 |
| Q4 |
70,443 |
40,448 |
1,740,484 |
243,516 |
1,810,927 |
283,964 |
| 2021 |
Q1 |
70,434 |
40,443 |
1,704,093 |
236,574 |
1,774,527 |
277,017 |
| Q2 |
70,687 |
46,432 |
1,640,278 |
261,761 |
1,710,965 |
308,193 |
| Q3 |
70,601 |
47,289 |
1,569,074 |
278,182 |
1,639,675 |
325,471 |
| Q4 |
70,753 |
47,481 |
1,660,611 |
290,274 |
1,731,364 |
337,755 |
| 2022 |
Q1 |
70,785 |
47,560 |
1,670,276 |
296,340 |
1,741,061 |
343,900 |
| Q2 |
70,854 |
47,742 |
1,659,116 |
289,259 |
1,729,970 |
337,001 |
| Q3 |
70,928 |
47,831 |
1,686,665 |
295,539 |
1,757,593 |
343,370 |
| Q4 |
71,112 |
48,071 |
1,716,029 |
328,035 |
1,787,141 |
376,106 |
| 2023 |
Q1 |
71,651 |
48,743 |
1,740,362 |
330,189 |
1,812,013 |
378,932 |
| Q2 |
72,077 |
49,185 |
1,676,401 |
322,666 |
1,748,478 |
371,851 |
| Q3 |
72,714 |
50,406 |
1,699,853 |
331,804 |
1,772,567 |
382,210 |
| Q4 |
73,445 |
51,195 |
1,786,620 |
332,366 |
1,860,065 |
383,561 |
| 2024 |
Q1 |
73,813 |
51,589 |
1,813,319 |
334,565 |
1,892,132 |
386,154 |
| Q2 |
N.A. |
N.A. |
N.A. |
N.A. |
N.A. |
N.A. |
| Q3 |
N.A. |
N.A. |
N.A. |
N.A. |
N.A. |
N.A. |
| Q4 |
74,745 |
52,454 |
1,819,721 |
336,619 |
1,894,466 |
389,073 |
Source: Quarterly Bulletins of Labour Force Sample Surveys, Q1 2015-Q4 2024
ANNEXED NOTE
1. Technical Notes and Definitions
Censuses:
Reference period for census 2015: the night of 20 to 21 April 2015.
Reference period for census 2020: December 2020 (administrative records-based census).
Population of reference: all individuals (nationals and non-nationals) present within the State’s borders during time of reference, including in labour camps.
Labour force Sample Surveys:
The Statistics Authority conducted the first labor Force Sample Survey in 2001. Starting from 2006, the execution of these surveys came to be on annual basis.
Since 2013, data has been collected on a monthly basis and published every 3 months.
| Labour Force Sample Surveys |
Sampling frame |
Sample size |
Reference period/ periodicity of data collection |
| households |
individuals |
| 2015 |
Census 2010 |
6,953 |
44,756 |
Monthly |
| 2016 |
Census 2010 |
9,199 |
60,016 |
Monthly |
| 2017 |
Census 2015 |
9,200 |
60,278 |
Monthly |
| 2018 |
Census 2015 |
9,200 |
60,238 |
Monthly |
| 2019 |
Census 2015 |
8,445 |
54,948 |
Monthly |
| 2020 |
Census 2015 |
9,200 |
60,024 |
Monthly |
| 2021 |
Census 2015 |
9,200 |
59,997 |
Monthly |
| 2022 |
Census 2020 |
10,560 |
65,253 |
Monthly |
| 2023 |
Census 2020 |
10,560 |
65,253 |
Monthly |
| 2024 |
Census 2020 |
10,560 |
|
Monthly |
Reference period for the labor force data: the week prior to the reference date for data collection.
Population of reference: sample of Qatari and non-Qatari households of the following types: i. Qatari households; ii. Non-Qatari households;
iii. Small labor gatherings; iv. Large labor gatherings, present in Qatar on the night of survey/ periods of reference
The collective households are a group of persons not related to each other and sharing living conditions in a residential unit, I.e. labor camps, students living
nurses in hospitals… etc. The survey covered the small collective households (includes less than 7 persons) and large collective households (includes 7 persons or
The survey does not cover short periods accommodation, i.e. hotels.
Employed population:
Persons aged 15 years an above, who during the week preceding the survey:
a) Perform a work for a wage, salary, profits or household gains, whether it was in cash or in kind.
b) Are temporarily not employed, however, they still have an official relation with their work
2. Institution which provides data
National Planning Council (NPC), formerly the Planning and Statistics Authority (PSA)
https://www.npc.qa/en/pages/default.aspx
https://www.npc.qa/ar/pages/default.aspx
3. Data availability
Annual and quarterly bulletins of Labour Force Surveys reports can be downloaded from NPC’s website, in PDF and/or Excel formats:
https://www.npc.qa/en/statistics/pages/subjectdetails.aspx#
Last date of access: October 2025.
GLMM and GRC cannot guarantee that the link to access the source will not change;
that the information will not be removed from the website it was obtained from;
that no geo-blockages will be imposed; or that the information will not be available for any another reason.
Keywords: Qatar, Employment, Female Employment, National Labour, Foreign Labour
|
Domestic Sector |
| Kuwaitis |
Non-Kuwaitis |
Total |
| Males |
Females |
Total |
Males |
Females |
Total |
Males |
Females |
Total |
| 2014 Q4 |
0 |
0 |
0 |
251,687 |
341,341 |
593,028 |
251,687 |
341,341 |
593,028 |
| 2015 Q1 |
0 |
0 |
0 |
278,705 |
376,684 |
655,389 |
278,705 |
376,684 |
655,389 |
| 2015 Q2 |
0 |
0 |
0 |
267,579 |
342,357 |
609,936 |
267,579 |
342,357 |
609,936 |
| 2015 Q3 |
0 |
0 |
0 |
289,126 |
378,043 |
667,169 |
289,126 |
378,043 |
667,169 |
| 2015 Q4 |
0 |
0 |
0 |
294,233 |
370,409 |
664,642 |
294,233 |
370,409 |
664,642 |
| 2016 Q1 |
0 |
0 |
0 |
299,339 |
362,775 |
662,114 |
299,339 |
362,775 |
662,114 |
| 2016 Q2 |
0 |
0 |
0 |
299,384 |
362,778 |
662,162 |
299,384 |
362,778 |
662,162 |
| 2016 Q3 |
0 |
0 |
0 |
306,121 |
363,341 |
669,462 |
306,121 |
363,341 |
669,462 |
| 2016 Q4 |
0 |
0 |
0 |
314,686 |
358,413 |
673,099 |
314,686 |
358,413 |
673,099 |
| 2017 Q1 |
0 |
0 |
0 |
320,073 |
352,561 |
672,634 |
320,073 |
352,561 |
672,634 |
| 2017 Q2 |
0 |
0 |
0 |
324,831 |
350,432 |
675,263 |
324,831 |
350,432 |
675,263 |
| 2017 Q3 |
0 |
0 |
0 |
331,901 |
345,721 |
677,622 |
331,901 |
345,721 |
677,622 |
| 2017 Q4 |
0 |
0 |
0 |
337,090 |
340,849 |
677,939 |
337,090 |
340,849 |
677,939 |
| 2018 Q1 |
0 |
0 |
0 |
342,707 |
340,808 |
683,515 |
342,707 |
340,808 |
683,515 |
| 2018 Q2 |
0 |
0 |
0 |
349,828 |
338,756 |
688,584 |
349,828 |
338,756 |
688,584 |
| 2018 Q3 |
0 |
0 |
0 |
349,988 |
338,967 |
688,955 |
349,988 |
338,967 |
688,955 |
| 2018 Q4 |
0 |
0 |
0 |
351,973 |
354,613 |
706,586 |
351,973 |
354,613 |
706,586 |
| 2019 Q1 |
0 |
0 |
0 |
353,572 |
361,797 |
715,369 |
353,572 |
361,797 |
715,369 |
| 2019 Q2 |
0 |
0 |
0 |
354,271 |
370,161 |
724,432 |
354,271 |
370,161 |
724,432 |
| 2019 Q3 |
0 |
0 |
0 |
353,801 |
373,990 |
727,791 |
353,801 |
373,990 |
727,791 |
| 2019 Q4 |
0 |
0 |
0 |
353,882 |
377,702 |
731,584 |
353,882 |
377,702 |
731,584 |
| 2020 Q1 |
0 |
0 |
0 |
347,923 |
370,141 |
718,064 |
347,923 |
370,141 |
718,064 |
| 2020 Q2 |
0 |
0 |
0 |
328,992 |
351,270 |
680,262 |
328,992 |
351,270 |
680,262 |
| 2020 Q3 |
0 |
0 |
0 |
329,374 |
343,885 |
673,259 |
329,374 |
343,885 |
673,259 |
| 2020 Q4 |
0 |
0 |
0 |
328,250 |
340,365 |
668,615 |
328,250 |
340,365 |
668,615 |
| 2021 Q1 |
0 |
0 |
0 |
320,313 |
330,954 |
651,267 |
320,313 |
330,954 |
651,267 |
| 2021 Q2 |
0 |
0 |
0 |
314,532 |
324,528 |
639,060 |
314,532 |
324,528 |
639,060 |
| 2021 Q3 |
0 |
0 |
0 |
301,105 |
307,125 |
608,230 |
301,105 |
307,125 |
608,230 |
| 2021 Q4 |
0 |
0 |
0 |
295,645 |
298,003 |
593,648 |
295,645 |
298,003 |
593,648 |
| 2022 Q1 |
0 |
0 |
0 |
305,860 |
307,320 |
613,180 |
305,860 |
307,320 |
613,180 |
| 2022 Q2 |
0 |
0 |
0 |
315,545 |
339,219 |
654,764 |
315,545 |
339,219 |
654,764 |
| 2022 Q3 |
0 |
0 |
0 |
333,995 |
377,349 |
711,344 |
333,995 |
377,349 |
711,344 |
| 2022 Q4 |
0 |
0 |
0 |
347,515 |
405,782 |
753,297 |
347,515 |
405,782 |
753,297 |
| 2023 Q1 |
0 |
0 |
0 |
357,121 |
423,062 |
780,183 |
357,121 |
423,062 |
780,183 |
| 2023 Q2 |
0 |
0 |
0 |
361,945 |
426,211 |
788,156 |
361,945 |
426,211 |
788,156 |
| 2023 Q3 |
0 |
0 |
0 |
363,839 |
425,931 |
789,770 |
363,839 |
425,931 |
789,770 |
| 2023 Q4 |
0 |
0 |
0 |
363,438 |
422,793 |
786,231 |
363,438 |
422,793 |
786,231 |
| 2024 Q1 |
0 |
0 |
0 |
365,562 |
423,471 |
789,033 |
365,562 |
423,471 |
789,033 |
| 2024 Q2 |
0 |
0 |
0 |
365,117 |
421,223 |
786,340 |
365,117 |
421,223 |
786,340 |
| 2024 Q3 |
0 |
0 |
0 |
328,589 |
411,261 |
739,850 |
328,589 |
411,261 |
739,850 |
| 2024 Q4 |
0 |
0 |
0 |
325,650 |
410,015 |
735,665 |
325,650 |
410,015 |
735,665 |
| 2025 Q1 |
0 |
0 |
0 |
330,091 |
415,055 |
745,146 |
330,091 |
415,055 |
745,146 |
Source: Central Statistical Bureau (CSB), Labour Market Information System (LMIS), Integrated Database
ANNEXED NOTE
1. Characteristics of data and definitions
Kuwait’s Labour Market Information System (KLMIS) was developed by the Central Statistical Bureau (CSB), in collaboration with relevant other government agencies.
https://lmis.csb.gov.kw/ar/Default.aspx;
https://lmis.csb.gov.kw/En/Docs/KLMI%20Report%20English%20-%20Final%20Version.pdf.
KLMIS’s Integrated database, updated on a quarterly basis,
tabulates basic data on nationals’ and foreign migrants’ employment,
taken from four administrative sources:
the Civil Service Commission (CSC) (public sector’s statistics);
the Public Authority for Civil Information (PACI) (public entities which are not included in the Civil Service Commission records);
the Public Authority for Manpower (PAM) (statistics on workers in the private sector);
Ministry of Interior (MoI) (domestic workers).
2015 Q4: no data. The estimate is the average of Q3 2015 and Q1 2016 values.
The employed persons are defined as individuals aged 15 years and over who:
a. Work for a company, the government, or any other person outside the family during the past seven days.
b. Worked for their own projects or for family projects in the last seven days.
c. Did not work in the last seven days, but they were absent from their usual work.
Information on LMIS’s data sources is taken from:
Al Daas, M. Labor Statistics for evidence-based policies,
https://www.iaos-isi.org/images/IAOS2017-19/2016Conference/P5C/Mona_Al_daas_paper.pdf, p. 3.
2. Institution which provides data
The Central Statistical Bureau (CSB)
https://www.csb.gov.kw/
https://www.csb.gov.kw/default_en
3. Data availability
Kuwait: Central Statistical Bureau. Integrated Database – LMIS
https://lmis.csb.gov.kw/
https://lmis.csb.gov.kw/default_En
Data are avalaible in Arabic and English, by quarter, for every year since 2014.
https://lmis.csb.gov.kw/IntegratedDataView_En
Last date of access: September 2025.
GLMM and GRC cannot guarantee that the link to access the source will not change;
that the information will not be removed from the website it was obtained from;
that no geo-blockages will be imposed; or that the information will not be available for any another reason.
Keywords: Kuwait, National Labour, Foreign Labour, Employment, Female Employment, Labour Market, National & Foreign Labour, Domestic Workers
|
Total employed |
| Kuwaitis |
Non-Kuwaitis |
Total |
| Males |
Females |
Total |
Males |
Females |
Total |
Males |
Females |
Total |
| 2014 Q4 |
150,835 |
187,462 |
338,297 |
1,529,403 |
497,363 |
2,026,766 |
1,680,238 |
684,825 |
2,365,063 |
| 2015 Q1 |
164,291 |
189,547 |
353,838 |
1,589,097 |
528,520 |
2,117,617 |
1,753,388 |
718,067 |
2,471,455 |
| 2015 Q2 |
154,276 |
188,141 |
342,417 |
1,578,655 |
494,371 |
2,073,026 |
1,732,931 |
682,512 |
2,415,443 |
| 2015 Q3 |
152,799 |
186,504 |
339,303 |
1,573,676 |
529,763 |
2,103,439 |
1,726,475 |
716,267 |
2,442,742 |
| 2015 Q4 |
154,415 |
190,207 |
344,622 |
1,645,827 |
527,346 |
2,173,173 |
1,800,242 |
717,553 |
2,517,795 |
| 2016 Q1 |
155,899 |
193,145 |
349,044 |
1,693,061 |
522,410 |
2,215,471 |
1,848,960 |
715,555 |
2,564,515 |
| 2016 Q2 |
155,671 |
193,121 |
348,792 |
1,727,126 |
524,487 |
2,251,613 |
1,882,797 |
717,608 |
2,600,405 |
| 2016 Q3 |
156,194 |
195,481 |
351,675 |
1,769,203 |
527,981 |
2,297,184 |
1,925,397 |
723,462 |
2,648,859 |
| 2016 Q4 |
157,249 |
197,557 |
354,806 |
1,761,703 |
521,971 |
2,283,674 |
1,918,952 |
719,528 |
2,638,480 |
| 2017 Q1 |
156,557 |
197,047 |
353,604 |
1,757,179 |
517,330 |
2,274,509 |
1,913,736 |
714,377 |
2,628,113 |
| 2017 Q2 |
158,099 |
200,755 |
358,854 |
1,808,391 |
517,089 |
2,325,480 |
1,966,490 |
717,844 |
2,684,334 |
| 2017 Q3 |
159,390 |
202,146 |
361,536 |
1,842,814 |
514,237 |
2,357,051 |
2,002,204 |
716,383 |
2,718,587 |
| 2017 Q4 |
159,805 |
205,755 |
365,560 |
1,836,328 |
510,336 |
2,346,664 |
1,996,133 |
716,091 |
2,712,224 |
| 2018 Q1 |
160,485 |
208,690 |
369,175 |
1,865,929 |
512,304 |
2,378,233 |
2,026,414 |
720,994 |
2,747,408 |
| 2018 Q2 |
162,395 |
212,409 |
374,804 |
1,876,191 |
509,245 |
2,385,436 |
2,038,586 |
721,654 |
2,760,240 |
| 2018 Q3 |
163,787 |
214,541 |
378,328 |
1,885,200 |
509,864 |
2,395,064 |
2,048,987 |
724,405 |
2,773,392 |
| 2018 Q4 |
164,437 |
216,215 |
380,652 |
1,902,238 |
528,068 |
2,430,306 |
2,066,675 |
744,283 |
2,810,958 |
| 2019 Q1 |
165,502 |
219,096 |
384,598 |
1,914,032 |
537,383 |
2,451,415 |
2,079,534 |
756,479 |
2,836,013 |
| 2019 Q2 |
166,301 |
222,452 |
388,753 |
1,929,921 |
547,352 |
2,477,273 |
2,096,222 |
769,804 |
2,866,026 |
| 2019 Q3 |
166,238 |
223,660 |
389,898 |
1,908,051 |
550,392 |
2,458,443 |
2,074,289 |
774,052 |
2,848,341 |
| 2019 Q4 |
167,816 |
227,020 |
394,836 |
1,912,140 |
557,928 |
2,470,068 |
2,079,956 |
784,948 |
2,864,904 |
| 2020 Q1 |
168,845 |
228,581 |
397,426 |
1,914,594 |
552,207 |
2,466,801 |
2,083,439 |
780,788 |
2,864,227 |
| 2020 Q2 |
168,489 |
228,172 |
396,661 |
1,870,680 |
531,932 |
2,402,612 |
2,039,169 |
760,104 |
2,799,273 |
| 2020 Q3 |
168,172 |
227,872 |
396,044 |
1,790,327 |
520,249 |
2,310,576 |
1,958,499 |
748,121 |
2,706,620 |
| 2020 Q4 |
172,253 |
234,422 |
406,675 |
1,742,551 |
512,558 |
2,255,109 |
1,914,804 |
746,980 |
2,661,784 |
| 2021 Q1 |
174,044 |
237,420 |
411,464 |
1,686,485 |
500,815 |
2,187,300 |
1,860,529 |
738,235 |
2,598,764 |
| 2021 Q2 |
176,995 |
242,589 |
419,584 |
1,655,723 |
493,656 |
2,149,379 |
1,832,718 |
736,245 |
2,568,963 |
| 2021 Q3 |
178,836 |
245,350 |
424,186 |
1,612,886 |
474,889 |
2,087,775 |
1,791,722 |
720,239 |
2,511,961 |
| 2021 Q4 |
181,818 |
248,310 |
430,128 |
1,580,274 |
465,706 |
2,045,980 |
1,762,092 |
714,016 |
2,476,108 |
| 2022 Q1 |
183,544 |
251,281 |
434,825 |
1,587,004 |
476,243 |
2,063,247 |
1,770,548 |
727,524 |
2,498,072 |
| 2022 Q2 |
185,155 |
253,404 |
438,559 |
1,619,907 |
512,163 |
2,132,070 |
1,805,062 |
765,567 |
2,570,629 |
| 2022 Q3 |
184,953 |
253,850 |
438,803 |
1,692,626 |
556,934 |
2,249,560 |
1,877,579 |
810,784 |
2,688,363 |
| 2022 Q4 |
186,845 |
255,802 |
442,647 |
1,754,166 |
593,474 |
2,347,640 |
1,941,011 |
849,276 |
2,790,287 |
| 2023 Q1 |
187,447 |
257,375 |
444,822 |
1,791,288 |
617,184 |
2,408,472 |
1,978,735 |
874,559 |
2,853,294 |
| 2023 Q2 |
188,204 |
258,860 |
447,064 |
1,807,111 |
622,919 |
2,430,030 |
1,995,315 |
881,779 |
2,877,094 |
| 2023 Q3 |
188,927 |
259,901 |
448,828 |
1,821,890 |
626,539 |
2,448,429 |
2,010,817 |
886,440 |
2,897,257 |
| 2023 Q4 |
191,235 |
262,803 |
454,038 |
1,835,690 |
629,499 |
2,465,189 |
2,026,925 |
892,302 |
2,919,227 |
| 2024 Q1 |
192,712 |
264,855 |
457,567 |
1,844,496 |
634,396 |
2,478,892 |
2,037,208 |
899,251 |
2,936,459 |
| 2024 Q2 |
188,432 |
263,163 |
451,595 |
1,842,125 |
633,640 |
2,475,765 |
2,030,557 |
896,803 |
2,927,360 |
| 2024 Q3 |
189,014 |
262,390 |
451,404 |
1,846,581 |
631,325 |
2,477,906 |
2,035,595 |
893,715 |
2,929,310 |
| 2024 Q4 |
189,417 |
260,171 |
449,588 |
1,863,501 |
636,452 |
2,499,953 |
2,052,918 |
896,623 |
2,949,541 |
| 2025 Q1 |
190,819 |
259,414 |
450,233 |
1,861,598 |
645,144 |
2,506,742 |
2,052,417 |
904,558 |
2,956,975 |
Source: Central Statistical Bureau (CSB), Labour Market Information System (LMIS), Integrated Database
ANNEXED NOTE
1. Characteristics of data and definitions
Kuwait’s Labour Market Information System (KLMIS) was developed by the Central Statistical Bureau (CSB), in collaboration with relevant other government agencies.
https://lmis.csb.gov.kw/ar/Default.aspx;
https://lmis.csb.gov.kw/En/Docs/KLMI%20Report%20English%20-%20Final%20Version.pdf.
KLMIS’s Integrated database, updated on a quarterly basis,
tabulates basic data on nationals’ and foreign migrants’ employment,
taken from four administrative sources:
the Civil Service Commission (CSC) (public sector’s statistics);
the Public Authority for Civil Information (PACI) (public entities which are not included in the Civil Service Commission records);
the Public Authority for Manpower (PAM) (statistics on workers in the private sector);
Ministry of Interior (MoI) (domestic workers).
The employed persons are defined as individuals aged 15 years and over who:
a. Work for a company, the government, or any other person outside the family during the past seven days.
b. Worked for their own projects or for family projects in the last seven days.
c. Did not work in the last seven days, but they were absent from their usual work.
Information on LMIS’s data sources is taken from:
Al Daas, M. Labor Statistics for evidence-based policies,
https://www.iaos-isi.org/images/IAOS2017-19/2016Conference/P5C/Mona_Al_daas_paper.pdf, p. 3.
2. Institution which provides data
The Central Statistical Bureau (CSB)
https://www.csb.gov.kw/
https://www.csb.gov.kw/default_en
3. Data availability
Kuwait: Central Statistical Bureau. Integrated Database – LMIS
https://lmis.csb.gov.kw/
https://lmis.csb.gov.kw/default_En
Data are avalaible in Arabic and English, by quarter, for every year since 2014.
https://lmis.csb.gov.kw/IntegratedDataView_En
Last date of access: September 2025.
GLMM and GRC cannot guarantee that the link to access the source will not change;
that the information will not be removed from the website it was obtained from;
that no geo-blockages will be imposed; or that the information will not be available for any another reason.
Keywords: Kuwait, National Labour, Foreign Labour, Employment, Female Employment, Labour Market, National & Foreign Labour, Domestic Workers
|
Private Sector |
| Kuwaitis |
Non-Kuwaitis |
Total |
| Males |
Females |
Total |
Males |
Females |
Total |
Males |
Females |
Total |
| 2014 Q4 |
34,436 |
39,996 |
74,432 |
1,236,328 |
119,407 |
1,355,735 |
1,270,764 |
159,403 |
1,430,167 |
| 2015 Q1 |
36,420 |
40,121 |
76,541 |
1,257,704 |
113,076 |
1,370,780 |
1,294,124 |
153,197 |
1,447,321 |
| 2015 Q2 |
36,085 |
39,223 |
75,308 |
1,254,153 |
113,030 |
1,367,183 |
1,290,238 |
152,253 |
1,442,491 |
| 2015 Q3 |
34,618 |
36,284 |
70,902 |
1,228,980 |
111,784 |
1,340,764 |
1,263,598 |
148,068 |
1,411,666 |
| 2015 Q4 |
34,219 |
36,020 |
70,239 |
1,294,088 |
115,922 |
1,410,010 |
1,328,307 |
151,942 |
1,480,249 |
| 2016 Q1 |
35,022 |
36,527 |
71,549 |
1,336,300 |
118,652 |
1,454,952 |
1,371,322 |
155,179 |
1,526,501 |
| 2016 Q2 |
34,735 |
36,122 |
70,857 |
1,369,171 |
120,500 |
1,489,671 |
1,403,906 |
156,622 |
1,560,528 |
| 2016 Q3 |
35,337 |
36,701 |
72,038 |
1,404,511 |
122,657 |
1,527,168 |
1,439,848 |
159,358 |
1,599,206 |
| 2016 Q4 |
35,032 |
36,228 |
71,260 |
1,387,950 |
121,137 |
1,509,087 |
1,422,982 |
157,365 |
1,580,347 |
| 2017 Q1 |
34,512 |
35,740 |
70,252 |
1,377,178 |
121,798 |
1,498,976 |
1,411,690 |
157,538 |
1,569,228 |
| 2017 Q2 |
35,180 |
36,438 |
71,618 |
1,423,887 |
123,896 |
1,547,783 |
1,459,067 |
160,334 |
1,619,401 |
| 2017 Q3 |
35,286 |
36,367 |
71,653 |
1,451,537 |
125,609 |
1,577,146 |
1,486,823 |
161,976 |
1,648,799 |
| 2017 Q4 |
35,185 |
36,053 |
71,238 |
1,440,153 |
126,629 |
1,566,782 |
1,475,338 |
162,682 |
1,638,020 |
| 2018 Q1 |
35,541 |
36,516 |
72,057 |
1,464,423 |
128,529 |
1,592,952 |
1,499,964 |
165,045 |
1,665,009 |
| 2018 Q2 |
36,062 |
37,028 |
73,090 |
1,468,959 |
128,550 |
1,597,509 |
1,505,021 |
165,578 |
1,670,599 |
| 2018 Q3 |
36,655 |
37,636 |
74,291 |
1,478,639 |
129,314 |
1,607,953 |
1,515,294 |
166,950 |
1,682,244 |
| 2018 Q4 |
36,011 |
36,949 |
72,960 |
1,493,772 |
131,817 |
1,625,589 |
1,529,783 |
168,766 |
1,698,549 |
| 2019 Q1 |
36,409 |
37,225 |
73,634 |
1,503,999 |
133,857 |
1,637,856 |
1,540,408 |
171,082 |
1,711,490 |
| 2019 Q2 |
36,613 |
37,224 |
73,837 |
1,519,336 |
135,787 |
1,655,123 |
1,555,949 |
173,011 |
1,728,960 |
| 2019 Q3 |
36,468 |
37,046 |
73,514 |
1,498,578 |
135,317 |
1,633,895 |
1,535,046 |
172,363 |
1,707,409 |
| 2019 Q4 |
36,341 |
36,892 |
73,233 |
1,501,843 |
138,987 |
1,640,830 |
1,538,184 |
175,879 |
1,714,063 |
| 2020 Q1 |
36,783 |
37,382 |
74,165 |
1,510,075 |
140,700 |
1,650,775 |
1,546,858 |
178,082 |
1,724,940 |
| 2020 Q2 |
36,328 |
36,975 |
73,303 |
1,485,401 |
139,434 |
1,624,835 |
1,521,729 |
176,409 |
1,698,138 |
| 2020 Q3 |
36,110 |
36,673 |
72,783 |
1,404,357 |
134,998 |
1,539,355 |
1,440,467 |
171,671 |
1,612,138 |
| 2020 Q4 |
36,352 |
36,629 |
72,981 |
1,361,740 |
132,393 |
1,494,133 |
1,398,092 |
169,022 |
1,567,114 |
| 2021 Q1 |
36,343 |
36,581 |
72,924 |
1,313,376 |
130,182 |
1,443,558 |
1,349,719 |
166,763 |
1,516,482 |
| 2021 Q2 |
36,508 |
36,507 |
73,015 |
1,289,774 |
130,011 |
1,419,785 |
1,326,282 |
166,518 |
1,492,800 |
| 2021 Q3 |
36,502 |
36,052 |
72,554 |
1,261,341 |
129,214 |
1,390,555 |
1,297,843 |
165,266 |
1,463,109 |
| 2021 Q4 |
36,597 |
35,625 |
72,222 |
1,233,774 |
128,828 |
1,362,602 |
1,270,371 |
164,453 |
1,434,824 |
| 2022 Q1 |
37,036 |
35,656 |
72,692 |
1,230,458 |
129,782 |
1,360,240 |
1,267,494 |
165,438 |
1,432,932 |
| 2022 Q2 |
36,997 |
35,324 |
72,321 |
1,253,533 |
132,862 |
1,386,395 |
1,290,530 |
168,186 |
1,458,716 |
| 2022 Q3 |
36,841 |
34,987 |
71,828 |
1,307,830 |
139,324 |
1,447,154 |
1,344,671 |
174,311 |
1,518,982 |
| 2022 Q4 |
37,063 |
34,770 |
71,833 |
1,354,090 |
146,461 |
1,500,551 |
1,391,153 |
181,231 |
1,572,384 |
| 2023 Q1 |
37,073 |
34,645 |
71,718 |
1,380,914 |
152,151 |
1,533,065 |
1,417,987 |
186,796 |
1,604,783 |
| 2023 Q2 |
36,964 |
34,442 |
71,406 |
1,392,176 |
155,436 |
1,547,612 |
1,429,140 |
189,878 |
1,619,018 |
| 2023 Q3 |
37,120 |
34,305 |
71,425 |
1,405,003 |
159,586 |
1,564,589 |
1,442,123 |
193,891 |
1,636,014 |
| 2023 Q4 |
37,751 |
35,079 |
72,830 |
1,418,668 |
165,457 |
1,584,125 |
1,456,419 |
200,536 |
1,656,955 |
| 2024 Q1 |
38,101 |
35,473 |
73,574 |
1,424,636 |
168,724 |
1,593,360 |
1,462,737 |
204,197 |
1,666,934 |
| 2024 Q2 |
38,537 |
35,604 |
74,141 |
1,422,623 |
170,161 |
1,592,784 |
1,461,160 |
205,765 |
1,666,925 |
| 2024 Q3 |
39,203 |
36,335 |
75,538 |
1,463,413 |
177,618 |
1,641,031 |
1,502,616 |
213,953 |
1,716,569 |
| 2024 Q4 |
38,705 |
35,036 |
73,741 |
1,482,606 |
183,388 |
1,665,994 |
1,521,311 |
218,424 |
1,739,735 |
| 2025 Q1 |
38,999 |
34,002 |
73,001 |
1,475,920 |
185,925 |
1,661,845 |
1,514,919 |
219,927 |
1,734,846 |
Source: Central Statistical Bureau (CSB), Labour Market Information System (LMIS), Integrated Database
ANNEXED NOTE
1. Characteristics of data and definitions
Kuwait’s Labour Market Information System (KLMIS) was developed by the Central Statistical Bureau (CSB), in collaboration with relevant other government agencies.
https://lmis.csb.gov.kw/ar/Default.aspx;
https://lmis.csb.gov.kw/En/Docs/KLMI%20Report%20English%20-%20Final%20Version.pdf.
KLMIS’s Integrated database, updated on a quarterly basis,
tabulates basic data on nationals’ and foreign migrants’ employment,
taken from four administrative sources:
the Civil Service Commission (CSC) (public sector’s statistics);
the Public Authority for Civil Information (PACI) (public entities which are not included in the Civil Service Commission records);
the Public Authority for Manpower (PAM) (statistics on workers in the private sector);
Ministry of Interior (MoI) (domestic workers).
The employed persons are defined as individuals aged 15 years and over who:
a. Work for a company, the government, or any other person outside the family during the past seven days.
b. Worked for their own projects or for family projects in the last seven days.
c. Did not work in the last seven days, but they were absent from their usual work.
Information on LMIS’s data sources is taken from:
Al Daas, M. Labor Statistics for evidence-based policies,
https://www.iaos-isi.org/images/IAOS2017-19/2016Conference/P5C/Mona_Al_daas_paper.pdf, p. 3.
2. Institution which provides data
The Central Statistical Bureau (CSB)
https://www.csb.gov.kw/
https://www.csb.gov.kw/default_en
3. Data availability
Kuwait: Central Statistical Bureau. Integrated Database – LMIS
https://lmis.csb.gov.kw/
https://lmis.csb.gov.kw/default_En
Data are avalaible in Arabic and English, by quarter, for every year since 2014.
https://lmis.csb.gov.kw/IntegratedDataView_En
Last date of access: September 2025.
GLMM and GRC cannot guarantee that the link to access the source will not change;
that the information will not be removed from the website it was obtained from; that no geo-blockages will be imposed; or that the information will not be available for any another reason.
Keywords: Kuwait, National Labour, Foreign Labour, Employment, Female Employment, Labour Market, National & Foreign Labour, Domestic Workers
|
Government Sector |
| Kuwaitis |
Non-Kuwaitis |
Total |
| Males |
Females |
Total |
Males |
Females |
Total |
Males |
Females |
Total |
| 2014 Q4 |
116,399 |
147,466 |
263,865 |
41,388 |
36,615 |
78,003 |
157,787 |
184,081 |
341,868 |
| 2015 Q1 |
127,871 |
149,426 |
277,297 |
52,688 |
38,760 |
91,448 |
180,559 |
188,186 |
368,745 |
| 2015 Q2 |
118,191 |
148,918 |
267,109 |
56,923 |
38,984 |
95,907 |
175,114 |
187,902 |
363,016 |
| 2015 Q3 |
118,181 |
150,220 |
268,401 |
55,570 |
39,936 |
95,506 |
173,751 |
190,156 |
363,907 |
| 2015 Q4 |
120,196 |
154,187 |
274,383 |
57,506 |
41,015 |
98,521 |
177,702 |
195,202 |
372,904 |
| 2016 Q1 |
120,877 |
156,618 |
277,495 |
57,422 |
40,983 |
98,405 |
178,299 |
197,601 |
375,900 |
| 2016 Q2 |
120,936 |
156,999 |
277,935 |
58,571 |
41,209 |
99,780 |
179,507 |
198,208 |
377,715 |
| 2016 Q3 |
120,857 |
158,780 |
279,637 |
58,571 |
41,983 |
100,554 |
179,428 |
200,763 |
380,191 |
| 2016 Q4 |
122,217 |
161,329 |
283,546 |
59,067 |
42,421 |
101,488 |
181,284 |
203,750 |
385,034 |
| 2017 Q1 |
122,045 |
161,307 |
283,352 |
59,928 |
42,971 |
102,899 |
181,973 |
204,278 |
386,251 |
| 2017 Q2 |
122,919 |
164,317 |
287,236 |
59,673 |
42,761 |
102,434 |
182,592 |
207,078 |
389,670 |
| 2017 Q3 |
124,104 |
165,779 |
289,883 |
59,376 |
42,907 |
102,283 |
183,480 |
208,686 |
392,166 |
| 2017 Q4 |
124,620 |
169,702 |
294,322 |
59,085 |
42,858 |
101,943 |
183,705 |
212,560 |
396,265 |
| 2018 Q1 |
124,944 |
172,174 |
297,118 |
58,799 |
42,967 |
101,766 |
183,743 |
215,141 |
398,884 |
| 2018 Q2 |
126,333 |
175,381 |
301,714 |
57,404 |
41,939 |
99,343 |
183,737 |
217,320 |
401,057 |
| 2018 Q3 |
127,132 |
176,905 |
304,037 |
56,573 |
41,583 |
98,156 |
183,705 |
218,488 |
402,193 |
| 2018 Q4 |
128,426 |
179,266 |
307,692 |
56,493 |
41,638 |
98,131 |
184,919 |
220,904 |
405,823 |
| 2019 Q1 |
129,093 |
181,871 |
310,964 |
56,461 |
41,729 |
98,190 |
185,554 |
223,600 |
409,154 |
| 2019 Q2 |
129,688 |
185,228 |
314,916 |
56,314 |
41,404 |
97,718 |
186,002 |
226,632 |
412,634 |
| 2019 Q3 |
129,770 |
186,614 |
316,384 |
55,672 |
41,085 |
96,757 |
185,442 |
227,699 |
413,141 |
| 2019 Q4 |
131,475 |
190,128 |
321,603 |
56,415 |
41,239 |
97,654 |
187,890 |
231,367 |
419,257 |
| 2020 Q1 |
132,062 |
191,199 |
323,261 |
56,596 |
41,366 |
97,962 |
188,658 |
232,565 |
421,223 |
| 2020 Q2 |
132,161 |
191,197 |
323,358 |
56,287 |
41,228 |
97,515 |
188,448 |
232,425 |
420,873 |
| 2020 Q3 |
132,062 |
191,199 |
323,261 |
56,596 |
41,366 |
97,962 |
188,658 |
232,565 |
421,223 |
| 2020 Q4 |
135,901 |
197,793 |
333,694 |
52,561 |
39,800 |
92,361 |
188,462 |
237,593 |
426,055 |
| 2021 Q1 |
137,701 |
200,839 |
338,540 |
52,796 |
39,679 |
92,475 |
190,497 |
240,518 |
431,015 |
| 2021 Q2 |
140,487 |
206,082 |
346,569 |
51,417 |
39,117 |
90,534 |
191,904 |
245,199 |
437,103 |
| 2021 Q3 |
142,334 |
209,298 |
351,632 |
50,440 |
38,550 |
88,990 |
192,774 |
247,848 |
440,622 |
| 2021 Q4 |
145,221 |
212,685 |
357,906 |
50,855 |
38,875 |
89,730 |
196,076 |
251,560 |
447,636 |
| 2022 Q1 |
146,508 |
215,625 |
362,133 |
50,686 |
39,141 |
89,827 |
197,194 |
254,766 |
451,960 |
| 2022 Q2 |
148,158 |
218,080 |
366,238 |
50,829 |
40,082 |
90,911 |
198,987 |
258,162 |
457,149 |
| 2022 Q3 |
148,112 |
218,863 |
366,975 |
50,801 |
40,261 |
91,062 |
198,913 |
259,124 |
458,037 |
| 2022 Q4 |
149,782 |
221,032 |
370,814 |
52,561 |
41,231 |
93,792 |
202,343 |
262,263 |
464,606 |
| 2023 Q1 |
150,374 |
222,730 |
373,104 |
53,253 |
41,971 |
95,224 |
203,627 |
264,701 |
468,328 |
| 2023 Q2 |
151,240 |
224,418 |
375,658 |
52,990 |
41,272 |
94,262 |
204,230 |
265,690 |
469,920 |
| 2023 Q3 |
151,807 |
225,596 |
377,403 |
53,048 |
41,022 |
94,070 |
204,855 |
266,618 |
471,473 |
| 2023 Q4 |
153,484 |
227,724 |
381,208 |
53,584 |
41,249 |
94,833 |
207,068 |
268,973 |
476,041 |
| 2024 Q1 |
154,611 |
229,382 |
383,993 |
54,298 |
42,201 |
96,499 |
208,909 |
271,583 |
480,492 |
| 2024 Q2 |
149,895 |
227,559 |
377,454 |
54,385 |
42,256 |
96,641 |
204,280 |
269,815 |
474,095 |
| 2024 Q3 |
149,811 |
226,055 |
375,866 |
54,579 |
42,446 |
97,025 |
204,390 |
268,501 |
472,891 |
| 2024 Q4 |
150,712 |
225,135 |
375,847 |
55,245 |
43,049 |
98,294 |
205,957 |
268,184 |
474,141 |
| 2025 Q1 |
151,820 |
225,412 |
377,232 |
55,587 |
44,164 |
99,751 |
207,407 |
269,576 |
476,983 |
Source: Central Statistical Bureau (CSB), Labour Market Information System (LMIS), Integrated Database
ANNEXED NOTE
1. Characteristics of data and definitions
Kuwait’s Labour Market Information System (KLMIS) was developed by the Central Statistical Bureau (CSB), in collaboration with relevant other government agencies.
https://lmis.csb.gov.kw/ar/Default.aspx;
https://lmis.csb.gov.kw/En/Docs/KLMI%20Report%20English%20-%20Final%20Version.pdf.
KLMIS’s Integrated database, updated on a quarterly basis,
tabulates basic data on nationals’ and foreign migrants’ employment,
taken from four administrative sources:
the Civil Service Commission (CSC) (public sector’s statistics);
the Public Authority for Civil Information (PACI) (public entities which are not included in the Civil Service Commission records);
the Public Authority for Manpower (PAM) (statistics on workers in the private sector);
Ministry of Interior (MoI) (domestic workers).
The employed persons are defined as individuals aged 15 years and over who:
a. Work for a company, the government, or any other person outside the family during the past seven days.
b. Worked for their own projects or for family projects in the last seven days.
c. Did not work in the last seven days, but they were absent from their usual work.
Information on LMIS’s data sources is taken from:
Al Daas, M. Labor Statistics for evidence-based policies,
https://www.iaos-isi.org/images/IAOS2017-19/2016Conference/P5C/Mona_Al_daas_paper.pdf, p. 3.
2. Institution which provides data
The Central Statistical Bureau (CSB)
https://www.csb.gov.kw/
https://www.csb.gov.kw/default_en
3. Data availability
Kuwait: Central Statistical Bureau. Integrated Database – LMIS
https://lmis.csb.gov.kw/
https://lmis.csb.gov.kw/default_En
Data are avalaible in Arabic and English, by quarter, for every year since 2014.
https://lmis.csb.gov.kw/IntegratedDataView_En
Last date of access: September 2025.
GLMM and GRC cannot guarantee that the link to access the source will not change;
that the information will not be removed from the website it was obtained from; that no geo-blockages will be imposed; or that the information will not be available for any another reason.
Keywords: Kuwait, National Labour, Foreign Labour, Employment, Female Employment, Labour Market, National & Foreign Labour, Domestic Workers
|
2015 |
2016 |
2017 |
2018 |
2019 |
2020 |
2021 |
2022 |
2023 |
2024 |
Q1 2025 |
| Males |
Females |
Males |
Females |
Males |
Females |
Males |
Females |
Males |
Females |
Males |
Females |
Males |
Females |
Males |
Females |
Males |
Females |
Males |
Females |
Males |
Females |
| India |
184,719 |
84,383 |
217,191 |
83,841 |
221,905 |
70,620 |
230,313 |
79,334 |
238,582 |
98,499 |
225,555 |
98,526 |
210,135 |
92,237 |
213,081 |
89,605 |
249,719 |
101,140 |
245,318 |
100,214 |
212,980 |
98,522 |
| Philippines |
858 |
114,909 |
999 |
154,166 |
959 |
163,133 |
859 |
139,581 |
851 |
147,929 |
819 |
147,090 |
779 |
137,155 |
937 |
161,104 |
1,104 |
200,300 |
945 |
164,218 |
740 |
131,360 |
| Bangladesh |
52,289 |
1,338 |
18,618 |
1,026 |
74,429 |
1,079 |
91,880 |
1,205 |
87,746 |
1,105 |
77,355 |
903 |
78,913 |
932 |
76,900 |
821 |
80,820 |
832 |
86,723 |
859 |
85,682 |
887 |
| Sri Lanka |
17,330 |
60,679 |
51,540 |
56,322 |
16,815 |
51,517 |
15,936 |
56,252 |
16,266 |
64,734 |
15,635 |
60,618 |
15,473 |
58,112 |
15,456 |
57,314 |
20,335 |
81,793 |
21,786 |
101,007 |
21,182 |
110,939 |
| Ethiopia |
3,159 |
43,664 |
1,557 |
28,653 |
1,288 |
19,520 |
1,230 |
16,864 |
1,204 |
21,177 |
1,077 |
16,773 |
998 |
13,397 |
888 |
9,026 |
860 |
7,072 |
843 |
6,023 |
643 |
4,892 |
| Nepal |
2,567 |
19,203 |
1,981 |
20,110 |
1,716 |
22,715 |
1,479 |
23,872 |
1,186 |
18,648 |
995 |
14,053 |
940 |
12,597 |
929 |
12,754 |
1,098 |
25,097 |
1,169 |
37,916 |
1,237 |
53,920 |
| Indonesia |
33 |
8,873 |
24 |
4,272 |
19 |
3,708 |
14 |
3,232 |
12 |
2,903 |
12 |
2,371 |
10 |
2,533 |
9 |
2,232 |
9 |
1,975 |
8 |
1,823 |
8 |
1,657 |
| Ghana |
296 |
4,337 |
483 |
7,577 |
320 |
4,782 |
205 |
2,134 |
|
|
|
|
|
|
|
|
|
|
|
|
|
|
| Madagascar |
6 |
1,970 |
3 |
1,784 |
12 |
5,437 |
11 |
4,356 |
6 |
2,578 |
3 |
1,711 |
|
|
|
|
|
|
|
|
|
|
| Pakistan |
1,972 |
26 |
1,953 |
26 |
|
|
|
|
1,815 |
12 |
|
|
1,619 |
9 |
1,533 |
6 |
1,523 |
6 |
1,470 |
5 |
|
|
| Ivory Coast |
|
|
|
|
231 |
2,019 |
285 |
3,816 |
246 |
3,786 |
179 |
2,175 |
159 |
1,230 |
|
|
|
|
|
|
|
|
| Benin |
|
|
|
|
|
|
|
|
|
|
100 |
2,181 |
96 |
1,777 |
149 |
2,687 |
217 |
4,605 |
241 |
5,978 |
284 |
9,124 |
| Sudan |
|
|
|
|
|
|
|
|
|
|
|
|
|
|
1,485 |
4 |
|
|
|
|
1,353 |
7 |
| Mali |
|
|
|
|
|
|
|
|
|
|
|
|
|
|
|
|
1,366 |
555 |
1,690 |
715 |
2,007 |
1,370 |
| Other countries |
4,350 |
2,975 |
5,035 |
5,001 |
7,137 |
5,902 |
7,616 |
8,110 |
6,357 |
8,790 |
7,262 |
4,869 |
5,410 |
4,549 |
4,178 |
3,666 |
4,894 |
2,836 |
4,924 |
2,465 |
3,975 |
2,377 |
| Total |
267,579 |
342,357 |
299,384 |
362,778 |
324,831 |
350,432 |
349,828 |
338,756 |
354,271 |
370,161 |
328,992 |
351,270 |
314,532 |
324,528 |
315,545 |
339,219 |
361,945 |
426,211 |
365,117 |
421,223 |
330,091 |
415,055 |
Source: Central Statistical Bureau (CSB), Labour Market Information System (LMIS), Integrated Database
ANNEXED NOTE
1. Characteristics of data and definitions
Kuwait’s Labour Market Information System (KLMIS) was developed by the Central Statistical Bureau (CSB),
in collaboration with relevant other government agencies.
https://lmis.csb.gov.kw/ar/Default.aspx;
https://lmis.csb.gov.kw/En/Docs/KLMI%20Report%20English%20-%20Final%20Version.pdf.
KLMIS’s Integrated database, updated on a quarterly basis,
tabulates basic data on nationals’ and foreign migrants’ employment,
taken from four administrative sources:
the Civil Service Commission (CSC) (public sector’s statistics);
the Public Authority for Civil Information (PACI) (public entities which are not included in the Civil Service Commission records);
the Public Authority for Manpower (PAM) (statistics on workers in the private sector);
Ministry of Interior (MoI) (domestic workers).
Information on LMIS’s data sources is taken from:
Al Daas, M. Labor Statistics for evidence-based policies,
https://www.iaos-isi.org/images/IAOS2017-19/2016Conference/P5C/Mona_Al_daas_paper.pdf, p. 3.
2. Institution which provides data
The Central Statistical Bureau (CSB)
https://www.csb.gov.kw/
https://www.csb.gov.kw/default_en
3. Period of data coverage
30/06, given year, unless stated otherwise
4. Data availability
Kuwait: Central Statistical Bureau. Integrated Database – LMIS
https://lmis.csb.gov.kw/
https://lmis.csb.gov.kw/default_En
Data are avalaible in Arabic and English, by quarter, for every year since 2014.
https://lmis.csb.gov.kw/IntegratedDataView_En
Last date of access: September 2025.
GLMM and GRC cannot guarantee that the link to access the source will not change;
that the information will not be removed from the website it was obtained from;
that no geo-blockages will be imposed; or that the information will not be available for any another reason.
Keywords: Kuwait, Domestic Workers, Foreign Labour, Employment, Labour Market, India, Bangladesh, Pakistan, Philippines, Nepal, Sri Lanka, Kenya, Ethiopia, Madagascar, Ivory Coast, Benin, Sudan
|
Q2 2015 |
Q2 2016 |
Q2 2017 |
Q2 2018 |
Q2 2019 |
Q2 2020 |
Q2 2021 |
Q2 2022 |
Q2 2023 |
Q2 2024 |
Q1 2025 |
| India |
269,102 |
301,032 |
292,525 |
309,647 |
337,081 |
324,081 |
302,372 |
302,686 |
350,859 |
345,532 |
311,502 |
| Philippines |
115,767 |
155,165 |
164,092 |
140,440 |
148,780 |
147,909 |
137,934 |
162,041 |
201,404 |
165,163 |
132,100 |
| Bangladesh |
53,627 |
52,566 |
75,508 |
93,085 |
88,851 |
78,258 |
79,845 |
77,721 |
81,652 |
87,582 |
86,569 |
| Sri Lanka |
78,009 |
74,940 |
68,332 |
72,188 |
81,000 |
76,253 |
73,585 |
72,770 |
102,128 |
122,793 |
132,121 |
| Ethiopia |
46,823 |
30,210 |
20,808 |
18,094 |
22,381 |
17,850 |
14,395 |
9,914 |
7,932 |
6,866 |
5,535 |
| Nepal |
21,770 |
22,091 |
24,431 |
25,351 |
19,834 |
15,048 |
13,537 |
13,683 |
26,195 |
39,085 |
55,157 |
| Indonesia |
8,906 |
4,296 |
3,727 |
3,246 |
2,915 |
2,383 |
2,543 |
2,241 |
1,984 |
1,831 |
1,665 |
| Ghana |
4,633 |
8,060 |
5,102 |
2,339 |
|
|
|
|
|
|
|
| Madagascar |
1,976 |
1,787 |
5,449 |
4,367 |
2,584 |
1,714 |
|
|
|
|
|
| Pakistan |
1,998 |
1,979 |
|
|
1,827 |
|
1,628 |
1,539 |
1,529 |
1,475 |
|
| Ivory Coast |
|
|
2,250 |
4,101 |
4,032 |
2,354 |
1,389 |
|
|
|
|
| Benin |
|
|
|
|
|
2,281 |
1,873 |
2,836 |
4,822 |
6,219 |
9,408 |
| Sudan |
|
|
|
|
|
|
|
1,489 |
|
|
1,360 |
| Mali |
|
|
|
|
|
|
|
|
1,921 |
2,405 |
3,377 |
| Other countries |
7,325 |
10,036 |
13,039 |
15,726 |
15,147 |
12,131 |
9,959 |
7,844 |
7,730 |
7,389 |
6,352 |
| Total |
609,936 |
662,162 |
675,263 |
688,584 |
724,432 |
680,262 |
639,060 |
654,764 |
788,156 |
786,340 |
745,146 |
Source: Central Statistical Bureau (CSB), Labour Market Information System (LMIS), Integrated Database
ANNEXED NOTE
1. Characteristics of data and definitions
Kuwait’s Labour Market Information System (KLMIS) was developed by the Central Statistical Bureau (CSB),
in collaboration with relevant other government agencies.
https://lmis.csb.gov.kw/ar/Default.aspx;
https://lmis.csb.gov.kw/En/Docs/KLMI%20Report%20English%20-%20Final%20Version.pdf.
KLMIS’s Integrated database, updated on a quarterly basis,
tabulates basic data on nationals’ and foreign migrants’ employment,
the Civil Service Commission (CSC) (public sector’s statistics);
the Public Authority for Civil Information (PACI) (public entities which are not included in the Civil Service Commission records);
the Public Authority for Manpower (PAM) (statistics on workers in the private sector);
Ministry of Interior (MoI) (domestic workers).
Information on LMIS’s data sources is taken from:
Al Daas, M. Labor Statistics for evidence-based policies,
https://www.iaos-isi.org/images/IAOS2017-19/2016Conference/P5C/Mona_Al_daas_paper.pdf, p. 3.
2. Institution which provides data
The Central Statistical Bureau (CSB)
https://www.csb.gov.kw/
https://www.csb.gov.kw/default_en
3. Period of data coverage
30/06, given year, unless stated otherwise
4. Data availability
Kuwait: Central Statistical Bureau. Integrated Database – LMIS
https://lmis.csb.gov.kw/
https://lmis.csb.gov.kw/default_En
Data are avalaible in Arabic and English, by quarter, for every year since 2014.
https://lmis.csb.gov.kw/IntegratedDataView_En
Last date of access: September 2025.
GLMM and GRC cannot guarantee that the link to access the source will not change;
that the information will not be removed from the website it was obtained from;
that no geo-blockages will be imposed; or that the information will not be available for any another reason.
Keywords: Kuwait, Domestic Workers, Foreign Labour, Employment, Labour Market, India, Bangladesh, Pakistan, Philippines, Nepal, Sri Lanka, Kenya, Ethiopia, Madagascar, Ivory Coast, Benin, Sudan
|
Males |
Females |
Total |
| Turkey |
22,127 |
3,711 |
25,838 |
| Azerbaijan |
411 |
207 |
618 |
| Cyprus |
108 |
49 |
157 |
| Armenia |
47 |
46 |
93 |
| Georgia |
51 |
29 |
80 |
| Other |
6 |
3 |
9 |
| West Asia (non-Arab states) |
22,750 |
4,045 |
26,795 |
| Uzbekistan |
526 |
320 |
846 |
| Kyrgyzstan |
424 |
305 |
729 |
| Kazakhstan |
362 |
343 |
705 |
| Tajikistan |
336 |
260 |
596 |
| Turkmenistan |
106 |
141 |
247 |
| Central Asia |
1,754 |
1,369 |
3,123 |
| Bangladesh |
1,950,943 |
165,249 |
2,116,192 |
| India |
1,712,780 |
171,696 |
1,884,476 |
| Pakistan |
1,647,704 |
166,974 |
1,814,678 |
| Nepal |
293,049 |
4,512 |
297,561 |
| Afghanistan |
94,628 |
37,654 |
132,282 |
| Sri Lanka |
50,305 |
34,489 |
84,794 |
| British Indian Ocean Territory |
357 |
110 |
467 |
| Iran |
137 |
107 |
244 |
| Maldives |
135 |
58 |
193 |
| Other |
1 |
|
|
| South Asia |
5,750,039 |
580,849 |
6,330,887 |
| Philippines |
274,305 |
451,588 |
725,893 |
| Indonesia |
41,351 |
133,991 |
175,342 |
| Myanmar |
89,850 |
73,867 |
163,717 |
| Malaysia |
2,320 |
4,335 |
6,655 |
| Thailand |
3,422 |
2,832 |
6,254 |
| VietNam |
531 |
2,185 |
2,716 |
| Singapore |
239 |
155 |
394 |
| Cambodia |
185 |
106 |
291 |
| Brunei Darussalam |
80 |
84 |
164 |
| Lao Peoples Democratic Republic |
15 |
2 |
17 |
| Other |
1 |
|
1 |
| South-East Asia |
412,299 |
669,145 |
1,081,444 |
| China |
13,009 |
1,610 |
14,619 |
| Korea (the Republic of) |
1,051 |
651 |
1,702 |
| Taiwan (Province of China) |
542 |
489 |
1,031 |
| Japan |
314 |
191 |
505 |
| Mongolia |
4 |
7 |
11 |
| Others |
4 |
3 |
7 |
| East Asia |
14,924 |
2,951 |
17,875 |
| Total |
6,201,766 |
1,258,359 |
7,460,124 |
Source: GAStat, Saudi Arabia census 2022
ANNEXED NOTE
1. Technical Notes and Definitions
GLMM’s retabulation and partial redistribution of census data “Non-Saudi population by nationality and gender”
https://www.stats.gov.sa/en/statistics?index=119025#
Source of data: Saudi census 2022
Date of reference: 10 May 2022
Population of reference: Families and individual citizens and residents within the Kingdom, regardless of the status of their identification documents.
Visitors for Hajj, Umrah and tourism are excluded from the census.
Methodology:
The first phase of the 2020 census began on 3 February 2020 (enumeration of buildings and households). Census 2022 used geospatial data, including satellite images, electricity consumption and mobile phone data, to improve the accuracy and geographic coverage of address canvassing.
The second stage (“actual enumeration”) was due to start on the original reference date (17 March 2020), but was suspended by the outbreak of the COVID-19 crisis. This stage was conducted in October 2021.
The 2022 census used a combined methodology – administrative records, fieldwork and digital self-enumeration.
Household data were collected from e-portals of self-enumeration (on residents’ mobile devices, laptops or personal computers, or self-enumeration stations/kiosks, located in shopping centers).
The digital self-enumeration process was complemented by face-to-face interviews, using digital tablets.
Census 2022 used a de jure approach: enumerating people according to their usual place of residence.
Administrative data from multiple sources was used to cross-validate collected census data.
Census 2022 was designed as a launchpad for several new secure statistical data registers for population, housing, and businesses.
Portal of the Saudi census:
https://www.stats.gov.sa/en/statistics?index=119025#
Population data for 2010-22 were revised and backcasted, based on 2022 population census and past years’ administrative data.
Technical note on backcasting:
https://database.stats.gov.sa/Methodologies/En_Documents/40_Technical%20Note%20Population%20Back%20Casting.PDF
2. Institution which provides data
General Authority for Statistics (GAStat)
3. Data availability
The data was retrieved from the Saudi census portal on GAStat website:
https://www.stats.gov.sa/en/statistics?index=119025#
“Population” section, then “Nationality statistics” section
https://www.stats.gov.sa/en/statistics-tabs?tab=436327&category=127396
Date of access: 15 September 2025.
GLMM and GRC cannot guarantee that the link to access the source will not change;
that the information will not be removed from the website it was obtained from;
that no geo-blockages will be imposed; or that the information will not be available for any another reason.
Keywords: Saudi Arabia, Foreign Population, Asia, Bangladesh, India, Pakistan, Philippines, Nepal, Indonesia, Myanmar, Afghanistan, Sri Lanka, Turkey, China, Thailand, Malaysia, Korea, Taiwan, Vietnam, Uzbekistan, Kyrgyzstan, Azerbaijan, Kazakhstan, British Indian Ocean Territory, Tajikistan, Japan, Singapore, Cambodia, Iran, Maldives, Cyprus, Turkmenistan
|
Males |
Females |
Total |
| France |
2,967 |
2,196 |
5,163 |
| Germany |
1,049 |
702 |
1,751 |
| Netherlands |
537 |
332 |
869 |
| Belgium |
260 |
183 |
443 |
| Austria |
153 |
108 |
261 |
| Switzerland |
151 |
99 |
250 |
| Luxembourg |
6 |
9 |
15 |
| Total |
5,123 |
3,629 |
8,752 |
| United Kingdom |
10,966 |
6,899 |
17,865 |
| Ireland |
730 |
602 |
1,332 |
| Sweden |
323 |
215 |
538 |
| Denmark |
124 |
81 |
205 |
| Norway |
94 |
50 |
144 |
| Finland |
51 |
54 |
105 |
| Lithuania |
17 |
32 |
49 |
| Latvia |
15 |
19 |
34 |
| Estonia |
10 |
5 |
15 |
| Iceland |
6 |
7 |
13 |
| Other |
1 |
2 |
3 |
| Total |
12,337 |
7,966 |
20,303 |
| Spain |
1,127 |
652 |
1,779 |
| Italy |
1,013 |
466 |
1,479 |
| Greece |
619 |
279 |
898 |
| Portugal |
354 |
216 |
570 |
| Bosnia and Herzegovina |
172 |
316 |
488 |
| Albania |
238 |
184 |
422 |
| Serbia |
170 |
212 |
382 |
| Croatia |
147 |
66 |
213 |
| Macedonia |
73 |
62 |
135 |
| Montenegro |
30 |
51 |
81 |
| Andorra |
9 |
14 |
23 |
| Malta |
13 |
6 |
19 |
| Slovenia |
8 |
5 |
13 |
| Other |
1 |
1 |
2 |
| Total |
3,974 |
2,530 |
6,504 |
| Russian Federation |
1,163 |
1,004 |
2,167 |
| Ukraine |
296 |
529 |
825 |
| Romania |
305 |
312 |
617 |
| Poland |
202 |
216 |
418 |
| Czechia |
82 |
131 |
213 |
| Hungary |
79 |
65 |
144 |
| Slovakia |
57 |
86 |
143 |
| Belarus |
34 |
80 |
114 |
| Bulgaria |
51 |
58 |
109 |
| Moldova |
10 |
30 |
40 |
| Total |
2,279 |
2,511 |
4,790 |
| Total Europe |
23,713 |
16,636 |
40,349 |
Source: GAStat, Saudi Arabia census 2022
ANNEXED NOTE
1. Technical Notes and Definitions
GLMM’s retabulation and partial redistribution of census data “Non-Saudi population by nationality and gender”
https://www.stats.gov.sa/en/statistics?index=119025#
Source of data: Saudi census 2022
Date of reference: 10 May 2022
Population of reference: Families and individual citizens and residents within the Kingdom, regardless of the status of their identification documents.
Visitors for Hajj, Umrah and tourism are excluded from the census.
Methodology:
The first phase of the 2020 census began on 3 February 2020 (enumeration of buildings and households). Census 2022 used geospatial data, including satellite images, electricity consumption and mobile phone data, to improve the accuracy and geographic coverage of address canvassing.
The second stage (“actual enumeration”) was due to start on the original reference date (17 March 2020), but was suspended by the outbreak of the COVID-19 crisis. This stage was conducted in October 2021.
The 2022 census used a combined methodology – administrative records, fieldwork and digital self-enumeration.
Household data were collected from e-portals of self-enumeration (on residents’ mobile devices, laptops or personal computers, or self-enumeration stations/kiosks, located in shopping centers).
The digital self-enumeration process was complemented by face-to-face interviews, using digital tablets.
Census 2022 used a de jure approach: enumerating people according to their usual place of residence.
Administrative data from multiple sources was used to cross-validate collected census data.
Census 2022 was designed as a launchpad for several new secure statistical data registers for population, housing, and businesses.
Portal of the Saudi census:
https://www.stats.gov.sa/en/statistics?index=119025#
Population data for 2010-22 were revised and backcasted, based on 2022 population census and past years’ administrative data.
Technical note on backcasting:
https://database.stats.gov.sa/Methodologies/En_Documents/40_Technical%20Note%20Population%20Back%20Casting.PDF
2. Institution which provides data
General Authority for Statistics (GAStat)
3. Data availability
The data was retrieved from the Saudi census portal on GAStat website:
https://www.stats.gov.sa/en/statistics?index=119025#
“Population” section, then “Nationality statistics” section
https://www.stats.gov.sa/en/statistics-tabs?tab=436327&category=127396
Date of access: 15 September 2025.
GLMM and GRC cannot guarantee that the link to access the source will not change;
that the information will not be removed from the website it was obtained from;
that no geo-blockages will be imposed; or that the information will not be available for any another reason.
Keywords: Saudi Arabia, Foreign Population, Europe, France, Germany, Netherlands, Belgium, Austria, Switzerland, Luxembourg, United Kingdom, Ireland, Sweden, Denmark, Norway, Finland, Lithuania, Latvia, Estonia, Iceland, Spain, Italy, Greece, Portugal, Bosnia and Herzegovina, Albania, Serbia, Croatia, Macedonia, Montenegro, Andorra, Malta, Slovenia, Russian Federation, Ukraine, Romania, Poland, Czechia, Hungary, Slovakia, Belarus, Bulgaria, Moldova
|
Q1 2021 |
Q2 2021 |
Q3 2021 |
Q4 2021 |
Q1 2022 |
Q2 2022 |
Q3 2022 |
Q4 2022 |
Q1 2023 |
Q2 2023 |
Q3 2023 |
Q4 2023 |
Q1 2024 |
Q2 2024 |
Q3 2024 |
Q4 2024 |
Q1 2025 |
| Agriculture, forestry and fishing |
89,866 |
103,627 |
102,094 |
106,710 |
132,269 |
181,046 |
NA |
354,795 |
521,309 |
540,603 |
139,654 |
142,402 |
164,292 |
203,475 |
204,897 |
290,672 |
341,690 |
| Mining and quarrying |
64,007 |
173,230 |
173,224 |
176,650 |
171,620 |
142,153 |
NA |
141,816 |
146,455 |
157,758 |
160,780 |
166,204 |
173,925 |
186,826 |
197,474 |
220,458 |
218,088 |
| Manufacturing |
626,216 |
827,037 |
830,836 |
852,925 |
892,895 |
943,887 |
NA |
1,033,933 |
1,086,782 |
1,123,456 |
1,184,551 |
1,211,398 |
1,298,422 |
1,341,920 |
1,386,764 |
1,515,096 |
1,576,431 |
| Electricity, gas, steam and air conditioning supply |
37,403 |
78,442 |
77,763 |
78,129 |
79,442 |
40,157 |
NA |
39,390 |
39,011 |
38,498 |
38,418 |
39,317 |
40,294 |
46,151 |
46,674 |
49,100 |
49,862 |
| Water supply; sewerage, waste management and remediation activities |
18,487 |
23,578 |
23,221 |
23,850 |
29,025 |
87,941 |
NA |
106,556 |
122,329 |
129,086 |
152,013 |
156,994 |
138,035 |
168,219 |
173,128 |
180,363 |
179,481 |
| Construction |
1,803,570 |
2,029,594 |
1,996,612 |
2,058,439 |
2,152,344 |
2,453,723 |
NA |
2,460,230 |
2,540,702 |
2,541,815 |
2,608,274 |
2,617,187 |
2,816,018 |
2,894,564 |
2,972,737 |
3,246,657 |
3,396,663 |
| Wholesale and retail trade; repair of motor vehicles and motorcycles |
1,426,482 |
1,828,219 |
1,813,880 |
1,790,879 |
1,820,040 |
1,719,838 |
NA |
1,626,050 |
1,653,550 |
1,629,081 |
1,621,497 |
1,616,873 |
1,647,023 |
1,648,970 |
1,644,350 |
1,732,029 |
1,753,708 |
| Transportation and storage |
192,230 |
260,938 |
264,794 |
281,064 |
319,753 |
406,735 |
NA |
439,565 |
459,542 |
467,109 |
494,242 |
503,243 |
550,184 |
566,981 |
592,765 |
756,106 |
780,243 |
| Accommodation and food service activities |
308,053 |
381,488 |
390,819 |
555,301 |
671,247 |
653,310 |
NA |
675,154 |
694,182 |
686,139 |
686,468 |
673,976 |
681,367 |
679,540 |
673,835 |
708,196 |
714,084 |
| Information and communication |
38,608 |
78,762 |
80,821 |
82,149 |
84,090 |
123,491 |
NA |
123,331 |
123,307 |
118,538 |
106,607 |
104,389 |
110,795 |
111,735 |
113,119 |
120,389 |
122,356 |
| Financial and insurance activities |
12,839 |
76,810 |
77,191 |
77,924 |
79,815 |
88,780 |
NA |
91,291 |
92,274 |
92,610 |
93,314 |
95,184 |
96,478 |
96,916 |
98,607 |
100,115 |
101,500 |
| Real estate activities |
25,182 |
38,134 |
39,207 |
39,303 |
39,807 |
66,181 |
NA |
54,627 |
55,674 |
54,738 |
53,671 |
52,808 |
54,389 |
53,981 |
53,303 |
55,646 |
56,703 |
| Professional, scientific and technical activities |
88,617 |
131,885 |
133,323 |
138,157 |
153,113 |
196,824 |
NA |
213,687 |
225,340 |
228,288 |
234,837 |
242,103 |
250,588 |
255,021 |
263,531 |
273,228 |
277,561 |
| Administrative and support service activities |
883,841 |
976,024 |
946,426 |
977,737 |
1,012,678 |
1,141,367 |
NA |
1,175,278 |
1,204,832 |
1,168,552 |
1,130,332 |
1,110,940 |
1,156,985 |
1,170,302 |
1,196,249 |
1,237,396 |
1,267,077 |
| Public administration and defence; compulsory social security |
70,341 |
264,295 |
272,991 |
295,173 |
297,192 |
264,775 |
NA |
266,467 |
267,708 |
271,363 |
278,501 |
284,829 |
289,434 |
282,128 |
289,351 |
295,254 |
300,533 |
| Education |
62,365 |
122,705 |
135,359 |
140,899 |
146,434 |
171,808 |
NA |
180,694 |
184,775 |
177,190 |
194,591 |
197,448 |
202,219 |
188,489 |
207,694 |
294,727 |
292,239 |
| Human health and social work activities |
229,046 |
436,670 |
444,930 |
470,352 |
407,099 |
413,245 |
NA |
440,396 |
452,352 |
443,553 |
448,359 |
448,222 |
453,900 |
448,912 |
457,315 |
463,194 |
466,499 |
| Arts, entertainment and recreation |
18,432 |
28,124 |
29,325 |
29,992 |
31,667 |
29,288 |
NA |
32,338 |
33,509 |
32,748 |
32,242 |
32,069 |
32,572 |
32,671 |
33,166 |
40,961 |
41,689 |
| Other service activities |
174,281 |
210,010 |
208,242 |
209,986 |
244,155 |
257,284 |
NA |
237,962 |
239,385 |
235,915 |
234,478 |
230,526 |
242,973 |
250,886 |
253,536 |
273,158 |
281,093 |
| Activities of households as employer Activities of extraterritorial organizations and bodiess; undifferentiated goods- and services-producing activities of households for own use |
110 |
145 |
148 |
224 |
246 |
106 |
NA |
94 |
85 |
89 |
88 |
86 |
83 |
77 |
90 |
102 |
109 |
| Activities of extraterritorial organizations and bodies |
404 |
1,575 |
1,627 |
1,748 |
1,854 |
844 |
NA |
859 |
838 |
830 |
833 |
473 |
487 |
497 |
495 |
396 |
393 |
| Not specified |
131,412 |
118,878 |
115,552 |
143,717 |
329,694 |
158,839 |
NA |
228,525 |
295,094 |
357,127 |
919,238 |
916,062 |
992,969 |
1,078,502 |
1,149,578 |
585,242 |
580,785 |
| Total |
6,301,792 |
8,190,170 |
8,158,385 |
8,531,308 |
9,096,479 |
9,541,622 |
NA |
9,923,038 |
10,439,035 |
10,495,086 |
10,812,988 |
10,842,733 |
11,393,432 |
11,706,763 |
12,008,658 |
12,438,485 |
12,798,787 |
Source: Register-based Labour Market Statistics, General Authority for Statistics (GAStat)
1. Data collection methodology
LFS were first conducted in 2001 and became bi-annual after 2006. Data were collected through nationally representative household sample surveys, which sampling was based on most recent censuses.
Since 2016, Labour Force Surveys have been conducted and published on a quarterly basis, based on a household telephone survey conducted by GAStat. Employment data extracted from administrative records were also introduced as a complement to the results of Labour Force Surveys in Labour Market Statistics’ publications, starting on Q1 2017.
The present data is taken from administrative records.
Population of reference: workers subject to the rule of the General Organization of Social Insurance (GOSI):
a. contributors on the job who are subject to social insurance laws and regulations in the private and government sector;
b. new contributors, and contributors who terminated their contribution to social insurance during the quarter.
Figures of workers in Labor Market statistics which were derived from administrative records do not include the following categories:
1-Workers in the military and security sectors
2- Workers who are not registered in the civil service, social insurance (GOSI) and domestic workers’ records, which include:
– Saudis working for their own businesses and are not subjected to the labor regulations, also, not registered in social insurance,
such as those who work in delivery through electronic apps
– Saudi employers who work in establishments and not registered in the social insurance
– Non-Saudi staff working in foreign international, political or military missions
3- Non-Saudi employees who come to the Kingdom for work that normally takes less than three months to be completed.
Definitions and categories used by GAStat in Labour Markets Statistics (employment; unemployment; occupation and activity sectors, etc.) are based on international standards:
For LFS methodology and definitions, see metadata section in report, and:
https://database.stats.gov.sa/Methodologies/En_Documents/03_Labor%20Market%20Bulletin%20Methodology,%20Fourth%20Quarter%202020%20_%20General%20Authority%20for%20Statistics.pdf
https://database.stats.gov.sa/Methodologies/En_Documents/03_Labor%20Market%20Bulletin%20Methodology,%20Fourth%20Quarter%202020%20_%20General%20Authority%20for%20Statistics.pdf
Classification of economic activities: Saudi Classification of Economic Activities, based on the International Standard Industrial Classification of all economic activities (ISIC4)
https://www.stats.gov.sa/en/classifications
2. Institution which provides data
General Authority for Statistics (GAStat)
3. Data availability
Since 2021, GAStat has been publishing separately the employment data taken from administrative records,and unemployment/inactivity data as well as general indicators, calculated from the results of the field interviews conducted by GAStat (Labour Force Survey).
The time-series was built using the quarterly Register-based Labour Market Statistics for given quarters 2023-2025: available at:
https://www.stats.gov.sa/en/statistics-tabs/-/categories/417515?tab=436312&category=417515
Before 2023: available in the “archived data”:
https://www.stats.gov.sa/en/statistics?index=1317550
“social statistics”, and “labour force”
https://www.stats.gov.sa/en/statistics-tabs?tab=436312&category=1333429
Last date of access: 26 August 2025.
Keywords: Employment, Saudi Arabia, National & Foreign Labour
GLMM and GRC cannot guarantee that the link to access the source will not change;
that the information will not be removed from the website it was obtained from;
that no geo-blockages will be imposed; or that the information will not be available for any another reason.
|
Q1 2021 |
Q2 2021 |
Q3 2021 |
Q4 2021 |
Q1 2022 |
Q2 2022 |
Q3 2022 |
Q4 2022 |
Q1 2023 |
Q2 2023 |
Q3 2023 |
Q4 2023 |
Q1 2024 |
Q2 2024 |
Q3 2024 |
Q4 2024 |
Q1 2025 |
| Agriculture, forestry and fishing |
16,434 |
16,266 |
16,288 |
16,527 |
17,545 |
22,812 |
NA |
25,528 |
26,194 |
23,744 |
19,576 |
20,737 |
20,800 |
24,294 |
23,941 |
30,187 |
32,364 |
| Mining and quarrying |
111,099 |
111,003 |
111,765 |
114,420 |
113,400 |
101,644 |
NA |
105,217 |
107,031 |
110,356 |
111,606 |
114,264 |
115,960 |
118,180 |
119,694 |
123,583 |
122,979 |
| Manufacturing |
211,568 |
213,760 |
218,854 |
225,917 |
235,198 |
235,459 |
NA |
255,544 |
276,313 |
295,968 |
324,340 |
344,800 |
358,716 |
370,106 |
379,981 |
404,875 |
408,164 |
| Electricity, gas, steam and air conditioning supply |
40,952 |
41,032 |
41,242 |
41,596 |
42,065 |
33,641 |
NA |
33,170 |
32,695 |
32,120 |
31,581 |
31,694 |
31,494 |
33,648 |
33,513 |
34,493 |
34,625 |
| Water supply; sewerage, waste management and remediation activities |
5,122 |
5,272 |
5,336 |
5,567 |
7,440 |
18,351 |
NA |
20,399 |
21,415 |
21,876 |
25,171 |
26,976 |
22,660 |
34,838 |
35,760 |
36,671 |
36,645 |
| Construction |
311,944 |
286,699 |
290,900 |
302,768 |
318,228 |
347,865 |
NA |
369,532 |
368,016 |
365,366 |
380,329 |
383,785 |
397,613 |
400,320 |
410,273 |
426,068 |
434,440 |
| Wholesale and retail trade; repair of motor vehicles and motorcycles |
446,094 |
445,969 |
460,134 |
460,682 |
481,745 |
431,257 |
NA |
420,283 |
424,734 |
418,320 |
413,349 |
411,501 |
405,746 |
396,519 |
391,102 |
395,093 |
392,019 |
| Transportation and storage |
66,144 |
67,453 |
70,977 |
75,606 |
86,032 |
107,796 |
NA |
119,572 |
124,173 |
127,304 |
130,760 |
132,670 |
137,440 |
137,391 |
141,228 |
148,261 |
151,111 |
| Accommodation and food service activities |
78,333 |
74,799 |
79,822 |
115,570 |
149,260 |
141,452 |
NA |
150,110 |
151,043 |
149,910 |
149,285 |
147,425 |
143,828 |
141,094 |
137,053 |
138,371 |
137,153 |
| Information and communication |
40,986 |
41,119 |
42,329 |
44,093 |
45,927 |
73,918 |
NA |
76,714 |
75,783 |
72,282 |
61,123 |
59,389 |
62,968 |
63,220 |
63,984 |
65,718 |
67,436 |
| Financial and insurance activities |
63,629 |
64,199 |
64,642 |
65,029 |
66,454 |
71,940 |
NA |
75,001 |
75,752 |
76,323 |
76,772 |
78,582 |
79,611 |
80,071 |
81,715 |
82,952 |
84,296 |
| Real estate activities |
13,049 |
13,581 |
14,444 |
14,883 |
15,741 |
24,677 |
NA |
22,925 |
23,438 |
22,853 |
22,207 |
21,656 |
21,685 |
21,424 |
21,146 |
21,350 |
21,932 |
| Professional, scientific and technical activities |
44,394 |
44,560 |
46,420 |
49,857 |
58,115 |
84,006 |
NA |
105,783 |
113,405 |
115,304 |
118,852 |
122,074 |
124,267 |
125,817 |
131,526 |
133,975 |
135,926 |
| Administrative and support service activities |
139,343 |
131,967 |
138,444 |
140,659 |
151,336 |
189,804 |
NA |
210,350 |
205,473 |
198,553 |
191,886 |
191,894 |
191,069 |
184,883 |
186,654 |
192,456 |
191,971 |
| Public administration and defence; compulsory social security |
176,561 |
186,072 |
193,476 |
211,419 |
217,604 |
201,819 |
NA |
205,996 |
209,334 |
213,359 |
221,569 |
228,276 |
232,997 |
224,681 |
232,226 |
237,908 |
243,205 |
| Education |
70,741 |
64,313 |
74,797 |
80,054 |
85,456 |
96,668 |
NA |
104,945 |
106,346 |
97,894 |
110,781 |
111,806 |
111,648 |
99,197 |
114,745 |
113,818 |
112,356 |
| Human health and social work activities |
200,122 |
202,540 |
209,095 |
219,344 |
203,730 |
201,222 |
NA |
213,943 |
218,978 |
215,787 |
222,718 |
225,779 |
227,989 |
224,253 |
232,126 |
237,170 |
238,680 |
| Arts, entertainment and recreation |
8,715 |
9,287 |
10,296 |
10,435 |
11,317 |
10,666 |
NA |
12,898 |
13,245 |
13,146 |
13,246 |
13,560 |
13,744 |
13,785 |
14,085 |
15,267 |
15,452 |
| Other service activities |
41,284 |
42,481 |
43,352 |
43,627 |
45,143 |
41,985 |
NA |
41,853 |
41,170 |
41,818 |
41,982 |
41,824 |
41,983 |
42,518 |
42,371 |
43,732 |
43,903 |
| Activities of households as employer Activities of extraterritorial organizations and bodiess; undifferentiated goods- and services-producing activities of households for own use |
32 |
31 |
29 |
28 |
23 |
7 |
NA |
6 |
7 |
8 |
12 |
15 |
14 |
18 |
22 |
43 |
50 |
| Activities of extraterritorial organizations and bodies |
1,052 |
1,155 |
1,208 |
1,314 |
1,416 |
594 |
NA |
616 |
606 |
605 |
615 |
275 |
278 |
284 |
284 |
278 |
277 |
| Not specified |
1,845 |
1,780 |
1,458 |
1,417 |
20,315 |
5,370 |
NA |
11,030 |
16,037 |
18,308 |
29,037 |
29,448 |
28,175 |
35,879 |
36,810 |
11,503 |
10,916 |
|
2,089,443 |
2,065,338 |
2,135,308 |
2,240,812 |
2,373,490 |
2,442,953 |
NA |
2,581,415 |
2,631,188 |
2,631,204 |
2,696,797 |
2,738,430 |
2,770,685 |
2,772,420 |
2,830,239 |
2,893,772 |
2,915,900 |
Source: Register-based Labour Market Statistics, General Authority for Statistics (GAStat)
1. Data collection methodology
LFS were first conducted in 2001 and became bi-annual after 2006. Data were collected through nationally representative household sample surveys, which sampling was based on most recent censuses.
Since 2016, Labour Force Surveys have been conducted and published on a quarterly basis, based on a household telephone survey conducted by GAStat. Employment data extracted from administrative records were also introduced as a complement to the results of Labour Force Surveys in Labour Market Statistics’ publications, starting on Q1 2017.
The present data is taken from administrative records.
Population of reference: workers subject to the rule of the General Organization of Social Insurance (GOSI):
a. contributors on the job who are subject to social insurance laws and regulations in the private and government sector;
b. new contributors, and contributors who terminated their contribution to social insurance during the quarter.
Figures of workers in Labor Market statistics which were derived from administrative records do not include the following categories:
1-Workers in the military and security sectors
2- Workers who are not registered in the civil service, social insurance (GOSI) and domestic workers’ records, which include:
– Saudis working for their own businesses and are not subjected to the labor regulations, also, not registered in social insurance,
such as those who work in delivery through electronic apps
– Saudi employers who work in establishments and not registered in the social insurance
– Non-Saudi staff working in foreign international, political or military missions
3- Non-Saudi employees who come to the Kingdom for work that normally takes less than three months to be completed.
Definitions and categories used by GAStat in Labour Markets Statistics (employment; unemployment; occupation and activity sectors, etc.) are based on international standards:
For LFS methodology and definitions, see metadata section in report, and:
https://database.stats.gov.sa/Methodologies/En_Documents/03_Labor%20Market%20Bulletin%20Methodology,%20Fourth%20Quarter%202020%20_%20General%20Authority%20for%20Statistics.pdf
https://database.stats.gov.sa/Methodologies/En_Documents/03_Labor%20Market%20Bulletin%20Methodology,%20Fourth%20Quarter%202020%20_%20General%20Authority%20for%20Statistics.pdf
Classification of economic activities: Saudi Classification of Economic Activities, based on the International Standard Industrial Classification of all economic activities (ISIC4)
https://www.stats.gov.sa/en/classifications
2. Institution which provides data
General Authority for Statistics (GAStat)
3. Data availability
Since 2021, GAStat has been publishing separately the employment data taken from administrative records,and unemployment/inactivity data as well as general indicators, calculated from the results of the field interviews conducted by GAStat (Labour Force Survey).
The time-series was built using the quarterly Register-based Labour Market Statistics for given quarters 2023-2025: available at:
https://www.stats.gov.sa/en/statistics-tabs/-/categories/417515?tab=436312&category=417515
Before 2023: available in the “archived data”:
https://www.stats.gov.sa/en/statistics?index=1317550
“social statistics”, and “labour force”
https://www.stats.gov.sa/en/statistics-tabs?tab=436312&category=1333429
Last date of access: 26 August 2025.
Keywords: Employment, Saudi Arabia, National & Foreign Labour
GLMM and GRC cannot guarantee that the link to access the source will not change;
that the information will not be removed from the website it was obtained from;
that no geo-blockages will be imposed; or that the information will not be available for any another reason.
|
Q1 2021 |
Q2 2021 |
Q3 2021 |
Q4 2021 |
Q1 2022 |
Q2 2022 |
Q3 2022 |
Q4 2022 |
Q1 2023 |
Q2 2023 |
Q3 2023 |
Q4 2023 |
Q1 2024 |
Q2 2024 |
Q3 2024 |
Q4 2024 |
Q1 2025 |
| Agriculture, forestry and fishing |
89,866 |
87,361 |
85,806 |
90,183 |
114,724 |
158,234 |
NA |
329,267 |
495,115 |
516,859 |
120,078 |
121,665 |
143,492 |
179,181 |
180,956 |
260,485 |
309,326 |
| Mining and quarrying |
64,007 |
62,227 |
61,459 |
62,230 |
58,220 |
40,509 |
NA |
36,599 |
39,424 |
47,402 |
49,174 |
51,940 |
57,965 |
68,646 |
77,780 |
96,875 |
95,109 |
| Manufacturing |
626,216 |
613,277 |
611,982 |
627,008 |
657,697 |
708,428 |
NA |
778,389 |
810,469 |
827,488 |
860,211 |
866,598 |
939,706 |
971,814 |
1,006,783 |
1,110,221 |
1,168,267 |
| Electricity, gas, steam and air conditioning supply |
37,403 |
37,410 |
36,521 |
36,533 |
37,377 |
6,516 |
NA |
6,220 |
6,316 |
6,378 |
6,837 |
7,623 |
8,800 |
12,503 |
13,161 |
14,607 |
15,237 |
| Water supply; sewerage, waste management and remediation activities |
18,487 |
18,306 |
17,885 |
18,283 |
21,585 |
69,590 |
NA |
86,157 |
100,914 |
107,210 |
126,842 |
130,018 |
115,375 |
133,381 |
137,368 |
143,692 |
142,836 |
| Construction |
1,803,570 |
1,742,895 |
1,705,712 |
1,755,671 |
1,834,116 |
2,105,858 |
NA |
2,090,698 |
2,172,686 |
2,176,449 |
2,227,945 |
2,233,402 |
2,418,405 |
2,494,244 |
2,562,464 |
2,820,589 |
2,962,223 |
| Wholesale and retail trade; repair of motor vehicles and motorcycles |
1,426,482 |
1,382,250 |
1,353,746 |
1,330,197 |
1,338,295 |
1,288,581 |
NA |
1,205,767 |
1,228,816 |
1,210,761 |
1,208,148 |
1,205,372 |
1,241,277 |
1,252,451 |
1,253,248 |
1,336,936 |
1,361,689 |
| Transportation and storage |
192,230 |
193,485 |
193,817 |
205,458 |
233,721 |
298,939 |
NA |
319,993 |
335,369 |
339,805 |
363,482 |
370,573 |
412,744 |
429,590 |
451,537 |
607,845 |
629,132 |
| Accommodation and food service activities |
308,053 |
306,689 |
310,997 |
439,731 |
521,987 |
511,858 |
NA |
525,044 |
543,139 |
536,229 |
537,183 |
526,551 |
537,539 |
538,446 |
536,782 |
569,825 |
576,931 |
| Information and communication |
38,608 |
37,643 |
38,492 |
38,056 |
38,163 |
49,573 |
NA |
46,617 |
47,524 |
46,256 |
45,484 |
45,000 |
47,827 |
48,515 |
49,135 |
54,671 |
54,920 |
| Financial and insurance activities |
12,839 |
12,611 |
12,549 |
12,895 |
13,361 |
16,840 |
NA |
16,290 |
16,522 |
16,287 |
16,542 |
16,602 |
16,867 |
16,845 |
16,892 |
17,163 |
17,204 |
| Real estate activities |
25,182 |
24,553 |
24,763 |
24,420 |
24,066 |
41,504 |
NA |
31,702 |
32,236 |
31,885 |
31,464 |
31,152 |
32,704 |
32,557 |
32,157 |
34,296 |
34,771 |
| Professional, scientific and technical activities |
88,617 |
87,325 |
86,903 |
88,300 |
94,998 |
112,818 |
NA |
107,904 |
111,935 |
112,984 |
115,985 |
120,029 |
126,321 |
129,204 |
132,005 |
139,253 |
141,635 |
| Administrative and support service activities |
883,841 |
844,057 |
807,982 |
837,078 |
861,342 |
951,563 |
NA |
964,928 |
999,359 |
969,999 |
938,446 |
919,046 |
965,916 |
985,419 |
1,009,595 |
1,044,940 |
1,075,106 |
| Public administration and defence; compulsory social security |
70,341 |
78,223 |
79,515 |
83,754 |
79,588 |
62,956 |
NA |
60,471 |
58,374 |
58,004 |
56,932 |
56,553 |
56,437 |
57,447 |
57,125 |
57,346 |
57,328 |
| Education |
62,365 |
58,392 |
60,562 |
60,845 |
60,978 |
75,140 |
NA |
75,749 |
78,429 |
79,296 |
83,810 |
85,642 |
90,571 |
89,292 |
92,949 |
180,909 |
179,883 |
| Human health and social work activities |
229,046 |
234,130 |
235,835 |
251,008 |
203,369 |
212,023 |
NA |
226,453 |
233,374 |
227,766 |
225,641 |
222,443 |
225,911 |
224,659 |
225,189 |
226,024 |
227,819 |
| Arts, entertainment and recreation |
18,432 |
18,837 |
19,029 |
19,557 |
20,350 |
18,622 |
NA |
19,440 |
20,264 |
19,602 |
18,996 |
18,509 |
18,828 |
18,886 |
19,081 |
25,694 |
26,237 |
| Other service activities |
174,281 |
167,529 |
164,890 |
166,359 |
199,012 |
215,299 |
NA |
196,109 |
198,215 |
194,097 |
192,496 |
188,702 |
200,990 |
208,368 |
211,165 |
229,426 |
237,190 |
| Activities of households as employer Activities of extraterritorial organizations and bodiess; undifferentiated goods- and services-producing activities of households for own use |
110 |
114 |
119 |
196 |
223 |
99 |
NA |
88 |
78 |
81 |
76 |
71 |
69 |
59 |
68 |
59 |
59 |
| Activities of extraterritorial organizations and bodies |
404 |
420 |
419 |
434 |
438 |
250 |
NA |
243 |
232 |
225 |
218 |
198 |
209 |
213 |
211 |
118 |
116 |
| Not specified |
131,412 |
117,098 |
114,094 |
142,300 |
309,379 |
153,469 |
NA |
217,495 |
279,057 |
338,819 |
890,201 |
886,614 |
964,794 |
1,042,623 |
1,112,768 |
573,739 |
569,869 |
| Total |
6,301,792 |
6,124,832 |
6,023,077 |
6,290,496 |
6,722,989 |
7,098,669 |
NA |
7,341,623 |
7,807,847 |
7,863,882 |
8,116,191 |
8,104,303 |
8,622,747 |
8,934,343 |
9,178,419 |
9,544,713 |
9,882,887 |
Source: Register-based Labour Market Statistics, General Authority for Statistics (GAStat)
1. Data collection methodology
LFS were first conducted in 2001 and became bi-annual after 2006. Data were collected through nationally representative household sample surveys, which sampling was based on most recent censuses.
Since 2016, Labour Force Surveys have been conducted and published on a quarterly basis, based on a household telephone survey conducted by GAStat. Employment data extracted from administrative records were also introduced as a complement to the results of Labour Force Surveys in Labour Market Statistics’ publications, starting on Q1 2017.
The present data is taken from administrative records.
Population of reference: workers subject to the rule of the General Organization of Social Insurance (GOSI):
a. contributors on the job who are subject to social insurance laws and regulations in the private and government sector;
b. new contributors, and contributors who terminated their contribution to social insurance during the quarter.
Figures of workers in Labor Market statistics which were derived from administrative records do not include the following categories:
1-Workers in the military and security sectors
2- Workers who are not registered in the civil service, social insurance (GOSI) and domestic workers’ records, which include:
– Saudis working for their own businesses and are not subjected to the labor regulations, also, not registered in social insurance,
such as those who work in delivery through electronic apps
– Saudi employers who work in establishments and not registered in the social insurance
– Non-Saudi staff working in foreign international, political or military missions
3- Non-Saudi employees who come to the Kingdom for work that normally takes less than three months to be completed.
Definitions and categories used by GAStat in Labour Markets Statistics (employment; unemployment; occupation and activity sectors, etc.) are based on international standards:
For LFS methodology and definitions, see metadata section in report, and:
https://database.stats.gov.sa/Methodologies/En_Documents/03_Labor%20Market%20Bulletin%20Methodology,%20Fourth%20Quarter%202020%20_%20General%20Authority%20for%20Statistics.pdf
https://database.stats.gov.sa/Methodologies/En_Documents/03_Labor%20Market%20Bulletin%20Methodology,%20Fourth%20Quarter%202020%20_%20General%20Authority%20for%20Statistics.pdf
Classification of economic activities: Saudi Classification of Economic Activities, based on the International Standard Industrial Classification of all economic activities (ISIC4)
https://www.stats.gov.sa/en/classifications
2. Institution which provides data
General Authority for Statistics (GAStat)
3. Data availability
Since 2021, GAStat has been publishing separately the employment data taken from administrative records,and unemployment/inactivity data as well as general indicators, calculated from the results of the field interviews conducted by GAStat (Labour Force Survey).
The time-series was built using the quarterly Register-based Labour Market Statistics for given quarters 2023-2025: available at:
https://www.stats.gov.sa/en/statistics-tabs/-/categories/417515?tab=436312&category=417515
Before 2023: available in the “archived data”:
https://www.stats.gov.sa/en/statistics?index=1317550
“social statistics”, and “labour force”
https://www.stats.gov.sa/en/statistics-tabs?tab=436312&category=1333429
Last date of access: 26 August 2025.
Keywords: Employment, Saudi Arabia, National & Foreign Labour
GLMM and GRC cannot guarantee that the link to access the source will not change;
that the information will not be removed from the website it was obtained from;
that no geo-blockages will be imposed; or that the information will not be available for any another reason.
|
Q1 2021 |
Q2 2021 |
Q3 2021 |
Q4 2021 |
Q1 2022 |
Q2 2022 |
Q3 2022 |
Q4 2022 |
Q1 2023 |
Q2 2023 |
Q3 2023 |
Q4 2023 |
Q1 2024 |
Q2 2024 |
Q3 2024 |
Q4 2024 |
Q1 2025 |
| Managers |
230,763 |
N.A. |
232,739 |
238,222 |
216,672 |
232,391 |
N.A. |
297,015 |
315,833 |
314,524 |
330,625 |
340,109 |
354,622 |
362,158 |
369,811 |
382,145 |
388,795 |
| Professionals |
852,578 |
N.A. |
891,661 |
973,569 |
894,147 |
931,590 |
N.A. |
1,176,140 |
1,361,927 |
1,370,727 |
1,472,328 |
1,506,718 |
1,565,546 |
1,570,466 |
1,644,870 |
1,703,442 |
1,739,151 |
| Technicians and associate professionals |
972,261 |
N.A. |
939,505 |
961,743 |
833,738 |
837,925 |
N.A. |
886,222 |
960,587 |
962,944 |
977,733 |
984,187 |
1,007,469 |
1,066,730 |
1,078,664 |
1,123,100 |
1,130,800 |
| Clerical support workers |
529,855 |
N.A. |
518,655 |
517,973 |
418,057 |
439,300 |
N.A. |
573,178 |
585,074 |
579,425 |
578,982 |
587,713 |
590,766 |
610,111 |
608,927 |
615,842 |
618,575 |
| Service and sales workers |
565,568 |
N.A. |
563,320 |
590,329 |
554,231 |
631,230 |
N.A. |
716,250 |
819,939 |
820,944 |
861,702 |
867,736 |
902,905 |
911,696 |
925,609 |
940,798 |
954,097 |
| Skilled agricultural, forestry and fishery workers |
40,459 |
N.A. |
37,359 |
44,394 |
41,435 |
24,947 |
N.A. |
26,305 |
33,705 |
32,538 |
31,426 |
30,815 |
27,642 |
34,188 |
35,319 |
35,405 |
35,136 |
| Craft and related trades workers |
1,045,838 |
N.A. |
936,825 |
949,385 |
865,403 |
904,423 |
N.A. |
973,587 |
1,157,565 |
1,160,916 |
1,275,983 |
1,270,230 |
1,300,515 |
1,306,698 |
1,296,351 |
1,298,303 |
1,304,189 |
| Plant and machine operators, and assemblers |
770,741 |
N.A. |
718,087 |
760,537 |
704,568 |
738,370 |
N.A. |
814,398 |
1,029,608 |
1,038,723 |
1,071,391 |
1,077,348 |
1,157,003 |
1,189,256 |
1,228,552 |
1,271,655 |
1,304,554 |
| Elementary occupations |
3,313,262 |
N.A. |
3,153,076 |
3,441,414 |
3,677,448 |
3,618,730 |
N.A. |
4,311,761 |
4,022,345 |
4,066,062 |
4,075,973 |
4,050,778 |
4,367,373 |
4,580,064 |
4,748,348 |
5,018,900 |
5,274,705 |
| Other Occupations |
38,977 |
N.A. |
39,350 |
53,742 |
890,780 |
1,182,716 |
N.A. |
148,182 |
152,452 |
148,283 |
136,845 |
127,099 |
119,591 |
75,396 |
72,207 |
48,895 |
48,785 |
| Not specified |
30,933 |
N.A. |
127,808 |
0 |
0 |
0 |
N.A. |
0 |
0 |
0 |
0 |
0 |
0 |
0 |
|
|
|
| Total |
8,391,235 |
N.A. |
8,158,385 |
8,531,308 |
9,096,479 |
9,541,622 |
N.A. |
9,923,038 |
10,439,035 |
10,495,086 |
10,812,988 |
10,842,733 |
11,393,432 |
11,706,763 |
12,008,658 |
12,438,485 |
12,798,787 |
Source: Register-based Labour Market Statistics, General Authority for Statistics (GAStat)
1. Data collection methodology
LFS were first conducted in 2001 and became bi-annual after 2006. Data were collected through nationally
representative household sample surveys, which sampling was based on most recent censuses.
Since 2016, Labour Force Surveys have been conducted and published on a quarterly basis, based on a
household telephone survey conducted by GAStat. Employment data extracted from administrative records
were also introduced as a complement to the results of Labour Force Surveys in Labour Market Statistics’
publications, starting on Q1 2017.
The present data is taken from administrative records.
Population of reference: workers subject to the rule of the General Organization of Social Insurance (GOSI):
a. contributors on the job who are subject to social insurance laws and regulations in the private and government sector;
b. new contributors, and contributors who terminated their contribution to social insurance during the quarter.
Figures of workers in Labor Market statistics which were derived from administrative records do not include the following categories:
1-Workers in the military and security sectors
2- Workers who are not registered in the civil service, social insurance (GOSI) and domestic workers’ records, which include:
– Saudis working for their own businesses and are not subjected to the labor regulations, also, not registered in social insurance,
such as those who work in delivery through electronic apps
– Saudi employers who work in establishments and not registered in the social insurance
– Non-Saudi staff working in foreign international, political or military missions
3- Non-Saudi employees who come to the Kingdom for work that normally takes less than three months to be completed.
Definitions and categories used by GAStat in Labour Markets Statistics (employment; unemployment;
occupation and activity sectors, etc.) are based on international standards:
For LFS methodology and definitions, see metadata section in report, and:
https://database.stats.gov.sa/Methodologies/En_Documents/03_Labor%20Market%20Bulletin%20Methodology,%20Fourth%20Quarter%202020%20_%20General%20Authority%20for%20Statistics.pdf
https://database.stats.gov.sa/Methodologies/En_Documents/03_Labor%20Market%20Bulletin%20Methodology,%20Fourth%20Quarter%202020%20_%20General%20Authority%20for%20Statistics.pdf
Classification of occupations: Saudi classification of occupations, based on ISCO-08.
https://www.stats.gov.sa/en/page/292
This classification was adopted in Q1 2021.
2. Institution which provides data
General Authority for Statistics (GAStat)
3. Data availability
Since 2021, GAStat has been publishing separately the employment data taken from administrative records,
and unemployment/inactivity data as well as general indicators, calculated from the results of the field
interviews conducted by GAStat (Labour Force Survey).
The time-series was built using the quarterly Register-based Labour Market Statistics for given quarters
2023-2025: available at:
https://www.stats.gov.sa/en/statistics-tabs/-/categories/417515?tab=436312&category=417515
Before 2023: available in the “archived data”:
https://www.stats.gov.sa/en/statistics?index=1317550
“social statistics”, and “labour force”
https://www.stats.gov.sa/en/statistics-tabs?tab=436312&category=1333429
Last date of access: 26 June 2025.
Keywords: Employment, Female Employment, Saudi Arabia, National & Foreign Labour, Highly Skilled Labour, Low-Skilled Labour
GLMM and GRC cannot guarantee that the link to access the source will not change;
that the information will not be removed from the website it was obtained from;
that no geo-blockages will be imposed; or that the information will not be available for any another reason.
|
Q3 2021 |
Q4 2021 |
Q1 2022 |
Q2 2022 |
Q3 2022 |
Q4 2022 |
Q1 2023 |
Q2 2023 |
Q3 2023 |
Q4 2023 |
Q1 2024 |
Q2 2024 |
Q3 2024 |
Q4 2024 |
Q1 2025 |
| Managers |
954 |
1,205 |
1,743 |
1,789 |
N.A. |
425 |
1,258 |
322 |
1,499 |
1,059 |
1,697 |
1,543 |
2,043 |
2,422 |
1,922 |
| Professionals |
15,772 |
15,658 |
24,884 |
18,036 |
N.A. |
3,092 |
9,686 |
2,211 |
10,495 |
8,844 |
12,377 |
10,076 |
12,369 |
15,386 |
14,074 |
| Technicians and associate professionals |
5,176 |
10,640 |
5,975 |
6,556 |
N.A. |
1,581 |
7,790 |
1,530 |
6,805 |
5,044 |
7,986 |
7,043 |
9,205 |
10,616 |
10,533 |
| Clerical support workers |
332 |
464 |
1,082 |
839 |
N.A. |
251 |
539 |
378 |
717 |
722 |
339 |
1,093 |
1,528 |
1,651 |
1,326 |
| Service and sales workers |
5,381 |
12,408 |
25,354 |
13,188 |
N.A. |
1,704 |
7,555 |
1,539 |
7,715 |
4,922 |
1,279 |
7,196 |
8,795 |
11,991 |
9,589 |
| Skilled agricultural, forestry and fishery workers |
1,825 |
6,994 |
533 |
169 |
N.A. |
22 |
161 |
15 |
106 |
67 |
9,362 |
117 |
229 |
249 |
128 |
| Craft and related trades workers |
8,153 |
26,708 |
23,295 |
11,518 |
N.A. |
2,149 |
11,769 |
2,511 |
12,210 |
7,854 |
112 |
10,523 |
11,748 |
15,669 |
12,650 |
| Plant and machine operators, and assemblers |
12,063 |
42,361 |
17,841 |
10,354 |
N.A. |
2,674 |
14,297 |
2,650 |
12,071 |
8,969 |
12,435 |
12,714 |
15,951 |
22,679 |
18,759 |
| Elementary occupations |
128,190 |
316,958 |
250,887 |
96,969 |
N.A. |
20,539 |
66,707 |
11,501 |
54,086 |
36,777 |
14,619 |
49,109 |
60,366 |
86,436 |
76,945 |
| Other occupations |
0 |
8,945 |
61,588 |
39,385 |
N.A. |
26 |
499 |
113 |
452 |
273 |
61,428 |
326 |
340 |
321 |
274 |
| Not specified |
6,955 |
|
|
|
N.A. |
|
|
|
|
|
|
|
|
|
|
| Total |
184,801 |
442,341 |
413,182 |
198,803 |
N.A. |
32,463 |
120,261 |
22,770 |
106,156 |
74,531 |
121,634 |
99,740 |
122,574 |
167,420 |
146,200 |
Source: Register-based Labour Market Statistics, General Authority for Statistics (GAStat)
1. Data collection methodology
LFS were first conducted in 2001 and became bi-annual after 2006. Data were collected through nationally
representative household sample surveys, which sampling was based on most recent censuses.
Since 2016, Labour Force Surveys have been conducted and published on a quarterly basis, based on a
household telephone survey conducted by GAStat. Employment data extracted from administrative records
were also introduced as a complement to the results of Labour Force Surveys in Labour Market Statistics’
publications, starting on Q1 2017.
The present data is taken from administrative records.
Population of reference: workers subject to the rule of the General Organization of Social Insurance (GOSI):
a. contributors on the job who are subject to social insurance laws and regulations in the private and government sector;
b. new contributors, and contributors who terminated their contribution to social insurance during the quarter.
Figures of workers in Labor Market statistics which were derived from administrative records do not include the following categories:
1-Workers in the military and security sectors
2- Workers who are not registered in the civil service, social insurance (GOSI) and domestic workers’ records, which include:
– Saudis working for their own businesses and are not subjected to the labor regulations, also, not registered in social insurance,
such as those who work in delivery through electronic apps
– Saudi employers who work in establishments and not registered in the social insurance
– Non-Saudi staff working in foreign international, political or military missions
3- Non-Saudi employees who come to the Kingdom for work that normally takes less than three months to be completed.
Definitions and categories used by GAStat in Labour Markets Statistics (employment; unemployment;
occupation and activity sectors, etc.) are based on international standards:
For LFS methodology and definitions, see metadata section in report, and:
https://database.stats.gov.sa/Methodologies/En_Documents/03_Labor%20Market%20Bulletin%20Methodology,%20Fourth%20Quarter%202020%20_%20General%20Authority%20for%20Statistics.pdf
https://database.stats.gov.sa/Methodologies/En_Documents/03_Labor%20Market%20Bulletin%20Methodology,%20Fourth%20Quarter%202020%20_%20General%20Authority%20for%20Statistics.pdf
Classification of occupations: Saudi classification of occupations, based on ISCO-08.
https://www.stats.gov.sa/en/page/292
This classification was adopted in Q1 2021.
2. Institution which provides data
General Authority for Statistics (GAStat)
3. Data availability
Since 2021, GAStat has been publishing separately the employment data taken from administrative records,
and unemployment/inactivity data as well as general indicators, calculated from the results of the field
interviews conducted by GAStat (Labour Force Survey).
The time-series was built using the quarterly Register-based Labour Market Statistics for given quarters
2023-2025: available at:
https://www.stats.gov.sa/en/statistics-tabs/-/categories/417515?tab=436312&category=417515
Before 2023: available in the “archived data”:
https://www.stats.gov.sa/en/statistics?index=1317550
“social statistics”, and “labour force”
https://www.stats.gov.sa/en/statistics-tabs?tab=436312&category=1333429
Last date of access: 26 June 2025.
Keywords: Employment, Female Employment, Saudi Arabia, National & Foreign Labour, Highly Skilled Labour, Low-Skilled Labour
GLMM and GRC cannot guarantee that the link to access the source will not change;
that the information will not be removed from the website it was obtained from;
that no geo-blockages will be imposed; or that the information will not be available for any another reason.
|
Q3 2021 |
Q4 2021 |
Q1 2022 |
Q2 2022 |
Q3 2022 |
Q4 2022 |
Q1 2023 |
Q2 2023 |
Q3 2023 |
Q4 2023 |
Q1 2024 |
Q2 2024 |
Q3 2024 |
Q4 2024 |
Q1 2025 |
| Managers |
4,896 |
4,858 |
13,825 |
19,186 |
N.A. |
16,106 |
17,017 |
13,166 |
18,524 |
17,206 |
16,473 |
14,796 |
17,650 |
20,877 |
17,122 |
| Professionals |
29,242 |
33,395 |
41,430 |
39,565 |
N.A. |
34,093 |
34,706 |
31,632 |
57,672 |
36,677 |
35,623 |
31,985 |
54,858 |
46,207 |
34,711 |
| Technicians and associate professionals |
17,330 |
22,033 |
32,200 |
30,190 |
N.A. |
21,543 |
23,268 |
18,723 |
23,336 |
21,948 |
21,118 |
18,886 |
24,145 |
28,504 |
23,266 |
| Clerical support workers |
16,158 |
19,961 |
28,930 |
35,399 |
N.A. |
29,274 |
29,218 |
22,555 |
30,419 |
30,205 |
374 |
25,891 |
32,583 |
37,076 |
31,653 |
| Service and sales workers |
18,398 |
22,501 |
27,393 |
28,295 |
N.A. |
19,225 |
22,228 |
18,153 |
20,689 |
17,672 |
28,714 |
15,063 |
19,630 |
19,301 |
16,468 |
| Skilled agricultural, forestry and fishery workers |
41 |
29 |
45 |
62 |
N.A. |
121 |
30 |
38 |
52 |
36 |
18,367 |
29 |
65 |
56 |
23 |
| Craft and related trades workers |
910 |
1,089 |
2,435 |
1,895 |
N.A. |
1,280 |
1,424 |
1,288 |
1,732 |
1,818 |
26 |
1,241 |
1,665 |
1,937 |
1,537 |
| Plant and machine operators, and assemblers |
1,060 |
1,394 |
2,597 |
2,777 |
N.A. |
1,989 |
2,288 |
2,164 |
2,020 |
1,694 |
1,394 |
1,366 |
1,843 |
2,075 |
1,353 |
| Elementary occupations |
2,388 |
3,273 |
3,030 |
5,428 |
N.A. |
4,538 |
7,493 |
2,395 |
2,395 |
2,236 |
1,573 |
1,426 |
1,986 |
2,405 |
1,667 |
| Other occupations |
302 |
642 |
208 |
440 |
N.A. |
710 |
769 |
2,016 |
1,071 |
455 |
2,038 |
77 |
80 |
48 |
43 |
| Not specified |
23 |
|
|
|
|
|
|
|
|
|
|
|
|
|
|
| Total |
90,748 |
109,175 |
152,093 |
163,237 |
N.A. |
128,879 |
138,441 |
112,130 |
157,910 |
129,947 |
125,700 |
110,760 |
154,505 |
158,486 |
127,843 |
Source: Register-based Labour Market Statistics, General Authority for Statistics (GAStat)
1. Data collection methodology
LFS were first conducted in 2001 and became bi-annual after 2006. Data were collected through nationally
representative household sample surveys, which sampling was based on most recent censuses.
Since 2016, Labour Force Surveys have been conducted and published on a quarterly basis, based on a
household telephone survey conducted by GAStat. Employment data extracted from administrative records
were also introduced as a complement to the results of Labour Force Surveys in Labour Market Statistics’
publications, starting on Q1 2017.
The present data is taken from administrative records.
Population of reference: workers subject to the rule of the General Organization of Social Insurance (GOSI):
a. contributors on the job who are subject to social insurance laws and regulations in the private and government sector;
b. new contributors, and contributors who terminated their contribution to social insurance during the quarter.
Figures of workers in Labor Market statistics which were derived from administrative records do not include the following categories:
1-Workers in the military and security sectors
2- Workers who are not registered in the civil service, social insurance (GOSI) and domestic workers’ records, which include:
– Saudis working for their own businesses and are not subjected to the labor regulations, also, not registered in social insurance,
such as those who work in delivery through electronic apps
– Saudi employers who work in establishments and not registered in the social insurance
– Non-Saudi staff working in foreign international, political or military missions
3- Non-Saudi employees who come to the Kingdom for work that normally takes less than three months to be completed.
Definitions and categories used by GAStat in Labour Markets Statistics (employment; unemployment;
occupation and activity sectors, etc.) are based on international standards:
For LFS methodology and definitions, see metadata section in report, and:
https://database.stats.gov.sa/Methodologies/En_Documents/03_Labor%20Market%20Bulletin%20Methodology,%20Fourth%20Quarter%202020%20_%20General%20Authority%20for%20Statistics.pdf
https://database.stats.gov.sa/Methodologies/En_Documents/03_Labor%20Market%20Bulletin%20Methodology,%20Fourth%20Quarter%202020%20_%20General%20Authority%20for%20Statistics.pdf
Classification of occupations: Saudi classification of occupations, based on ISCO-08.
https://www.stats.gov.sa/en/page/292
This classification was adopted in Q1 2021.
2. Institution which provides data
General Authority for Statistics (GAStat)
3. Data availability
Since 2021, GAStat has been publishing separately the employment data taken from administrative records,
and unemployment/inactivity data as well as general indicators, calculated from the results of the field
interviews conducted by GAStat (Labour Force Survey).
The time-series was built using the quarterly Register-based Labour Market Statistics for given quarters
2023-2025: available at:
https://www.stats.gov.sa/en/statistics-tabs/-/categories/417515?tab=436312&category=417515
Before 2023: available in the “archived data”:
https://www.stats.gov.sa/en/statistics?index=1317550
“social statistics”, and “labour force”
https://www.stats.gov.sa/en/statistics-tabs?tab=436312&category=1333429
Last date of access: 26 June 2025.
Keywords: Employment, Female Employment, Saudi Arabia, National & Foreign Labour, Highly Skilled Labour, Low-Skilled Labour
GLMM and GRC cannot guarantee that the link to access the source will not change;
that the information will not be removed from the website it was obtained from;
that no geo-blockages will be imposed; or that the information will not be available for any another reason.
|
Q1 2021 |
Q2 2021 |
Q3 2021 |
Q4 2021 |
Q1 2022 |
Q2 2022 |
Q3 2022 |
Q4 2022 |
Q1 2023 |
Q2 2023 |
Q3 2023 |
Q4 2023 |
Q1 2024 |
Q2 2024 |
Q3 2024 |
Q4 2024 |
Q1 2025 |
| Managers |
59,593 |
N.A. |
58,084 |
59,943 |
56,578 |
60,605 |
N.A. |
72,390 |
86,267 |
88,204 |
97,626 |
101,704 |
112,483 |
117,229 |
122,788 |
128,916 |
133,567 |
| Professionals |
411,122 |
N.A. |
414,710 |
430,871 |
427,052 |
443,652 |
N.A. |
476,672 |
637,863 |
636,038 |
683,932 |
695,349 |
728,790 |
747,254 |
768,421 |
791,859 |
807,823 |
| Technicians and associate professionals |
546,134 |
N.A. |
513,198 |
519,965 |
468,542 |
465,679 |
N.A. |
466,276 |
527,690 |
524,435 |
525,704 |
520,995 |
537,090 |
549,211 |
556,135 |
585,931 |
590,778 |
| Clerical support workers |
53,384 |
N.A. |
49,460 |
48,845 |
43,931 |
43,134 |
N.A. |
41,084 |
49,311 |
48,764 |
47,423 |
48,307 |
48,906 |
50,184 |
51,172 |
51,311 |
52,580 |
| Service and sales workers |
291,042 |
N.A. |
268,399 |
279,740 |
288,338 |
358,485 |
N.A. |
377,223 |
477,037 |
481,255 |
513,460 |
519,819 |
554,999 |
571,991 |
583,407 |
597,509 |
611,852 |
| Skilled agricultural, forestry and fishery workers |
39,023 |
N.A. |
35,973 |
42,967 |
40,388 |
23,923 |
N.A. |
24,655 |
32,113 |
30,941 |
29,828 |
29,209 |
26,061 |
32,613 |
33,598 |
33,679 |
33,429 |
| Craft and related trades workers |
1,003,685 |
N.A. |
893,833 |
905,384 |
832,316 |
866,260 |
N.A. |
925,634 |
1,109,393 |
1,112,592 |
1,227,008 |
1,219,812 |
1,249,368 |
1,255,352 |
1,245,444 |
1,246,231 |
1,250,151 |
| Plant and machine operators, and assemblers |
699,046 |
N.A. |
644,503 |
685,202 |
644,041 |
679,059 |
N.A. |
736,219 |
951,124 |
960,110 |
992,940 |
997,973 |
1,077,856 |
1,119,151 |
1,158,355 |
1,200,514 |
1,233,514 |
| Elementary occupations |
3,178,852 |
N.A. |
3,018,243 |
3,305,055 |
3,575,105 |
3,521,264 |
N.A. |
4,175,442 |
3,879,858 |
3,926,310 |
3,951,596 |
3,928,787 |
4,248,284 |
4,454,259 |
4,625,076 |
4,897,848 |
5,158,320 |
| Other Occupations |
998 |
N.A. |
933 |
12,524 |
346,698 |
636,608 |
N.A. |
46,028 |
57,191 |
55,233 |
46,674 |
42,348 |
38,910 |
37,099 |
34,023 |
10,915 |
10,873 |
| Not specified |
18,913 |
N.A. |
125,741 |
0 |
0 |
0 |
N.A. |
0 |
0 |
0 |
0 |
0 |
0 |
0 |
|
|
|
| Total |
6,301,792 |
N.A. |
6,023,077 |
6,290,496 |
6,722,989 |
7,098,669 |
N.A. |
7,341,623 |
7,807,847 |
7,863,882 |
8,116,191 |
8,104,303 |
8,622,747 |
8,934,343 |
9,178,419 |
9,544,713 |
9,882,887 |
Source: Register-based Labour Market Statistics, General Authority for Statistics (GAStat)
1. Data collection methodology
LFS were first conducted in 2001 and became bi-annual after 2006. Data were collected through nationally
representative household sample surveys, which sampling was based on most recent censuses.
Since 2016, Labour Force Surveys have been conducted and published on a quarterly basis, based on a
household telephone survey conducted by GAStat. Employment data extracted from administrative records
were also introduced as a complement to the results of Labour Force Surveys in Labour Market Statistics’
publications, starting on Q1 2017.
The present data is taken from administrative records.
Population of reference: workers subject to the rule of the General Organization of Social Insurance (GOSI):
a. contributors on the job who are subject to social insurance laws and regulations in the private and government sector;
b. new contributors, and contributors who terminated their contribution to social insurance during the quarter.
Figures of workers in Labor Market statistics which were derived from administrative records do not include the following category:
1-Workers in the military and security sectors
2- Workers who are not registered in the civil service, social insurance (GOSI) and domestic workers’ records, which include:
– Saudis working for their own businesses and are not subjected to the labor regulations, also, not registered in social
such as those who work in delivery through electronic apps
– Saudi employers who work in establishments and not registered in the social insurance
– Non-Saudi staff working in foreign international, political or military missions
3- Non-Saudi employees who come to the Kingdom for work that normally takes less than three months to be completed.
Definitions and categories used by GAStat in Labour Markets Statistics (employment; unemployment; occupation and activity sectors, etc.) are based on international standards:
For LFS methodology and definitions, see metadata section in report, and:
https://database.stats.gov.sa/Methodologies/En_Documents/03_Labor%20Market%20Bulletin%20Methodology,%20Fourth%20Quarter%202020%20_%20General%20Authority%20for%20Statistics.pdf
https://database.stats.gov.sa/Methodologies/En_Documents/03_Labor%20Market%20Bulletin%20Methodology,%20Fourth%20Quarter%202020%20_%20General%20Authority%20for%20Statistics.pdf
Classification of occupations: Saudi classification of occupations, based on ISCO-08.
https://www.stats.gov.sa/en/page/292
This classification was adopted in Q1 2021.
2. Institution which provides data
General Authority for Statistics (GAStat)
3. Data availability
Since 2021, GAStat has been publishing separately the employment data taken from administrative records,
and unemployment/inactivity data as well as general indicators, calculated from the results of the field
interviews conducted by GAStat (Labour Force Survey).
The time-series was built using the quarterly Register-based Labour Market Statistics for given quarters
2023-2025: available at:
https://www.stats.gov.sa/en/statistics-tabs/-/categories/417515?tab=436312&category=417515
Before 2023: available in the “archived data”:
https://www.stats.gov.sa/en/statistics?index=1317550
“social statistics”, and “labour force”
https://www.stats.gov.sa/en/statistics-tabs?tab=436312&category=1333429
Last date of access: 26 June 2025.
Keywords: Employment, Female Employment, Saudi Arabia, National & Foreign Labour, Highly Skilled Labour, Low-Skilled Labour
GLMM and GRC cannot guarantee that the link to access the source will not change;
that the information will not be removed from the website it was obtained from;
that no geo-blockages will be imposed; or that the information will not be available for any another reason.
|
Q1 2021 |
Q2 2021 |
Q3 2021 |
Q4 2021 |
Q1 2022 |
Q2 2022 |
Q3 2022 |
Q4 2022 |
Q1 2023 |
Q2 2023 |
Q3 2023 |
Q4 2023 |
Q1 2024 |
Q2 2024 |
Q3 2024 |
Q4 2024 |
Q1 2025 |
| Managers |
171,170 |
N.A. |
174,655 |
178,279 |
160,094 |
171,786 |
N.A. |
224,625 |
229,566 |
226,320 |
232,999 |
238,405 |
242,139 |
244,929 |
247,023 |
253,229 |
255,228 |
| Professionals |
441,456 |
N.A. |
476,951 |
542,698 |
467,095 |
487,938 |
N.A. |
699,468 |
724,064 |
734,689 |
788,396 |
811,369 |
836,756 |
823,212 |
876,449 |
911,583 |
931,328 |
| Technicians and associate professionals |
426,127 |
N.A. |
426,307 |
441,778 |
365,196 |
372,246 |
N.A. |
419,946 |
432,897 |
438,509 |
452,029 |
463,192 |
470,379 |
517,519 |
522,529 |
537,169 |
540,022 |
| Clerical support workers |
476,471 |
N.A. |
469,195 |
469,128 |
374,126 |
396,166 |
N.A. |
532,094 |
535,763 |
530,661 |
531,559 |
539,406 |
541,860 |
559,927 |
557,755 |
564,531 |
565,995 |
| Service and sales workers |
274,526 |
N.A. |
294,921 |
310,589 |
265,893 |
272,745 |
N.A. |
339,027 |
342,902 |
339,689 |
348,242 |
347,917 |
347,906 |
339,705 |
342,202 |
343,289 |
342,245 |
| Skilled agricultural, forestry and fishery workers |
1,436 |
N.A. |
1,386 |
1,427 |
1,047 |
1,024 |
N.A. |
1,650 |
1,592 |
1,597 |
1,598 |
1,606 |
1,581 |
1,575 |
1,721 |
1,726 |
1,707 |
| Craft and related trades workers |
42,153 |
N.A. |
42,992 |
44,001 |
33,087 |
38,163 |
N.A. |
47,953 |
48,172 |
48,324 |
48,975 |
50,418 |
51,147 |
51,346 |
50,907 |
52,072 |
54,038 |
| Plant and machine operators, and assemblers |
71,695 |
N.A. |
73,584 |
75,335 |
60,527 |
59,311 |
N.A. |
78,179 |
78,484 |
78,613 |
78,451 |
79,375 |
79,147 |
70,105 |
70,197 |
71,141 |
71,040 |
| Elementary occupations |
134,410 |
N.A. |
134,833 |
136,359 |
102,343 |
97,466 |
N.A. |
136,319 |
142,487 |
139,752 |
124,377 |
121,991 |
119,089 |
125,805 |
123,272 |
121,052 |
116,385 |
| Other Occupations |
37,979 |
N.A. |
38,417 |
41,218 |
544,082 |
546,108 |
N.A. |
102,154 |
95,261 |
93,050 |
90,171 |
84,751 |
80,681 |
38,297 |
38,184 |
37,980 |
37,912 |
| Not specified |
12,020 |
N.A. |
2,067 |
|
|
|
N.A. |
|
|
|
|
|
|
|
|
|
|
| Total |
2,089,443 |
N.A. |
2,135,308 |
2,240,812 |
2,373,490 |
2,442,953 |
N.A. |
2,581,415 |
2,631,188 |
2,631,204 |
2,696,797 |
2,738,430 |
2,770,685 |
2,772,420 |
2,830,239 |
2,893,772 |
2,915,900 |
Source: Register-based Labour Market Statistics, General Authority for Statistics (GAStat)
1. Data collection methodology
LFS were first conducted in 2001 and became bi-annual after 2006. Data were collected through nationally
representative household sample surveys, which sampling was based on most recent censuses.
Since 2016, Labour Force Surveys have been conducted and published on a quarterly basis, based on a
household telephone survey conducted by GAStat. Employment data extracted from administrative records
were also introduced as a complement to the results of Labour Force Surveys in Labour Market Statistics’
publications, starting on Q1 2017.
The present data is taken from administrative records.
Population of reference: workers subject to the rule of the General Organization of Social Insurance (GOSI):
a. contributors on the job who are subject to social insurance laws and regulations in the private and government sector;
b. new contributors, and contributors who terminated their contribution to social insurance during the quarter.
Figures of workers in Labor Market statistics which were derived from administrative records do not include the following
1-Workers in the military and security sectors
2- Workers who are not registered in the civil service, social insurance (GOSI) and domestic workers’ records, which include:
– Saudis working for their own businesses and are not subjected to the labor regulations, also, not registered in social
such as those who work in delivery through electronic apps
– Saudi employers who work in establishments and not registered in the social insurance
– Non-Saudi staff working in foreign international, political or military missions
3- Non-Saudi employees who come to the Kingdom for work that normally takes less than three months to be completed.
Definitions and categories used by GAStat in Labour Markets Statistics (employment; unemployment;
occupation and activity sectors, etc.) are based on international standards:
For LFS methodology and definitions, see metadata section in report, and:
https://database.stats.gov.sa/Methodologies/En_Documents/03_Labor%20Market%20Bulletin%20Methodology,%20Fourth%20Quarter%202020%20_%20General%20Authority%20for%20Statistics.pdf
https://database.stats.gov.sa/Methodologies/En_Documents/03_Labor%20Market%20Bulletin%20Methodology,%20Fourth%20Quarter%202020%20_%20General%20Authority%20for%20Statistics.pdf
Classification of occupations: Saudi classification of occupations, based on ISCO-08.
https://www.stats.gov.sa/en/page/292
This classification was adopted in Q1 2021.
2. Institution which provides data
General Authority for Statistics (GAStat)
3. Data availability
Since 2021, GAStat has been publishing separately the employment data taken from administrative records,
and unemployment/inactivity data as well as general indicators, calculated from the results of the field
interviews conducted by GAStat (Labour Force Survey).
The time-series was built using the quarterly Register-based Labour Market Statistics for given quarters
2023-2025: available at:
https://www.stats.gov.sa/en/statistics-tabs/-/categories/417515?tab=436312&category=417515
Before 2023: available in the “archived data”:
https://www.stats.gov.sa/en/statistics?index=1317550
“social statistics”, and “labour force”
https://www.stats.gov.sa/en/statistics-tabs?tab=436312&category=1333429
Last date of access: 26 June 2025.
Keywords: Employment, Female Employment, Saudi Arabia, National & Foreign Labour, Highly Skilled Labour, Low-Skilled
GLMM and GRC cannot guarantee that the link to access the source will not change;
that the information will not be removed from the website it was obtained from;
that no geo-blockages will be imposed; or that the information will not be available for any another reason.
|
|
|
2013 |
2014 |
2015 |
2016 |
2017 |
2018 |
2019 |
2020 |
2021 |
2022 |
2023 |
2024 |
| Bahrain |
nationals |
males |
64.0 |
64.1 |
63.4 |
63.2 |
63.2 |
63.2 |
63.2 |
63.2 |
n.a. |
n.a. |
n.a. |
n.a. |
| females |
32.2 |
32.3 |
32.3 |
32.2 |
32.2 |
32.2 |
32.2 |
32.2 |
n.a. |
n.a. |
n.a. |
n.a. |
| non-nationals |
males |
98.1 |
97.6 |
97.9 |
97.8 |
97.8 |
n.a. |
n.a. |
n.a. |
n.a. |
n.a. |
n.a. |
n.a. |
| females |
58.7 |
57.2 |
58.2 |
58.2 |
58.2 |
n.a. |
n.a. |
n.a. |
n.a. |
n.a. |
n.a. |
n.a. |
| Kuwait |
nationals |
males |
56.3 |
54.2 |
52.6 |
47.7 |
47.7 |
n.a. |
n.a. |
n.a. |
47.7 |
n.a. |
n.a. |
n.a. |
| females |
40.3 |
37.6 |
39.3 |
30.8 |
30.8 |
n.a. |
n.a. |
n.a. |
45.0 |
n.a. |
n.a. |
n.a. |
| non-nationals |
males |
84.8 |
94.2 |
95.3 |
95.5 |
95.5 |
n.a. |
n.a. |
n.a. |
91.9 |
n.a. |
n.a. |
n.a. |
| females |
58.6 |
61.3 |
65.8 |
65.5 |
65.5 |
n.a. |
n.a. |
n.a. |
63.5 |
n.a. |
n.a. |
n.a. |
| Oman |
nationals |
males |
n.a. |
n.a. |
n.a. |
39.3 |
39.3 |
39.2 |
40.7 |
40.7 |
n.a. |
n.a. |
n.a. |
n.a. |
| females |
n.a. |
n.a. |
n.a. |
21.7 |
22.4 |
21.7 |
23.7 |
23.7 |
n.a. |
n.a. |
n.a. |
n.a. |
| non-nationals |
males |
n.a. |
n.a. |
n.a. |
n.a. |
n.a. |
n.a. |
n.a. |
n.a. |
n.a. |
n.a. |
n.a. |
n.a. |
| females |
n.a. |
n.a. |
n.a. |
n.a. |
n.a. |
n.a. |
n.a. |
n.a. |
n.a. |
n.a. |
n.a. |
n.a. |
| Qatar |
nationals |
males |
70.0 |
68.9 |
68.6 |
68.5 |
68.2 |
68.1 |
67.9 |
66.4 |
66.7 |
66.1 |
66.0 |
66.0 |
| females |
34.7 |
35.0 |
36.1 |
36.9 |
36.7 |
37.1 |
37.6 |
37.0 |
42.0 |
42.9 |
43.5 |
44.1 |
| non-nationals |
males |
97.9 |
97.8 |
97.8 |
98.0 |
97.6 |
97.6 |
97.5 |
97.5 |
97.2 |
97.1 |
97.3 |
97.4 |
| females |
59.0 |
59.4 |
64.9 |
64.6 |
64.5 |
64.2 |
63.7 |
64.3 |
64.2 |
66.4 |
68.4 |
68.7 |
| Saudi Arabia |
nationals |
males |
64.6 |
64.9 |
63.3 |
64.6 |
63.4 |
63.0 |
66.6 |
68.5 |
65.6 |
67.3 |
65.4 |
66.2 |
| females |
16.4 |
17.6 |
17.4 |
19.0 |
19.4 |
20.2 |
26.0 |
33.2 |
34.7 |
35.5 |
35.0 |
36.0 |
| non-nationals |
males |
94.2 |
93.4 |
93.7 |
93.3 |
94.2 |
93.8 |
93.6 |
92.4 |
92.6 |
94.0 |
95.3 |
93.2 |
| females |
31.2 |
28.7 |
33.1 |
22.8 |
24.2 |
25.9 |
28.8 |
29.3 |
34.0 |
32.1 |
33.8 |
27.9 |
| UAE |
nationals |
males |
n.a. |
n.a. |
n.a. |
64.1 |
62.9 |
60.4 |
62.2 |
62.2 |
n.a. |
n.a. |
n.a. |
n.a. |
| females |
n.a. |
n.a. |
n.a. |
30.9 |
32.4 |
32.3 |
33.2 |
33.2 |
n.a. |
n.a. |
n.a. |
n.a. |
| non-nationals |
males |
n.a. |
n.a. |
n.a. |
95.0 |
94.6 |
95.1 |
94.2 |
n.a. |
n.a. |
n.a. |
n.a. |
n.a. |
| females |
n.a. |
n.a. |
n.a. |
54.3 |
55.9 |
55.9 |
61.1 |
n.a. |
n.a. |
n.a. |
n.a. |
n.a. |
Sources: GCC-Stat Center and national institutes of statistics
1- Definitions and remarks:
Labour Force Participation Rates (LFPR) refer to the percentage of active (employed or unemployed) population aged 15 and above in the category (sex and nationality).
Ex.: 22.8% of foreign women aged 15 and above in Saudi Arabia are economically active in 2016 (i.e.: officially registered as employed or unemployed).
2- Sources of data:
Data published by the GCC Stat Center are supplied by individual countries and republished without adjustment.
Figures are the same in GCC-Stat and national publications, unless stated otherwise.
Nationals:
Until 2020:
GCC Stat. Labour Statistics in GCC Countries, issues of 2017; 2019; 2020.
https://gccstat.org/en/statistic/publications/labor-statistics
https://www.gccstat.org/ar/statistic/publications/labor-statistics
2017-2020: GCC-Stat publications provide figures for nationals only.
2021-2024:
National sources:
Bahrain
No data on participation rates available from Information and eGovernment Authority (IGA) and from Bahrain Open Data portal.
Bahrain census 2020 data do not match data for Bahrain as reproduced in GCC-Stat Labour Statistics publication (in table).
Bahraini males’ LFPR: 59.6 percent
Bahraini females’ LFPR: 42.7 percent
Source: census 2020
https://www.data.gov.bh/explore/dataset/population-15-years-and-above-by-labour-force-participation-nationality-and-sex-/
Kuwait
2018-2020; 2022-2024: no data on participation rates available from CSB, Kuwait NSO.
PACI and other relevant institutions’ websites cannot be accessed from outside Kuwait.
2021: census data
https://census.csb.gov.kw/CensusData_EN?CatID=5
Oman
No data on participation rates available from NCSI, Oman’s NSO.
Oman Census 2020 data do not match data for Oman as reproduced in GCC-Stat Labour Statistics publication (in table).
Omani males’ LFPR: 70.6 percent
Omani females’ LFPR: 52.6 percent
Source: census 2020
https://portal.ecensus.gov.om/ecen-portal/?lang=en
Qatar
2013-2023: National Planning Council (NPC). Annual Bulletin of Labour Force Sample Survey, given years
https://www.npc.qa/en/statistics/pages/subjectdetails.aspx#
2024: NPC. Quarterly Bulletin. Labour Force Sample Survey, Q4 2024
https://www.npc.qa/en/statistics/pages/subjectdetails.aspx#
Saudi Arabia
GAStat. Labour Market Statistics, Q4 2021 to 2024
As of July 2025, Labour Force Survey data from Q1 2021 to Q1 2024 were revised and backcasted, based on 2022 population census results.
Therefore, the present rates may differ from earlier estimates based on previous Labour Force Surveys’ sampling base
Quarterly Labour Market Statistics reports are accessible from:
https://www.stats.gov.sa/en/statistics?index=119025
https://www.stats.gov.sa/statistics?index=119025
Data from GCC-Stat and GAStat are for Q4 of every given year.
UAE
FCSC. Labour Force Survey results, given years
https://fcsc.gov.ae/#/%3Fsubject=Demography%20and%20Social&folder=Demography%20and%20Social/Labour%20Force/Labor%20Force
2010- 2016: no data
2021-2024: no data disaggregated by nationality in national statistics.
Non-nationals:
Until 2017:
GCC Stat. Labour Statistics in GCC Countries 2019
https://gccstat.org/en/statistic/publications/labor-statistics
https://www.gccstat.org/ar/statistic/publications/labor-statistics
2017-2022:
National sources:
Bahrain
No data on participation rates from Information and eGovernment Authority (IGA) and from Bahrain Open Data portal.
Census 2020:
Non-Bahraini males’ economic participation rate: 97.4 percent
Non-Bahraini females’ economic participation rate: 58.6 percent
Source: census 2020
https://www.data.gov.bh/explore/dataset/population-15-years-and-above-by-labour-force-participation-nationality-and-sex-/
Kuwait
2018-2020; 2022-2024: no data on participation rates available from CSB, Kuwait NSO.
PACI and other relevant institutions’ websites cannot be accessed from outside Kuwait.
2021: census data
https://census.csb.gov.kw/CensusData_EN?CatID=5
Oman
No data on participation rates available from NCSI, Oman’s NSO.
Unemployment benefit not accessible to non-nationals; no data available on unemployment among non-nationals.
Estimate below is based on inactivity rates calculated from census 2020 results:
Non-Omani males’ LFPR: 95.5 percent
Non-Omani females’ LFPR: 66.4 percent
Source: census 2020
https://portal.ecensus.gov.om/ecen-portal/?lang=en
Qatar
2013-2023: National Planning Council (NPC). Annual Bulletin of Labour Force Sample Survey, given years
https://www.npc.qa/en/statistics/pages/subjectdetails.aspx#
2024: NPC. Quarterly Bulletin. Labour Force Sample Survey, Q4 2024
https://www.npc.qa/en/statistics/pages/subjectdetails.aspx#
Saudi Arabia
GAStat. Labour Market Statistics, Q4 2021 to 2024
As of July 2025, Labour Force Survey data from Q1 2021 to Q1 2024 were revised and backcasted, based on 2022 population census results.
Therefore, the present rates may differ from earlier estimates based on previous Labour Force Surveys’ sampling base.
Quarterly Labour Market Statistics reports are accessible from:
https://www.stats.gov.sa/en/statistics?index=119025
https://www.stats.gov.sa/statistics?index=119025.
Data from GCC-Stat and GAStat are for Q4 of every given year.
UAE
2010- 2016: no data
2017-2019:
FCSC. Labour Force Survey results, given years
https://fcsc.gov.ae/en-us/Pages/Statistics/Statistics-by-Subject.aspx#/%3Fsubject=Demography%20and%20Social&folder=Demography%20and%20Social/Labour%20Force/Labor%20Force
2020-2024: no data disaggregated by nationality.
Keywords:Gulf Cooperation Council, Bahrain, Oman, Kuwait, Saudi Arabia, Qatar, United Arab Emirates, National & Foreign Labour, National Labour, Foreign Labour, Female Employment
Last accessed: 7 July 2025.
GLMM and GRC cannot guarantee that the link to access the source will not change;
that the information will not be removed from the website it was obtained from;
that no geo-blockages will be imposed; or that the information will not be available for any another reason.
|
|
|
|
|
|
|
|
|
|
|
Saudis |
Non-Saudis |
Total population |
| |
Males |
Females |
Total |
Males |
Females |
Total |
Males |
Females |
Total |
| 2010 |
7,066,599 |
6,979,565 |
14,046,164 |
7,156,237 |
2,776,086 |
9,932,323 |
14,222,836 |
9,755,651 |
23,978,487 |
| 2011 |
7,210,243 |
7,131,886 |
14,342,129 |
7,896,884 |
2,852,854 |
10,749,738 |
15,107,127 |
9,984,740 |
25,091,867 |
| 2012 |
7,380,972 |
7,302,574 |
14,683,546 |
8,568,573 |
2,916,742 |
11,485,315 |
15,949,545 |
10,219,316 |
26,168,861 |
| 2013 |
7,581,015 |
7,498,386 |
15,079,401 |
9,469,421 |
3,075,182 |
12,544,603 |
17,050,436 |
10,573,568 |
27,624,004 |
| 2014 |
7,812,695 |
7,722,341 |
15,535,036 |
9,641,977 |
3,132,260 |
12,774,237 |
17,454,672 |
10,854,601 |
28,309,273 |
| 2015 |
8,029,058 |
7,939,013 |
15,968,071 |
10,621,855 |
3,226,456 |
13,848,311 |
18,650,913 |
11,165,469 |
29,816,382 |
| 2016 |
8,218,925 |
8,136,387 |
16,355,312 |
11,296,387 |
3,302,499 |
14,598,886 |
19,515,312 |
11,438,886 |
30,954,198 |
| 2017 |
8,383,654 |
8,313,326 |
16,696,980 |
10,949,843 |
3,330,532 |
14,280,375 |
19,333,497 |
11,643,858 |
30,977,355 |
| 2018 |
8,578,445 |
8,507,191 |
17,085,636 |
10,002,472 |
3,108,173 |
13,110,645 |
18,580,917 |
11,615,364 |
30,196,281 |
| 2019 |
8,790,733 |
8,716,438 |
17,507,171 |
9,553,850 |
3,002,778 |
12,556,628 |
18,344,583 |
11,719,216 |
30,063,799 |
| 2020 |
9,030,279 |
8,948,308 |
17,978,587 |
10,248,548 |
3,325,375 |
13,573,923 |
19,278,827 |
12,273,683 |
31,552,510 |
| 2021 |
9,228,524 |
9,152,145 |
18,380,669 |
9,341,023 |
3,062,691 |
12,403,714 |
18,569,547 |
12,214,836 |
30,784,383 |
| 2022 |
9,434,131 |
9,358,131 |
18,792,262 |
10,244,464 |
3,138,498 |
13,382,962 |
19,678,595 |
12,496,629 |
32,175,224 |
| 2023 |
9,641,422 |
9,604,507 |
19,245,929 |
11,153,512 |
3,303,290 |
14,456,802 |
20,794,934 |
12,907,797 |
33,702,731 |
| 2024 |
9,827,595 |
9,807,663 |
19,635,258 |
12,088,577 |
3,576,445 |
15,665,022 |
21,916,172 |
13,384,108 |
35,300,280 |
Source: GAStat
ANNEXED NOTE
1. Technical Notes and Definitions
2023-2024: The methodology involves estimating the population for each age group, as well as gender and nationality, following international standards and practices. The General Authority for Statistics uses the (Method Component-Cohort) approach, leveraging data from various sources, including the National Information Center for administrative records to provide key components such as births, deaths, and migration. Changes in the demographic characteristics for 2024 are assessed against the previous population report from the Authority, using data from the 2022 Saudi Census.
https://www.stats.gov.sa/documents/20117/2435273/Population+Estimates+Statistics+2024+EN.pdf/9b71e303-5fd9-19cb-9913-850a9d521639?t=1738859947691
Methodological report:
https://www.stats.gov.sa/documents/20117/2435133/Methodology+and+Quality+Report+for+Population+Projections+and+Estimates+Statistics+_EN.pdf/0fdb394f-8a13-82e0-ed7c-c240b338d25f?t=1738829096975
2010-2022: Source: Saudi census 2022
Date of reference: 10 May 2022
Population of reference: Families and individual citizens and residents within the Kingdom, regardless of the status of their identification documents.
Visitors for Hajj, Umrah and tourism are excluded from the census.
Methodology:
The first phase of the 2020 census began on 3 February 2020 (enumeration of buildings and households). Census 2022 used geospatial data, including satellite images, electricity consumption and mobile phone data, to improve the accuracy and geographic coverage of address canvassing. The 2022 census used a combined methodology – administrative records, fieldwork and digital self-enumeration.
Household data were collected from e-portals of self-enumeration (on residents’ mobile devices, laptops or personal computers, or self-enumeration stations/kiosks, located in shopping centers).
The digital self-enumeration process was complemented by face-to-face interviews, using digital tablets.
Census 2022 used a de jure approach: enumerating people according to their usual place of residence.
Administrative data from multiple sources was used to cross-validate collected census data.
Census 2022 was designed as a launchpad for several new secure statistical data registers for population, housing, and businesses.
See census methodology in:
https://portal.saudicensus.sa/portal/public/methodology
Portal of the Saudi census:
https://portal.saudicensus.sa/portal
Population data for 2010-22 were revised and backcasted, based on 2022 population census and past years’ administrative data.
2. Institution which provides data
General Authority for Statistics (GAStat)
3. Data availability
2010-2022: retrieved from the Saudi census section on GAStat website:
https://portal.saudicensus.sa/portal
Accessible from the “Statistics” section, then “Social Statistics”, “Vitals and Demographics Statistics”, Saudi census statistics 2022
https://www.stats.gov.sa/en/statistics?index=119025&subindex=127380#
“Population statistics” section, then “Population growth statistics”
https://portal.saudicensus.sa/portal/public/1/15?type=TABLE
Selected, pre-set tables can be downloaded from the thematic section.
2023-2024: “Statistics”, “Social Statistics”, “Vitals and Demographics Statistics”, “population estimates statistics”.
https://www.stats.gov.sa/en/statistics-tabs?tab=436312&category=2366987
Last date of access: 10 March 2025.
GLMM and GRC cannot guarantee that the link to access the source will not change;
that the information will not be removed from the website it was obtained from;
that no geo-blockages will be imposed; or that the information will not be available for any another reason.
Keywords: Saudi Arabia, Foreign Population, National Population, Foreign & National Populations
|
Saudis |
Non-Saudis |
Total |
|
Males |
Females |
Total |
Males |
Females |
Total |
Males |
Females |
Total |
| No schooling |
26.7 |
10.1 |
13.6 |
89.3 |
47.4 |
71.4 |
72.0 |
23.1 |
42.3 |
| Early childhood education |
34.2 |
13.2 |
18.3 |
95.9 |
28.4 |
79.6 |
83.4 |
17.5 |
52.2 |
| Primary education |
37.1 |
19.6 |
26.6 |
96.3 |
34.3 |
86.8 |
86.0 |
25.0 |
68.3 |
| Lower secondary education |
22.4 |
12.9 |
17.5 |
92.3 |
25.5 |
80.9 |
73.9 |
17.4 |
56.9 |
| Upper secondary education |
67.7 |
29.8 |
50.4 |
89.5 |
24.1 |
75.1 |
80.5 |
27.9 |
62.8 |
| Post-secondary non-tertiary education |
82.6 |
56.0 |
74.4 |
95.4 |
22.5 |
86.6 |
88.6 |
48.9 |
79.4 |
| Short-cycle tertiary education |
84.2 |
59.7 |
76.5 |
95.8 |
24.5 |
87.0 |
89.7 |
52.0 |
80.9 |
| Bachelor’s or equivalent level |
89.2 |
60.2 |
73.3 |
97.1 |
22.8 |
80.1 |
93.8 |
50.5 |
76.4 |
| Master’s or equivalent level |
91.9 |
84.8 |
89.4 |
96.8 |
38.5 |
83.6 |
94.9 |
64.1 |
86.1 |
| Doctoral or equivalent level |
91.7 |
93.8 |
92.4 |
96.4 |
80.6 |
93.0 |
94.9 |
86.3 |
92.8 |
| Total |
66.2 |
36.0 |
51.1 |
93.2 |
27.9 |
79.9 |
83.6 |
33.5 |
66.4 |
Source: Labour Market Statistics, General Authority for Statistics (GAStat)
1. Data collection methodology and definitions used
Labour Force Surveys were first conducted in 2001 and became bi-annual after 2006. Data were collected through nationally representative household sample surveys, which sampling was based on most recent censuses.
Since 2016, Labour Force Surveys have been conducted and published on a quarterly basis, based onthe following sources:
1. Household telephone surveys conducted by GAStat.
2. Employment data extracted from administrative records, introduced as a complement to the results of Labour Force Surveys in Labour Market Statistics’ publications, starting on Q1 2017.
Types of data by source:
1. Household Telephone Surveys:
Estimates of labor force, characteristics of the unemployed and inactive
The survey provides estimates of the working-age populations (aged 15 years and above), inside and outside the labour force, the characteristics of the inactive and unemployed populations), and supplies the data to calculate key indicators of labour market such as the unemployment and the labour force participation rates.
2. Administrative records:
– Ministry of Human Resources and Social Development (MHRSD)
(formerly Ministry of Labour and Social Development):
Supplies data on:
Employees on the job Subject to the rules and regulations of the Civil Service
– General Organization of Social Insurance (GOSI):
Supplies data on:
a. contributors on the job who are subject to social insurance laws and regulations in the private and government sector;
b. new contributors, and contributors who terminated their contribution to social insurance during the quarter.
– National Information Center (NIC):
Supplies data on:
a. domestic workers.
The present data is based on estimates drawn from the results of the quarterly Labour Force Survey,
revised on the basis of the results of census 2022.
LFS results are published as rates only. Numerical estimates are unavailable.
Definitions:
Population in the labour force:
Individuals (15 years and above) who contribute or are ready to contribute to the production of commodities and services during the reference period of the survey. The labour force includes the employed and unemployed populations.
Population outside the labour force:
Individuals (15 years and above) who is not classified as part of the labour force because they do not
work, do not seek a job, are unable to work, or are not ready to work during the survey reference period.
For example: Students, housewives, retired persons who do not work, individuals unable or unwilling to
work, or who do not look for a job for other reasons.
Labour force participation rate = (total labour force ÷ total population of working age (aged 15 years and over)) x 100
Classification used for levels of education: (ISCED_11) and for fields of education: (ISCED_13)
As of July 2024, Labour Force Survey data from Q1 2021 to Q1 2024 were revised and backcasted, based on 2022 population census results.
Therefore, the present rates may differ from earlier estimates based on previous Labour Force Surveys’ sampling base.
Technical note on backcasting:
https://database.stats.gov.sa/Methodologies/En_Documents/40_Technical%20Note%20Population%20Back%20Casting.PDF
Definitions and categories used by GAStat in Labour Markets Statistics (employment; unemployment; occupation and activity sectors, etc.) are based on international standards:
For LFS methodology and definitions, see:
https://www.stats.gov.sa/en/w/lfs-1
https://www.stats.gov.sa/w/lfs-1
2. Institution which provides data
General Authority for Statistics (GAStat)
3. Data availability
Since 2021, GAStat has been publishing separately the employment data taken from administrative records,
and unemployment/inactivity data as well as general indicators, calculated from the results of the field
interviews conducted by GAStat (Labour Force Survey).
The present time-series was taken from the Labour Market Statistics- Q4, 2024 (Excel and PDF formats)
https://www.stats.gov.sa/en/statistics-tabs?tab=436312&category=417515
https://www.stats.gov.sa/statistics-tabs?tab=436312&category=417515
Quarterly Register-based Labour Market Statistics reports are accessible from:
https://www.stats.gov.sa/en/statistics?index=119025
https://www.stats.gov.sa/statistics?index=119025
Date of access: 22 June 2025.
Keywords: Employment, Unemployment, Female Employment, Saudi Arabia, National & Foreign Labour
GLMM and GRC cannot guarantee that the link to access the source will not change;
that the information will not be removed from the website it was obtained from;
that no geo-blockages will be imposed; or that the information will not be available for any another reason.
|
Saudis |
Non Saudis |
Total |
| Males |
Females |
Total |
Males |
Females |
Total |
Males |
Females |
Total |
| 2021 Q1 |
64.8 |
31.9 |
48.3 |
93.6 |
38.5 |
82.0 |
82.2 |
33.8 |
64.8 |
| 2021 Q2 |
65.0 |
32.1 |
48.5 |
92.8 |
38.5 |
81.0 |
81.4 |
33.9 |
64.1 |
| 2021 Q3 |
65.1 |
34.3 |
49.6 |
92.7 |
41.0 |
81.2 |
81.2 |
36.2 |
64.6 |
| 2021 Q4 |
65.6 |
34.7 |
50.1 |
92.6 |
34.0 |
79.8 |
81.5 |
34.5 |
64.4 |
| 2022 Q1 |
65.1 |
33.3 |
49.1 |
91.6 |
33.4 |
79.3 |
81.0 |
33.3 |
63.9 |
| 2022 Q2 |
66.5 |
35.1 |
50.8 |
92.9 |
32.5 |
80.4 |
82.6 |
34.3 |
65.4 |
| 2022 Q3 |
66.3 |
36.5 |
51.4 |
93.9 |
32.8 |
81.1 |
83.2 |
35.4 |
66.3 |
| 2022 Q4 |
67.3 |
35.5 |
51.5 |
94.0 |
32.1 |
81.3 |
83.8 |
34.5 |
66.5 |
| 2023 Q1 |
67.1 |
35.5 |
51.4 |
93.9 |
34.8 |
81.9 |
83.8 |
35.3 |
66.9 |
| 2023 Q2 |
66.3 |
34.8 |
50.7 |
93.5 |
31.9 |
80.8 |
83.2 |
33.9 |
66.1 |
| 2023 Q3 |
65.7 |
35.4 |
50.8 |
93.8 |
32.6 |
81.2 |
83.2 |
34.6 |
66.4 |
| 2023 Q4 |
65.4 |
35.0 |
50.4 |
95.3 |
33.8 |
82.5 |
84.1 |
34.6 |
67.0 |
| 2024 Q1 |
66.4 |
35.8 |
51.4 |
93.3 |
28.3 |
79.6 |
83.2 |
33.4 |
66.0 |
| 2024 Q2 |
66.3 |
35.4 |
50.8 |
93.4 |
28.9 |
80.3 |
83.6 |
33.4 |
66.2 |
| 2024 Q3 |
66.9 |
36.2 |
51.5 |
93.6 |
27.9 |
80.2 |
84.0 |
33.6 |
66.6 |
| 2024 Q4 |
66.2 |
36.0 |
51.1 |
93.2 |
27.9 |
79.9 |
83.6 |
33.5 |
66.4 |
Source: Labour Market Statistics, General Authority for Statistics (GAStat)
1. Data collection methodology and definitions used
Labour Force Surveys were first conducted in 2001 and became bi-annual after 2006. Data were collected through nationally representative household sample surveys, which sampling was based on most recent censuses.
Since 2016, Labour Force Surveys have been conducted and published on a quarterly basis, based onthe following sources:
1. Household telephone surveys conducted by GAStat.
2. Employment data extracted from administrative records, introduced as a complement to the results of
Labour Force Surveys in Labour Market Statistics’ publications, starting on Q1 2017.
Types of data by source:
1. Household Telephone Surveys:
Estimates of labor force, characteristics of the unemployed and inactive
The survey provides estimates of the working-age populations (aged 15 years and above), inside and outside the labour force, the characteristics of the inactive and unemployed populations), and supplies the data to calculate key indicators of labour market such as unemployed populations), and supplies the data to calculate key indicators of labour market such as the unemployment and the labour force participation rates.
2. Administrative records:
– Ministry of Human Resources and Social Development (MHRSD)
(formerly Ministry of Labour and Social Development):
Supplies data on:
Employees on the job Subject to the rules and regulations of the Civil Service
– General Organization of Social Insurance (GOSI):
Supplies data on:
a. contributors on the job who are subject to social insurance laws and regulations in the private and government sector;
b. new contributors, and contributors who terminated their contribution to social insurance during the quarter.
– National Information Center (NIC):
Supplies data on:
a. domestic workers.
The present data is based on estimates drawn from the results of the quarterly Labour Force Survey,
revised on the basis of the results of census 2022.
LFS results are published as rates only. Numerical estimates are unavailable.
Definitions:
Population in the labour force:
Individuals (15 years and above) who contribute or are ready to contribute to the production of commodities and services during the reference period of the survey. The labour force includes the employed and unemployed populations.
Population outside the labour force:
Individuals (15 years and above) who is not classified as part of the labour force because they do not work, do not seek a job, are unable to work, or are not ready to work during the survey reference period.
For example: Students, housewives, retired persons who do not work, individuals unable or unwilling to work, or who do not look for a job for other reasons.
Labour force participation rate = (total labour force ÷ total population of working age (aged 15 years and over)) x 100
As of July 2024, Labour Force Survey data from Q1 2021 to Q1 2024 were revised and backcasted, based on 2022 population census results.
Therefore, the present rates may differ from earlier estimates based on previous Labour Force Surveys’ sampling base.
Technical note on backcasting:
https://database.stats.gov.sa/Methodologies/En_Documents/40_Technical%20Note%20Population%20Back%20Casting.PDF
Definitions and categories used by GAStat in Labour Markets Statistics (employment; unemployment; occupation and activity sectors, etc.) are based on international standards:
For LFS methodology and definitions, see:
https://www.stats.gov.sa/en/w/lfs-1
https://www.stats.gov.sa/w/lfs-1
2. Institution which provides data
General Authority for Statistics (GAStat)
3. Data availability
Since 2021, GAStat has been publishing separately the employment data taken from administrative records, and unemployment/inactivity data as well as general indicators, calculated from the results of the field
interviews conducted by GAStat (Labour Force Survey).
The present time-series was taken from the Labour Market Statistics- Q4, 2024 (Excel and PDF formats)
https://www.stats.gov.sa/en/statistics-tabs?tab=436312&category=417515
https://www.stats.gov.sa/statistics-tabs?tab=436312&category=417515
Quarterly Register-based Labour Market Statistics reports are accessible from:
https://www.stats.gov.sa/en/statistics?index=119025
https://www.stats.gov.sa/statistics?index=119025.
Date of access: 22 June 2025.
Keywords: Employment, Unemployment, Female Employment, Saudi Arabia, National & Foreign Labour
GLMM and GRC cannot guarantee that the link to access the source will not change;
that the information will not be removed from the website it was obtained from;
that no geo-blockages will be imposed; or that the information will not be available for any another reason.
|
Saudis |
Non-Saudis |
Total |
| Males |
Females |
Total |
Males |
Females |
Total |
Males |
Females |
Total |
| 2017 Q1 |
2,021,865 |
1,017,080 |
3,038,945 |
9,859,039 |
991,153 |
10,850,192 |
11,880,904 |
2,008,233 |
13,889,137 |
| 2017 Q2 |
2,029,786 |
1,022,663 |
3,052,449 |
9,777,916 |
1,010,793 |
10,788,709 |
11,807,702 |
2,033,456 |
13,841,158 |
| 2017 Q3 |
2,035,745 |
1,027,999 |
3,063,744 |
9,674,729 |
1,019,591 |
10,694,320 |
11,710,474 |
2,047,590 |
13,758,064 |
| 2017 Q4 |
2,080,601 |
1,083,245 |
3,163,846 |
9,442,163 |
975,132 |
10,417,295 |
11,522,764 |
2,058,377 |
13,581,141 |
| 2018 Q1 |
2,067,976 |
1,082,433 |
3,150,409 |
9,231,869 |
951,235 |
10,183,104 |
11,299,845 |
2,033,668 |
13,333,513 |
| 2018 Q2 |
2,053,189 |
1,072,154 |
3,125,343 |
8,927,862 |
964,861 |
9,892,723 |
10,981,051 |
2,037,015 |
13,018,066 |
| 2018 Q3 |
2,043,585 |
1,066,402 |
3,109,987 |
8,622,890 |
955,165 |
9,578,055 |
10,666,475 |
2,021,567 |
12,688,042 |
| 2018 Q4 |
2,040,742 |
1,070,457 |
3,111,199 |
8,356,943 |
1,072,476 |
9,429,419 |
10,397,685 |
2,142,933 |
12,540,618 |
| 2019 Q1 |
2,036,142 |
1,075,887 |
3,112,029 |
8,458,199 |
1,195,013 |
9,653,212 |
10,494,341 |
2,270,900 |
12,765,241 |
| 2019 Q2 |
2,027,964 |
1,062,284 |
3,090,248 |
8,529,419 |
1,237,365 |
9,766,784 |
10,557,383 |
2,299,649 |
12,857,032 |
| 2019 Q3 |
2,023,910 |
1,076,902 |
3,100,812 |
8,572,339 |
1,254,757 |
9,827,096 |
10,596,249 |
2,331,659 |
12,927,908 |
| 2019 Q4 |
2,054,858 |
1,115,414 |
3,170,272 |
8,792,516 |
1,428,187 |
10,220,703 |
10,847,374 |
2,543,601 |
13,390,975 |
| 2020 Q1 |
2,066,553 |
1,136,870 |
3,203,423 |
9,092,998 |
1,339,191 |
10,432,189 |
11,159,551 |
2,476,061 |
13,635,612 |
| 2020 Q2 |
2,055,767 |
1,115,655 |
3,171,422 |
9,101,286 |
1,357,746 |
10,459,032 |
11,157,053 |
2,473,401 |
13,630,454 |
| 2020 Q3 |
2,100,702 |
1,152,574 |
3,253,276 |
8,866,940 |
1,334,922 |
10,201,862 |
10,967,642 |
2,487,496 |
13,455,138 |
| 2020 Q4 |
2,079,331 |
1,172,867 |
3,252,198 |
8,753,985 |
1,312,515 |
10,066,500 |
10,833,316 |
2,485,382 |
13,318,698 |
| 2021 Q1 |
2,081,446 |
1,225,152 |
3,306,598 |
8,773,896 |
1,403,319 |
10,177,215 |
10,855,342 |
2,628,471 |
13,483,813 |
| 2021 Q2 |
2,098,831 |
1,181,183 |
3,280,014 |
8,449,536 |
1,170,338 |
9,619,874 |
10,548,367 |
2,351,521 |
12,899,888 |
| 2021 Q3 |
2,127,551 |
1,215,287 |
3,342,838 |
8,244,566 |
1,118,241 |
9,362,807 |
10,372,117 |
2,333,528 |
12,705,645 |
| 2021 Q4 |
2,180,320 |
1,269,737 |
3,450,057 |
8,481,117 |
1,114,064 |
9,595,181 |
10,661,437 |
2,383,801 |
13,045,238 |
| 2022 Q1 |
2,233,351 |
1,338,525 |
3,571,876 |
8,971,450 |
1,187,323 |
10,158,773 |
11,204,801 |
2,525,848 |
13,730,649 |
| 2022 Q2 |
2,262,535 |
1,375,609 |
3,638,144 |
9,320,979 |
1,210,640 |
10,531,619 |
11,583,514 |
2,586,249 |
14,169,763 |
| 2022 Q3 |
2,274,628 |
1,417,858 |
3,692,486 |
9,593,551 |
1,304,906 |
10,898,457 |
11,868,179 |
2,722,764 |
14,590,943 |
| 2022 Q4 |
2,300,070 |
1,470,561 |
3,770,631 |
9,672,933 |
1,314,794 |
10,987,727 |
11,973,003 |
2,785,355 |
14,758,358 |
| 2023 Q1 |
2,354,750 |
1,515,731 |
3,870,481 |
10,137,453 |
1,355,438 |
11,492,891 |
12,492,203 |
2,871,169 |
15,363,372 |
| 2023 Q2 |
2,338,735 |
1,518,362 |
3,857,097 |
10,202,131 |
1,395,840 |
11,597,971 |
12,540,866 |
2,914,202 |
15,455,068 |
| 2023 Q3 |
2,357,785 |
1,563,536 |
3,921,321 |
10,461,593 |
1,435,240 |
11,896,833 |
12,819,378 |
2,998,776 |
15,818,154 |
| 2023 Q4 |
2,333,023 |
1,582,224 |
3,915,247 |
10,482,543 |
1,489,714 |
11,972,257 |
12,815,566 |
3,071,938 |
15,887,504 |
| 2024 Q1 |
2,338,857 |
1,599,711 |
3,938,568 |
10,985,203 |
1,592,431 |
12,577,634 |
13,324,060 |
3,192,142 |
16,516,202 |
| 2024 Q2 |
2,339,984 |
1,591,476 |
3,931,460 |
11,263,627 |
1,668,972 |
12,932,599 |
13,603,611 |
3,260,448 |
16,864,059 |
| 2024 Q3 |
2,362,772 |
1,627,885 |
3,990,657 |
11,474,582 |
1,716,096 |
13,190,678 |
13,837,354 |
3,343,981 |
17,181,335 |
| 2024 Q4 |
2,393,923 |
1,660,560 |
4,054,483 |
11,828,151 |
1,789,636 |
13,617,787 |
14,222,074 |
3,450,196 |
17,672,270 |
Source: Register-based Labour Market Statistics, General Authority for Statistics (GAStat)
1. Data collection methodology
LFS were first conducted in 2001 and became bi-annual after 2006. Data were collected through nationally
representative household sample surveys, which sampling was based on most recent censuses.
Since 2016, Labour Force Surveys have been conducted and published on a quarterly basis, based on a
household telephone survey conducted by GAStat. Employment data extracted from administrative records
were also introduced as a complement to the results of Labour Force Surveys in Labour Market Statistics’
publications, starting on Q1 2017.
The present data is taken from administrative records.
Population of reference: Workers registered in the General Organization of Social Insurance (GOSI), in civil service and as domestic workers, in the governmental, public, private and domestic sectors.
GAStat Labour Market Statistics: administrative records
Estimates of figures and characteristics of employment in Saudi Arabia are taken from administrative records from the following institutions:
– Ministry of Human Resources and Social Development (MHRSD)
(formerly Ministry of Labour and Social Development):
Supplies data on: Employees on the job subject to the rules and regulations of the Civil Service (government sector)
– General Organization of Social Insurance (GOSI):
Supplies data on:
a. contributors on the job who are subject to social insurance laws and regulations in the private and public sectors;
b. new contributors, and contributors who terminated their contribution to social insurance during the quarter.
– National Information Center (NIC):
Supplies data on domestic workers (data owner: MHRSD).
Figures of workers in Labor Market statistics which were derived from administrative records do not include the following category:
1-Workers in the military and security sectors
2- Workers who are not registered in the civil service, social insurance (GOSI) and domestic workers’ records, which include:
– Saudis working for their own businesses and are not subjected to the labor regulations, also, not registered in social insurance,
such as those who work in delivery through electronic apps
– Saudi employers who work in establishments and not registered in the social insurance
– Non-Saudi staff working in foreign international, political or military missions
3- Non-Saudi employees who come to the Kingdom for work that normally takes less than three months to be completed.
Definitions and categories used by GAStat in Labour Markets Statistics (employment; unemployment;
occupation and activity sectors, etc.) are based on international standards:
For LFS methodology and definitions, see metadata section in report, and:
https://database.stats.gov.sa/Methodologies/En_Documents/03_Labor%20Market%20Bulletin%20Methodology,%20Fourth%20Quarter%202020%20_%20General%20Authority%20for%20Statistics.pdf
https://database.stats.gov.sa/Methodologies/En_Documents/03_Labor%20Market%20Bulletin%20Methodology,%20Fourth%20Quarter%202020%20_%20General%20Authority%20for%20Statistics.pdf
2. Institution which provides data
General Authority for Statistics (GAStat)
3. Data availability
Since 2021, GAStat has been publishing separately the employment data taken from administrative records,
and unemployment/inactivity data as well as general indicators, calculated from the results of the field
interviews conducted by GAStat (Labour Force Survey).
The time-series was built using the quarterly Register-based Labour Market Statistics for given quarters
2023-2024: available at:
https://www.stats.gov.sa/en/statistics-tabs/-/categories/417515?tab=436312&category=417515
Before 2023: available in the “archived data”:
https://www.stats.gov.sa/en/statistics?index=1317550
“social statistics”, and “labour force”
https://www.stats.gov.sa/en/statistics-tabs?tab=436312&category=1333429
Last date of access: 26 June 2025.
Keywords: Employment, Female Employment, Saudi Arabia, National & Foreign Labour
GLMM and GRC cannot guarantee that the link to access the source will not change;
that the information will not be removed from the website it was obtained from;
that no geo-blockages will be imposed; or that the information will not be available for any another reason.
|
Qataris |
Non-Qataris |
Total |
| Census year |
males |
females |
total |
males |
females |
total |
males |
females |
total |
| 1986 |
49,684 |
50,070 |
99,754 |
200,641 |
72,997 |
273,638 |
250,325 |
123,067 |
373,392 |
| 1997 |
75,881 |
75,792 |
151,673 |
277,905 |
106,896 |
384,801 |
353,786 |
182,688 |
536,474 |
| 2004 |
95,703 |
96,883 |
192,586 |
450,411 |
155,064 |
605,475 |
546,114 |
251,947 |
798,061 |
| 2010 |
120,736 |
122,337 |
243,073 |
1,164,003 |
292,359 |
1,456,362 |
1,284,739 |
414,696 |
1,699,435 |
| 2015 |
152,700* |
154,248* |
306,948* |
1,692,960* |
449,600* |
2,142,560* |
1,845,660 |
603,848 |
2,449,508 |
| 2020 |
170,873* |
169,476* |
340,349* |
1,863,845* |
642,124* |
2,505,769* |
2,034,518 |
811,600 |
2,846,118 |
Source: MDPS/ PSA/ NPC and GLMM calculations on the basis of MDPS/ QSA/ NPC data
* GLMM’s estimate, based on data published by the MDPS/ QSA/ NPC (see below).
ANNEXED NOTE
1. Technical Notes and Definitions
Reference periods for each census:
The nights of: March 16th, 1986; March 1st, 1997; March 16th, 2004, April 21st, 2010; April 20th, 2015;
December 2020.
Implementation method: de facto, as well as de jure methods (1986-2015)
Census 2020 was based on administrative records, supplemented by an online self-enumeration platform, completed with field enumeration.
Population of reference: all individuals (nationals and non-nationals), present within the country’s
borders during night of reference.
– Populations away from usual residence in Qatar for reasons of duty,
or on a visit abroad for less than two months, as well as individuals with no personal housing within Qatar staying
with a household for more than two months, are counted in their usual/ present residence during census night.
– Populations in transit or visiting Qatar as tourists, as well as residents of public housing or visitors staying in a household
for less than two months after night of reference were excluded.
Prior to census 2010, only a sample of foreign residents was covered in censuses.
2015: Estimates of total population broken down by nationality (Qataris and non-Qataris) are not readily available in any
census publication
The present figures are GLMM’s estimates, using:
a. 2015 Labour Force Survey (Q2): provides estimates of the population aged 15 and above, by nationality (Qataris/ non-Qataris) and sex
Sampling frame of LFS 2015: Population Census 2010.
Sample size: 44,756 persons, in 6,953 households: 1- Qatari households; 2- Non-Qatari regular (non-collective) and collective households;
Reference period for the labour force data: the week prior to data collection day.
Population of reference: all Qatari and non-Qatari households present in Qatar on the night of survey,
living in normal and collective households.
b. MDPS. Women and Men in the State of Qatar- A Statistical Profile, Doha: MDPS, 2016.
Provides the distribution of population by broad age group, nationality and sex (period of reference: mid-2015).
(Table 1/3, p. 18).
c. Census 2015: provides the estimates of the total population by sex.
d. The numbers of Qataris by sex were calculated using sources a. and b.
e. The numbers of non-Qataris were calculated using source c. (census total population estimates) and results d.(estimates of Qataris by sex).
‘2020: Estimates of total population broken down by nationality (Qataris and non-Qataris) are not readily available in any
‘census publication.
‘The present figures are GLMM’s estimates, using:
a. 2020 Labour Force Survey (Q4): provides estimates of the population aged 15 and above, by nationality (Qatari/ non-Qatari) and sex
Sampling frame of LFS 2020: Population Census 2015.
Sample size: 9,200 households for the whole year, divided by quarter: 1- Qatari households; 2- Non-Qatari regular (non-collective) and collective households;
Reference period for the labour force data: the week prior to data collection day.
Population of reference: all Qatari and non-Qatari households present in Qatar on the night of survey,
living in normal and collective households.
b. Planning and Statistics Authority (PSA). Woman and Man in the State of Qatar- A Statistical Portrait, Doha: PSA, 2020.
Provides the distribution of population by broad age group, nationality and sex (period of reference: mid-2019).
(Table 1/3, p. 8).
c. Census 2020: provides the estimates of the total population by sex.
d. The numbers of Qataris by sex were calculated using sources a. and b.
e. The numbers of non-Qataris were calculated using source c. (census total population estimates) and results d.(estimates of Qataris by sex).
2. Institution which provides data
Ministry of Development Planning and Statistics (MDPS)
Planning and Statistics Authority (PSA)
Currently: Qatar National Planning Council (NPC)
https://www.npc.qa/en/Pages/default.aspx
3. Data availability
Released parts of censuses (1986; 1997; 2004; 2010, 2015), as well as some analytical volumes,
are available on the website of the NPC, in PDF format.
https://www.npc.qa/en/statistics/Pages/census/default.aspx
Census 2020′ website:
https://www.npc.qa/en/statistics/census2020/Pages/results/default.aspx
https://www.npc.qa/ar/statistics/census2020/Pages/results/default.aspx
Main results of the General Census of Population, Housing and Establishments 2020
https://www.npc.qa/en/statistics/Pages/census/default.aspx#
https://www.npc.qa/ar/statistics/Pages/census/default.aspx#
Labour Force Surveys (quarterly and annual results):
https://www.npc.qa/en/statistics/pages/subjectdetails.aspx#
MDPS. Woman and Man in the State of Qatar- A Statistical Profile, Doha: MDPS, 2016.
https://www.npc.qa/en/statistics/Statistical%20Releases/Social/General%20Social%20Statistics/MenWomenProfile/Woman_Man_2016_En.pdf
PSA. Woman and Man in the State of Qatar- A Statistical Portrait, Doha: PSA, 2020.
https://www.npc.qa/en/statistics/Statistical%20Releases/Social/General%20Social%20Statistics/MenWomenProfile/Woman_Man_2020_EN.pdf
Keywords: Qatar, National Population, Foreign Population
Last date of access: June 2025.
GLMM and GRC cannot guarantee that the link to access the source will not change;
that the information will not be removed from the website it was obtained from;
that no geo-blockages will be imposed; or that the information will not be available for any another reason.
| Census |
Qataris |
Non-Qataris |
Total |
| 1970 |
45,039 |
66,094 |
111,133 |
| 1986 |
99,754 |
273,638 |
373,392 |
| 1997 |
151,673 |
384,801 |
536,474 |
| 2004 |
192,586 |
605,475 |
798,061 |
| 2010 |
243,073 |
1,456,362 |
1,699,435 |
| 2015 |
301,342* |
2,103,434* |
2,404,776 |
| 2020 |
340,349* |
2,505,769* |
2,846,118 |
Source: MDPS/ PSA/ NPC and GLMM calculations on the basis of MDPS/ QSA/ NPC data
* GLMM’s estimate, based on data published by the MDPS/ QSA/ NPC (see below).
ANNEXED NOTE
1. Technical Notes and Definitions
Reference periods for each census:
1970: unknown; the nights of: March 16th, 1986; March 1st, 1997; March 16th, 2004, April 21st, 2010; April 20th, 2015;
December 2020.
Implementation method: de facto, as well as de jure methods (1986-2015)
Census 2020 was based on administrative records, supplemented by an online self-enumeration platform,
completed with field enumeration.
Population of reference: all individuals (nationals and non-nationals), present within the country’s
borders during night of reference.
– Populations away from usual residence in Qatar for reasons of duty,
for less than two months after night of reference were excluded.
Prior to census 2010, only a sample of foreign residents was covered in censuses.
2015: Estimates of total population broken down by nationality (Qataris and non-Qataris) are not readily available in any census publication
The present figures are GLMM’s estimates, using:
a. 2015 Labour Force Survey (Q2): provides estimates of the population aged 15 and above, by nationality (Qataris/ non-Qataris) and sex
Sampling frame of LFS 2015: Population Census 2010.
Sample size: 44,756 persons, in 6,953 households: 1- Qatari households; 2- Non-Qatari regular (non-collective) and collective households;
Reference period for the labour force data: the week prior to data collection day.
Population of reference: all Qatari and non-Qatari households present in Qatar on the night of survey,
living in normal and collective households.
b. MDPS. Women and Men in the State of Qatar- A Statistical Profile, Doha: MDPS, 2016.
Provides the distribution of population by broad age group, nationality and sex (period of reference: mid-2015).
(Table 1/3, p. 18).
c. Census 2015: provides the estimates of the total population by sex.
d. The numbers of Qataris by sex were calculated using sources a. and b.
e. The numbers of non-Qataris were calculated using source c. (census total population estimates) and results d. (estimates of Qataris by sex).
2020: Estimates of total population broken down by nationality (Qataris and non-Qataris) are not readily available in any
‘census publication.
‘The present figures are GLMM’s estimates, using:
a. 2020 Labour Force Survey (Q4): provides estimates of the population aged 15 and above, by nationality (Qatari/ non-Qatari) and sex
Sampling frame of LFS 2020: Population Census 2015.
Sample size: 9,200 households for the whole year, divided by quarter: 1- Qatari households; 2- Non-Qatari regular (non-collective) and collective households;
Reference period for the labour force data: the week prior to data collection day.
Population of reference: all Qatari and non-Qatari households present in Qatar on the night of survey,
living in normal and collective households.
b. Planning and Statistics Authority (PSA). Woman and Man in the State of Qatar- A Statistical Portrait, Doha: PSA, 2020.
Provides the distribution of population by broad age group, nationality and sex (period of reference: mid-2019).
(Table 1/3, p. 8).
c. Census 2020: provides the estimates of the total population by sex.
d. The numbers of Qataris by sex were calculated using sources a. and b.
e. The numbers of non-Qataris were calculated using source c. (census total population estimates) and results d.(estimates of Qataris by sex).
2. Institution which provides data
Ministry of Development Planning and Statistics (MDPS)
Planning and Statistics Authority (PSA)
Currently: Qatar National Planning Council (NPC)
https://www.npc.qa/en/Pages/default.aspx
3. Data availability
Released parts of censuses (1986; 1997; 2004; 2010, 2015), as well as some analytical volumes,
are available on the website of the NPC, in PDF format.
https://www.npc.qa/en/statistics/Pages/census/default.aspx
Census 2020′ website:
https://www.npc.qa/en/statistics/census2020/Pages/results/default.aspx
https://www.npc.qa/ar/statistics/census2020/Pages/results/default.aspx
Main results of the General Census of Population, Housing and Establishments 2020
https://www.npc.qa/en/statistics/Pages/census/default.aspx#
https://www.npc.qa/ar/statistics/Pages/census/default.aspx#
Labour Force Surveys (quarterly and annual results):
https://www.npc.qa/en/statistics/pages/subjectdetails.aspx#
MDPS. Woman and Man in the State of Qatar- A Statistical Profile, Doha: MDPS, 2016.
https://www.npc.qa/en/statistics/Statistical%20Releases/Social/General%20Social%20Statistics/MenWomenProfile/Woman_Man_2016_En.pdf
PSA. Woman and Man in the State of Qatar- A Statistical Portrait, Doha: PSA, 2020.
https://www.npc.qa/en/statistics/Statistical%20Releases/Social/General%20Social%20Statistics/MenWomenProfile/Woman_Man_2020_EN.pdf
Keywords: Qatar, National Population, Foreign Population
Last date of access: June 2025.
GLMM and GRC cannot guarantee that the link to access the source will not change;
that the information will not be removed from the website it was obtained from;
that no geo-blockages will be imposed; or that the information will not be available for any another reason.
|
Qataris |
Arabs |
Asians |
Europeans |
Other nationalities |
Total births |
% of Qatari births in total |
| GCC Arabs |
Non-GCC Arabs |
Total |
| 1981 |
3,002 |
348 |
1,820 |
2,168 |
1,992 |
28 |
2 |
7,192 |
41.7 |
| 1982 |
3,457 |
403 |
2,103 |
2,506 |
2,034 |
31 |
3 |
8,031 |
43.0 |
| 1983 |
3,416 |
426 |
2,304 |
2,730 |
2,072 |
33 |
10 |
8,261 |
41.4 |
| 1984 |
3,812 |
457 |
2,331 |
2,788 |
1,976 |
27 |
10 |
8,613 |
44.3 |
| 1985 |
3,857 |
594 |
2,538 |
3,132 |
2,176 |
33 |
27 |
9,225 |
41.8 |
| 1986 |
4,034 |
638 |
2,942 |
3,580 |
2,284 |
30 |
14 |
9,942 |
40.6 |
| 1987 |
3,991 |
674 |
3,055 |
3,729 |
2,150 |
29 |
20 |
9,919 |
40.2 |
| 1988 |
4,472 |
744 |
3,376 |
4,120 |
2,207 |
22 |
21 |
10,842 |
41.2 |
| 1989 |
4,513 |
726 |
3,518 |
4,244 |
2,099 |
34 |
18 |
10,908 |
41.4 |
| 1990 |
4,724 |
800 |
3,421 |
4,221 |
2,027 |
28 |
22 |
11,022 |
42.9 |
| 1991 |
4,691 |
700 |
2,685 |
3,385 |
1,632 |
25 |
23 |
9,756 |
48.1 |
| 1992 |
5,016 |
620 |
2,731 |
3,351 |
2,033 |
24 |
35 |
10,459 |
48.0 |
| 1993 |
5,389 |
580 |
2,816 |
3,396 |
1,982 |
26 |
29 |
10,822 |
49.8 |
| 1994 |
5,373 |
558 |
2,619 |
3,177 |
1,953 |
27 |
31 |
10,561 |
50.9 |
| 1995 |
5,344 |
519 |
2,563 |
3,082 |
1,872 |
36 |
37 |
10,371 |
51.5 |
| 1996 |
5,306 |
491 |
2,623 |
3,114 |
1,813 |
42 |
42 |
10,317 |
51.4 |
| 1997 |
5,312 |
460 |
2,691 |
3,151 |
1,866 |
59 |
59 |
10,447 |
50.8 |
| 1998 |
5,446 |
439 |
2,678 |
3,117 |
2,091 |
44 |
83 |
10,781 |
50.5 |
| 1999 |
5,574 |
398 |
2,669 |
3,067 |
2,082 |
40 |
83 |
10,846 |
51.4 |
| 2000 |
5,612 |
406 |
2,800 |
3,206 |
2,323 |
40 |
69 |
11,250 |
49.9 |
| 2001 |
5,855 |
399 |
3,185 |
3,584 |
2,559 |
37 |
83 |
12,118 |
48.3 |
| 2002 |
5,924 |
355 |
3,270 |
3,625 |
2,493 |
63 |
95 |
12,200 |
48.6 |
| 2003 |
6,193 |
394 |
3,481 |
3,875 |
2,622 |
45 |
121 |
12,856 |
48.2 |
| 2004 |
6,488 |
383 |
3,482 |
3,865 |
2,581 |
101 |
155 |
13,190 |
49.2 |
| 2005 |
6,260 |
345 |
3,539 |
3,884 |
2,722 |
117 |
418 |
13,401 |
46.7 |
| 2006 |
6,563 |
393 |
3,844 |
4,237 |
2,996 |
127 |
197 |
14,120 |
46.5 |
| 2007 |
7,178 |
435 |
4,188 |
4,623 |
3,407 |
198 |
275 |
15,681 |
45.8 |
| 2008 |
7,355 |
498 |
4,840 |
5,338 |
3,912 |
253 |
352 |
17,210 |
42.7 |
| 2009 |
7,664 |
544 |
5,235 |
5,779 |
4,484 |
319 |
405 |
18,651 |
41.1 |
| 2010 |
7,733 |
593 |
5,573 |
6,166 |
4,838 |
359 |
408 |
19,504 |
39.6 |
| 2011 |
7,592 |
591 |
6,244 |
6,835 |
5,333 |
382 |
481 |
20,623 |
36.8 |
| 2012 |
6,953 |
629 |
7,048 |
7,676 |
5,829 |
421 |
540 |
21,423 |
32.5 |
| 2013 |
7,807 |
666 |
7,851 |
8,517 |
6,325 |
460 |
599 |
23,708 |
32.9 |
| 2014 |
7,954 |
694 |
8,728 |
9,422 |
6,762 |
610 |
695 |
25,443 |
31.3 |
| 2015 |
8,244 |
678 |
9315 |
9,993 |
7116 |
551 |
718 |
26,622 |
31.0 |
| 2016 |
7,938 |
664 |
9,538 |
10,202 |
7,309 |
588 |
779 |
26,816 |
29.6 |
| 2017 |
7,944 |
607 |
10,149 |
10,756 |
7,789 |
514 |
903 |
27,906 |
28.5 |
| 2018 |
7,803 |
486 |
9,905 |
10,391 |
8,411 |
533 |
931 |
28,069 |
27.8 |
| 2019 |
7,496 |
479 |
10,067 |
10,546 |
8,839 |
523 |
1,008 |
28,412 |
26.4 |
| 2020 |
7,098 |
449 |
10,241 |
10,690 |
9,577 |
532 |
1,117 |
29,014 |
24.5 |
| 2021 |
7,814 |
444 |
8,360 |
8,804 |
8,189 |
497 |
1,015 |
26,319 |
29.7 |
| 2022 |
7,149 |
429 |
8,735 |
9,164 |
8,500 |
464 |
1,039 |
26,316 |
27.2 |
Source: Vital Statistics- Annual Bulletin of Births and Deaths, MDPS.
ANNEXED NOTE
1. Characteristics of data and definitions
The data covers the Qatari births in Qatar and abroad, as well as foreign births in Qatar.
According to Law No. 5, 1982 on the Vital Registration System, vital registration data are transmitted by the Ministry of Health to the Ministry of Development Planning & Statistics for tabulations and processing.
Late registered births are recorded on the year of registration.
The nationality group which the newborn belongs to is collected according to the nationality of the father/ head of the household.
2. Institution which provides data
Ministry of Development Planning and Statistics (MDPS).
Currently: National Planning Council (NPC)
3. Period of data coverage:
January 1st-December 31st, given years.
4. Data availability
Vital Statistics Annual Bulletins of Births and Death are available in PDF and Excel formats on MDPS website, for the years 1984 to 2015.
https://www.npc.qa/en/statistics/pages/subjectdetails.aspx#
A selection of data is also published as part of the Annual Statistical Abstracts, in PDF and Excel formats.
https://www.npc.qa/en/statistics/pages/subjectdetails.aspx#
Keywords: Qatar, Foreign & National Populations, Second Generation, Family Reunification, Identity, Duration Stay
Last date of access: June 2025.
GLMM and GRC cannot guarantee that the link to access the source will not change;
that the information will not be removed from the website it was obtained from;
that no geo-blockages will be imposed; or that the information will not be available for any another reason.
| Father’s Nationality |
Emirati father |
Non-Emirati father |
Total |
| Mother’s Nationality |
Male births |
Female births |
Total |
Male births |
Female births |
Total |
Male births |
Female births |
Total |
| Emirati mother |
12,633 |
11,643 |
24,276 |
837 |
828 |
1,665 |
13,470 |
12,471 |
25,941 |
| Non-Emirati mother |
3,430 |
3,183 |
6,613 |
33,079 |
30,998 |
64,077 |
36,509 |
34,181 |
70,690 |
| Total |
16,063 |
14,826 |
30,889 |
33,916 |
31,826 |
65,742 |
49,979 |
46,652 |
96,631 |
Sources: Federal Competitiveness and Statistics Centre (FCSC)/ Ministry of Health and Prevention.
ANNEXED NOTE
1. Characteristics of data
Vital statistics data (births and deaths) are taken from the records of the UAE Ministry of Health and Prevention.
The table presents the total number of live births who were registered in one of the health facilities and hospitals in the country during a specific calendar year.
It also includes children of citizens born abroad who were registered inside the country.
https://fcsc.gov.ae/_layouts/download.aspx?SourceUrl=%2Fen-us%2FLists%2FD_StatisticsSubjectV2%2FAttachments%2F1769%2FSP-17%20Methodology%20for%20Birth%20and%20Death%20Statistics.pdf
Definition of live birth and other metadata:
https://fcsc.gov.ae/_layouts/download.aspx?SourceUrl=%2Fen-us%2FLists%2FD_StatisticsSubjectV2%2FAttachments%2F1768%2F3-%20Births%20Statistics%202022%20%D8%A5%D8%AD%D8%B5%D8%A7%D8%A1%D8%A7%D8%AA%20%D8%A7%D9%84%D9%85%D9%88%D8%A7%D9%84%D9%8A%D8%AF.xlsx
Methodology of births and deaths’ registration:
https://fcsc.gov.ae/_layouts/download.aspx?SourceUrl=%2Fen-us%2FLists%2FD_StatisticsSubjectV2%2FAttachments%2F1769%2FSP-17%20Methodology%20for%20Birth%20and%20Death%20Statistics.pdf
2. Institution which provides data
UAE Federal Competitiveness and Statistitics Center (FCSC)
https://fcsa.gov.ae/en-us/
3. Data availability
Births and deaths records, disaggregated by nationality and published by the FCSC (annual estimates available since 1995). Uninterrupted series: available since 2007
https://fcsc.gov.ae/en-us/Pages/Statistics/Statistics-by-Subject.aspx#/%3Ffolder=Demography%20and%20Social/Vital%20Statistics/Births%20and%20Deaths&subject=Demography%20and%20Social
UAE stat data explorer (.csv format):
https://uaestat.fcsc.gov.ae/?lc=en&fs[0]=FCSC%20-%20Statistical%20Hierarchy%2C0%7CBirths%23VTS_BIR%23&pg=0&fc=FCSC%20-%20Statistical%20Hierarchy&snb=5
Last date of access: 09 May 2025
GLMM and GRC cannot guarantee that the link to access the source will not change;
that the information will not be removed from the website it was obtained from;
that no geo-blockages will be imposed; or that the information will not be available for any another reason.
Keywords: United Arab Emirates, National Population, Foreign Population, National & Foreign Populations
|
Emirati births |
Non-Emirati births |
Total |
|
Male births |
Female births |
Total |
Male births |
Female births |
Total |
Male births |
Female births |
Total |
| Abu Dhabi |
8,613 |
7,690 |
16,303 |
10,667 |
9,953 |
20,620 |
19,280 |
17,643 |
36,923 |
| Dubai |
3,596 |
3,445 |
7,041 |
13,960 |
13,055 |
27,015 |
17,556 |
16,500 |
34,056 |
| Sharjah |
1,465 |
1,378 |
2,843 |
4,972 |
4,669 |
9,641 |
6,437 |
6,047 |
12,484 |
| Ajman |
324 |
259 |
583 |
2,883 |
2,809 |
5,692 |
3,207 |
3,068 |
6,275 |
| Umm Al Quwain |
468 |
475 |
943 |
166 |
172 |
338 |
634 |
647 |
1,281 |
| Ras Al – Khaima |
777 |
754 |
1,531 |
729 |
691 |
1,420 |
1,506 |
1,445 |
2,951 |
| Fujairah |
820 |
825 |
1,645 |
539 |
477 |
1,016 |
1,359 |
1,302 |
2,661 |
| Total |
16,063 |
14,826 |
30,889 |
33,916 |
31,826 |
65,742 |
49,979 |
46,652 |
96,631 |
Sources: Federal Competitiveness and Statistics Centre (FCSC)/ Ministry of Health and Prevention.
ANNEXED NOTE
1. Characteristics of data
Vital statistics data (births and deaths) are taken from the records of the UAE Ministry of Health and Prevention.
The table presents the total number of live births who were registered in one of the health facilities and hospitals in the country during a specific calendar year.
It also includes children of citizens born abroad who were registered inside the country.
https://fcsc.gov.ae/_layouts/download.aspx?SourceUrl=%2Fen-us%2FLists%2FD_StatisticsSubjectV2%2FAttachments%2F1769%2FSP-17%20Methodology%20for%20Birth%20and%20Death%20Statistics.pdf
Definition of live birth and other metadata:
https://fcsc.gov.ae/_layouts/download.aspx?SourceUrl=%2Fen-us%2FLists%2FD_StatisticsSubjectV2%2FAttachments%2F1768%2F3-%20Births%20Statistics%202022%20%D8%A5%D8%AD%D8%B5%D8%A7%D8%A1%D8%A7%D8%AA%20%D8%A7%D9%84%D9%85%D9%88%D8%A7%D9%84%D9%8A%D8%AF.xlsx
Methodology of births and deaths’ registration:
https://fcsc.gov.ae/_layouts/download.aspx?SourceUrl=%2Fen-us%2FLists%2FD_StatisticsSubjectV2%2FAttachments%2F1769%2FSP-17%20Methodology%20for%20Birth%20and%20Death%20Statistics.pdf
2. Institution which provides data
UAE Federal Competitiveness and Statistitics Center (FCSC)
https://fcsa.gov.ae/en-us/
3. Data availability
Births and deaths records, disaggregated by nationality and published by the FCSC (annual estimates available since 1995). Uninterrupted series: available since 2007
https://fcsc.gov.ae/en-us/Pages/Statistics/Statistics-by-Subject.aspx#/%3Ffolder=Demography%20and%20Social/Vital%20Statistics/Births%20and%20Deaths&subject=Demography%20and%20Social
UAE stat data explorer (.csv format):
https://uaestat.fcsc.gov.ae/?lc=en&fs[0]=FCSC%20-%20Statistical%20Hierarchy%2C0%7CBirths%23VTS_BIR%23&pg=0&fc=FCSC%20-%20Statistical%20Hierarchy&snb=5
Last date of access: 09 May 2025
GLMM and GRC cannot guarantee that the link to access the source will not change;
that the information will not be removed from the website it was obtained from;
that no geo-blockages will be imposed; or that the information will not be available for any another reason.
Keywords: United Arab Emirates, National Population, Foreign Population, National & Foreign Populations
| Mother’s age group |
Emirati births |
Non-Emirati births |
Total |
| Male births |
Female births |
Total |
Male births |
Female births |
Total |
Male births |
Female births |
Total |
| 15-19 |
125 |
100 |
225 |
239 |
233 |
472 |
364 |
333 |
697 |
| 20-24 |
1,831 |
1,591 |
3,422 |
2,647 |
2,553 |
5,200 |
4,478 |
4,144 |
8,622 |
| 25-29 |
4,461 |
4,207 |
8,668 |
9,020 |
8,334 |
17,354 |
13,481 |
12,541 |
26,022 |
| 30-34 |
5,141 |
4,732 |
9,873 |
12,769 |
11,970 |
24,739 |
17,910 |
16,702 |
34,612 |
| 35-39 |
3,399 |
3,180 |
6,579 |
7,398 |
7,057 |
14,455 |
10,797 |
10,237 |
21,034 |
| 40-44 |
1,037 |
944 |
1,981 |
1,727 |
1,563 |
3,290 |
2,764 |
2,507 |
5,271 |
| 45-49 |
60 |
69 |
129 |
106 |
102 |
208 |
166 |
171 |
337 |
| 50+ |
9 |
3 |
12 |
10 |
14 |
24 |
19 |
17 |
36 |
| Total |
16,063 |
14,826 |
30,889 |
33,916 |
31,826 |
65,742 |
49,979 |
46,652 |
96,631 |
Sources: Federal Competitiveness and Statistics Centre (FCSC)/ Ministry of Health and Prevention.
ANNEXED NOTE
1. Characteristics of data
Vital statistics data (births and deaths) are taken from the records of the UAE Ministry of Health and Prevention
The table presents the total number of live births who were registered in one of the health facilities and hospitals in the country during a specific calendar year.
It also includes children of citizens born abroad who were registered inside the country.
https://fcsc.gov.ae/_layouts/download.aspx?SourceUrl=%2Fen-us%2FLists%2FD_StatisticsSubjectV2%2FAttachments%2F1769%2FSP-17%20Methodology%20for%20Birth%20and%20Death%20Statistics.pdf
Definition of live birth and other metadata:
https://fcsc.gov.ae/_layouts/download.aspx?SourceUrl=%2Fen-us%2FLists%2FD_StatisticsSubjectV2%2FAttachments%2F1768%2F3-%20Births%20Statistics%202022%20%D8%A5%D8%AD%D8%B5%D8%A7%D8%A1%D8%A7%D8%AA%20%D8%A7%D9%84%D9%85%D9%88%D8%A7%D9%84%D9%8A%D8%AF.xlsx
Methodology of births and deaths’ registration:
https://fcsc.gov.ae/_layouts/download.aspx?SourceUrl=%2Fen-us%2FLists%2FD_StatisticsSubjectV2%2FAttachments%2F1769%2FSP-17%20Methodology%20for%20Birth%20and%20Death%20Statistics.pdf
2. Institution which provides data
UAE Federal Competitiveness and Statistitics Center (FCSC)
https://fcsa.gov.ae/en-us/
3. Data availability
Births and deaths records, disaggregated by nationality and published by the FCSC (annual estimates available since 1995). Uninterrupted series: available since 2007
https://fcsc.gov.ae/en-us/Pages/Statistics/Statistics-by-Subject.aspx#/%3Ffolder=Demography%20and%20Social/Vital%20Statistics/Births%20and%20Deaths&subject=Demography%20and%20Social
UAE stat data explorer (.csv format):
https://uaestat.fcsc.gov.ae/?lc=en&fs[0]=FCSC%20-%20Statistical%20Hierarchy%2C0%7CBirths%23VTS_BIR%23&pg=0&fc=FCSC%20-%20Statistical%20Hierarchy&snb=5
Last date of access: 09 May 2025
GLMM and GRC cannot guarantee that the link to access the source will not change;
that the information will not be removed from the website it was obtained from;
that no geo-blockages will be imposed; or that the information will not be available for any another reason.
Keywords: United Arab Emirates, National Population, Foreign Population, National & Foreign Populations
|
Saudis |
Non-Saudis |
Total (TFR Saudi and non-Saudi population) |
| 2011 |
3.8 |
1.3 |
2.8 |
| 2012 |
3.7 |
1.4 |
2.8 |
| 2013 |
3.6 |
1.4 |
2.7 |
| 2014 |
3.6 |
1.4 |
2.7 |
| 2015 |
3.5 |
1.4 |
2.6 |
| 2016 |
3.5 |
1.6 |
2.7 |
| 2017 |
3.5 |
1.7 |
2.7 |
| 2018 |
3.4 |
1.7 |
2.7 |
| 2019 |
3.2 |
1.5 |
2.5 |
| 2020 |
3.0 |
1.2 |
2.3 |
| 2021 |
2.8 |
1.1 |
2.2 |
| 2022 |
2.8 |
0.9 |
2.1 |
Source: General Authority for Statistics (GAStat)
ANNEXED NOTE
1. Technical Notes and Definitions
Indicator’s Definition:
The Total Fertility Rate (TFR) is the average number of children a hypothetical cohort of women would have at the end of their reproductive period
if they were subject during their whole lives to the fertility rates of a given period and if they were not subject to mortality.
It is expressed as children per woman.
Population Estimates:
The General Authority for Statistics uses the (Method Component-Cohort) approach leveraging data from various sources including the National Information Center
for administrative records to provide key components such as births, deaths and migration.
Changes in the demographic characteristics for 2024 are assessed against the previous population report from the Authority using data from the 2022 Saudi census.
Saudi census 2022:
Date of reference: 10 May 2022
Population of reference: Families and individual citizens and residents within the Kingdom, regardless of the status of their identification documents.
Visitors for Hajj, Umrah and tourism are excluded from the census.
Methodology:
The first phase of the 2020 census began on 3 February 2020 (enumeration of buildings and households). Census 2022 used geospatial data, including satellite images, electricity consumption and mobile phone data, to improve the accuracy and geographic coverage of address canvassing.
The second stage (“actual enumeration”) was due to start on the original reference date (17 March 2020), but was suspended by the outbreak of the COVID-19 crisis. This stage was conducted in October 2021.
The 2022 census used a combined methodology – administrative records, fieldwork and digital self-enumeration.
Household data were collected from e-portals of self-enumeration (on residents’ mobile devices, laptops or personal computers, or self-enumeration stations/kiosks, located in shopping centers).
The digital self-enumeration process was complemented by face-to-face interviews, using digital tablets.
Census 2022 used a de jure approach: enumerating people according to their usual place of residence.
Administrative data from multiple sources was used to cross-validate collected census data.
See census methodology in:
https://portal.saudicensus.sa/portal/public/methodology
Portal of the Saudi census:
https://portal.saudicensus.sa/portal
Population data for 2010-22 were revised and backcasted, based on 2022 population census and past years’ administrative data.
Technical note on backcasting:
https://database.stats.gov.sa/Methodologies/En_Documents/40_Technical%20Note%20Population%20Back%20Casting.PDF
2. Institution which provides data
General Authority for Statistics (GAStat)
3. Data availability
The time series were taken from GAStat’s publication “Population Estimates Statistics 2024” (PDF version).
https://www.stats.gov.sa/en/statistics?index=119025
Report Link:
https://www.stats.gov.sa/documents/20117/2435273/Population+Estimates+Statistics+2024+EN.pdf/9b71e303-5fd9-19cb-9913-850a9d521639?t=1738859947691
Last date of access: 09 May 2025
GLMM and GRC cannot guarantee that the link to access the source will not change;
that the information will not be removed from the website it was obtained from;
that no geo-blockages will be imposed; or that the information will not be available for any another reason.
Keywords: Saudi Arabia, National Population, Foreign Population
|
Emirati mothers |
Non-Emirati mothers |
Total |
|
Male births |
Female births |
Total |
Male births |
Female births |
Total |
Male births |
Female births |
Total |
| 1977 |
5,491 |
5,236 |
10,727 |
6,307 |
6,085 |
12,392 |
11,798 |
11,321 |
23,119 |
| 1978 |
6,092 |
5,873 |
11,965 |
8,031 |
7,649 |
15,680 |
14,123 |
13,522 |
27,645 |
| 1979 |
6,534 |
6,410 |
12,944 |
9,794 |
8,947 |
18,741 |
16,328 |
15,357 |
31,685 |
| 1980 |
7,258 |
6,904 |
14,162 |
10,549 |
10,063 |
20,612 |
17,807 |
16,967 |
34,774 |
| 1981 |
7,656 |
7,347 |
15,003 |
12,011 |
11,533 |
23,544 |
19,667 |
18,880 |
38,547 |
| 1982 |
8,331 |
7,853 |
16,184 |
13,045 |
12,732 |
25,777 |
21,376 |
20,585 |
41,961 |
| 1983 |
8,678 |
8,256 |
16,934 |
13,484 |
13,001 |
26,485 |
22,162 |
21,257 |
43,419 |
| 1984 |
9,031 |
8,625 |
17,656 |
13,461 |
12,587 |
26,048 |
22,492 |
21,212 |
43,704 |
| 1985 |
9,034 |
8,733 |
17,767 |
13,546 |
12,879 |
26,425 |
22,580 |
21,612 |
44,192 |
| 1986 |
9,380 |
8,999 |
18,379 |
13,810 |
13,271 |
27,081 |
23,190 |
22,270 |
45,460 |
| 1987 |
9,328 |
8,977 |
18,305 |
15,003 |
14,395 |
29,398 |
24,331 |
23,372 |
47,703 |
| 1988 |
9,603 |
9,114 |
18,717 |
16,405 |
15,714 |
32,119 |
26,008 |
24,828 |
50,836 |
| 1989 |
9,625 |
9,327 |
18,952 |
16,753 |
16,198 |
32,951 |
26,378 |
25,525 |
51,903 |
| 1990 |
9,652 |
9,108 |
18,760 |
17,218 |
16,286 |
33,504 |
26,870 |
25,394 |
52,264 |
| 1991 |
9,507 |
8,873 |
18,380 |
15,947 |
15,169 |
31,116 |
25,454 |
24,042 |
49,496 |
| 1992 |
9,929 |
9,419 |
19,348 |
16,127 |
15,129 |
31,256 |
26,056 |
24,548 |
50,604 |
| 1993 |
10,119 |
9,752 |
19,871 |
15,486 |
14,840 |
30,326 |
25,605 |
24,592 |
50,197 |
| 1994 |
10,340 |
9,925 |
20,265 |
16,507 |
15,668 |
32,175 |
26,847 |
25,593 |
52,440 |
| 1995 |
10,408 |
9,930 |
20,338 |
14,343 |
13,886 |
28,229 |
24,751 |
23,816 |
48,567 |
| 1996 |
10,883 |
10,356 |
21,239 |
13,150 |
12,661 |
25,811 |
24,033 |
23,017 |
47,050 |
| 1997 |
10,637 |
10,151 |
20,788 |
13,069 |
12,503 |
25,572 |
23,706 |
22,654 |
46,360 |
| 1998 |
10,376 |
9,842 |
20,218 |
14,202 |
13,716 |
27,918 |
24,578 |
23,558 |
48,136 |
| 1999 |
10,623 |
10,299 |
20,922 |
14,751 |
13,986 |
28,737 |
25,374 |
24,285 |
49,659 |
| 2000 |
11,502 |
10,949 |
22,451 |
16,138 |
15,097 |
31,235 |
27,640 |
26,046 |
53,686 |
| 2001 |
11,825 |
11,384 |
23,209 |
16,793 |
16,134 |
32,927 |
28,618 |
27,518 |
56,136 |
| 2002 |
12,170 |
11,975 |
24,145 |
17,338 |
16,587 |
33,925 |
29,508 |
28,562 |
58,070 |
| 2003 |
13,188 |
12,567 |
25,755 |
18,053 |
17,357 |
35,410 |
31,241 |
29,924 |
61,165 |
| 2004 |
13,854 |
13,419 |
27,273 |
18,325 |
17,515 |
35,840 |
32,179 |
30,934 |
63,113 |
| 2005 |
14,310 |
13,712 |
28,022 |
18,835 |
17,766 |
36,601 |
33,145 |
31,478 |
64,623 |
| 2006 |
14,099 |
13,804 |
27,903 |
17,951 |
17,115 |
35,066 |
32,050 |
30,919 |
62,969 |
| 2007 |
14,649 |
14,352 |
29,001 |
19,810 |
18,856 |
38,666 |
34,459 |
33,208 |
67,667 |
| 2008 |
14,982 |
14,543 |
29,525 |
20,279 |
18,963 |
39,242 |
35,264 |
33,515 |
68,779 |
| 2009 |
15,958 |
14,990 |
30,951 |
23,191 |
22,217 |
45,415 |
39,149 |
37,207 |
76,376 |
| 2010 |
16,397 |
15,906 |
32,303 |
24,239 |
23,057 |
47,296 |
40,652 |
38,973 |
79,625 |
| 2011 |
17,027 |
16,439 |
33,466 |
25,690 |
24,744 |
50,434 |
42,743 |
41,207 |
83,950 |
| 2012 |
17,279 |
16,761 |
34,040 |
28,207 |
27,272 |
55,479 |
45,511 |
44,060 |
89,578 |
| 2013 |
17,257 |
16,708 |
33,965 |
30,571 |
28,950 |
59,521 |
47,855 |
45,684 |
93,539 |
| 2014 |
17,643 |
16,975 |
34,618 |
31,398 |
29,790 |
61,188 |
49,067 |
46,793 |
95,860 |
| 2015 |
17,835 |
16,959 |
34,794 |
32,226 |
30,270 |
62,496 |
50,061 |
47,229 |
97,290 |
| 2016 |
17,662 |
16,891 |
34,553 |
32,925 |
30,733 |
63,658 |
50,634 |
47,665 |
98,299 |
| 2017 |
17,462 |
16,834 |
34,296 |
32,659 |
30,778 |
63,437 |
50,121 |
47,612 |
97,733 |
| 2018 |
17,218 |
16,482 |
33,700 |
31,512 |
30,093 |
61,609 |
48,730 |
46,575 |
95,313 |
| 2019 |
16,925 |
15,876 |
32,801 |
31,932 |
29,964 |
61,896 |
48,857 |
45,840 |
94,697 |
| 2020 |
16,341 |
15,263 |
31,604 |
33,899 |
32,069 |
65,968 |
50,240 |
47,332 |
97,572 |
| 2021 |
16,376 |
15,360 |
31,736 |
31,440 |
29,601 |
61,041 |
47,816 |
44,961 |
92,777 |
| 2022 |
16,063 |
14,826 |
30,889 |
33,916 |
31,826 |
65,742 |
49,979 |
46,652 |
96,631 |
Source: Ministry of Health and Prevention/ Federal Competitiveness and Statistics Centre (FCSC).
ANNEXED NOTE
1. Characteristics of data
Totals may vary due to the “Not Stated” nationality or gender for some births included in the grand total.
Vital statistics data (births and deaths) are taken from the records of the UAE Ministry of Health and Prevention.
The table presents the total number of live births who were registered in one of the health facilities and hospitals in the country during a specific calendar year.
It also includes children of citizens born abroad who were registered inside the country.
Methodology of births and deaths’ registration:
https://fcsc.gov.ae/_layouts/download.aspx?SourceUrl=%2Fen-us%2FLists%2FD_StatisticsSubjectV2%2FAttachments%2F1769%2FSP-17%20Methodology%20for%20Birth%20and%20Death%20Statistics.pdf
Definition of live birth and other metadata:
https://fcsc.gov.ae/_layouts/download.aspx?SourceUrl=%2Fen-us%2FLists%2FD_StatisticsSubjectV2%2FAttachments%2F1768%2F3-%20Births%20Statistics%202022%20%D8%A5%D8%AD%D8%B5%D8%A7%D8%A1%D8%A7%D8%AA%20%D8%A7%D9%84%D9%85%D9%88%D8%A7%D9%84%D9%8A%D8%AF.xlsx
Methodology of births and deaths’ registration:
https://fcsc.gov.ae/_layouts/download.aspx?SourceUrl=%2Fen-us%2FLists%2FD_StatisticsSubjectV2%2FAttachments%2F1769%2FSP-17%20Methodology%20for%20Birth%20and%20Death%20Statistics.pdf
2. Institution which provides data
UAE Federal Competitiveness and Statistitics Center (FCSC)
https://fcsa.gov.ae/en-us/
3. Data availability
Births and deaths records, disaggregated by nationality and published by the FCSC (annual estimates available since 1995). Uninterrupted series: available since 2007
https://fcsc.gov.ae/en-us/Pages/Statistics/Statistics-by-Subject.aspx#/%3Ffolder=Demography%20and%20Social/Vital%20Statistics/Births%20and%20Deaths&subject=Demography%20and%20Social
UAE stat data explorer (.csv format):
https://uaestat.fcsc.gov.ae/?lc=en&fs[0]=FCSC%20-%20Statistical%20Hierarchy%2C0%7CBirths%23VTS_BIR%23&pg=0&fc=FCSC%20-%20Statistical%20Hierarchy&snb=5
Last date of access: 09 May 2025
GLMM and GRC cannot guarantee that the link to access the source will not change;
that the information will not be removed from the website it was obtained from;
that no geo-blockages will be imposed; or that the information will not be available for any another reason.
Keywords: United Arab Emirates, National Population, Foreign Population, National & Foreign Populations
|
Crude Births Rate
(per 1,000 total population) |
Emirati women’s Total Fertility Rate (TFR)
(Children per Emirati woman) |
| 2016 |
10.8 |
3.7 |
| 2017 |
10.5 |
3.7 |
| 2018 |
10.2 |
3.6 |
| 2019 |
10.0 |
3.3 |
| 2020 |
10.5 |
3.23 |
| 2021 |
9.7 |
3.2 |
| 2022 |
9.4 |
3.1 |
Source: Ministry of Health and Prevention/ Federal Competitiveness and Statistics Centre (FCSC).
ANNEXED NOTE
1. Characteristics of data
Vital statistics data (births and deaths) are taken from the records of the UAE Ministry of Health and Prevention.
Methodology of births and deaths’ registration:
https://fcsc.gov.ae/_layouts/download.aspx?SourceUrl=%2Fen-us%2FLists%2FD_StatisticsSubjectV2%2FAttachments%2F1769%2FSP-17%20Methodology%20for%20Birth%20and%20Death%20Statistics.pdf
Indicators Definition:
Crude Birth Rate (CBR): The number of live births per 1,000 population in a given year.
The Total Fertility Rate (TFR) is the average number of children a hypothetical cohort of women would have at the end of their reproductive period
if they were subject during their whole lives to the fertility rates of a given period and if they were not subject to mortality.
It is expressed as children per woman.
Definition of live birth and other metadata:
https://fcsc.gov.ae/_layouts/download.aspx?SourceUrl=%2Fen-us%2FLists%2FD_StatisticsSubjectV2%2FAttachments%2F1768%2F3-%20Births%20Statistics%202022%20%D8%A5%D8%AD%D8%B5%D8%A7%D8%A1%D8%A7%D8%AA%20%D8%A7%D9%84%D9%85%D9%88%D8%A7%D9%84%D9%8A%D8%AF.xlsx
2. Institution which provides data
UAE Federal Competitiveness and Statistitics Center (FCSC)
https://fcsa.gov.ae/en-us/
3. Data availability
Births and deaths records, disaggregated by nationality and published by the FCSC (annual estimates available since 1995). Uninterrupted series: available since 2007
https://fcsc.gov.ae/en-us/Pages/Statistics/Statistics-by-Subject.aspx#/%3Ffolder=Demography%20and%20Social/Vital%20Statistics/Births%20and%20Deaths&subject=Demography%20and%20Social
UAE stat data explorer (.csv format):
https://uaestat.fcsc.gov.ae/?lc=en&fs[0]=FCSC%20-%20Statistical%20Hierarchy%2C0%7CBirths%23VTS_BIR%23&pg=0&fc=FCSC%20-%20Statistical%20Hierarchy&snb=5
Last date of access: 09 May 2025
GLMM and GRC cannot guarantee that the link to access the source will not change;
that the information will not be removed from the website it was obtained from;
that no geo-blockages will be imposed; or that the information will not be available for any another reason.
Keywords: United Arab Emirates, National Population, Foreign Population, National & Foreign Populations
| |
2021 |
2022 |
2023 |
| |
Omanis |
Expatriates |
Omanis |
Expatriates |
Omanis |
Expatriates |
| Muscat |
19,915 |
12,229 |
20,145 |
17,720 |
20,555 |
48,453 |
| Mutrah |
39,419 |
179,291 |
39,820 |
183,770 |
42,686 |
177,332 |
| Al Amrat |
91,800 |
32,189 |
93,555 |
46,200 |
95,303 |
51,566 |
| Bawshar |
90,982 |
291,932 |
92,623 |
319,921 |
94,583 |
318,107 |
| As Seeb |
263,410 |
228,665 |
268,580 |
256,116 |
271,919 |
271,504 |
| Qurayyat |
48,010 |
12,339 |
49,001 |
14,005 |
50,125 |
13,547 |
| Muscat Governorate |
553,536 |
756,645 |
563,724 |
837,732 |
575,171 |
880,509 |
| Salalah |
153,448 |
180,240 |
156,438 |
232,403 |
160,378 |
257,513 |
| Taqah |
18,737 |
3,796 |
19,915 |
6,571 |
20,470 |
7,090 |
| Mirbat |
13,296 |
3,522 |
13,604 |
5,024 |
14,098 |
5,731 |
| Rakhyut |
4,362 |
650 |
4,493 |
773 |
4,648 |
927 |
| Thumrayt |
10,274 |
6,968 |
10,606 |
8,347 |
10,938 |
8,923 |
| Dalkut |
2,743 |
509 |
2,830 |
585 |
2,946 |
665 |
| Al Mazuynah |
7,676 |
1,324 |
8,126 |
2,002 |
8,746 |
2,552 |
| Muqshin |
489 |
161 |
489 |
216 |
533 |
234 |
| Shalim wa juzor al Hallniyat |
4,252 |
2,527 |
4,357 |
3,234 |
4,493 |
3,899 |
| Sadah |
5,246 |
815 |
5,315 |
1,041 |
5,384 |
1,098 |
| Dhofar Governorate |
220,523 |
200,512 |
226,173 |
260,196 |
232,634 |
288,632 |
| Khasab |
21,037 |
9,578 |
21,388 |
12,269 |
22,157 |
14,540 |
| Daba |
6,886 |
3,377 |
6,997 |
3,717 |
7,174 |
4,030 |
| Bukha |
3,310 |
1,128 |
3,350 |
1,197 |
3,344 |
1,227 |
| Madaha |
3,601 |
781 |
3,611 |
695 |
3,667 |
661 |
| Musandam Governorate |
34,834 |
14,864 |
35,346 |
17,878 |
36,342 |
20,458 |
| Al Buraymi |
65,024 |
43,345 |
65,921 |
47,567 |
66,424 |
51,652 |
| Mahdah |
8,311 |
2,050 |
8,514 |
2,403 |
8,523 |
2,613 |
| As Sunaynah |
627 |
725 |
624 |
732 |
618 |
746 |
| Al Buraymi Governorate |
73,962 |
46,120 |
75,059 |
50,702 |
75,565 |
55,011 |
| Nizwa |
83,720 |
40,017 |
86,208 |
53,059 |
89,220 |
58,962 |
| Bahla |
72,660 |
17,229 |
74,463 |
21,952 |
75,997 |
23,355 |
| Manah |
19,126 |
6,562 |
19,524 |
8,336 |
19,713 |
8,586 |
| Al Hamra |
25,372 |
3,717 |
26,038 |
4,975 |
26,562 |
5,344 |
| Adam |
20,121 |
8,294 |
20,602 |
11,248 |
20,457 |
11,698 |
| Izki |
48,714 |
12,090 |
49,887 |
16,147 |
50,994 |
17,973 |
| Samail |
65,346 |
16,387 |
66,931 |
21,066 |
68,218 |
22,579 |
| BidBid |
30,573 |
7,598 |
31,386 |
10,096 |
31,837 |
11,706 |
| AL Jabal Alakhdar |
9,543 |
1,464 |
9,779 |
1,997 |
9,933 |
2,116 |
| Ad Dakhliyah Governorate |
375,175 |
113,358 |
384,818 |
148,876 |
392,931 |
162,319 |
| Sohar |
135,033 |
100,022 |
138,020 |
125,874 |
141,801 |
138,861 |
| Shinas |
67,676 |
15,987 |
69,084 |
19,233 |
70,373 |
21,601 |
| Liwa |
37,367 |
20,295 |
38,247 |
25,045 |
39,135 |
27,069 |
| Saham |
117,640 |
34,143 |
120,235 |
45,311 |
122,493 |
50,562 |
| Al khaburah |
65,407 |
15,284 |
67,150 |
22,821 |
68,511 |
26,697 |
| As Suwayq |
140,577 |
45,974 |
143,818 |
57,176 |
146,391 |
64,052 |
| Al Batinah North Governorate |
563,700 |
231,705 |
576,554 |
295,460 |
588,704 |
328,842 |
| Al Rustaq |
97,311 |
23,015 |
99,922 |
29,128 |
102,381 |
31,905 |
| Al Awabi |
16,761 |
2,801 |
17,118 |
3,432 |
17,370 |
3,401 |
| Nakhal |
24,022 |
5,032 |
24,656 |
7,153 |
25,133 |
8,031 |
| Wadi Al maawil |
17,352 |
3,535 |
17,763 |
4,867 |
18,372 |
5,416 |
| Barka |
126,638 |
57,897 |
129,376 |
75,799 |
131,049 |
88,374 |
| Al Musanaah |
79,358 |
22,286 |
81,194 |
27,618 |
83,362 |
30,655 |
| Al Batinah South Governorate |
361,442 |
114,566 |
370,029 |
147,997 |
377,667 |
167,782 |
| Sur |
74,513 |
38,800 |
76,018 |
46,509 |
77,704 |
48,955 |
| Al Kamil wa al Wafi |
28,044 |
11,034 |
28,654 |
14,137 |
29,218 |
16,882 |
| Jaalan bani bu Hasan |
36,714 |
9,346 |
37,575 |
13,180 |
38,360 |
15,732 |
| Jaalan bani bu Ali |
83,496 |
26,550 |
85,885 |
31,845 |
87,821 |
34,890 |
| Masirah |
9,123 |
5,010 |
9,322 |
6,623 |
9,491 |
7,448 |
| Ash Sharqiyah South Governorate |
231,890 |
90,740 |
237,454 |
112,294 |
242,594 |
123,907 |
| Ibra |
30,597 |
18,620 |
31,438 |
21,717 |
31,973 |
23,181 |
| Al Mudaybi |
63,611 |
19,557 |
65,524 |
26,669 |
65,304 |
28,755 |
| Bidiyah |
27,423 |
15,302 |
28,196 |
20,770 |
28,709 |
23,782 |
| Al qabil |
19,411 |
5,649 |
19,874 |
7,123 |
20,379 |
8,066 |
| Wadi bani Khalid |
11,612 |
1,790 |
11,888 |
2,309 |
12,154 |
2,353 |
| Dima wa at Taiyin |
23,487 |
3,775 |
24,224 |
4,723 |
24,607 |
4,981 |
| Sinaw |
21,023 |
12,232 |
21,277 |
15,500 |
24,270 |
17,078 |
| Ash Sharqiyah North Governorate |
197,164 |
76,925 |
202,421 |
98,811 |
207,396 |
108,196 |
| Ibri |
125,330 |
40,278 |
128,031 |
50,203 |
130,545 |
53,179 |
| Yanqul |
21,615 |
5,220 |
22,101 |
6,637 |
22,498 |
7,216 |
| Dank |
19,390 |
4,801 |
19,770 |
6,116 |
20,284 |
6,807 |
| Adh Dhahirah Governorate |
166,335 |
50,299 |
169,902 |
62,956 |
173,327 |
67,202 |
| Hayma |
3,303 |
6,240 |
3,390 |
7,110 |
3,521 |
7,391 |
| Muhut |
13,180 |
4,358 |
13,477 |
5,556 |
13,622 |
5,999 |
| Ad Duqm |
5,432 |
15,147 |
5,538 |
18,313 |
5,708 |
17,787 |
| Al Jazir |
3,641 |
1,850 |
3,726 |
2,358 |
3,775 |
2,610 |
| Al Wusta Governorate :- |
25,556 |
27,595 |
26,131 |
33,337 |
26,626 |
33,787 |
| Sultanate Total |
2,804,117 |
1,723,329 |
2,867,611 |
2,066,239 |
2,928,957 |
2,236,645 |
Source: National Centre for Statistics and Information
ANNEXED NOTE
1. Technical Notes and Definitions
Period of reference: 31/12.
Source of the data: data updated from e-census 2020; based on vital statistics (births and deaths) produced by the Ministry of Health (MOH), and National Registration System (Royal Oman Police).
The civil registration records all Omani and expatriate residents. It is based on the civil status system and is maintained
by the General Directorate of Civil Status, a part of the Royal Oman Police.
Since 2004, registration of all vital events taking place in the Sultanate (births, death, marriages and divorces) in the civil register is mandatory for Omanis and foreign residents of the Sultanate.
e-census 2020:
Population data and statistics: methodology explained in publication “Electronic Census System for the E-Census for Population, Residences & Establishments 2020”, especially pp. 15-16; 19-20
https://portal.ecensus.gov.om/web/
Portal of e-census 2020 and data updates for December 2021 to 2023:
https://portal.ecensus.gov.om/web/
Characteristics of data:
Figures refer to 1. Omanis holding an official valid document registered in the National Registration System, or expired for less than ten years.
2. Foreign residents holding valid visas, or visas expired for lesss than two years; dependents holding valid visas, providing that they are in the country.
Residence visa for expatriates includes residence visa for a wife of an Omani, student resident, multiple entry visa, employment visa,
employment contracting visa, official visit visa, investor visa. The dependent visa includes Family Reunion visas and relative/ friend visit visa.
2. Institution which provides data
National Center for Statistics and Information (NCSI)
3. Data availability
As of April 2025, census 2020 data processing tool is not functional.
Data were retrieved from Oman Statistical Yearbook 2024, Population section:
https://www.ncsi.gov.om/Pages/Publications.aspx
Date of access: 23 April 2025.
GLMM and GRC cannot guarantee that the link to access the source will not change;
that the information will not be removed from the website it was obtained from;
that no geo-blockages will be imposed; or that the information will not be available for any another reason.
Keywords: Oman, Foreign & National Population
| |
Omanis |
Expatriates |
Total |
| |
Males |
Females |
Total |
Males |
Females |
Total |
Males |
Females |
Total |
| 0-4 |
185,929 |
179,730 |
365,659 |
29,645 |
28,071 |
57,716 |
215,574 |
207,801 |
423,375 |
| 5-9 |
209,421 |
201,574 |
410,995 |
33,484 |
31,975 |
65,459 |
242,905 |
233,549 |
476,454 |
| 10-14 |
170,250 |
165,045 |
335,295 |
27,812 |
25,842 |
53,654 |
198,062 |
190,887 |
388,949 |
| 15-19 |
126,275 |
121,354 |
247,629 |
20,647 |
19,066 |
39,713 |
146,922 |
140,420 |
287,342 |
| 20-24 |
110,133 |
107,390 |
217,523 |
150,980 |
38,393 |
189,373 |
261,113 |
145,783 |
406,896 |
| 25-29 |
115,076 |
111,291 |
226,367 |
259,826 |
61,196 |
321,022 |
374,902 |
172,487 |
547,389 |
| 30-34 |
123,856 |
121,376 |
245,232 |
316,076 |
75,202 |
391,278 |
439,932 |
196,578 |
636,510 |
| 35-39 |
116,740 |
114,377 |
231,117 |
337,055 |
78,066 |
415,121 |
453,795 |
192,443 |
646,238 |
| 40-44 |
93,746 |
93,064 |
186,810 |
238,597 |
57,752 |
296,349 |
332,343 |
150,816 |
483,159 |
| 45-49 |
67,986 |
68,290 |
136,276 |
141,083 |
37,514 |
178,597 |
209,069 |
105,804 |
314,873 |
| 50-54 |
44,163 |
42,691 |
86,854 |
89,470 |
21,933 |
111,403 |
133,633 |
64,624 |
198,257 |
| 55-59 |
31,874 |
33,707 |
65,581 |
49,157 |
12,441 |
61,598 |
81,031 |
46,148 |
127,179 |
| 60-64 |
26,972 |
30,799 |
57,771 |
22,105 |
7,404 |
29,509 |
49,077 |
38,203 |
87,280 |
| 65-69 |
18,614 |
23,473 |
42,087 |
10,714 |
4,389 |
15,103 |
29,328 |
27,862 |
57,190 |
| 70-74 |
13,184 |
16,898 |
30,082 |
3,351 |
2,520 |
5,871 |
16,535 |
19,418 |
35,953 |
| 75-79 |
8,709 |
10,432 |
19,141 |
1481 |
1319 |
2,800 |
10,190 |
11,751 |
21,941 |
| > 80 |
11,187 |
13,351 |
24,538 |
1153 |
926 |
2,079 |
12,340 |
14,277 |
26,617 |
| Total |
1,474,115 |
1,454,842 |
2,928,957 |
1,732,636 |
504,009 |
2,236,645 |
3,206,751 |
1,958,851 |
5,165,602 |
Source: National Centre for Statistics and Information
ANNEXED NOTE
1. Technical Notes and Definitions
Period of reference: 31/12.
Source of the data: data updated from e-census 2020; based on vital statistics (births and deaths) produced by the Ministry of Health (MOH), and National Registration System (Royal Oman Police).
The civil registration records all Omani and expatriate residents. It is based on the civil status system and is maintained
by the General Directorate of Civil Status, a part of the Royal Oman Police.
Since 2004, registration of all vital events taking place in the Sultanate (births, death, marriages and divorces) in the civil register is mandatory for Omanis and foreign residents of the Sultanate.
e-census 2020:
Population data and statistics: methodology explained in publication “Electronic Census System for the E-Census for Population, Residences & Establishments 2020”, especially pp. 15-16; 19-20
https://portal.ecensus.gov.om/web/
Portal of e-census 2020 and data updates for December 2021 to 2023:
https://portal.ecensus.gov.om/web/
Characteristics of data:
Figures refer to 1. Omanis holding an official valid document registered in the National Registration System, or expired for less than ten years.
2. Foreign residents holding valid visas, or visas expired for lesss than two years; dependents holding valid visas, providing that they are in the country.
Residence visa for expatriates includes residence visa for a wife of an Omani, student resident, multiple entry visa, employment visa,
employment contracting visa, official visit visa, investor visa. The dependent visa includes Family Reunion visas and relative/ friend visit visa.
2. Institution which provides data
National Center for Statistics and Information (NCSI)
3. Data availability
As of April 2025, census 2020 data processing tool is not functional.
Data were retrieved from Oman Statistical Yearbook 2024, Population section:
https://www.ncsi.gov.om/Pages/Publications.aspx
Date of access: 23 April 2025.
GLMM and GRC cannot guarantee that the link to access the source will not change;
that the information will not be removed from the website it was obtained from;
that no geo-blockages will be imposed; or that the information will not be available for any another reason.
Keywords: Oman, Foreign & National Population
| |
15 – 19 |
20 – 24 |
25 – 29 |
30 – 34 |
35 – 39 |
40 – 44 |
45 – 49 |
Total Fertility Rate (children per woman) |
| 2006 |
7.30 |
76.90 |
164.50 |
176.70 |
133.10 |
61.70 |
19.10 |
3.20 |
| 2007 |
7.60 |
80.10 |
162.80 |
170.10 |
130.70 |
57.80 |
17.50 |
3.10 |
| 2008 |
8.30 |
87.70 |
170.80 |
178.70 |
136.70 |
59.70 |
18.50 |
3.30 |
| 2009 |
13.40 |
108.50 |
176.70 |
173.00 |
127.50 |
51.90 |
13.50 |
3.30 |
| 2010 |
12.30 |
112.80 |
203.60 |
201.30 |
141.70 |
58.50 |
12.60 |
3.70 |
| 2011 |
12.10 |
105.00 |
199.50 |
195.60 |
148.50 |
61.30 |
12.50 |
3.70 |
| 2012 |
12.10 |
108.00 |
205.20 |
197.10 |
150.50 |
64.60 |
10.10 |
3.70 |
| 2013 |
15.20 |
122.50 |
213.10 |
201.80 |
149.60 |
63.10 |
9.70 |
3.90 |
| 2014 |
14.40 |
119.90 |
216.10 |
205.20 |
153.00 |
67.90 |
9.70 |
3.90 |
| 2015 |
14.93 |
117.65 |
218.50 |
207.90 |
157.79 |
68.38 |
11.29 |
4.00 |
| 2016 |
13.72 |
114.99 |
219.17 |
207.67 |
157.65 |
68.81 |
10.99 |
3.97 |
| 2017 |
13.10 |
113.30 |
218.90 |
211.80 |
159.50 |
71.80 |
10.20 |
4.00 |
| 2018 |
12.00 |
107.30 |
207.80 |
201.70 |
161.70 |
77.30 |
10.50 |
3.90 |
| 2019 |
8.30 |
96.30 |
197.20 |
203.60 |
156.20 |
69.50 |
9.00 |
3.70 |
| 2020 |
7.50 |
86.70 |
188.40 |
190.20 |
155.00 |
73.10 |
9.40 |
3.60 |
| 2021 |
7.38 |
83.59 |
186.08 |
186.84 |
150.47 |
66.01 |
8.28 |
3.40 |
| 2022 |
5.60 |
74.60 |
174.60 |
174.70 |
140.30 |
64.50 |
7.30 |
3.20 |
| 2023 |
3.94 |
57.71 |
152.38 |
160.44 |
130.24 |
62.53 |
6.84 |
2.90 |
Source: National Centre for Statistics and Information
ANNEXED NOTE
1. Technical Notes and Definitions
Period of reference: 31/12.
Source of the data: vital statistics (births and deaths) produced by the Ministry of Health (MOH),and National Registration System (Royal Oman Police).
The civil registration records all Omani and expatriate residents. It is based on the civil status system and is maintained
by the General Directorate of Civil Status, a part of the Royal Oman Police.
Since 2004, registration of all vital events taking place in the Sultanate (births, death, marriages and divorces) in the civil register is mandatory for Omanis and foreign residents of the Sultanate.
Definitions:
The Age-Specific Fertility Rates (ASFR) measure the annual number of births to women of a specified age or age group per 1,000 women in that age group.
The Total Fertility Rate (TFR) is the number of children that would be born to a woman if she were to live to the end of her childbearing years and bear children in accordance with age-specific fertility rates currently observed. The reference period is three years preceding the survey.
Characteristics of data:
Figures refer to 1. Omanis holding an official valid document registered in the National Registration System, or expired for less than ten years.
2. Foreign residents holding valid visas, or visas expired for lesss than two years; dependents holding valid visas, providing that they are in the country.
Residence visa for expatriates includes residence visa for a wife of an Omani, student resident, multiple entry visa, employment visa,
employment contracting visa, official visit visa, investor visa. The dependent visa includes Family Reunion visas and relative/ friend visit visa.
2. Institution which provides data
National Center for Statistics and Information (NCSI)
https://www.ncsi.gov.om/Pages/NCSI.aspx
3. Data availability
Data were retrieved from Oman data portal, Population section
http://www.data.gov.om/
https://data.gov.om/OMPOP2016/population
Date of access: 23 April 2025.
GLMM and GRC cannot guarantee that the link to access the source will not change;
that the information will not be removed from the website it was obtained from;
that no geo-blockages will be imposed; or that the information will not be available for any another reason.
Keywords: Oman, National Population
| |
15 – 19 |
20 – 24 |
25 – 29 |
30 – 34 |
35 – 39 |
40 – 44 |
45 – 49 |
Total Fertility Rate (children per woman) |
| 2006 |
9.80 |
42.40 |
53.20 |
49.00 |
36.10 |
12.40 |
3.90 |
1.00 |
| 2007 |
8.80 |
39.90 |
53.60 |
50.40 |
35.80 |
13.60 |
3.70 |
1.00 |
| 2008 |
5.60 |
34.60 |
43.30 |
40.80 |
27.50 |
10.50 |
2.40 |
0.82 |
| 2009 |
19.20 |
49.70 |
50.40 |
40.10 |
26.70 |
9.30 |
1.60 |
1.00 |
| 2010 |
14.50 |
48.50 |
53.10 |
46.80 |
24.30 |
10.40 |
1.00 |
1.00 |
| 2011 |
11.20 |
44.80 |
46.50 |
40.40 |
22.90 |
8.70 |
1.40 |
0.90 |
| 2012 |
10.00 |
35.20 |
38.20 |
42.00 |
22.90 |
8.30 |
0.90 |
0.80 |
| 2013 |
11.50 |
30.40 |
31.60 |
44.30 |
24.20 |
8.10 |
2.40 |
0.80 |
| 2014 |
10.60 |
32.30 |
31.20 |
41.70 |
24.80 |
9.00 |
1.30 |
0.80 |
| 2015 |
9.50 |
34.71 |
29.71 |
40.03 |
22.66 |
7.00 |
1.31 |
0.70 |
| 2016 |
|
33.29 |
29.31 |
38.45 |
23.13 |
7.58 |
0.87 |
0.72 |
| 2017 |
10.80 |
28.20 |
28.30 |
36.30 |
23.20 |
7.10 |
1.10 |
0.70 |
| 2018 |
10.30 |
24.70 |
28.90 |
36.70 |
22.60 |
7.50 |
0.70 |
0.70 |
| 2019 |
8.80 |
24.70 |
28.70 |
35.20 |
22.60 |
6.60 |
0.90 |
0.60 |
| 2020 |
6.40 |
34.10 |
35.00 |
35.30 |
24.00 |
6.70 |
1.20 |
0.70 |
| 2021 |
4.42 |
40.54 |
33.57 |
32.18 |
21.41 |
6.38 |
0.68 |
0.70 |
| 2022 |
7.10 |
27.80 |
31.50 |
28.50 |
17.90 |
5.10 |
0.70 |
0.60 |
| 2023 |
6.24 |
22.76 |
28.97 |
30.23 |
19.00 |
4.80 |
0.45 |
0.60 |
Source: National Centre for Statistics and Information
ANNEXED NOTE
1. Technical Notes and Definitions
Period of reference: 31/12.
Source of the data: vital statistics (births and deaths) produced by the Ministry of Health (MOH),and National Registration System (Royal Oman Police).
The civil registration records all Omani and expatriate residents. It is based on the civil status system and is maintained
by the General Directorate of Civil Status, a part of the Royal Oman Police.
Since 2004, registration of all vital events taking place in the Sultanate (births, death, marriages and divorces) in the civil register is mandatory for Omanis and foreign residents of the Sultanate.
Definitions:
The Age-Specific Fertility Rates (ASFR) measure the annual number of births to women of a specified age or age group per 1,000 women in that age group.
The Total Fertility Rate (TFR) is the number of children that would be born to a woman if she were to live to the end of her childbearing years and bear children in accordance with age-specific fertility rates currently observed. The reference period is three years preceding the survey.
Characteristics of data:
Figures refer to 1. Omanis holding an official valid document registered in the National Registration System, or expired for less than ten years.
2. Foreign residents holding valid visas, or visas expired for lesss than two years; dependents holding valid visas, providing that they are in the country.
Residence visa for expatriates includes residence visa for a wife of an Omani, student resident, multiple entry visa, employment visa,
employment contracting visa, official visit visa, investor visa. The dependent visa includes Family Reunion visas and relative/ friend visit visa.
2. Institution which provides data
National Center for Statistics and Information (NCSI)
https://www.ncsi.gov.om/Pages/NCSI.aspx
3. Data availability
Data were retrieved from Oman data portal, Population section
http://www.data.gov.om/
https://data.gov.om/OMPOP2016/population
Date of access: 23 April 2025.
GLMM and GRC cannot guarantee that the link to access the source will not change;
that the information will not be removed from the website it was obtained from;
that no geo-blockages will be imposed; or that the information will not be available for any another reason.
Keywords: Oman, Foreign Population
| |
Omanis |
Expatriates |
Total |
| |
Males |
Females |
Total |
Males |
Females |
Total |
Males |
Females |
Total |
| 2000 |
|
|
1,777,685 |
|
|
623,571 |
|
|
2,401,256 |
| 2001 |
928,747 |
897,377 |
1,826,124 |
522,294 |
129,269 |
651,563 |
1,451,041 |
1,026,646 |
2,477,687 |
| 2002 |
950,666 |
918,914 |
1,869,580 |
492,650 |
175,512 |
668,162 |
1,443,316 |
1,094,426 |
2,537,742 |
| 2003* |
900,540 |
881,018 |
1,781,558 |
412,699 |
146,558 |
559,257 |
1,313,239 |
1,027,576 |
2,340,815 |
| 2004 |
911,135 |
891,796 |
1,802,931 |
449,756 |
162,889 |
612,645 |
1,360,891 |
1,054,685 |
2,415,576 |
| 2005 |
931,007 |
911,677 |
1,842,684 |
527,838 |
138,315 |
666,153 |
1,458,845 |
1,049,992 |
2,508,837 |
| 2006 |
951,440 |
932,136 |
1,883,576 |
546,703 |
146,783 |
693,486 |
1,498,143 |
1,078,919 |
2,577,062 |
| 2007 |
970,489 |
952,208 |
1,922,697 |
651,630 |
169,172 |
820,802 |
1,622,119 |
1,121,380 |
2,743,499 |
| 2008 |
994,120 |
973,060 |
1,967,180 |
693,294 |
206,954 |
900,248 |
1,687,414 |
1,180,014 |
2,867,428 |
| 2009 |
1,019,322 |
998,237 |
2,017,559 |
951,793 |
204,565 |
1,156,358 |
1,971,115 |
1,202,802 |
3,173,917 |
| 2010* |
990,590 |
966,746 |
1,957,336 |
621,818 |
194,325 |
816,143 |
1,612,408 |
1,161,071 |
2,773,479 |
| 2011 |
1,024,923 |
988,235 |
2,013,158 |
1,065,960 |
216,180 |
1,530,437 |
2,090,883 |
1,204,415 |
3,295,298 |
| 2012 |
1,062,918 |
1,029,642 |
2,092,560 |
1,269,769 |
260,672 |
1,530,437 |
1,699,894 |
1,290,314 |
3,622,997 |
| 2013 |
1,100,614 |
1,071,388 |
2,172,002 |
1,401,621 |
281,583 |
1,683,204 |
2,502,235 |
1,352,971 |
3,855,206 |
| 2014 |
1,143,579 |
1,117,126 |
2,260,705 |
1,436,232 |
295,956 |
1,732,188 |
2,579,811 |
1,413,082 |
3,992,893 |
| 2015 |
1,184,430 |
1,160,516 |
2,344,646 |
1,500,414 |
313,742 |
1,814,156 |
2,684,844 |
1,474,258 |
4,159,102 |
| 2016 |
1,224,763 |
1,202,320 |
2,427,083 |
1,660,693 |
325,533 |
1,986,226 |
2,885,456 |
1,527,853 |
4,413,309 |
| 2017 |
1,262,760 |
1,241,493 |
2,504,253 |
1,720,640 |
333,954 |
2,054,594 |
2,983,400 |
1,575,447 |
4,558,847 |
| 2018 |
1,299,741 |
1,279,495 |
2,579,236 |
1,669,549 |
343,974 |
2,013,523 |
2,969,290 |
1,623,469 |
4,592,759 |
| 2019 |
1,337,179 |
1,318,274 |
2,655,453 |
1,608,245 |
354,570 |
1,962,815 |
2,945,424 |
1,672,844 |
4,618,268 |
| 2020 |
1,368,998 |
1,350,502 |
2,719,500 |
1,481,532 |
376,984 |
1,858,516 |
2,850,530 |
1,727,486 |
4,578,016 |
| 2021 |
1,393,942 |
1,372,866 |
2,766,808 |
1,338,967 |
373,598 |
1,712,565 |
2,732,909 |
1,746,464 |
4,479,373 |
| 2022 |
1,427,105 |
1,406,610 |
2,833,715 |
1,480,913 |
413,744 |
1,894,657 |
2,908,018 |
1,820,354 |
4,728,372 |
| 2023 |
1,457,815 |
1,437,732 |
2,895,547 |
1,704,228 |
479,739 |
2,183,967 |
3,162,043 |
1,917,471 |
5,079,514 |
| 2024 |
1,487,094 |
1,468,077 |
2,955,171 |
1,713,905 |
534,598 |
2,248,503 |
3,200,999 |
2,002,675 |
5,203,674 |
Source: National Centre for Statistics and Information (NCSI)
ANNEXED NOTE
1. Technical Notes and Definitions
Period of reference: mid-year (30 June), except census years 2003* and 2010*: end of year.
Source of the data: censuses; vital statistics (births and deaths) produced by the Ministry of Health (MOH),
and data provided by the Royal Oman Police (ROP) on Omani and non-Omani residents.
1- Censuses were held in 1993; 2003, 2010, and 2020.
Censuses’ reference dates: 1993: n.a.; 2003: 7-8 December; 2010: 12-13 December; 2020: 12 December 2020.
2- National Registration System (2011- )
The civil registration records all Omani and expatriate residents. It is based on the civil status system and is maintained
by the General Directorate of Civil Status, a part of the Royal Oman Police.
Since 2004, registration of all vital events taking place in the Sultanate (births, death, marriages and divorces) in the civil register
is mandatory for Omanis and foreign residents of the Sultanate.
Characteristics of data:
Figures refer to 1. Omanis holding an official valid document registered in the National Registration System, or expired for less than ten years
2. Foreign residents holding valid visas, or visas expired for lesss than two years; dependents holding valid visas, providing that they are in the country.
Residence visa for expatriates includes residence visa for a wife of an Omani, student resident, multiple entry visa, employment visa,
employment contracting visa, official visit visa, investor visa. The dependent visa includes Family Reunion visas and relative/ friend visit visa.
2. Institution which provides data
National Center for Statistics and Information (NCSI)
3. Data availability
Figures for 2000 to 2024 were uploaded from NCSI Oman Data portal (daily data- figures for 30 June):
https://data.gov.om/OMPOP2016/population
Date of access: 03 April 2025.
GLMM and GRC cannot guarantee that the link to access the source will not change;
that the information will not be removed from the website it was obtained from;
that no geo-blockages will be imposed; or that the information will not be available for any another reason.
Keywords: Oman, Foreign & National Population
| |
Omanis |
Non-Omanis |
Total |
| |
Males |
Females |
Total |
Males |
Females |
Total |
Males |
Females |
Total |
| 2015 |
1,184,430 |
1,160,516 |
2,344,946 |
1,500,414 |
313,742 |
1,814,156 |
2,684,844 |
1,474,258 |
4,159,102 |
| 2016 |
1,225,390 |
1,202,435 |
2,429,458 |
1,660,693 |
325,533 |
1,986,226 |
2,886,083 |
1,527,968 |
4,414,051 |
| 2017 |
1,263,764 |
1,241,605 |
2,505,369 |
1,720,640 |
333,954 |
2,054,594 |
2,984,404 |
1,575,559 |
4,559,963 |
| 2018 |
1,299,741 |
1,279,495 |
2,579,236 |
1,690,362 |
332,108 |
2,022,470 |
2,990,103 |
1,611,603 |
4,601,706 |
| 2019 |
1,337,021 |
1,318,123 |
2,655,144 |
1,608,233 |
354,550 |
1,962,783 |
2,945,254 |
1,672,673 |
4,617,927 |
| 2020 |
1,378,561 |
1,357,405 |
2,721,026 |
1,366,662 |
378,414 |
1,745,076 |
2,745,223 |
1,735,819 |
4,481,042 |
| 2021 |
1,412,508 |
1,391,609 |
2,804,117 |
1,348,646 |
374,683 |
1,723,329 |
2,761,154 |
1,766,292 |
4,527,446 |
| 2022 |
1,443,846 |
1,423,765 |
2,867,611 |
1,618,786 |
447,453 |
2,066,239 |
3,062,632 |
1,871,218 |
4,933,850 |
| 2023 |
1,474,115 |
1,454,842 |
2,928,957 |
1,732,636 |
504,009 |
2,236,645 |
3,206,751 |
1,958,851 |
5,165,602 |
| 2024 |
1,501,736 |
1,483,057 |
2,984,793 |
1,723,012 |
560,267 |
2,283,279 |
3,224,748 |
2,043,324 |
5,268,072 |
Source: National Centre for Statistics and Information (NCSI)
ANNEXED NOTE
1. Technical Notes and Definitions
Period of reference: end of year.
Source of the data: censuses; vital statistics (births and deaths) produced by the Ministry of Health (MOH),
and data provided by the Royal Oman Police (ROP) on Omani and non-Omani residents.
1- Censuses were held in 1993; 2003, 2010, and 2020.
Censuses’ reference dates: 1993: n.a.; 2003: 7-8 December; 2010: 12-13 December; 2020: 12 December 2020.
2- National Registration System (2011- )
The civil registration records all Omani and expatriate residents. It is based on the civil status system and is maintained
by the General Directorate of Civil Status, a part of the Royal Oman Police.
Since 2004, registration of all vital events taking place in the Sultanate (births, death, marriages and divorces) in the civil register
is mandatory for Omanis and foreign residents of the Sultanate.
Characteristics of data:
Figures refer to 1. Omanis holding an official valid document registered in the National Registration System, or expired for less than ten years
2. Foreign residents holding valid visas, or visas expired for lesss than two years; dependents holding valid visas, providing that they are in the country.
Residence visa for expatriates includes residence visa for a wife of an Omani, student resident, multiple entry visa, employment visa,
employment contracting visa, official visit visa, investor visa. The dependent visa includes Family Reunion visas and relative/ friend visit visa.
2. Institution which provides data
National Center for Statistics and Information (NCSI)
3. Data availability
Figures were uploaded from NCSI Oman Data portal (annual data):
https://data.gov.om/OMPOP2016/population
Date of access: 03 April 2025.
GLMM and GRC cannot guarantee that the link to access the source will not change;
that the information will not be removed from the website it was obtained from;
that no geo-blockages will be imposed; or that the information will not be available for any another reason.
Keywords: Oman, Foreign & National Population
| |
Omanis |
Expatriates |
Total |
| 2000 |
1,777,685 |
623,571 |
2,401,256 |
| 2001 |
1,826,124 |
651,563 |
2,477,687 |
| 2002 |
1,869,580 |
668,162 |
2,537,742 |
| 2003* |
1,781,558 |
559,257 |
2,340,815 |
| 2004 |
1,802,931 |
612,645 |
2,415,576 |
| 2005 |
1,842,684 |
666,153 |
2,508,837 |
| 2006 |
1,883,576 |
693,486 |
2,577,062 |
| 2007 |
1,922,697 |
820,802 |
2,743,499 |
| 2008 |
1,967,180 |
900,248 |
2,867,428 |
| 2009 |
2,017,559 |
1,156,358 |
3,173,917 |
| 2010* |
1,957,336 |
816,143 |
2,773,479 |
| 2011 |
2,013,158 |
1,530,437 |
3,295,298 |
| 2012 |
2,092,560 |
1,530,437 |
3,622,997 |
| 2013 |
2,172,002 |
1,683,204 |
3,855,206 |
| 2014 |
2,260,705 |
1,732,188 |
3,992,893 |
| 2015 |
2,344,646 |
1,814,156 |
4,159,102 |
| 2016 |
2,427,083 |
1,986,226 |
4,413,309 |
| 2017 |
2,504,253 |
2,054,594 |
4,558,847 |
| 2018 |
2,579,236 |
2,013,523 |
4,592,759 |
| 2019 |
2,655,453 |
1,962,815 |
4,618,268 |
| 2020 |
2,719,500 |
1,858,516 |
4,578,016 |
| 2021 |
2,766,808 |
1,712,565 |
4,479,373 |
| 2022 |
2,833,715 |
1,894,657 |
4,728,372 |
| 2023 |
2,895,547 |
2,183,967 |
5,079,514 |
| 2024 |
2,955,171 |
2,248,503 |
5,203,674 |
Source: National Centre for Statistics and Information (NCSI)
ANNEXED NOTE
1. Technical Notes and Definitions
Period of reference: mid-year (30 June), except census years 2003* and 2010*: end of year.
Source of the data: censuses; vital statistics (births and deaths) produced by the Ministry of Health (MOH),
and data provided by the Royal Oman Police (ROP) on Omani and non-Omani residents.
1- Censuses were held in 1993; 2003, 2010, and 2020.
Censuses’ reference dates: 1993: n.a.; 2003: 7-8 December; 2010: 12-13 December; 2020: 12 December 2020.
2- National Registration System (2011- )
The civil registration records all Omani and expatriate residents. It is based on the civil status system and is maintained
by the General Directorate of Civil Status, a part of the Royal Oman Police.
Since 2004, registration of all vital events taking place in the Sultanate (births, death, marriages and divorces) in the civil register
is mandatory for Omanis and foreign residents of the Sultanate.
Characteristics of data:
Figures refer to 1. Omanis holding an official valid document registered in the National Registration System, or expired for less than ten years
2. Foreign residents holding valid visas, or visas expired for lesss than two years; dependents holding valid visas, providing that they are in the country.
Residence visa for expatriates includes residence visa for a wife of an Omani, student resident, multiple entry visa, employment visa,
employment contracting visa, official visit visa, investor visa. The dependent visa includes Family Reunion visas and relative/ friend visit visa.
3. Data availability
Figures for 2000 to 2024 were uploaded from NCSI Oman Data portal (daily data- figures for 30 June):
https://data.gov.om/OMPOP2016/population
Population figures only available from 01 July 2015 as of 03 April 2025
Date of access: 03 April 2025.
GLMM and GRC cannot guarantee that the link to access the source will not change;
that the information will not be removed from the website it was obtained from;
that no geo-blockages will be imposed; or that the information will not be available for any another reason.
Keywords: Oman, Foreign & National Population
| |
|
|
|
|
|
|
|
|
|
|
|
|
| |
2011 |
2012 |
2013 |
2014 |
2015 |
2016 |
2017 |
2018 |
2019 |
2020 |
2021 |
2022 |
| 15-19 |
22,337 |
22,081 |
22,000 |
21,431 |
19,690 |
19,006 |
17,947 |
16,317 |
13,863 |
12,203 |
10,411 |
7,997 |
| 20-24 |
96,129 |
94,859 |
95,798 |
97,500 |
94,860 |
93,322 |
92,419 |
86,371 |
77,157 |
69,671 |
63,063 |
56,642 |
| 25-29 |
128,561 |
128,426 |
130,422 |
134,246 |
134,088 |
135,731 |
136,116 |
134,680 |
128,804 |
124,613 |
118,559 |
116,083 |
| 30-34 |
101,280 |
103,095 |
105,108 |
110,369 |
112,823 |
116,133 |
119,828 |
121,506 |
118,028 |
116,075 |
112,178 |
115,189 |
| 35-39 |
56,807 |
59,827 |
60,333 |
63,957 |
66,792 |
70,205 |
74,669 |
79,555 |
79,411 |
80,005 |
79,255 |
85,096 |
| 40-44 |
19,086 |
20,555 |
20,411 |
20,983 |
21,250 |
21,390 |
22,859 |
24,007 |
24,873 |
25,944 |
26,447 |
33,002 |
| 45-49 |
1,761 |
1,725 |
1,634 |
1,753 |
1,703 |
1,744 |
1,832 |
1,851 |
1,880 |
1,882 |
1,774 |
3,146 |
| Total |
425,961 |
430,568 |
435,706 |
450,239 |
451,206 |
457,531 |
465,670 |
464,287 |
444,016 |
430,393 |
411,687 |
417,155 |
Source: General Authority for Statistics (GAStat)
ANNEXED NOTE
1. Technical Notes and Definitions
Saudi census 2022:
Date of reference: 10 May 2022
Population of reference: Families and individual citizens and residents within the Kingdom, regardless of the status of their identification documents.
Visitors for Hajj, Umrah and tourism are excluded from the census.
Methodology:The first phase of the 2020 census began on 3 February 2020 (enumeration of buildings and households). Census 2022 used geospatial data, including satellite images, electricity consumption and mobile phone data, to improve the accuracy and geographic coverage of address canvassing.
The 2022 census used a combined methodology – administrative records, fieldwork and digital self-enumeration.
Household data were collected from e-portals of self-enumeration (on residents’ mobile devices, laptops or personal computers, or self-enumeration stations/kiosks, located in shopping centers).
The digital self-enumeration process was complemented by face-to-face interviews, using digital tablets.
Census 2022 used a de jure approach: enumerating people according to their usual place of residence.
Administrative data from multiple sources was used to cross-validate collected census data.
Indicator’s Definition: Estimated Saudi births in the 12 months preceding population reference date, in absolute numbers, with breakdown by mothers’ age from 2011 to 2022.
See census methodology in:
https://portal.saudicensus.sa/portal/public/methodology
Portal of the Saudi census:
https://portal.saudicensus.sa/portal
Population data for 2010-22 were revised and backcasted, based on 2022 population census and past years’ administrative data.
Technical note on backcasting:
https://database.stats.gov.sa/Methodologies/En_Documents/40_Technical%20Note%20Population%20Back%20Casting.PDF
Data for non-Saudis are not published:
“Given regulatory framework which restricts Non Saudis from staying after the working age period, only Saudi figures are published”
See: “other info” in metadata.
2. Institution which provides data
General Authority for Statistics (GAStat)
3. Data availability
The time series were taken from GAStat’s statistical database:
https://database.stats.gov.sa/home/landing
Report Link:
https://database.stats.gov.sa/home/report/3877
(includes metadata)
Date of access: 23 March 2025.
GLMM and GRC cannot guarantee that the link to access the source will not change;
that the information will not be removed from the website it was obtained from;
that no geo-blockages will be imposed; or that the information will not be available for any another reason.
Keywords: Saudi Arabia, National Population
| |
|
|
|
|
|
|
|
|
|
| |
Saudis |
Non-Saudis |
Total |
| Males |
Females |
Total |
Males |
Females |
Total |
Males |
Females |
Total |
| 2017 Q1 |
2,021,865 |
1,017,080 |
3,038,945 |
9,859,039 |
991,153 |
10,850,192 |
11,880,904 |
2,008,233 |
13,889,137 |
| 2017 Q2 |
2,029,786 |
1,022,663 |
3,052,449 |
9,777,916 |
1,010,793 |
10,788,709 |
11,807,702 |
2,033,456 |
13,841,158 |
| 2017 Q3 |
2,035,745 |
1,027,999 |
3,063,744 |
9,674,729 |
1,019,591 |
10,694,320 |
11,710,474 |
2,047,590 |
13,758,064 |
| 2017 Q4 |
2,080,601 |
1,083,245 |
3,163,846 |
9,442,163 |
975,132 |
10,417,295 |
11,522,764 |
2,058,377 |
13,581,141 |
| 2018 Q1 |
2,067,976 |
1,082,433 |
3,150,409 |
9,231,869 |
951,235 |
10,183,104 |
11,299,845 |
2,033,668 |
13,333,513 |
| 2018 Q2 |
2,053,189 |
1,072,154 |
3,125,343 |
8,927,862 |
964,861 |
9,892,723 |
10,981,051 |
2,037,015 |
13,018,066 |
| 2018 Q3 |
2,043,585 |
1,066,402 |
3,109,987 |
8,622,890 |
955,165 |
9,578,055 |
10,666,475 |
2,021,567 |
12,688,042 |
| 2018 Q4 |
2,040,742 |
1,070,457 |
3,111,199 |
8,356,943 |
1,072,476 |
9,429,419 |
10,397,685 |
2,142,933 |
12,540,618 |
| 2019 Q1 |
2,036,142 |
1,075,887 |
3,112,029 |
8,458,199 |
1,195,013 |
9,653,212 |
10,494,341 |
2,270,900 |
12,765,241 |
| 2019 Q2 |
2,027,964 |
1,062,284 |
3,090,248 |
8,529,419 |
1,237,365 |
9,766,784 |
10,557,383 |
2,299,649 |
12,857,032 |
| 2019 Q3 |
2,023,910 |
1,076,902 |
3,100,812 |
8,572,339 |
1,254,757 |
9,827,096 |
10,596,249 |
2,331,659 |
12,927,908 |
| 2019 Q4 |
2,054,858 |
1,115,414 |
3,170,272 |
8,792,516 |
1,428,187 |
10,220,703 |
10,847,374 |
2,543,601 |
13,390,975 |
| 2020 Q1 |
2,066,553 |
1,136,870 |
3,203,423 |
9,092,998 |
1,339,191 |
10,432,189 |
11,159,551 |
2,476,061 |
13,635,612 |
| 2020 Q2 |
2,055,767 |
1,115,655 |
3,171,422 |
9,101,286 |
1,357,746 |
10,459,032 |
11,157,053 |
2,473,401 |
13,630,454 |
| 2020 Q3 |
2,100,702 |
1,152,574 |
3,253,276 |
8,866,940 |
1,334,922 |
10,201,862 |
10,967,642 |
2,487,496 |
13,455,138 |
| 2020 Q4 |
2,079,331 |
1,172,867 |
3,252,198 |
8,753,985 |
1,312,515 |
10,066,500 |
10,833,316 |
2,485,382 |
13,318,698 |
| 2021 Q1 |
2,081,446 |
1,225,152 |
3,306,598 |
8,773,896 |
1,403,319 |
10,177,215 |
10,855,342 |
2,628,471 |
13,483,813 |
| 2021 Q2 |
2,098,831 |
1,181,183 |
3,280,014 |
8,449,536 |
1,170,338 |
9,619,874 |
10,548,367 |
2,351,521 |
12,899,888 |
| 2021 Q3 |
2,127,551 |
1,215,287 |
3,342,838 |
8,244,566 |
1,118,241 |
9,362,807 |
10,372,117 |
2,333,528 |
12,705,645 |
| 2021 Q4 |
2,180,320 |
1,269,737 |
3,450,057 |
8,481,117 |
1,114,064 |
9,595,181 |
10,661,437 |
2,383,801 |
13,045,238 |
| 2022 Q1 |
2,233,351 |
1,338,525 |
3,571,876 |
8,971,450 |
1,187,323 |
10,158,773 |
11,204,801 |
2,525,848 |
13,730,649 |
| 2022 Q2 |
2,262,535 |
1,375,609 |
3,638,144 |
9,320,979 |
1,210,640 |
10,531,619 |
11,583,514 |
2,586,249 |
14,169,763 |
| 2022 Q3 |
2,274,628 |
1,417,858 |
3,692,486 |
9,593,551 |
1,304,906 |
10,898,457 |
11,868,179 |
2,722,764 |
14,590,943 |
| 2022 Q4 |
2,300,070 |
1,470,561 |
3,770,631 |
9,672,933 |
1,314,794 |
10,987,727 |
11,973,003 |
2,785,355 |
14,758,358 |
| 2023 Q1 |
2,354,750 |
1,515,731 |
3,870,481 |
10,137,453 |
1,355,438 |
11,492,891 |
12,492,203 |
2,871,169 |
15,363,372 |
| 2023 Q2 |
2,338,735 |
1,518,362 |
3,857,097 |
10,202,131 |
1,395,840 |
11,597,971 |
12,540,866 |
2,914,202 |
15,455,068 |
| 2023 Q3 |
2,357,785 |
1,563,536 |
3,921,321 |
10,461,593 |
1,435,240 |
11,896,833 |
12,819,378 |
2,998,776 |
15,818,154 |
| 2023 Q4 |
2,333,023 |
1,582,224 |
3,915,247 |
10,482,543 |
1,489,714 |
11,972,257 |
12,815,566 |
3,071,938 |
15,887,504 |
| 2024 Q1 |
2,338,857 |
1,599,711 |
3,938,568 |
10,985,203 |
1,592,431 |
12,577,634 |
13,324,060 |
3,192,142 |
16,516,202 |
| 2024 Q2 |
2,339,984 |
1,591,476 |
3,931,460 |
11,263,627 |
1,668,972 |
12,932,599 |
13,603,611 |
3,260,448 |
16,864,059 |
| 2024 Q3 |
2,362,772 |
1,627,885 |
3,990,657 |
11,474,582 |
1,716,096 |
13,190,678 |
13,837,354 |
3,343,981 |
17,181,335 |
Source: Register-based Labour Market Statistics, General Authority for Statistics (GAStat)
1. Data collection methodology
LFS were first conducted in 2001 and became bi-annual after 2006. Data were collected through nationally
representative household sample surveys, which sampling was based on most recent censuses.
Since 2016, Labour Force Surveys have been conducted and published on a quarterly basis, based on a
household telephone survey conducted by GAStat. Employment data extracted from administrative records
were also introduced as a complement to the results of Labour Force Surveys in Labour Market Statistics’
publications, starting on Q1 2017.
The present data is taken from administrative records.
Population of reference: Workers registered in the General Organization of Social Insurance (GOSI), in civil service and
as domestic workers, in the governmental, public, private and domestic sectors.
GAStat Labour Market Statistics: administrative records
Estimates of figures and characteristics of employment in Saudi Arabia are taken from administrative
records from the following institutions:
– Ministry of Human Resources and Social Development (MHRSD)
(formerly Ministry of Labour and Social Development):
Supplies data on:
Employees on the job subject to the rules and regulations of the Civil Service (government sector)
– General Organization of Social Insurance (GOSI):
Supplies data on:
a. contributors on the job who are subject to social insurance laws and regulations in the private and public sectors;
b. new contributors, and contributors who terminated their contribution to social insurance during the quarter.
– National Information Center (NIC):
Supplies data on domestic workers (data owner: MHRSD).
Figures of workers in Labor Market statistics which were derived from administrative records do not include the following category:
1-Workers in the military and security sectors
2- Workers who are not registered in the civil service, social insurance (GOSI) and domestic workers’ records, which include:
– Saudis working for their own businesses and are not subjected to the labor regulations, also, not registered in social insurance,
such as those who work in delivery through electronic apps
– Saudi employers who work in establishments and not registered in the social insurance
– Non-Saudi staff working in foreign international, political or military missions
3- Non-Saudi employees who come to the Kingdom for work that normally takes less than three months to be completed.
Definitions and categories used by GAStat in Labour Markets Statistics (employment; unemployment;
occupation and activity sectors, etc.) are based on international standards:
For LFS methodology and definitions, see metadata section in report, and:
https://database.stats.gov.sa/Methodologies/En_Documents/03_Labor%20Market%20Bulletin%20Methodology,%20Fourth%20Quarter%202020%20_%20General%20Authority%20for%20Statistics.pdf
https://database.stats.gov.sa/Methodologies/En_Documents/03_Labor%20Market%20Bulletin%20Methodology,%20Fourth%20Quarter%202020%20_%20General%20Authority%20for%20Statistics.pdf
2. Institution which provides data
General Authority for Statistics (GAStat)
3. Data availability
Since 2021, GAStat has been publishing separately the employment data taken from administrative records,
and unemployment/inactivity data as well as general indicators, calculated from the results of the field
interviews conducted by GAStat (Labour Force Survey).
The time-series was built using the quarterly Register-based Labour Market Statistics for given quarters
2023-2024: available at:
https://www.stats.gov.sa/en/statistics-tabs/-/categories/417515?tab=436312&category=417515
Before 2023: available in the “archived data”:
https://www.stats.gov.sa/en/statistics?index=1317550
“social statistics”, and “labour force”
https://www.stats.gov.sa/en/statistics-tabs?tab=436312&category=1333429
Last date of access: 26 March 2025.
Keywords: Employment, Female Employment, Saudi Arabia, National & Foreign Labour
GLMM and GRC cannot guarantee that the link to access the source will not change;
that the information will not be removed from the website it was obtained from;
that no geo-blockages will be imposed; or that the information will not be available for any another reason.
| |
|
|
|
|
|
|
|
|
|
| |
|
Saudis |
|
|
Non-Saudis |
|
|
Total |
|
| |
Males |
Females |
Total |
Males |
Females |
Total |
Males |
Females |
Total |
| 0-4 |
1,087,847 |
1,055,985 |
2,143,832 |
197,277 |
187,201 |
384,478 |
1,285,124 |
1,243,186 |
2,528,310 |
| 5-9 |
1,157,068 |
1,129,170 |
2,286,238 |
259,922 |
248,058 |
507,980 |
1,416,990 |
1,377,228 |
2,794,218 |
| 10-14 |
1,084,262 |
1,055,819 |
2,140,081 |
231,544 |
219,486 |
451,030 |
1,315,806 |
1,275,305 |
2,591,111 |
| 15-19 |
966,963 |
949,776 |
1,916,739 |
181,546 |
169,151 |
350,697 |
1,148,509 |
1,118,927 |
2,267,436 |
| 20-24 |
872,446 |
859,680 |
1,732,126 |
871,174 |
214,671 |
1,085,845 |
1,743,620 |
1,074,351 |
2,817,971 |
| 25-29 |
863,032 |
852,315 |
1,715,347 |
1,815,803 |
426,494 |
2,242,297 |
2,678,835 |
1,278,809 |
3,957,644 |
| 30-34 |
791,258 |
783,524 |
1,574,782 |
1,954,040 |
499,927 |
2,453,967 |
2,745,298 |
1,283,451 |
4,028,749 |
| 35-39 |
702,459 |
700,730 |
1,403,189 |
1,877,261 |
488,401 |
2,365,662 |
2,579,720 |
1,189,131 |
3,768,851 |
| 40-44 |
568,760 |
573,587 |
1,142,347 |
1,413,935 |
331,915 |
1,745,850 |
1,982,695 |
905,502 |
2,888,197 |
| 45-49 |
408,869 |
425,289 |
834,158 |
930,656 |
202,010 |
1,132,666 |
1,339,525 |
627,299 |
1,966,824 |
| 50-54 |
328,231 |
355,753 |
683,984 |
631,814 |
126,752 |
758,566 |
960,045 |
482,505 |
1,442,550 |
| 55-59 |
267,228 |
288,326 |
555,554 |
413,623 |
77,536 |
491,159 |
680,851 |
365,862 |
1,046,713 |
| 60-64 |
200,014 |
217,625 |
417,639 |
214,882 |
50,577 |
265,459 |
414,896 |
268,202 |
683,098 |
| 65-69 |
138,708 |
141,697 |
280,405 |
94,804 |
28,489 |
123,293 |
233,512 |
170,186 |
403,698 |
| 70-74 |
79,384 |
85,375 |
164,759 |
37,938 |
15,587 |
53,525 |
117,322 |
100,962 |
218,284 |
| 75-79 |
55,598 |
57,535 |
113,133 |
14,710 |
8,310 |
23,020 |
70,308 |
65,845 |
136,153 |
| 80+ |
69,295 |
72,321 |
141,616 |
12,583 |
8,725 |
21,308 |
81,878 |
81,046 |
162,924 |
| Total |
9,641,422 |
9,604,507 |
19,245,929 |
11,153,512 |
3,303,290 |
14,456,802 |
20,794,934 |
12,907,797 |
33,702,731 |
Source: GAStat
ANNEXED NOTE
1. Technical Notes and Definitions
2023-2024: The methodology involves estimating the population for each age group, as well as gender and nationality, following international standards and practices.The General Authority for Statistics uses the (Method Component-Cohort) approach, leveraging data from various sources, including the National Information Center for administrative records to provide key components such as births, deaths, and migration.
Changes in the demographic characteristics for 2024 are assessed against the previous population report from the Authority, using data from the 2022 Saudi Census.
https://www.stats.gov.sa/documents/20117/2435273/Population+Estimates+Statistics+2024+EN.pdf/9b71e303-5fd9-19cb-9913-850a9d521639?t=1738859947691
Methodological report:
https://www.stats.gov.sa/documents/20117/2435133/Methodology+and+Quality+Report+for+Population+Projections+and+Estimates+Statistics+_EN.pdf/0fdb394f-8a13-82e0-ed7c-c240b338d25f?t=1738829096975
2. Institution which provides data
General Authority for Statistics (GAStat)
https://www.stats.gov.sa/en/home
https://www.stats.gov.sa/home
3. Data availability
2023-2024: “Statistics”, “Social Statistics”, “Vitals and Demographics Statistics”, “population estimates statistics”.
https://www.stats.gov.sa/en/statistics-tabs?tab=436312&category=2366987
Last date of access: 10 March 2025.
GLMM and GRC cannot guarantee that the link to access the source will not change;
that the information will not be removed from the website it was obtained from;
that no geo-blockages will be imposed; or that the information will not be available for any another reason.
Keywords: Saudi Arabia, Foreign Population, National Population, Foreign & National Populations
|
Saudis |
Non-Saudis |
Total |
| 2010 |
14,046,164 |
9,932,323 |
23,978,487 |
| 2011 |
14,342,129 |
10,749,738 |
25,091,867 |
| 2012 |
14,683,546 |
11,485,315 |
26,168,861 |
| 2013 |
15,079,401 |
12,544,603 |
27,624,004 |
| 2014 |
15,535,036 |
12,774,237 |
28,309,273 |
| 2015 |
15,968,071 |
13,848,311 |
29,816,382 |
| 2016 |
16,355,312 |
14,598,886 |
30,954,198 |
| 2017 |
16,696,980 |
14,280,375 |
30,977,355 |
| 2018 |
17,085,636 |
13,110,645 |
30,196,281 |
| 2019 |
17,507,171 |
12,556,628 |
30,063,799 |
| 2020 |
17,978,587 |
13,573,923 |
31,552,510 |
| 2021 |
18,380,669 |
12,403,714 |
30,784,383 |
| 2022 |
18,792,262 |
13,382,962 |
32,175,224 |
| 2023 |
19,245,929 |
14,456,802 |
33,702,731 |
| 2024 |
19,635,258 |
15,665,022 |
35,300,280 |
Source: GAStat
ANNEXED NOTE
1. Technical Notes and Definitions
2023-2024: The methodology involves estimating the population for each age group, as well as gender and nationality, following international standards and practices. The General Authority for Statistics uses the (Method Component-Cohort) approach, leveraging data from various sources, including the National Information Center for administrative records to provide key components such as births, deaths, and migration. Changes in the demographic characteristics for 2024 are assessed against the previous population report from the Authority, using data from the 2022 Saudi Census.
https://www.stats.gov.sa/documents/20117/2435273/Population+Estimates+Statistics+2024+EN.pdf/9b71e303-5fd9-19cb-9913-850a9d521639?t=1738859947691
Methodological report:
https://www.stats.gov.sa/documents/20117/2435133/Methodology+and+Quality+Report+for+Population+Projections+and+Estimates+Statistics+_EN.pdf/0fdb394f-8a13-82e0-ed7c-c240b338d25f?t=1738829096975
2010-2022: Source: Saudi census 2022
Date of reference: 10 May 2022
Population of reference: Families and individual citizens and residents within the Kingdom, regardless of the status of their identification documents.
Visitors for Hajj, Umrah and tourism are excluded from the census.
Methodology:
The first phase of the 2020 census began on 3 February 2020 (enumeration of buildings and households). Census 2022 used geospatial data, including satellite images, electricity consumption and mobile phone data, to improve the accuracy and geographic coverage of address canvassing. The 2022 census used a combined methodology – administrative records, fieldwork and digital self-enumeration.
Household data were collected from e-portals of self-enumeration (on residents’ mobile devices, laptops or personal computers, or self-enumeration stations/kiosks, located in shopping centers).
The digital self-enumeration process was complemented by face-to-face interviews, using digital tablets.
Census 2022 used a de jure approach: enumerating people according to their usual place of residence.
Administrative data from multiple sources was used to cross-validate collected census data.
Census 2022 was designed as a launchpad for several new secure statistical data registers for population, housing, and businesses.
See census methodology in:
https://portal.saudicensus.sa/portal/public/methodology
Portal of the Saudi census:
https://portal.saudicensus.sa/portal
Population data for 2010-22 were revised and backcasted, based on 2022 population census and past years’ administrative data.
2. Institution which provides data
General Authority for Statistics (GAStat)
3. Data availability
2010-2022: retrieved from the Saudi census section on GAStat website:
https://portal.saudicensus.sa/portal
Accessible from the “Statistics” section, then “Social Statistics”, “Vitals and Demographics Statistics”, Saudi census statistics 2022
https://www.stats.gov.sa/en/statistics?index=119025&subindex=127380#
“Population statistics” section, then “Population growth statistics”
https://portal.saudicensus.sa/portal/public/1/15?type=TABLE
Selected, pre-set tables can be downloaded from the thematic section.
2023-2024: “Statistics”, “Social Statistics”, “Vitals and Demographics Statistics”, “population estimates statistics”.
https://www.stats.gov.sa/en/statistics-tabs?tab=436312&category=2366987
Last date of access: 10 March 2025.
GLMM and GRC cannot guarantee that the link to access the source will not change;
that the information will not be removed from the website it was obtained from;
that no geo-blockages will be imposed; or that the information will not be available for any another reason.
Keywords: Saudi Arabia, Foreign Population, National Population, Foreign & National Populations
| |
|
|
|
|
|
|
|
|
|
| |
|
Saudis |
|
|
Non-Saudis |
|
|
Total |
|
| |
Males |
Females |
Total |
Males |
Females |
Total |
Males |
Females |
Total |
| 0-4 |
1,079,765 |
1,046,773 |
2,126,538 |
194,400 |
184,251 |
378,651 |
1,274,165 |
1,231,024 |
2,505,189 |
| 5-9 |
1,153,454 |
1,127,344 |
2,280,798 |
256,343 |
243,711 |
500,054 |
1,409,797 |
1,371,055 |
2,780,852 |
| 10-14 |
1,103,253 |
1,075,034 |
2,178,287 |
237,412 |
225,184 |
462,596 |
1,340,665 |
1,300,218 |
2,640,883 |
| 15-19 |
992,884 |
975,955 |
1,968,839 |
189,492 |
177,801 |
367,293 |
1,182,376 |
1,153,756 |
2,336,132 |
| 20-24 |
884,417 |
872,503 |
1,756,920 |
1,031,907 |
259,526 |
1,291,433 |
1,916,324 |
1,132,029 |
3,048,353 |
| 25-29 |
862,252 |
853,022 |
1,715,274 |
1,972,204 |
501,014 |
2,473,218 |
2,834,456 |
1,354,036 |
4,188,492 |
| 30-34 |
807,752 |
801,655 |
1,609,407 |
2,039,534 |
532,304 |
2,571,838 |
2,847,286 |
1,333,959 |
4,181,245 |
| 35-39 |
722,806 |
720,219 |
1,443,025 |
2,072,825 |
532,013 |
2,604,838 |
2,795,631 |
1,252,232 |
4,047,863 |
| 40-44 |
599,165 |
604,477 |
1,203,642 |
1,574,139 |
364,198 |
1,938,337 |
2,173,304 |
968,675 |
3,141,979 |
| 45-49 |
436,840 |
452,556 |
889,396 |
1,017,713 |
220,582 |
1,238,295 |
1,454,553 |
673,138 |
2,127,691 |
| 50-54 |
337,761 |
365,968 |
703,729 |
661,253 |
135,064 |
796,317 |
999,014 |
501,032 |
1,500,046 |
| 55-59 |
278,222 |
302,239 |
580,461 |
439,307 |
82,095 |
521,402 |
717,529 |
384,334 |
1,101,863 |
| 60-64 |
207,603 |
226,875 |
434,478 |
225,846 |
52,863 |
278,709 |
433,449 |
279,738 |
713,187 |
| 65-69 |
148,001 |
154,971 |
302,972 |
103,667 |
30,471 |
134,138 |
251,668 |
185,442 |
437,110 |
| 70-74 |
86,556 |
93,691 |
180,247 |
42,212 |
17,157 |
59,369 |
128,768 |
110,848 |
239,616 |
| 75-79 |
56,837 |
59,167 |
116,004 |
16,766 |
8,999 |
25,765 |
73,603 |
68,166 |
141,769 |
| 80+ |
70,027 |
75,214 |
145,241 |
13,557 |
9,212 |
22,769 |
83,584 |
84,426 |
168,010 |
| Total |
9,827,595 |
9,807,663 |
19,635,258 |
12,088,577 |
3,576,445 |
15,665,022 |
21,916,172 |
13,384,108 |
35,300,280 |
Source: GAStat
ANNEXED NOTE
1. Technical Notes and Definitions
2023-2024: The methodology involves estimating the population for each age group, as well as gender and nationality, following international standards and practices. The General Authority for Statistics uses the (Method Component-Cohort) approach, leveraging data from various sources, including the National Information Center for administrative records to provide key components such as births, deaths, and migration. Changes in the demographic characteristics for 2024 are assessed against the previous population report from the Authority, using data from the 2022 Saudi Census.
https://www.stats.gov.sa/documents/20117/2435273/Population+Estimates+Statistics+2024+EN.pdf/9b71e303-5fd9-19cb-9913-850a9d521639?t=1738859947691
Methodological report:
https://www.stats.gov.sa/documents/20117/2435133/Methodology+and+Quality+Report+for+Population+Projections+and+Estimates+Statistics+_EN.pdf/0fdb394f-8a13-82e0-ed7c-c240b338d25f?t=1738829096975
2. Institution which provides data
General Authority for Statistics (GAStat)
3. Data availability
2023-2024: “Statistics”, “Social Statistics”, “Vitals and Demographics Statistics”, “population estimates statistics”.
https://www.stats.gov.sa/en/statistics-tabs?tab=436312&category=2366987
Last date of access: 10 March 2025.
GLMM and GRC cannot guarantee that the link to access the source will not change;
that the information will not be removed from the website it was obtained from;
that no geo-blockages will be imposed; or that the information will not be available for any another reason.
Keywords: Saudi Arabia, Foreign Population, National Population, Foreign & National Populations
| |
End-of-year data |
Mid-year data |
| Emirati births |
Emirati deaths |
Emirati births |
Emirati deaths |
Emirati population |
Total population |
Non-Emirati population |
| (given) |
(given) |
(calculated) |
(calculated) |
(2010 given-then calculated) |
(given) |
(calculated) |
| 1 |
2 |
3 |
4 |
5 |
6 |
7 |
| 2009 |
30,951 |
2,401 |
|
|
|
|
|
| 2010 |
32,303 |
2,342 |
31,627 |
2,372 |
962,348 |
6,965,488 |
6,003,140 |
| 2011 |
33,466 |
2,327 |
32,885 |
2,335 |
992,898 |
7,243,588 |
6,250,690 |
| 2012 |
34,040 |
2,342 |
33,753 |
2,335 |
1,024,316 |
7,539,307 |
6,514,991 |
| 2013 |
33,965 |
2,340 |
34,003 |
2,341 |
1,055,978 |
7,846,755 |
6,790,777 |
| 2014 |
34,618 |
2,471 |
34,292 |
2,406 |
1,087,864 |
8,272,124 |
7,184,260 |
| 2015 |
34,794 |
2,648 |
34,706 |
2,560 |
1,120,010 |
8,738,350 |
7,618,340 |
| 2016 |
34,553 |
2,606 |
34,674 |
2,627 |
1,152,057 |
9,131,839 |
7,979,782 |
| 2017 |
32,659 |
2,547 |
33,606 |
2,577 |
1,183,086 |
9,314,611 |
8,131,525 |
| 2018 |
33,700 |
2,397 |
33,180 |
2,472 |
1,213,794 |
9,378,791 |
8,164,997 |
| 2019 |
32,801 |
2,416 |
33,251 |
2,407 |
1,244,638 |
9,512,778 |
8,268,140 |
| 2020 |
31604 |
2,394 |
32,203 |
2,405 |
1,274,435 |
9,289,297 |
8,014,862 |
| 2021 |
31736 |
3,050 |
31,670 |
2,722 |
1,303,383 |
9,861,007 |
8,557,624 |
| 2022 |
30889 |
2,975 |
31,313 |
3,013 |
1,331,683 |
10,288,946 |
8,957,263 |
Source: Federal Competitiveness and Statistics Centre (FCSC). UAE vital statistics (births and deaths, 2009-2022); FCSC. UAE Population (2010-2022).
ANNEXED NOTE
1. Characteristics of data, definitions and population counting operations in the UAE
Figures of UAE population disaggregated by nationality are unavailable in published sources.
The FCSC publishes annual aggregated estimates of the total population in the UAE, based on the administrative records’ data:
“Population count is the total count of all persons living within the boundaries of the country at a specific time with their demographic characteristics from the official administrative records of the country”.
The table’s figures of Emirati and non-Emirati populations are GLMM’s estimates, using the following sources of published data:
1. Based on projections from census 2005, disaggregated estimates of Emirati and non-Emirati populations, last published for 2010 (mid-year)
http://original.fcsa.gov.ae/EnglishHome/ReportDetailsEnglish/tabid/121/Default.aspx?ItemId=1914&PTID=104&MenuId=1.
(publication no longer available as of 25 02 2025)
2. Disaggregated figures of births and deaths for the Emirati population (end-of-year figures), published for the years 2009 to 2019 (columns 1 and 2).
https://fcsc.gov.ae/en-us/Pages/Statistics/Statistics-by-Subject.aspx#/%3Ffolder=Demography%20and%20Social/Vital%20Statistics/Births%20and%20Deaths&subject=Demography%20and%20Social
Starting with 2009 data, we calculate the numbers of Emirati births and deaths for the middle of each year (columns 3 and 4).
3. Assuming:
a. that the Emirati nationals’ demographic growth is primarily driven by natural increase (births-deaths), and that Emirati citizens’ international migration and naturalisations are only a few;
b. that the figure of 962,348 Emiratis for 2010 is accurate,
we calculate the number of Emiratis for mid- years 2011 to 2022 (column 5):
E. population mid-year n = (E. population mid-year n-1) + (E. births mid-year n) – (E. deaths mid-year n).
4. The estimates of Emiratis are deducted from given total population figures (column 6), to estimate the number of non-Emiratis.
The accuracy of such estimates cannot be assessed, as they are based on given data which cannot be verified, such as the projections of census 2005 population data for 2010.
2. Institution which provides data
Federal Competitiveness and Statistitics Center (FCSC)
https://fcsa.gov.ae/en-us/
3. Data availability
Disaggregated estimates of Emirati and non-Emirati populations for 2006-2025, based on projection from census 2005
http://original.fcsa.gov.ae/EnglishHome/ReportDetailsEnglish/tabid/121/Default.aspx?ItemId=1914&PTID=104&MenuId=1.
(publication no longer available as of 25 02 2025)
Births and deaths records, disaggregated by nationality (annual estimates available since 1995). Uninterrupted series: available since 2007
https://fcsc.gov.ae/en-us/Pages/Statistics/Statistics-by-Subject.aspx#/%3Ffolder=Demography%20and%20Social/Vital%20Statistics/Births%20and%20Deaths&subject=Demography%20and%20Social
Total UAE population estimates (2000-2023)
https://fcsc.gov.ae/en-us/Pages/Statistics/Statistics-by-Subject.aspx#/%3Ffolder=Demography%20and%20Social/Population/Population&subject=Demography%20and%20Social
Last date of access: February 2025
Keywords: United Arab Emirates, National Population, Foreign Population, National & Foreign Populations
GLMM and GRC cannot guarantee that the link to access the source will not change;
that the information will not be removed from the website it was obtained from;
that no geo-blockages will be imposed; or that the information will not be available for any another reason.
| Country |
Total population |
Nationals |
Foreign nationals |
% nationals |
% non-nationals |
| Bahrain |
1,472,204 |
713,263 |
758,941 |
48.4 |
51.6 |
| Kuwait |
4,816,592 |
1,442,005 |
3,374,587 |
29.9 |
70.1 |
| Oman |
4,578,016 |
2,719,500 |
1,858,516 |
59.4 |
40.6 |
| Qatar |
2,833,679 |
338,000* |
2,495,679* |
11.8** |
88.2** |
| Saudi Arabia |
35,013,414 |
21,430,128 |
13,583,286 |
61.2 |
38.8 |
| UAE |
9,289,297 |
1,274,435* |
8,014,862* |
13.7** |
86.3** |
| Total |
58,003,202 |
27,917,331* |
30,085,871* |
48.1** |
51.9** |
| Source: National institutes of statistics and GLMM’s estimates based on data published by National Statistical Institutes (see below) |
| * GLMM’s estimate, based on data published by National Statistical Institutes (see below). |
| ** Ratio is calculated on the basis of population estimates (see below). |
1- Definition:
Non-nationals are:
1- persons bearing nationality of a foreign State other than the GCC State of residence, or bearing no proof of nationality from any given state (stateless persons and holders of refugee status and travel document in a third country);
2- Holders of residence permit residing in the given GCC country at date of census, as per definition of residence used in each of the countries.
Figures by nationality for Qatar and the UAE are estimates.
2- Sources of data:
(1) Bahrain Open Data Portal, “Documents” section, Population 2020, https://www.data.gov.bh/en/ResourceCenter
Source: administrative records (central Population Register)
(2) Statistics Service System, Kuwait Public Authority for Civil Information (PACI). Population, June 2020.
https://www.paci.gov.kw/ (inaccessible from outside Kuwait as of 4 October 2022).
(3) National Centre for Statistical Information (NCSI). Monthly Statistical Bulletin, July 2020.
https://www.ncsi.gov.om/Elibrary/Pages/LibraryContentView.aspx
(4) Total figures of Qataris and non-Qataris residing in Qatar are not readily available in any published source.
The present figures are GLMM’s estimates, using:
a. Qatar Planning and Statistics Authority, Population and Social Statistics 2020
https://www.psa.gov.qa/en/statistics/Statistical%20Releases/Population/Population/2020/Population_social_1_2020_AE.xls
which gave the total population by sex for mid-2020.
b. Qatar Planning and Statistics Authority. Woman and Man in the State of Qatar-A Statistical Profile, 2020,
https://www.psa.gov.qa/en/statistics/Statistical%20Releases/Social/GenrealSocialStatistics/MenWomenProfile/2020/Woman_Man_2020_EN.pdf
(last available data on total national and foreign populations’ age structure, as of September 2022)
which gave the percentage distribution of population by broad age group for mid-2019, by sex and nationality
c. The Labour Force Survey for the second quarter of 2020
https://www.psa.gov.qa/en/statistics/Statistical%20Releases/Social/LaborForce/2020/LF_Q2_2020_AE.xlsx
which gave the numbers of Qataris and foreigners aged 15 and above for mid-2020 (Q2 2020).
These were used to estimate the number of residents aged below 15 years, by nationality.
(5) Saudi Arabia Monetary Authority. Annual Statistics 2020, table 37. Population estimates by the General Authority for Statistics (GAStat),
based on the results of the Population Censuses (1974, 1992, 2004, 2010), on the Demographic Research Bulletin 2016 (2013-2017),
and on administrative records: vital statistics records (births and deaths records) and im/emigration records (General Authority for Statistics).
https://www.sama.gov.sa/en-US/EconomicReports/pages/yearlystatistics.aspx
(6) Figures of UAE population disaggregated by nationality are unavailable in published sources.
The Federal Competitiveness and Statistics Center (FCSC) publishes annual aggregated estimates of the total population in the UAE, based on the administrative records’ data:
“Population count is the total count of all persons living within the boundaries of the country at a specific time with their demographic characteristics from the official administrative records of the country”.
The table’s figures of Emirati and non-Emirati populations are GLMM’s estimates, using the following sources of published data:
1. Based on projections from census 2005, disaggregated estimates of Emirati and non-Emirati populations, last published for 2010 (mid-year)
http://original.fcsa.gov.ae/EnglishHome/ReportDetailsEnglish/tabid/121/Default.aspx?ItemId=1914&PTID=104&MenuId=1.
(publication no longer available as of 25 02 2025)
2. Disaggregated figures of births and deaths for the Emirati population (end-of-year figures), published for the years 2009 to 2022 (columns 1 and 2).
https://fcsc.gov.ae/en-us/Pages/Statistics/Statistics-by-Subject.aspx#/%3Ffolder=Demography%20and%20Social/Vital%20Statistics/Births%20and%20Deaths&subject=Demography%20and%20Social
Starting with 2009 data, we calculate the numbers of Emirati births and deaths
3. Assuming:
a. that the Emirati nationals’ demographic growth is primarily driven by natural increase (births-deaths), and that Emirati citizens’ international migration and naturalisations are only a few;
b. that the figure of Emiratis for 2010 is accurate, we calculate the number of Emiratis for mid- years 2011 to 2022:
E. population mid-year n = (E. population mid-year n-1) + (E. births mid-year n) – (E. deaths mid-year n).
4. The estimates of Emiratis are deducted from given total population figures, to estimate the number of non-Emiratis.
The accuracy of such estimates cannot be assessed, as they are based on given data which cannot be verified, such as the projections of census 2005 population data for 2010.
for more details see: https://gulfmigration.grc.net/glmm-database/demographic-and-economic-module/?search=1&cmct=United+Arab+Emirates
Last date of access: 25 February 2025
GLMM and GRC cannot guarantee that the link to access the source will not change;
that the information will not be removed from the website it was obtained from;
that no geo-blockages will be imposed; or that the information will not be available for any another reason.
| Country |
Total population |
Nationals |
Foreign nationals |
% nationals |
% foreign nationals |
| Bahrain |
1,524,693 |
714,011 |
810,682 |
46.8 |
53.2 |
| Kuwait |
4,589,643 |
1,502,896 |
3,086,747 |
32.7 |
67.3 |
| Oman |
4,730,648 |
2,835,864 |
1,894,784 |
59.9 |
40.1 |
| Qatar |
2,878,202 |
348,839* |
2,529,362* |
12.1** |
87.9** |
| Saudi Arabia |
32,175,224 |
18,792,262 |
13,382,962 |
58.4 |
41.6 |
| UAE |
10,288,946 |
1,331,683* |
8,957,263* |
12.9** |
87.1** |
| Total |
56,187,356 |
25,525,555* |
30,661,800* |
45.4** |
54.6** |
| Source: National institutes of statistics and GLMM’s estimates based on data published by National Statistical Institutes (see below) |
| * GLMM’s estimate, based on data published by National Statistical Institutes (see below). |
| ** Ratio is calculated on the basis of population estimates (see below). |
1- Definition:
Non-nationals are:
1- persons bearing nationality of a foreign State other than the GCC State of residence, or bearing no proof of nationality from any given state (stateless persons and holders of refugee status and travel document in a third country);
2- Holders of residence permit residing in the given GCC country at date of census, as per definition of residence used in each of the countries.
Figures by nationality for Qatar are author’s estimates.
2- Sources of data:
(1) Bahrain Open Data Portal, “Population” section,
https://www.data.gov.bh/pages/homepage/
Source: administrative records (central Population Register)
(2) Kuwait Central Bureau of Statistics
https://www.csb.gov.kw/default_en
“Population” statistics, 01-01-2022 and 01-01-2023
The population estimates are based on the results of census 2021.
Kuwait population estimates: based on natural increase (births-deaths), and number of naturalisations during past year.
Non-Kuwaiti population estimates: based on natural increase, and on net migration (entries-exits) (Ministry of Interior data) recorded during the past year.
Source of births and deaths data: the Public Authority for Civil Information (PACI) (inaccessible from outside Kuwait as of December 2023).
The figure for mid-2022 (average of the two figures for 01 January) was calculated by the author.
(3) National Centre for Statistical Information (NCSI), census 2020 portal
https://portal.ecensus.gov.om/ecen-portal/
Dataset “Population”, updated figures for 01-01-2022 and 01-01-2023.
location of report: public/Census_reports/Public_Datasets/public_population_en.xanalyzer
The figure for mid-2022 (average of the two end-of-year figures) was calculated by the author.
(4) Total figures of Qataris and non-Qataris residing in Qatar are not readily available in any published source.
The present figures are GLMM’s estimates, using:
a. The Annual Bulletin of the Labour Force Survey 2022
https://www.psa.gov.qa/en/statistics/Statistical%20Releases/Social/LaborForce/2020/LF_Q2_2020_AE.xlsx
which gave:
1. the numbers of Qataris and foreigners aged 15 and above for 2022.
2. The total resident population in Qatar.
b. Qatar Planning and Statistics Authority. Woman and Man in the State of Qatar-A Statistical Profile, 2022,
https://www.psa.gov.qa/en/statistics/Statistical%20Releases/Social/GenrealSocialStatistics/MenWomenProfile/2022/Woman_Man_2022_EN.pdf
which gave:
1. the sex ratio of the total population by nationality
2. the percentage distribution of population by broad age group for mid-2021, by sex and nationality
(last available data on total national and foreign populations’ age structure, as of December 2023)
These were used to estimate the total population by sex and nationality.
(5) General Authority for Statistics (GAStat) Statistical database, census 2022, Population estimates.
Report name: Population estimates by gender, nationality, and region 2010 – 2022
based on the administrative records’ data:
“Population count is the total count of all persons living within the boundaries of the country at a specific time with their demographic characteristics from the official administrative records of the country”.
The table’s figures of Emirati and non-Emirati populations are GLMM’s estimates, using the following sources of published data:
1. Based on projections from census 2005, disaggregated estimates of Emirati and non-Emirati populations, last published for 2010 (mid-year)
http://original.fcsa.gov.ae/EnglishHome/ReportDetailsEnglish/tabid/121/Default.aspx?ItemId=1914&PTID=104&MenuId=1.
(publication no longer available as of 25 02 2025)
2. Disaggregated figures of births and deaths for the Emirati population (end-of-year figures), published for the years 2009 to 2022(columns 1 and 2).
https://fcsc.gov.ae/en-us/Pages/Statistics/Statistics-by-Subject.aspx#/%3Ffolder=Demography%20and%20Social/Vital%20Statistics/Births%20and%20Deaths&subject=Demography%20and%20Social
Starting with 2009 data, we calculate the numbers of Emirati births and deaths
3. Assuming:
a. that the Emirati nationals’ demographic growth is primarily driven by natural increase (births-deaths),and that Emirati citizens’ international migration and naturalisations are only a few;
b. that the figure of Emiratis for 2010 is accurate, we calculate the number of Emiratis for mid- years 2011 to 2022:
E. population mid-year n = (E. population mid-year n-1) + (E. births mid-year n) – (E. deaths mid-year n).
4. The estimates of Emiratis are deducted from given total population figures, to estimate the number of non-Emiratis.
The accuracy of such estimates cannot be assessed, as they are based on given data which cannot be verified, such as the projections of census 2005 population data for 2010.
for more details see: https://gulfmigration.grc.net/glmm-database/demographic-and-economic-module/?search=1&cmct=United+Arab+Emirates
Last date of access: February 2025.
Keywords: Bahrain, Oman, Kuwait, Saudi Arabia, Qatar, United Arab Emirates, Foreign & National Populations
GLMM and GRC cannot guarantee that the link to access the source will not change; that the information will not be removed from the website it was obtained from; that no geo-blockages will be imposed; or that the information will not be available for any another reason.
| |
Emiratis |
Non-Emiratis |
Total |
| |
Males |
Females |
Total |
Males |
Females |
Total |
Males |
Females |
Total |
| Federal Government |
NA |
NA |
NA |
NA |
NA |
NA |
3.3% |
4.0% |
3.5% |
| Local government |
NA |
NA |
NA |
NA |
NA |
NA |
3.7% |
5.9% |
4.2% |
| Private Sector |
NA |
NA |
NA |
NA |
NA |
NA |
83.9% |
52.8% |
76.7% |
| Shared |
NA |
NA |
NA |
NA |
NA |
NA |
4.6% |
6.3% |
5.0% |
| Foreign |
NA |
NA |
NA |
NA |
NA |
NA |
1.6% |
3.3% |
2.0% |
| Diplomatic Authority |
NA |
NA |
NA |
NA |
NA |
NA |
0.0% |
0.1% |
0.0% |
| Non-profit Organizations |
NA |
NA |
NA |
NA |
NA |
NA |
0.1% |
0.2% |
0.1% |
| Without Establishment |
NA |
NA |
NA |
NA |
NA |
NA |
0.2% |
0.6% |
0.3% |
| Private Households |
NA |
NA |
NA |
NA |
NA |
NA |
2.5% |
25.6% |
7.8% |
| Other |
NA |
NA |
NA |
NA |
NA |
NA |
0.0% |
0.0% |
0.0% |
| Not Stated |
NA |
NA |
NA |
NA |
NA |
NA |
0.2% |
1.1% |
0.4% |
| Total |
NA |
NA |
NA |
NA |
NA |
NA |
100.0% |
100.0% |
100.0% |
Source: Federal Competitiveness and Statistitics Center (FCSC)
ANNEXED NOTE
1. Characteristics of data, definitions and population counting operations in the UAE
Since 2016, the UAE Federal Competitiveness and Statistitics Center (FCSC)
resumed the implementation of Labour Force Surveys. The last one was conducted in 2009.
Labour Force Surveys are based on field surveys.
No metadata and methodological indications for the current Labour Force Surveys are available.
https://fcsa.gov.ae/en-us/Pages/Statistics/qualitygate.aspx#?tid=1&sid=1
Since 2020, Labour Force Surveys’ publications stopped including data disaggregated by nationality (national/non-national).
2. Institution which provides data
Federal Competitiveness and Statistitics Center (FCSC)
https://fcsa.gov.ae/en-us/
3. Data availability
The results of 2008, 2009, 2016 to 2023 Labour Force Surveys are available (in Excel format) in FCSC’s website, section “Statistics by Subject”; “Demographis and Social Statistics”; “Labor Force”
https://fcsc.gov.ae/en-us/Pages/Statistics/Statistics-by-Subject.aspx?_gl=1*yblmar*_ga*MTUxNDM3MDY4MS4xNzM2OTU4MzA1*_ga_ZHMQE6JK4Z*MTczNjk2NTg3MC4zLjEuMTczNjk2NjIyOS4wLjAuMA..#report-tvDetails
Raw datasets for the period 2019 to the last LFS are also available in the UAE Stat portal
https://uaestat.fcsc.gov.ae/en
Last date of access: February 2025
Keywords: United Arab Emirates, Labour Market, Employment, Female Employment, National & Foreign Labour
GLMM and GRC cannot guarantee that the link to access the source will not change;
that the information will not be removed from the website it was obtained from;
that no geo-blockages will be imposed; or that the information will not be available for any another reason.
| |
Emiratis |
Non-Emiratis |
Total |
| |
Males |
Females |
Total |
Males |
Females |
Total |
Males |
Females |
Total |
| Agriculture, forestry and fishing |
NA |
NA |
NA |
NA |
NA |
NA |
1.9% |
0.1% |
1.5% |
| Mining and quarrying |
NA |
NA |
NA |
NA |
NA |
NA |
5.2% |
1.7% |
4.4% |
| Manufacturing |
NA |
NA |
NA |
NA |
NA |
NA |
10.2% |
3.2% |
8.6% |
| Electricity, gas, steam and air conditioning supply |
NA |
NA |
NA |
NA |
NA |
NA |
0.8% |
0.5% |
0.7% |
| Water supply; sewerage, waste management and remediation activities |
NA |
NA |
NA |
NA |
NA |
NA |
0.5% |
0.1% |
0.4% |
| Construction |
NA |
NA |
NA |
NA |
NA |
NA |
20.4% |
3.2% |
16.5% |
| Wholesale and retail trade; repair of motor vehicles and motorcycles |
NA |
NA |
NA |
NA |
NA |
NA |
17.8% |
9.3% |
15.8% |
| Transportation and storage |
NA |
NA |
NA |
NA |
NA |
NA |
6.3% |
3.7% |
5.7% |
| Accommodation and food service activities |
NA |
NA |
NA |
NA |
NA |
NA |
5.4% |
2.5% |
4.7% |
| Information and communication |
NA |
NA |
NA |
NA |
NA |
NA |
2.6% |
3.3% |
2.7% |
| Financial and insurance activities |
NA |
NA |
NA |
NA |
NA |
NA |
2.5% |
4.9% |
3.0% |
| Real estate activities |
NA |
NA |
NA |
NA |
NA |
NA |
2.0% |
2.7% |
2.2% |
| Professional, scientific and technical activities |
NA |
NA |
NA |
NA |
NA |
NA |
3.4% |
6.0% |
4.0% |
| Administrative and support service activities |
NA |
NA |
NA |
NA |
NA |
NA |
8.0% |
6.3% |
7.6% |
| Public administration and defence; compulsory social security |
NA |
NA |
NA |
NA |
NA |
NA |
5.0% |
5.6% |
5.1% |
| Education |
NA |
NA |
NA |
NA |
NA |
NA |
1.2% |
8.6% |
2.9% |
| Human health and social work activities |
NA |
NA |
NA |
NA |
NA |
NA |
1.7% |
7.6% |
3.0% |
| Arts, entertainment and recreation |
NA |
NA |
NA |
NA |
NA |
NA |
0.6% |
1.0% |
0.7% |
| Other service activities |
NA |
NA |
NA |
NA |
NA |
NA |
1.6% |
2.0% |
1.7% |
| Activities of households as employers; services-producing activities of households for own use |
NA |
NA |
NA |
NA |
NA |
NA |
2.5% |
25.9% |
7.9% |
| Activities of extraterritorial organizations and bodies |
NA |
NA |
NA |
NA |
NA |
NA |
0.0% |
0.2% |
0.1% |
| Not Stated |
NA |
NA |
NA |
NA |
NA |
NA |
0.6% |
1.4% |
0.8% |
| Total |
NA |
NA |
NA |
NA |
NA |
NA |
100.0% |
100.0% |
100.0% |
Source: Federal Competitiveness and Statistitics Center (FCSC)
ANNEXED NOTE
1. Characteristics of data, definitions and population counting operations in the UAE
Since 2016, the UAE Federal Competitiveness and Statistitics Center (FCSC)
resumed the implementation of Labour Force Surveys. The last one was conducted in 2009.
Labour Force Surveys are based on field surveys.
No metadata and methodological indications for the current Labour Force Surveys are available.
https://fcsa.gov.ae/en-us/Pages/Statistics/qualitygate.aspx#?tid=1&sid=1
Since 2020, Labour Force Surveys’ publications stopped including data disaggregated by nationality (national/non-national).
2. Institution which provides data
Federal Competitiveness and Statistitics Center (FCSC)
https://fcsa.gov.ae/en-us/
3. Data availability
The results of 2008, 2009, 2016 to 2023 Labour Force Surveys are available (in Excel format) in FCSC’s website, section “Statistics by Subject”; “Demographis and Social Statistics”; “Labor Force”
https://fcsc.gov.ae/en-us/Pages/Statistics/Statistics-by-Subject.aspx?_gl=1*yblmar*_ga*MTUxNDM3MDY4MS4xNzM2OTU4MzA1*_ga_ZHMQE6JK4Z*MTczNjk2NTg3MC4zLjEuMTczNjk2NjIyOS4wLjAuMA..#report-tvDetails
Raw datasets for the period 2019 to the last LFS are also available in the UAE Stat portal
https://uaestat.fcsc.gov.ae/en
Last date of access: February 2025
Keywords: United Arab Emirates, Labour Market, Employment, Female Employment, National & Foreign Labour
GLMM and GRC cannot guarantee that the link to access the source will not change;
that the information will not be removed from the website it was obtained from;
that no geo-blockages will be imposed; or that the information will not be available for any another reason.
| |
Emiratis |
Non-Emiratis |
Total |
| |
Males |
Females |
Total |
Males |
Females |
Total |
Males |
Females |
Total |
| Federal Government |
NA |
NA |
NA |
NA |
NA |
NA |
4.0% |
4.1% |
4.0% |
| Local government |
NA |
NA |
NA |
NA |
NA |
NA |
4.7% |
8.5% |
5.6% |
| Private Sector |
NA |
NA |
NA |
NA |
NA |
NA |
79.5% |
44.3% |
71.0% |
| Shared |
NA |
NA |
NA |
NA |
NA |
NA |
5.6% |
4.8% |
5.4% |
| Foreign |
NA |
NA |
NA |
NA |
NA |
NA |
1.4% |
2.3% |
1.6% |
| Diplomatic Authority |
NA |
NA |
NA |
NA |
NA |
NA |
0.0% |
0.2% |
0.1% |
| Non-profit Organizations |
NA |
NA |
NA |
NA |
NA |
NA |
0.1% |
0.3% |
0.2% |
| Without Establishment |
NA |
NA |
NA |
NA |
NA |
NA |
0.5% |
0.6% |
0.5% |
| Private Households |
NA |
NA |
NA |
NA |
NA |
NA |
4.2% |
34.9% |
11.6% |
| Other |
NA |
NA |
NA |
NA |
NA |
NA |
0.0% |
0.0% |
0.0% |
| Not Stated |
NA |
NA |
NA |
NA |
NA |
NA |
0.0% |
0.0% |
0.0% |
| Total |
NA |
NA |
NA |
NA |
NA |
NA |
100.0% |
100.0% |
100.0% |
Source: Federal Competitiveness and Statistitics Center (FCSC)
ANNEXED NOTE
1. Characteristics of data, definitions and population counting operations in the UAE
Since 2016, the UAE Federal Competitiveness and Statistitics Center (FCSC)
resumed the implementation of Labour Force Surveys. The last one was conducted in 2009.
Labour Force Surveys are based on field surveys.
No metadata and methodological indications for the current Labour Force Surveys are available.
https://fcsa.gov.ae/en-us/Pages/Statistics/qualitygate.aspx#?tid=1&sid=1
Since 2020, Labour Force Surveys’ publications stopped including data disaggregated by nationality (national/non-national).
2. Institution which provides data
Federal Competitiveness and Statistitics Center (FCSC)
https://fcsa.gov.ae/en-us/
3. Data availability
The results of 2008, 2009, 2016 to 2023 Labour Force Surveys are available (in Excel format) in FCSC’s website, section “Statistics by Subject”; “Demographis and Social Statistics”; “Labor Force”
https://fcsc.gov.ae/en-us/Pages/Statistics/Statistics-by-Subject.aspx?_gl=1*yblmar*_ga*MTUxNDM3MDY4MS4xNzM2OTU4MzA1*_ga_ZHMQE6JK4Z*MTczNjk2NTg3MC4zLjEuMTczNjk2NjIyOS4wLjAuMA..#report-tvDetails
Raw datasets for the period 2019 to the last LFS are also available in the UAE Stat portal
https://uaestat.fcsc.gov.ae/en
Last date of access: February 2025
Keywords: United Arab Emirates, Labour Market, Employment, Female Employment, National & Foreign Labour
GLMM and GRC cannot guarantee that the link to access the source will not change;
that the information will not be removed from the website it was obtained from;
that no geo-blockages will be imposed; or that the information will not be available for any another reason.
| |
Emiratis |
Non-Emiratis |
Total |
| |
Males |
Females |
Total |
Males |
Females |
Total |
Males |
Females |
Total |
| Federal Government |
NA |
NA |
NA |
NA |
NA |
NA |
3.8 |
5.4 |
4.2 |
| Local government |
NA |
NA |
NA |
NA |
NA |
NA |
6.1 |
8.4 |
6.6 |
| Private Sector |
NA |
NA |
NA |
NA |
NA |
NA |
76.8 |
43.5 |
68.8 |
| Shared |
NA |
NA |
NA |
NA |
NA |
NA |
6.7 |
5.9 |
6.5 |
| Foreign |
NA |
NA |
NA |
NA |
NA |
NA |
0.8 |
0.6 |
0.7 |
| Diplomatic Authority |
NA |
NA |
NA |
NA |
NA |
NA |
0 |
0 |
0 |
| Non-profit Organizations |
NA |
NA |
NA |
NA |
NA |
NA |
0.3 |
0.3 |
0.3 |
| Without Establishment |
NA |
NA |
NA |
NA |
NA |
NA |
0.4 |
0.6 |
0.5 |
| Private Households |
NA |
NA |
NA |
NA |
NA |
NA |
4.9 |
35.2 |
12.2 |
| Other |
NA |
NA |
NA |
NA |
NA |
NA |
0.1 |
0 |
0.1 |
| Not Stated |
NA |
NA |
NA |
NA |
NA |
NA |
0 |
0 |
0 |
| Total |
NA |
NA |
NA |
NA |
NA |
NA |
100 |
100 |
100 |
Source: Federal Competitiveness and Statistitics Center (FCSC)
ANNEXED NOTE
1. Characteristics of data, definitions and population counting operations in the UAE
Since 2016, the UAE Federal Competitiveness and Statistitics Center (FCSC)
resumed the implementation of Labour Force Surveys. The last one was conducted in 2009.
Labour Force Surveys are based on field surveys.
No metadata and methodological indications for the current Labour Force Surveys are available.
https://fcsa.gov.ae/en-us/Pages/Statistics/qualitygate.aspx#?tid=1&sid=1
2. Institution which provides data
Federal Competitiveness and Statistitics Center (FCSC)
https://fcsa.gov.ae/en-us/
3. Data availability
The results of 2008, 2009, 2016 to 2023 Labour Force Surveys are available (in Excel format) in FCSC’s website, section “Statistics by Subject”; “Demographis and Social Statistics”; “Labor Force”
https://fcsc.gov.ae/en-us/Pages/Statistics/Statistics-by-Subject.aspx?_gl=1*yblmar*_ga*MTUxNDM3MDY4MS4xNzM2OTU4MzA1*_ga_ZHMQE6JK4Z*MTczNjk2NTg3MC4zLjEuMTczNjk2NjIyOS4wLjAuMA..#report-tvDetails
Raw datasets for the period 2019 to the last LFS are also available in the UAE Stat portal
https://uaestat.fcsc.gov.ae/en
Last date of access: December 2024.
Keywords: United Arab Emirates, Labour Market, Employment, Female Employment, National & Foreign Labour
GLMM and GRC cannot guarantee that the link to access the source will not change;
that the information will not be removed from the website it was obtained from;
that no geo-blockages will be imposed; or that the information will not be available for any another reason.
| |
Emiratis |
Non-Emiratis |
Total |
| |
Males |
Females |
Total |
Males |
Females |
Total |
Males |
Females |
Total |
| Federal Government |
44.7 |
31 |
40.5 |
2 |
1.6 |
1.9 |
3.9 |
3.4 |
3.8 |
| Local government |
36.7 |
40 |
37.7 |
5.2 |
3.7 |
4.9 |
6.6 |
6 |
6.5 |
| Private Sector |
6.5 |
11.4 |
8 |
82.4 |
46.4 |
73.9 |
79.1 |
44.3 |
70.7 |
| Shared |
10 |
16 |
11.9 |
4.4 |
3.7 |
4.2 |
4.6 |
4.5 |
4.6 |
| Foreign |
0.2 |
0.6 |
0.3 |
1.1 |
1.4 |
1.1 |
1 |
1.3 |
1.1 |
| Diplomatic Authority |
0 |
0 |
0 |
0.1 |
0 |
0.1 |
0.1 |
0 |
0.1 |
| Non-profit Organizations |
0.9 |
0.5 |
0.8 |
0.2 |
0.1 |
0.2 |
0.2 |
0.1 |
0.2 |
| Without Establishment |
0.3 |
0 |
0.2 |
0.2 |
0.2 |
0.2 |
0.2 |
0.1 |
0.2 |
| Private Households |
0 |
0.1 |
0 |
4.3 |
42.8 |
13.4 |
4.1 |
40.1 |
12.7 |
| Other |
0.1 |
0.1 |
0.1 |
0 |
0 |
0 |
0 |
0 |
0 |
| Not Stated |
0.5 |
0.3 |
0.4 |
0 |
0.1 |
0 |
0.1 |
0.1 |
0.1 |
| Total |
100 |
100 |
100 |
100 |
100 |
100 |
100 |
100 |
100 |
Source: Federal Competitiveness and Statistitics Center (FCSC)
ANNEXED NOTE
1. Characteristics of data, definitions and population counting operations in the UAE
Since 2016, the UAE Federal Competitiveness and Statistitics Center (FCSC)
resumed the implementation of Labour Force Surveys. The last one was conducted in 2009.
Labour Force Surveys are based on field surveys.
No metadata and methodological indications for the current Labour Force Surveys are available.
https://fcsa.gov.ae/en-us/Pages/Statistics/qualitygate.aspx#?tid=1&sid=1
2. Institution which provides data
Federal Competitiveness and Statistitics Center (FCSC)
https://fcsa.gov.ae/en-us/
3. Data availability
The results of 2008, 2009, 2016 to 2023 Labour Force Surveys are available (in Excel format) in FCSC’s website, section “Statistics by Subject”; “Demographis and Social Statistics”; “Labor Force”
https://fcsc.gov.ae/en-us/Pages/Statistics/Statistics-by-Subject.aspx?_gl=1*yblmar*_ga*MTUxNDM3MDY4MS4xNzM2OTU4MzA1*_ga_ZHMQE6JK4Z*MTczNjk2NTg3MC4zLjEuMTczNjk2NjIyOS4wLjAuMA..#report-tvDetails
Raw datasets for the period 2019 to the last LFS are also available in the UAE Stat portal
https://uaestat.fcsc.gov.ae/en
Last date of access: December 2024.
Keywords: United Arab Emirates, Labour Market, Employment, Female Employment, National & Foreign Labour, National Labour, Foreign Labour
GLMM and GRC cannot guarantee that the link to access the source will not change;
that the information will not be removed from the website it was obtained from;
that no geo-blockages will be imposed; or that the information will not be available for any another reason.
| |
Emiratis |
Non-Emiratis |
Total |
| |
Males |
Females |
Total |
Males |
Females |
Total |
Males |
Females |
Total |
| Federal Government |
NA |
NA |
NA |
NA |
NA |
NA |
3.9 |
3.9 |
3.9 |
| Local government |
NA |
NA |
NA |
NA |
NA |
NA |
5.6 |
8.5 |
6.3 |
| Private Sector |
NA |
NA |
NA |
NA |
NA |
NA |
79.8 |
45.0 |
71.6 |
| Shared |
NA |
NA |
NA |
NA |
NA |
NA |
4.8 |
5.0 |
4.8 |
| Foreign |
NA |
NA |
NA |
NA |
NA |
NA |
1.0 |
1.0 |
1.0 |
| Diplomatic Authority |
NA |
NA |
NA |
NA |
NA |
NA |
0.0 |
0.1 |
0.1 |
| Non-profit Organizations |
NA |
NA |
NA |
NA |
NA |
NA |
0.2 |
0.2 |
0.2 |
| Without Establishment |
NA |
NA |
NA |
NA |
NA |
NA |
0.7 |
0.4 |
0.6 |
| Private Households |
NA |
NA |
NA |
NA |
NA |
NA |
4.1 |
35.9 |
11.6 |
| Other |
NA |
NA |
NA |
NA |
NA |
NA |
0.0 |
0.0 |
0.0 |
| Not Stated |
NA |
NA |
NA |
NA |
NA |
NA |
0.0 |
0.0 |
0.0 |
| Total |
NA |
NA |
NA |
NA |
NA |
NA |
100 |
100 |
100 |
Source: Federal Competitiveness and Statistitics Center (FCSC)
ANNEXED NOTE
1. Characteristics of data, definitions and population counting operations in the UAE
Since 2016, the UAE Federal Competitiveness and Statistitics Center (FCSC)
resumed the implementation of Labour Force Surveys. The last one was conducted in 2009.
Labour Force Surveys are based on field surveys.
No metadata and methodological indications for the current Labour Force Surveys are available.
https://fcsa.gov.ae/en-us/Pages/Statistics/qualitygate.aspx#?tid=1&sid=1
Since 2020, Labour Force Surveys’ publications stopped including data disaggregated by nationality (national/non-national).
2. Institution which provides data
Federal Competitiveness and Statistitics Center (FCSC)
https://fcsa.gov.ae/en-us/
3. Data availability
The results of 2008, 2009, 2016 to 2023 Labour Force Surveys are available (in Excel format) in FCSC’s website, section “Statistics by Subject”; “Demographis and Social Statistics”; “Labor Force”
https://fcsc.gov.ae/en-us/Pages/Statistics/Statistics-by-Subject.aspx?_gl=1*yblmar*_ga*MTUxNDM3MDY4MS4xNzM2OTU4MzA1*_ga_ZHMQE6JK4Z*MTczNjk2NTg3MC4zLjEuMTczNjk2NjIyOS4wLjAuMA..#report-tvDetails
Raw datasets for the period 2019 to the last LFS are also available in the UAE Stat portal
https://uaestat.fcsc.gov.ae/en
Last date of access: December 2024.
Keywords: United Arab Emirates, Labour Market, Employment, Female Employment, National & Foreign Labour
GLMM and GRC cannot guarantee that the link to access the source will not change;
that the information will not be removed from the website it was obtained from;
that no geo-blockages will be imposed; or that the information will not be available for any another reason.
| |
Saudis |
Non Saudis |
Total |
| |
Males |
Females |
Total |
Males |
Females |
Total |
Males |
Females |
Total |
| Education |
1.0 |
13.3 |
8.4 |
0.2 |
15.0 |
1.7 |
0.7 |
13.3 |
7.1 |
| Agriculture, forestry, fisheries and veterinary |
2.2 |
0.0 |
2.0 |
1.7 |
0.0 |
1.7 |
1.8 |
0.0 |
1.8 |
| Arts and Humanities |
4.1 |
14.4 |
10.1 |
0.5 |
12.8 |
1.9 |
2.5 |
14.3 |
8.0 |
| Business, Management and Law |
4.5 |
17.1 |
8.1 |
0.8 |
20.8 |
1.4 |
2.3 |
17.5 |
4.6 |
| Communication and Information Technology |
7.0 |
20.1 |
11.2 |
2.1 |
18.6 |
2.7 |
4.0 |
19.9 |
6.6 |
| Engineering, manufacturing and Building |
4.6 |
12.1 |
5.0 |
1.2 |
33.4 |
1.5 |
2.2 |
18.7 |
2.6 |
| Health and well-being |
2.8 |
6.1 |
4.3 |
0.3 |
4.9 |
1.7 |
1.3 |
5.6 |
3.0 |
| Natural Sciences, Mathematics, and Statistics |
3.8 |
16.7 |
11.2 |
2.7 |
11.6 |
3.5 |
3.3 |
16.4 |
8.9 |
| Services |
1.8 |
28.5 |
7.3 |
1.0 |
0.0 |
0.9 |
1.5 |
23.7 |
5.1 |
| Social Sciences, Press and Media |
1.6 |
16.5 |
7.5 |
0.0 |
15.5 |
1.7 |
0.9 |
16.4 |
5.6 |
| Unknown programs |
16.2 |
0.0 |
13.6 |
0.0 |
0.0 |
0.0 |
13.9 |
0.0 |
11.9 |
Source: Labour Force Survey, in: Labour Market Statistics, General Authority for Statistics (GAStat)
1. Data collection methodology
LFS were first conducted in 2001 and became bi-annual after 2006. Data were collected through nationally-representative household sample surveys, which sampling was based on most recent censuses. Since 2016, Labour Force Surveys have been conducted and published on a quarterly basis,based on a household telephone survey conducted by GAStat. Employment data extracted from administrative records were also introduced as a complement to the results of Labour Force Surveys in Labour Market Statistics’ publications, starting on Q1 2017.
The present data is based on estimates drawn from the results of the quarterly Labour Force Survey.
LFS results are published as rates only. Numerical estimates are unavailable.
Population data for 2010-22 were revised and backcasted, based on 2022 population census and past years’ administrative data.
Technical note on backcasting:
https://portal.saudicensus.sa/static-assets/media/content/20230529_Back-Casting%20Methodology.pdf?crafterSite=gastat-portal
Methodologies/En_Documents/40_Technical Note Population Back Casting.PDF
GAStat Labour Market Statistics: Labour Force Survey (household telephone survey conducted by GAStat)
Sample size: 53,360 households, from all administrative regions of Saudi Arabia.
Population covered: residents in Saudi Arabia, Saudis and non-Saudis. All household members, including domestic workers.
The survey provides estimates of the size of the total and working-age populations (aged 15 years and above), inside and outside the labour force. It highlights the characteristics of the labour force (employed and unemployed populations), and supplies the data to calculate key indicators of labour market such as the unemployment and the labour force participation rates.
Household survey questionnaire:
https://www.stats.gov.sa/en/statistical-knowledge/72.
https://www.stats.gov.sa/ar/statistical-knowledge/72
Definitions:
– Unemployed individuals:
Individuals (15 years and above) who were:
1. Without a job in the week preceding the household contact.
2. Seriously looking for work during the four weeks prior to contacting the family. This includes those who did not search for work during the four weeks prior to the survey because they were waiting to find work, or to establish their own business during the next period, providing they searched for a job before the reference period.
3. People who were able to work and ready to join whenever necessary during the week preceding the household contact or the following two weeks.
– Unemployed individuals who have been working:
Unemployed individuals (15 years and above) who had been working, then left their jobs for any reason, and who during the time reference were: unemployed, seriously seeking a job and ready to start working.
Unemployment rate= (number of unemployed individuals ÷ total labour force) x 100
Definitions and categories used by GAStat in Labour Markets Statistics (employment; unemployment; occupation and activity sectors, etc.) are based on international standards:
For LFS methodology and definitions, see:
https://www.stats.gov.sa/en/node/9787.
2. Institution which provides data
General Authority for Statistics (GAStat)
3. Data availability
Since 2021, GAStat has been publishing separately the employment data taken from administrative records, and unemployment/inactivity data as well as general indicators, calculated from the results of the field interviews conducted by GAStat (Labour Force Survey). The present time-series was taken from the Labour Market Statistics- Q2, 2024 (English and Arabic versions).
https://www.stats.gov.sa/en/814
https://www.stats.gov.sa/ar/814
Date of access: 15 December 2024.
Keywords: Unemployment, Saudi Arabia, Education, Highly Skilled Labour, National & Foreign Labour
GLMM and GRC cannot guarantee that the link to access the source will not change;
that the information will not be removed from the website it was obtained from;
that no geo-blockages will be imposed; or that the information will not be available for any another reason.
| |
Saudis |
Non Saudis |
Total |
| |
Males |
Females |
Total |
Males |
Females |
Total |
Males |
Females |
Total |
| No schooling |
3.1 |
2.4 |
2.7 |
1.0 |
0.0 |
0.8 |
1.2 |
0.8 |
1.1 |
| Early childhood education |
0.5 |
6.8 |
4.0 |
0.8 |
0.0 |
0.7 |
0.8 |
3.8 |
1.1 |
| Primary education |
3.2 |
5.9 |
4.4 |
0.3 |
1.9 |
0.4 |
0.5 |
3.6 |
0.9 |
| Lower secondary education |
4.2 |
7.4 |
5.4 |
0.0 |
1.1 |
0.1 |
0.4 |
3.7 |
0.7 |
| Upper secondary education |
4.3 |
12.0 |
6.3 |
1.6 |
5.9 |
1.8 |
2.5 |
10.4 |
3.7 |
| Post-secondary non-tertiary education |
5.6 |
11.2 |
7.0 |
2.1 |
2.5 |
2.1 |
3.9 |
10.0 |
4.9 |
| Short-cycle tertiary education |
6.6 |
13.3 |
8.2 |
2.3 |
12.7 |
2.8 |
4.4 |
13.2 |
5.8 |
| Bachelor’s or equivalent level |
3.2 |
15.4 |
8.6 |
0.7 |
11.7 |
1.5 |
1.7 |
14.9 |
5.2 |
| Master’s or equivalent level |
0.2 |
8.4 |
3.0 |
0.5 |
14.0 |
1.8 |
0.4 |
10.2 |
2.3 |
| Doctoral or equivalent level |
0.0 |
1.4 |
0.4 |
0.0 |
4.5 |
0.7 |
0.0 |
3.1 |
0.6 |
Source: Labour Force Survey, in: Labour Market Statistics, General Authority for Statistics (GAStat)
1. Data collection methodology
LFS were first conducted in 2001 and became bi-annual after 2006. Data were collected through nationally-representative household sample surveys, which sampling was based on most recent censuses. Since 2016, Labour Force Surveys have been conducted and published on a quarterly basis,based on a household telephone survey conducted by GAStat. Employment data extracted from administrative records were also introduced as a complement to the results of Labour Force Surveys in Labour Market Statistics’ publications, starting on Q1 2017.
The present data is based on estimates drawn from the results of the quarterly Labour Force Survey.
LFS results are published as rates only. Numerical estimates are unavailable.
Population data for 2010-22 were revised and backcasted, based on 2022 population census and past years’ administrative data.
Technical note on backcasting:
https://portal.saudicensus.sa/static-assets/media/content/20230529_Back-Casting%20Methodology.pdf?crafterSite=gastat-portal
Methodologies/En_Documents/40_Technical Note Population Back Casting.PDF
GAStat Labour Market Statistics: Labour Force Survey (household telephone survey conducted by GAStat)
Sample size: 53,360 households, from all administrative regions of Saudi Arabia.
Population covered: residents in Saudi Arabia, Saudis and non-Saudis. All household members, including domestic workers.
The survey provides estimates of the size of the total and working-age populations (aged 15 years and above), inside and outside the labour force. It highlights the characteristics of the labour force (employed and unemployed populations), and supplies the data to calculate key indicators of labour market such as the unemployment and the labour force participation rates.
Household survey questionnaire:
https://www.stats.gov.sa/en/statistical-knowledge/72.
https://www.stats.gov.sa/ar/statistical-knowledge/72
Definitions:
– Unemployed individuals:
Individuals (15 years and above) who were:
1. Without a job in the week preceding the household contact.
2. Seriously looking for work during the four weeks prior to contacting the family. This includes those who did not search for work during the four weeks prior to the survey because they were waiting to find work, or to establish their own business during the next period, providing they searched for a job before the reference period.
3. People who were able to work and ready to join whenever necessary during the week preceding the household contact or the following two weeks.
– Unemployed individuals who have been working:
Unemployed individuals (15 years and above) who had been working, then left their jobs for any reason, and who during the time reference were: unemployed, seriously seeking a job and ready to start working.
Unemployment rate= (number of unemployed individuals ÷ total labour force) x 100
Definitions and categories used by GAStat in Labour Markets Statistics (employment; unemployment; occupation and activity sectors, etc.) are based on international standards:
For LFS methodology and definitions, see:
https://www.stats.gov.sa/en/node/9787.
2. Institution which provides data
General Authority for Statistics (GAStat)
3. Data availability
Since 2021, GAStat has been publishing separately the employment data taken from administrative records, and unemployment/inactivity data as well as general indicators, calculated from the results of the field interviews conducted by GAStat (Labour Force Survey). The present time-series was taken from the Labour Market Statistics- Q2, 2024 (English and Arabic versions).
https://www.stats.gov.sa/en/814
https://www.stats.gov.sa/ar/814
Date of access: 15 December 2024.
Keywords: Unemployment, Saudi Arabia, Education, National & Foreign Labour
GLMM and GRC cannot guarantee that the link to access the source will not change;
that the information will not be removed from the website it was obtained from;
that no geo-blockages will be imposed; or that the information will not be available for any another reason.
| |
Saudis |
Non-Saudis |
Total |
| |
Males |
Females |
Total |
Males |
Females |
Total |
Males |
Females |
Total |
| 2021 Q1 |
7.44 |
21.72 |
12.17 |
1.53 |
5.38 |
1.91 |
3.37 |
16.37 |
5.80 |
| 2021 Q2 |
6.39 |
22.67 |
11.80 |
2.23 |
6.67 |
2.68 |
3.58 |
17.50 |
6.26 |
| 2021 Q3 |
6.21 |
22.16 |
11.73 |
1.67 |
7.43 |
2.32 |
3.18 |
17.41 |
6.12 |
| 2021 Q4 |
5.37 |
22.94 |
11.48 |
2.13 |
9.30 |
2.79 |
3.19 |
19.11 |
6.31 |
| 2022 Q1 |
5.16 |
20.32 |
10.32 |
1.88 |
6.52 |
2.29 |
2.93 |
16.35 |
5.45 |
| 2022 Q2 |
4.92 |
19.47 |
9.96 |
1.51 |
6.38 |
1.92 |
2.58 |
15.91 |
5.06 |
| 2022 Q3 |
4.39 |
20.66 |
10.16 |
1.25 |
6.14 |
1.66 |
2.22 |
16.69 |
4.95 |
| 2022 Q4 |
4.31 |
15.68 |
8.21 |
1.07 |
6.09 |
1.47 |
2.07 |
13.03 |
4.06 |
| 2023 Q1 |
4.67 |
16.33 |
8.67 |
1.23 |
6.42 |
1.68 |
2.27 |
13.40 |
4.31 |
| 2023 Q2 |
4.63 |
15.89 |
8.45 |
1.08 |
5.51 |
1.44 |
2.15 |
12.93 |
4.08 |
| 2023 Q3 |
4.73 |
16.57 |
8.81 |
1.08 |
6.56 |
1.53 |
2.17 |
13.67 |
4.24 |
| 2023 Q4 |
4.60 |
13.91 |
7.78 |
0.58 |
4.72 |
0.94 |
1.75 |
11.11 |
3.42 |
| 2024 Q1 |
4.21 |
14.17 |
7.61 |
0.75 |
5.39 |
1.10 |
1.79 |
11.83 |
3.54 |
| 2024 Q2 |
3.99 |
12.84 |
7.09 |
0.84 |
5.03 |
1.14 |
1.74 |
10.75 |
3.32 |
Source: Labour Force Survey, in: Labour Market Statistics, General Authority for Statistics (GAStat)
1. Data collection methodology
LFS were first conducted in 2001 and became bi-annual after 2006. Data were collected through nationally-representative household sample surveys, which sampling was based on most recent censuses. Since 2016, Labour Force Surveys have been conducted and published on a quarterly basis,based on a household telephone survey conducted by GAStat. Employment data extracted from administrative records were also introduced as a complement to the results of Labour Force Surveys in Labour Market Statistics’ publications, starting on Q1 2017.
The present data is based on estimates drawn from the results of the quarterly Labour Force Survey.
LFS results are published as rates only. Numerical estimates are unavailable.
Population data for 2010-22 were revised and backcasted, based on 2022 population census and past years’ administrative data.
Technical note on backcasting:
https://portal.saudicensus.sa/static-assets/media/content/20230529_Back-Casting%20Methodology.pdf?crafterSite=gastat-portal
Methodologies/En_Documents/40_Technical Note Population Back Casting.PDF
GAStat Labour Market Statistics: Labour Force Survey (household telephone survey conducted by GAStat)
Sample size: 53,360 households, from all administrative regions of Saudi Arabia.
Population covered: residents in Saudi Arabia, Saudis and non-Saudis. All household members, including domestic workers.
The survey provides estimates of the size of the total and working-age populations (aged 15 years and above), inside and outside the labour force. It highlights the characteristics of the labour force (employed and unemployed populations), and supplies the data to calculate key indicators of labour market such as the unemployment and the labour force participation rates.
Household survey questionnaire:
https://www.stats.gov.sa/en/statistical-knowledge/72.
https://www.stats.gov.sa/ar/statistical-knowledge/72
Definitions:
– Unemployed individuals:
Individuals (15 years and above) who were:
1. Without a job in the week preceding the household contact.
2. Seriously looking for work during the four weeks prior to contacting the family. This includes those who did not search for work during the four weeks prior to the survey because they were waiting to find work, or to establish their own business during the next period, providing they searched for a job before the reference period.
3. People who were able to work and ready to join whenever necessary during the week preceding the household contact or the following two weeks.
– Unemployed individuals who have been working:
Unemployed individuals (15 years and above) who had been working, then left their jobs for any reason, and who during the time reference were: unemployed, seriously seeking a job and ready to start working.
Unemployment rate= (number of unemployed individuals ÷ total labour force) x 100
Definitions and categories used by GAStat in Labour Markets Statistics (employment; unemployment; occupation and activity sectors, etc.) are based on international standards:
For LFS methodology and definitions, see:
https://www.stats.gov.sa/en/node/9787.
2. Institution which provides data
General Authority for Statistics (GAStat)
3. Data availability
Since 2021, GAStat has been publishing separately the employment data taken from administrative records, and unemployment/inactivity data as well as general indicators, calculated from the results of the field interviews conducted by GAStat (Labour Force Survey). The present time-series was taken from the Labour Market Statistics- Q2, 2024 (English and Arabic versions).
https://www.stats.gov.sa/en/814
https://www.stats.gov.sa/ar/814
Date of access: 15 December 2024.
Keywords: Unemployment, Saudi Arabia, National & Foreign Labour
GLMM and GRC cannot guarantee that the link to access the source will not change;
that the information will not be removed from the website it was obtained from;
that no geo-blockages will be imposed; or that the information will not be available for any another reason.
| |
Saudis |
Non Saudis |
Total |
| |
Males |
Females |
Total |
Males |
Females |
Total |
Males |
Females |
Total |
| Agriculture, forestry and fishing |
16,584 |
7,710 |
24,294 |
176,024 |
3,157 |
179,181 |
192,608 |
10,867 |
203,475 |
| Mining and quarrying |
108,022 |
10,158 |
118,180 |
67,683 |
963 |
68,646 |
175,705 |
11,121 |
186,826 |
| Manufacturing |
236,326 |
133,780 |
370,106 |
957,036 |
14,778 |
971,814 |
1,193,362 |
148,558 |
1,341,920 |
| Electricity, gas, steam and air conditioning supply |
31,405 |
2,243 |
33,648 |
11,838 |
665 |
12,503 |
43,243 |
2,908 |
46,151 |
| Water supply; sewerage, waste management and remediation activities |
25,904 |
8,934 |
34,838 |
130,020 |
3,361 |
133,381 |
155,924 |
12,295 |
168,219 |
| Construction |
243,729 |
156,591 |
400,320 |
2,466,623 |
27,621 |
2,494,244 |
2,710,352 |
184,212 |
2,894,564 |
| Wholesale and retail trade; repair of motor vehicles and motorcycles |
200,610 |
195,909 |
396,519 |
1,232,543 |
19,908 |
1,252,451 |
1,433,153 |
215,817 |
1,648,970 |
| Transportation and storage |
90,741 |
46,650 |
137,391 |
425,948 |
3,642 |
429,590 |
516,689 |
50,292 |
566,981 |
| Accommodation and food service activities |
70,254 |
70,840 |
141,094 |
531,402 |
7,044 |
538,446 |
601,656 |
77,884 |
679,540 |
| Information and communication |
35,126 |
28,094 |
63,220 |
45,930 |
2,585 |
48,515 |
81,056 |
30,679 |
111,735 |
| Financial and insurance activities |
57,699 |
22,372 |
80,071 |
15,939 |
906 |
16,845 |
73,638 |
23,278 |
96,916 |
| Real estate activities |
13,448 |
7,976 |
21,424 |
31,693 |
864 |
32,557 |
45,141 |
8,840 |
53,981 |
| Professional, scientific and technical activities |
80,513 |
45,304 |
125,817 |
123,492 |
5,712 |
129,204 |
204,005 |
51,016 |
255,021 |
| Administrative and support service activities |
117,721 |
67,162 |
184,883 |
828,750 |
156,669 |
985,419 |
946,471 |
223,831 |
1,170,302 |
| Public administration and defence; compulsory social security |
164,135 |
60,546 |
224,681 |
47,255 |
10,192 |
57,447 |
211,390 |
70,738 |
282,128 |
| Education |
38,616 |
60,581 |
99,197 |
74,134 |
15,158 |
89,292 |
112,750 |
75,739 |
188,489 |
| Human health and social work activities |
105,928 |
118,325 |
224,253 |
117,489 |
107,170 |
224,659 |
223,417 |
225,495 |
448,912 |
| Arts, entertainment and recreation |
6,975 |
6,810 |
13,785 |
16,352 |
2,534 |
18,886 |
23,327 |
9,344 |
32,671 |
| Other service activities |
20,158 |
22,360 |
42,518 |
183,028 |
25,340 |
208,368 |
203,186 |
47,700 |
250,886 |
| Activities of households as employer Activities of extraterritorial organizations and bodiess; undifferentiated goods- and services-producing activities of households for own use |
3 |
15 |
18 |
56 |
3 |
59 |
59 |
18 |
77 |
| Activities of extraterritorial organizations and bodies |
223 |
61 |
284 |
212 |
1 |
213 |
435 |
62 |
497 |
| Other activities |
16,888 |
18,991 |
35,879 |
1,030,091 |
12,532 |
1,042,623 |
1,046,979 |
31,523 |
1,078,502 |
| Total |
1,681,008 |
1,091,412 |
2,772,420 |
8,513,538 |
420,805 |
8,934,343 |
10,194,546 |
1,512,217 |
11,706,763 |
Source: Register-based Labour Market Statistics, General Authority for Statistics (GAStat)
1. Data collection methodology
LFS were first conducted in 2001 and became bi-annual after 2006. Data were collected through nationally representative household sample surveys, which sampling was based on most recent censuses. Since 2016, Labour Force Surveys have been conducted and published on a quarterly basis, based on a household telephone survey conducted by GAStat. Employment data extracted from administrative records were also introduced as a complement to the results of Labour Force Surveys in Labour Market Statistics’ publications, starting on Q1 2017.
The present data is taken from administrative records.
Population of reference: workers subject to the rule of the General Organization of Social Insurance (GOSI):
a. contributors on the job who are subject to social insurance laws and regulations in the private and government sector;
b. new contributors, and contributors who terminated their contribution to social insurance during the quarter.
Figures of workers in Labor Market statistics which were derived from administrative records do not include the following category:
1-Workers in the military and security sectors
2- Workers who are not registered in the civil service, social insurance (GOSI) and domestic workers’ records, which include:
– Saudis working for their own businesses and are not subjected to the labor regulations, also, not registered in social insurance, such as those who work in delivery through electronic apps
– Saudi employers who work in establishments and not registered in the social insurance
– Non-Saudi staff working in foreign international, political or military missions
3- Non-Saudi employees who come to the Kingdom for work that normally takes less than three months to be completed.
Definitions and categories used by GAStat in Labour Markets Statistics (employment; unemployment;
occupation and activity sectors, etc.) are based on international standards:
For LFS methodology and definitions, see:
https://www.stats.gov.sa/en/node/9787
https://database.stats.gov.sa/Methodologies/En_Documents/03_Labor%20Market%20Bulletin%20Methodology,%20Fourth%20Quarter%202020%20_%20General%20Authority%20for%20Statistics.pdf
https://www.stats.gov.sa/en/node/9787
https://database.stats.gov.sa/Methodologies/En_Documents/03_Labor%20Market%20Bulletin%20Methodology,%20Fourth%20Quarter%202020%20_%20General%20Authority%20for%20Statistics.pdf
Classification of activities: The Saudi Classification of Economic Activities, based on the International Standard Industrial Classification of all economic activities (ISIC4)
https://www.stats.gov.sa/en/isic4
2. Institution which provides data
General Authority for Statistics (GAStat)
3. Data availability
Since 2021, GAStat has been publishing separately the employment data taken from administrative records, and unemployment/inactivity data as well as general indicators, calculated from the results of the field interviews conducted by GAStat (Labour Force Survey).
The present time-series was taken from Register-based Labour Market Statistics publications, given quarters and years.
(English and Arabic versions)
https://www.stats.gov.sa/en/814
https://www.stats.gov.sa/ar/814
Date of access: 05 November 2024.
Keywords: Employment, Female Employment, Saudi Arabia, National & Foreign Labour
GLMM and GRC cannot guarantee that the link to access the source will not change;
that the information will not be removed from the website it was obtained from;
that no geo-blockages will be imposed; or that the information will not be available for any another reason.
| |
Males |
Females |
Total |
| Yemen |
1,334,481 |
468,988 |
1,803,469 |
| Egypt |
1,181,180 |
290,202 |
1,471,382 |
| Sudan |
673,689 |
145,886 |
819,575 |
| Syria |
259,632 |
189,682 |
449,314 |
| Jordan |
113,549 |
90,700 |
204,249 |
| Palestine |
68,069 |
61,800 |
129,869 |
| Lebanon |
32,779 |
20,000 |
52,779 |
| Kuwait |
31,500 |
18,500 |
50,000 |
| Morocco |
18,396 |
30,400 |
48,796 |
| Tunisia |
14,318 |
10,500 |
24,818 |
| Mauritania |
7,700 |
10,300 |
18,000 |
| Bahrain |
13,000 |
3,700 |
16,700 |
| Algeria |
5,000 |
4,600 |
9,600 |
| UAE |
6,800 |
1,600 |
8,400 |
| Qatar |
5,900 |
1,200 |
7,100 |
| Iraq |
3,000 |
3,400 |
6,400 |
| Oman |
2,800 |
900 |
3,700 |
| Libya |
400 |
300 |
700 |
| Total |
3,772,193 |
1,352,658 |
5,124,851 |
Source: GAStat, Saudi Arabia census 2022
ANNEXED NOTE
1. Technical Notes and Definitions
GLMM’s retabulation and reformatting of census data in thousands in dashboard figure: “Non-Saudi population by nationality and gender”
https://portal.saudicensus.sa/portal/public/1/18/41?type=DASHBOARD
Source of data: Saudi census 2022
Date of reference: 10 May 2022
Population of reference: Families and individual citizens and residents within the Kingdom, regardless of the status of their identification documents.
Visitors for Hajj, Umrah and tourism are excluded from the census.
Methodology:
The first phase of the 2020 census began on 3 February 2020 (enumeration of buildings and households). Census 2022 used geospatial data, including satellite images, electricity consumption and mobile phone data, to improve the accuracy and geographic coverage of address canvassing.
The 2022 census used a combined methodology – administrative records, fieldwork and digital self-enumeration.
Household data were collected from e-portals of self-enumeration (on residents’ mobile devices, laptops or personal computers, or self-enumeration stations/kiosks, located in shopping centers).
The digital self-enumeration process was complemented by face-to-face interviews, using digital tablets.
Census 2022 used a de jure approach: enumerating people according to their usual place of residence.
Administrative data from multiple sources was used to cross-validate collected census data.
Census 2022 was designed as a launchpad for several new secure statistical data registers for population, housing, and businesses.
See census methodology in:
https://portal.saudicensus.sa/portal/public/methodology
Portal of the Saudi census:
https://portal.saudicensus.sa/portal
Population data for 2010-22 were revised and backcasted, based on 2022 population census and past years’ administrative data.
Technical note on backcasting:
https://portal.saudicensus.sa/static-assets/media/content/20230529_Back-Casting%20Methodology.pdf?crafterSite=gastat-portal
2. Institution which provides data
General Authority for Statistics (GAStat)
3. Data availability
The data was retrieved from the Saudi census portal on GAStat website:
https://portal.saudicensus.sa/portal
“Population” section, then “dashboard” section
https://portal.saudicensus.sa/portal/public/1/18/41?type=DASHBOARD
Date of access: 21 November 2024.
GLMM and GRC cannot guarantee that the link to access the source will not change;
that the information will not be removed from the website it was obtained from;
that no geo-blockages will be imposed; or that the information will not be available for any another reason.
Keywords: Saudi Arabia, Foreign Population, Arab Countries, Yemen, Egypt, Sudan, Syria, Jordan, Palestine, Lebanon, Kuwait, Morocco, Tunisia, Mauritania, Bahrain, Algeria, UAE, Qatar, Iraq, Oman, Libya
| |
Qataris |
Non-Qataris |
Total |
| |
Males |
Females |
Total |
Males |
Females |
Total |
Males |
Females |
Total |
| Agriculture, forestry and fishing |
62 |
0 |
62 |
37,254 |
0 |
37,254 |
37,316 |
0 |
37,316 |
| Mining and quarrying |
4,896 |
1,932 |
6,828 |
25,451 |
2,441 |
27,892 |
30,347 |
4,373 |
34,720 |
| Manufacturing |
1,485 |
345 |
1,830 |
103,366 |
2,442 |
105,808 |
104,851 |
2,787 |
107,638 |
| Electricity, gas, steam and air conditioning supply |
1,246 |
1,326 |
2,572 |
12,741 |
1,870 |
14,611 |
13,987 |
3,196 |
17,183 |
| Water supply; sewerage, waste management and remediation activities |
561 |
297 |
858 |
5,996 |
0 |
5,996 |
6,557 |
297 |
6,854 |
| Construction |
1,485 |
250 |
1,735 |
660,597 |
8,311 |
668,908 |
662,082 |
8,561 |
670,643 |
| Wholesale and retail trade; repair of motor vehicles and motorcycles |
1,119 |
846 |
1,965 |
225,695 |
26,913 |
252,608 |
226,814 |
27,759 |
254,573 |
| Transportation and storage |
1,981 |
1,670 |
3,651 |
126,417 |
19,893 |
146,310 |
128,398 |
21,563 |
149,961 |
| Accommodation and food service activities |
548 |
969 |
1,517 |
72,718 |
21,403 |
94,121 |
73,266 |
22,372 |
95,638 |
| Information and communication |
2,297 |
1,520 |
3,817 |
17,379 |
4,950 |
22,329 |
19,676 |
6,470 |
26,146 |
| Financial and insurance activities |
2,313 |
2,798 |
5,111 |
16,521 |
7,389 |
23,910 |
18,834 |
10,187 |
29,021 |
| Real estate activities |
510 |
266 |
776 |
18,223 |
2,636 |
20,859 |
18,733 |
2,902 |
21,635 |
| Professional, scientific and technical activities |
374 |
187 |
561 |
26,958 |
5,343 |
32,301 |
27,332 |
5,530 |
32,862 |
| Administrative and support service activities |
392 |
831 |
1,223 |
163,505 |
32,347 |
195,852 |
163,897 |
33,178 |
197,075 |
| Public administration and defence; compulsory social security |
46,432 |
19,167 |
65,599 |
42,496 |
5,120 |
47,616 |
88,928 |
24,287 |
113,215 |
| Education |
2,894 |
11,564 |
14,458 |
28,598 |
33,959 |
62,557 |
31,492 |
45,523 |
77,015 |
| Human health and social work activities |
3,362 |
5,405 |
8,767 |
51,562 |
44,561 |
96,123 |
54,924 |
49,966 |
104,890 |
| Arts, entertainment and recreation |
1,213 |
1,167 |
2,380 |
8,537 |
3,037 |
11,574 |
9,750 |
4,204 |
13,954 |
| Other service activities |
109 |
47 |
156 |
10,896 |
3,900 |
14,796 |
11,005 |
3,947 |
14,952 |
| Activities of households as employers; undifferentiated goods- and services-producing activities of households for own use |
0 |
0 |
0 |
66,195 |
101,069 |
167,264 |
66,195 |
101,069 |
167,264 |
| Activities of extraterritorial organizations and bodies |
313 |
111 |
424 |
4,699 |
2,255 |
6,954 |
5,012 |
2,366 |
7,378 |
| Total |
73,592 |
50,698 |
124,290 |
1,725,804 |
329,839 |
2,055,643 |
1,799,396 |
380,537 |
2,179,933 |
Source: Annual Bulletin of Labour Force Sample Survey 2023
ANNEXED NOTE
1. Technical Notes and Definitions
The data is taken from Labour Force Survey 2023 (yearly synthesis)
Sampling frame : Population Census 2020.
Sample size: 65,253 persons, in 10,560 households: 1- Qatari households; 2- Non-Qatari regular (non-collective) households;
3- Non-Qatari small collective households or labour gatherings (2 – 6 persons); 4- Non-Qatari large collective households or large labour gatherings (7 persons or more).
The collective households are a group of persons not related to each other and sharing living conditions in a residential unit, I.e. labour camps, students living boarding
schools, nurses in hospitals… etc. The survey covered the small collective households (includes less than 7 persons) and large collective households (includes 7 persons or more).
Data Collection: The sample was divided into equal parts to collect data monthly. Each month 1/3 of the quarterly data were collected during the first two weeks of the month.
Reference period for the labour force data: the week prior to data collection day.
The survey did not cover short periods accommodation, i.e. hotels.
The present data includes active population, i.e. employed and unemployed. It does not include persons seeking work for the first time
Classifications used: ISIC Rev. 4.
2. Institution which provides data
Planning and Statistics Authority / National Planning Council
https://www.psa.gov.qa/en/Pages/default.aspx
3. Data availability
Labour Force Surveys (yearly and quarterly data) can be downloaded from PSA’s website, “Labor Force” section, in PDF and Excel format:
https://www.psa.gov.qa/en/statistics1/pages/topicslisting.aspx?parent=Social&child=LaborForce
Date of access: November 2024.
GLMM and GRC cannot guarantee that the link to access the source will not change;
that the information will not be removed from the website it was obtained from;
that no geo-blockages will be imposed; or that the information will not be available for any another reason.
Keywords: Qatar, Labour Market, Employment, National & Foreign Labour, National Labour, Foreign Labour, Highly-Skilled Labour, Low-Skilled Labour
| |
Qataris |
Non-Qataris |
Total |
| |
Males |
Females |
Total |
Males |
Females |
Total |
Males |
Females |
Total |
| Legislators, Senior Officials and Managers |
10,112 |
3,639 |
13,751 |
42,650 |
4,631 |
47,281 |
52,762 |
8,270 |
61,032 |
| Professionals |
18,355 |
23,150 |
41,505 |
191,392 |
99,697 |
291,089 |
209,747 |
122,847 |
332,594 |
| Technicians and Associate Professionals |
13,613 |
5,658 |
19,271 |
156,855 |
32,979 |
189,834 |
170,468 |
38,637 |
209,105 |
| Clerks |
23,806 |
16,650 |
40,456 |
112,573 |
41,140 |
153,713 |
136,379 |
57,790 |
194,169 |
| Service Workers and Shop and Market Sales Workers |
2,417 |
1,162 |
3,579 |
149,986 |
60,096 |
210,082 |
152,403 |
61,258 |
213,661 |
| Skilled Agricultural and Fishery Workers |
0 |
0 |
0 |
31,890 |
0 |
31,890 |
31,890 |
0 |
31,890 |
| Craft and Related Trades Workers |
2,634 |
0 |
2,634 |
548,408 |
826 |
549,234 |
551,042 |
826 |
551,868 |
| Plant and Machine Operators And Assemblers |
1,619 |
0 |
1,619 |
285,612 |
254 |
285,866 |
287,231 |
254 |
287,485 |
| Elementary Occupations |
1,036 |
439 |
1,475 |
206,438 |
90,216 |
296,654 |
207,474 |
90,655 |
298,129 |
| Total |
73,592 |
50,698 |
124,290 |
1,725,804 |
329,839 |
2,055,643 |
1,799,396 |
380,537 |
2,179,933 |
Source: Annual Bulletin of Labour Force Sample Survey 2023
ANNEXED NOTE
1. Technical Notes and Definitions
The data is taken from Labour Force Survey 2023 (yearly synthesis)
Sampling frame : Population Census 2020.
Sample size: 65,253 persons, in 10,560 households: 1- Qatari households; 2- Non-Qatari regular (non-collective) households;
3- Non-Qatari small collective households or labour gatherings (2 – 6 persons); 4- Non-Qatari large collective households or large labour gatherings (7 persons or more).
The collective households are a group of persons not related to each other and sharing living conditions in a residential unit, I.e. labour camps, students living boarding
schools, nurses in hospitals… etc. The survey covered the small collective households (includes less than 7 persons) and large collective households (includes 7 persons or more).
Data Collection: The sample was divided into equal parts to collect data monthly. Each month 1/3 of the quarterly data were collected during the first two weeks of the month.
Reference period for the labour force data: the week prior to data collection day.
The survey did not cover short periods accommodation, i.e. hotels.
The present data includes active population, i.e. employed and unemployed. It does not include persons seeking work for the first time
Classifications used: ISCO-88.
2. Institution which provides data
Planning and Statistics Authority / National Planning Council
https://www.psa.gov.qa/en/Pages/default.aspx
3. Data availability
Labour Force Surveys (yearly and quarterly data) can be downloaded from PSA’s website, “Labor Force” section, in PDF and Excel format:
https://www.psa.gov.qa/en/statistics1/pages/topicslisting.aspx?parent=Social&child=LaborForce
Date of access: November 2024.
GLMM and GRC cannot guarantee that the link to access the source will not change;
that the information will not be removed from the website it was obtained from;
that no geo-blockages will be imposed; or that the information will not be available for any another reason.
Keywords: Qatar, Labour Market, Employment, National & Foreign Labour, National Labour, Foreign Labour, Highly-Skilled Labour, Low-Skilled Labour
|
Qataris |
Non-Qataris |
Total |
|
Males |
Females |
Total |
Males |
Females |
Total |
Males |
Females |
Total |
| Government Department |
52,425 |
34,662 |
87,087 |
59,496 |
18,207 |
77,703 |
111,921 |
52,869 |
164,790 |
| Government Company/ Corporation |
8,062 |
6,802 |
14,864 |
45,622 |
18,018 |
63,640 |
53,684 |
24,820 |
78,504 |
| Mixed |
5,906 |
4,580 |
10,486 |
23,155 |
3,874 |
27,029 |
29,061 |
8,454 |
37,515 |
| Private |
6,509 |
4,215 |
10,724 |
1,524,920 |
186,051 |
1,710,971 |
1,531,429 |
190,266 |
1,721,695 |
Diplomatic/International/
Regional |
313 |
111 |
424 |
4,699 |
2,255 |
6,954 |
5,012 |
2,366 |
7,378 |
| Non profit |
377 |
328 |
705 |
1,717 |
365 |
2,082 |
2,094 |
693 |
2,787 |
| Domestic |
0 |
0 |
0 |
66,195 |
101,069 |
167,264 |
66,195 |
101,069 |
167,264 |
| Total |
73,592 |
50,698 |
124,290 |
1,725,804 |
329,839 |
2,055,643 |
1,799,396 |
380,537 |
2,179,933 |
Source: Annual Bulletin of Labour Force Sample Survey 2023
ANNEXED NOTE
1. Technical Notes and Definitions
The data is taken from Labour Force Survey 2023 (yearly synthesis)
Sampling frame : Population Census 2020.
Sample size: 65,253 persons, in 10,560 households: 1- Qatari households; 2- Non-Qatari regular (non-collective) households;
3- Non-Qatari small collective households or labour gatherings (2 – 6 persons); 4- Non-Qatari large collective households or large labour gatherings (7 persons or more).
The collective households are a group of persons not related to each other and sharing living conditions in a residential unit, I.e. labour camps, students living boarding
schools, nurses in hospitals… etc. The survey covered the small collective households (includes less than 7 persons) and large collective households (includes 7 persons or more).
Data Collection: The sample was divided into equal parts to collect data monthly. Each month 1/3 of the quarterly data were collected during the first two weeks of the month.
Reference period for the labour force data: the week prior to data collection day.
The survey did not cover short periods accommodation, i.e. hotels.
The present data includes the active population, i.e. employed and unemployed. It does not include persons seeking work for the first time
Definition of sectors of activity:
a) Governmental department: Government bodies engaged in administrative or service activities, such as ministries, public schools, public health centers, and hospitals.
b) Government corporation/company: Companies engaged in productive activities whose capital is entirely owned by government, such as Central Bank of Qatar, Qatar Petroleum.
c) Private: Establishments owned by individuals or a group of individuals either Qatari nationals or non-Qataris, whether natural or legal personalities.
d) Mixed: Establishments in which the government shares capital with another party, whether national (such as Qatar National Bank) or foreign (such as Gulf Air Corporation).
e) Diplomatic/International/Regional: Establishments engaged in diplomatic or consulate activities on behalf of other countries or those belonging to regional or international organizations.
f) Domestic sector: Includes all those working in a household for a salary, either males or females, such as housemaids, cooks, drivers, and gardeners.
2. Institution which provides data
Planning and Statistics Authority/ National Planning Council
https://www.psa.gov.qa/en/Pages/default.aspx
3. Data availability
Labour Force Surveys (yearly and quarterly data) can be downloaded from PSA’s website, section “Labor Force”, in PDF and Excel format:
https://www.psa.gov.qa/en/statistics1/pages/topicslisting.aspx?parent=Social&child=LaborForce
Date of access: November 2024.
GLMM and GRC cannot guarantee that the link to access the source will not change;
that the information will not be removed from the website it was obtained from;
that no geo-blockages will be imposed; or that the information will not be available for any another reason.
Keywords: Qatar, Labour Market, Employment, Female Employment, National & Foreign Labour, National Labour, Foreign Labour, Domestic Workerstion
| |
Bahrain |
Kuwait* |
Oman |
Qatar |
Saudi Arabia |
UAE |
| 2010 |
570,687 |
1,148,363 |
1,957,336 |
N.A. |
14,046,164 |
N.A. |
| 2011 |
584,688 |
1,183,185 |
2,013,158 |
N.A. |
14,342,129 |
N.A. |
| 2012 |
599,629 |
1,212,436 |
2,092,560 |
N.A. |
14,683,546 |
N.A. |
| 2013 |
614,830 |
1,242,499 |
2,172,002 |
N.A. |
15,079,401 |
N.A. |
| 2014 |
630,744 |
1,275,857 |
2,260,705 |
N.A. |
15,535,036 |
N.A. |
| 2015 |
647,835 |
1,307,605 |
2,344,646 |
N.A. |
15,968,071 |
N.A. |
| 2016 |
664,707 |
1,337,693 |
2,427,825 |
N.A. |
16,355,312 |
N.A. |
| 2017 |
677,506 |
1,370,013 |
2,505,369 |
N.A. |
16,696,980 |
N.A. |
| 2018 |
689,714 |
1,403,113 |
2,579,236 |
N.A. |
17,085,636 |
N.A. |
| 2019 |
701,827 |
1,432,045 |
2,655,453 |
N.A. |
17,507,171 |
N.A. |
| 2020 |
713,263 |
1,459,970 |
2,735,966 |
N.A. |
17,978,587 |
N.A. |
| 2021 |
719,741 |
1,488,716 |
2,804,117 |
N.A. |
18,380,669 |
N.A. |
| 2022 |
721,657 |
1,517,076 |
2,833,715 |
N.A. |
18,792,262 |
N.A. |
| 2023 |
727,352 |
1,545,781 |
2,891,988 |
N.A. |
N.A. |
N.A. |
*: end of year figures
N.A.: No data available as of 4 October 2024.
Sources:
(1) Bahrain: for detailed sources and metadata please visit:
https://gulfmigration.grc.net/bahrain-population-estimates-by-nationality-bahraini-non-bahraini-mid-year-estimates-1991-2023/
(2) Kuwait: for detailed sources and metadata please visit:
https://gulfmigration.grc.net/kuwait-population-by-nationality-kuwaiti-non-kuwaiti-and-sex-1990-2023/
(3) Oman: for detailed sources and metadata please visit:
https://gulfmigration.grc.net/oman-population-by-nationality-omani-non-omani-2000-2023/
(4) Qatar: No population data broken down by nationality.
(5) Saudi Arabia: for detailed sources and metadata please visit:
https://gulfmigration.grc.net/saudi-arabia-population-by-nationality-saudi-non-saudi-2010-2022-data-adjusted-by-census-2022/
(6) UAE: No population data broken down by nationality.
Last date of access: 4 October 2024.
GLMM and GRC cannot guarantee that the link to access the source will not change;
that the information will not be removed from the website it was obtained from;
that no geo-blockages will be imposed; or that the information will not be available for any another reason.
| |
Bahrain |
Kuwait |
Oman |
Qatar |
Saudi Arabia |
UAE |
| 2010 |
1,228,543 |
3,582,054 |
2,773,479 |
1,715,098 |
23,978,487 |
6,965,488 |
| 2011 |
1,195,020 |
3,697,292 |
3,295,298 |
1,732,717 |
25,091,867 |
7,243,588 |
| 2012 |
1,208,964 |
3,823,728 |
3,623,001 |
1,832,903 |
26,168,861 |
7,539,307 |
| 2013 |
1,253,191 |
3,965,144 |
3,855,206 |
2,003,700 |
27,624,004 |
7,846,755 |
| 2014 |
1,314,562 |
4,091,993 |
3,992,893 |
2,216,180 |
28,309,273 |
8,272,124 |
| 2015 |
1,370,322 |
4,239,006 |
4,159,102 |
2,437,790 |
29,816,382 |
8,738,350 |
| 2016 |
1,423,726 |
4,411,124 |
4,414,051 |
2,617,634 |
30,954,198 |
9,131,839 |
| 2017 |
1,501,116 |
4,500,476 |
4,559,963 |
2,724,606 |
30,977,355 |
9,314,611 |
| 2018 |
1,503,091 |
4,621,638 |
4,601,706 |
2,760,170 |
30,196,281 |
9,378,791 |
| 2019 |
1,483,756 |
4,776,407 |
4,618,268 |
2,799,202 |
30,063,799 |
9,512,778 |
| 2020 |
1,472,204 |
4,670,713 |
4,481,042 |
2,833,679 |
31,552,510 |
9,289,297 |
| 2021 |
1,504,365 |
4,385,717 |
4,527,446 |
2,748,162 |
30,784,383 |
9,861,007 |
| 2022 |
1,557,182 |
4,793,568 |
4,728,372 |
2,932,241 |
32,175,224 |
10,288,946 |
| 2023 |
1,577,059 |
4,913,271 |
4,527,446 |
3,063,005 |
N.A. |
10,678,556 |
*: end of year figures
N.A.: No data available as of 4 October 2024.
Sources:
(1) Bahrain: for detailed sources and metadata please visit:
https://gulfmigration.grc.net/bahrain-population-estimates-by-nationality-bahraini-non-bahraini-mid-year-estimates-1991-2023/
(2) Kuwait: for detailed sources and metadata please visit:
https://gulfmigration.grc.net/kuwait-population-by-nationality-kuwaiti-non-kuwaiti-and-sex-1990-2023/
(3) Oman: for detailed sources and metadata please visit:
https://gulfmigration.grc.net/oman-population-by-nationality-omani-non-omani-2000-2023/
(4) Qatar: for detailed sources and metadata please visit:
https://gulfmigration.grc.net/qatar-estimates-of-total-population-by-sex-and-annual-demographic-growth-rates-1986-2023/
(5) Saudi Arabia: for detailed sources and metadata please visit:
https://gulfmigration.grc.net/saudi-arabia-population-by-nationality-saudi-non-saudi-2010-2022-data-adjusted-by-census-2022/
(6) UAE: No population data broken down by nationality.
https://gulfmigration.grc.net/uae-total-population-residing-in-the-uae-by-sex-2000-2023/
Last date of access: 4 October 2024.
GLMM and GRC cannot guarantee that the link to access the source will not change;
that the information will not be removed from the website it was obtained from;
that no geo-blockages will be imposed; or that the information will not be available for any another reason.
| |
Bahrain |
Kuwait* |
Oman |
Qatar |
Saudi Arabia |
UAE |
| 2010 |
657,856 |
2,433,691 |
816,143 |
N.A. |
9,932,323 |
N.A. |
| 2011 |
610,332 |
2,514,107 |
1,282,140 |
N.A. |
10,749,738 |
N.A. |
| 2012 |
609,335 |
2,611,292 |
1,530,441 |
N.A. |
11,485,315 |
N.A. |
| 2013 |
638,361 |
2,722,645 |
1,683,204 |
N.A. |
12,544,603 |
N.A. |
| 2014 |
683,818 |
2,816,136 |
1,732,188 |
N.A. |
12,774,237 |
N.A. |
| 2015 |
722,487 |
2,931,401 |
1,814,456 |
N.A. |
13,848,311 |
N.A. |
| 2016 |
759,019 |
3,073,431 |
1,986,226 |
N.A. |
14,598,886 |
N.A. |
| 2017 |
823,610 |
3,130,463 |
2,054,594 |
N.A. |
14,280,375 |
N.A. |
| 2018 |
813,377 |
3,218,525 |
2,022,470 |
N.A. |
13,110,645 |
N.A. |
| 2019 |
781,929 |
3,344,362 |
1,962,815 |
N.A. |
12,556,628 |
N.A. |
| 2020 |
758,941 |
3,210,743 |
1,745,076 |
N.A. |
13,573,923 |
N.A. |
| 2021 |
784,624 |
2,897,001 |
1,723,329 |
N.A. |
12,403,714 |
N.A. |
| 2022 |
835,525 |
3,276,492 |
1,894,657 |
N.A. |
13,382,962 |
N.A. |
| 2023 |
849,707 |
3,367,490 |
2,168,238 |
N.A. |
N.A. |
N.A. |
*: end of year figures
N.A.: No data available as of 4 October 2024.
Sources:
(1) Bahrain: for detailed sources and metadata please visit:
https://gulfmigration.grc.net/bahrain-population-estimates-by-nationality-bahraini-non-bahraini-mid-year-estimates-1991-2023/
(2) Kuwait: for detailed sources and metadata please visit:
https://gulfmigration.grc.net/kuwait-population-by-nationality-kuwaiti-non-kuwaiti-and-sex-1990-2023/
(3) Oman: for detailed sources and metadata please visit:
https://gulfmigration.grc.net/oman-population-by-nationality-omani-non-omani-2000-2023/
(4) Qatar: No population data broken down by nationality.
(5) Saudi Arabia: for detailed sources and metadata please visit:
https://gulfmigration.grc.net/saudi-arabia-population-by-nationality-saudi-non-saudi-2010-2022-data-adjusted-by-census-2022/
(6) UAE: No population data broken down by nationality.
Last date of access: 4 October 2024.
GLMM and GRC cannot guarantee that the link to access the source will not change;
that the information will not be removed from the website it was obtained from;
that no geo-blockages will be imposed; or that the information will not be available for any another reason.
| |
|
Kuwaitis |
|
|
Non-Kuwaitis |
|
|
Total |
|
| Year |
Male |
Female |
Total |
Male |
Female |
Total |
Male |
Female |
Total |
| 1990 |
286,299 |
292,212 |
578,511 |
944,585 |
628,584 |
1,573,169 |
1,230,884 |
920,796 |
2,151,680 |
| 1993 |
325,892 |
331,601 |
657,493 |
682,161 |
305,973 |
988,134 |
1,008,053 |
637,574 |
1,645,627 |
| 1995 |
351,314 |
356,801 |
708,115 |
841,320 |
409,359 |
1,250,679 |
1,192,634 |
766,160 |
1,958,794 |
| 1996 |
363,476 |
368,927 |
732,403 |
914,327 |
447,159 |
1,361,486 |
1,277,803 |
816,086 |
2,093,889 |
| 1997 |
n.a. |
n.a. |
n.a. |
n.a. |
n.a. |
n.a. |
n.a. |
n.a. |
n.a. |
| 1998 |
388,687 |
397,323 |
786,010 |
1,002,718 |
482,137 |
1,484,855 |
1,391,405 |
879,460 |
2,270,865 |
| 1999 |
401,433 |
410,822 |
812,255 |
970,865 |
471,834 |
1,442,699 |
1,372,298 |
882,656 |
2,254,954 |
| 2000 |
415,613 |
426,177 |
841,790 |
927,023 |
448,445 |
1,375,468 |
1,342,636 |
874,622 |
2,217,258 |
| 2001 |
429,209 |
441,074 |
870,283 |
960,390 |
478,429 |
1,438,819 |
1,389,599 |
919,503 |
2,309,102 |
| 2002 |
442,310 |
455,975 |
898,285 |
1,020,913 |
500,730 |
1,521,643 |
1,463,223 |
956,705 |
2,419,928 |
| 2003 |
456,226 |
471,460 |
927,686 |
1,098,878 |
520,120 |
1,618,998 |
1,555,104 |
991,580 |
2,546,684 |
| 2004 |
469,327 |
486,907 |
956,234 |
1,240,267 |
557,155 |
1,797,422 |
1,709,594 |
1,044,062 |
2,753,656 |
| 2005 |
486,089 |
506,128 |
992,217 |
1,391,322 |
607,650 |
1,998,972 |
1,877,411 |
1,113,778 |
2,991,189 |
| 2006 |
501,148 |
522,168 |
1,023,316 |
1,510,818 |
648,826 |
2,159,644 |
2,011,966 |
1,170,994 |
3,182,960 |
| 2007 |
516,631 |
537,966 |
1,054,597 |
1,615,273 |
729,767 |
2,345,040 |
2,131,904 |
1,267,733 |
3,399,637 |
| 2008 |
532,566 |
554,985 |
1,087,551 |
1,618,766 |
735,496 |
2,354,262 |
2,151,332 |
1,290,481 |
3,441,813 |
| 2009 |
548,290 |
570,620 |
1,118,910 |
1,591,935 |
774,036 |
2,365,971 |
2,140,225 |
1,344,656 |
3,484,881 |
| 2010 |
563,631 |
584,712 |
1,148,343 |
1,586,716 |
846,995 |
2,433,711 |
2,150,347 |
1,431,707 |
3,582,054 |
| 2011 |
580,558 |
602,616 |
1,183,174 |
1,641,135 |
872,983 |
2,514,118 |
2,221,693 |
1,475,599 |
3,697,292 |
| 2012 |
595,365 |
617,071 |
1,212,436 |
1,705,468 |
905,824 |
2,611,292 |
2,300,833 |
1,522,895 |
3,823,728 |
| 2013 |
610,545 |
631,954 |
1,242,499 |
1,772,413 |
950,232 |
2,722,645 |
2,382,958 |
1,582,186 |
3,965,144 |
| 2014 |
626,256 |
649,601 |
1,275,857 |
1,855,279 |
960,857 |
2,816,136 |
2,481,535 |
1,610,458 |
4,091,993 |
| 2015 |
641,282 |
666,323 |
1,307,605 |
1,964,264 |
967,137 |
2,931,401 |
2,605,546 |
1,633,460 |
4,239,006 |
| 2016 |
656,084 |
681,609 |
1,337,693 |
2,089,302 |
984,129 |
3,073,431 |
2,745,386 |
1,665,738 |
4,411,124 |
| 2017 |
671,012 |
699,001 |
1,370,013 |
2,167,409 |
963,054 |
3,130,463 |
2,838,421 |
1,662,055 |
4,500,476 |
| 2018 |
686,475 |
716,638 |
1,403,113 |
2,253,768 |
964,757 |
3,218,525 |
2,940,243 |
1,681,395 |
4,621,638 |
| 2019 |
700,742 |
731,303 |
1,432,045 |
2,303,549 |
1,040,813 |
3,344,362 |
3,004,291 |
1,772,116 |
4,776,407 |
| 2020 |
714,936 |
745,034 |
1,459,970 |
2,177,731 |
1,033,012 |
3,210,743 |
2,892,667 |
1,778,046 |
4,670,713 |
| 2021 |
729,638 |
759,078 |
1,488,716 |
1,941,628 |
955,373 |
2,897,001 |
2,671,266 |
1,714,451 |
4,385,717 |
| 2022 |
744,238 |
772,838 |
1,517,076 |
2,188,819 |
1,087,673 |
3,276,492 |
2,933,057 |
1,860,511 |
4,793,568 |
| 2023 |
758,716 |
787,065 |
1,545,781 |
2,262,500 |
1,104,990 |
3,367,490 |
3,021,216 |
1,892,055 |
4,913,271 |
Source: PACI and CSB
ANNEXED NOTE
1. Characteristics of data and definitions
1990-2020: The source of data used is the Public Authority for Civil Information (PACI), an independant government body in charge of :
1- centralising all population and labour force data in order to manage a fully computerised population register
2- issuing mandatory civil identification cards to every resident of the country, regardless of age and nationality.
The other source of demographic and socioeconomic data on Kuwait is the Central Statistical Office (CSO), operating within the Planning Ministry. The CSO has conducted ten population and housing censuses since its inception in 1957.
PACI’s records of residents’ movements is thus regularly updated, which limits the risk of population overcount. Therefore, it is more likely that residents were undercounted during CSO- Ministry of Planning’s census operations (see: Shah, N. Population of Kuwait. Structure and Dynamics, Kuwait: Kuwait University Academic Publication Council, 2010, chapter 1).
(a) Kuwaiti: the Kuwaiti nationality rests upon a document of Kuwaiti nationality or a certificate proving Kuwaiti nationality issued by the Ministry of Interior of Kuwait.
(b) Non-Kuwaiti: his/ her nationality is determined by the name of the State which issued the passport. The foreign national also entered Kuwait legally and has a stamp of residence.
This category includes the Bidoon, a category of stateless persons living in the Emirate. Kuwait’s Bidoon population originates from three broad categories:
1) those whose ancestors failed to apply for nationality or lacked necessary documentation at the time of Kuwait’s independence in 1961;
2) those recruited to work in Kuwait’s army or police force during the 1960s who permanently settled in Kuwait, along with their families;
3) children of Kuwaiti mothers and stateless or foreign fathers (see Human Rights Watch. Prisoners of the Past. Kuwaiti Bidun and the Burden of Statelessness, June 2011, p. 3).
(The children of Kuwaiti mothers and non-Kuwaiti fathers (with specific nationality) inherit the father’s nationality. They are stateless if the father is stateless).
2021: census data. 2021 census was conducted based on administrative sourcess.
https://census.csb.gov.kw/index_EN
https://census.csb.gov.kw/
2021- : CSB publishes population and other statistics, based on the results of census 2021.
Estimates of Kuwaiti population are based on natural increase (births-deaths) during the year.
Estimates of non-Kuwaiti population are based on natural increase, arrival and departures during the year.
Date of reference: end of year.
2. Institution which provides data
The Public Authority for Civil Information (PACI)
https://www.csb.gov.kw/Default
3. Period of data coverage: 31 December
The database is updated twice a year and the website presents only the most recent data.
4. Data availability
1990-2019: The statistics section of PACI’s website
http://www.paci.gov.kw/en/
http://www.paci.gov.kw/
provides population and socio-economic data broken down by nationality (Kuwaiti/ non-Kuwaiti). Some data are displayed by nationality groups.
Analytical tables and data crosstabulations are available for download in PDF, html, .png and Excel (.csv) formats.
PACI website and statistics has been inaccessible from outside Kuwait since 2019.
2021- : Central Statistical Bureau (CSB)
https://www.csb.gov.kw/Default
Section “Statistics and Bulletins”; “Population Statistics”; and “Population estimates”
https://www.csb.gov.kw/Pages/Statistics_en?ID=67&ParentCatID=1
Population estimates are also available in CBS Annual Statistical Abstracts (section “General Statistics”)
https://www.csb.gov.kw/Pages/Statistics_en.aspx?ID=18&ParentCatID=2
Date of access: October 2024.
GLMM and GRC cannot guarantee that the link to access the source will not change;
that the information will not be removed from the website it was obtained from;
that no geo-blockages will be imposed; or that the information will not be available for any another reason.
Keywords: Kuwait, National Population, Foreign Population
| Year |
Kuwaitis |
Non-Kuwaitis |
Total |
| 1990 |
578,511 |
1,573,169 |
2,151,680 |
| 1993 |
657,493 |
988,134 |
1,645,627 |
| 1995 |
708,115 |
1,250,679 |
1,958,794 |
| 1996 |
732,403 |
1,361,486 |
2,093,889 |
| 1998 |
786,010 |
1,484,855 |
2,270,865 |
| 1999 |
812,255 |
1,442,699 |
2,254,954 |
| 2000 |
841,790 |
1,375,468 |
2,217,258 |
| 2001 |
870,283 |
1,438,819 |
2,309,102 |
| 2002 |
898,285 |
1,521,643 |
2,419,928 |
| 2003 |
927,686 |
1,618,998 |
2,546,684 |
| 2004 |
956,234 |
1,797,422 |
2,753,656 |
| 2005 |
992,217 |
1,998,972 |
2,991,189 |
| 2006 |
1,023,316 |
2,159,644 |
3,182,960 |
| 2007 |
1,054,598 |
2,345,039 |
3,399,637 |
| 2008 |
1,087,552 |
2,354,261 |
3,441,813 |
| 2009 |
1,118,911 |
2,365,970 |
3,484,881 |
| 2010 |
1,148,363 |
2,433,691 |
3,582,054 |
| 2011 |
1,183,185 |
2,514,107 |
3,697,292 |
| 2012 |
1,212,436 |
2,611,292 |
3,823,728 |
| 2013 |
1,242,499 |
2,722,645 |
3,965,144 |
| 2014 |
1,275,857 |
2,816,136 |
4,091,993 |
| 2015 |
1,307,605 |
2,931,401 |
4,239,006 |
| 2016 |
1,337,693 |
3,073,431 |
4,411,124 |
| 2017 |
1,370,013 |
3,130,463 |
4,500,476 |
| 2018 |
1,403,113 |
3,218,525 |
4,621,638 |
| 2019 |
1,432,045 |
3,344,362 |
4,776,407 |
| 2020 |
1,459,970 |
3,210,743 |
4,670,713 |
| 2021 |
1,488,716 |
2,897,001 |
4,385,717 |
| 2022 |
1,517,076 |
3,276,492 |
4,793,568 |
| 2023 |
1,545,781 |
3,367,490 |
4,913,271 |
Source: PACI and CSB
ANNEXED NOTE
1. Characteristics of data and definitions
1990-2020: The source of data used is the Public Authority for Civil Information (PACI), an independant government body in charge of :
1- centralising all population and labour force data in order to manage a fully computerised population register
2- issuing mandatory civil identification cards to every resident of the country, regardless of age and nationality.
The other source of demographic and socioeconomic data on Kuwait is the Central Statistical Office (CSO), operating within the Planning Ministry. The CSO has conducted ten population and housing censuses since its inception in 1957.
PACI’s records of residents’ movements is thus regularly updated, which limits the risk of population overcount. Therefore, it is more likely that residents were undercounted during CSO- Ministry of Planning’s census operations (see: Shah, N. Population of Kuwait. Structure and Dynamics, Kuwait: Kuwait University Academic Publication Council, 2010, chapter 1).
(a) Kuwaiti: the Kuwaiti nationality rests upon a document of Kuwaiti nationality or a certificate proving Kuwaiti nationality issued by the Ministry of Interior of Kuwait.
(b) Non-Kuwaiti: his/ her nationality is determined by the name of the State which issued the passport. The foreign national also entered Kuwait legally and has a stamp of residence.
This category includes the Bidoon, a category of stateless persons living in the Emirate. Kuwait’s Bidoon population originates from three broad categories:
1) those whose ancestors failed to apply for nationality or lacked necessary documentation at the time of Kuwait’s independence in 1961;
2) those recruited to work in Kuwait’s army or police force during the 1960s who permanently settled in Kuwait, along with their families;
3) children of Kuwaiti mothers and stateless or foreign fathers (see Human Rights Watch. Prisoners of the Past. Kuwaiti Bidun and the Burden of Statelessness, June 2011, p. 3).
(The children of Kuwaiti mothers and non-Kuwaiti fathers (with specific nationality) inherit the father’s nationality. They are stateless if the father is stateless).
2021: census data. 2021 census was conducted based on administrative sourcess.
https://census.csb.gov.kw/index_EN
https://census.csb.gov.kw/
2021- : CSB publishes population and other statistics, based on the results of census 2021.
Estimates of Kuwaiti population are based on natural increase (births-deaths) during the year.
Estimates of non-Kuwaiti population are based on natural increase, arrival and departures during the year.
Date of reference: end of year.
2. Institution which provides data
The Public Authority for Civil Information (PACI)
https://www.csb.gov.kw/Default
3. Period of data coverage: 31 December
The database is updated twice a year and the website presents only the most recent data.
3. Data availability
1990-2019: The statistics section of PACI’s website
http://www.paci.gov.kw/en/
http://www.paci.gov.kw/
provides population and socio-economic data broken down by nationality (Kuwaiti/ non-Kuwaiti). Some data are displayed by nationality groups.
Analytical tables and data crosstabulations are available for download in PDF, html, .png and Excel (.csv) formats.
PACI website and statistics has been inaccessible from outside Kuwait since 2019.
2021- : Central Statistical Bureau (CSB)
https://www.csb.gov.kw/Default
Section “Statistics and Bulletins”; “Population Statistics”; and “Population estimates”
https://www.csb.gov.kw/Pages/Statistics_en?ID=67&ParentCatID=1
Population estimates are also available in CBS Annual Statistical Abstracts (section “General Statistics”)
https://www.csb.gov.kw/Pages/Statistics_en.aspx?ID=18&ParentCatID=2
Date of access: October 2024.
GLMM and GRC cannot guarantee that the link to access the source will not change;
that the information will not be removed from the website it was obtained from;
that no geo-blockages will be imposed; or that the information will not be available for any another reason.
Keywords: Kuwait, National Population, Foreign Population
| |
Total population |
Annual growth rates (%) |
| |
males |
females |
total |
males |
females |
total |
| 1986 |
250,328 |
123,067 |
373,395 |
|
|
|
| 1987 |
256,844 |
127,006 |
383,850 |
2.6 |
3.2 |
2.8 |
| 1988 |
263,958 |
131,251 |
395,209 |
2.7 |
3.3 |
2.9 |
| 1989 |
271,685 |
135,886 |
407,571 |
2.9 |
3.5 |
3.1 |
| 1990 |
279,800 |
140,979 |
420,779 |
2.9 |
3.7 |
3.2 |
| 1991 |
288,600 |
145,772 |
434,372 |
3.1 |
3.3 |
3.2 |
| 1992 |
297,992 |
150,579 |
448,571 |
3.2 |
3.2 |
3.2 |
| 1993 |
308,458 |
155,509 |
463,967 |
3.5 |
3.2 |
3.4 |
| 1994 |
319,379 |
160,951 |
480,330 |
3.5 |
3.4 |
3.5 |
| 1995 |
331,111 |
166,440 |
497,551 |
3.6 |
3.4 |
3.5 |
| 1996 |
343,472 |
172,104 |
515,576 |
3.7 |
3.3 |
3.6 |
| 1997 |
353,787 |
182,687 |
536,474 |
3.0 |
6.0 |
4.0 |
| 1998 |
370,742 |
190,248 |
560,990 |
4.7 |
4.1 |
4.5 |
| 1999 |
388,602 |
198,168 |
586,770 |
4.7 |
4.1 |
4.5 |
| 2000 |
407,148 |
206,821 |
613,969 |
4.7 |
4.3 |
4.5 |
| 2001 |
427,316 |
216,048 |
643,364 |
4.8 |
4.4 |
4.7 |
| 2002 |
450,351 |
226,147 |
676,498 |
5.3 |
4.6 |
5.0 |
| 2003 |
476,513 |
237,346 |
713,859 |
5.6 |
4.8 |
5.4 |
| 2004 |
546,116 |
251,943 |
798,059 |
13.6 |
6.0 |
11.1 |
| 2005 |
637,070 |
269,053 |
906,123 |
15.4 |
6.6 |
12.7 |
| 2006 |
754,298 |
288,649 |
1,042,947 |
16.9 |
7.0 |
14.1 |
| 2007 |
905,747 |
312,503 |
1,218,250 |
18.3 |
7.9 |
15.5 |
| 2008 |
1,111,176 |
337,303 |
1,448,479 |
20.4 |
7.6 |
17.3 |
| 2009 |
1,265,146 |
373,480 |
1,638,626 |
13.0 |
10.2 |
12.3 |
| 2010 |
1,296,110 |
414,988 |
1,715,098 |
2.4 |
10.5 |
4.6 |
| 2011 |
1,288,590 |
444,127 |
1,732,717 |
-0.6 |
6.8 |
1.0 |
| 2012 |
1,355,199 |
477,704 |
1,832,903 |
5.0 |
7.3 |
5.6 |
| 2013 |
1,477,632 |
526,068 |
2,003,700 |
8.6 |
9.6 |
8.9 |
| 2014 |
1,652,037 |
564,143 |
2,216,180 |
11.2 |
7.0 |
10.1 |
| 2015 |
1,840,643 |
597,147 |
2,437,790 |
10.8 |
5.7 |
9.5 |
| 2016 |
1,975,536 |
642,098 |
2,617,634 |
7.1 |
7.3 |
7.1 |
| 2017 |
2,046,047 |
678,559 |
2,724,606 |
3.5 |
5.5 |
4.0 |
| 2018 |
2,048,206 |
711,964 |
2,760,170 |
0.1 |
4.8 |
1.3 |
| 2019 |
2,064,276 |
734,926 |
2,799,202 |
0.8 |
3.2 |
1.4 |
| 2020 |
2,025,902 |
807,777 |
2,833,679 |
-1.9 |
9.5 |
1.2 |
| 2021 |
1,970,649 |
777,513 |
2,748,162 |
-2.8 |
-3.8 |
-3.1 |
| 2022 |
2,121,336 |
810,905 |
2,932,241 |
7.4 |
4.2 |
6.5 |
| 2023 |
2,206,546 |
856,459 |
3,063,005 |
11.3 |
9.7 |
10.8 |
Source: Planning and Statistics Authority (PSA)/ National Planning Council (NPC)
ANNEXED NOTE
1. Characteristics of data and definitions
The table provides intercensal estimates of Qatar’s total resident population (nationals and non-nationals) based on census results (1986; 1997; 2004; 2010, 2015 and 2020), civil registration of births and deaths, and registration of entries and exits Annual growth rates: author’s calculation.
2. Institution which provides data
Planning and Statistics Authority (PSA)/National Planning Council (NPC)
https://www.psa.gov.qa/en/Pages/default.aspx
3. Period of data coverage:
mid-year estimates, given years.
3. Data availability
The population data is available in the Population and Social Statistics Bulletin (Annual issues).
https://www.psa.gov.qa/en/statistics1/pages/topicslisting.aspx?parent=Population&child=Population
Date of access: October 2024.
GLMM and GRC cannot guarantee that the link to access the source will not change;
that the information will not be removed from the website it was obtained from;
that no geo-blockages will be imposed; or that the information will not be available for any another reason.
Keywords: Qatar, Foreign & National Populations
| |
Bahrainis |
Non-Bahrainis |
Total |
| |
Males |
Females |
Total |
Males |
Females |
Total |
Males |
Females |
Total |
| 2012: Q1 |
68,188 |
25,387 |
93,575 |
343,077 |
24,236 |
367,313 |
411,265 |
49,623 |
460,888 |
| Q2 |
68,341 |
25,365 |
93,706 |
348,529 |
24,555 |
373,084 |
416,870 |
49,920 |
466,790 |
| Q3 |
68,667 |
25,236 |
93,903 |
354,842 |
25,159 |
380,001 |
423,509 |
50,395 |
473,904 |
| Q4 |
68,880 |
25,616 |
94,496 |
359,051 |
25,726 |
384,777 |
427,931 |
51,342 |
479,273 |
| 2013: Q1 |
69,070 |
25,863 |
94,933 |
366,052 |
26,335 |
392,387 |
435,122 |
52,198 |
487,320 |
| Q2 |
69,517 |
26,193 |
95,710 |
372,914 |
27,213 |
400,127 |
442,431 |
53,406 |
495,837 |
| Q3 |
69,139 |
26,091 |
95,230 |
374,824 |
28,178 |
403,002 |
443,963 |
54,269 |
498,232 |
| Q4 |
69,354 |
26,254 |
95,608 |
371,669 |
28,813 |
400,482 |
441,023 |
55,067 |
496,090 |
| 2014: Q1 |
69,738 |
26,799 |
96,537 |
363,777 |
29,012 |
392,789 |
433,515 |
55,811 |
489,326 |
| Q2 |
70,473 |
27,321 |
97,794 |
367,074 |
29,504 |
396,578 |
437,547 |
56,825 |
494,372 |
| Q3 |
70,707 |
27,651 |
98,358 |
374,080 |
30,383 |
404,463 |
444,787 |
58,034 |
502,821 |
| Q4 |
70,929 |
28,290 |
99,219 |
381,579 |
31,278 |
412,857 |
452,508 |
59,568 |
512,076 |
| 2015: Q1 |
70,833 |
28,535 |
99,368 |
387,580 |
31,973 |
419,553 |
458,413 |
60,508 |
518,921 |
| Q2 |
71,833 |
29,367 |
101,200 |
398,596 |
32,945 |
431,541 |
470,429 |
62,312 |
532,741 |
| Q3 |
71,413 |
29,598 |
101,011 |
404,240 |
33,549 |
437,789 |
475,653 |
63,147 |
538,800 |
| Q4 |
71,170 |
30,028 |
101,198 |
411,093 |
34,281 |
445,374 |
482,263 |
64,309 |
546,572 |
| 2016: Q1 |
73,032 |
31,419 |
104,451 |
426,335 |
34,804 |
461,139 |
499,367 |
66,223 |
565,590 |
| Q2 |
72,398 |
31,139 |
103,537 |
439,707 |
34,411 |
474,118 |
512,105 |
65,550 |
577,655 |
| Q3 |
71,215 |
30,738 |
101,953 |
456,478 |
35,004 |
491,482 |
527,693 |
65,742 |
593,435 |
| Q4 |
71,235 |
30,932 |
102,167 |
473,169 |
35,893 |
509,062 |
544,404 |
66,825 |
611,229 |
| 2017: Q1 |
71,152 |
30,911 |
102,063 |
464,698 |
36,395 |
501,093 |
535,850 |
67,306 |
603,156 |
| Q2 |
71,301 |
31,160 |
102,461 |
459,601 |
36,815 |
496,416 |
530,902 |
67,975 |
598,877 |
| Q3 |
71,629 |
31,474 |
103,103 |
457,842 |
37,602 |
495,444 |
529,471 |
69,076 |
598,547 |
| Q4 |
71,830 |
31,972 |
103,802 |
457,024 |
38,888 |
495,912 |
528,854 |
70,860 |
599,714 |
| 2018: Q1 |
71,972 |
32,427 |
104,399 |
459,437 |
39,504 |
498,941 |
531,409 |
71,931 |
603,340 |
| Q2 |
72,129 |
32,753 |
104,882 |
459,851 |
40,028 |
499,879 |
531,980 |
72,781 |
604,761 |
| Q3 |
71,887 |
32,612 |
104,499 |
456,824 |
40,446 |
497,270 |
528,711 |
73,058 |
601,769 |
| Q4 |
72,023 |
33,191 |
105,214 |
461,656 |
41,350 |
503,006 |
533,679 |
74,541 |
608,220 |
| 2019: Q1 |
71,473 |
33,188 |
104,661 |
459,754 |
41,887 |
501,641 |
531,227 |
75,075 |
606,302 |
| Q2 |
72,533 |
33,858 |
106,391 |
456,923 |
42,204 |
499,127 |
529,456 |
76,062 |
605,518 |
| Q3 |
72,683 |
34,099 |
106,782 |
455,517 |
42,774 |
498,291 |
528,200 |
76,873 |
605,073 |
| Q4 |
72,545 |
34,280 |
106,825 |
455,867 |
43,132 |
498,999 |
528,412 |
77,412 |
605,824 |
| 2020: Q1 |
73,889 |
35,422 |
109,311 |
451,797 |
42,688 |
494,485 |
525,686 |
78,110 |
603,796 |
| Q2 |
73,724 |
35,298 |
109,022 |
451,041 |
41,332 |
492,373 |
524,765 |
76,630 |
601,395 |
| Q3 |
71,747 |
34,260 |
106,007 |
428,374 |
39,683 |
468,057 |
500,121 |
73,943 |
574,064 |
| Q4 |
71,015 |
33,670 |
104,685 |
421,048 |
38,974 |
460,022 |
492,063 |
72,644 |
564,707 |
| 2021: Q1 |
71,716 |
34,043 |
105,759 |
418,434 |
38,901 |
457,335 |
490,150 |
72,944 |
563,094 |
| Q2 |
73,068 |
34,550 |
107,618 |
412,871 |
39,163 |
452,034 |
485,939 |
73,713 |
559,652 |
| Q3 |
73,073 |
34,459 |
107,532 |
398,408 |
39,026 |
437,434 |
471,481 |
73,485 |
544,966 |
| Q4 |
73,892 |
35,486 |
109,378 |
408,298 |
40,187 |
448,485 |
482,190 |
75,673 |
557,863 |
| 2022: Q1 |
74,588 |
36,019 |
110,607 |
423,724 |
41,524 |
465,248 |
498,312 |
77,543 |
575,855 |
| Q2 |
75,352 |
36,613 |
111,965 |
436,480 |
43,002 |
479,482 |
511,832 |
79,615 |
591,447 |
| Q3 |
75,241 |
36,610 |
111,851 |
445,286 |
44,120 |
489,406 |
520,527 |
80,730 |
601,257 |
| Q4 |
76,115 |
37,114 |
113,229 |
450,676 |
45,642 |
496,318 |
526,791 |
82,756 |
609,547 |
| 2023: Q1 |
75,138 |
36,751 |
111,889 |
470,279 |
47,349 |
517,628 |
545,417 |
84,100 |
629,517 |
| Q2 |
74,886 |
36,783 |
111,669 |
473,578 |
48,389 |
521,967 |
548,464 |
85,172 |
633,636 |
Source: BLMI, Labour Market Regulation Authority (LMRA)
ANNEXED NOTE
1. Technical Notes and Definitions
Data are extracted from the files submitted by Expatriate Management System (LMRA-EMS), General Organisation for Social Insurance (GOSI), Pension Fund Commission (PFC), and Civil Service Bureau (CSB) monthly data files to LMRA.Estimates of employed population include all civilian employed persons in the private and public sectors (insured, uninsured and self-employed) and domestic workers.
LMRA data do not include non-civilian employees (engaged in military, defense and other relevant entities and ranked as so).
1. From 2008 Q2 onward, “Public sector” for non-Bahraini workers refers to workers in the “Government sector” of the Expatriate Management System (EMS) of LMRA.
2. “Private Sector” for non-Bahraini workers refers to the sum of “Commercial” and “Non-Commercial, Non-Government” (NCNG) sectors of LMRA’s EMS system.
3. Male population includes persons with unrecorded sex attribute.
4. Details may not add up to totals due to rounding error. Also, data from this table may differ from totals obtained from other tables in the series (Tables A1, A2, A06, A07, A10 and A99).
5. The drop in number of domestic workers in Q2 2018 is due to data cleansing of domestic records during Q2 at LMRA
6. From the period 2019 Q1 onwards the Domestic permit counts have been reviewed to include the domestic workers holding active work permits in addition to in-progress permits issued with a residence permit. The count also includes domestic permits due for renewal that have not been terminated or cancelled by the employer.
Employment as defined by the LMRA is in line with the ILO resolution concerning statistics of the economically active population, employment, unemployment and underemployment.
It includes all persons above a specific age during a specific period either in paid employment or in self-employment and includes the following:
(a) paid employment
(a1) at work: persons who during the reference period performed some work for wage or salary, in cash or in kind, even for one hour
(a2) with a job but not at work: persons who, having already worked in their present job, were temporarily not at work during the reference period and had a formal attachment to their job(e.g., absence because of illness or injury, holiday or vacation, strike or lockout, educational or training leave, maternity or parental leave, reduction in economic activity, etc.)
(b) self employment
(b1) at work: persons who during the reference period performed some work for profit or family gain, in cash or in kind
(b2) with an enterprise but not at work: persons with an enterprise, which may be a business enterprise, a farm or a service undertaking, who were temporarily not at work during the reference period for any specific reason.
Estimates of employed population are no longer available in the Bahrain Labour Market Indicators (BLMI) publications after Q2 2023.
2. Institution which provides data
Labour Market Regulatory Authority (LMRA)
https://www.lmra.gov.bh/en/home
3. Data availability
Labour Market Regulatory Authority (LMRA), Kingdom of Bahrain, based on data from Bahrain Labour Market Indicators.
https://blmi.lmra.gov.bh/2023/06/data/lmr/Table_A.pdf
Data are tabulated in PDF format.
The definitions that the LMRA adopts for its data can be found in the Glossary section:
https://blmi.lmra.gov.bh/mi_glossary.xml
Date of access: September 2024.
GLMM and GRC cannot guarantee that the link to access the source will not change;
that the information will not be removed from the website it was obtained from;
that no geo-blockages will be imposed; or that the information will not be available for any another reason.
Keywords: Bahrain, National Labour, Foreign Labour, Employment, Female Employment, Domestic Workers
| |
Bahrainis |
Non-Bahrainis |
Total |
| |
Males |
Females |
Total |
Males |
Females |
Total |
Males |
Females |
Total |
| 2012: Q1 |
26,867 |
22,206 |
49,073 |
6,026 |
2,303 |
8,329 |
32,893 |
24,509 |
57,402 |
| Q2 |
27,446 |
24,486 |
51,932 |
5,979 |
2,433 |
8,412 |
33,425 |
26,919 |
60,344 |
| Q3 |
27,449 |
24,477 |
51,926 |
6,286 |
2,447 |
8,733 |
33,735 |
26,924 |
60,659 |
| Q4 |
27,614 |
24,629 |
52,243 |
6,399 |
2,505 |
8,904 |
34,013 |
27,134 |
61,147 |
| 2013: Q1 |
27,623 |
25,225 |
52,848 |
6,473 |
2,613 |
9,086 |
34,096 |
27,838 |
61,934 |
| Q2 |
30,145 |
26,390 |
56,535 |
6,455 |
2,691 |
9,146 |
36,600 |
29,081 |
65,681 |
| Q3 |
30,115 |
26,550 |
56,665 |
6,644 |
2,889 |
9,533 |
36,759 |
29,439 |
66,198 |
| Q4 |
30,169 |
26,696 |
56,865 |
6,786 |
3,160 |
9,946 |
36,955 |
29,856 |
66,811 |
| 2014: Q1 |
30,213 |
26,775 |
56,988 |
6,834 |
3,176 |
10,010 |
37,047 |
29,951 |
66,998 |
| Q2 |
30,037 |
26,780 |
56,817 |
6,736 |
3,082 |
9,818 |
36,773 |
29,862 |
66,635 |
| Q3 |
30,053 |
26,778 |
56,831 |
6,854 |
3,342 |
10,196 |
36,907 |
30,120 |
67,027 |
| Q4 |
30,263 |
26,856 |
57,119 |
6,906 |
3,335 |
10,241 |
37,169 |
30,191 |
67,360 |
| 2015: Q1 |
30,061 |
27,000 |
57,061 |
6,861 |
3,320 |
10,181 |
36,922 |
30,320 |
67,242 |
| Q2 |
30,054 |
27,183 |
57,237 |
6,726 |
3,227 |
9,953 |
36,780 |
30,410 |
67,190 |
| Q3 |
29,986 |
27,185 |
57,171 |
6,861 |
3,384 |
10,245 |
36,847 |
30,569 |
67,416 |
| Q4 |
29,867 |
27,263 |
57,130 |
6,916 |
3,493 |
10,409 |
36,783 |
30,756 |
67,539 |
| 2016: Q1 |
29,340 |
27,092 |
56,432 |
6,818 |
3,448 |
10,266 |
36,158 |
30,540 |
66,698 |
| Q2 |
29,138 |
27,036 |
56,174 |
6,675 |
3,356 |
10,031 |
35,813 |
30,392 |
66,205 |
| Q3 |
28,672 |
26,801 |
55,473 |
6,639 |
3,329 |
9,968 |
35,311 |
30,130 |
65,441 |
| Q4 |
28,441 |
26,511 |
54,952 |
6,679 |
3,328 |
10,007 |
35,120 |
29,839 |
64,959 |
| 2017: Q1 |
28,018 |
26,701 |
54,719 |
6,684 |
3,316 |
10,000 |
34,702 |
30,017 |
64,719 |
| Q2 |
27,962 |
26,838 |
54,800 |
6,613 |
3,270 |
9,883 |
34,575 |
30,108 |
64,683 |
| Q3 |
27,708 |
26,828 |
54,536 |
6,590 |
3,263 |
9,853 |
34,298 |
30,091 |
64,389 |
| Q4 |
27,693 |
26,920 |
54,613 |
6,605 |
3,275 |
9,880 |
34,298 |
30,195 |
64,493 |
| 2018: Q1 |
27,236 |
26,741 |
53,977 |
6,616 |
3,249 |
9,865 |
33,852 |
29,990 |
63,842 |
| Q2 |
27,130 |
26,802 |
53,932 |
6,555 |
3,175 |
9,730 |
33,685 |
29,977 |
63,662 |
| Q3 |
26,867 |
26,821 |
53,688 |
6,490 |
3,136 |
9,626 |
33,357 |
29,957 |
63,314 |
| Q4 |
26,870 |
27,077 |
53,947 |
6,504 |
3,131 |
9,635 |
33,374 |
30,208 |
63,582 |
| 2019: Q1 |
23,702 |
25,569 |
49,271 |
6,509 |
3,125 |
9,634 |
30,211 |
28,694 |
58,905 |
| Q2 |
22,557 |
24,155 |
46,712 |
6,408 |
3,060 |
9,468 |
28,965 |
27,215 |
56,180 |
| Q3 |
22,385 |
23,745 |
46,130 |
6,312 |
3,016 |
9,328 |
28,697 |
26,761 |
55,458 |
| Q4 |
22,694 |
24,189 |
46,883 |
6,245 |
2,979 |
9,224 |
28,939 |
27,168 |
56,107 |
| 2020: Q1 |
22,721 |
24,714 |
47,435 |
6,171 |
3,012 |
9,183 |
28,892 |
27,726 |
56,618 |
| Q2 |
22,776 |
25,011 |
47,787 |
6,171 |
3,163 |
9,334 |
28,947 |
28,174 |
57,121 |
| Q3 |
22,766 |
25,080 |
47,846 |
6,080 |
3,369 |
9,449 |
28,846 |
28,449 |
57,295 |
| Q4 |
22,764 |
25,229 |
47,993 |
5,959 |
3,479 |
9,438 |
28,723 |
28,708 |
57,431 |
| 2021: Q1 |
22,688 |
25,310 |
47,998 |
5,835 |
3,448 |
9,283 |
28,523 |
28,758 |
57,281 |
| Q2 |
22,655 |
25,474 |
48,129 |
5,872 |
3,553 |
9,425 |
28,527 |
29,027 |
57,554 |
| Q3 |
22,651 |
25,595 |
48,246 |
5,803 |
3,483 |
9,286 |
28,454 |
29,078 |
57,532 |
| Q4 |
22,761 |
25,890 |
48,651 |
5,740 |
3,464 |
9,204 |
28,501 |
29,354 |
57,855 |
| 2022: Q1 |
22,863 |
26,230 |
49,093 |
5,687 |
3,423 |
9,110 |
28,550 |
29,653 |
58,203 |
| Q2 |
22,976 |
26,489 |
49,465 |
5,582 |
3,372 |
8,954 |
28,558 |
29,861 |
58,419 |
| Q3 |
23,085 |
26,676 |
49,761 |
5,441 |
3,341 |
8,782 |
28,526 |
30,017 |
58,543 |
| Q4 |
23,166 |
27,076 |
50,242 |
5,346 |
3,303 |
8,649 |
28,512 |
30,379 |
58,891 |
| 2023: Q1 |
22,934 |
27,025 |
49,959 |
5,263 |
3,270 |
8,533 |
28,197 |
30,295 |
58,492 |
| Q2 |
22,483 |
26,949 |
49,432 |
5,042 |
3,119 |
8,161 |
27,525 |
30,068 |
57,593 |
Source: BLMI, Labour Market Regulation Authority (LMRA)
ANNEXED NOTE
1. Technical Notes and Definitions
Data are extracted from the files submitted by Expatriate Management System (LMRA-EMS), General Organisation for Social Insurance (GOSI), Pension Fund Commission (PFC), and Civil Service Bureau (CSB) monthly data files to LMRA.Estimates of employed population include all civilian employed persons in the private and public sectors (insured, uninsured and self-employed) and domestic workers.
LMRA data do not include non-civilian employees (engaged in military, defense and other relevant entities and ranked as so).
1. From 2008 Q2 onward, “Public sector” for non-Bahraini workers refers to workers in the “Government sector” of the Expatriate Management System (EMS) of LMRA.
2. “Private Sector” for non-Bahraini workers refers to the sum of “Commercial” and “Non-Commercial, Non-Government” (NCNG) sectors of LMRA’s EMS system.
3. Male population includes persons with unrecorded sex attribute.
4. Details may not add up to totals due to rounding error. Also, data from this table may differ from totals obtained from other tables in the series (Tables A1, A2, A06, A07, A10 and A99).
5. The drop in number of domestic workers in Q2 2018 is due to data cleansing of domestic records during Q2 at LMRA
6. From the period 2019 Q1 onwards the Domestic permit counts have been reviewed to include the domestic workers holding active work permits in addition to in-progress permits issued with a residence permit. The count also includes domestic permits due for renewal that have not been terminated or cancelled by the employer.
Employment as defined by the LMRA is in line with the ILO resolution concerning statistics of the economically active population, employment, unemployment and underemployment.
It includes all persons above a specific age during a specific period either in paid employment or in self-employment and includes the following:
(a) paid employment
(a1) at work: persons who during the reference period performed some work for wage or salary, in cash or in kind, even for one hour
(a2) with a job but not at work: persons who, having already worked in their present job, were temporarily not at work during the reference period and had a formal attachment to their job(e.g., absence because of illness or injury, holiday or vacation, strike or lockout, educational or training leave, maternity or parental leave, reduction in economic activity, etc.)
(b) self employment
(b1) at work: persons who during the reference period performed some work for profit or family gain, in cash or in kind
(b2) with an enterprise but not at work: persons with an enterprise, which may be a business enterprise, a farm or a service undertaking, who were temporarily not at work during the reference period for any specific reason.
Estimates of employed population are no longer available in the Bahrain Labour Market Indicators (BLMI) publications after Q2 2023.
2. Institution which provides data
Labour Market Regulatory Authority (LMRA)
https://www.lmra.gov.bh/en/home
3. Data availability
Labour Market Regulatory Authority (LMRA), Kingdom of Bahrain, based on data from Bahrain Labour Market Indicators.
https://blmi.lmra.gov.bh/2023/06/data/lmr/Table_A.pdf
Data are tabulated in PDF format.
The definitions that the LMRA adopts for its data can be found in the Glossary section:
https://blmi.lmra.gov.bh/mi_glossary.xml
Date of access: September 2024.
GLMM and GRC cannot guarantee that the link to access the source will not change;
that the information will not be removed from the website it was obtained from;
that no geo-blockages will be imposed; or that the information will not be available for any another reason.
Keywords: Bahrain, National Labour, Foreign Labour, Employment, Female Employment, Domestic Workers
| |
Bahrainis |
Non-Bahrainis |
Total |
| |
Males |
Females |
Total |
Males |
Females |
Total |
Males |
Females |
Total |
| 2012: Q1 |
0 |
0 |
0 |
33,067 |
55,557 |
88,624 |
33,067 |
55,557 |
88,624 |
| Q2 |
0 |
0 |
0 |
33,341 |
56,783 |
90,124 |
33,341 |
56,783 |
90,124 |
| Q3 |
0 |
0 |
0 |
34,369 |
58,192 |
92,561 |
34,369 |
58,192 |
92,561 |
| Q4 |
0 |
0 |
0 |
35,813 |
59,484 |
95,297 |
35,813 |
59,484 |
95,297 |
| 2013: Q1 |
0 |
0 |
0 |
37,285 |
61,039 |
98,324 |
37,285 |
61,039 |
98,324 |
| Q2 |
0 |
0 |
0 |
37,915 |
62,434 |
100,349 |
37,915 |
62,434 |
100,349 |
| Q3 |
0 |
0 |
0 |
38,916 |
63,786 |
102,702 |
38,916 |
63,786 |
102,702 |
| Q4 |
0 |
0 |
0 |
39,629 |
64,099 |
103,728 |
39,629 |
64,099 |
103,728 |
| 2014: Q1 |
0 |
0 |
0 |
40,398 |
64,805 |
105,203 |
40,398 |
64,805 |
105,203 |
| Q2 |
0 |
0 |
0 |
41,173 |
64,932 |
106,105 |
41,173 |
64,932 |
106,105 |
| Q3 |
0 |
0 |
0 |
41,828 |
65,169 |
106,997 |
41,828 |
65,169 |
106,997 |
| Q4 |
0 |
0 |
0 |
42,318 |
65,393 |
107,711 |
42,318 |
65,393 |
107,711 |
| 2015: Q1 |
0 |
0 |
0 |
42,861 |
65,886 |
108,746 |
42,861 |
65,886 |
108,746 |
| Q2 |
0 |
0 |
0 |
43,720 |
66,645 |
110,365 |
43,720 |
66,645 |
110,365 |
| Q3 |
0 |
0 |
0 |
44,085 |
66,918 |
111,002 |
44,085 |
66,918 |
111,002 |
| Q4 |
0 |
0 |
0 |
44,085 |
66,918 |
111,002 |
44,085 |
66,918 |
111,002 |
| 2016: Q1 |
0 |
0 |
0 |
44,085 |
66,918 |
111,002 |
44,085 |
66,918 |
111,002 |
| Q2 |
0 |
0 |
0 |
44,085 |
66,918 |
111,002 |
44,085 |
66,918 |
111,002 |
| Q3 |
0 |
0 |
0 |
44,085 |
66,918 |
111,002 |
44,085 |
66,918 |
111,002 |
| Q4 |
0 |
0 |
0 |
44,085 |
66,918 |
111,002 |
44,085 |
66,918 |
111,002 |
| 2017: Q1 |
0 |
0 |
0 |
24,112 |
75,305 |
99,417 |
24,112 |
75,305 |
99,417 |
| Q2 |
0 |
0 |
0 |
23,809 |
76,249 |
100,058 |
23,809 |
76,249 |
100,058 |
| Q3 |
0 |
0 |
0 |
23,288 |
75,088 |
98,376 |
23,288 |
75,088 |
98,376 |
| Q4 |
0 |
0 |
0 |
23,044 |
75,861 |
98,905 |
23,044 |
75,861 |
98,905 |
| 2018: Q1 |
0 |
0 |
0 |
23,649 |
79,878 |
103,527 |
23,649 |
79,878 |
103,527 |
| Q2 |
0 |
0 |
0 |
22,478 |
69,374 |
91,852 |
22,478 |
69,374 |
91,852 |
| Q3 |
0 |
0 |
0 |
22,275 |
67,885 |
90,160 |
22,275 |
67,885 |
90,160 |
| Q4 |
0 |
0 |
0 |
22,552 |
68,039 |
90,591 |
22,552 |
68,039 |
90,591 |
| 2019: Q1 |
0 |
0 |
0 |
23,254 |
64,488 |
87,742 |
23,254 |
64,488 |
87,742 |
| Q2 |
0 |
0 |
0 |
23,506 |
63,938 |
87,444 |
23,506 |
63,938 |
87,444 |
| Q3 |
0 |
0 |
0 |
23,677 |
63,409 |
87,086 |
23,677 |
63,409 |
87,086 |
| Q4 |
0 |
0 |
0 |
24,033 |
63,47 |
87,503 |
24,033 |
63,470 |
87,503 |
| 2020: Q1 |
0 |
0 |
0 |
24,351 |
63,759 |
88,110 |
24,351 |
63,759 |
88,110 |
| Q2 |
0 |
0 |
0 |
22,939 |
57,512 |
80,451 |
22,939 |
57,512 |
80,451 |
| Q3 |
0 |
0 |
0 |
22,064 |
53,344 |
75,408 |
22,064 |
53,344 |
75,408 |
| Q4 |
0 |
0 |
0 |
21,758 |
51,236 |
72,994 |
21,758 |
51,236 |
72,994 |
| 2021: Q1 |
0 |
0 |
0 |
21,720 |
51,276 |
72,996 |
21,720 |
51,276 |
72,996 |
| Q2 |
0 |
0 |
0 |
21,620 |
51,012 |
72,632 |
21,620 |
51,012 |
72,632 |
| Q3 |
0 |
0 |
0 |
21,475 |
50,169 |
71,644 |
21,475 |
50,169 |
71,644 |
| Q4 |
0 |
0 |
0 |
21,681 |
50,789 |
72,470 |
21,681 |
50,789 |
72,470 |
| 2022: Q1 |
0 |
0 |
0 |
21,886 |
51,793 |
73,679 |
21,886 |
51,793 |
73,679 |
| Q2 |
0 |
0 |
0 |
22,148 |
52,748 |
74,896 |
22,148 |
52,748 |
74,896 |
| Q3 |
0 |
0 |
0 |
22,415 |
53,839 |
76,254 |
22,415 |
53,839 |
76,254 |
| Q4 |
0 |
0 |
0 |
22,677 |
55,030 |
77,707 |
22,677 |
55,030 |
77,707 |
| 2023: Q1 |
0 |
0 |
0 |
22,842 |
56,023 |
78,865 |
22,842 |
56,023 |
78,865 |
| Q2 |
0 |
0 |
0 |
22,850 |
56,050 |
78,900 |
22,850 |
56,050 |
78,900 |
Source: BLMI, Labour Market Regulation Authority (LMRA)
ANNEXED NOTE
1. Technical Notes and Definitions
Data are extracted from the files submitted by Expatriate Management System (LMRA-EMS), General Organisation for Social Insurance (GOSI), Pension Fund Commission (PFC), and Civil Service Bureau (CSB) monthly data files to LMRA.Estimates of employed population include all civilian employed persons in the private and public sectors (insured, uninsured and self-employed) and domestic workers.
LMRA data do not include non-civilian employees (engaged in military, defense and other relevant entities and ranked as so).
1. From 2008 Q2 onward, “Public sector” for non-Bahraini workers refers to workers in the “Government sector” of the Expatriate Management System (EMS) of LMRA.
2. “Private Sector” for non-Bahraini workers refers to the sum of “Commercial” and “Non-Commercial, Non-Government” (NCNG) sectors of LMRA’s EMS system.
3. Male population includes persons with unrecorded sex attribute.
4. Details may not add up to totals due to rounding error. Also, data from this table may differ from totals obtained from other tables in the series (Tables A1, A2, A06, A07, A10 and A99).
5. The drop in number of domestic workers in Q2 2018 is due to data cleansing of domestic records during Q2 at LMRA
6. From the period 2019 Q1 onwards the Domestic permit counts have been reviewed to include the domestic workers holding active work permits in addition to in-progress permits issued with a residence permit. The count also includes domestic permits due for renewal that have not been terminated or cancelled by the employer.
Definition of domestic worker:
https://blmi.lmra.gov.bh/mi_glossary.xml#Domestic%20Worker
Employment as defined by the LMRA is in line with the ILO resolution concerning statistics of the economically active population, employment, unemployment and underemployment.
It includes all persons above a specific age during a specific period either in paid employment or in self-employment and includes the following:
(a) paid employment
(a1) at work: persons who during the reference period performed some work for wage or salary, in cash or in kind, even for one hour
(a2) with a job but not at work: persons who, having already worked in their present job, were temporarily not at work during the reference period and had a formal attachment to their job(e.g., absence because of illness or injury, holiday or vacation, strike or lockout, educational or training leave, maternity or parental leave, reduction in economic activity, etc.)
(b) self employment
(b1) at work: persons who during the reference period performed some work for profit or family gain, in cash or in kind
(b2) with an enterprise but not at work: persons with an enterprise, which may be a business enterprise, a farm or a service undertaking, who were temporarily not at work during the reference period for any specific reason.
Estimates of employed population are no longer available in the Bahrain Labour Market Indicators (BLMI) publications after Q2 2023.
2. Institution which provides data
Labour Market Regulatory Authority (LMRA)
https://www.lmra.gov.bh/en/home
3. Data availability
Labour Market Regulatory Authority (LMRA), Kingdom of Bahrain, based on data from Bahrain Labour Market Indicators.
https://blmi.lmra.gov.bh/2023/06/data/lmr/Table_A.pdf
Data are tabulated in PDF format.
The definitions that the LMRA adopts for its data can be found in the Glossary section:
https://blmi.lmra.gov.bh/mi_glossary.xml
Date of access: September 2024.
GLMM and GRC cannot guarantee that the link to access the source will not change;
that the information will not be removed from the website it was obtained from;
that no geo-blockages will be imposed; or that the information will not be available for any another reason.
Keywords: Bahrain, National Labour, Foreign Labour, Employment, Female Employment, Domestic Workers
| |
Q3 2021 |
Q4 2021 |
Q1 2022 |
Q2 2022 |
Q3 2022 |
Q4 2022 |
Q1 2023 |
Q2 2023 |
Q3 2023 |
Q4 2023 |
Q1 2024 |
Q2 2024 |
| Managers |
4,896 |
4,858 |
13,825 |
19,186 |
N.A. |
16,106 |
17,017 |
13,166 |
18,524 |
17,206 |
16,473 |
14,796 |
| Professionals |
29,242 |
33,395 |
41,430 |
39,565 |
N.A. |
34,093 |
34,706 |
31,632 |
57,672 |
36,677 |
35,623 |
31,985 |
| Technicians and associate professionals |
17,330 |
22,033 |
32,200 |
30,190 |
N.A. |
21,543 |
23,268 |
18,723 |
23,336 |
21,948 |
21,118 |
18,886 |
| Clerical support workers |
16,158 |
19,961 |
28,930 |
35,399 |
N.A. |
29,274 |
29,218 |
22,555 |
30,419 |
30,205 |
374 |
25,891 |
| Service and sales workers |
18,398 |
22,501 |
27,393 |
28,295 |
N.A. |
19,225 |
22,228 |
18,153 |
20,689 |
17,672 |
28,714 |
15,063 |
| Skilled agricultural, forestry and fishery workers |
41 |
29 |
45 |
62 |
N.A. |
121 |
30 |
38 |
52 |
36 |
18,367 |
29 |
| Craft and related trades workers |
910 |
1,089 |
2,435 |
1,895 |
N.A. |
1,280 |
1,424 |
1,288 |
1,732 |
1,818 |
26 |
1,241 |
| Plant and machine operators, and assemblers |
1,060 |
1,394 |
2,597 |
2,777 |
N.A. |
1,989 |
2,288 |
2,164 |
2,020 |
1,694 |
1,394 |
1,366 |
| Elementary occupations |
2,388 |
3,273 |
3,030 |
5,428 |
N.A. |
4,538 |
7,493 |
2,395 |
2,395 |
2,236 |
1,573 |
1,426 |
| Other occupations |
302 |
642 |
208 |
440 |
N.A. |
710 |
769 |
2,016 |
1,071 |
455 |
2,038 |
77 |
| Not specified |
23 |
|
|
|
|
|
|
|
|
|
|
|
| Total |
90,748 |
109,175 |
152,093 |
163,237 |
N.A. |
128,879 |
138,441 |
112,130 |
157,910 |
129,947 |
125,700 |
110,760 |
Source: Register-based Labour Market Statistics, General Authority for Statistics (GAStat)
1. Data collection methodology
LFS were first conducted in 2001 and became bi-annual after 2006. Data were collected through nationally representative household sample surveys, which sampling was based on most recent censuses. Since 2016, Labour Force Surveys have been conducted and published on a quarterly basis, based on a household telephone survey conducted by GAStat. Employment data extracted from administrative records were also introduced as a complement to the results of Labour Force Surveys in Labour Market Statistics’ publications, starting on Q1 2017.
The present data is taken from administrative records.
Population of reference: workers subject to the rule of the General Organization of Social Insurance (GOSI):
a. contributors on the job who are subject to social insurance laws and regulations in the private and government sector;
b. new contributors, and contributors who terminated their contribution to social insurance during the quarter.
who were newly registered with GOSI during the period (inflows)
Registration with GOSI is compulsory for workers in the private sector and non-civil servants in the government sector, who make up about 70 percent of foreign workers.
The present data does not incorporate:
1. Civil servants
2. Domestic workers
Figures of workers in Labor Market statistics which were derived from administrative records do not include the following categories:
1-Workers in the military and security sectors
2-Workers who are not registered in the civil service, social insurance (GOSI) and domestic workers’ records, which include:
– Saudis working for their own businesses and are not subjected to the labor regulations, also, not registered in social insurance, such as those who work in delivery through electronic apps
– Saudi employers who work in establishments and not registered in the social insurance
– Non-Saudi staff working in foreign international, political or military missions
3- Non-Saudi employees who come to the Kingdom for work that normally takes less than three months to be completed.
Definitions and categories used by GAStat in Labour Markets Statistics (employment; unemployment;
occupation and activity sectors, etc.) are based on international standards:
For LFS methodology and definitions, see:
https://www.stats.gov.sa/en/node/9787
https://database.stats.gov.sa/Methodologies/En_Documents/03_Labor%20Market%20Bulletin%20Methodology,%20Fourth%20Quarter%202020%20_%20General%20Authority%20for%20Statistics.pdf
https://www.stats.gov.sa/en/node/9787
https://database.stats.gov.sa/Methodologies/En_Documents/03_Labor%20Market%20Bulletin%20Methodology,%20Fourth%20Quarter%202020%20_%20General%20Authority%20for%20Statistics.pdf
Classification of occupations: Saudi classification of occupations, based on ISCO-08.
https://www.stats.gov.sa/en/page/292
This classification was adopted in Q1 2021.
2. Institution which provides data
General Authority for Statistics (GAStat)
3. Data availability
Since 2021, GAStat has been publishing separately the employment data taken from administrative records, and unemployment/inactivity data as well as general indicators, calculated from the results of the field interviews conducted by GAStat (Labour Force Survey).
The present time-series was taken from Register-based Labour Market Statistics publications, given quarters and years.
(English and Arabic versions)
https://www.stats.gov.sa/en/814
https://www.stats.gov.sa/ar/814
Date of access: 10 October 2024.
Keywords: Employment, Female Employment, Saudi Arabia, National & Foreign Labour, Highly Skilled Labour, Low-Skilled Labour
GLMM and GRC cannot guarantee that the link to access the source will not change; that the information will not be removed from the website it was obtained from; that no geo-blockages will be imposed; or that the information will not be available for any another reason.
| |
Q3 2021 |
Q4 2021 |
Q1 2022 |
Q2 2022 |
Q3 2022 |
Q4 2022 |
Q1 2023 |
Q2 2023 |
Q3 2023 |
Q4 2023 |
Q1 2024 |
Q2 2024 |
| Managers |
954 |
1,205 |
1,743 |
1,789 |
N.A. |
425 |
1,258 |
322 |
1,499 |
1,059 |
1,697 |
1,543 |
| Professionals |
15,772 |
15,658 |
24,884 |
18,036 |
N.A. |
3,092 |
9,686 |
2,211 |
10,495 |
8,844 |
12,377 |
10,076 |
| Technicians and associate professionals |
5,176 |
10,640 |
5,975 |
6,556 |
N.A. |
1,581 |
7,790 |
1,530 |
6,805 |
5,044 |
7,986 |
7,043 |
| Clerical support workers |
332 |
464 |
1,082 |
839 |
N.A. |
251 |
539 |
378 |
717 |
722 |
339 |
1,093 |
| Service and sales workers |
5,381 |
12,408 |
25,354 |
13,188 |
N.A. |
1,704 |
7,555 |
1,539 |
7,715 |
4,922 |
1,279 |
7,196 |
| Skilled agricultural, forestry and fishery workers |
1,825 |
6,994 |
533 |
169 |
N.A. |
22 |
161 |
15 |
106 |
67 |
9,362 |
117 |
| Craft and related trades workers |
8,153 |
26,708 |
23,295 |
11,518 |
N.A. |
2,149 |
11,769 |
2,511 |
12,210 |
7,854 |
112 |
10,523 |
| Plant and machine operators, and assemblers |
12,063 |
42,361 |
17,841 |
10,354 |
N.A. |
2,674 |
14,297 |
2,650 |
12,071 |
8,969 |
12,435 |
12,714 |
| Elementary occupations |
128,190 |
316,958 |
250,887 |
96,969 |
N.A. |
20,539 |
66,707 |
11,501 |
54,086 |
36,777 |
14,619 |
49,109 |
| Other occupations |
0 |
8,945 |
61,588 |
39,385 |
N.A. |
26 |
499 |
113 |
452 |
273 |
61,428 |
326 |
| Not specified |
6,955 |
|
|
|
N.A. |
|
|
|
|
|
|
|
| Total |
184,801 |
442,341 |
413,182 |
198,803 |
N.A. |
32,463 |
120,261 |
22,770 |
106,156 |
74,531 |
121,634 |
99,740 |
Source: Register-based Labour Market Statistics, General Authority for Statistics (GAStat)
1. Data collection methodology
LFS were first conducted in 2001 and became bi-annual after 2006. Data were collected through nationally representative household sample surveys, which sampling was based on most recent censuses. Since 2016, Labour Force Surveys have been conducted and published on a quarterly basis, based on a household telephone survey conducted by GAStat. Employment data extracted from administrative records were also introduced as a complement to the results of Labour Force Surveys in Labour Market Statistics’ publications, starting on Q1 2017.
The present data is taken from administrative records.
Population of reference: workers subject to the rule of the General Organization of Social Insurance (GOSI):
a. contributors on the job who are subject to social insurance laws and regulations in the private and government sector;
b. new contributors, and contributors who terminated their contribution to social insurance during the quarter.
who were newly registered with GOSI during the period (inflows)
Registration with GOSI is compulsory for workers in the private sector and non-civil servants in the government sector, who make up about 70 percent of foreign workers.
The present data does not incorporate:
1. Civil servants
2. Domestic workers
Figures of workers in Labor Market statistics which were derived from administrative records do not include the following categories:
1-Workers in the military and security sectors
2-Workers who are not registered in the civil service, social insurance (GOSI) and domestic workers’ records, which include:
– Saudis working for their own businesses and are not subjected to the labor regulations, also, not registered in social insurance, such as those who work in delivery through electronic apps
– Saudi employers who work in establishments and not registered in the social insurance
– Non-Saudi staff working in foreign international, political or military missions
3- Non-Saudi employees who come to the Kingdom for work that normally takes less than three months to be completed.
Definitions and categories used by GAStat in Labour Markets Statistics (employment; unemployment;
occupation and activity sectors, etc.) are based on international standards:
For LFS methodology and definitions, see:
https://www.stats.gov.sa/en/node/9787
https://database.stats.gov.sa/Methodologies/En_Documents/03_Labor%20Market%20Bulletin%20Methodology,%20Fourth%20Quarter%202020%20_%20General%20Authority%20for%20Statistics.pdf
https://www.stats.gov.sa/en/node/9787
https://database.stats.gov.sa/Methodologies/En_Documents/03_Labor%20Market%20Bulletin%20Methodology,%20Fourth%20Quarter%202020%20_%20General%20Authority%20for%20Statistics.pdf
Classification of occupations: Saudi classification of occupations, based on ISCO-08.
https://www.stats.gov.sa/en/page/292
This classification was adopted in Q1 2021.
2. Institution which provides data
General Authority for Statistics (GAStat)
3. Data availability
Since 2021, GAStat has been publishing separately the employment data taken from administrative records, and unemployment/inactivity data as well as general indicators, calculated from the results of the field interviews conducted by GAStat (Labour Force Survey).
The present time-series was taken from Register-based Labour Market Statistics publications, given quarters and years.
(English and Arabic versions)
https://www.stats.gov.sa/en/814
https://www.stats.gov.sa/ar/814
Date of access: 10 October 2024.
Keywords: Employment, Female Employment, Saudi Arabia, National & Foreign Labour, Highly Skilled Labour, Low-Skilled Labour
GLMM and GRC cannot guarantee that the link to access the source will not change; that the information will not be removed from the website it was obtained from; that no geo-blockages will be imposed; or that the information will not be available for any another reason.
| Quarters |
Saudis |
Non-Saudis |
Total |
| Males |
Females |
Total |
Males |
Females |
Total |
Males |
Females |
Total |
| 2020 Q1 |
108,852 |
68,492 |
177,344 |
416,136 |
22,595 |
438,731 |
524,988 |
91,087 |
616,075 |
| 2020 Q2 |
61,889 |
54,201 |
116,090 |
160,554 |
7,654 |
168,208 |
222,443 |
61,855 |
284,298 |
| 2020 Q3 |
111,051 |
73,924 |
184,975 |
475,522 |
20,023 |
495,545 |
586,573 |
93,947 |
680,520 |
| 2020 Q4 |
172,819 |
122,939 |
295,758 |
449,539 |
21,205 |
470,744 |
622,358 |
144,144 |
766,502 |
| 2021 Q1 |
N.A. |
N.A. |
N.A. |
N.A. |
N.A. |
N.A. |
N.A. |
N.A. |
N.A. |
| 2021 Q2 |
142,314 |
154,932 |
297,246 |
430,412 |
20,895 |
451,307 |
572,726 |
175,827 |
748,553 |
| 2021 Q3 |
198,656 |
146,979 |
345,635 |
616,847 |
24,662 |
641,509 |
815,503 |
171,641 |
987,144 |
| 2021 Q4 |
178,102 |
120,429 |
298,531 |
665,610 |
27,310 |
692,920 |
843,712 |
147,739 |
991,451 |
| 2022 Q1 |
85,712 |
116,751 |
202,463 |
17,519 |
223,802 |
241,321 |
103,231 |
340,553 |
443,784 |
| 2022 Q2 |
38,787 |
40,185 |
78,972 |
59,460 |
5,974 |
65,434 |
98,247 |
46,159 |
144,406 |
| 2022 Q3 |
45,475 |
44,796 |
90,271 |
52,555 |
4,640 |
57,195 |
98,030 |
49,436 |
147,466 |
| 2022 Q4 |
41,387 |
34,603 |
75,990 |
113,691 |
7,679 |
121,370 |
155,078 |
42,282 |
197,360 |
| 2023 Q1 |
44,277 |
35,822 |
80,099 |
53,718 |
7,216 |
60,934 |
97,995 |
43,038 |
141,033 |
| 2023 Q2 |
38,736 |
41,279 |
80,015 |
82,464 |
7,135 |
89,599 |
121,200 |
48,414 |
169,614 |
| 2023 Q3 |
44,239 |
41,367 |
85,606 |
74,900 |
6,492 |
81,392 |
119,139 |
47,859 |
166,998 |
| 2023 Q4 |
43,302 |
40,154 |
83,456 |
96,657 |
7,428 |
104,085 |
139,959 |
47,582 |
187,541 |
| 2024 Q1 |
41,051 |
39,142 |
80,193 |
94,346 |
5,748 |
100,094 |
135,397 |
44,890 |
180,287 |
| 2024 Q2 |
42,821 |
47,142 |
89,963 |
61,597 |
6,380 |
67,977 |
104,418 |
53,522 |
157,940 |
Source: Register-based Labour Market Statistics, General Authority for Statistics (GAStat)
1. Data collection methodology
LFS were first conducted in 2001 and became bi-annual after 2006. Data were collected through nationally representative household sample surveys, which sampling was based on most recent censuses. Since 2016, Labour Force Surveys have been conducted and published on a quarterly basis, based on a household telephone survey conducted by GAStat. Employment data extracted from administrative records were also introduced as a complement to the results of Labour Force Surveys in Labour Market Statistics’ publications, starting on Q1 2017.
The present data is taken from administrative records.
Population of reference: workers subject to the rule of the General Organization of Social Insurance (GOSI):
a. contributors on the job who are subject to social insurance laws and regulations in the private and government sector;
b. new contributors, and contributors who terminated their contribution to social insurance during the quarter.
who stopped being registered with GOSI during the period (outflows)
Registration with GOSI is compulsory for workers in the private sector and non-civil servants in the government sector, who make up about 70 percent of foreign workers.
The present data does not incorporate:
1. Civil servants
2. Domestic workers
Figures of workers in Labor Market statistics which were derived from administrative records do not include the following categories:
1-Workers in the military and security sectors
2-Workers who are not registered in the civil service, social insurance (GOSI) and domestic workers’ records, which include:
– Saudis working for their own businesses and are not subjected to the labor regulations, also, not registered in social insurance, such as those who work in delivery through electronic apps
– Saudi employers who work in establishments and not registered in the social insurance
– Non-Saudi staff working in foreign international, political or military missions
3- Non-Saudi employees who come to the Kingdom for work that normally takes less than three months to be completed.
Definitions and categories used by GAStat in Labour Markets Statistics (employment; unemployment; occupation and activity sectors, etc.) are based on international standards:
For LFS methodology and definitions, see:
https://www.stats.gov.sa/en/node/9787
https://database.stats.gov.sa/Methodologies/En_Documents/03_Labor%20Market%20Bulletin%20Methodology,%20Fourth%20Quarter%202020%20_%20General%20Authority%20for%20Statistics.pdf
https://www.stats.gov.sa/en/node/9787
https://database.stats.gov.sa/Methodologies/En_Documents/03_Labor%20Market%20Bulletin%20Methodology,%20Fourth%20Quarter%202020%20_%20General%20Authority%20for%20Statistics.pdf
Classification of occupations: Saudi classification of occupations, based on ISCO-08.
https://www.stats.gov.sa/en/page/292
This classification was adopted in Q1 2021.
2. Institution which provides data
General Authority for Statistics (GAStat)
3. Data availability
Since 2021, GAStat has been publishing separately the employment data taken from administrative records, and unemployment/inactivity data as well as general indicators, calculated from the results of the field interviews conducted by GAStat (Labour Force Survey).
The present time-series was taken from Register-based Labour Market Statistics publications, given quarters and years.
(English and Arabic versions)
https://www.stats.gov.sa/en/814
https://www.stats.gov.sa/ar/814
Date of access: 10 October 2024.
Keywords: Employment, Female Employment, Saudi Arabia, National & Foreign Labour
GLMM and GRC cannot guarantee that the link to access the source will not change; that the information will not be removed from the website it was obtained from; that no geo-blockages will be imposed; or that the information will not be available for any another reason.
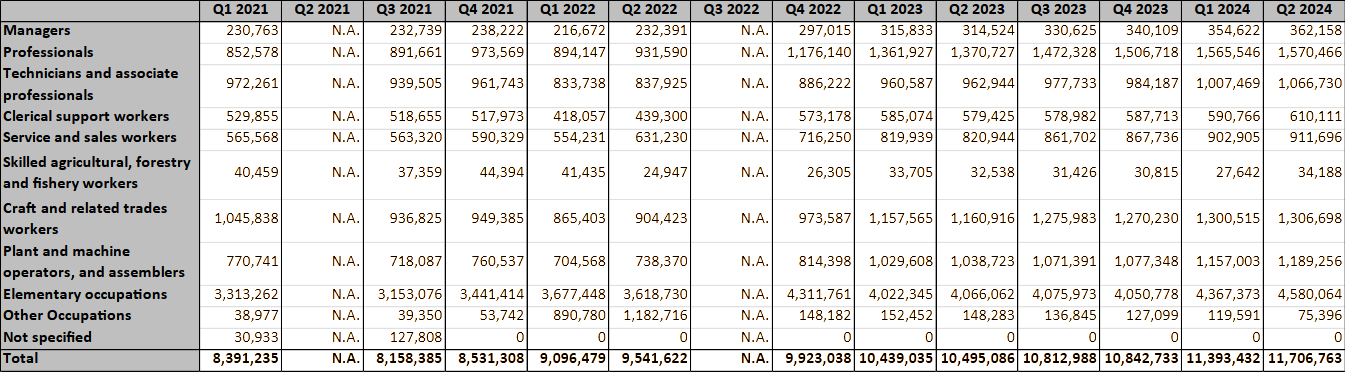
Source: Register-based Labour Market Statistics, General Authority for Statistics (GAStat)
1. Data collection methodology
LFS were first conducted in 2001 and became bi-annual after 2006. Data were collected through nationally representative household sample surveys, which sampling was based on most recent censuses.
Since 2016, Labour Force Surveys have been conducted and published on a quarterly basis, based on a household telephone survey conducted by GAStat. Employment data extracted from administrative records were also introduced as a complement to the results of Labour Force Surveys in Labour Market Statistics’ publications, starting on Q1 2017.
The present data is taken from administrative records.
Population of reference: workers subject to the rule of the General Organization of Social Insurance (GOSI):
a. contributors on the job who are subject to social insurance laws and regulations in the private and government sector;
b. new contributors, and contributors who terminated their contribution to social insurance during the quarter.
Figures of workers in Labor Market statistics which were derived from administrative records do not include the following categories:
1-Workers in the military and security sectors
2- Workers who are not registered in the civil service, social insurance (GOSI) and domestic workers’ records, which include:
– Saudis working for their own businesses and are not subjected to the labour regulations, also, not registered in social insurance, such as those who work in delivery through electronic apps
– Saudi employers who work in establishments and not registered in the social insurance
– Non-Saudi staff working in foreign international, political or military missions
3- Non-Saudi employees who come to the Kingdom for work that normally takes less than three months to be completed.
Definitions and categories used by GAStat in Labour Markets Statistics (employment; unemployment; occupation and activity sectors, etc.) are based on international standards:
For LFS methodology and definitions, see:
https://www.stats.gov.sa/en/node/9787
https://database.stats.gov.sa/Methodologies/En_Documents/03_Labor%20Market%20Bulletin%20Methodology,%20Fourth%20Quarter%202020%20_%20General%20Authority%20for%20Statistics.pdf
https://www.stats.gov.sa/en/node/9787
https://database.stats.gov.sa/Methodologies/En_Documents/03_Labor%20Market%20Bulletin%20Methodology,%20Fourth%20Quarter%202020%20_%20General%20Authority%20for%20Statistics.pdf
Classification of occupations: Saudi classification of occupations, based on ISCO-08.
https://www.stats.gov.sa/en/page/292
This classification was adopted in Q1 2021.
2. Institution which provides data
General Authority for Statistics (GAStat)
3. Data availability
Since 2021, GAStat has been publishing separately the employment data taken from administrative records, and unemployment/inactivity data as well as general indicators, calculated from the results of the field interviews conducted by GAStat (Labour Force Survey).
The present time-series was taken from Register-based Labour Market Statistics publications, given quarters and years (English and Arabic versions)
https://www.stats.gov.sa/en/814
https://www.stats.gov.sa/ar/814
Date of access: 05 October 2024.
Keywords: Employment, Female Employment, Saudi Arabia, National & Foreign Labour, Highly Skilled Labour, Low-Skilled Labour
GLMM and GRC cannot guarantee that the link to access the source will not change; that the information will not be removed from the website it was obtained from; that no geo-blockages will be imposed; or that the information will not be available for any another reason.
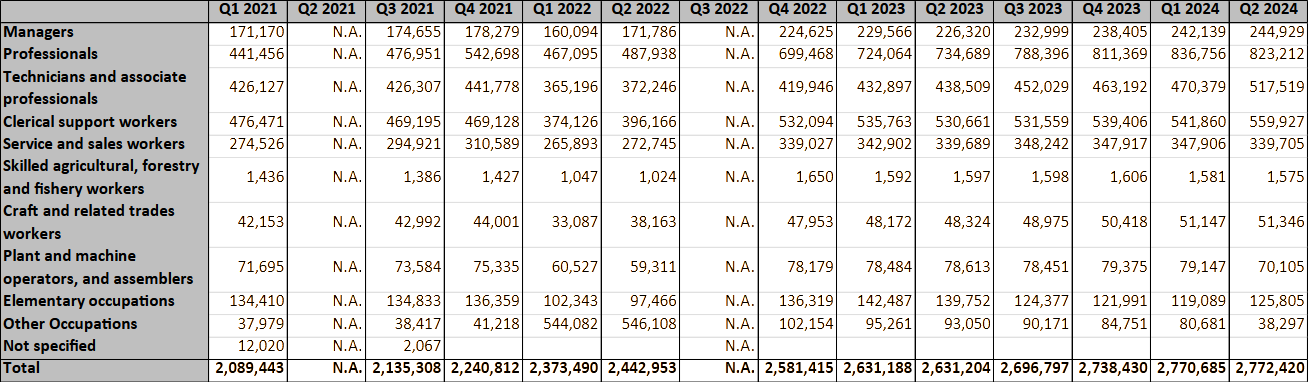
Source: Register-based Labour Market Statistics, General Authority for Statistics (GAStat)
1. Data collection methodology
LFS were first conducted in 2001 and became bi-annual after 2006. Data were collected through nationally representative household sample surveys, which sampling was based on most recent censuses.
Since 2016, Labour Force Surveys have been conducted and published on a quarterly basis, based on a
household telephone survey conducted by GAStat. Employment data extracted from administrative records were also introduced as a complement to the results of Labour Force Surveys in Labour Market Statistics’ publications, starting on Q1 2017.
The present data is taken from administrative records.
Population of reference: workers subject to the rule of the General Organization of Social Insurance (GOSI):
a. contributors on the job who are subject to social insurance laws and regulations in the private and government sector;
b. new contributors, and contributors who terminated their contribution to social insurance during the quarter.
Figures of workers in Labor Market statistics which were derived from administrative records do not include the following categories:
1-Workers in the military and security sectors
2- Workers who are not registered in the civil service, social insurance (GOSI) and domestic workers’ records, which include:
– Saudis working for their own businesses and are not subjected to the labour regulations, also, not registered in social insurance,
such as those who work in delivery through electronic apps
– Saudi employers who work in establishments and not registered in the social insurance
– Non-Saudi staff working in foreign international, political or military missions
3- Non-Saudi employees who come to the Kingdom for work that normally takes less than three months to be completed.
Definitions and categories used by GAStat in Labour Markets Statistics (employment; unemployment; occupation and activity sectors, etc.) are based on international standards:
For LFS methodology and definitions, see:
https://www.stats.gov.sa/en/node/9787
https://database.stats.gov.sa/Methodologies/En_Documents/03_Labor%20Market%20Bulletin%20Methodology,%20Fourth%20Quarter%202020%20_%20General%20Authority%20for%20Statistics.pdf
https://www.stats.gov.sa/en/node/9787
https://database.stats.gov.sa/Methodologies/En_Documents/03_Labor%20Market%20Bulletin%20Methodology,%20Fourth%20Quarter%202020%20_%20General%20Authority%20for%20Statistics.pdf
Classification of occupations: Saudi classification of occupations, based on ISCO-08.
https://www.stats.gov.sa/en/page/292
This classification was adopted in Q1 2021.
2. Institution which provides data
General Authority for Statistics (GAStat)
3. Data availability
Since 2021, GAStat has been publishing separately the employment data taken from administrative records, and unemployment/inactivity data as well as general indicators, calculated from the results of the field interviews conducted by GAStat (Labour Force Survey).
The present time-series was taken from Register-based Labour Market Statistics publications, given quarters and years (English and Arabic versions)
https://www.stats.gov.sa/en/814
https://www.stats.gov.sa/ar/814
Date of access: 05 October 2024.
Keywords: Employment, Female Employment, Saudi Arabia, National & Foreign Labour, Highly Skilled Labour, Low-Skilled Labour
GLMM and GRC cannot guarantee that the link to access the source will not change; that the information will not be removed from the website it was obtained from; that no geo-blockages will be imposed; or that the information will not be available for any another reason.
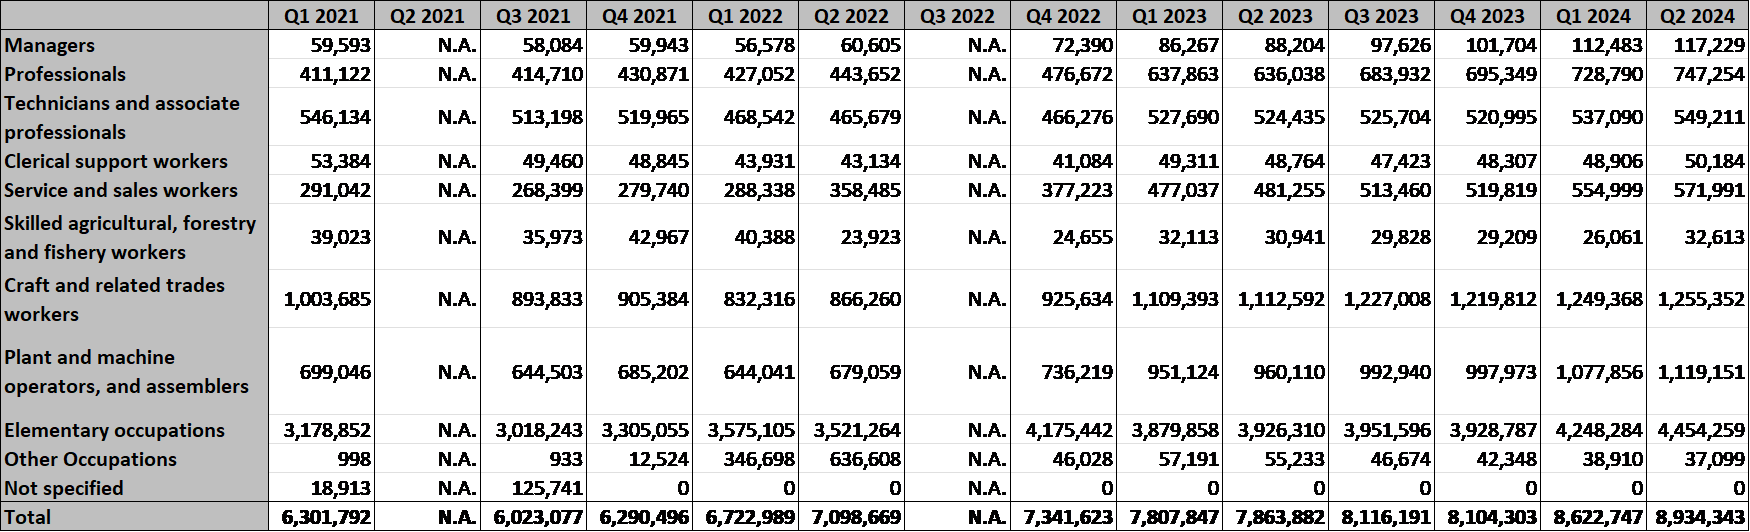
Source: Register-based Labour Market Statistics, General Authority for Statistics (GAStat)
1. Data collection methodology
LFS were first conducted in 2001 and became bi-annual after 2006. Data were collected through nationally representative household sample surveys, which sampling was based on most recent censuses.
Since 2016, Labour Force Surveys have been conducted and published on a quarterly basis, based on a household telephone survey conducted by GAStat. Employment data extracted from administrative records were also introduced as a complement to the results of Labour Force Surveys in Labour Market Statistics’ publications, starting on Q1 2017.
The present data is taken from administrative records.
Population of reference: workers subject to the rule of the General Organization of Social Insurance (GOSI):
a. contributors on the job who are subject to social insurance laws and regulations in the private and government sector;
b. new contributors, and contributors who terminated their contribution to social insurance during the quarter.
Figures of workers in Labor Market statistics which were derived from administrative records do not include the following categories:
1-Workers in the military and security sectors
2- Workers who are not registered in the civil service, social insurance (GOSI) and domestic workers’ records, which include:
– Saudis working for their own businesses and are not subjected to the labour regulations, also, not registered in social insurance,
such as those who work in delivery through electronic apps
– Saudi employers who work in establishments and not registered in the social insurance
– Non-Saudi staff working in foreign international, political or military missions
3- Non-Saudi employees who come to the Kingdom for work that normally takes less than three months to be completed.
Definitions and categories used by GAStat in Labour Markets Statistics (employment; unemployment; occupation and activity sectors, etc.) are based on international standards:
For LFS methodology and definitions, see:
https://www.stats.gov.sa/en/node/9787
https://database.stats.gov.sa/Methodologies/En_Documents/03_Labor%20Market%20Bulletin%20Methodology,%20Fourth%20Quarter%202020%20_%20General%20Authority%20for%20Statistics.pdf
https://www.stats.gov.sa/en/node/9787
https://database.stats.gov.sa/Methodologies/En_Documents/03_Labor%20Market%20Bulletin%20Methodology,%20Fourth%20Quarter%202020%20_%20General%20Authority%20for%20Statistics.pdf
Classification of occupations: Saudi classification of occupations, based on ISCO-08.
https://www.stats.gov.sa/en/page/292
This classification was adopted in Q1 2021.
2. Institution which provides data
General Authority for Statistics (GAStat)
3. Data availability
Since 2021, GAStat has been publishing separately the employment data taken from administrative records, and unemployment/inactivity data as well as general indicators, calculated from the results of the field interviews conducted by GAStat (Labour Force Survey).
The present time-series was taken from Register-based Labour Market Statistics publications, given quarters and years (English and Arabic versions)
https://www.stats.gov.sa/en/814
https://www.stats.gov.sa/ar/814
Date of access: 05 October 2024.
Keywords: Employment, Female Employment, Saudi Arabia, National & Foreign Labour, Highly Skilled Labour, Low-Skilled Labour
GLMM and GRC cannot guarantee that the link to access the source will not change; that the information will not be removed from the website it was obtained from; that no geo-blockages will be imposed; or that the information will not be available for any another reason.
|
|
Saudis
|
Non-Saudis
|
Total
|
|
Males
|
Females
|
Total
|
Males
|
Females
|
Total
|
Males
|
Females
|
Total
|
|
2017 Q1
|
2,021,865
|
1,017,080
|
3,038,945
|
9,859,039
|
991,153
|
10,850,192
|
11,880,904
|
2,008,233
|
13,889,137
|
|
2017 Q2
|
2,029,786
|
1,022,663
|
3,052,449
|
9,777,916
|
1,010,793
|
10,788,709
|
11,807,702
|
2,033,456
|
13,841,158
|
|
2017 Q3
|
2,035,745
|
1,027,999
|
3,063,744
|
9,674,729
|
1,019,591
|
10,694,320
|
11,710,474
|
2,047,590
|
13,758,064
|
|
2017 Q4
|
2,080,601
|
1,083,245
|
3,163,846
|
9,442,163
|
975,132
|
10,417,295
|
11,522,764
|
2,058,377
|
13,581,141
|
|
2018 Q1
|
2,067,976
|
1,082,433
|
3,150,409
|
9,231,869
|
951,235
|
10,183,104
|
11,299,845
|
2,033,668
|
13,333,513
|
|
2018 Q2
|
2,053,189
|
1,072,154
|
3,125,343
|
8,927,862
|
964,861
|
9,892,723
|
10,981,051
|
2,037,015
|
13,018,066
|
|
2018 Q3
|
2,043,585
|
1,066,402
|
3,109,987
|
8,622,890
|
955,165
|
9,578,055
|
10,666,475
|
2,021,567
|
12,688,042
|
|
2018 Q4
|
2,040,742
|
1,070,457
|
3,111,199
|
8,356,943
|
1,072,476
|
9,429,419
|
10,397,685
|
2,142,933
|
12,540,618
|
|
2019 Q1
|
2,036,142
|
1,075,887
|
3,112,029
|
8,458,199
|
1,195,013
|
9,653,212
|
10,494,341
|
2,270,900
|
12,765,241
|
|
2019 Q2
|
2,027,964
|
1,062,284
|
3,090,248
|
8,529,419
|
1,237,365
|
9,766,784
|
10,557,383
|
2,299,649
|
12,857,032
|
|
2019 Q3
|
2,023,910
|
1,076,902
|
3,100,812
|
8,572,339
|
1,254,757
|
9,827,096
|
10,596,249
|
2,331,659
|
12,927,908
|
|
2019 Q4
|
2,054,858
|
1,115,414
|
3,170,272
|
8,792,516
|
1,428,187
|
10,220,703
|
10,847,374
|
2,543,601
|
13,390,975
|
|
2020 Q1
|
2,066,553
|
1,136,870
|
3,203,423
|
9,092,998
|
1,339,191
|
10,432,189
|
11,159,551
|
2,476,061
|
13,635,612
|
|
2020 Q2
|
2,055,767
|
1,115,655
|
3,171,422
|
9,101,286
|
1,357,746
|
10,459,032
|
11,157,053
|
2,473,401
|
13,630,454
|
|
2020 Q3
|
2,100,702
|
1,152,574
|
3,253,276
|
8,866,940
|
1,334,922
|
10,201,862
|
10,967,642
|
2,487,496
|
13,455,138
|
|
2020 Q4
|
2,079,331
|
1,172,867
|
3,252,198
|
8,753,985
|
1,312,515
|
10,066,500
|
10,833,316
|
2,485,382
|
13,318,698
|
|
2021 Q1
|
2,081,446
|
1,225,152
|
3,306,598
|
8,773,896
|
1,403,319
|
10,177,215
|
10,855,342
|
2,628,471
|
13,483,813
|
|
2021 Q2
|
2,098,831
|
1,181,183
|
3,280,014
|
8,449,536
|
1,170,338
|
9,619,874
|
10,548,367
|
2,351,521
|
12,899,888
|
|
2021 Q3
|
2,127,551
|
1,215,287
|
3,342,838
|
8,244,566
|
1,118,241
|
9,362,807
|
10,372,117
|
2,333,528
|
12,705,645
|
|
2021 Q4
|
2,180,320
|
1,269,737
|
3,450,057
|
8,481,117
|
1,114,064
|
9,595,181
|
10,661,437
|
2,383,801
|
13,045,238
|
|
2022 Q1
|
2,233,351
|
1,338,525
|
3,571,876
|
8,971,450
|
1,187,323
|
10,158,773
|
11,204,801
|
2,525,848
|
13,730,649
|
|
2022 Q2
|
2,262,535
|
1,375,609
|
3,638,144
|
9,320,979
|
1,210,640
|
10,531,619
|
11,583,514
|
2,586,249
|
14,169,763
|
|
2022 Q3
|
2,274,628
|
1,417,858
|
3,692,486
|
9,593,551
|
1,304,906
|
10,898,457
|
11,868,179
|
2,722,764
|
14,590,943
|
|
2022 Q4
|
2,300,070
|
1,470,561
|
3,770,631
|
9,672,933
|
1,314,794
|
10,987,727
|
11,973,003
|
2,785,355
|
14,758,358
|
|
2023 Q1
|
2,354,750
|
1,515,731
|
3,870,481
|
10,137,453
|
1,355,438
|
11,492,891
|
12,492,203
|
2,871,169
|
15,363,372
|
|
2023 Q2
|
2,338,735
|
1,518,362
|
3,857,097
|
10,202,131
|
1,395,840
|
11,597,971
|
12,540,866
|
2,914,202
|
15,455,068
|
|
2023 Q3
|
2,357,785
|
1,563,536
|
3,921,321
|
10,461,593
|
1,435,240
|
11,896,833
|
12,819,378
|
2,998,776
|
15,818,154
|
|
2023 Q4
|
2,333,023
|
1,582,224
|
3,915,247
|
10,482,543
|
1,489,714
|
11,972,257
|
12,815,566
|
3,071,938
|
15,887,504
|
|
2024 Q1
|
2,338,857
|
1,599,711
|
3,938,568
|
10,985,203
|
1,592,431
|
12,577,634
|
13,324,060
|
3,192,142
|
16,516,202
|
Source: Register-based Labour Market Statistics, General Authority for Statistics (GAStat)
1. Data collection methodology
LFS were first conducted in 2001 and became bi-annual after 2006. Data were collected through nationally representative household sample surveys, which sampling was based on most recent censuses. Since 2016, Labour Force Surveys have been conducted and published on a quarterly basis, based on a household telephone survey conducted by GAStat. Employment data extracted from administrative records were also introduced as a complement to the results of Labour Force Surveys in Labour Market Statistics publications, starting on Q1 2017.
The present data is taken from administrative records.
GAStat Labour Market Statistics: administrative records
Estimates of figures and characteristics of employment in Saudi Arabia are taken from administrative records from the following institutions:
– Ministry of Human Resources and Social Development (MHRSD)
(formerly Ministry of Labour and Social Development):
Supplies data on:
Employees on the job Subject to the rules and regulations of the Civil Service
– General Organization of Social Insurance (GOSI):
Supplies data on:
a. contributors on the job who are subject to social insurance laws and regulations in the private
and government sector;
b. new contributors, and contributors who terminated their contribution to social insurance during the quarter.
– National Information Center (NIC):
Supplies data on domestic workers (data owner: MHRSD).
Figures of workers in Labor Market Statistics which were derived from administrative records do not include the following categories:
-
Workers in the military and security sectors
-
Workers who are not registered in the civil service, social insurance (GOSI) and domestic workers’ records, which include:
– Saudis working for their own businesses and are not subjected to the labor regulations, also, not registered in social insurance, such as those who work in delivery through electronic apps
– Saudi employers who work in establishments and not registered in the social insurance
– Non-Saudi staff working in foreign international, political or military missions
3- Non-Saudi employees who come to the Kingdom for work that normally takes less than three months to be completed.
Definitions and categories used by GAStat in Labour Markets Statistics (employment; unemployment; occupation and activity sectors, etc.) are based on international standards:
For LFS methodology and definitions, see:
https://www.stats.gov.sa/en/node/9787
https://database.stats.gov.sa/Methodologies/En_Documents/03_Labor%20Market%20Bulletin%20Methodology,%20Fourth%20Quarter%202020%20_%20General%20Authority%20for%20Statistics.pdf
https://www.stats.gov.sa/en/node/9787
https://database.stats.gov.sa/Methodologies/En_Documents/03_Labor%20Market%20Bulletin%20Methodology,%20Fourth%20Quarter%202020%20_%20General%20Authority%20for%20Statistics.pdf
2. Institution which provides data
General Authority for Statistics (GAStat)
3. Data availability
Since 2021, GAStat has been publishing separately the employment data taken from administrative records, and unemployment/inactivity data as well as general indicators, calculated from the results of the field interviews conducted by GAStat (Labour Force Survey).
The present time-series was taken from the Register-based Labour Market Statistics– Q4, 2022
(English and Arabic versions)
https://www.stats.gov.sa/sites/default/files/LMS_2022_Q4_EN_1.xlsx
https://www.stats.gov.sa/sites/default/files/LMS_2022_Q4_AR_1.xlsx
and from relevant quarterly Register-based Labour Market Statistics reports for 2023 and 2024, accessible from:
https://www.stats.gov.sa/en/814
https://www.stats.gov.sa/ar/814
Date of access: 02 September 2024.
Keywords: Employment, Female Employment, Saudi Arabia, National & Foreign Labour
GLMM and GRC cannot guarantee that the link to access the source will not change; that the information will not be removed from the website it was obtained from; that no geo-blockages will be imposed; or that the information will not be available for any another reason.
|
|
Omanis
|
Expatriates
|
total workforce
|
|
|
public sector
|
private sector
|
domestic sector
|
Total employed Omanis
|
public sector
|
private sector
|
domestic sector
|
Total employed expatriates
|
|
2005
|
109,424
|
98,537
|
0
|
207,961
|
22,990
|
424,788
|
n.a.
|
447,778
|
655,739
|
|
2006
|
116,054
|
114,311
|
0
|
230,365
|
22,752
|
510,713
|
n.a.
|
533,465
|
763,830
|
|
2007
|
124,405
|
131,775
|
0
|
256,180
|
22,503
|
638,447
|
n.a.
|
660,950
|
917,130
|
|
2008
|
131,209
|
147,194
|
0
|
278,403
|
22,319
|
698,489
|
96,446
|
817,254
|
1,095,657
|
|
2009
|
136,622
|
158,315
|
0
|
294,937
|
22,916
|
779,653
|
94,592
|
897,161
|
1,192,098
|
|
2010
|
140,370
|
177,716
|
0
|
318,086
|
23,612
|
862,209
|
93,421
|
979,242
|
1,297,328
|
|
2011
|
159,258
|
174,441
|
0
|
333,699
|
25,182
|
1,006,928
|
107,662
|
1,139,772
|
1,473,471
|
|
2012
|
166,804
|
172,066
|
0
|
338,870
|
27,522
|
1,190,300
|
125,882
|
1,343,704
|
1,682,574
|
|
2013
|
180,737
|
181,860
|
0
|
362,597
|
30,392
|
1,332,431
|
138,705
|
1,501,528
|
1,864,125
|
|
2014
|
192,222
|
197,510
|
0
|
389,732
|
33,611
|
1,270,213
|
240,180
|
1,544,004
|
1,933,736
|
|
2015
|
193,965
|
209,620
|
0
|
403,585
|
35,502
|
1,373,842
|
262,196
|
1,671,540
|
2,075,125
|
|
2016
|
195,937
|
223,083
|
0
|
419,020
|
37,624
|
1,504,936
|
283,043
|
1,825,603
|
2,244,623
|
|
2017
|
195,680
|
238,688
|
0
|
434,368
|
36,383
|
1,502,808
|
292,881
|
1,832,072
|
2,266,440
|
|
2018
|
195,481
|
252,132
|
0
|
447,613
|
35,418
|
1,435,153
|
294,560
|
1,765,131
|
2,212,744
|
|
2019
|
202,893
|
262,333
|
0
|
465,226
|
34,470
|
1,363,955
|
294,156
|
1,692,581
|
2,157,807
|
|
2020
|
349,272
|
352,735
|
50,717
|
752,724
|
43,912
|
1,115,322
|
252,042
|
1,411,276
|
2,164,000
|
|
2021
|
351,231
|
374,606
|
47,949
|
773,786
|
41,641
|
1,107,574
|
235,618
|
1,384,833
|
2,158,619
|
|
2022
|
363,438
|
383,179
|
55,198
|
801,815
|
44,056
|
1,359,776
|
303,476
|
1,707,308
|
2,509,123
|
|
2023
|
376,856
|
399,803
|
76,545
|
853,204
|
44,178
|
1,454,170
|
328,900
|
1,827,248
|
2,680,452
|
Source: NCSI. Statistical Yearbooks, 2009 to 2024
ANNEXED NOTE
1. Technical Notes and Definitions
Data for the governmental sector exclude Security and Defence personnels.
https://cbo.gov.om/sites/assets/Documents/English/Publications/AnnualReports/AnnualReport2017eng.pdf
Private sector includes Private, Communal and Other Sectors.
Omanis in the private sector are registered with the Public Authority for Social Insurance (PASI).
2020 and after: employment data is taken from National Registration system (includes insured and uninsured employees).
2. Institution which provides data
National Center for Statistics and Information (NCSI)
3. Data availability
The data on employment by sector and nationality is available in NCSI’s Statistical Yearbooks (chapter “Employment”)
https://www.ncsi.gov.om/Elibrary/LibraryContentDoc/bar_bar_Statistical%20Year%20Book%202024%20Issue%2052_a0f3084d-42a7-4183-83c0-3c9e603f89b5.pdf
https://www.ncsi.gov.om/Pages/Publications.aspx
Last date of access: September 2024.
GLMM and GRC cannot guarantee that the link to access the source will not change; that the information will not be removed from the website it was obtained from; that no geo-blockages will be imposed; or that the information will not be available for any another reason.
Keywords: Oman, National Labour, Foreign Labour, Employment, Female Employment, Labour Market, National & Foreign Labour, Domestic Workers
|
|
Qataris
|
Non-Qataris
|
Total
|
|
|
Males
|
Females
|
Total
|
Males
|
Females
|
Total
|
Males
|
Females
|
Total
|
|
2006
|
38,684
|
19,447
|
58,131
|
415,235
|
57,767
|
473,002
|
453,919
|
77,214
|
531,133
|
|
2007
|
40,322
|
21,223
|
61,545
|
686,430
|
79,608
|
766,038
|
726,752
|
100,831
|
827,583
|
|
2008
|
42,770
|
24,815
|
67,585
|
1,002,388
|
97,928
|
1,100,316
|
1,045,158
|
122,743
|
1,167,901
|
|
2009
|
45,242
|
25,402
|
70,644
|
1,092,844
|
97,983
|
1,190,827
|
1,138,086
|
123,385
|
1,261,471
|
|
2010*
|
46,168
|
24,908
|
71,076
|
1,070,973
|
128,134
|
1,199,107
|
1,117,141
|
153,042
|
1,270,183
|
|
2011
|
49,228
|
25,145
|
74,373
|
1,068,083
|
127,789
|
1,195,872
|
1,117,311
|
152,934
|
1,270,245
|
|
2012
|
55,609
|
26,992
|
82,601
|
1,117,577
|
140,404
|
1,257,981
|
1,173,186
|
167,396
|
1,340,582
|
|
2013
|
60,877
|
30,256
|
91,133
|
1,284,838
|
163,169
|
1,448,007
|
1,345,715
|
193,425
|
1,539,140
|
|
2014
|
62,202
|
31,282
|
93,484
|
1,419,940
|
173,247
|
1,593,187
|
1,482,142
|
204,529
|
1,686,671
|
|
2015
|
64,101
|
34,322
|
98,423
|
1,628,620
|
226,395
|
1,855,015
|
1,692,721
|
260,717
|
1,953,438
|
|
2016
|
65,023
|
36,394
|
101,417
|
1,716,529
|
234,467
|
1,950,996
|
1,781,552
|
270,861
|
2,052,413
|
|
2017
|
66,859
|
37,057
|
103,916
|
1,711,444
|
238,827
|
1,950,271
|
1,778,303
|
275,884
|
2,054,187
|
|
2018
|
67,610
|
38,428
|
106,038
|
1,742,169
|
246,159
|
1,988,328
|
1,809,779
|
284,587
|
2,094,366
|
|
2019
|
68,210
|
39,277
|
107,487
|
1,754,752
|
245,462
|
2,000,214
|
1,822,962
|
284,739
|
2,107,701
|
|
2020
|
70,047
|
40,238
|
110,285
|
1,765,660
|
252,821
|
2,018,481
|
1,835,707
|
293,059
|
2,128,766
|
|
2021
|
70,247
|
45,191
|
115,438
|
1,643,097
|
262,632
|
1,905,729
|
1,713,344
|
307,823
|
2,021,167
|
|
2022
|
72,086
|
48,684
|
120,770
|
1,705,016
|
304,103
|
2,009,119
|
1,777,102
|
352,787
|
2,129,889
|
|
2023
|
73,592
|
50,698
|
124,290
|
1,725,804
|
329,839
|
2,055,643
|
1,799,396
|
380,537
|
2,179,933
|
Source: Annual Bulletins of Labour Force Sample Surveys, 2006 to 2009 and 2011 to 2023; *: census 2010
ANNEXED NOTE
1. Technical Notes and Definitions
Censuses:
Reference period for census 2015: the night of 20 to 21 April 2015.
Reference period for census 2010: the night of 20 to 21 April 2010.
Reference period for census 2020: December 2020 (administrative records-based census).
Population of reference: all individuals (nationals and non-nationals) present within the State’s borders during time of reference, including in labour camps.
Labour force Sample Surveys:
The Statistics Authority conducted the first labor Force Sample Survey in 2001. Starting from 2006, the execution of these surveys came to be on annual basis.
Since 2013, data has been collected on a monthly basis and published every 3 months.
|
Labour Force Sample Surveys
|
Sampling frame
|
Sample size
|
Reference period/ periodicity of data collection
|
|
households
|
individuals
|
|
2006
|
based on independent samples drawn from distinct frames of specially constructed PSUs
|
5,492
|
31,439
|
March 2006
|
|
2007
|
nd
|
5,492
|
31,439
|
October 2007
|
|
2008
|
nd
|
6,104
|
nd
|
December 2008
|
|
2009
|
nd
|
6,109
|
35,839
|
October 2009
|
|
2011
|
nd
|
6,920
|
35,839
|
March 2011
|
|
2012
|
Census 2010
|
6,895
|
37,629
|
April 2012
|
|
2013
|
Census 2010
|
c. 7000
|
n.d.
|
Monthly
|
|
2014
|
Census 2010
|
8,351
|
53,363
|
Monthly
|
|
2015
|
Census 2010
|
6,953
|
44,756
|
Monthly
|
|
2016
|
Census 2010
|
9,199
|
60,016
|
Monthly
|
|
2017
|
Census 2015
|
9,200
|
60,278
|
Monthly
|
|
2018
|
Census 2015
|
9,200
|
60,238
|
Monthly
|
|
2019
|
Census 2015
|
8,445
|
54,948
|
Monthly
|
|
2020
|
Census 2015
|
9,200
|
60,024
|
Monthly
|
|
2021
|
Census 2015
|
9,200
|
59,997
|
Monthly
|
|
2022
|
Census 2020
|
10,560
|
65,253
|
Monthly
|
|
2023
|
Census 2020
|
10,560
|
65,253
|
Monthly
|
Reference period for the labor force data: the week prior to the reference date for data collection.
Population of reference: sample of Qatari and non-Qatari households of the following types: i. Qatari households; ii. Non-Qatari households; iii. Small labor gatherings; iv. Large labor gatherings, present in Qatar on the night of survey/ periods of reference
The collective households are a group of persons not related to each other and sharing living conditions in a residential unit, I.e. labor camps, students living boarding schools, nurses in hospitals… etc. The survey covered the small collective households (includes less than 7 persons) and large collective households (includes 7 persons or more).
The survey did not cover short periods accommodation, i.e. hotels.
Employed population:
Persons aged 15 years an above, who during the week preceding the survey:
a) Perform a work for a wage, salary, profits or household gains, whether it was in cash or in kind.
b) Are temporarily not employed, however, they still have an official relation with their work
2. Institution which provides data
Planning and Statistics Authority (PSA)
https://www.psa.gov.qa/en/Pages/default.aspx
3. Data availability
Annual Bulletins of Labour Force Surveys reports can be downloaded from PSA’s website, in PDF and Excel formats:
https://www.psa.gov.qa/en/statistics1/pages/topicslisting.aspx?parent=Social&child=LaborForce
Last date of access: September 2024.
GLMM and GRC cannot guarantee that the link to access the source will not change; that the information will not be removed from the website it was obtained from; that no geo-blockages will be imposed; or that the information will not be available for any another reason.
Keywords: Qatar, Employment, Female Employment, National Labour, Foreign Labour
|
|
Total employed population
|
|
Government Sector
|
Private Sector
|
Domestic Sector
|
All sectors
|
|
Males
|
Females
|
Total
|
Males
|
Females
|
Total
|
Males
|
Females
|
Total
|
Males
|
Females
|
Total
|
|
2010
|
104,325
|
59,657
|
163,982
|
985,631
|
54,294
|
1,039,925
|
20,739
|
72,682
|
93,421
|
1,110,695
|
186,633
|
1,297,328
|
|
2011
|
111,689
|
72,751
|
184,440
|
1,124,884
|
56,485
|
1,181,369
|
21,245
|
86,417
|
107,662
|
1,257,818
|
215,653
|
1,473,471
|
|
2012
|
117,099
|
77,227
|
194,326
|
1,302,175
|
60,191
|
1,362,366
|
22,322
|
103,560
|
125,882
|
1,441,596
|
240,978
|
1,682,574
|
|
2013
|
125,673
|
85,456
|
211,129
|
1,440,952
|
73,339
|
1,514,291
|
24,078
|
114,627
|
138,705
|
1,590,703
|
273,422
|
1,864,125
|
|
2014
|
133,383
|
92,450
|
225,833
|
1,393,385
|
74,338
|
1,467,723
|
109,017
|
131,163
|
240,180
|
1,635,785
|
297,951
|
1,933,736
|
|
2015
|
135,487
|
93,980
|
229,467
|
1,501,783
|
81,679
|
1,583,462
|
120,433
|
141,763
|
262,196
|
1,757,703
|
317,422
|
2,075,125
|
|
2016
|
138,480
|
95,081
|
233,561
|
1,638,478
|
89,541
|
1,728,019
|
134,296
|
148,747
|
283,043
|
1,911,254
|
333,369
|
2,244,623
|
|
2017
|
136,690
|
95,373
|
232,063
|
1,642,361
|
99,135
|
1,741,496
|
137,355
|
155,526
|
292,881
|
1,916,406
|
350,034
|
2,266,440
|
|
2018
|
135,694
|
95,205
|
230,899
|
1,582,368
|
104,917
|
1,687,285
|
136,431
|
158,129
|
294,560
|
1,854,493
|
358,251
|
2,212,744
|
|
2019
|
140,178
|
97,185
|
237,363
|
1,514,008
|
112,280
|
1,626,288
|
135,256
|
158,900
|
294,156
|
1,789,442
|
368,365
|
2,157,807
|
|
2020
|
291,476
|
101,708
|
393,184
|
1,335,192
|
132,865
|
1,468,057
|
155,205
|
147,554
|
302,759
|
1,781,873
|
382,127
|
2,164,000
|
|
2021
|
289,931
|
102,941
|
392,872
|
1,334,099
|
148,081
|
1,482,180
|
149,044
|
134,523
|
283,567
|
1,773,074
|
385,545
|
2,158,619
|
|
2022
|
295,944
|
111,550
|
407,494
|
1,581,704
|
161,251
|
1,742,955
|
182,224
|
176,450
|
358,674
|
2,059,872
|
449,251
|
2,509,123
|
|
2023
|
300,489
|
120,545
|
421,034
|
1,676,943
|
177,030
|
1,853,973
|
210,052
|
195,393
|
405,445
|
2,187,484
|
492,968
|
2,680,452
|
Source: NCSI. Statistical Yearbooks, 2009 to 2024
ANNEXED NOTE
1. Technical Notes and Definitions
Data for the governmental sector exclude Security and Defence personnels.
https://cbo.gov.om/sites/assets/Documents/English/Publications/AnnualReports/AnnualReport2017eng.pdf
Private sector includes Private, Communal and Other Sectors.
Omanis in the private sector are registered with the Public Authority for Social Insurance (PASI).
2020 and after: employment data is taken from National Registration system (includes insured and uninsured employees).
2. Institution which provides data
National Center for Statistics and Information (NCSI)
3. Data availability
The data on employment by sector and nationality is available in NCSI’s Statistical Yearbooks (chapter “Employment”)
https://www.ncsi.gov.om/Elibrary/LibraryContentDoc/bar_bar_Statistical%20Year%20Book%202024%20Issue%2052_a0f3084d-42a7-4183-83c0-3c9e603f89b5.pdf
https://www.ncsi.gov.om/Pages/Publications.aspx
Last date of access: September 2024.
GLMM and GRC cannot guarantee that the link to access the source will not change; that the information will not be removed from the website it was obtained from; that no geo-blockages will be imposed; or that the information will not be available for any another reason.
Keywords: Oman, Employment, Female Employment, Labour Market, National & Foreign Labour, Domestic Workers
|
|
Omanis
|
|
Government Sector
|
Private Sector
|
Domestic Sector
|
All sectors
|
|
Males
|
Females
|
Total
|
Males
|
Females
|
Total
|
Males
|
Females
|
Total
|
Males
|
Females
|
Total
|
|
2010
|
88,483
|
51,887
|
140,370
|
143,482
|
34,234
|
177,716
|
|
|
|
231,965
|
86,121
|
318,086
|
|
2011
|
94,639
|
64,619
|
159,258
|
139,878
|
34,563
|
174,441
|
0
|
0
|
0
|
234,517
|
99,182
|
333,699
|
|
2012
|
98,604
|
68,200
|
166,804
|
136,818
|
35,248
|
172,066
|
0
|
0
|
0
|
235,422
|
103,448
|
338,870
|
|
2013
|
106,281
|
74,456
|
180,737
|
143,860
|
38,000
|
181,860
|
0
|
0
|
0
|
250,141
|
112,456
|
362,597
|
|
2014
|
112,847
|
79,375
|
192,222
|
152,959
|
44,551
|
197,510
|
0
|
0
|
0
|
265,806
|
123,926
|
389,732
|
|
2015
|
114,133
|
79,832
|
193,965
|
159,375
|
50,245
|
209,620
|
0
|
0
|
0
|
273,508
|
130,077
|
403,585
|
|
2016
|
114,566
|
81,371
|
195,937
|
168,995
|
54,088
|
223,083
|
0
|
0
|
0
|
283,561
|
135,459
|
419,020
|
|
2017
|
113,642
|
82,038
|
195,680
|
178,021
|
60,667
|
238,688
|
0
|
0
|
0
|
291,663
|
142,705
|
434,368
|
|
2018
|
113,087
|
82,394
|
195,481
|
187,090
|
65,042
|
252,132
|
0
|
0
|
0
|
300,177
|
147,436
|
447,613
|
|
2019
|
118,257
|
84,636
|
202,893
|
191,768
|
70,565
|
262,333
|
0
|
0
|
0
|
310,025
|
155,201
|
465,226
|
|
2020
|
261,015
|
88,257
|
349,272
|
256,210
|
96,525
|
352,735
|
32,027
|
18,690
|
50,717
|
549,252
|
203,472
|
752,724
|
|
2021
|
262,067
|
89,164
|
351,231
|
266,125
|
108,481
|
374,606
|
29,693
|
18,256
|
47,949
|
557,885
|
215,901
|
773,786
|
|
2022
|
267,786
|
95,652
|
363,438
|
267,580
|
115,599
|
383,179
|
34,704
|
20,494
|
55,198
|
570,070
|
231,745
|
801,815
|
|
2023
|
271,687
|
105,169
|
376,856
|
275,334
|
124,469
|
399,803
|
55,534
|
21,011
|
76,545
|
602,555
|
250,649
|
853,204
|
Source: NCSI. Statistical Yearbooks, 2009 to 2024
ANNEXED NOTE
1. Technical Notes and Definitions
Data for the governmental sector exclude Security and Defence personnels.
https://cbo.gov.om/sites/assets/Documents/English/Publications/AnnualReports/AnnualReport2017eng.pdf
Private sector includes Private, Communal and Other Sectors.
Omanis in the private sector are registered with the Public Authority for Social Insurance (PASI).
2020 and after: employment data is taken from National Registration system (includes insured and uninsured employees).
2. Institution which provides data
National Center for Statistics and Information (NCSI)
3. Data availability
The data on employment by sector and nationality is available in NCSI’s Statistical Yearbooks (chapter “Employment”)
https://www.ncsi.gov.om/Elibrary/LibraryContentDoc/bar_bar_Statistical%20Year%20Book%202024%20Issue%2052_a0f3084d-42a7-4183-83c0-3c9e603f89b5.pdf
https://www.ncsi.gov.om/Pages/Publications.aspx
Last date of access: September 2024.
GLMM and GRC cannot guarantee that the link to access the source will not change; that the information will not be removed from the website it was obtained from; that no geo-blockages will be imposed; or that the information will not be available for any another reason.
Keywords: Oman, National Labour, Foreign Labour, Employment, Female Employment, Labour Market, National & Foreign Labour, Domestic Workers
|
|
Non-Omanis
|
|
Government Sector
|
Private Sector
|
Domestic Sector
|
All sectors
|
|
Males
|
Females
|
Total
|
Males
|
Females
|
Total
|
Males
|
Females
|
Total
|
Males
|
Females
|
Total
|
|
2010
|
15,842
|
7,770
|
23,612
|
842,149
|
20,060
|
862,209
|
20,739
|
72,682
|
93,421
|
878,730
|
100,512
|
979,242
|
|
2011
|
17,050
|
8,132
|
25,182
|
985,006
|
21,922
|
1,006,928
|
21,245
|
86,417
|
107,662
|
1,023,301
|
116,471
|
1,139,772
|
|
2012
|
18,495
|
9,027
|
27,522
|
1,165,357
|
24,943
|
1,190,300
|
22,322
|
103,560
|
125,882
|
1,206,174
|
137,530
|
1,343,704
|
|
2013
|
19,392
|
11,000
|
30,392
|
1,297,092
|
35,339
|
1,332,431
|
24,078
|
114,627
|
138,705
|
1,340,562
|
160,966
|
1,501,528
|
|
2014
|
20,536
|
13,075
|
33,611
|
1,240,426
|
29,787
|
1,270,213
|
109,017
|
131,163
|
240,180
|
1,369,979
|
174,025
|
1,544,004
|
|
2015
|
21,354
|
14,148
|
35,502
|
1,342,408
|
31,434
|
1,373,842
|
120,433
|
141,763
|
262,196
|
1,484,195
|
187,345
|
1,671,540
|
|
2016
|
23,914
|
13,710
|
37,624
|
1,469,483
|
35,453
|
1,504,936
|
134,296
|
148,747
|
283,043
|
1,627,693
|
197,910
|
1,825,603
|
|
2017
|
23,048
|
13,335
|
36,383
|
1,464,340
|
38,468
|
1,502,808
|
137,355
|
155,526
|
292,881
|
1,624,743
|
207,329
|
1,832,072
|
|
2018
|
22,607
|
12,811
|
35,418
|
1,395,278
|
39,875
|
1,435,153
|
136,431
|
158,129
|
294,560
|
1,554,316
|
210,815
|
1,765,131
|
|
2019
|
21,921
|
12,549
|
34,470
|
1,322,240
|
41,715
|
1,363,955
|
135,256
|
158,900
|
294,156
|
1,479,417
|
213,164
|
1,692,581
|
|
2020
|
30,461
|
13,451
|
43,912
|
1,078,982
|
36,340
|
1,115,322
|
123,178
|
128,864
|
252,042
|
1,232,621
|
178,655
|
1,411,276
|
|
2021
|
27,864
|
13,777
|
41,641
|
1,067,974
|
39,600
|
1,107,574
|
119,351
|
116,267
|
235,618
|
1,215,189
|
169,644
|
1,384,833
|
|
2022
|
28,158
|
15,898
|
44,056
|
1,314,124
|
45,652
|
1,359,776
|
147,520
|
155,956
|
303,476
|
1,489,802
|
217,506
|
1,707,308
|
|
2023
|
28,802
|
15,376
|
44,178
|
1,401,609
|
52,561
|
1,454,170
|
154,518
|
174,382
|
328,900
|
1,584,929
|
242,319
|
1,827,248
|
Source: NCSI. Statistical Yearbooks, 2009 to 2024
ANNEXED NOTE
1. Technical Notes and Definitions
Data for the governmental sector exclude Security and Defence personnels.
https://cbo.gov.om/sites/assets/Documents/English/Publications/AnnualReports/AnnualReport2017eng.pdf
Private sector includes Private, Communal and Other Sectors.
Omanis in the private sector are registered with the Public Authority for Social Insurance (PASI).
2020 and after: employment data is taken from National Registration system (includes insured and uninsured employees).
2. Institution which provides data
National Center for Statistics and Information (NCSI)
3. Data availability
The data on employment by sector and nationality is available in NCSI’s Statistical Yearbooks (chapter “Employment”)
https://www.ncsi.gov.om/Elibrary/LibraryContentDoc/bar_bar_Statistical%20Year%20Book%202024%20Issue%2052_a0f3084d-42a7-4183-83c0-3c9e603f89b5.pdf
https://www.ncsi.gov.om/Pages/Publications.aspx
Last date of access: September 2024.
GLMM and GRC cannot guarantee that the link to access the source will not change; that the information will not be removed from the website it was obtained from; that no geo-blockages will be imposed; or that the information will not be available for any another reason.
Keywords: Oman, National Labour, Foreign Labour, Employment, Female Employment, Labour Market, National & Foreign Labour, Domestic Workers
|
|
Omanis
|
Expatriates
|
Total
|
|
|
Males
|
Females
|
Total
|
Males
|
Females
|
Total
|
Males
|
Females
|
Total
|
|
2010
|
231,965
|
86,121
|
318,086
|
878,730
|
100,512
|
979,242
|
1,110,695
|
186,633
|
1,297,328
|
|
2011
|
234,517
|
99,182
|
333,699
|
1,023,301
|
116,471
|
1,139,772
|
1,257,818
|
215,653
|
1,473,471
|
|
2012
|
235,422
|
103,448
|
338,870
|
1,206,174
|
137,530
|
1,343,704
|
1,441,596
|
240,978
|
1,682,574
|
|
2013
|
250,141
|
112,456
|
362,597
|
1,340,562
|
160,966
|
1,501,528
|
1,590,703
|
273,422
|
1,864,125
|
|
2014
|
265,806
|
123,926
|
389,732
|
1,369,979
|
174,025
|
1,544,004
|
1,635,785
|
297,951
|
1,933,736
|
|
2015
|
273,508
|
130,077
|
403,585
|
1,484,195
|
187,345
|
1,671,540
|
1,757,703
|
317,422
|
2,075,125
|
|
2016
|
283,561
|
135,459
|
419,020
|
1,627,693
|
197,910
|
1,825,603
|
1,911,254
|
333,369
|
2,244,623
|
|
2017
|
291,663
|
142,705
|
434,368
|
1,624,743
|
207,329
|
1,832,072
|
1,916,406
|
350,034
|
2,266,440
|
|
2018
|
300,177
|
147,436
|
447,613
|
1,554,316
|
210,815
|
1,765,131
|
1,854,493
|
358,251
|
2,212,744
|
|
2019
|
310,025
|
155,201
|
465,226
|
1,479,417
|
213,164
|
1,692,581
|
1,789,442
|
368,365
|
2,157,807
|
|
2020
|
549,252
|
203,472
|
752,724
|
1,232,621
|
178,655
|
1,411,276
|
1,781,873
|
382,127
|
2,164,000
|
|
2021
|
557,885
|
215,901
|
773,786
|
1,215,189
|
169,644
|
1,384,833
|
1,773,074
|
385,545
|
2,158,619
|
|
2022
|
570,070
|
231,745
|
801,815
|
1,489,802
|
217,506
|
1,707,308
|
2,059,872
|
449,251
|
2,509,123
|
|
2023
|
602,555
|
250,649
|
853,204
|
1,584,929
|
242,319
|
1,827,248
|
2,187,484
|
492,968
|
2,680,452
|
Source: NCSI. Statistical Yearbooks, 2020 to 2024
ANNEXED NOTES
1. Technical Notes and Definitions
Data refer to the total employed population, in the governmental, private and domestic sectors.
Data for the governmental sector exclude Security and Defence personnels.
2020 and after: employment data is taken from National Registration system (includes insured and uninsured employees).
2. Institution which provides data
National Center for Statistics and Information (NCSI)
3. Data availability
The data on employment by sector and nationality is available in NCSI’s Statistical Yearbooks (chapter “Employment”)
https://www.ncsi.gov.om/Elibrary/LibraryContentDoc/bar_bar_Statistical%20Year%20Book%202024%20Issue%2052_a0f3084d-42a7-4183-83c0-3c9e603f89b5.pdf
https://www.ncsi.gov.om/Pages/Publications.aspx
Last date of access: 2 September 2024.
GLMM and GRC cannot guarantee that the link to access the source will not change; that the information will not be removed from the website it was obtained from; that no geo-blockages will be imposed; or that the information will not be available for any another reason.
Keywords: Oman, National Labour, Foreign Labour, Employment, Female Employment, Labour Market, National & Foreign Labour
|
|
Omanis
|
Expatriates
|
Total
|
|
2010
|
318,086
|
979,242
|
1,297,328
|
|
2011
|
333,699
|
1,139,772
|
1,473,471
|
|
2012
|
338,870
|
1,343,704
|
1,682,574
|
|
2013
|
362,597
|
1,501,528
|
1,864,125
|
|
2014
|
389,732
|
1,544,004
|
1,933,736
|
|
2015
|
403,585
|
1,671,540
|
2,075,125
|
|
2016
|
419,020
|
1,825,603
|
2,244,623
|
|
2017
|
434,368
|
1,832,072
|
2,266,440
|
|
2018
|
447,613
|
1,765,131
|
2,212,744
|
|
2019
|
465,226
|
1,692,581
|
2,157,807
|
|
2020
|
752,724
|
1,411,276
|
2,164,000
|
|
2021
|
773,786
|
1,384,833
|
2,158,619
|
|
2022
|
801,815
|
1,707,308
|
2,509,123
|
|
2023
|
853,204
|
1,827,248
|
2,680,452
|
Source: NCSI. Statistical Yearbooks, 2020 to 2024
ANNEXED NOTES
1. Technical Notes and Definitions
Data refer to the total employed population, in the governmental, private and domestic sectors.
Data for the governmental sector exclude Security and Defence personnels.
2020 and after: employment data is taken from National Registration system (includes insured and uninsured employees).
2. Institution which provides data
National Center for Statistics and Information (NCSI)
3. Data availability
The data on employment by sector and nationality is available in NCSI’s Statistical Yearbooks (chapter “Employment”)
https://www.ncsi.gov.om/Elibrary/LibraryContentDoc/bar_bar_Statistical%20Year%20Book%202024%20Issue%2052_a0f3084d-42a7-4183-83c0-3c9e603f89b5.pdf
https://www.ncsi.gov.om/Pages/Publications.aspx
Last date of access: 2 September 2024.
GLMM and GRC cannot guarantee that the link to access the source will not change; that the information will not be removed from the website it was obtained from; that no geo-blockages will be imposed; or that the information will not be available for any another reason.
Keywords: Oman, National Labour, Foreign Labour, Employment, Labour Market, National & Foreign Labour
|
|
Bahrain
|
Kuwait
|
Oman
|
Qatar
|
Saudi Arabia
|
UAE
|
|
Total pop. employed in private sector
|
Non-nationals employed in private sector
|
% non-nationals in private sector
|
Total pop. employed in private sector
|
Non-nationals employed in private sector
|
% non-nationals in private sector
|
Total pop. employed in private sector
|
Non-nationals employed in private sector
|
% non-nationals in private sector
|
Total labour force in private sector
|
Non-nationals in private sector
|
% non-nationals in private sector
|
Total pop. employed in private sector
|
Non-nationals employed in private sector
|
% non-nationals in private sector
|
Total pop. employed in private sector
|
|
2015
|
546,572
|
445,374
|
81.5
|
1,480,249
|
1,410,010
|
95.3
|
1,583,462
|
1,373,842
|
86.8
|
1,511,627
|
1,499,956
|
99.2
|
10,140,936
|
8,416,681
|
83.0
|
4,734,285
|
|
2016
|
611,229
|
509,062
|
83.3
|
1,580,347
|
1,509,087
|
95.5
|
1,728,019
|
1,504,936
|
87.1
|
1,602,630
|
1,592,577
|
99.4
|
10,168,137
|
8,492,965
|
83.5
|
4,851,582
|
|
2017
|
599,714
|
495,912
|
82.7
|
1,638,020
|
1,566,782
|
95.7
|
1,741,496
|
1,502,808
|
86.3
|
1,606,550
|
1,596,340
|
99.4
|
9,701,960
|
7,928,287
|
81.7
|
5,012,634
|
|
2018
|
608,220
|
503,006
|
82.7
|
1,698,528
|
1,625,589
|
95.7
|
1,687,285
|
1,435,153
|
85.1
|
1,652,818
|
1,642,498
|
99.4
|
8,599,487
|
6,895,514
|
80.2
|
4,980,272
|
|
2019
|
605,824
|
498,999
|
82.4
|
1,714,063
|
1,640,830
|
95.7
|
1,626,288
|
1,363,955
|
83.9
|
1,661,807
|
1,651,951
|
99.4
|
8,138,590
|
6,437,886
|
79.1
|
5,094,407
|
|
2020
|
564,641
|
460,022
|
81.5
|
1,567,114
|
1,494,133
|
95.3
|
1,468,057
|
1,115,322
|
76.0
|
1,710,948
|
1,702,251
|
99.5
|
8,026,901
|
6,280,145
|
78.2
|
4,799,196
|
|
2021
|
557,863
|
448,485
|
80.4
|
1,434,824
|
1,362,602
|
95.0
|
1,482,180
|
1,107,574
|
74.7
|
1,593,673
|
1,584,118
|
99.4
|
8,084,253
|
6,174,178
|
76.4
|
4,903,612
|
|
2022
|
609,547
|
496,318
|
81.4
|
1,572,384
|
1,500,551
|
95.4
|
1,742,955
|
1,359,776
|
78.0
|
1,675,213
|
1,665,285
|
99.4
|
9,422,233
|
7,227,688
|
76.7
|
NA
|
|
2023
|
NA
|
NA
|
NA
|
1,656,955
|
1,584,125
|
95.6
|
1,853,973
|
1,454,170
|
78.4
|
1,721,695
|
1,710,971
|
99.4
|
10,292,270
|
7,991,679
|
77.6
|
NA
|
Sources: national institutes of statistics and relevant national institutions
1- Definitions and remarks:
Non-nationals are:
1- persons bearing nationality of a foreign State other than the GCC State of residence, or bearing no proof of nationality from any given state (stateless persons and holders of refugee status and travel document in a third country);
2- Holders of residence permit residing in the given GCC country at date of census, as per definition of residence used in each of the countries.
Unless stated otherwise (if specific categories of workers are excluded from statistics, for instance), employment refers to: all persons of working age (15 and above), who during a reference period worked to produce goods or provide services for pay (cash or kind) or worked for profit from their own (or partially owned) business or worked without pay in the family business or with other individuals. It also includes those who have a temporary absence from a job during the reference period due to vacation or illness or any other reason.
Figures refer to workers employed in the private sector.
Reference period: end of year.
-
Q4 of quarterly data published for Bahrain, Kuwait, Saudi Arabia
-
Annual data published for Oman, Qatar, UAE.
Bahrain: employment data include all civilian employed persons in the private and public sectors (insured, uninsured and self-employed) and domestic workers.
Starting from Q1 2010, LMRA is using data from LMRA Expat management System (EMS) to produce the total number of foreign worker employment in public and private sectors.
No data on employment by sector after Q2 2023.
Kuwait: data are taken from administrative records. The Public Authority for Manpower (PAM) maintains statistics on workers in the private sector.
Oman: “Private sector” includes Private, Communal and Other Sectors.
2020 and after: employment data is taken from National Registration system (includes insured and uninsured employees).
Qatar: population of reference: labour force.
Labour Force Survey data are collected on a monthly basis, and based on field surveys.
Saudi Arabia: figures of workers in Labor Market statistics are taken from administrative records.
They do not include the following categories:
1-Workers in the military and security sectors
2- Workers who are not registered in the civil service, social insurance (GOSI) and domestic workers’ records, which include:
-
Saudis working for their own businesses and are not subjected to the labor regulations, also, not registered in social insurance, such as those who work in delivery through electronic apps
-
Saudi employers who work in establishments and not registered in the social insurance
-
Non-Saudi staff working in foreign, international, political or military missions
3- Non-Saudi employees who come to the Kingdom for work that normally takes less than three months to be completed.
UAE: total population (nationals+non-nationals) employed in private sector. Figures disaggregated by nationality are not available.
No data available after 2021.
2- Sources of data:
Bahrain: Labour Market Regulation Authority (LMRA). Bahrain Labour Market Indicators (BLMI), Q4 2022,
https://blmi.lmra.gov.bh/2022/12/mi_dashboard.xml
No data on employment by sector after Q2 2023.
Kuwait: Central Statistical Bureau. Integrated Database – LMIS, Q4 data, 2015 to 2023.
https://lmis.csb.gov.kw/
Oman: National Center for Statistics and Information (NCSI). Statistical Yearbook 2024, Chapter “Employment”
https://www.ncsi.gov.om/Elibrary/LibraryContentDoc/bar_bar_Statistical%20Year%20Book%202024%20Issue%2052_a0f3084d-42a7-4183-83c0-3c9e603f89b5.pdf
https://www.ncsi.gov.om/Pages/Publications.aspx
Qatar: Planning and Statistics Authority. Annual Bulletins of Labour Force Sample Surveys 2015 to 2023
https://www.psa.gov.qa/en/statistics1/pages/topicslisting.aspx?parent=Social&child=LaborForce
Saudi Arabia: General Authority for Statistics (GAStat). Labour Force Surveys 2017 to 2023, Q4 data.
https://www.stats.gov.sa/en/814
2015-2016: Saudi Arabia Central Bank (SAMA). Yearly statistics
https://www.sama.gov.sa/en-US/EconomicReports/Pages/report.aspx?cid=127
UAE: Labour Market Information System, Ministry of Human Resources and Emiratisation (MoHRE).
https://www.mohre.gov.ae/en/data-library/statistical-report.aspx
No data available since 2021.
Last accessed: 2 September 2024
GLMM and GRC cannot guarantee that the link to access the source will not change; that the information will not be removed from the website it was obtained from; that no geo-blockages will be imposed; or that the information will not be available for any another reason.
Keywords: Bahrain, Kuwait, Oman, Qatar, Saudi Arabia, United Arab Emirates, Employment, Female Employment, Labour Market, National & Foreign Labour
|
|
Saudis
|
Non-Saudis
|
Total
|
|
|
Males
|
Females
|
Total
|
Males
|
Females
|
Total
|
Males
|
Females
|
Total
|
|
2021 Q1
|
64.8
|
31.9
|
48.3
|
93.6
|
38.5
|
82.0
|
82.2
|
33.8
|
64.8
|
|
2021 Q2
|
65.0
|
32.1
|
48.5
|
92.8
|
38.5
|
81.0
|
81.4
|
33.9
|
64.1
|
|
2021 Q3
|
65.1
|
34.3
|
49.6
|
92.7
|
41.0
|
81.2
|
81.2
|
36.2
|
64.6
|
|
2021 Q4
|
65.6
|
34.7
|
50.1
|
92.6
|
34.0
|
79.8
|
81.5
|
34.5
|
64.4
|
|
2022 Q1
|
65.1
|
33.3
|
49.1
|
91.6
|
33.4
|
79.3
|
81.0
|
33.3
|
63.9
|
|
2022 Q2
|
66.5
|
35.1
|
50.8
|
92.9
|
32.5
|
80.4
|
82.6
|
34.3
|
65.4
|
|
2022 Q3
|
66.3
|
36.5
|
51.4
|
93.9
|
32.8
|
81.1
|
83.2
|
35.4
|
66.3
|
|
2022 Q4
|
67.3
|
35.5
|
51.5
|
94.0
|
32.1
|
81.3
|
83.8
|
34.5
|
66.5
|
|
2023 Q1
|
67.1
|
35.5
|
51.4
|
93.9
|
34.8
|
81.9
|
83.8
|
35.3
|
66.9
|
|
2023 Q2
|
66.3
|
34.8
|
50.7
|
93.5
|
31.9
|
80.8
|
83.2
|
33.9
|
66.1
|
|
2023 Q3
|
65.7
|
35.4
|
50.8
|
93.8
|
32.6
|
81.2
|
83.2
|
34.6
|
66.4
|
|
2023 Q4
|
65.4
|
35.0
|
50.4
|
95.3
|
33.8
|
82.5
|
84.1
|
34.6
|
67.0
|
|
2024 Q1
|
66.4
|
35.8
|
51.4
|
93.3
|
28.3
|
79.6
|
83.2
|
33.4
|
66.0
|
Source: Labour Market Statistics, Statistical Database, General Authority for Statistics (GAStat)
1. Data collection methodology and definitions used
Labour Force Surveys were first conducted in 2001 and became bi-annual after 2006. Data were collected through nationally-representative household sample surveys, which sampling was based on most recent censuses.
Since 2016, Labour Force Surveys have been conducted and published on a quarterly basis, based on the following sources:
1. Household telephone surveys conducted by GAStat.
2. Employment data extracted from administrative records, introduced as a complement to the results of Labour Force Surveys in Labour Market Statistics’ publications, starting on Q1 2017.
Types of data by source:
1. Household Telephone Surveys:
Estimates of labor force, characteristics of the unemployed and inactive
The survey provides estimates of the working-age populations (aged 15 years and above), inside and outside the labour force, the characteristics of the inactive and unemployed populations), and supplies the data to calculate key indicators of labour market such as the unemployment and the labour force participation rates.
2. Administrative records:
– Ministry of Human Resources and Social Development (MHRSD)
(formerly Ministry of Labour and Social Development):
Supplies data on:
Employees on the job Subject to the rules and regulations of the Civil Service
– General Organization of Social Insurance (GOSI):
Supplies data on:
a. contributors on the job who are subject to social insurance laws and regulations in the private
and government sector;
b. new contributors, and contributors who terminated their contribution to social insurance during the quarter.
– National Information Center (NIC):
Supplies data on:
a. domestic workers.
The present data is based on estimates drawn from the results of the quarterly Labour Force Survey, revised on the basis of the results of census 2022.
LFS results are published as rates only. Numerical estimates are unavailable.
Household survey questionnaire:
https://www.stats.gov.sa/sites/default/files/2021_Q3_LFS%20Questionnaire_EN%2022-08-2021.pdf
Definitions:
Population in the labour force:
Individuals (15 years and above) who contribute or are ready to contribute to the production of commodities and services during the reference period of the survey. The labour force includes the employed and unemployed populations.
Population outside the labour force:
Individuals (15 years and above) who is not classified as part of the labour force because they do not work, do not seek a job, are unable to work, or are not ready to work during the survey reference period.
For example: Students, housewives, retired persons who do not work, individuals unable or unwilling to work, or who do not look for a job for other reasons.
Labour force participation rate = (total labour force ÷ total population of working age (aged 15 years and over)) x 100
As of July 2024, Labour Force Survey data from Q1 2021 to Q1 2024 were revised and backcasted, based on 2022 population census results. Therefore, the present rates may differ from earlier estimates based on previous Labour Force Surveys’ sampling base.
Technical note on backcasting:
https://portal.saudicensus.sa/static-assets/media/content/20230529_Back-Casting%20Methodology.pdf?crafterSite=gastat-portal
Definitions and categories used by GAStat in Labour Markets Statistics (employment; unemployment; occupation and activity sectors, etc.) are based on international standards:
For LFS methodology and definitions, see:
https://www.stats.gov.sa/en/node/9787
https://database.stats.gov.sa/Methodologies/En_Documents/03_Labor%20Market%20Bulletin%20Methodology,%20Fourth%20Quarter%202020%20_%20General%20Authority%20for%20Statistics.pdf
2. Institution which provides data
General Authority for Statistics (GAStat)
3. Data availability
Since 2021, GAStat has been publishing separately the employment data taken from administrative records, and unemployment/inactivity data as well as general indicators, calculated from the results of the field interviews conducted by GAStat (Labour Force Survey).
The present time-series was taken from the Labour Market Statistics- Q1, 2024 (Excel and PDF formats)
https://www.stats.gov.sa/sites/default/files/LM%20tables_Q1_2024_EN_0.xlsx
https://www.stats.gov.sa/sites/default/files/LMS%20Q1_2024_PR_EN_0.pdf
https://www.stats.gov.sa/sites/default/files/LM%20tables_Q1_2024_AR_1.xlsx
https://www.stats.gov.sa/sites/default/files/LMS%20Q1_2024_PR_AR_0.pdf
Quarterly Register-based Labour Market Statistics reports are accessible from:
https://www.stats.gov.sa/en/814
https://www.stats.gov.sa/ar/814
Date of access: 22 July 2024.
Keywords: Employment, Unemployment, Female Employment, Saudi Arabia, National & Foreign Labour
GLMM and GRC cannot guarantee that the link to access the source will not change; that the information will not be removed from the website it was obtained from; that no geo-blockages will be imposed; or that the information will not be available for any another reason.
|
|
Males
|
Females
|
Total
|
|
2000
|
2,249,793
|
919,429
|
3,169,222
|
|
2001
|
2,372,568
|
973,271
|
3,345,839
|
|
2002
|
2,514,249
|
1,031,752
|
3,546,001
|
|
2003
|
2,739,191
|
1,126,470
|
3,865,661
|
|
2004
|
2,979,251
|
1,250,607
|
4,229,858
|
|
2005
|
3,206,550
|
1,378,878
|
4,585,428
|
|
2006
|
3,398,181
|
1,511,601
|
4,909,782
|
|
2007
|
3,842,795
|
1,752,357
|
5,595,152
|
|
2008
|
4,429,652
|
2,068,246
|
6,497,898
|
|
2009
|
4,574,201
|
2,199,987
|
6,774,188
|
|
2010
|
4,655,257
|
2,310,231
|
6,965,488
|
|
2011
|
4,793,049
|
2,450,539
|
7,243,588
|
|
2012
|
4,937,649
|
2,601,658
|
7,539,307
|
|
2013
|
5,129,965
|
2,716,790
|
7,846,755
|
|
2014
|
5,396,717
|
2,875,407
|
8,272,124
|
|
2015
|
5,690,481
|
3,047,869
|
8,738,350
|
|
2016
|
5,931,800
|
3,200,039
|
9,131,839
|
|
2017
|
6,037,711
|
3,276,900
|
9,314,611
|
|
2018
|
6,064,682
|
3,314,109
|
9,378,791
|
|
2019
|
6,139,696
|
3,373,082
|
9,512,778
|
|
2020
|
5,984,973
|
3,304,324
|
9,289,297
|
|
2021
|
6,325,310
|
3,535,697
|
9,861,007
|
|
2022
|
6,595,692
|
3,693,254
|
10,288,946
|
|
*2023
|
6,842,905
|
3,835,651
|
10,678,556
|
Source: Federal Competitiveness and Statistics Centre (FCSC)
(*): Preliminary data
ANNEXED NOTE
1. Characteristics of data
Definition: Population count is the total count of all persons living within the boundaries of the country at a specific time with their demographic characteristics, taken from the official administrative records of the country.
Source of the estimate: administrative records
Period of reference: not stated.
Data disaggregated by nationality (Emiratis/ non-Emiratis) are unavailable in published statistics.
2. Institution which provides data
Federal Competitiveness and Statistics Centre (FCSC)
https://fcsc.gov.ae/en-us/
3. Data availability
The data is taken from the “Statistics” section of FCSC’s website (“Statistics by subject”, then “Population and Social” sections).
https://fcsc.gov.ae/en-us/Pages/Statistics/Statistics.aspx
Date of access: 22 July 2024.
GLMM and GRC cannot guarantee that the link to access the source will not change; that the information will not be removed from the website it was obtained from; that no geo-blockages will be imposed; or that the information will not be available for any another reason.
Keywords: United Arab Emirates, Population
|
|
Males
|
Females
|
Total
|
|
Ethiopia
|
44,200
|
115,100
|
159,300
|
|
Uganda
|
8,200
|
119,800
|
128,000
|
|
Kenya
|
10,900
|
80,900
|
91,800
|
|
Nigeria
|
37,400
|
42,200
|
79,600
|
|
Eritrea
|
22,200
|
25,100
|
47,300
|
|
Chad
|
20,500
|
25,700
|
46,200
|
|
Somalia
|
22,800
|
22,900
|
45,700
|
|
Mali
|
18,900
|
19,500
|
38,400
|
|
Niger
|
16,200
|
17,400
|
33,600
|
|
Ghana
|
6,600
|
7,600
|
14,200
|
|
Burundi
|
200
|
5,700
|
5,900
|
|
Burkina Faso
|
2,700
|
2,400
|
5,100
|
|
South Africa
|
2,300
|
2,500
|
4,800
|
|
Senegal
|
2,100
|
700
|
2,800
|
|
Djibouti
|
1,000
|
800
|
1,800
|
|
Guinea
|
900
|
500
|
1,400
|
|
Cameroon
|
700
|
700
|
1,400
|
|
Madagascar
|
0
|
1,300
|
1,300
|
|
Tanzania
|
900
|
300
|
1,200
|
|
Ivory Coast
|
700
|
400
|
1,100
|
|
Gambia
|
600
|
300
|
900
|
|
Benin
|
400
|
100
|
500
|
|
Sierra Leone
|
300
|
100
|
400
|
|
Zimbabwe
|
200
|
100
|
300
|
|
Others
|
2,000
|
500
|
2,500
|
|
Total
|
222,900
|
492,600
|
715,500
|
Source: GAStat, Saudi Arabia census 2022
ANNEXED NOTE
1. Technical Notes and Definitions
GLMM’s retabulation and reformatting of census data in thousands in dashboard figure: “Non-Saudi population by nationality and gender” https://portal.saudicensus.sa/portal/public/1/18/41?type=DASHBOARD
Source of data: Saudi census 2022.
Date of reference: 10 May 2022
Population of reference: Families and individual citizens and residents within the Kingdom, regardless of the status of their identification documents. Visitors for Hajj, Umrah and tourism are excluded from the census.
Methodology:
The first phase of the 2020 census began on 3 February 2020 (enumeration of buildings and households). Census 2022 used geospatial data, including satellite images, electricity consumption and mobile phone data, to improve the accuracy and geographic coverage of address canvassing.
The second stage (“actual enumeration”) was due to start on the original reference date (17 March 2020), but was suspended by the outbreak of the COVID-19 crisis. This stage was conducted in October 2021.
The 2022 census used a combined methodology – administrative records, fieldwork and digital self-enumeration. Household data were collected from e-portals of self-enumeration (on residents’ mobile devices, laptops or personal computers, or self-enumeration stations/kiosks, located in shopping centers). The digital self-enumeration process was complemented by face-to-face interviews, using digital tablets.
Census 2022 used a de jure approach: enumerating people according to their usual place of residence.
Administrative data from multiple sources was used to cross-validate collected census data.
Census 2022 was designed as a launchpad for several new secure statistical data registers for population, housing, and businesses.
See census methodology in:
https://portal.saudicensus.sa/portal/public/methodology
Portal of the Saudi census:
https://portal.saudicensus.sa/portal
Population data for 2010-22 were revised and backcasted, based on 2022 population census and past years’ administrative data.
Technical note on backcasting:
https://portal.saudicensus.sa/static-assets/media/content/20230529_Back-Casting%20Methodology.pdf?crafterSite=gastat-portal
2. Institution which provides data
General Authority for Statistics (GAStat)
3. Data availability
The data was retrieved from the Saudi census portal on GAStat website:
https://portal.saudicensus.sa/portal
“Population” section, then “dashboard” section
https://portal.saudicensus.sa/portal/public/1/18/41?type=DASHBOARD
Date of access: 21 May 2024.
GLMM and GRC cannot guarantee that the link to access the source will not change; that the information will not be removed from the website it was obtained from; that no geo-blockages will be imposed; or that the information will not be available for any another reason.
Keywords: Saudi Arabia, Foreign Population, Africa, Ethiopia, Uganda, Kenya, Nigeria, Eritrea, Chad, Somalia, Mali, Niger, Ghana, Burundi, Burkina Faso, South Africa, Senegal, Djibouti, Guinea, Cameroon, Madagascar, Tanzania, Ivory Coast, Gambia, Benin, Sierra Leone, Zimbabwe
|
|
Saudis
|
Non-Saudis
|
Total
|
|
Makkah Al Mukarramah
|
26.5
|
33.7
|
30.0
|
|
Ar Riyadh
|
25.7
|
33.6
|
29.5
|
|
Eastern Region
|
25.3
|
34.7
|
29.3
|
|
Al Bahah
|
26.7
|
35.3
|
28.9
|
|
Aseer
|
25.4
|
35.2
|
28.2
|
|
Al Madinah Al Munawwarah
|
25.0
|
33.8
|
28.2
|
|
Al Qaseem
|
25.5
|
34.2
|
28.1
|
|
Hail
|
24.9
|
35.5
|
28.0
|
|
Jazan
|
25.5
|
32.1
|
27.4
|
|
Tabuk
|
23.6
|
35.4
|
26.9
|
|
Najran
|
23.0
|
32.4
|
26.1
|
|
Northern Borders
|
22.9
|
33.8
|
25.9
|
|
Al Jawf
|
21.7
|
35.4
|
25.3
|
|
Total
|
25.4
|
33.9
|
29.0
|
Source: GAStat, Saudi Arabia census 2022
ANNEXED NOTE
1. Technical Notes and Definitions
The average age corresponds to the arithmetic mean of all ages of the total of the population.
Source of data: Saudi census 2022.
Date of reference: 10 May 2022
Population of reference: Families and individual citizens and residents within the Kingdom, regardless of the status of their identification documents. Visitors for Hajj, Umrah and tourism are excluded from the census.
Methodology:
The first phase of the 2020 census began on 3 February 2020 (enumeration of buildings and households). Census 2022 used geospatial data, including satellite images, electricity consumption and mobile phone data, to improve the accuracy and geographic coverage of address canvassing.
The second stage (“actual enumeration”) was due to start on the original reference date (17 March 2020), but was suspended by the outbreak of the COVID-19 crisis. This stage was conducted in October 2021.
The 2022 census used a combined methodology – administrative records, fieldwork and digital self-enumeration. Household data were collected from e-portals of self-enumeration (on residents’ mobile devices, laptops or personal computers, or self-enumeration stations/kiosks, located in shopping centers). The digital self-enumeration process was complemented by face-to-face interviews, using digital tablets.
Census 2022 used a de jure approach: enumerating people according to their usual place of residence.
Administrative data from multiple sources was used to cross-validate collected census data.
Census 2022 was designed as a launchpad for several new secure statistical data registers for population, housing, and businesses.
See census methodology in:
https://portal.saudicensus.sa/portal/public/methodology
Portal of the Saudi census:
https://portal.saudicensus.sa/portal
Population data for 2010-22 were revised and backcasted, based on 2022 population census and past years’ administrative data.
Technical note on backcasting:
https://portal.saudicensus.sa/static-assets/media/content/20230529_Back-Casting%20Methodology.pdf?crafterSite=gastat-portal
2. Institution which provides data
General Authority for Statistics (GAStat)
3. Data availability
The table was retrieved from the Saudi census portal on GAStat website:
https://portal.saudicensus.sa/portal
“Population” section, then “data tables”-
https://portal.saudicensus.sa/portal/public/1/15?type=TABLE
Selected, pre-set tables can be downloaded from the thematic section.
Date of access: 21 May 2024.
GLMM and GRC cannot guarantee that the link to access the source will not change; that the information will not be removed from the website it was obtained from; that no geo-blockages will be imposed; or that the information will not be available for any another reason.
Keywords: Saudi Arabia, Foreign Population, National Population, Foreign & National Populations
|
|
Saudis
|
Non-Saudis
|
Total
|
|
Makkah Al Mukarramah
|
26.5
|
33.7
|
30.0
|
|
Ar Riyadh
|
25.7
|
33.6
|
29.5
|
|
Eastern Region
|
25.3
|
34.7
|
29.3
|
|
Al Bahah
|
26.7
|
35.3
|
28.9
|
|
Aseer
|
25.4
|
35.2
|
28.2
|
|
Al Madinah Al Munawwarah
|
25.0
|
33.8
|
28.2
|
|
Al Qaseem
|
25.5
|
34.2
|
28.1
|
|
Hail
|
24.9
|
35.5
|
28.0
|
|
Jazan
|
25.5
|
32.1
|
27.4
|
|
Tabuk
|
23.6
|
35.4
|
26.9
|
|
Najran
|
23.0
|
32.4
|
26.1
|
|
Northern Borders
|
22.9
|
33.8
|
25.9
|
|
Al Jawf
|
21.7
|
35.4
|
25.3
|
|
Total
|
25.4
|
33.9
|
29.0
|
Source: GAStat, Saudi Arabia census 2022
ANNEXED NOTE
1. Technical Notes and Definitions
The median age indicates the age of the individual in a population with 50% of the population being younger and 50% being older than the individual.
Source of data: Saudi census 2022:
Date of reference: 10 May 2022
Population of reference: Families and individual citizens and residents within the Kingdom, regardless of the status of their identification documents. Visitors for Hajj, Umrah and tourism are excluded from the census.
Methodology:
The first phase of the 2020 census began on 3 February 2020 (enumeration of buildings and households). Census 2022 used geospatial data, including satellite images, electricity consumption and mobile phone data, to improve the accuracy and geographic coverage of address canvassing.
The second stage (“actual enumeration”) was due to start on the original reference date (17 March 2020), but was suspended by the outbreak of the COVID-19 crisis. This stage was conducted in October 2021.
The 2022 census used a combined methodology – administrative records, fieldwork and digital self-enumeration. Household data were collected from e-portals of self-enumeration (on residents’ mobile devices, laptops or personal computers, or self-enumeration stations/kiosks, located in shopping centers). The digital self-enumeration process was complemented by face-to-face interviews, using digital tablets.
Census 2022 used a de jure approach: enumerating people according to their usual place of residence.
Administrative data from multiple sources was used to cross-validate collected census data.
Census 2022 was designed as a launchpad for several new secure statistical data registers for population, housing, and businesses.
See census methodology in:
https://portal.saudicensus.sa/portal/public/methodology
Portal of the Saudi census:
https://portal.saudicensus.sa/portal
Population data for 2010-22 were revised and backcasted, based on 2022 population census and past years’ administrative data.
Technical note on backcasting:
https://portal.saudicensus.sa/static-assets/media/content/20230529_Back-Casting%20Methodology.pdf?crafterSite=gastat-portal
2. Institution which provides data
General Authority for Statistics (GAStat)
3. Data availability
The table was retrieved from the Saudi census portal on GAStat website:
https://portal.saudicensus.sa/portal
“Population” section, then “data tables”-
https://portal.saudicensus.sa/portal/public/1/15?type=TABLE
Selected, pre-set tables can be downloaded from the thematic section.
Date of access: 21 May 2024.
GLMM and GRC cannot guarantee that the link to access the source will not change; that the information will not be removed from the website it was obtained from; that no geo-blockages will be imposed; or that the information will not be available for any another reason.
Keywords: Saudi Arabia, Foreign Population, National Population, Foreign & National Populations
|
|
2010
|
2011
|
2012
|
2013
|
2014
|
2015
|
2016
|
2017
|
2018
|
2019
|
2020
|
2021
|
2022
|
|
Saudis
|
Males
|
19
|
19
|
19
|
19
|
20
|
20
|
20
|
21
|
21
|
21
|
21
|
22
|
22
|
|
Females
|
19
|
19
|
20
|
20
|
20
|
21
|
21
|
21
|
21
|
22
|
22
|
22
|
23
|
|
Total
|
19
|
19
|
19
|
20
|
20
|
20
|
21
|
21
|
21
|
21
|
22
|
22
|
22
|
|
Non-Saudis
|
Males
|
24
|
26
|
28
|
30
|
31
|
32
|
34
|
34
|
35
|
35
|
35
|
35
|
35
|
|
Females
|
24
|
25
|
26
|
27
|
27
|
28
|
29
|
30
|
30
|
30
|
30
|
31
|
31
|
|
Total
|
24
|
26
|
27
|
29
|
30
|
31
|
33
|
33
|
34
|
34
|
34
|
34
|
34
|
|
Total
|
Males
|
23
|
24
|
25
|
27
|
28
|
29
|
30
|
31
|
31
|
31
|
31
|
31
|
31
|
|
Females
|
21
|
22
|
22
|
23
|
23
|
24
|
24
|
24
|
25
|
25
|
25
|
25
|
26
|
|
Total
|
22
|
23
|
24
|
26
|
26
|
27
|
28
|
29
|
29
|
29
|
29
|
29
|
29
|
Source: General Authority for Statistics (GAStat)
ANNEXED NOTE
1. Technical Notes and Definitions
The median age indicates the age of the individual in a population with 50% of the population being younger and 50% being older than the individual.
The median age for 2022 is calculated on the basis of census 2022′ results. Estimates for the years 2010-2021 are calculated using a backcasting methodology (see below).
Source of data: Saudi census 2022
Date of reference: 10 May 2022
Population of reference: Families and individual citizens and residents within the Kingdom, regardless of the status of their identification documents.
Visitors for Hajj, Umrah and tourism are excluded from the census.
Methodology:
The first phase of the 2020 census began on 3 February 2020 (enumeration of buildings and households). Census 2022 used geospatial data, including satellite images, electricity consumption and mobile phone data, to improve the accuracy and geographic coverage of address canvassing.
The second stage (“actual enumeration”) was due to start on the original reference date (17 March 2020), but was suspended by the outbreak of the COVID-19 crisis. This stage was conducted in October 2021.
The 2022 census used a combined methodology – administrative records, fieldwork and digital self-enumeration.
Household data were collected from e-portals of self-enumeration (on residents’ mobile devices, laptops or personal computers, or self-enumeration stations/kiosks, located in shopping centers).
The digital self-enumeration process was complemented by face-to-face interviews, using digital tablets.
Census 2022 used a de jure approach: enumerating people according to their usual place of residence.
Administrative data from multiple sources was used to cross-validate collected census data.
Census 2022 was designed as a launchpad for several new secure statistical data registers for population, housing, and businesses.
See census methodology in:
https://portal.saudicensus.sa/portal/public/methodology
Portal of the Saudi census:
https://portal.saudicensus.sa/portal
Population data for 2010-22 were revised and backcasted, based on 2022 population census and past years’ administrative data.
Technical note on backcasting:
https://portal.saudicensus.sa/static-assets/media/content/20230529_Back-Casting%20Methodology.pdf?crafterSite=gastat-portal
2. Institution which provides data
General Authority for Statistics (GAStat)
3. Data availability
The time series were taken from GAStat’s statistical database:
https://database.stats.gov.sa/home/landing
Report Link:
https://database.stats.gov.sa/home/indicator/535
(includes metadata)
Date of access: 07 June 2024.
GLMM and GRC cannot guarantee that the link to access the source will not change; that the information will not be removed from the website it was obtained from; that no geo-blockages will be imposed; or that the information will not be available for any another reason.
Keywords: Saudi Arabia, Foreign Population, National Population, Foreign & National Populations
|
|
2011
|
2012
|
2013
|
2014
|
2015
|
2016
|
2017
|
2018
|
2019
|
2020
|
2021
|
2022
|
|
Ar Riyadh
|
2.1%
|
2.4%
|
2.7%
|
3.1%
|
2.8%
|
2.5%
|
2.1%
|
2.3%
|
2.5%
|
2.7%
|
2.3%
|
2.3%
|
|
Makkah Al Mukarramah
|
2.2%
|
2.4%
|
2.8%
|
3.1%
|
2.9%
|
2.5%
|
2.2%
|
2.4%
|
2.6%
|
2.8%
|
2.3%
|
2.3%
|
|
Eastern Region
|
2.1%
|
2.4%
|
2.7%
|
3.1%
|
2.8%
|
2.5%
|
2.1%
|
2.4%
|
2.5%
|
2.7%
|
2.2%
|
2.2%
|
|
Aseer
|
2.1%
|
2.3%
|
2.6%
|
2.9%
|
2.7%
|
2.4%
|
2.1%
|
2.3%
|
2.4%
|
2.7%
|
2.2%
|
2.2%
|
|
Al Madinah Al Munawwarah
|
2.1%
|
2.3%
|
2.6%
|
3.0%
|
2.7%
|
2.4%
|
2.1%
|
2.3%
|
2.4%
|
2.6%
|
2.2%
|
2.2%
|
|
Jazan
|
2.1%
|
2.3%
|
2.7%
|
3.0%
|
2.8%
|
2.4%
|
2.1%
|
2.3%
|
2.5%
|
2.7%
|
2.2%
|
2.2%
|
|
Al Qaseem
|
2.1%
|
2.3%
|
2.7%
|
3.0%
|
2.8%
|
2.4%
|
2.1%
|
2.3%
|
2.5%
|
2.7%
|
2.2%
|
2.2%
|
|
Tabuk
|
2.0%
|
2.3%
|
2.6%
|
2.9%
|
2.7%
|
2.3%
|
2.0%
|
2.2%
|
2.3%
|
2.5%
|
2.1%
|
2.1%
|
|
Hail
|
2.1%
|
2.3%
|
2.6%
|
3.0%
|
2.7%
|
2.4%
|
2.0%
|
2.3%
|
2.4%
|
2.6%
|
2.2%
|
2.2%
|
|
Al Jawf
|
1.9%
|
2.1%
|
2.4%
|
2.8%
|
2.5%
|
2.2%
|
1.9%
|
2.1%
|
2.2%
|
2.3%
|
1.9%
|
1.9%
|
|
Najran
|
2.0%
|
2.2%
|
2.5%
|
2.8%
|
2.6%
|
2.3%
|
2.0%
|
2.2%
|
2.3%
|
2.5%
|
2.0%
|
2.0%
|
|
Northern Borders
|
2.0%
|
2.2%
|
2.5%
|
2.8%
|
2.6%
|
2.3%
|
1.9%
|
2.2%
|
2.2%
|
2.4%
|
2.0%
|
2.0%
|
|
Al Bahah
|
2.1%
|
2.3%
|
2.7%
|
3.0%
|
2.8%
|
2.4%
|
2.1%
|
2.4%
|
2.5%
|
2.8%
|
2.3%
|
2.4%
|
|
Total
|
2.1%
|
2.4%
|
2.7%
|
3.0%
|
2.8%
|
2.4%
|
2.1%
|
2.3%
|
2.5%
|
2.7%
|
2.2%
|
2.2%
|
Source: GAStat, Saudi Arabia census 2022
ANNEXED NOTE
1. Technical Notes and Definitions
Source: Saudi census 2022
Date of reference: 10 May 2022
Population of reference: Families and individual citizens and residents within the Kingdom, regardless of the status of their identification documents. Visitors for Hajj, Umrah and tourism are excluded from the census.
Methodology:
The first phase of the 2020 census began on 3 February 2020 (enumeration of buildings and households). Census 2022 used geospatial data, including satellite images, electricity consumption and mobile phone data, to improve the accuracy and geographic coverage of address canvassing.
The second stage (“actual enumeration”) was due to start on the original reference date (17 March 2020), but was suspended by the outbreak of the COVID-19 crisis. This stage was conducted in October 2021.
The 2022 census used a combined methodology – administrative records, fieldwork and digital self-enumeration. Household data were collected from e-portals of self-enumeration (on residents’ mobile devices, laptops or personal computers, or self-enumeration stations/kiosks, located in shopping centers). The digital self-enumeration process was complemented by face-to-face interviews, using digital tablets.
Census 2022 used a de jure approach: enumerating people according to their usual place of residence.
Administrative data from multiple sources was used to cross-validate collected census data.
Census 2022 was designed as a launchpad for several new secure statistical data registers for population, housing, and businesses.
See census methodology in:
https://portal.saudicensus.sa/portal/public/methodology
Portal of the Saudi census:
https://portal.saudicensus.sa/portal
Population data for 2010-22 were revised and backcasted, based on 2022 population census and past years’ administrative data.
Technical note on backcasting:
https://portal.saudicensus.sa/static-assets/media/content/20230529_Back-Casting%20Methodology.pdf?crafterSite=gastat-portal
2. Institution which provides data
General Authority for Statistics (GAStat)
3. Data availability
The table was retrieved from the Saudi census portal on GAStat website:
https://portal.saudicensus.sa/portal
“Population” section, then “data tables”-
https://portal.saudicensus.sa/portal/public/1/15?type=TABLE
Selected, pre-set tables can be downloaded from the thematic section.
Date of access: 21 May 2024.
GLMM and GRC cannot guarantee that the link to access the source will not change; that the information will not be removed from the website it was obtained from; that no geo-blockages will be imposed; or that the information will not be available for any another reason.
Keywords: Saudi Arabia, Foreign Population, National Population, Foreign & National Populations
|
|
2011
|
2012
|
2013
|
2014
|
2015
|
2016
|
2017
|
2018
|
2019
|
2020
|
2021
|
2022
|
|
Makkah Al Mukarramah
|
6.8%
|
5.5%
|
7.9%
|
0.8%
|
7.0%
|
4.2%
|
-3.0%
|
-9.0%
|
-5.2%
|
7.1%
|
-9.5%
|
6.5%
|
|
Ar Riyadh
|
8.8%
|
7.4%
|
9.7%
|
2.3%
|
8.9%
|
5.9%
|
-1.7%
|
-7.8%
|
-3.8%
|
8.6%
|
-8.2%
|
8.3%
|
|
Eastern Region
|
9.6%
|
8.1%
|
10.4%
|
2.7%
|
9.6%
|
6.5%
|
-1.6%
|
-7.6%
|
-3.5%
|
8.8%
|
-8.0%
|
9.1%
|
|
Al Madinah Al Munawwarah
|
7.7%
|
6.4%
|
8.8%
|
1.6%
|
8.0%
|
5.1%
|
-2.4%
|
-8.4%
|
-4.5%
|
7.8%
|
-8.9%
|
7.6%
|
|
Aseer
|
9.6%
|
8.1%
|
10.5%
|
2.7%
|
9.8%
|
6.6%
|
-1.6%
|
-7.6%
|
-3.5%
|
8.7%
|
-8.0%
|
9.3%
|
|
Al Qaseem
|
7.7%
|
6.2%
|
8.4%
|
0.8%
|
7.7%
|
4.5%
|
-3.4%
|
-9.3%
|
-5.3%
|
6.8%
|
-9.7%
|
7.0%
|
|
Jazan
|
7.8%
|
6.4%
|
8.8%
|
1.5%
|
8.0%
|
5.0%
|
-2.4%
|
-8.4%
|
-4.5%
|
7.8%
|
-8.9%
|
7.4%
|
|
Tabuk
|
10.2%
|
8.8%
|
11.1%
|
3.3%
|
10.3%
|
7.1%
|
-1.1%
|
-7.1%
|
-3.0%
|
9.3%
|
-7.5%
|
9.8%
|
|
Hail
|
10.7%
|
9.1%
|
11.4%
|
3.6%
|
10.6%
|
7.4%
|
-0.8%
|
-6.8%
|
-2.7%
|
9.6%
|
-7.2%
|
9.9%
|
|
Najran
|
10.2%
|
8.7%
|
11.0%
|
3.4%
|
10.1%
|
7.0%
|
-0.8%
|
-6.9%
|
-2.9%
|
9.6%
|
-7.4%
|
9.4%
|
|
Al Jawf
|
9.5%
|
8.0%
|
10.3%
|
2.5%
|
9.5%
|
6.3%
|
-1.7%
|
-7.7%
|
-3.7%
|
8.6%
|
-8.1%
|
8.9%
|
|
Al Bahah
|
7.4%
|
5.9%
|
8.2%
|
0.5%
|
7.4%
|
4.3%
|
-3.7%
|
-9.5%
|
-5.6%
|
6.5%
|
-9.9%
|
6.7%
|
|
Northern Borders
|
10.5%
|
8.9%
|
11.2%
|
3.4%
|
10.3%
|
7.1%
|
-0.8%
|
-6.9%
|
-2.9%
|
9.6%
|
-7.3%
|
9.4%
|
|
Total
|
8.2%
|
6.8%
|
9.2%
|
1.8%
|
8.4%
|
5.4%
|
-2.2%
|
-8.2%
|
-4.2%
|
8.1%
|
-8.6%
|
7.9%
|
Source: GAStat, Saudi Arabia census 2022
ANNEXED NOTE
1. Technical Notes and Definitions
Source: Saudi census 2022
Date of reference: 10 May 2022
Population of reference: Families and individual citizens and residents within the Kingdom, regardless of the status of their identification documents. Visitors for Hajj, Umrah and tourism are excluded from the census.
Methodology:
The first phase of the 2020 census began on 3 February 2020 (enumeration of buildings and households). Census 2022 used geospatial data, including satellite images, electricity consumption and mobile phone data, to improve the accuracy and geographic coverage of address canvassing.
The second stage (“actual enumeration”) was due to start on the original reference date (17 March 2020), but was suspended by the outbreak of the COVID-19 crisis. This stage was conducted in October 2021.
The 2022 census used a combined methodology – administrative records, fieldwork and digital self-enumeration. Household data were collected from e-portals of self-enumeration (on residents’ mobile devices, laptops or personal computers, or self-enumeration stations/kiosks, located in shopping centers). The digital self-enumeration process was complemented by face-to-face interviews, using digital tablets.
Census 2022 used a de jure approach: enumerating people according to their usual place of residence.
Administrative data from multiple sources was used to cross-validate collected census data.
Census 2022 was designed as a launchpad for several new secure statistical data registers for population, housing, and businesses.
See census methodology in:
https://portal.saudicensus.sa/portal/public/methodology
Portal of the Saudi census:
https://portal.saudicensus.sa/portal
Population data for 2010-22 were revised and backcasted, based on 2022 population census and past years’ administrative data.
Technical note on backcasting:
https://portal.saudicensus.sa/static-assets/media/content/20230529_Back-Casting%20Methodology.pdf?crafterSite=gastat-portal
2. Institution which provides data
General Authority for Statistics (GAStat)
3. Data availability
The table was retrieved from the Saudi census portal on GAStat website:
https://portal.saudicensus.sa/portal
“Population” section, then “data tables”-
https://portal.saudicensus.sa/portal/public/1/15?type=TABLE
Selected, pre-set tables can be downloaded from the thematic section.
Date of access: 21 May 2024.
GLMM and GRC cannot guarantee that the link to access the source will not change; that the information will not be removed from the website it was obtained from; that no geo-blockages will be imposed; or that the information will not be available for any another reason.
Keywords: Saudi Arabia, Foreign Population, National Population, Foreign & National Populations
|
|
2010
|
2011
|
2012
|
2013
|
2014
|
2015
|
2016
|
2017
|
2018
|
2019
|
2020
|
2021
|
2022
|
|
Ar Riyadh
|
6,224,033
|
6,551,735
|
6,867,853
|
7,294,753
|
7,489,799
|
7,933,711
|
8,271,126
|
8,275,538
|
8,030,674
|
7,979,262
|
8,422,408
|
8,175,378
|
8,591,748
|
|
Makkah Al Mukarramah
|
6,350,217
|
6,640,252
|
6,910,156
|
7,292,178
|
7,428,120
|
7,808,136
|
8,076,610
|
8,019,757
|
7,715,338
|
7,607,556
|
7,982,529
|
7,692,188
|
8,021,463
|
|
Eastern Region
|
3,647,910
|
3,833,419
|
4,015,832
|
4,256,947
|
4,379,894
|
4,636,295
|
4,835,564
|
4,853,790
|
4,746,614
|
4,740,235
|
4,989,327
|
4,879,962
|
5,125,254
|
|
Al Madinah Al Munawwarah
|
1,621,483
|
1,689,249
|
1,755,228
|
1,844,577
|
1,888,619
|
1,980,839
|
2,050,659
|
2,053,943
|
2,009,884
|
2,004,830
|
2,096,074
|
2,053,240
|
2,137,983
|
|
Aseer
|
1,469,841
|
1,529,057
|
1,588,898
|
1,666,269
|
1,713,764
|
1,796,865
|
1,863,056
|
1,879,189
|
1,863,690
|
1,876,328
|
1,958,677
|
1,943,532
|
2,024,285
|
|
Jazan
|
1,062,495
|
1,102,242
|
1,141,642
|
1,193,895
|
1,223,724
|
1,277,892
|
1,319,680
|
1,326,914
|
1,310,678
|
1,315,117
|
1,370,141
|
1,355,099
|
1,404,997
|
|
Al Qaseem
|
1,034,755
|
1,075,381
|
1,114,675
|
1,166,736
|
1,192,307
|
1,246,088
|
1,285,600
|
1,285,836
|
1,261,835
|
1,260,269
|
1,310,168
|
1,289,032
|
1,336,179
|
|
Tabuk
|
638,270
|
663,804
|
689,921
|
723,408
|
745,148
|
781,281
|
810,586
|
818,980
|
813,992
|
820,568
|
856,497
|
850,859
|
886,036
|
|
Hail
|
528,426
|
550,595
|
573,231
|
602,279
|
621,248
|
652,630
|
678,308
|
686,058
|
682,111
|
688,236
|
719,987
|
715,422
|
746,406
|
|
Al Jawf
|
444,672
|
461,187
|
477,818
|
499,207
|
512,630
|
535,411
|
553,527
|
558,052
|
554,005
|
557,379
|
579,446
|
574,894
|
595,822
|
|
Najran
|
423,831
|
442,261
|
460,802
|
484,876
|
499,520
|
525,201
|
545,958
|
551,172
|
545,320
|
548,237
|
574,344
|
567,533
|
592,300
|
|
Northern Borders
|
270,097
|
280,731
|
291,604
|
305,467
|
314,614
|
329,475
|
341,532
|
345,347
|
343,630
|
346,525
|
361,607
|
359,411
|
373,577
|
|
Al Bahah
|
262,457
|
271,954
|
281,201
|
293,412
|
299,886
|
312,558
|
321,992
|
322,779
|
318,510
|
319,257
|
331,305
|
327,833
|
339,174
|
|
Total
|
23,978,487
|
25,091,867
|
26,168,861
|
27,624,004
|
28,309,273
|
29,816,382
|
30,954,198
|
30,977,355
|
30,196,281
|
30,063,799
|
31,552,510
|
30,784,383
|
32,175,224
|
Source: GAStat, Saudi Arabia census 2022
ANNEXED NOTE
1. Technical Notes and Definitions
Source: Saudi census 2022
Date of reference: 10 May 2022
Population of reference: Families and individual citizens and residents within the Kingdom, regardless of the status of their identification documents. Visitors for Hajj, Umrah and tourism are excluded from the census.
Methodology:
The first phase of the 2020 census began on 3 February 2020 (enumeration of buildings and households). Census 2022 used geospatial data, including satellite images, electricity consumption and mobile phone data, to improve the accuracy and geographic coverage of address canvassing.
The second stage (“actual enumeration”) was due to start on the original reference date (17 March 2020), but was suspended by the outbreak of the COVID-19 crisis. This stage was conducted in October 2021.
The 2022 census used a combined methodology – administrative records, fieldwork and digital self-enumeration. Household data were collected from e-portals of self-enumeration (on residents’ mobile devices, laptops or personal computers, or self-enumeration stations/kiosks, located in shopping centers). The digital self-enumeration process was complemented by face-to-face interviews, using digital tablets.
Census 2022 used a de jure approach: enumerating people according to their usual place of residence.
Administrative data from multiple sources was used to cross-validate collected census data.
Census 2022 was designed as a launchpad for several new secure statistical data registers for population, housing, and businesses.
See census methodology in:
https://portal.saudicensus.sa/portal/public/methodology
Portal of the Saudi census:
https://portal.saudicensus.sa/portal
Population data for 2010-22 were revised and backcasted, based on 2022 population census and past years’ administrative data.
Technical note on backcasting:
https://portal.saudicensus.sa/static-assets/media/content/20230529_Back-Casting%20Methodology.pdf?crafterSite=gastat-portal
2. Institution which provides data
General Authority for Statistics (GAStat)
3. Data availability
The table was retrieved from the Saudi census portal on GAStat website:
https://portal.saudicensus.sa/portal
“Population” section, then “data tables”-
https://portal.saudicensus.sa/portal/public/1/15?type=TABLE
Selected, pre-set tables can be downloaded from the thematic section.
Date of access: 21 May 2024.
GLMM and GRC cannot guarantee that the link to access the source will not change; that the information will not be removed from the website it was obtained from; that no geo-blockages will be imposed; or that the information will not be available for any another reason.
Keywords: Saudi Arabia, Foreign Population, National Population, Foreign & National Populations
|
|
2010
|
2011
|
2012
|
2013
|
2014
|
2015
|
2016
|
2017
|
2018
|
2019
|
2020
|
2021
|
2022
|
|
Ar Riyadh
|
3,305,130
|
3,376,149
|
3,458,239
|
3,553,092
|
3,662,353
|
3,765,888
|
3,858,350
|
3,939,731
|
4,032,222
|
4,132,732
|
4,245,118
|
4,341,082
|
4,439,210
|
|
Makkah Al Mukarramah
|
3,077,186
|
3,143,642
|
3,220,353
|
3,309,457
|
3,411,883
|
3,509,532
|
3,597,076
|
3,674,514
|
3,762,757
|
3,858,847
|
3,966,569
|
4,059,151
|
4,153,723
|
|
Eastern Region
|
2,198,314
|
2,245,170
|
2,299,455
|
2,362,331
|
2,434,902
|
2,503,812
|
2,565,462
|
2,619,725
|
2,681,465
|
2,747,955
|
2,822,193
|
2,885,380
|
2,949,854
|
|
Aseer
|
1,085,911
|
1,108,194
|
1,133,777
|
1,163,522
|
1,197,499
|
1,230,126
|
1,259,150
|
1,284,979
|
1,314,421
|
1,346,378
|
1,382,430
|
1,413,144
|
1,444,688
|
|
Al Madinah Al Munawwarah
|
1,016,601
|
1,037,556
|
1,061,715
|
1,089,763
|
1,122,069
|
1,152,683
|
1,180,128
|
1,204,341
|
1,231,833
|
1,261,628
|
1,294,821
|
1,323,113
|
1,352,146
|
|
Jazan
|
751,557
|
767,174
|
785,113
|
805,976
|
829,893
|
852,717
|
873,097
|
891,118
|
911,672
|
934,067
|
959,274
|
980,751
|
1,002,779
|
|
Al Qaseem
|
694,563
|
708,993
|
725,612
|
744,872
|
767,117
|
788,220
|
807,053
|
823,666
|
842,541
|
863,265
|
886,335
|
906,182
|
926,490
|
|
Tabuk
|
483,844
|
493,568
|
504,780
|
517,758
|
532,753
|
546,914
|
559,538
|
570,591
|
583,145
|
596,694
|
611,785
|
624,511
|
637,601
|
|
Hail
|
397,348
|
405,527
|
414,907
|
425,836
|
438,429
|
450,344
|
461,046
|
470,430
|
481,125
|
492,755
|
505,682
|
516,643
|
527,885
|
|
Al Jawf
|
339,599
|
346,085
|
353,499
|
362,102
|
372,075
|
381,457
|
389,853
|
397,228
|
405,546
|
414,341
|
424,048
|
432,039
|
440,264
|
|
Najran
|
301,508
|
307,487
|
314,336
|
322,269
|
331,415
|
340,041
|
347,786
|
354,626
|
362,338
|
370,542
|
379,637
|
387,183
|
394,976
|
|
Northern Borders
|
207,384
|
211,450
|
216,161
|
221,596
|
227,856
|
233,788
|
239,060
|
243,709
|
248,972
|
254,571
|
260,800
|
265,989
|
271,358
|
|
Al Bahah
|
187,219
|
191,134
|
195,599
|
200,827
|
206,792
|
212,549
|
217,713
|
222,322
|
227,599
|
233,396
|
239,895
|
245,501
|
251,288
|
|
Total
|
14,046,164
|
14,342,129
|
14,683,546
|
15,079,401
|
15,535,036
|
15,968,071
|
16,355,312
|
16,696,980
|
17,085,636
|
17,507,171
|
17,978,587
|
18,380,669
|
18,792,262
|
Source: GAStat, Saudi Arabia census 2022
ANNEXED NOTE
1. Technical Notes and Definitions
Source: Saudi census 2022
Date of reference: 10 May 2022
Population of reference: Families and individual citizens and residents within the Kingdom, regardless of the status of their identification documents. Visitors for Hajj, Umrah and tourism are excluded from the census.
Methodology:
The first phase of the 2020 census began on 3 February 2020 (enumeration of buildings and households). Census 2022 used geospatial data, including satellite images, electricity consumption and mobile phone data, to improve the accuracy and geographic coverage of address canvassing.
The second stage (“actual enumeration”) was due to start on the original reference date (17 March 2020), but was suspended by the outbreak of the COVID-19 crisis. This stage was conducted in October 2021.
The 2022 census used a combined methodology – administrative records, fieldwork and digital self-enumeration. Household data were collected from e-portals of self-enumeration (on residents’ mobile devices, laptops or personal computers, or self-enumeration stations/kiosks, located in shopping centers). The digital self-enumeration process was complemented by face-to-face interviews, using digital tablets.
Census 2022 used a de jure approach: enumerating people according to their usual place of residence.
Administrative data from multiple sources was used to cross-validate collected census data.
Census 2022 was designed as a launchpad for several new secure statistical data registers for population, housing, and businesses.
See census methodology in:
https://portal.saudicensus.sa/portal/public/methodology
Portal of the Saudi census:
https://portal.saudicensus.sa/portal
Population data for 2010-22 were revised and backcasted, based on 2022 population census and past years’ administrative data.
Technical note on backcasting:
https://portal.saudicensus.sa/static-assets/media/content/20230529_Back-Casting%20Methodology.pdf?crafterSite=gastat-portal
2. Institution which provides data
General Authority for Statistics (GAStat)
3. Data availability
The table was retrieved from the Saudi census portal on GAStat website:
https://portal.saudicensus.sa/portal
“Population” section, then “data tables”-
https://portal.saudicensus.sa/portal/public/1/15?type=TABLE
Selected, pre-set tables can be downloaded from the thematic section.
Date of access: 21 May 2024.
GLMM and GRC cannot guarantee that the link to access the source will not change; that the information will not be removed from the website it was obtained from; that no geo-blockages will be imposed; or that the information will not be available for any another reason.
Keywords: Saudi Arabia, Foreign Population, National Population, Foreign & National Populations
|
|
2010
|
2011
|
2012
|
2013
|
2014
|
2015
|
2016
|
2017
|
2018
|
2019
|
2020
|
2021
|
2022
|
|
Makkah Al Mukarramah
|
3,273,031
|
3,496,610
|
3,689,803
|
3,982,721
|
4,016,237
|
4,298,604
|
4,479,534
|
4,345,243
|
3,952,581
|
3,748,709
|
4,015,960
|
3,633,037
|
3,867,740
|
|
Ar Riyadh
|
2,918,903
|
3,175,586
|
3,409,614
|
3,741,661
|
3,827,446
|
4,167,823
|
4,412,776
|
4,335,807
|
3,998,452
|
3,846,530
|
4,177,290
|
3,834,296
|
4,152,538
|
|
Eastern Region
|
1,449,596
|
1,588,249
|
1,716,377
|
1,894,616
|
1,944,992
|
2,132,483
|
2,270,102
|
2,234,065
|
2,065,149
|
1,992,280
|
2,167,134
|
1,994,582
|
2,175,400
|
|
Al Madinah Al Munawwarah
|
604,882
|
651,693
|
693,513
|
754,814
|
766,550
|
828,156
|
870,531
|
849,602
|
778,051
|
743,202
|
801,253
|
730,127
|
785,837
|
|
Aseer
|
383,930
|
420,863
|
455,121
|
502,747
|
516,265
|
566,739
|
603,906
|
594,210
|
549,269
|
529,950
|
576,247
|
530,388
|
579,597
|
|
Al Qaseem
|
340,192
|
366,388
|
389,063
|
421,864
|
425,190
|
457,868
|
478,547
|
462,170
|
419,294
|
397,004
|
423,833
|
382,850
|
409,689
|
|
Jazan
|
310,938
|
335,068
|
356,529
|
387,919
|
393,831
|
425,175
|
446,583
|
435,796
|
399,006
|
381,050
|
410,867
|
374,348
|
402,218
|
|
Tabuk
|
154,426
|
170,236
|
185,141
|
205,650
|
212,395
|
234,367
|
251,048
|
248,389
|
230,847
|
223,874
|
244,712
|
226,348
|
248,435
|
|
Hail
|
131,078
|
145,068
|
158,324
|
176,443
|
182,819
|
202,286
|
217,262
|
215,628
|
200,986
|
195,481
|
214,305
|
198,779
|
218,521
|
|
Najran
|
122,323
|
134,774
|
146,466
|
162,607
|
168,105
|
185,160
|
198,172
|
196,546
|
182,982
|
177,695
|
194,707
|
180,350
|
197,324
|
|
Al Jawf
|
105,073
|
115,102
|
124,319
|
137,105
|
140,555
|
153,954
|
163,674
|
160,824
|
148,459
|
143,038
|
155,398
|
142,855
|
155,558
|
|
Al Bahah
|
75,238
|
80,820
|
85,602
|
92,585
|
93,094
|
100,009
|
104,279
|
100,457
|
90,911
|
85,861
|
91,410
|
82,332
|
87,886
|
|
Northern Borders
|
62,713
|
69,281
|
75,443
|
83,871
|
86,758
|
95,687
|
102,472
|
101,638
|
94,658
|
91,954
|
100,807
|
93,422
|
102,219
|
|
Total
|
9,932,323
|
10,749,738
|
11,485,315
|
12,544,603
|
12,774,237
|
13,848,311
|
14,598,886
|
14,280,375
|
13,110,645
|
12,556,628
|
13,573,923
|
12,403,714
|
13,382,962
|
Source: GAStat, Saudi Arabia census 2022
ANNEXED NOTE
1. Technical Notes and Definitions
Source: Saudi census 2022
Date of reference: 10 May 2022
Population of reference: Families and individual citizens and residents within the Kingdom, regardless of the status of their identification documents. Visitors for Hajj, Umrah and tourism are excluded from the census.
Methodology:
The first phase of the 2020 census began on 3 February 2020 (enumeration of buildings and households). Census 2022 used geospatial data, including satellite images, electricity consumption and mobile phone data, to improve the accuracy and geographic coverage of address canvassing.
The second stage (“actual enumeration”) was due to start on the original reference date (17 March 2020), but was suspended by the outbreak of the COVID-19 crisis. This stage was conducted in October 2021.
The 2022 census used a combined methodology – administrative records, fieldwork and digital self-enumeration. Household data were collected from e-portals of self-enumeration (on residents’ mobile devices, laptops or personal computers, or self-enumeration stations/kiosks, located in shopping centers). The digital self-enumeration process was complemented by face-to-face interviews, using digital tablets.
Census 2022 used a de jure approach: enumerating people according to their usual place of residence.
Administrative data from multiple sources was used to cross-validate collected census data.
Census 2022 was designed as a launchpad for several new secure statistical data registers for population, housing, and businesses.
See census methodology in:
https://portal.saudicensus.sa/portal/public/methodology
Portal of the Saudi census:
https://portal.saudicensus.sa/portal
Population data for 2010-22 were revised and backcasted, based on 2022 population census and past years’ administrative data.
Technical note on backcasting:
https://portal.saudicensus.sa/static-assets/media/content/20230529_Back-Casting%20Methodology.pdf?crafterSite=gastat-portal
2. Institution which provides data
General Authority for Statistics (GAStat)
3. Data availability
The table was retrieved from the Saudi census portal on GAStat website:
https://portal.saudicensus.sa/portal
“Population” section, then “data tables”-
https://portal.saudicensus.sa/portal/public/1/15?type=TABLE
Selected, pre-set tables can be downloaded from the thematic section.
Date of access: 21 May 2024.
GLMM and GRC cannot guarantee that the link to access the source will not change; that the information will not be removed from the website it was obtained from; that no geo-blockages will be imposed; or that the information will not be available for any another reason.
Keywords: Saudi Arabia, Foreign Population, National Population, Foreign & National Populations
|
|
2011
|
2012
|
2013
|
2014
|
2015
|
2016
|
2017
|
2018
|
2019
|
2020
|
2021
|
2022
|
|
Ar Riyadh
|
5.3%
|
4.8%
|
6.2%
|
2.7%
|
5.9%
|
4.3%
|
0.1%
|
-3.0%
|
-0.6%
|
5.6%
|
-2.9%
|
5.1%
|
|
Makkah Al Mukarramah
|
4.6%
|
4.1%
|
5.5%
|
1.9%
|
5.1%
|
3.4%
|
-0.7%
|
-3.8%
|
-1.4%
|
4.9%
|
-3.6%
|
4.3%
|
|
Eastern Region
|
5.1%
|
4.8%
|
6.0%
|
2.9%
|
5.9%
|
4.3%
|
0.4%
|
-2.2%
|
-0.1%
|
5.3%
|
-2.2%
|
5.0%
|
|
Al Madinah Al Munawwarah
|
4.2%
|
3.9%
|
5.1%
|
2.4%
|
4.9%
|
3.5%
|
0.2%
|
-2.1%
|
-0.3%
|
4.6%
|
-2.0%
|
4.1%
|
|
Aseer
|
4.0%
|
3.9%
|
4.9%
|
2.9%
|
4.8%
|
3.7%
|
0.9%
|
-0.8%
|
0.7%
|
4.4%
|
-0.8%
|
4.2%
|
|
Jazan
|
3.7%
|
3.6%
|
4.6%
|
2.5%
|
4.4%
|
3.3%
|
0.5%
|
-1.2%
|
0.3%
|
4.2%
|
-1.1%
|
3.7%
|
|
Al Qaseem
|
3.9%
|
3.7%
|
4.7%
|
2.2%
|
4.5%
|
3.2%
|
0.0%
|
-1.9%
|
-0.1%
|
4.0%
|
-1.6%
|
3.7%
|
|
Tabuk
|
4.0%
|
3.9%
|
4.9%
|
3.0%
|
4.8%
|
3.8%
|
1.0%
|
-0.6%
|
0.8%
|
4.4%
|
-0.7%
|
4.1%
|
|
Hail
|
4.2%
|
4.1%
|
5.1%
|
3.1%
|
5.1%
|
3.9%
|
1.1%
|
-0.6%
|
0.9%
|
4.6%
|
-0.6%
|
4.3%
|
|
Al Jawf
|
3.7%
|
3.6%
|
4.5%
|
2.7%
|
4.4%
|
3.4%
|
0.8%
|
-0.7%
|
0.6%
|
4.0%
|
-0.8%
|
3.6%
|
|
Najran
|
4.3%
|
4.2%
|
5.2%
|
3.0%
|
5.1%
|
4.0%
|
1.0%
|
-1.1%
|
0.5%
|
4.8%
|
-1.2%
|
4.4%
|
|
Northern Borders
|
3.9%
|
3.9%
|
4.8%
|
3.0%
|
4.7%
|
3.7%
|
1.1%
|
-0.5%
|
0.8%
|
4.4%
|
-0.6%
|
3.9%
|
|
Al Bahah
|
3.6%
|
3.4%
|
4.3%
|
2.2%
|
4.2%
|
3.0%
|
0.2%
|
-1.3%
|
0.2%
|
3.8%
|
-1.0%
|
3.5%
|
|
Total
|
4.6%
|
4.3%
|
5.6%
|
2.5%
|
5.3%
|
3.8%
|
0.1%
|
-2.5%
|
-0.4%
|
5.0%
|
-2.4%
|
4.5%
|
Source: GAStat, Saudi Arabia census 2022
ANNEXED NOTE
1. Technical Notes and Definitions
Source: Saudi census 2022
Date of reference: 10 May 2022
Population of reference: Families and individual citizens and residents within the Kingdom, regardless of the status of their identification documents. Visitors for Hajj, Umrah and tourism are excluded from the census.
Methodology:
The first phase of the 2020 census began on 3 February 2020 (enumeration of buildings and households). Census 2022 used geospatial data, including satellite images, electricity consumption and mobile phone data, to improve the accuracy and geographic coverage of address canvassing.
The second stage (“actual enumeration”) was due to start on the original reference date (17 March 2020), but was suspended by the outbreak of the COVID-19 crisis. This stage was conducted in October 2021.
The 2022 census used a combined methodology – administrative records, fieldwork and digital self-enumeration. Household data were collected from e-portals of self-enumeration (on residents’ mobile devices, laptops or personal computers, or self-enumeration stations/kiosks, located in shopping centers). The digital self-enumeration process was complemented by face-to-face interviews, using digital tablets.
Census 2022 used a de jure approach: enumerating people according to their usual place of residence.
Administrative data from multiple sources was used to cross-validate collected census data.
Census 2022 was designed as a launchpad for several new secure statistical data registers for population, housing, and businesses.
See census methodology in:
https://portal.saudicensus.sa/portal/public/methodology
Portal of the Saudi census:
https://portal.saudicensus.sa/portal
Population data for 2010-22 were revised and backcasted, based on 2022 population census and past years’ administrative data.
Technical note on backcasting:
https://portal.saudicensus.sa/static-assets/media/content/20230529_Back-Casting%20Methodology.pdf?crafterSite=gastat-portal
2. Institution which provides data
General Authority for Statistics (GAStat)
3. Data availability
The table was retrieved from the Saudi census portal on GAStat website:
https://portal.saudicensus.sa/portal
“Population” section, then “data tables”-
https://portal.saudicensus.sa/portal/public/1/15?type=TABLE
Selected, pre-set tables can be downloaded from the thematic section.
Date of access: 21 May 2024.
GLMM and GRC cannot guarantee that the link to access the source will not change; that the information will not be removed from the website it was obtained from; that no geo-blockages will be imposed; or that the information will not be available for any another reason.
Keywords: Saudi Arabia, Foreign Population, National Population, Foreign & National Populations
|
|
2010
|
2011
|
2012
|
2013
|
2014
|
2015
|
2016
|
2017
|
2018
|
2019
|
2020
|
2021
|
2022
|
|
0-4
|
2,492,503
|
2,547,295
|
2,600,739
|
2,655,996
|
2,720,823
|
2,773,424
|
2,834,236
|
2,859,199
|
2,847,159
|
2,807,571
|
2,780,036
|
2,661,302
|
2,578,159
|
|
5-9
|
2,190,042
|
2,235,764
|
2,285,700
|
2,347,267
|
2,413,433
|
2,507,746
|
2,591,704
|
2,622,253
|
2,625,845
|
2,655,099
|
2,718,774
|
2,721,434
|
2,762,317
|
|
10-14
|
2,229,080
|
2,161,101
|
2,130,458
|
2,118,722
|
2,127,667
|
2,180,172
|
2,240,857
|
2,278,664
|
2,311,776
|
2,361,187
|
2,453,015
|
2,490,632
|
2,546,414
|
|
15-19
|
3,103,040
|
2,871,903
|
2,650,718
|
2,454,961
|
2,299,600
|
2,210,942
|
2,152,113
|
2,098,042
|
2,057,345
|
2,064,047
|
2,110,206
|
2,148,429
|
2,196,700
|
|
20-24
|
3,813,218
|
3,735,209
|
3,580,419
|
3,456,057
|
3,264,520
|
3,061,698
|
2,832,367
|
2,593,970
|
2,364,234
|
2,293,114
|
2,486,431
|
2,384,384
|
2,615,982
|
|
25-29
|
3,257,219
|
3,553,023
|
3,621,781
|
3,824,781
|
3,866,343
|
3,940,474
|
3,897,523
|
3,682,154
|
3,362,411
|
3,319,944
|
3,561,340
|
3,381,282
|
3,745,715
|
|
30-34
|
2,108,930
|
2,463,017
|
2,771,007
|
3,154,966
|
3,377,955
|
3,723,724
|
3,963,271
|
3,970,590
|
3,796,045
|
3,761,659
|
3,971,445
|
3,758,285
|
3,892,832
|
|
35-39
|
1,412,813
|
1,670,637
|
1,938,697
|
2,266,184
|
2,461,105
|
2,820,230
|
3,121,544
|
3,241,354
|
3,209,224
|
3,237,830
|
3,379,938
|
3,300,160
|
3,464,956
|
|
40-44
|
1,098,057
|
1,284,094
|
1,497,021
|
1,725,771
|
1,835,791
|
2,069,160
|
2,281,986
|
2,353,534
|
2,332,549
|
2,310,917
|
2,514,966
|
2,455,831
|
2,653,877
|
|
45-49
|
760,663
|
920,930
|
1,116,423
|
1,309,663
|
1,416,604
|
1,609,284
|
1,764,785
|
1,808,100
|
1,782,422
|
1,732,368
|
1,808,275
|
1,749,706
|
1,825,180
|
|
50-54
|
475,514
|
588,321
|
739,039
|
879,984
|
965,483
|
1,136,194
|
1,275,542
|
1,335,132
|
1,338,521
|
1,334,544
|
1,412,925
|
1,353,888
|
1,388,372
|
|
55-59
|
316,186
|
343,654
|
454,775
|
565,594
|
632,649
|
743,422
|
841,036
|
892,368
|
905,009
|
895,772
|
965,178
|
956,541
|
995,219
|
|
60-64
|
228,088
|
214,749
|
252,591
|
300,935
|
343,380
|
413,816
|
484,813
|
538,629
|
543,711
|
553,062
|
606,017
|
610,557
|
647,652
|
|
65+
|
493,134
|
502,170
|
529,493
|
563,123
|
583,920
|
626,096
|
672,421
|
703,366
|
720,030
|
736,685
|
783,964
|
811,952
|
861,849
|
|
Total
|
23,978,487
|
25,091,867
|
26,168,861
|
27,624,004
|
28,309,273
|
29,816,382
|
30,954,198
|
30,977,355
|
30,196,281
|
30,063,799
|
31,552,510
|
30,784,383
|
32,175,224
|
Source: GAStat, Saudi Arabia census 2022
ANNEXED NOTE
1. Technical Notes and Definitions
Source: Saudi census 2022
Date of reference: 10 May 2022
Population of reference: Families and individual citizens and residents within the Kingdom, regardless of the status of their identification documents. Visitors for Hajj, Umrah and tourism are excluded from the census.
Methodology:
The first phase of the 2020 census began on 3 February 2020 (enumeration of buildings and households). Census 2022 used geospatial data, including satellite images, electricity consumption and mobile phone data, to improve the accuracy and geographic coverage of address canvassing.
The second stage (“actual enumeration”) was due to start on the original reference date (17 March 2020), but was suspended by the outbreak of the COVID-19 crisis. This stage was conducted in October 2021.
The 2022 census used a combined methodology – administrative records, fieldwork and digital self-enumeration. Household data were collected from e-portals of self-enumeration (on residents’ mobile devices, laptops or personal computers, or self-enumeration stations/kiosks, located in shopping centers). The digital self-enumeration process was complemented by face-to-face interviews, using digital tablets.
Census 2022 used a de jure approach: enumerating people according to their usual place of residence.
Administrative data from multiple sources was used to cross-validate collected census data.
Census 2022 was designed as a launchpad for several new secure statistical data registers for population, housing, and businesses.
See census methodology in:
https://portal.saudicensus.sa/portal/public/methodology
Portal of the Saudi census:
https://portal.saudicensus.sa/portal
Population data for 2010-22 were revised and backcasted, based on 2022 population census and past years’ administrative data.
Technical note on backcasting:
https://portal.saudicensus.sa/static-assets/media/content/20230529_Back-Casting%20Methodology.pdf?crafterSite=gastat-portal
2. Institution which provides data
General Authority for Statistics (GAStat)
3. Data availability
The table was retrieved from the Saudi census portal on GAStat website:
https://portal.saudicensus.sa/portal
“Population” section, then “data tables”-
https://portal.saudicensus.sa/portal/public/1/15?type=TABLE
Selected, pre-set tables can be downloaded from the thematic section.
Date of access: 21 May 2024.
GLMM and GRC cannot guarantee that the link to access the source will not change; that the information will not be removed from the website it was obtained from; that no geo-blockages will be imposed; or that the information will not be available for any another reason.
Keywords: Saudi Arabia, Foreign Population, National Population, Foreign & National Populations
|
|
2010
|
2011
|
2012
|
2013
|
2014
|
2015
|
2016
|
2017
|
2018
|
2019
|
2020
|
2021
|
2022
|
|
0-4
|
2,008,963
|
2,046,268
|
2,079,046
|
2,109,747
|
2,149,421
|
2,176,044
|
2,205,651
|
2,235,769
|
2,263,495
|
2,261,128
|
2,248,523
|
2,207,144
|
2,173,955
|
|
5-9
|
1,795,995
|
1,819,501
|
1,854,085
|
1,899,682
|
1,948,599
|
1,997,894
|
2,039,453
|
2,069,381
|
2,098,666
|
2,141,065
|
2,178,697
|
2,218,817
|
2,257,680
|
|
10-14
|
1,743,734
|
1,739,974
|
1,740,210
|
1,745,272
|
1,767,090
|
1,793,929
|
1,819,847
|
1,851,401
|
1,894,036
|
1,944,609
|
2,002,564
|
2,056,243
|
2,100,003
|
|
15-19
|
1,672,331
|
1,695,038
|
1,721,599
|
1,732,468
|
1,734,742
|
1,734,007
|
1,731,422
|
1,727,852
|
1,728,293
|
1,749,744
|
1,780,971
|
1,815,977
|
1,858,245
|
|
20-24
|
1,481,953
|
1,495,207
|
1,513,646
|
1,553,213
|
1,594,468
|
1,635,319
|
1,663,349
|
1,684,852
|
1,692,401
|
1,695,535
|
1,704,126
|
1,712,289
|
1,719,492
|
|
25-29
|
1,258,389
|
1,293,813
|
1,331,310
|
1,373,034
|
1,419,057
|
1,459,682
|
1,486,618
|
1,504,322
|
1,543,929
|
1,581,892
|
1,631,568
|
1,667,248
|
1,702,262
|
|
30-34
|
965,988
|
1,018,730
|
1,076,851
|
1,132,049
|
1,196,967
|
1,253,681
|
1,301,477
|
1,338,646
|
1,379,421
|
1,420,197
|
1,466,942
|
1,498,761
|
1,529,157
|
|
35-39
|
742,672
|
767,257
|
797,075
|
839,439
|
898,265
|
961,136
|
1,021,320
|
1,077,141
|
1,129,250
|
1,189,000
|
1,250,567
|
1,303,846
|
1,354,051
|
|
40-44
|
640,348
|
658,377
|
672,763
|
700,620
|
723,586
|
737,618
|
766,646
|
793,796
|
831,674
|
884,946
|
948,663
|
1,011,939
|
1,077,993
|
|
45-49
|
509,027
|
528,754
|
551,321
|
576,853
|
606,158
|
632,931
|
654,475
|
666,455
|
690,034
|
707,950
|
721,179
|
752,011
|
785,913
|
|
50-54
|
372,826
|
392,796
|
416,326
|
442,281
|
463,774
|
498,392
|
521,635
|
542,358
|
564,662
|
589,888
|
616,126
|
638,080
|
653,994
|
|
55-59
|
246,098
|
261,688
|
286,451
|
310,046
|
336,756
|
359,939
|
382,699
|
405,240
|
429,280
|
447,942
|
482,648
|
505,712
|
529,004
|
|
60-64
|
179,714
|
183,189
|
189,599
|
197,985
|
215,718
|
233,330
|
250,289
|
274,137
|
296,103
|
321,258
|
344,906
|
367,017
|
390,642
|
|
65+
|
428,126
|
441,537
|
453,264
|
466,712
|
480,435
|
494,169
|
510,431
|
525,630
|
544,392
|
572,017
|
601,107
|
625,585
|
659,871
|
|
Total
|
14,046,164
|
14,342,129
|
14,683,546
|
15,079,401
|
15,535,036
|
15,968,071
|
16,355,312
|
16,696,980
|
17,085,636
|
17,507,171
|
17,978,587
|
18,380,669
|
18,792,262
|
Source: GAStat, Saudi Arabia census 2022
ANNEXED NOTE
1. Technical Notes and Definitions
Source: Saudi census 2022
Date of reference: 10 May 2022
Population of reference: Families and individual citizens and residents within the Kingdom, regardless of the status of their identification documents. Visitors for Hajj, Umrah and tourism are excluded from the census.
Methodology:
The first phase of the 2020 census began on 3 February 2020 (enumeration of buildings and households). Census 2022 used geospatial data, including satellite images, electricity consumption and mobile phone data, to improve the accuracy and geographic coverage of address canvassing.
The second stage (“actual enumeration”) was due to start on the original reference date (17 March 2020), but was suspended by the outbreak of the COVID-19 crisis. This stage was conducted in October 2021.
The 2022 census used a combined methodology – administrative records, fieldwork and digital self-enumeration. Household data were collected from e-portals of self-enumeration (on residents’ mobile devices, laptops or personal computers, or self-enumeration stations/kiosks, located in shopping centers). The digital self-enumeration process was complemented by face-to-face interviews, using digital tablets.
Census 2022 used a de jure approach: enumerating people according to their usual place of residence.
Administrative data from multiple sources was used to cross-validate collected census data.
Census 2022 was designed as a launchpad for several new secure statistical data registers for population, housing, and businesses.
See census methodology in:
https://portal.saudicensus.sa/portal/public/methodology
Portal of the Saudi census:
https://portal.saudicensus.sa/portal
Population data for 2010-22 were revised and backcasted, based on 2022 population census and past years’ administrative data.
Technical note on backcasting:
https://portal.saudicensus.sa/static-assets/media/content/20230529_Back-Casting%20Methodology.pdf?crafterSite=gastat-portal
2. Institution which provides data
General Authority for Statistics (GAStat)
3. Data availability
The table was retrieved from the Saudi census portal on GAStat website:
https://portal.saudicensus.sa/portal
“Population” section, then “data tables”-
https://portal.saudicensus.sa/portal/public/1/15?type=TABLE
Selected, pre-set tables can be downloaded from the thematic section.
Date of access: 29 April 2024.
GLMM and GRC cannot guarantee that the link to access the source will not change; that the information will not be removed from the website it was obtained from; that no geo-blockages will be imposed; or that the information will not be available for any another reason.
Keywords: Saudi Arabia, Foreign Population, National Population, Foreign & National Populations
|
|
2010
|
2011
|
2012
|
2013
|
2014
|
2015
|
2016
|
2017
|
2018
|
2019
|
2020
|
2021
|
2022
|
|
0-4
|
1,019,438
|
1,039,949
|
1,058,044
|
1,074,877
|
1,094,939
|
1,108,138
|
1,122,206
|
1,136,499
|
1,150,005
|
1,149,054
|
1,143,238
|
1,123,158
|
1,106,938
|
|
5-9
|
910,950
|
923,456
|
941,249
|
963,885
|
988,681
|
1,014,065
|
1,035,568
|
1,051,738
|
1,068,058
|
1,090,559
|
1,110,229
|
1,130,286
|
1,148,999
|
|
10-14
|
885,626
|
884,525
|
884,499
|
887,328
|
897,761
|
910,246
|
923,037
|
938,822
|
960,136
|
986,571
|
1,017,004
|
1,045,126
|
1,068,186
|
|
15-19
|
848,170
|
858,892
|
872,720
|
878,022
|
879,186
|
878,270
|
877,114
|
875,019
|
875,811
|
886,895
|
902,401
|
920,497
|
941,806
|
|
20-24
|
745,393
|
750,637
|
759,378
|
778,792
|
799,653
|
820,475
|
833,956
|
844,534
|
848,930
|
852,074
|
858,443
|
864,290
|
868,712
|
|
25-29
|
628,210
|
646,273
|
665,711
|
687,719
|
713,440
|
734,891
|
748,417
|
756,650
|
776,585
|
795,642
|
822,193
|
840,248
|
859,531
|
|
30-34
|
478,520
|
504,812
|
534,741
|
564,508
|
598,510
|
628,258
|
653,372
|
672,085
|
693,335
|
715,190
|
739,420
|
755,013
|
770,595
|
|
35-39
|
361,514
|
373,898
|
389,959
|
412,750
|
443,877
|
476,610
|
507,193
|
535,300
|
563,167
|
593,620
|
625,906
|
653,386
|
679,028
|
|
40-44
|
310,220
|
318,064
|
324,538
|
338,143
|
350,577
|
359,173
|
374,212
|
388,384
|
408,515
|
435,862
|
468,924
|
500,870
|
534,889
|
|
45-49
|
248,147
|
257,086
|
267,983
|
280,451
|
294,567
|
306,501
|
316,253
|
321,025
|
331,879
|
340,645
|
348,093
|
363,479
|
381,557
|
|
50-54
|
186,990
|
194,919
|
204,335
|
215,343
|
226,043
|
242,344
|
253,027
|
262,491
|
272,746
|
283,859
|
294,766
|
303,925
|
310,703
|
|
55-59
|
123,675
|
132,238
|
145,737
|
157,678
|
169,702
|
179,606
|
189,026
|
197,547
|
207,196
|
215,588
|
231,287
|
241,316
|
252,068
|
|
60-64
|
92,088
|
92,763
|
95,165
|
98,545
|
107,152
|
116,438
|
125,740
|
138,377
|
149,016
|
159,617
|
169,250
|
177,832
|
186,840
|
|
65+
|
227,658
|
232,731
|
236,913
|
242,974
|
248,607
|
254,043
|
259,804
|
265,183
|
273,066
|
285,557
|
299,125
|
309,098
|
324,279
|
|
Total
|
7,066,599
|
7,210,243
|
7,380,972
|
7,581,015
|
7,812,695
|
8,029,058
|
8,218,925
|
8,383,654
|
8,578,445
|
8,790,733
|
9,030,279
|
9,228,524
|
9,434,131
|
Source: GAStat, Saudi Arabia census 2022
ANNEXED NOTE
1. Technical Notes and Definitions
Source: Saudi census 2022
Date of reference: 10 May 2022
Population of reference: Families and individual citizens and residents within the Kingdom, regardless of the status of their identification documents. Visitors for Hajj, Umrah and tourism are excluded from the census.
Methodology:
The first phase of the 2020 census began on 3 February 2020 (enumeration of buildings and households). Census 2022 used geospatial data, including satellite images, electricity consumption and mobile phone data, to improve the accuracy and geographic coverage of address canvassing.
The second stage (“actual enumeration”) was due to start on the original reference date (17 March 2020), but was suspended by the outbreak of the COVID-19 crisis. This stage was conducted in October 2021.
The 2022 census used a combined methodology – administrative records, fieldwork and digital self-enumeration. Household data were collected from e-portals of self-enumeration (on residents’ mobile devices, laptops or personal computers, or self-enumeration stations/kiosks, located in shopping centers). The digital self-enumeration process was complemented by face-to-face interviews, using digital tablets.
Census 2022 used a de jure approach: enumerating people according to their usual place of residence.
Administrative data from multiple sources was used to cross-validate collected census data.
Census 2022 was designed as a launchpad for several new secure statistical data registers for population, housing, and businesses.
See census methodology in:
https://portal.saudicensus.sa/portal/public/methodology
Portal of the Saudi census:
https://portal.saudicensus.sa/portal
Population data for 2010-22 were revised and backcasted, based on 2022 population census and past years’ administrative data.
Technical note on backcasting:
https://portal.saudicensus.sa/static-assets/media/content/20230529_Back-Casting%20Methodology.pdf?crafterSite=gastat-portal
2. Institution which provides data
General Authority for Statistics (GAStat)
3. Data availability
The table was retrieved from the Saudi census portal on GAStat website:
https://portal.saudicensus.sa/portal
“Population” section, then “data tables”-
https://portal.saudicensus.sa/portal/public/1/15?type=TABLE
Selected, pre-set tables can be downloaded from the thematic section.
Date of access: 21 May 2024.
GLMM and GRC cannot guarantee that the link to access the source will not change; that the information will not be removed from the website it was obtained from; that no geo-blockages will be imposed; or that the information will not be available for any another reason.
Keywords: Saudi Arabia, Foreign Population, National Population, Foreign & National Populations
|
|
2010
|
2011
|
2012
|
2013
|
2014
|
2015
|
2016
|
2017
|
2018
|
2019
|
2020
|
2021
|
2022
|
|
0-4
|
989,525
|
1,006,319
|
1,021,002
|
1,034,870
|
1,054,482
|
1,067,906
|
1,083,445
|
1,099,270
|
1,113,490
|
1,112,074
|
1,105,285
|
1,083,986
|
1,067,017
|
|
5-9
|
885,045
|
896,045
|
912,836
|
935,797
|
959,918
|
983,829
|
1,003,885
|
1,017,643
|
1,030,608
|
1,050,506
|
1,068,468
|
1,088,531
|
1,108,681
|
|
10-14
|
858,108
|
855,449
|
855,711
|
857,944
|
869,329
|
883,683
|
896,810
|
912,579
|
933,900
|
958,038
|
985,560
|
1,011,117
|
1,031,817
|
|
15-19
|
824,161
|
836,146
|
848,879
|
854,446
|
855,556
|
855,737
|
854,308
|
852,833
|
852,482
|
862,849
|
878,570
|
895,480
|
916,439
|
|
20-24
|
736,560
|
744,570
|
754,268
|
774,421
|
794,815
|
814,844
|
829,393
|
840,318
|
843,471
|
843,461
|
845,683
|
847,999
|
850,780
|
|
25-29
|
630,179
|
647,540
|
665,599
|
685,315
|
705,617
|
724,791
|
738,201
|
747,672
|
767,344
|
786,250
|
809,375
|
827,000
|
842,731
|
|
30-34
|
487,468
|
513,918
|
542,110
|
567,541
|
598,457
|
625,423
|
648,105
|
666,561
|
686,086
|
705,007
|
727,522
|
743,748
|
758,562
|
|
35-39
|
381,158
|
393,359
|
407,116
|
426,689
|
454,388
|
484,526
|
514,127
|
541,841
|
566,083
|
595,380
|
624,661
|
650,460
|
675,023
|
|
40-44
|
330,128
|
340,313
|
348,225
|
362,477
|
373,009
|
378,445
|
392,434
|
405,412
|
423,159
|
449,084
|
479,739
|
511,069
|
543,104
|
|
45-49
|
260,880
|
271,668
|
283,338
|
296,402
|
311,591
|
326,430
|
338,222
|
345,430
|
358,155
|
367,305
|
373,086
|
388,532
|
404,356
|
|
50-54
|
185,836
|
197,877
|
211,991
|
226,938
|
237,731
|
256,048
|
268,608
|
279,867
|
291,916
|
306,029
|
321,360
|
334,155
|
343,291
|
|
55-59
|
122,423
|
129,450
|
140,714
|
152,368
|
167,054
|
180,333
|
193,673
|
207,693
|
222,084
|
232,354
|
251,361
|
264,396
|
276,936
|
|
60-64
|
87,626
|
90,426
|
94,434
|
99,440
|
108,566
|
116,892
|
124,549
|
135,760
|
147,087
|
161,641
|
175,656
|
189,185
|
203,802
|
|
65+
|
200,468
|
208,806
|
216,351
|
223,738
|
231,828
|
240,126
|
250,627
|
260,447
|
271,326
|
286,460
|
301,982
|
316,487
|
335,592
|
|
Total
|
6,979,565
|
7,131,886
|
7,302,574
|
7,498,386
|
7,722,341
|
7,939,013
|
8,136,387
|
8,313,326
|
8,507,191
|
8,716,438
|
8,948,308
|
9,152,145
|
9,358,131
|
Source: GAStat, Saudi Arabia census 2022
ANNEXED NOTE
1. Technical Notes and Definitions
Source: Saudi census 2022
Date of reference: 10 May 2022
Population of reference: Families and individual citizens and residents within the Kingdom, regardless of the status of their identification documents. Visitors for Hajj, Umrah and tourism are excluded from the census.
Methodology:
The first phase of the 2020 census began on 3 February 2020 (enumeration of buildings and households). Census 2022 used geospatial data, including satellite images, electricity consumption and mobile phone data, to improve the accuracy and geographic coverage of address canvassing.
The second stage (“actual enumeration”) was due to start on the original reference date (17 March 2020), but was suspended by the outbreak of the COVID-19 crisis. This stage was conducted in October 2021.
The 2022 census used a combined methodology – administrative records, fieldwork and digital self-enumeration. Household data were collected from e-portals of self-enumeration (on residents’ mobile devices, laptops or personal computers, or self-enumeration stations/kiosks, located in shopping centers). The digital self-enumeration process was complemented by face-to-face interviews, using digital tablets.
Census 2022 used a de jure approach: enumerating people according to their usual place of residence.
Administrative data from multiple sources was used to cross-validate collected census data.
Census 2022 was designed as a launchpad for several new secure statistical data registers for population, housing, and businesses.
See census methodology in:
https://portal.saudicensus.sa/portal/public/methodology
Portal of the Saudi census:
https://portal.saudicensus.sa/portal
Population data for 2010-22 were revised and backcasted, based on 2022 population census and past years’ administrative data.
Technical note on backcasting:
https://portal.saudicensus.sa/static-assets/media/content/20230529_Back-Casting%20Methodology.pdf?crafterSite=gastat-portal
2. Institution which provides data
General Authority for Statistics (GAStat)
3. Data availability
The table was retrieved from the Saudi census portal on GAStat website:
https://portal.saudicensus.sa/portal
“Population” section, then “data tables”-
https://portal.saudicensus.sa/portal/public/1/15?type=TABLE
Selected, pre-set tables can be downloaded from the thematic section.
Date of access: 21 May 2024.
GLMM and GRC cannot guarantee that the link to access the source will not change; that the information will not be removed from the website it was obtained from; that no geo-blockages will be imposed; or that the information will not be available for any another reason.
Keywords: Saudi Arabia, Foreign Population, National Population, Foreign & National Populations
|
|
2010
|
2011
|
2012
|
2013
|
2014
|
2015
|
2016
|
2017
|
2018
|
2019
|
2020
|
2021
|
2022
|
|
0-4
|
483,540
|
501,027
|
521,693
|
546,249
|
571,402
|
597,380
|
628,585
|
623,430
|
583,664
|
546,443
|
531,513
|
454,158
|
404,204
|
|
5-9
|
394,047
|
416,263
|
431,615
|
447,585
|
464,834
|
509,852
|
552,251
|
552,872
|
527,179
|
514,034
|
540,077
|
502,617
|
504,637
|
|
10-14
|
485,346
|
421,127
|
390,248
|
373,450
|
360,577
|
386,243
|
421,010
|
427,263
|
417,740
|
416,578
|
450,451
|
434,389
|
446,411
|
|
15-19
|
1,430,709
|
1,176,865
|
929,119
|
722,493
|
564,858
|
476,935
|
420,691
|
370,190
|
329,052
|
314,303
|
329,235
|
332,452
|
338,455
|
|
20-24
|
2,331,265
|
2,240,002
|
2,066,773
|
1,902,844
|
1,670,052
|
1,426,379
|
1,169,018
|
909,118
|
671,833
|
597,579
|
782,305
|
672,095
|
896,490
|
|
25-29
|
1,998,830
|
2,259,210
|
2,290,471
|
2,451,747
|
2,447,286
|
2,480,792
|
2,410,905
|
2,177,832
|
1,818,482
|
1,738,052
|
1,929,772
|
1,714,034
|
2,043,453
|
|
30-34
|
1,142,942
|
1,444,287
|
1,694,156
|
2,022,917
|
2,180,988
|
2,470,043
|
2,661,794
|
2,631,944
|
2,416,624
|
2,341,462
|
2,504,503
|
2,259,524
|
2,363,675
|
|
35-39
|
670,141
|
903,380
|
1,141,622
|
1,426,745
|
1,562,840
|
1,859,094
|
2,100,224
|
2,164,213
|
2,079,974
|
2,048,830
|
2,129,371
|
1,996,314
|
2,110,905
|
|
40-44
|
457,709
|
625,717
|
824,258
|
1,025,151
|
1,112,205
|
1,331,542
|
1,515,340
|
1,559,738
|
1,500,875
|
1,425,971
|
1,566,303
|
1,443,892
|
1,575,884
|
|
45-49
|
251,636
|
392,176
|
565,102
|
732,810
|
810,446
|
976,353
|
1,110,310
|
1,141,645
|
1,092,388
|
1,024,418
|
1,087,096
|
997,695
|
1,039,267
|
|
50-54
|
102,688
|
195,525
|
322,713
|
437,703
|
501,709
|
637,802
|
753,907
|
792,774
|
773,859
|
744,656
|
796,799
|
715,808
|
734,378
|
|
55-59
|
70,088
|
81,966
|
168,324
|
255,548
|
295,893
|
383,483
|
458,337
|
487,128
|
475,729
|
447,830
|
482,530
|
450,829
|
466,215
|
|
60-64
|
48,374
|
31,560
|
62,992
|
102,950
|
127,662
|
180,486
|
234,524
|
264,492
|
247,608
|
231,804
|
261,111
|
243,540
|
257,010
|
|
65+
|
65,008
|
60,633
|
76,229
|
96,411
|
103,485
|
131,927
|
161,990
|
177,736
|
175,638
|
164,668
|
182,857
|
186,367
|
201,978
|
|
Total
|
9,932,323
|
10,749,738
|
11,485,315
|
12,544,603
|
12,774,237
|
13,848,311
|
14,598,886
|
14,280,375
|
13,110,645
|
12,556,628
|
13,573,923
|
12,403,714
|
13,382,962
|
Source: GAStat, Saudi Arabia census 2022
ANNEXED NOTE
1. Technical Notes and Definitions
Source: Saudi census 2022
Date of reference: 10 May 2022
Population of reference: Families and individual citizens and residents within the Kingdom, regardless of the status of their identification documents. Visitors for Hajj, Umrah and tourism are excluded from the census.
Methodology:
The first phase of the 2020 census began on 3 February 2020 (enumeration of buildings and households). Census 2022 used geospatial data, including satellite images, electricity consumption and mobile phone data, to improve the accuracy and geographic coverage of address canvassing.
The second stage (“actual enumeration”) was due to start on the original reference date (17 March 2020), but was suspended by the outbreak of the COVID-19 crisis. This stage was conducted in October 2021.
The 2022 census used a combined methodology – administrative records, fieldwork and digital self-enumeration. Household data were collected from e-portals of self-enumeration (on residents’ mobile devices, laptops or personal computers, or self-enumeration stations/kiosks, located in shopping centers). The digital self-enumeration process was complemented by face-to-face interviews, using digital tablets.
Census 2022 used a de jure approach: enumerating people according to their usual place of residence.
Administrative data from multiple sources was used to cross-validate collected census data.
Census 2022 was designed as a launchpad for several new secure statistical data registers for population, housing, and businesses.
See census methodology in:
https://portal.saudicensus.sa/portal/public/methodology
Portal of the Saudi census:
https://portal.saudicensus.sa/portal
Population data for 2010-22 were revised and backcasted, based on 2022 population census and past years’ administrative data.
Technical note on backcasting:
https://portal.saudicensus.sa/static-assets/media/content/20230529_Back-Casting%20Methodology.pdf?crafterSite=gastat-portal
2. Institution which provides data
General Authority for Statistics (GAStat)
3. Data availability
The table was retrieved from the Saudi census portal on GAStat website:
https://portal.saudicensus.sa/portal
“Population” section, then “data tables”-
https://portal.saudicensus.sa/portal/public/1/15?type=TABLE
Selected, pre-set tables can be downloaded from the thematic section.
Date of access: 29 April 2024.
GLMM and GRC cannot guarantee that the link to access the source will not change; that the information will not be removed from the website it was obtained from; that no geo-blockages will be imposed; or that the information will not be available for any another reason.
Keywords: Saudi Arabia, Foreign Population, National Population, Foreign & National Populations
|
|
2010
|
2011
|
2012
|
2013
|
2014
|
2015
|
2016
|
2017
|
2018
|
2019
|
2020
|
2021
|
2022
|
|
0-4
|
281,868
|
292,375
|
303,226
|
313,794
|
321,463
|
341,648
|
354,766
|
339,112
|
314,297
|
290,820
|
273,752
|
232,029
|
207,304
|
|
5-9
|
240,934
|
248,145
|
254,321
|
258,114
|
259,809
|
290,146
|
315,333
|
302,860
|
285,967
|
274,855
|
278,397
|
256,911
|
258,552
|
|
10-14
|
323,321
|
270,802
|
244,975
|
229,146
|
212,646
|
228,205
|
247,118
|
238,836
|
229,197
|
223,082
|
232,855
|
222,975
|
229,199
|
|
15-19
|
1,048,865
|
856,730
|
669,756
|
509,425
|
383,717
|
313,759
|
271,466
|
226,223
|
194,602
|
180,681
|
178,453
|
172,835
|
175,010
|
|
20-24
|
1,744,872
|
1,672,982
|
1,527,171
|
1,403,709
|
1,229,556
|
1,051,184
|
858,404
|
658,290
|
478,062
|
436,799
|
583,396
|
504,304
|
696,723
|
|
25-29
|
1,528,529
|
1,747,195
|
1,756,973
|
1,876,320
|
1,860,620
|
1,888,716
|
1,834,078
|
1,638,292
|
1,359,807
|
1,288,908
|
1,440,918
|
1,299,592
|
1,643,796
|
|
30-34
|
813,737
|
1,085,210
|
1,310,178
|
1,583,597
|
1,713,356
|
1,962,350
|
2,124,415
|
2,077,300
|
1,895,503
|
1,825,511
|
1,950,636
|
1,754,136
|
1,871,377
|
|
35-39
|
449,959
|
654,908
|
879,372
|
1,120,421
|
1,232,453
|
1,495,450
|
1,709,149
|
1,751,586
|
1,679,864
|
1,671,605
|
1,721,626
|
1,608,490
|
1,672,645
|
|
40-44
|
330,803
|
477,172
|
662,055
|
831,162
|
898,841
|
1,091,889
|
1,252,259
|
1,277,093
|
1,220,800
|
1,163,086
|
1,267,720
|
1,161,353
|
1,279,957
|
|
45-49
|
188,960
|
316,990
|
472,331
|
620,034
|
685,331
|
832,904
|
950,079
|
966,281
|
916,410
|
855,112
|
894,090
|
814,925
|
851,367
|
|
50-54
|
70,724
|
156,379
|
262,878
|
366,452
|
424,803
|
551,860
|
659,756
|
691,179
|
673,946
|
646,388
|
675,958
|
602,238
|
613,826
|
|
55-59
|
53,124
|
61,634
|
132,523
|
211,311
|
246,936
|
327,873
|
397,330
|
421,715
|
412,915
|
383,511
|
405,851
|
380,123
|
391,870
|
|
60-64
|
37,198
|
18,885
|
43,406
|
78,924
|
100,883
|
149,318
|
199,227
|
225,831
|
209,288
|
193,276
|
213,317
|
197,497
|
207,766
|
|
65+
|
43,343
|
37,477
|
49,408
|
67,012
|
71,563
|
96,553
|
123,007
|
135,245
|
131,814
|
120,216
|
131,579
|
133,615
|
145,072
|
|
Total
|
7,156,237
|
7,896,884
|
8,568,573
|
9,469,421
|
9,641,977
|
10,621,855
|
11,296,387
|
10,949,843
|
10,002,472
|
9,553,850
|
10,248,548
|
9,341,023
|
10,244,464
|
Source: GAStat, Saudi Arabia census 2022
ANNEXED NOTE
1. Technical Notes and Definitions
Source: Saudi census 2022
Date of reference: 10 May 2022
Population of reference: Families and individual citizens and residents within the Kingdom, regardless of the status of their identification documents. Visitors for Hajj, Umrah and tourism are excluded from the census.
Methodology:
The first phase of the 2020 census began on 3 February 2020 (enumeration of buildings and households). Census 2022 used geospatial data, including satellite images, electricity consumption and mobile phone data, to improve the accuracy and geographic coverage of address canvassing.
The second stage (“actual enumeration”) was due to start on the original reference date (17 March 2020), but was suspended by the outbreak of the COVID-19 crisis. This stage was conducted in October 2021.
The 2022 census used a combined methodology – administrative records, fieldwork and digital self-enumeration. Household data were collected from e-portals of self-enumeration (on residents’ mobile devices, laptops or personal computers, or self-enumeration stations/kiosks, located in shopping centers). The digital self-enumeration process was complemented by face-to-face interviews, using digital tablets.
Census 2022 used a de jure approach: enumerating people according to their usual place of residence.
Administrative data from multiple sources was used to cross-validate collected census data.
Census 2022 was designed as a launchpad for several new secure statistical data registers for population, housing, and businesses.
See census methodology in:
https://portal.saudicensus.sa/portal/public/methodology
Portal of the Saudi census:
https://portal.saudicensus.sa/portal
Population data for 2010-22 were revised and backcasted, based on 2022 population census and past years’ administrative data.
Technical note on backcasting:
https://portal.saudicensus.sa/static-assets/media/content/20230529_Back-Casting%20Methodology.pdf?crafterSite=gastat-portal
2. Institution which provides data
General Authority for Statistics (GAStat)
3. Data availability
The table was retrieved from the Saudi census portal on GAStat website:
https://portal.saudicensus.sa/portal
“Population” section, then “data tables”-
https://portal.saudicensus.sa/portal/public/1/15?type=TABLE
Selected, pre-set tables can be downloaded from the thematic section.
Date of access: 21 May 2024.
GLMM and GRC cannot guarantee that the link to access the source will not change; that the information will not be removed from the website it was obtained from; that no geo-blockages will be imposed; or that the information will not be available for any another reason.
Keywords: Saudi Arabia, Foreign Population, National Population, Foreign & National Populations
|
|
2010
|
2011
|
2012
|
2013
|
2014
|
2015
|
2016
|
2017
|
2018
|
2019
|
2020
|
2021
|
2022
|
|
0-4
|
201,672
|
208,652
|
218,467
|
232,455
|
249,939
|
255,732
|
273,819
|
284,318
|
269,367
|
255,623
|
257,761
|
222,129
|
196,900
|
|
5-9
|
153,113
|
168,118
|
177,294
|
189,471
|
205,025
|
219,706
|
236,918
|
250,012
|
241,212
|
239,179
|
261,680
|
245,706
|
246,085
|
|
10-14
|
162,025
|
150,325
|
145,273
|
144,304
|
147,931
|
158,038
|
173,892
|
188,427
|
188,543
|
193,496
|
217,596
|
211,414
|
217,212
|
|
15-19
|
381,844
|
320,135
|
259,363
|
213,068
|
181,141
|
163,176
|
149,225
|
143,967
|
134,450
|
133,622
|
150,782
|
159,617
|
163,445
|
|
20-24
|
586,393
|
567,020
|
539,602
|
499,135
|
440,496
|
375,195
|
310,614
|
250,828
|
193,771
|
160,780
|
198,909
|
167,791
|
199,767
|
|
25-29
|
470,301
|
512,015
|
533,498
|
575,427
|
586,666
|
592,076
|
576,827
|
539,540
|
458,675
|
449,144
|
488,854
|
414,442
|
399,657
|
|
30-34
|
329,205
|
359,077
|
383,978
|
439,320
|
467,632
|
507,693
|
537,379
|
554,644
|
521,121
|
515,951
|
553,867
|
505,388
|
492,298
|
|
35-39
|
220,182
|
248,472
|
262,250
|
306,324
|
330,387
|
363,644
|
391,075
|
412,627
|
400,110
|
377,225
|
407,745
|
387,824
|
438,260
|
|
40-44
|
126,906
|
148,545
|
162,203
|
193,989
|
213,364
|
239,653
|
263,081
|
282,645
|
280,075
|
262,885
|
298,583
|
282,539
|
295,927
|
|
45-49
|
62,676
|
75,186
|
92,771
|
112,776
|
125,115
|
143,449
|
160,231
|
175,364
|
175,978
|
169,306
|
193,006
|
182,770
|
187,900
|
|
50-54
|
31,964
|
39,146
|
59,835
|
71,251
|
76,906
|
85,942
|
94,151
|
101,595
|
99,913
|
98,268
|
120,841
|
113,570
|
120,552
|
|
55-59
|
16,964
|
20,332
|
35,801
|
44,237
|
48,957
|
55,610
|
61,007
|
65,413
|
62,814
|
64,319
|
76,679
|
70,706
|
74,345
|
|
60-64
|
11,176
|
12,675
|
19,586
|
24,026
|
26,779
|
31,168
|
35,297
|
38,661
|
38,320
|
38,528
|
47,794
|
46,043
|
49,244
|
|
65+
|
21,665
|
23,156
|
26,821
|
29,399
|
31,922
|
35,374
|
38,983
|
42,491
|
43,824
|
44,452
|
51,278
|
52,752
|
56,906
|
|
Total
|
2,776,086
|
2,852,854
|
2,916,742
|
3,075,182
|
3,132,260
|
3,226,456
|
3,302,499
|
3,330,532
|
3,108,173
|
3,002,778
|
3,325,375
|
3,062,691
|
3,138,498
|
Source: GAStat, Saudi Arabia census 2022
ANNEXED NOTE
1. Technical Notes and Definitions
Source: Saudi census 2022
Date of reference: 10 May 2022
Population of reference: Families and individual citizens and residents within the Kingdom, regardless of the status of their identification documents. Visitors for Hajj, Umrah and tourism are excluded from the census.
Methodology:
The first phase of the 2020 census began on 3 February 2020 (enumeration of buildings and households). Census 2022 used geospatial data, including satellite images, electricity consumption and mobile phone data, to improve the accuracy and geographic coverage of address canvassing.
The second stage (“actual enumeration”) was due to start on the original reference date (17 March 2020), but was suspended by the outbreak of the COVID-19 crisis. This stage was conducted in October 2021.
The 2022 census used a combined methodology – administrative records, fieldwork and digital self-enumeration. Household data were collected from e-portals of self-enumeration (on residents’ mobile devices, laptops or personal computers, or self-enumeration stations/kiosks, located in shopping centers). The digital self-enumeration process was complemented by face-to-face interviews, using digital tablets.
Census 2022 used a de jure approach: enumerating people according to their usual place of residence.
Administrative data from multiple sources was used to cross-validate collected census data.
Census 2022 was designed as a launchpad for several new secure statistical data registers for population, housing, and businesses.
See census methodology in:
https://portal.saudicensus.sa/portal/public/methodology
Portal of the Saudi census:
https://portal.saudicensus.sa/portal
Population data for 2010-22 were revised and backcasted, based on 2022 population census and past years’ administrative data.
Technical note on backcasting:
https://portal.saudicensus.sa/static-assets/media/content/20230529_Back-Casting%20Methodology.pdf?crafterSite=gastat-portal
2. Institution which provides data
General Authority for Statistics (GAStat)
3. Data availability
The table was retrieved from the Saudi census portal on GAStat website:
https://portal.saudicensus.sa/portal
“Population” section, then “data tables”-
https://portal.saudicensus.sa/portal/public/1/15?type=TABLE
Selected, pre-set tables can be downloaded from the thematic section.
Date of access: 21 May 2024.
GLMM and GRC cannot guarantee that the link to access the source will not change; that the information will not be removed from the website it was obtained from; that no geo-blockages will be imposed; or that the information will not be available for any another reason.
Keywords: Saudi Arabia, Foreign Population, National Population, Foreign & National Populations
|
|
Bahrain
|
Kuwait*
|
Oman*
|
Qatar
|
Saudi Arabia
|
UAE
|
|
Males
|
Females
|
Males
|
Females
|
Males
|
Females
|
Males
|
Females
|
Males
|
Females
|
Males
|
Females
|
|
0-4
|
33,090
|
32,003
|
79,877
|
77,670
|
193,274
|
186,880
|
64,425**
|
61,140**
|
1,106,938
|
1,067,017
|
N.A.
|
N.A.
|
|
5-9
|
38,302
|
36,673
|
87,292
|
82,393
|
206,328
|
198,430
|
1,148,999
|
1,108,681
|
N.A.
|
N.A.
|
|
10-14
|
36,293
|
34,907
|
88,104
|
83,914
|
160,564
|
155,283
|
1,068,186
|
1,031,817
|
N.A.
|
N.A.
|
|
15-19
|
33,128
|
31,853
|
76,609
|
75,089
|
119,639
|
115,721
|
14,424
|
14,863
|
941,806
|
916,439
|
N.A.
|
N.A.
|
|
20-24
|
29,889
|
27,922
|
66,815
|
65,104
|
109,977
|
106,857
|
17,120
|
16,057
|
868,712
|
850,780
|
N.A.
|
N.A.
|
|
25-29
|
30,055
|
28,083
|
66,647
|
64,461
|
118,346
|
114,605
|
14,473
|
14,391
|
859,531
|
842,731
|
N.A.
|
N.A.
|
|
30-34
|
28,189
|
26,893
|
48,975
|
52,607
|
123,194
|
120,194
|
12,576
|
12,380
|
770,595
|
758,562
|
N.A.
|
N.A.
|
|
35-39
|
24,829
|
24,291
|
52,231
|
56,948
|
113,859
|
111,876
|
10,673
|
12,600
|
679,028
|
675,023
|
N.A.
|
N.A.
|
|
40-44
|
22,202
|
21,920
|
42,233
|
45,508
|
88,914
|
88,146
|
5,524
|
8,394
|
534,889
|
543,104
|
N.A.
|
N.A.
|
|
45-49
|
18,587
|
18,616
|
34,203
|
39,923
|
61,730
|
62,002
|
9,966
|
8,446
|
381,557
|
404,356
|
N.A.
|
N.A.
|
|
50-54
|
15,641
|
16,467
|
29,381
|
34,453
|
41,472
|
40,116
|
5,935
|
6,945
|
310,703
|
343,291
|
N.A.
|
N.A.
|
|
55-59
|
15,657
|
16,793
|
24,419
|
29,126
|
30,926
|
32,814
|
6,529
|
6,867
|
252,068
|
276,936
|
N.A.
|
N.A.
|
|
60-64
|
13,363
|
14,203
|
17,572
|
22,913
|
25,873
|
29,792
|
4,929
|
6,418
|
186,840
|
203,802
|
N.A.
|
N.A.
|
|
65-69
|
10,086
|
9,431
|
12,779
|
17,485
|
17,417
|
22,462
|
3,659
|
2,786
|
127,205
|
129,931
|
N.A.
|
N.A.
|
|
70-74
|
6,307
|
5,368
|
7,492
|
11,399
|
12,748
|
15,712
|
1,611
|
1,783
|
75,465
|
80,111
|
N.A.
|
N.A.
|
|
75-79
|
2,971
|
3,121
|
4,791
|
7,473
|
8,719
|
10,168
|
1,809
|
2,116
|
54,159
|
56,412
|
N.A.
|
N.A.
|
|
80-84
|
1,845
|
2,219
|
4,818
|
6,372
|
10,866
|
12,707
|
67,450
|
69,138
|
N.A.
|
N.A.
|
|
85+
|
1,153
|
1,661
|
N.A.
|
N.A.
|
|
Total
|
361,587
|
352,424
|
744,238
|
772,838
|
1,443,846
|
1,423,765
|
109,228
|
114,046
|
9,434,131
|
9,358,131
|
N.A.
|
N.A.
|
Source: National institutes of statistics
1- Definition:
Non-nationals are:
1- persons bearing nationality of a foreign State other than the GCC State of residence, or bearing no proof of nationality from any given state (stateless persons and holders of refugee status and travel document in a third country);
2- Holders of residence permit residing in the given GCC country at date of census, as per definition of residence used in each of the countries.
N.A: Not Available
*: end of year data.
**: GLMM estimates, based on available data from Qatari official statistical sources.
2- Sources of data:
(1) Bahrain: mid-year estimates of Bahrain’s total resident population (nationals and non-nationals) by age group, based on the results of census 2020.
Source: administrative records (central Population Register)
IGA’s Bahrain Open Data Portal:
https://bahrain.opendatasoft.com/pages/homepage/
https://bahrain.opendatasoft.com/explore/?sort=modified&refine.theme=Population
(2) Kuwait: Estimates based on census 2021 as a base year.
The Kuwaiti population for following years is estimated using natural increase figures (births – deaths) and number of naturalised non-nationals during the year. The non-Kuwaiti population is estimated based on natural increase figures (births – deaths) and net migration (entries – exits).
Source of the births and deaths data (vital statistics records): The Public Authority for Civil Information (PACI).
Source of data on arrivals and departures: Ministry of Interior.
CSB website, “Population Estimates” section, “Population Estimates in Kuwait by Age, Nationality and Sex at 1-1-2023” https://www.csb.gov.kw/Pages/Statistics_en?ID=67&ParentCatID=1
(3) Oman: Period of reference: 31/12.
Source of the data: data updated from e-census 2020; based on vital statistics (births and deaths) produced by the Ministry of Health (MOH), and National Registration System (Royal Oman Police).
The civil registration records all Omani and expatriate residents. It is based on the civil status system and is maintained by the General Directorate of Civil Status, a part of the Royal Oman Police.
Since 2004, registration of all vital events taking place in the Sultanate (births, death, marriages and divorces) in the civil register is mandatory for Omanis and foreign residents of the Sultanate.
E-census 2020:
Population data and statistics: methodology explained in publication “Electronic Census System for the E-Census for Population, Residences & Establishments 2020”, especially pp. 15-16; 19-20 https://portal.ecensus.gov.om/ecen-portal/indicators/83/viewer
Portal of e-census 2020 and data updates for December 2021 and 2022:
https://portal.ecensus.gov.om/ecen-portal /
Data retrieved from e-census portal, datasets building tool:
https://portal.ecensus.gov.om/ecen-portal/indicators/261/viewer
(4) Qatar: Disaggregated figures of the total Qatari and non-Qatari populations in Qatar are not readily available in any published source.
The numbers of Qataris and non-Qataris in age group 0-14 are GLMM’s estimates, using:
a. The Annual Bulletin of the Labour Force Survey 2022
https://www.psa.gov.qa/en/statistics/Statistical%20Releases/Social/LaborForce/2022/Bulletin_labor_force_2022.xlsx
which gives:
1. the numbers of Qataris and non-Qataris aged 15 and above by sex and five-years age group for 2022.
2. The total resident population in Qatar by sex (not disaggregated by nationality).
b. Qatar Planning and Statistics Authority. Woman and Man in the State of Qatar-A Statistical Profile, 2022,
https://www.psa.gov.qa/en/statistics/Statistical%20Releases/Social/GenrealSocialStatistics/MenWomenProfile/2022/Woman_Man_2022_EN.pdf
which gives:
-
the percentage distribution of population by broad age group (0-14; 15-64; 65+) for mid-2021, by sex and nationality (last available data on total national and foreign populations’ age structure, as of April 2024).
The two sources were used to estimate the total population by sex and nationality, and the numbers of Qataris and non-Qataris in age group 0-14.
(5) Saudi Arabia: Source of data: Saudi census 2022
The 2022 census used a combined methodology – administrative records, fieldwork and digital self-enumeration.
Population data for 2010-22 were revised and backcasted, based on 2022 population census and past years’ administrative data.
Technical note on backcasting:
https://portal.saudicensus.sa/static-assets/media/content/20230529_Back-Casting%20Methodology.pdf?crafterSite=gastat-portal
The table was retrieved from the Saudi census portal on GAStat website:
https://portal.saudicensus.sa/portal
“Population” section, then “data tables”-
https://portal.saudicensus.sa/portal/public/1/15?type=TABLE
Selected, pre-set tables can be downloaded from the thematic section.
(6) UAE: Figures of UAE population disaggregated by age group and nationality are unavailable in published sources, as of April 2024.
Data needed to indirectly estimate the UAE population by nationality are also unavailable for 2022.
For estimates relevant to earlier years, please visit GLMM’s database:
https://gulfmigration.grc.net/glmm-database/demographic-and-economic-module/
Last date of access: April 2024.
GLMM and GRC cannot guarantee that the link to access the source will not change; that the information will not be removed from the website it was obtained from; that no geo-blockages will be imposed; or that the information will not be available for any another reason.
Keywords: Bahrain, Oman, Kuwait, Saudi Arabia, Qatar, United Arab Emirates, Foreign & National Populations
|
|
Bahrain
|
Kuwait*
|
Oman*
|
Qatar
|
Saudi Arabia
|
UAE
|
|
Males
|
Females
|
Males
|
Females
|
Males
|
Females
|
Males
|
Females
|
Males
|
Females
|
Males
|
Females
|
|
0-4
|
15,295
|
14,641
|
56,555
|
55,569
|
26,794
|
25,299
|
191,313**
|
176,016**
|
207,304
|
196,900
|
N.A.
|
N.A.
|
|
5-9
|
15,102
|
14,766
|
75,842
|
71,866
|
29,798
|
28,203
|
258,552
|
246,085
|
N.A.
|
N.A.
|
|
10-14
|
12,285
|
11,508
|
74,787
|
70,185
|
24,832
|
22,989
|
229,199
|
217,212
|
N.A.
|
N.A.
|
|
15-19
|
9,689
|
7,712
|
55,679
|
52,907
|
18,522
|
17,083
|
33,140
|
30,060
|
175,010
|
163,445
|
N.A.
|
N.A.
|
|
20-24
|
36,034
|
10,774
|
62,238
|
44,489
|
126,549
|
29,487
|
141,262
|
64,709
|
696,723
|
199,767
|
N.A.
|
N.A.
|
|
25-29
|
61,338
|
27,949
|
239,562
|
86,968
|
257,767
|
52,192
|
228,763
|
43,547
|
1,643,796
|
399,657
|
N.A.
|
N.A.
|
|
30-34
|
112,210
|
34,431
|
288,214
|
125,939
|
323,870
|
71,543
|
430,327
|
116,317
|
1,871,377
|
492,298
|
N.A.
|
N.A.
|
|
35-39
|
117,938
|
32,139
|
363,465
|
164,133
|
306,440
|
69,943
|
327,583
|
50,329
|
1,672,645
|
438,260
|
N.A.
|
N.A.
|
|
40-44
|
81,649
|
26,598
|
334,328
|
140,911
|
213,005
|
52,093
|
265,862
|
70,894
|
1,279,957
|
295,927
|
N.A.
|
N.A.
|
|
45-49
|
54,881
|
19,068
|
245,893
|
111,643
|
128,647
|
34,166
|
123,657
|
34,071
|
851,367
|
187,900
|
N.A.
|
N.A.
|
|
50-54
|
36,513
|
11,850
|
181,928
|
75,451
|
84,102
|
19,789
|
120,834
|
22,800
|
613,826
|
120,552
|
N.A.
|
N.A.
|
|
55-59
|
18,778
|
7,217
|
114,223
|
43,782
|
44,499
|
10,925
|
45,787
|
13,302
|
391,870
|
74,345
|
N.A.
|
N.A.
|
|
60-64
|
8,875
|
3,680
|
54,780
|
22,135
|
20,141
|
6,205
|
25,748
|
6,901
|
207,766
|
49,244
|
N.A.
|
N.A.
|
|
65-69
|
3,195
|
1,567
|
24,294
|
10,517
|
8,908
|
3,628
|
7,534
|
3,117
|
85,139
|
26,184
|
N.A.
|
N.A.
|
|
70-74
|
972
|
635
|
9,966
|
5,345
|
2,774
|
2,094
|
3,892
|
1,750
|
35,014
|
14,753
|
N.A.
|
N.A.
|
|
75-79
|
369
|
312
|
4,196
|
3,095
|
1,186
|
1,028
|
1,981
|
1,906
|
13,233
|
7,688
|
N.A.
|
N.A.
|
|
80-84
|
172
|
189
|
2,869
|
2,738
|
952
|
786
|
11,686
|
8,281
|
N.A.
|
N.A.
|
|
85+
|
155
|
196
|
N.A.
|
N.A.
|
|
Total
|
585,450
|
225,232
|
2,188,819
|
1,087,673
|
1,618,786
|
447,453
|
1,756,370
|
459,703
|
10,244,464
|
3,138,498
|
N.A.
|
N.A.
|
Source: National institutes of statistics
1- Definition:
Non-nationals are:
1- persons bearing nationality of a foreign State other than the GCC State of residence, or bearing no proof of nationality from any given state (stateless persons and holders of refugee status and travel document in a third country);
2- Holders of residence permit residing in the given GCC country at date of census, as per definition of residence used in each of the countries.
N.A: Not Available
*: end of year data.
**: GLMM estimates, based on available data from Qatari official statistical sources.
2- Sources of data:
(1) Bahrain: mid-year estimates of Bahrain’s total resident population (nationals and non-nationals) by age group, based on the results of census 2020.
Source: administrative records (central Population Register).
IGA’s Bahrain Open Data Portal:
https://bahrain.opendatasoft.com/pages/homepage/
https://bahrain.opendatasoft.com/explore/?sort=modified&refine.theme=Population
(2) Kuwait: Estimates based on census 2021 as a base year.
The Kuwaiti population for following years is estimated using natural increase figures (births – deaths) and number of naturalised non-nationals during the year.
The non-Kuwaiti population is estimated based on natural increase figures (births – deaths) and net migration (entries – exits).
Source of the births and deaths data (vital statistics records): The Public Authority for Civil Information (PACI).
Source of data on arrivals and departures: Ministry of Interior.
CSB website, “Population Estimates” section, “Population Estimates in Kuwait by Age, Nationality and Sex at 1-1-2023” https://www.csb.gov.kw/Pages/Statistics_en?ID=67&ParentCatID=1
(3) Oman: Period of reference: 31/12.
Source of the data: data updated from e-census 2020; based on vital statistics (births and deaths) produced by the Ministry of Health (MOH), and National Registration System (Royal Oman Police).
The civil registration records all Omani and expatriate residents. It is based on the civil status system and is maintained by the General Directorate of Civil Status, a part of the Royal Oman Police.
Since 2004, registration of all vital events taking place in the Sultanate (births, death, marriages and divorces) in the civil register is mandatory for Omanis and foreign residents of the Sultanate.
E-census 2020:
Population data and statistics: methodology explained in publication “Electronic Census System for the E-Census for Population, Residences & Establishments 2020”, especially pp. 15-16; 19-20 https://portal.ecensus.gov.om/ecen-portal/indicators/83/viewer
Portal of e-census 2020 and data updates for December 2021 and 2022:
https://portal.ecensus.gov.om/ecen-portal /
Data retrieved from e-census portal, datasets building tool:
https://portal.ecensus.gov.om/ecen-portal/indicators/261/viewer
(4) Qatar: Disaggregated figures of the total Qatari and non-Qatari populations in Qatar are not readily available in any published source.
The numbers of Qataris and non-Qataris in age group 0-14 are GLMM’s estimates, using:
a. The Annual Bulletin of the Labour Force Survey 2022
https://www.psa.gov.qa/en/statistics/Statistical%20Releases/Social/LaborForce/2022/Bulletin_labor_force_2022.xlsx
which gives:
1. the numbers of Qataris and non-Qataris aged 15 and above by sex and five-years age group for 2022.
2. The total resident population in Qatar by sex (not disaggregated by nationality).
b. Qatar Planning and Statistics Authority. Woman and Man in the State of Qatar-A Statistical Profile, 2022,
https://www.psa.gov.qa/en/statistics/Statistical%20Releases/Social/GenrealSocialStatistics/MenWomenProfile/2022/Woman_Man_2022_EN.pdf
which gives:
-
the percentage distribution of population by broad age group (0-14; 15-64; 65+) for mid-2021, by sex and nationality (last available data on total national and foreign populations’ age structure, as of April 2024).
The two sources were used to estimate the total population by sex and nationality, and the numbers of Qataris and non-Qataris in age group 0-14.
(5) Saudi Arabia: Source of data: Saudi census 2022
The 2022 census used a combined methodology – administrative records, fieldwork and digital self-enumeration.
Population data for 2010-22 were revised and backcasted, based on 2022 population census and past years’ administrative data.
Technical note on backcasting:
https://portal.saudicensus.sa/static-assets/media/content/20230529_Back-Casting%20Methodology.pdf?crafterSite=gastat-portal
The table was retrieved from the Saudi census portal on GAStat website:
https://portal.saudicensus.sa/portal
“Population” section, then “data tables”-
https://portal.saudicensus.sa/portal/public/1/15?type=TABLE
Selected, pre-set tables can be downloaded from the thematic section.
(6) UAE: Figures of UAE population disaggregated by age group and nationality are unavailable in published sources, as of April 2024.
Data needed to indirectly estimate the UAE population by nationality are also unavailable for 2022.
For estimates relevant to earlier years, please visit GLMM’s database:
https://gulfmigration.grc.net/glmm-database/demographic-and-economic-module/
Last date of access: April 2024.
GLMM and GRC cannot guarantee that the link to access the source will not change; that the information will not be removed from the website it was obtained from; that no geo-blockages will be imposed; or that the information will not be available for any another reason.
Keywords: Bahrain, Oman, Kuwait, Saudi Arabia, Qatar, United Arab Emirates, Foreign & National Populations
|
|
Bahrain
|
Kuwait*
|
Oman*
|
Qatar
|
Saudi Arabia
|
UAE
|
|
Nationals
|
Non-nationals
|
Nationals
|
Non-nationals
|
Nationals
|
Non-nationals
|
Nationals
|
Non-nationals
|
Nationals
|
Non-nationals
|
Nationals
|
Non-nationals
|
|
0-4
|
65,093
|
29,936
|
157,547
|
112,124
|
380,154
|
52,093
|
125,565**
|
367,329**
|
2,173,955
|
404,204
|
N.A.
|
N.A.
|
|
5-9
|
74,975
|
29,868
|
169,685
|
147,708
|
404,758
|
58,001
|
2,257,680
|
504,637
|
N.A.
|
N.A.
|
|
10-14
|
71,200
|
23,793
|
172,018
|
144,972
|
315,847
|
47,821
|
2,100,003
|
446,411
|
N.A.
|
N.A.
|
|
15-19
|
64,981
|
17,401
|
151,698
|
108,586
|
235,360
|
35,605
|
29,287
|
63,200
|
1,858,245
|
338,455
|
N.A.
|
N.A.
|
|
20-24
|
57,811
|
46,808
|
131,919
|
106,727
|
216,834
|
156,036
|
33,177
|
205,971
|
1,719,492
|
896,490
|
N.A.
|
N.A.
|
|
25-29
|
58,138
|
89,287
|
131,108
|
326,530
|
232,951
|
309,959
|
28,864
|
272,310
|
1,702,262
|
2,043,453
|
N.A.
|
N.A.
|
|
30-34
|
55,082
|
146,641
|
101,582
|
414,153
|
243,388
|
395,413
|
24,956
|
546,644
|
1,529,157
|
2,363,675
|
N.A.
|
N.A.
|
|
35-39
|
49,120
|
150,077
|
109,179
|
527,598
|
225,735
|
376,383
|
23,273
|
377,912
|
1,354,051
|
2,110,905
|
N.A.
|
N.A.
|
|
40-44
|
44,122
|
108,247
|
87,741
|
475,239
|
177,060
|
265,098
|
13,918
|
336,756
|
1,077,993
|
1,575,884
|
N.A.
|
N.A.
|
|
45-49
|
37,203
|
73,949
|
74,126
|
357,536
|
123,732
|
162,813
|
18,412
|
157,728
|
785,913
|
1,039,267
|
N.A.
|
N.A.
|
|
50-54
|
32,108
|
48,363
|
63,834
|
257,379
|
81,588
|
103,891
|
12,880
|
143,634
|
653,994
|
734,378
|
N.A.
|
N.A.
|
|
55-59
|
32,450
|
25,995
|
53,545
|
158,005
|
63,740
|
55,424
|
13,396
|
59,089
|
529,004
|
466,215
|
N.A.
|
N.A.
|
|
60-64
|
27,566
|
12,555
|
40,485
|
76,915
|
55,665
|
26,346
|
11,347
|
32,649
|
390,642
|
257,010
|
N.A.
|
N.A.
|
|
65-69
|
19,517
|
4,762
|
30,264
|
34,811
|
39,879
|
12,536
|
6,445
|
10,651
|
257,136
|
111,323
|
N.A.
|
N.A.
|
|
70-74
|
11,675
|
1,607
|
18,891
|
15,311
|
28,460
|
4,868
|
3,394
|
5,642
|
155,576
|
49,767
|
N.A.
|
N.A.
|
|
75-79
|
6,092
|
681
|
12,264
|
7,291
|
18,887
|
2,214
|
3,925
|
3,887
|
110,571
|
20,921
|
N.A.
|
N.A.
|
|
80-84
|
4,064
|
361
|
11,190
|
5,607
|
23,573
|
1,738
|
136,588
|
19,967
|
N.A.
|
N.A.
|
|
85+
|
2,814
|
351
|
N.A.
|
N.A.
|
|
Total
|
714,011
|
810,682
|
1,517,076
|
3,276,492
|
2,867,611
|
2,066,239
|
348,839
|
2,583,402
|
18,792,262
|
13,382,962
|
N.A.
|
N.A.
|
Source: National institutes of statistics
1- Definition:
Non-nationals are:
1- persons bearing nationality of a foreign State other than the GCC State of residence, or bearing no proof of nationality from any given state (stateless persons and holders of refugee status and travel document in a third country);
2- Holders of residence permit residing in the given GCC country at date of census, as per definition of residence used in each of the countries.
N.A: Not Available
*: end of year data.
**: GLMM estimates, based on available data from Qatari official statistical sources.
2- Sources of data:
(1) Bahrain: mid-year estimates of Bahrain’s total resident population (nationals and non-nationals) by age group, based on the results of census 2020.
Source: administrative records (central Population Register)
IGA’s Bahrain Open Data Portal:
https://bahrain.opendatasoft.com/pages/homepage/
https://bahrain.opendatasoft.com/explore/?sort=modified&refine.theme=Population
(2) Kuwait: Estimates based on census 2021 as a base year.
The Kuwaiti population for following years is estimated using natural increase figures (births – deaths) and number of naturalised non-nationals during the year. The non-Kuwaiti population is estimated based on natural increase figures (births – deaths) and net migration (entries – exits).
Source of the births and deaths data (vital statistics records): The Public Authority for Civil Information (PACI).
Source of data on arrivals and departures: Ministry of Interior.
CSB website, “Population Estimates” section, “Population Estimates in Kuwait by Age, Nationality and Sex at 1-1-2023” https://www.csb.gov.kw/Pages/Statistics_en?ID=67&ParentCatID=1
(3) Oman: Period of reference: 31/12.
Source of the data: data updated from e-census 2020; based on vital statistics (births and deaths) produced by the Ministry of Health (MOH), and National Registration System (Royal Oman Police).
The civil registration records all Omani and expatriate residents. It is based on the civil status system and is maintained by the General Directorate of Civil Status, a part of the Royal Oman Police.
Since 2004, registration of all vital events taking place in the Sultanate (births, death, marriages and divorces) in the civil register is mandatory for Omanis and foreign residents of the Sultanate.
E-census 2020:
Population data and statistics: methodology explained in publication “Electronic Census System for the E-Census for Population, Residences & Establishments 2020”, especially pp. 15-16; 19-20 https://portal.ecensus.gov.om/ecen-portal/indicators/83/viewer
Portal of e-census 2020 and data updates for December 2021 and 2022:
https://portal.ecensus.gov.om/ecen-portal /
Data retrieved from e-census portal, datasets building tool:
https://portal.ecensus.gov.om/ecen-portal/indicators/261/viewer
(4) Qatar: Disaggregated figures of the total Qatari and non-Qatari populations in Qatar are not readily available in any published source.
The numbers of Qataris and non-Qataris in age group 0-14 are GLMM’s estimates, using:
a. The Annual Bulletin of the Labour Force Survey 2022
https://www.psa.gov.qa/en/statistics/Statistical%20Releases/Social/LaborForce/2022/Bulletin_labor_force_2022.xlsx
which gives:
1. the numbers of Qataris and non-Qataris aged 15 and above by sex and five-years age group for 2022.
2. The total resident population in Qatar by sex (not disaggregated by nationality).
b. Qatar Planning and Statistics Authority. Woman and Man in the State of Qatar-A Statistical Profile, 2022,
https://www.psa.gov.qa/en/statistics/Statistical%20Releases/Social/GenrealSocialStatistics/MenWomenProfile/2022/Woman_Man_2022_EN.pdf
which gives:
-
the percentage distribution of population by broad age group (0-14; 15-64; 65+) for mid-2021, by sex and nationality (last available data on total national and foreign populations’ age structure, as of April 2024).
The two sources were used to estimate the total population by sex and nationality, and the numbers of Qataris and non-Qataris in age group 0-14.
(5) Saudi Arabia: Source of data: Saudi census 2022
The 2022 census used a combined methodology – administrative records, fieldwork and digital self-enumeration.
Population data for 2010-22 were revised and backcasted, based on 2022 population census and past years’ administrative data.
Technical note on backcasting:
https://portal.saudicensus.sa/static-assets/media/content/20230529_Back-Casting%20Methodology.pdf?crafterSite=gastat-portal
The table was retrieved from the Saudi census portal on GAStat website:
https://portal.saudicensus.sa/portal
“Population” section, then “data tables”-
https://portal.saudicensus.sa/portal/public/1/15?type=TABLE
Selected, pre-set tables can be downloaded from the thematic section.
(6) UAE: Figures of UAE population disaggregated by age group and nationality are unavailable in published sources, as of April 2024.
Data needed to indirectly estimate the UAE population by nationality are also unavailable for 2022.
For estimates relevant to earlier years, please visit GLMM’s database:
https://gulfmigration.grc.net/glmm-database/demographic-and-economic-module/
Last date of access: April 2024.
GLMM and GRC cannot guarantee that the link to access the source will not change; that the information will not be removed from the website it was obtained from; that no geo-blockages will be imposed; or that the information will not be available for any another reason.
Keywords: Bahrain, Oman, Kuwait, Saudi Arabia, Qatar, United Arab Emirates, Foreign & National Populations
|
|
Saudis
|
Non-Saudis
|
Total
|
|
Males
|
Females
|
Total
|
Males
|
Females
|
Total
|
Males
|
Females
|
Total
|
|
Government sector
|
975,529
|
639,127
|
1,614,656
|
94,029
|
60,036
|
154,065
|
1,069,558
|
699,163
|
1,768,721
|
|
Private sector
|
1,357,494
|
943,097
|
2,300,591
|
7,671,779
|
319,900
|
7,991,679
|
9,029,273
|
1,262,997
|
10,292,270
|
|
Domestic sector
|
0
|
0
|
0
|
2,716,735
|
1,109,778
|
3,826,513
|
2,716,735
|
1,109,778
|
3,826,513
|
|
Total
|
2,333,023
|
1,582,224
|
3,915,247
|
10,482,543
|
1,489,714
|
11,972,257
|
12,815,566
|
3,071,938
|
15,887,504
|
Source: Register-Based Labour Market Statistics, General Authority for Statistics (GAStat)
1. Data collection methodology and definitions used
LFS were first conducted in 2001 and became bi-annual after 2006. Data were collected through nationally representative household sample surveys, which sampling was based on most recent censuses. Since 2016, Labour Force Surveys have been conducted and published on a quarterly basis, based on the following sources:
1. Household telephone surveys conducted by GAStat.
2. Employment data extracted from administrative records, introduced as a complement to the results of Labour Force Surveys in Labour Market Statistics’ publications, starting on Q1 2017.
Types of data available from GAStat’s labour statistics’ publications, by source:
1. Household Telephone Surveys:
Estimates of labor force, unemployed individuals, and indicators of labor force
2. Administrative records:
– Ministry of Human Resources and Social Development (MHRSD)
(formerly Ministry of Labour and Social Development):
Supplies data on:
Government sector’s workers and Private sector visas.
– General Organization of Social Insurance (GOSI):
Supplies data on:
a. contributors on the job who are subject to social insurance laws and regulations in the private
and government sector (outside the civil service);
b. workers who terminated their contribution to social insurance during the quarter.
– National Information Center (NIC):
Supplies data on:
a. job seekers in the public and private sectors from the data of (Jadara and Sa’ed) in the MHRSD, at (Taqat) portal of the HRDF;
b. government sector and individuals’ visas;
c. numbers of domestic workers.
Figures of workers in Labor Market statistics which were derived from administrative records DO NOT INCLUDE the following categories:
1-Workers in the military and security sectors
2- Workers who are not registered in the civil service and social insurance records, which include:
– Saudis working for their own businesses and are not subjected to the labor regulations, also, not registered in social insurance, such as those who work in delivery through electronic applications;
– Saudi employers who work in establishments and not registered in the social insurance;
– Non-Saudi staff working in foreign international, political or military missions.
3- Non-Saudi employees in the Kingdom for work contracts’ durations below three months.
The present data is taken from administrative records, and refers to the employed population registered in the civil service, GOSI and as domestic worker.
– The public (government) sector includes those subject to civil service regulations and government employees subject to insurance regulations (GOSI);
– The category of domestic workers in Arab states encompasses professions performed within the household, such as maids, cooks, waiters, valets, butlers, laundresses, gardeners, gatekeepers, stable-lads, chauffeurs, caretakers, governesses, babysitters, tutors, secretaries etc.
These professions are classified in the class 9700 of section T of the International Standard Industrial Classification of all Economic Activities (ISIC), Rev. 4.
See: Department of Economic and Social Affairs, Statistics Division. “International Standard Industrial Classification of All Economic Activities Revision 4, ” Statistical Papers, Series M No. 4/Rev.4, New York: United Nations, 2008, p. 269
https://unstats.un.org/unsd/publication/seriesm/seriesm_4rev4e.pdf.
Definitions and categories used by GAStat in Labour Markets Statistics (employment; unemployment; occupation and activity sectors, etc.) are based on international standards:
For LFS methodology and definitions, see:
https://www.stats.gov.sa/en/node/9787
https://database.stats.gov.sa/Methodologies/En_Documents/03_Labor%20Market%20Bulletin%20Methodology,%20Fourth%20Quarter%202020%20_%20General%20Authority%20for%20Statistics.pdf
2. Institution which provides data
General Authority for Statistics (GAStat)
3. Data availability
Since 2021, GAStat has been publishing separately the employment data taken from administrative records, and unemployment/inactivity data as well as general indicators, calculated from the results of the field interviews conducted by GAStat (Labour Force Survey).
The present time-series was taken from the Register-based Labour Market Statistics- Q4, 2023
(English and Arabic versions)
https://www.stats.gov.sa/sites/default/files/Register-based%20Labour%20Market%20Statistics-%20Q4%202023%20En.xlsx
https://www.stats.gov.sa/sites/default/files/Register-based%20Labour%20Market%20Statistics-%20Q4%202023Ar.xlsx
Quarterly Register-based Labour Market Statistics reports are accessible from:
https://www.stats.gov.sa/en/814
https://www.stats.gov.sa/ar/814
Date of access: 15 April 2024.
Keywords: Employment, Female Employment, Saudi Arabia, National & Foreign Labour, Domestic Workers
GLMM and GRC cannot guarantee that the link to access the source will not change; that the information will not be removed from the website it was obtained from; that no geo-blockages will be imposed; or that the information will not be available for any another reason.
|
Saudis
|
Non-Saudis
|
Total
|
|
Males
|
Females
|
Total
|
Males
|
Females
|
Total
|
Males
|
Females
|
Total
|
|
15-19
|
45,441
|
20,664
|
66,105
|
31,692
|
2,750
|
34,442
|
77,133
|
23,414
|
100,547
|
|
20-24
|
258,194
|
133,738
|
391,932
|
373,914
|
14,423
|
388,337
|
632,108
|
148,161
|
780,269
|
|
25-29
|
370,427
|
265,682
|
636,109
|
1,246,360
|
58,575
|
1,304,935
|
1,616,787
|
324,257
|
1,941,044
|
|
30-34
|
398,702
|
274,956
|
673,658
|
1,319,863
|
76,102
|
1,395,965
|
1,718,565
|
351,058
|
2,069,623
|
|
35-39
|
382,043
|
253,067
|
635,110
|
1,487,124
|
80,836
|
1,567,960
|
1,869,167
|
333,903
|
2,203,070
|
|
40-44
|
329,474
|
234,065
|
563,539
|
1,214,630
|
60,214
|
1,274,844
|
1,544,104
|
294,279
|
1,838,383
|
|
45-49
|
241,263
|
200,616
|
441,879
|
816,797
|
36,677
|
853,474
|
1,058,060
|
237,293
|
1,295,353
|
|
50-54
|
163,590
|
122,650
|
286,240
|
549,382
|
23,329
|
572,711
|
712,972
|
145,979
|
858,951
|
|
55-59
|
115,794
|
62,470
|
178,264
|
372,383
|
14,258
|
386,641
|
488,177
|
76,728
|
564,905
|
|
64-60
|
19,250
|
10,296
|
29,546
|
205,172
|
7,036
|
212,208
|
224,422
|
17,332
|
241,754
|
|
65+
|
8,845
|
4,020
|
12,865
|
148,491
|
5,736
|
154,227
|
157,336
|
9,756
|
167,092
|
|
Total
|
2,333,023
|
1,582,224
|
3,915,247
|
7,765,808
|
379,936
|
8,145,744
|
10,098,831
|
1,962,160
|
12,060,991
|
|
Domestic workers
|
0
|
0
|
0
|
2,716,735
|
1,109,778
|
3,826,513
|
2,716,735
|
1,109,778
|
3,826,513
|
|
Total
|
2,333,023
|
1,582,224
|
3,915,247
|
10,482,543
|
1,489,714
|
11,972,257
|
12,815,566
|
3,071,938
|
15,887,504
|
Source: Register-Based Labour Market Statistics, General Authority for Statistics (GAStat)
1. Data collection methodology and definitions used
LFS were first conducted in 2001 and became bi-annual after 2006. Data were collected through nationally representative household sample surveys, which sampling was based on most recent censuses. Since 2016, Labour Force Surveys have been conducted and published on a quarterly basis, based on the following sources:
1. Household telephone surveys conducted by GAStat.
2. Employment data extracted from administrative records, introduced as a complement to the results of Labour Force Surveys in Labour Market Statistics’ publications, starting on Q1 2017.
Types of data available from GAStat’s labour statistics’ publications, by source:
1. Household Telephone Surveys:
Estimates of labor force, unemployed individuals, and indicators of labor force
2. Administrative records:
– Ministry of Human Resources and Social Development (MHRSD)
(formerly Ministry of Labour and Social Development):
Supplies data on:
Government sector’s workers and Private sector visas.
– General Organization of Social Insurance (GOSI):
Supplies data on:
a. contributors on the job who are subject to social insurance laws and regulations in the private
and government sector (outside the civil service);
b. workers who terminated their contribution to social insurance during the quarter.
– National Information Center (NIC):
Supplies data on:
a. job seekers in the public and private sectors from the data of (Jadara and Sa’ed) in the MHRSD, at (Taqat) portal of the HRDF;
b. government sector and individuals’ visas;
c. numbers of domestic workers.
Figures of workers in Labor Market statistics which were derived from administrative records DO NOT INCLUDE the following categories:
1-Workers in the military and security sectors
2- Workers who are not registered in the civil service and social insurance records, which include:
– Saudis working for their own businesses and are not subjected to the labor regulations, also, not registered in social insurance, such as those who work in delivery through electronic applications;
– Saudi employers who work in establishments and not registered in the social insurance;
– Non-Saudi staff working in foreign international, political or military missions.
3- Non-Saudi employees in the Kingdom for work contracts’ durations below three months.
The present data is taken from administrative records, and refers to the employed population registered in the civil service, GOSI and as domestic worker.
– The public (government) sector includes those subject to civil service regulations and government employees subject to insurance regulations (GOSI);
– The category of domestic workers in Arab states encompasses professions performed within the household, such as maids, cooks, waiters, valets, butlers, laundresses, gardeners, gatekeepers, stable-lads, chauffeurs, caretakers, governesses, babysitters, tutors, secretaries etc.
These professions are classified in the class 9700 of section T of the International Standard Industrial Classification of all Economic Activities (ISIC), Rev. 4.
See: Department of Economic and Social Affairs, Statistics Division. “International Standard Industrial Classification of All Economic Activities Revision 4, ” Statistical Papers, Series M No. 4/Rev.4, New York: United Nations, 2008, p. 269
https://unstats.un.org/unsd/publication/seriesm/seriesm_4rev4e.pdf.
Definitions and categories used by GAStat in Labour Markets Statistics (employment; unemployment; occupation and activity sectors, etc.) are based on international standards:
For LFS methodology and definitions, see:
https://www.stats.gov.sa/en/node/9787
https://database.stats.gov.sa/Methodologies/En_Documents/03_Labor%20Market%20Bulletin%20Methodology,%20Fourth%20Quarter%202020%20_%20General%20Authority%20for%20Statistics.pdf
2. Institution which provides data
General Authority for Statistics (GAStat)
3. Data availability
Since 2021, GAStat has been publishing separately the employment data taken from administrative records, and unemployment/inactivity data as well as general indicators, calculated from the results of the field interviews conducted by GAStat (Labour Force Survey).
The present time-series was taken from the Register-based Labour Market Statistics- Q4, 2023
(English and Arabic versions)
https://www.stats.gov.sa/sites/default/files/Register-based%20Labour%20Market%20Statistics-%20Q4%202023%20En.xlsx
https://www.stats.gov.sa/sites/default/files/Register-based%20Labour%20Market%20Statistics-%20Q4%202023Ar.xlsx
Quarterly Register-based Labour Market Statistics reports are accessible from:
https://www.stats.gov.sa/en/814
https://www.stats.gov.sa/ar/814
Date of access: 15 April 2024.
Keywords: Employment, Female Employment, Saudi Arabia, National & Foreign Labour, Domestic Workers
GLMM and GRC cannot guarantee that the link to access the source will not change; that the information will not be removed from the website it was obtained from; that no geo-blockages will be imposed; or that the information will not be available for any another reason.
|
|
Saudis
|
Non-Saudis
|
Total
|
|
Males
|
Females
|
Total
|
Males
|
Females
|
Total
|
Males
|
Females
|
Total
|
|
Riyadh
|
1,026,468
|
698,269
|
1,724,737
|
3,556,070
|
203,004
|
3,759,074
|
4,582,538
|
901,273
|
5,483,811
|
|
Makkah
|
385,188
|
298,109
|
683,297
|
1,392,500
|
63,272
|
1,455,772
|
1,777,688
|
361,381
|
2,139,069
|
|
Madinah
|
92,019
|
63,797
|
155,816
|
262,437
|
11,828
|
274,265
|
354,456
|
75,625
|
430,081
|
|
Qassim
|
72,213
|
54,370
|
126,583
|
322,902
|
11,135
|
334,037
|
395,115
|
65,505
|
460,620
|
|
Eastern Province
|
469,165
|
235,216
|
704,381
|
1,416,392
|
52,543
|
1,468,935
|
1,885,557
|
287,759
|
2,173,316
|
|
Asir
|
88,973
|
75,336
|
164,309
|
248,125
|
15,979
|
264,104
|
337,098
|
91,315
|
428,413
|
|
Tabuk
|
33,602
|
27,626
|
61,228
|
91,126
|
3,536
|
94,662
|
124,728
|
31,162
|
155,890
|
|
Hail
|
29,457
|
24,722
|
54,179
|
112,302
|
4,362
|
116,664
|
141,759
|
29,084
|
170,843
|
|
Northern Borders
|
16,232
|
11,596
|
27,828
|
40,266
|
2,207
|
42,473
|
56,498
|
13,803
|
70,301
|
|
Jazan
|
44,621
|
39,521
|
84,142
|
129,877
|
5,074
|
134,951
|
174,498
|
44,595
|
219,093
|
|
Najran
|
31,295
|
20,754
|
52,049
|
104,549
|
3,640
|
108,189
|
135,844
|
24,394
|
160,238
|
|
Al-Baha
|
18,274
|
15,178
|
33,452
|
34,309
|
1,352
|
35,661
|
52,583
|
16,530
|
69,113
|
|
Al-Jouf
|
24,665
|
17,586
|
42,251
|
54,934
|
2,003
|
56,937
|
79,599
|
19,589
|
99,188
|
|
Outside the country
|
365
|
78
|
443
|
5
|
0
|
5
|
370
|
78
|
448
|
|
Undefined
|
486
|
66
|
552
|
14
|
1
|
15
|
500
|
67
|
567
|
|
Total
|
2,333,023
|
1,582,224
|
3,915,247
|
7,765,808
|
379,936
|
8,145,744
|
10,098,831
|
1,962,160
|
12,060,991
|
|
Domestic workers
|
0
|
0
|
0
|
2,716,735
|
1,109,778
|
3,826,513
|
2,716,735
|
1,109,778
|
3,826,513
|
|
Total
|
2,333,023
|
1,582,224
|
3,915,247
|
10,482,543
|
1,489,714
|
11,972,257
|
12,815,566
|
3,071,938
|
15,887,504
|
Source: Register-Based Labour Market Statistics, General Authority for Statistics (GAStat)
1. Data collection methodology and definitions used
LFS were first conducted in 2001 and became bi-annual after 2006. Data were collected through nationally representative household sample surveys, which sampling was based on most recent censuses. Since 2016, Labour Force Surveys have been conducted and published on a quarterly basis, based on the following sources:
1. Household telephone surveys conducted by GAStat.
2. Employment data extracted from administrative records, introduced as a complement to the results of Labour Force Surveys in Labour Market Statistics’ publications, starting on Q1 2017.
Types of data available from GAStat’s labour statistics’ publications, by source:
1. Household Telephone Surveys:
Estimates of labor force, unemployed individuals, and indicators of labor force
2. Administrative records:
– Ministry of Human Resources and Social Development (MHRSD)
(formerly Ministry of Labour and Social Development):
Supplies data on:
Government sector’s workers and Private sector visas.
– General Organization of Social Insurance (GOSI):
Supplies data on:
a. contributors on the job who are subject to social insurance laws and regulations in the private
and government sector (outside the civil service);
b. workers who terminated their contribution to social insurance during the quarter.
– National Information Center (NIC):
Supplies data on:
a. job seekers in the public and private sectors from the data of (Jadara and Sa’ed) in the MHRSD, at (Taqat) portal of the HRDF;
b. government sector and individuals’ visas;
c. numbers of domestic workers.
Figures of workers in Labor Market statistics which were derived from administrative records DO NOT INCLUDE the following categories:
1-Workers in the military and security sectors
2- Workers who are not registered in the civil service and social insurance records, which include:
– Saudis working for their own businesses and are not subjected to the labor regulations, also, not registered in social insurance, such as those who work in delivery through electronic applications;
– Saudi employers who work in establishments and not registered in the social insurance;
– Non-Saudi staff working in foreign international, political or military missions.
3- Non-Saudi employees in the Kingdom for work contracts’ durations below three months.
The present data is taken from administrative records and refers to the employed population registered in the civil service, GOSI and as domestic worker.
– The public (government) sector includes those subject to civil service regulations and government employees subject to insurance regulations (GOSI);
– The category of domestic workers in Arab states encompasses professions performed within the household, such as maids, cooks, waiters, valets, butlers, laundresses, gardeners, gatekeepers, stable-lads, chauffeurs, caretakers, governesses, babysitters, tutors, secretaries etc.
These professions are classified in the class 9700 of section T of the International Standard Industrial Classification of all Economic Activities (ISIC), Rev. 4.
See: Department of Economic and Social Affairs, Statistics Division. “International Standard Industrial Classification of All Economic Activities Revision 4, ” Statistical Papers, Series M No. 4/Rev.4, New York: United Nations, 2008, p. 269
https://unstats.un.org/unsd/publication/seriesm/seriesm_4rev4e.pdf.
Definitions and categories used by GAStat in Labour Markets Statistics (employment; unemployment; occupation and activity sectors, etc.) are based on international standards:
For LFS methodology and definitions, see:
https://www.stats.gov.sa/en/node/9787
https://database.stats.gov.sa/Methodologies/En_Documents/03_Labor%20Market%20Bulletin%20Methodology,%20Fourth%20Quarter%202020%20_%20General%20Authority%20for%20Statistics.pdf
2. Institution which provides data
General Authority for Statistics (GAStat)
3. Data availability
Since 2021, GAStat has been publishing separately the employment data taken from administrative records, and unemployment/inactivity data as well as general indicators, calculated from the results of the field interviews conducted by GAStat (Labour Force Survey).
The present time-series was taken from the Register-based Labour Market Statistics- Q4, 2023
(English and Arabic versions)
https://www.stats.gov.sa/sites/default/files/Register-based%20Labour%20Market%20Statistics-%20Q4%202023%20En.xlsx
https://www.stats.gov.sa/sites/default/files/Register-based%20Labour%20Market%20Statistics-%20Q4%202023Ar.xlsx
Quarterly Register-based Labour Market Statistics reports are accessible from:
https://www.stats.gov.sa/en/814
https://www.stats.gov.sa/ar/814
Date of access: 15 April 2024.
Keywords: Employment, Female Employment, Saudi Arabia, National & Foreign Labour, Domestic Workers
GLMM and GRC cannot guarantee that the link to access the source will not change; that the information will not be removed from the website it was obtained from; that no geo-blockages will be imposed; or that the information will not be available for any another reason.
|
|
Public Sector*
|
Private Sector
|
Domestic sector
|
Other***
|
Total employed
|
|
|
Private business sector**
|
Agricultural sector
|
|
|
|
Saudis
|
non-Saudis
|
Total
|
Saudis
|
non-Saudis
|
Total
|
Saudis
|
non-Saudis
|
Total
|
Saudis
|
non-Saudis
|
Total
|
Saudis
|
non-Saudis
|
Total
|
Saudis
|
non-Saudis
|
Total
|
|
|
2016 Q2
|
69.0
|
3.4
|
31.5
|
30.7
|
74.4
|
55.7
|
0.0
|
0.0
|
0.0
|
0.0
|
21.7
|
12.4
|
0.3
|
0.6
|
0.4
|
N.A.
|
N.A.
|
N.A.
|
|
|
2016 Q3
|
69.6
|
2.7
|
29.8
|
30.1
|
83.9
|
62.1
|
0.0
|
0.0
|
0.0
|
0.0
|
13.1
|
7.8
|
0.3
|
0.3
|
0.3
|
N.A.
|
N.A.
|
N.A.
|
|
|
2016 Q4
|
68.8
|
3.2
|
29.6
|
30.7
|
78.7
|
59.4
|
0.0
|
0.0
|
0.0
|
0.0
|
17.6
|
10.5
|
0.5
|
0.5
|
0.4
|
N.A.
|
N.A.
|
N.A.
|
|
|
2017 Q1
|
69.7
|
3.9
|
29.8
|
29.9
|
79.0
|
59.7
|
0.0
|
0.0
|
0.0
|
0.0
|
16.8
|
10.2
|
0.4
|
0.3
|
0.4
|
3,038,945
|
10,850,192
|
13,889,137
|
|
|
2017 Q2
|
71.4
|
4.0
|
31.0
|
28.3
|
81.5
|
60.2
|
0.0
|
0.0
|
0.0
|
0.0
|
14.1
|
8.4
|
0.2
|
0.4
|
0.3
|
3,052,449
|
10,788,709
|
13,841,158
|
|
|
2017 Q3
|
70.7
|
2.6
|
29.7
|
28.9
|
80.5
|
60.0
|
0.0
|
0.0
|
0.0
|
0.0
|
16.5
|
9.9
|
0.3
|
0.4
|
0.4
|
3,063,744
|
10,694,320
|
13,758,064
|
|
|
2017 Q4
|
70.3
|
3.7
|
30.5
|
29.3
|
78.9
|
58.9
|
0.0
|
0.0
|
0.0
|
0.0
|
16.9
|
10.1
|
0.4
|
0.5
|
0.5
|
3,163,846
|
10,417,295
|
13,581,141
|
|
|
2018 Q1
|
69.3
|
3.4
|
29.9
|
30.4
|
78.8
|
59.3
|
0.0
|
0.0
|
0.0
|
0.0
|
17.4
|
10.4
|
0.3
|
0.4
|
0.4
|
3,150,409
|
10,183,104
|
13,333,513
|
|
|
2018 Q2
|
70.7
|
3.5
|
30.2
|
28.9
|
77.0
|
57.8
|
0.0
|
0.0
|
0.0
|
0.0
|
19.2
|
11.5
|
0.4
|
0.4
|
0.4
|
3,125,343
|
9,892,723
|
13,018,066
|
|
|
2018 Q3
|
N.A
|
N.A
|
N.A
|
N.A
|
N.A
|
N.A
|
N.A
|
N.A
|
N.A
|
N.A
|
N.A
|
N.A
|
N.A
|
N.A
|
N.A
|
3,109,987
|
9,578,055
|
12,688,042
|
|
|
2018 Q4
|
N.A
|
N.A
|
N.A
|
N.A
|
N.A
|
N.A
|
N.A
|
N.A
|
N.A
|
N.A
|
N.A
|
N.A
|
N.A
|
N.A
|
N.A
|
3,111,199
|
9,429,419
|
12,540,618
|
|
|
2019 Q1
|
65.5
|
3.7
|
28.4
|
34.0
|
76.7
|
59.7
|
0.0
|
0.0
|
0.0
|
0.0
|
19.0
|
11.4
|
0.4
|
0.6
|
0.6
|
3,112,029
|
9,653,212
|
12,765,241
|
|
|
2019 Q2
|
64.2
|
3.8
|
28.7
|
35.5
|
77.3
|
60.0
|
0.0
|
0.0
|
0.0
|
0.0
|
18.4
|
10.8
|
0.3
|
0.5
|
0.5
|
3,090,248
|
9,766,784
|
12,857,032
|
|
|
2019 Q3
|
62.1
|
2.9
|
27.5
|
37.6
|
78.3
|
61.4
|
0.0
|
0.0
|
0.0
|
0.0
|
18.5
|
10.8
|
0.3
|
0.4
|
0.3
|
3,100,812
|
9,827,096
|
12,927,908
|
|
|
2019 Q4
|
61.6
|
3.2
|
28.0
|
38.0
|
75.9
|
59.8
|
0.0
|
0.0
|
0.0
|
0.0
|
20.4
|
11.8
|
0.3
|
0.4
|
0.4
|
3,170,272
|
10,220,703
|
13,390,975
|
|
|
2020 Q1
|
60.0
|
2.9
|
27.3
|
39.7
|
76.8
|
61.0
|
0.0
|
0.0
|
0.0
|
0.0
|
19.9
|
11.4
|
0.3
|
0.3
|
0.3
|
3,203,423
|
10,432,189
|
13,635,612
|
|
|
2020 Q2
|
59.3
|
4.3
|
28.6
|
40.4
|
70.9
|
57.5
|
0.0
|
0.0
|
0.0
|
0.0
|
24.5
|
13.7
|
0.2
|
0.3
|
0.3
|
3,171,422
|
10,459,032
|
13,630,454
|
|
|
2020 Q3
|
59.1
|
4.8
|
28.9
|
40.7
|
70.7
|
57.4
|
0.0
|
0.0
|
0.0
|
0.0
|
24.2
|
13.5
|
0.2
|
0.3
|
0.2
|
3,253,276
|
10,201,862
|
13,455,138
|
|
|
2020 Q4
|
54.0
|
4.7
|
27.3
|
45.8
|
71.4
|
59.6
|
0.0
|
0.0
|
0.0
|
0.0
|
23.6
|
12.8
|
0.2
|
0.3
|
0.2
|
3,252,198
|
10,066,500
|
13,318,698
|
|
|
2021 Q1
|
53.8
|
4.1
|
26.2
|
44.0
|
58.9
|
52.3
|
1.7
|
2.6
|
2.2
|
0.0
|
33.9
|
18.9
|
0.5
|
0.5
|
0.5
|
3,306,598
|
10,177,215
|
13,483,813
|
|
|
2021 Q2
|
54.8
|
3.8
|
26.6
|
43.4
|
60.8
|
53.0
|
1.0
|
2.3
|
1.7
|
0.0
|
32.5
|
18.0
|
0.8
|
0.7
|
0.7
|
3,280,014
|
9,619,874
|
12,899,888
|
|
|
2021 Q3
|
53.3
|
5.7
|
27.1
|
44.1
|
59.0
|
52.3
|
1.7
|
2.3
|
2.0
|
0.0
|
32.4
|
17.8
|
0.8
|
0.6
|
0.7
|
3,342,838
|
9,362,807
|
12,705,645
|
|
|
2021 Q4
|
52.8
|
4.1
|
26.7
|
45.2
|
65.0
|
55.8
|
1.4
|
2.8
|
2.2
|
0.0
|
27.5
|
14.7
|
0.7
|
0.5
|
0.7
|
3,450,057
|
9,595,181
|
13,045,238
|
|
|
2022 Q1
|
53.9
|
4.0
|
27.1
|
44.6
|
64.5
|
55.3
|
1.2
|
2.5
|
1.9
|
0.0
|
28.5
|
15.3
|
0.4
|
0.5
|
0.3
|
3,571,876
|
10,158,773
|
13,730,649
|
|
|
2022 Q2
|
52.5
|
3.6
|
27.2
|
45.8
|
67.4
|
56.9
|
1.3
|
2.6
|
2.0
|
0.0
|
26.2
|
13.5
|
0.5
|
0.2
|
0.3
|
3,638,144
|
10,531,619
|
14,169,763
|
|
|
2022 Q3
|
51.7
|
3.9
|
27.0
|
46.7
|
66.3
|
56.8
|
1.3
|
2.9
|
2.1
|
0.0
|
26.5
|
13.7
|
0.3
|
0.4
|
0.3
|
3,692,486
|
10,898,457
|
14,590,943
|
|
|
2022 Q4
|
53.1
|
4.3
|
28.1
|
45.3
|
69.3
|
57.6
|
1.3
|
2.3
|
1.8
|
0.0
|
23.7
|
12.1
|
0.3
|
0.4
|
0.5
|
3,770,631
|
10,987,727
|
14,758,358
|
|
|
2023 Q1
|
52.6
|
3.7
|
27.4
|
45.5
|
65.8
|
55.9
|
1.5
|
2.3
|
1.9
|
0.0
|
27.7
|
14.2
|
0.4
|
0.6
|
0.4
|
3,870,481
|
11,492,891
|
15,363,372
|
|
|
2023 Q2
|
52.1
|
3.7
|
27.2
|
45.9
|
67.1
|
56.8
|
1.4
|
3.0
|
2.2
|
0.0
|
25.7
|
13.2
|
0.6
|
0.5
|
0.6
|
3,857,097
|
11,597,971
|
15,455,068
|
|
Source: Labour Market Statistics, Statistical Database, General Authority for Statistics (GAStat)
1. Data collection methodology and definitions used
* Public sector: government, institution or company wholly owned by the government
**Private business sector or an activity owned by the individual (non-agricultural)
***Other: Non-profit organizations (non-profit organizations, non-governmental organizations, mosques); international organisations, other and unspecified employment sector.
LFS were first conducted in 2001 and became bi-annual after 2006. Data were collected through nationally representative household sample surveys, which sampling was based on most recent censuses.
Since 2016, Labour Force Surveys have been conducted and published on a quarterly basis, based on the following sources:
1. Household telephone surveys conducted by GAStat.
2. Employment data extracted from administrative records, introduced as a complement to the results of Labour Force Surveys in Labour Market Statistics’ publications, starting on Q1 2017.
Types of data by source:
1. Household Telephone Surveys:
Estimates of labor force, unemployed individuals, and indicators of labor force.
2. Administrative records:
– Ministry of Human Resources and Social Development (MHRSD)
(formerly Ministry of Labour and Social Development):
Supplies data on:
Government sector’s workers and private sector visas.
– General Organization of Social Insurance (GOSI):
Supplies data on:
a. contributors on the job who are subject to social insurance laws and regulations in the private and government sectors;
b. workers who terminated their contribution to social insurance during the quarter.
– National Information Center (NIC):
Supplies data on:
a. job seekers in the public and private sectors from the data of (Jadara and Sa’ed) in the MHRSD, at (Taqat) portal of the HRDF;
b. government sector and individuals’ visas;
c. numbers of domestic workers.
Figures of workers in Labor Market statistics which were derived from administrative records do not include the following categories:
1-Workers in the military and security sectors;
2- Workers who are not registered in the civil service and social insurance records, which include:
– Saudis working for their own businesses and are not subjected to the labor regulations, also, not registered in social insurance, such as those who work in delivery through electronic apps;
– Saudi employers who work in establishments and not registered in the social insurance;
– Non-Saudi staff working in foreign international, political or military missions.
3- Non-Saudi employees who come to the Kingdom for work that normally takes less than three months to be completed.
Definitions and categories used by GAStat in Labour Markets Statistics (employment; unemployment; occupation and activity sectors, etc.) are based on international standards.
For LFS methodology and definitions, see:
https://www.stats.gov.sa/en/node/9787
https://database.stats.gov.sa/Methodologies/En_Documents/03_Labor%20Market%20Bulletin%20Methodology,%20Fourth%20Quarter%202020%20_%20General%20Authority%20for%20Statistics.pdf
2. Institution which provides data
General Authority for Statistics (GAStat)
3. Data availability
The percent time series were taken from GAStat’s statistical database:
Report Link:
https://database.stats.gov.sa/home/report/239
The numerical time-series (total employed) was taken from the Register-based Labour Market Statistics- Q4, 2022 (English and Arabic versions):
https://www.stats.gov.sa/sites/default/files/LMS_2022_Q4_EN_1.xlsx
https://www.stats.gov.sa/sites/default/files/LMS_2022_Q4_AR_1.xlsx
and from relevant quarterly Register-based Labour Market Statistics reports for 2023, accessible from:
https://www.stats.gov.sa/en/814
https://www.stats.gov.sa/ar/814
Date of access: 30 March 2024.
Keywords: Employment, Female Employment, Saudi Arabia, National & Foreign Labour; Domestic Workers
GLMM and GRC cannot guarantee that the link to access the source will not change; that the information will not be removed from the website it was obtained from; that no geo-blockages will be imposed; or that the information will not be available for any another reason.
|
|
Public Sector*
|
Private Sector
|
Domestic sector
|
Other***
|
Total employed
|
|
Private business sector**
|
Agricultural sector
|
|
Males
|
Females
|
Males
|
Females
|
Males
|
Females
|
Males
|
Females
|
Males
|
Females
|
Males
|
Females
|
|
2016 Q2
|
3.2
|
4.5
|
83.4
|
9.6
|
0.0
|
0.0
|
12.8
|
85.3
|
0.6
|
0.6
|
N.A
|
N.A
|
|
2016 Q3
|
2.3
|
6.5
|
90.5
|
14.7
|
0.0
|
0.0
|
6.9
|
78.2
|
0.3
|
0.5
|
N.A
|
N.A
|
|
2016 Q4
|
2.7
|
6.8
|
87.1
|
13.8
|
0.0
|
0.0
|
9.7
|
78.6
|
0.5
|
0.8
|
N.A
|
N.A
|
|
2017 Q1
|
3.4
|
7.6
|
86.7
|
16.0
|
0.0
|
0.0
|
9.6
|
76.3
|
0.3
|
0.2
|
9,859,039
|
991,153
|
|
2017 Q2
|
3.2
|
13.3
|
87.4
|
15.2
|
0.0
|
0.0
|
9.0
|
71.3
|
0.4
|
0.2
|
9,777,916
|
1,010,793
|
|
2017 Q3
|
2.2
|
7.2
|
87.5
|
13.7
|
0.0
|
0.0
|
10.0
|
78.8
|
0.4
|
0.3
|
9,674,729
|
1,019,591
|
|
2017 Q4
|
3.5
|
5.9
|
85.6
|
12.2
|
0.0
|
0.0
|
10.4
|
81.3
|
0.5
|
0.6
|
9,442,163
|
975,132
|
|
2018 Q1
|
2.9
|
8.6
|
85.5
|
13.0
|
0.0
|
0.0
|
11.2
|
78.0
|
0.4
|
0.5
|
9,231,869
|
951,235
|
|
2018 Q2
|
2.9
|
8.5
|
84.7
|
12.0
|
0.0
|
0.0
|
11.9
|
79.3
|
0.4
|
0.1
|
8,927,862
|
964,861
|
|
2018 Q3
|
N.A
|
N.A
|
N.A
|
N.A
|
N.A
|
N.A
|
N.A
|
N.A
|
N.A
|
N.A
|
8,622,890
|
955,165
|
|
2018 Q4
|
N.A
|
N.A
|
N.A
|
N.A
|
N.A
|
N.A
|
N.A
|
N.A
|
N.A
|
N.A
|
8,356,943
|
1,072,476
|
|
2019 Q1
|
3.1
|
9.2
|
83.2
|
17.9
|
0.0
|
0.0
|
13.0
|
72.4
|
0.6
|
0.4
|
8,458,199
|
1,195,013
|
|
2019 Q2
|
2.9
|
11.7
|
84.2
|
14.4
|
0.0
|
0.0
|
12.3
|
73.1
|
0.5
|
0.8
|
8,529,419
|
1,237,365
|
|
2019 Q3
|
2.5
|
6.7
|
85.2
|
17.6
|
0.0
|
0.0
|
11.9
|
75.5
|
0.4
|
0.2
|
8,572,339
|
1,254,757
|
|
2019 Q4
|
2.4
|
9.4
|
83.4
|
13.9
|
0.0
|
0.0
|
13.7
|
76.4
|
0.4
|
0.3
|
8,792,516
|
1,428,187
|
|
2020 Q1
|
2.3
|
9.3
|
82.5
|
20.4
|
0.0
|
0.0
|
14.9
|
69.8
|
0.3
|
0.5
|
9,092,998
|
1,339,191
|
|
2020 Q2
|
3.8
|
8.4
|
77.0
|
17.6
|
0.0
|
0.0
|
18.8
|
73.7
|
0.3
|
0.3
|
9,101,286
|
1,357,746
|
|
2020 Q3
|
4.3
|
9.3
|
76.7
|
14.3
|
0.0
|
0.0
|
18.7
|
76.3
|
0.3
|
0.2
|
8,866,940
|
1,334,922
|
|
2020 Q4
|
4.2
|
9.1
|
77.6
|
17.6
|
0.0
|
0.0
|
17.9
|
73.2
|
0.3
|
0.1
|
8,753,985
|
1,312,515
|
|
2021 Q1
|
4.0
|
4.7
|
66.1
|
11.2
|
3.0
|
0.0
|
26.4
|
83.7
|
0.5
|
0.4
|
8,773,896
|
1,403,319
|
|
2021 Q2
|
3.8
|
4.1
|
68.0
|
13.3
|
2.6
|
0.0
|
25.1
|
81.5
|
0.6
|
1.0
|
8,449,536
|
1,170,338
|
|
2021 Q3
|
5.6
|
6.4
|
66.6
|
12.9
|
2.6
|
0.1
|
24.7
|
79.7
|
0.6
|
0.8
|
8,244,566
|
1,118,241
|
|
2021 Q4
|
3.8
|
6.3
|
71.4
|
16.3
|
3.2
|
0.0
|
20.9
|
76.5
|
0.6
|
0.9
|
8,481,117
|
1,114,064
|
|
2022 Q1
|
3.7
|
6.4
|
70.8
|
18.0
|
2.8
|
0.1
|
22.2
|
75.1
|
0.5
|
0.4
|
8,971,450
|
1,187,323
|
|
2022 Q2
|
3.1
|
7.1
|
74.0
|
19.9
|
3.0
|
0.1
|
19.6
|
72.6
|
0.3
|
0.3
|
9,320,979
|
1,210,640
|
|
2022 Q3
|
3.4
|
7.7
|
72.6
|
21.5
|
3.3
|
0.1
|
20.3
|
70.4
|
0.4
|
0.3
|
9,593,551
|
1,304,906
|
|
2022 Q4
|
3.6
|
9.2
|
75.6
|
23.5
|
2.6
|
0.1
|
17.8
|
66.5
|
0.4
|
0.8
|
9,672,933
|
1,314,794
|
|
2023 Q1
|
3.1
|
7.2
|
72.5
|
20.6
|
2.7
|
0.1
|
21.1
|
71.5
|
0.6
|
0.7
|
10,137,453
|
1,355,438
|
|
2023 Q2
|
3.1
|
7.6
|
73.2
|
22.7
|
3.4
|
0.0
|
19.8
|
69.0
|
0.5
|
0.6
|
10,202,131
|
1,395,840
|
Source: Labour Market Statistics, Statistical Database, General Authority for Statistics (GAStat)
1. Data collection methodology and definitions used
* Public sector: government, institution or company wholly owned by the government
**Private business sector or an activity owned by the individual (non-agricultural)
***Other: Non-profit organizations (non-profit organizations, non-governmental organizations, mosques); international organisations, other and unspecified employment sector.
LFS were first conducted in 2001 and became bi-annual after 2006. Data were collected through nationally representative household sample surveys, which sampling was based on most recent censuses.
Since 2016, Labour Force Surveys have been conducted and published on a quarterly basis, based on the following sources:
1. Household telephone surveys conducted by GAStat.
2. Employment data extracted from administrative records, introduced as a complement to the results of Labour Force Surveys in Labour Market Statistics’ publications, starting on Q1 2017.
Types of data by source:
1. Household Telephone Surveys:
Estimates of labor force, unemployed individuals, and indicators of labor force.
2. Administrative records:
– Ministry of Human Resources and Social Development (MHRSD)
(formerly Ministry of Labour and Social Development):
Supplies data on:
Government sector’s workers and private sector visas.
– General Organization of Social Insurance (GOSI):
Supplies data on:
a. contributors on the job who are subject to social insurance laws and regulations in the private and government sectors;
b. workers who terminated their contribution to social insurance during the quarter.
– National Information Center (NIC):
Supplies data on:
a. job seekers in the public and private sectors from the data of (Jadara and Sa’ed) in the MHRSD, at (Taqat) portal of the HRDF;
b. government sector and individuals’ visas;
c. numbers of domestic workers.
Figures of workers in Labor Market statistics which were derived from administrative records do not include the following categories:
1-Workers in the military and security sectors;
2- Workers who are not registered in the civil service and social insurance records, which include:
– Saudis working for their own businesses and are not subjected to the labor regulations, also, not registered in social insurance, such as those who work in delivery through electronic apps;
– Saudi employers who work in establishments and not registered in the social insurance;
– Non-Saudi staff working in foreign international, political or military missions.
3- Non-Saudi employees who come to the Kingdom for work that normally takes less than three months to be completed.
Definitions and categories used by GAStat in Labour Markets Statistics (employment; unemployment; occupation and activity sectors, etc.) are based on international standards.
For LFS methodology and definitions, see:
https://www.stats.gov.sa/en/node/9787
https://database.stats.gov.sa/Methodologies/En_Documents/03_Labor%20Market%20Bulletin%20Methodology,%20Fourth%20Quarter%202020%20_%20General%20Authority%20for%20Statistics.pdf
2. Institution which provides data
General Authority for Statistics (GAStat)
3. Data availability
The percent time series were taken from GAStat’s statistical database:
Report Link:
https://database.stats.gov.sa/home/report/239
The numerical time-series (total employed) was taken from the Register-based Labour Market Statistics- Q4, 2022 (English and Arabic versions):
https://www.stats.gov.sa/sites/default/files/LMS_2022_Q4_EN_1.xlsx
https://www.stats.gov.sa/sites/default/files/LMS_2022_Q4_AR_1.xlsx
and from relevant quarterly Register-based Labour Market Statistics reports for 2023, accessible from:
https://www.stats.gov.sa/en/814
https://www.stats.gov.sa/ar/814
Date of access: 30 March 2024.
Keywords: Employment, Female Employment, Saudi Arabia, National & Foreign Labour, Domestic Workers
GLMM and GRC cannot guarantee that the link to access the source will not change; that the information will not be removed from the website it was obtained from; that no geo-blockages will be imposed; or that the information will not be available for any another reason.
|
|
Males
|
Females
|
Total
|
|
Housekeepers
|
1,298
|
1,142
|
2,440
|
|
Drivers
|
1,791,238
|
120
|
1,791,358
|
|
Servants and house cleaners
|
787,884
|
1,015,884
|
1,803,768
|
|
Cooks and food provider
|
58,152
|
3,200
|
61,352
|
|
House guards
|
22,494
|
12
|
22,506
|
|
Farmers and gardeners
|
2,095
|
0
|
2,095
|
|
Home tailors
|
501
|
661
|
1,162
|
|
Nurses and health professionals in homes
|
525
|
1,112
|
1,637
|
|
Private teachers and nannies in homes
|
25
|
4,586
|
4,611
|
|
Total
|
2,664,212
|
1,026,717
|
3,690,929
|
Source: Register-based Labour Market Statistics, General Authority for Statistics (GAStat)
1. Data collection methodology
LFS were first conducted in 2001 and became bi-annual after 2006. Data were collected through nationally representative household sample surveys, which sampling was based on most recent censuses.
Since 2016, Labour Force Surveys have been conducted and published on a quarterly basis, based on a household telephone survey conducted by GAStat. Employment data extracted from administrative records were also introduced as a complement to the results of Labour Force Surveys in Labour Market Statistics’ publications, starting on Q1 2017.
The present data is taken from administrative records.
GAStat Labour Market Statistics:
Estimates of figures and characteristics of employment in Saudi Arabia are taken from administrative records from the following institutions:
– Ministry of Human Resources and Social Development (MHRSD) (formerly Ministry of Labour and Social Development):
Supplies data on Government sector’s workers.
– General Organization of Social Insurance (GOSI):
Supplies data on:
a. contributors on the job who are subject to social insurance laws and regulations in the private and government sectors;
b. workers who terminated their contribution to social insurance during the quarter.
– National Information Center (NIC):
Supplies data on domestic workers (data owner: MHRSD).
The category of domestic workers in Arab states encompasses professions performed within the household, such as maids, cooks, waiters, valets, butlers, laundresses, gardeners, gatekeepers, stable-lads, chauffeurs, caretakers, governesses, babysitters, tutors, secretaries etc.
These professions are classified in the class 9700 of section T of the International Standard Industrial Classification of all Economic Activities (ISIC), Rev. 4.
See: Department of Economic and Social Affairs, Statistics Division. “International Standard Industrial Classification of All Economic Activities Revision 4,” Statistical Papers, Series M No. 4/Rev.4, New York: United Nations, 2008, p. 269
https://unstats.un.org/unsd/publication/seriesm/seriesm_4rev4e.pdf.
Definitions and categories used by GAStat in Labour Markets Statistics (employment; unemployment; occupation and activity sectors, etc.) are based on international standards.
For LFS methodology and definitions, see: https://www.stats.gov.sa/en/node/9787.
2. Institution which provides data
General Authority for Statistics (GAStat)
3. Data availability
Since 2021, GAStat has been publishing separately the employment data taken from administrative records, and unemployment/inactivity data as well as general indicators, calculated from the results of the field interviews conducted by GAStat (Labour Force Survey).
The present time-series was taken from the Register-based Labour Market Statistics- Q2, 2023
(English and Arabic versions):
https://www.stats.gov.sa/sites/default/files/Register-based%20Labour%20Market%20Statistics-%20Q2%2C%202023En.xlsx
https://www.stats.gov.sa/sites/default/files/Register-based%20Labour%20Market%20Statistics-%20Q2%202023Ar.xlsx
Quarterly Register-based Labour Market Statistics reports are accessible from: https://www.stats.gov.sa/en/814
https://www.stats.gov.sa/ar/814
Date of access: 02 March 2024.
GLMM and GRC cannot guarantee that the link to access the source will not change; that the information will not be removed from the website it was obtained from; that no geo-blockages will be imposed; or that the information will not be available for any another reason.
Keywords: Saudi Arabia, Foreign Labour, Domestic Workers
|
|
Saudis
|
Non-Saudis
|
Total
|
|
|
Males
|
Females
|
Total
|
Males
|
Females
|
Total
|
Males
|
Females
|
Total
|
|
Agriculture, forestry and fishing
|
15,762
|
9,766
|
25,528
|
327,413
|
1,854
|
329,267
|
343,175
|
11,620
|
354,795
|
|
Mining and quarrying
|
97,846
|
7,371
|
105,217
|
35,921
|
678
|
36,599
|
133,767
|
8,049
|
141,816
|
|
Manufacturing
|
172,343
|
83,201
|
255,544
|
771,419
|
6,970
|
778,389
|
943,762
|
90,171
|
1,033,933
|
|
Electricity, gas, steam and air conditioning supply
|
32,268
|
902
|
33,170
|
6,208
|
12
|
6,220
|
38,476
|
914
|
39,390
|
|
Water supply; sewerage, waste management and remediation activities
|
13,746
|
6,653
|
20,399
|
82,706
|
3,451
|
86,157
|
96,452
|
10,104
|
106,556
|
|
Construction
|
229,878
|
139,654
|
369,532
|
2,077,846
|
12,852
|
2,090,698
|
2,307,724
|
152,506
|
2,460,230
|
|
Wholesale and retail trade; repair of motor vehicles and motorcycles
|
227,331
|
192,952
|
420,283
|
1,193,269
|
12,498
|
1,205,767
|
1,420,600
|
205,450
|
1,626,050
|
|
Transportation and storage
|
86,413
|
33,159
|
119,572
|
317,976
|
2,017
|
319,993
|
404,389
|
35,176
|
439,565
|
|
Accommodation and food service activities
|
80,196
|
69,914
|
150,110
|
519,847
|
5,197
|
525,044
|
600,043
|
75,111
|
675,154
|
|
Information and communication
|
48,964
|
27,750
|
76,714
|
44,850
|
1,767
|
46,617
|
93,814
|
29,517
|
123,331
|
|
Financial and insurance activities
|
56,018
|
18,983
|
75,001
|
15,630
|
660
|
16,290
|
71,648
|
19,643
|
91,291
|
|
Real estate activities
|
14,549
|
8,376
|
22,925
|
31,110
|
592
|
31,702
|
45,659
|
8,968
|
54,627
|
|
Professional, scientific and technical activities
|
68,213
|
37,570
|
105,783
|
104,101
|
3,803
|
107,904
|
172,314
|
41,373
|
213,687
|
|
Administrative and support service activities
|
132,909
|
77,441
|
210,350
|
843,526
|
121,402
|
964,928
|
976,435
|
198,843
|
1,175,278
|
|
Public administration and defence; compulsory social security
|
157,934
|
48,062
|
205,996
|
50,104
|
10,367
|
60,471
|
208,038
|
58,429
|
266,467
|
|
Education
|
40,187
|
64,758
|
104,945
|
62,545
|
13,204
|
75,749
|
102,732
|
77,962
|
180,694
|
|
Human health and social work activities
|
102,891
|
111,052
|
213,943
|
126,569
|
99,884
|
226,453
|
229,460
|
210,936
|
440,396
|
|
Arts, entertainment and recreation
|
6,218
|
6,680
|
12,898
|
17,385
|
2,055
|
19,440
|
23,603
|
8,735
|
32,338
|
|
Other service activities
|
21,054
|
20,799
|
41,853
|
175,871
|
20,238
|
196,109
|
196,925
|
41,037
|
237,962
|
|
Activities of households as employer Activities of extraterritorial organizations and bodiess; undifferentiated goods- and services-producing activities of households for own use
|
3
|
3
|
6
|
83
|
5
|
88
|
86
|
8
|
94
|
|
Activities of extraterritorial organizations and bodies
|
484
|
132
|
616
|
243
|
0
|
243
|
727
|
132
|
859
|
|
Other activities
|
5,878
|
5,152
|
11,030
|
215,137
|
2,358
|
217,495
|
221,015
|
7,510
|
228,525
|
|
Total
|
1,611,085
|
970,330
|
2,581,415
|
7,019,759
|
321,864
|
7,341,623
|
8,630,844
|
1,292,194
|
9,923,038
|
Source: Register-based Labour Market Statistics, General Authority for Statistics (GAStat)
1. Data collection methodology
LFS were first conducted in 2001 and became bi-annual after 2006. Data were collected through nationally representative household sample surveys, which sampling was based on most recent censuses.
Since 2016, Labour Force Surveys have been conducted and published on a quarterly basis, based on a
household telephone survey conducted by GAStat. Employment data extracted from administrative records were also introduced as a complement to the results of Labour Force Surveys in Labour Market Statistics’ publications, starting on Q1 2017.
Population of reference: workers subject to the rules and regulations of the General Organization of Social Insurance (GOSI):
a. contributors on the job who are subject to social insurance laws and regulations in the private
and government sector (outside the Civil service);
b. workers who terminated their contribution to social insurance during the quarter.
The present data is taken from administrative records.
GAStat Labour Market Statistics
Estimates of figures and characteristics of employment in Saudi Arabia are taken from administrative records from the following institutions:
– Ministry of Human Resources and Social Development (MHRSD)
(formerly Ministry of Labour and Social Development):
Supplies data on Government sector’s workers.
– General Organization of Social Insurance (GOSI):
Supplies data on:
a. contributors on the job who are subject to social insurance laws and regulations in the private
and government sector;
b. workers who terminated their contribution to social insurance during the quarter.
– National Information Center (NIC):
Supplies data on domestic workers (data owner: MHRSD).
Figures of workers in Labor Market statistics which were derived from administrative records do not include the following category:
1-Workers in the military and security sectors
2- Workers who are not registered in the civil service and social insurance records, which include:
– Saudis working for their own businesses and are not subjected to the labor regulations, also, not registered in social insurance, such as those who work in delivery through electronic apps
– Saudi employers who work in establishments and not registered in the social insurance
– Non-Saudi staff working in foreign international, political or military missions
3- Non-Saudi employees who come to the Kingdom for work that normally takes less than three months to be completed.
Saudi classification of activities: based on ISIC Rev. 4.
Definitions and categories used by GAStat in Labour Markets Statistics (employment; unemployment;
occupation and activity sectors, etc.) are based on international standards:
For LFS methodology and definitions, see: https://www.stats.gov.sa/en/node/9787.
2. Institution which provides data
General Authority for Statistics (GAStat)
3. Data availability
Since 2021, GAStat has been publishing separately the employment data taken from administrative records, and unemployment/inactivity data as well as general indicators, calculated from the results of the field interviews conducted by GAStat (Labour Force Survey).
The present time-series was taken from the Register-based Labour Market Statistics- Q4, 2022 (English and Arabic versions)
https://www.stats.gov.sa/sites/default/files/LMS_2022_Q4_EN_1.xlsx
https://www.stats.gov.sa/sites/default/files/LMS_2022_Q4_AR_1.xlsx
and from relevant quarterly Register-based Labour Market Statistics reports for 2023, accessible from:
https://www.stats.gov.sa/en/814
https://www.stats.gov.sa/ar/814
Date of access: 20 March 2024.
Keywords: Employment, Female Employment, Saudi Arabia, National & Foreign Labour
GLMM and GRC cannot guarantee that the link to access the source will not change; that the information will not be removed from the website it was obtained from; that no geo-blockages will be imposed; or that the information will not be available for any another reason.
|
|
Saudis
|
Non-Saudis
|
Total
|
|
|
Males
|
Females
|
Total
|
Males
|
Females
|
Total
|
Males
|
Females
|
Total
|
|
Managers
|
154,360
|
70,265
|
224,625
|
69,627
|
2,763
|
72,390
|
223,987
|
73,028
|
297,015
|
|
Professionals
|
369,906
|
329,562
|
699,468
|
371,757
|
104,915
|
476,672
|
741,663
|
434,477
|
1,176,140
|
|
Technicians and associate professionals
|
278,324
|
141,622
|
419,946
|
445,045
|
21,231
|
466,276
|
723,369
|
162,853
|
886,222
|
|
Clerical support workers
|
270,798
|
261,296
|
532,094
|
35,967
|
5,117
|
41,084
|
306,765
|
266,413
|
573,178
|
|
Service and sales workers
|
230,306
|
108,721
|
339,027
|
363,920
|
13,303
|
377,223
|
594,226
|
122,024
|
716,250
|
|
Skilled agricultural, forestry and fishery workers
|
1,461
|
189
|
1,650
|
24,641
|
14
|
24,655
|
26,102
|
203
|
26,305
|
|
Craft and related trades workers
|
42,654
|
5,299
|
47,953
|
921,889
|
3,745
|
925,634
|
964,543
|
9,044
|
973,587
|
|
Plant and machine operators, and assemblers
|
74,226
|
3,953
|
78,179
|
735,476
|
743
|
736,219
|
809,702
|
4,696
|
814,398
|
|
Elementary occupations
|
102,238
|
34,081
|
136,319
|
4,005,827
|
169,615
|
4,175,442
|
4,108,065
|
203,696
|
4,311,761
|
|
Other Occuption
|
86,812
|
15,342
|
102,154
|
45,610
|
418
|
46,028
|
132,422
|
15,760
|
148,182
|
|
Total
|
1,611,085
|
970,330
|
2,581,415
|
7,019,759
|
321,864
|
7,341,623
|
8,630,844
|
1,292,194
|
9,923,038
|
Source: Register-based Labour Market Statistics, General Authority for Statistics (GAStat)
1. Data collection methodology
LFS were first conducted in 2001 and became bi-annual after 2006. Data were collected through nationally representative household sample surveys, which sampling was based on most recent censuses.
Since 2016, Labour Force Surveys have been conducted and published on a quarterly basis, based on a
household telephone survey conducted by GAStat. Employment data extracted from administrative records were also introduced as a complement to the results of Labour Force Surveys in Labour Market Statistics’ publications, starting on Q1 2017.
Population of reference: workers subject to the rules and regulations of the General Organization of Social Insurance (GOSI):
a. contributors on the job who are subject to social insurance laws and regulations in the private
and government sector (outside the Civil service);
b. workers who terminated their contribution to social insurance during the quarter.
The present data is taken from administrative records.
GAStat Labour Market Statistics
Estimates of figures and characteristics of employment in Saudi Arabia are taken from administrative records from the following institutions:
– Ministry of Human Resources and Social Development (MHRSD)
(formerly Ministry of Labour and Social Development):
Supplies data on Government sector’s workers.
– General Organization of Social Insurance (GOSI):
Supplies data on:
a. contributors on the job who are subject to social insurance laws and regulations in the private
and government sector;
b. workers who terminated their contribution to social insurance during the quarter.
– National Information Center (NIC):
Supplies data on domestic workers (data owner: MHRSD).
Figures of workers in Labor Market statistics which were derived from administrative records do not include the following category:
1-Workers in the military and security sectors
2- Workers who are not registered in the civil service and social insurance records, which include:
– Saudis working for their own businesses and are not subjected to the labor regulations, also, not registered in social insurance, such as those who work in delivery through electronic apps
– Saudi employers who work in establishments and not registered in the social insurance
– Non-Saudi staff working in foreign international, political or military missions
3- Non-Saudi employees who come to the Kingdom for work that normally takes less than three months to be completed.
Saudi classification of occupations: based on ISCO-08.
Definitions and categories used by GAStat in Labour Markets Statistics (employment; unemployment;
occupation and activity sectors, etc.) are based on international standards:
For LFS methodology and definitions, see: https://www.stats.gov.sa/en/node/9787.
2. Institution which provides data
General Authority for Statistics (GAStat)
3. Data availability
Since 2021, GAStat has been publishing separately the employment data taken from administrative records, and unemployment/inactivity data as well as general indicators, calculated from the results of the field interviews conducted by GAStat (Labour Force Survey).
The present time-series was taken from the Register-based Labour Market Statistics- Q4, 2022 (English and Arabic versions)
https://www.stats.gov.sa/sites/default/files/LMS_2022_Q4_EN_1.xlsx
https://www.stats.gov.sa/sites/default/files/LMS_2022_Q4_AR_1.xlsx
and from relevant quarterly Register-based Labour Market Statistics reports for 2023, accessible from:
https://www.stats.gov.sa/en/814
https://www.stats.gov.sa/ar/814
Date of access: 20 March 2024.
Keywords: Employment, Female Employment, Saudi Arabia, National & Foreign Labour, Highly-Skilled Labour, Low-Skilled Labour
GLMM and GRC cannot guarantee that the link to access the source will not change; that the information will not be removed from the website it was obtained from; that no geo-blockages will be imposed; or that the information will not be available for any another reason.
| |
Saudis |
Non-Saudis |
Total |
| |
Males |
Females |
Total |
Males |
Females |
Total |
Males |
Females |
Total |
| 2017 Q1 |
2,021,865 |
1,017,080 |
3,038,945 |
9,859,039 |
991,153 |
10,850,192 |
11,880,904 |
2,008,233 |
13,889,137 |
| 2017 Q2 |
2,029,786 |
1,022,663 |
3,052,449 |
9,777,916 |
1,010,793 |
10,788,709 |
11,807,702 |
2,033,456 |
13,841,158 |
| 2017 Q3 |
2,035,745 |
1,027,999 |
3,063,744 |
9,674,729 |
1,019,591 |
10,694,320 |
11,710,474 |
2,047,590 |
13,758,064 |
| 2017 Q4 |
2,080,601 |
1,083,245 |
3,163,846 |
9,442,163 |
975,132 |
10,417,295 |
11,522,764 |
2,058,377 |
13,581,141 |
| 2018 Q1 |
2,067,976 |
1,082,433 |
3,150,409 |
9,231,869 |
951,235 |
10,183,104 |
11,299,845 |
2,033,668 |
13,333,513 |
| 2018 Q2 |
2,053,189 |
1,072,154 |
3,125,343 |
8,927,862 |
964,861 |
9,892,723 |
10,981,051 |
2,037,015 |
13,018,066 |
| 2018 Q3 |
2,043,585 |
1,066,402 |
3,109,987 |
8,622,890 |
955,165 |
9,578,055 |
10,666,475 |
2,021,567 |
12,688,042 |
| 2018 Q4 |
2,040,742 |
1,070,457 |
3,111,199 |
8,356,943 |
1,072,476 |
9,429,419 |
10,397,685 |
2,142,933 |
12,540,618 |
| 2019 Q1 |
2,036,142 |
1,075,887 |
3,112,029 |
8,458,199 |
1,195,013 |
9,653,212 |
10,494,341 |
2,270,900 |
12,765,241 |
| 2019 Q2 |
2,027,964 |
1,062,284 |
3,090,248 |
8,529,419 |
1,237,365 |
9,766,784 |
10,557,383 |
2,299,649 |
12,857,032 |
| 2019 Q3 |
2,023,910 |
1,076,902 |
3,100,812 |
8,572,339 |
1,254,757 |
9,827,096 |
10,596,249 |
2,331,659 |
12,927,908 |
| 2019 Q4 |
2,054,858 |
1,115,414 |
3,170,272 |
8,792,516 |
1,428,187 |
10,220,703 |
10,847,374 |
2,543,601 |
13,390,975 |
| 2020 Q1 |
2,066,553 |
1,136,870 |
3,203,423 |
9,092,998 |
1,339,191 |
10,432,189 |
11,159,551 |
2,476,061 |
13,635,612 |
| 2020 Q2 |
2,055,767 |
1,115,655 |
3,171,422 |
9,101,286 |
1,357,746 |
10,459,032 |
11,157,053 |
2,473,401 |
13,630,454 |
| 2020 Q3 |
2,100,702 |
1,152,574 |
3,253,276 |
8,866,940 |
1,334,922 |
10,201,862 |
10,967,642 |
2,487,496 |
13,455,138 |
| 2020 Q4 |
2,079,331 |
1,172,867 |
3,252,198 |
8,753,985 |
1,312,515 |
10,066,500 |
10,833,316 |
2,485,382 |
13,318,698 |
| 2021 Q1 |
2,081,446 |
1,225,152 |
3,306,598 |
8,773,896 |
1,403,319 |
10,177,215 |
10,855,342 |
2,628,471 |
13,483,813 |
| 2021 Q2 |
2,098,831 |
1,181,183 |
3,280,014 |
8,449,536 |
1,170,338 |
9,619,874 |
10,548,367 |
2,351,521 |
12,899,888 |
| 2021 Q3 |
2,127,551 |
1,215,287 |
3,342,838 |
8,244,566 |
1,118,241 |
9,362,807 |
10,372,117 |
2,333,528 |
12,705,645 |
| 2021 Q4 |
2,180,320 |
1,269,737 |
3,450,057 |
8,481,117 |
1,114,064 |
9,595,181 |
10,661,437 |
2,383,801 |
13,045,238 |
| 2022 Q1 |
2,233,351 |
1,338,525 |
3,571,876 |
8,971,450 |
1,187,323 |
10,158,773 |
11,204,801 |
2,525,848 |
13,730,649 |
| 2022 Q2 |
2,262,535 |
1,375,609 |
3,638,144 |
9,320,979 |
1,210,640 |
10,531,619 |
11,583,514 |
2,586,249 |
14,169,763 |
| 2022 Q3 |
2,274,628 |
1,417,858 |
3,692,486 |
9,593,551 |
1,304,906 |
10,898,457 |
11,868,179 |
2,722,764 |
14,590,943 |
| 2022 Q4 |
2,300,070 |
1,470,561 |
3,770,631 |
9,672,933 |
1,314,794 |
10,987,727 |
11,973,003 |
2,785,355 |
14,758,358 |
| 2023 Q1 |
2,354,750 |
1,515,731 |
3,870,481 |
10,137,453 |
1,355,438 |
11,492,891 |
12,492,203 |
2,871,169 |
15,363,372 |
| 2023 Q2 |
2,338,735 |
1,518,362 |
3,857,097 |
10,202,131 |
1,395,840 |
11,597,971 |
12,540,866 |
2,914,202 |
15,455,068 |
| 2023 Q3 |
2,357,785 |
1,563,536 |
3,921,321 |
10,461,593 |
1,435,240 |
11,896,833 |
12,819,378 |
2,998,776 |
15,818,154 |
Source: Register-based Labour Market Statistics, General Authority for Statistics (GAStat)
- Data collection methodology
LFS were first conducted in 2001 and became bi-annual after 2006. Data were collected through nationally representative household sample surveys, which sampling was based on most recent censuses.
Since 2016, Labour Force Surveys have been conducted and published on a quarterly basis, based on a household telephone survey conducted by GAStat. Employment data extracted from administrative records were also introduced as a complement to the results of Labour Force Surveys in Labour Market Statistics’ publications, starting on Q1 2017.
The present data is taken from administrative records.
GAStat Labour Market Statistics:
Estimates of figures and characteristics of employment in Saudi Arabia are taken from administrative records from the following institutions:
– Ministry of Human Resources and Social Development (MHRSD) (formerly Ministry of Labour and Social Development):
Supplies data on Government sector’s workers.
– General Organization of Social Insurance (GOSI):
Supplies data on:
- contributors on the job who are subject to social insurance laws and regulations in the private and government sectors;
- workers who terminated their contribution to social insurance during the quarter.
– National Information Center (NIC):
Supplies data on domestic workers (data owner: MHRSD).
Figures of workers in Labor Market statistics which were derived from administrative records do not include the following categories:
1-Workers in the military and security sectors
2- Workers who are not registered in the civil service and social insurance records, which include:
– Saudis working for their own businesses and are not subjected to the labor regulations, also, not registered in social insurance, such as those who work in delivery through electronic apps;
– Saudi employers who work in establishments and not registered in the social insurance
– Non-Saudi staff working in foreign international, political or military missions
3- Non-Saudi employees who come to the Kingdom for work that normally takes less than three months to be completed.
Definitions and categories used by GAStat in Labour Markets Statistics (employment; unemployment; occupation and activity sectors, etc.) are based on international standards.
For LFS methodology and definitions, see: https://www.stats.gov.sa/en/node/9787.
- Institution which provides data
General Authority for Statistics (GAStat)
- Data availability
Since 2021, GAStat has been publishing separately the employment data taken from administrative records, and unemployment/inactivity data as well as general indicators, calculated from the results of the field interviews conducted by GAStat (Labour Force Survey).
The present time-series was taken from the Register-based Labour Market Statistics- Q4, 2022
(English and Arabic versions):
https://www.stats.gov.sa/sites/default/files/LMS_2022_Q4_EN_1.xlsx
https://www.stats.gov.sa/sites/default/files/LMS_2022_Q4_AR_1.xlsx
and from relevant quarterly Register-based Labour Market Statistics reports for 2023, accessible from: https://www.stats.gov.sa/en/814
https://www.stats.gov.sa/ar/814
Date of access: 02 March 2024.
GLMM and GRC cannot guarantee that the link to access the source will not change; that the information will not be removed from the website it was obtained from; that no geo-blockages will be imposed; or that the information will not be available for any another reason.
Keywords: Employment, Female Employment, Saudi Arabia, National & Foreign Labour
| |
Saudis |
Non-Saudis |
Total |
| |
Males |
Females |
Total |
Males |
Females |
Total |
Males |
Females |
Total |
| Governmental |
966,722 |
609,364 |
1,576,086 |
96,975 |
61,025 |
158,000 |
1,063,697 |
670,389 |
1,734,086 |
| Private |
1,333,348 |
861,197 |
2,194,545 |
6,945,931 |
281,757 |
7,227,688 |
8,279,279 |
1,142,954 |
9,422,233 |
| Domestic |
0 |
0 |
0 |
2,630,027 |
972,012 |
3,602,039 |
2,630,027 |
972,012 |
3,602,039 |
| Total |
2,300,070 |
1,470,561 |
3,770,631 |
9,672,933 |
1,314,794 |
10,987,727 |
11,973,003 |
2,785,355 |
14,758,358 |
Source: Register-based Labour Market Statistics, General Authority for Statistics (GAStat)
- Data collection methodology
LFS were first conducted in 2001 and became bi-annual after 2006. Data were collected through nationally representative household sample surveys, which sampling was based on most recent censuses.
Since 2016, Labour Force Surveys have been conducted and published on a quarterly basis, based on a
household telephone survey conducted by GAStat. Employment data extracted from administrative records were also introduced as a complement to the results of Labour Force Surveys in Labour Market Statistics’ publications, starting on Q1 2017.
The present data is taken from administrative records.
GAStat Labour Market Statistics:
Estimates of figures and characteristics of employment in Saudi Arabia are taken from administrative
records from the following institutions:
– Ministry of Human Resources and Social Development (MHRSD)
(formerly Ministry of Labour and Social Development):
Supplies data on Government sector’s workers.
– General Organization of Social Insurance (GOSI):
Supplies data on:
- contributors on the job who are subject to social insurance laws and regulations in the private
and government sector;
- workers who terminated their contribution to social insurance during the quarter.
– National Information Center (NIC):
Supplies data on domestic workers (data owner: MHRSD).
Figures of workers in Labor Market statistics which were derived from administrative records do not include the following category:
1-Workers in the military and security sectors
2- Workers who are not registered in the civil service and social insurance records, which include:
– Saudis working for their own businesses and are not subjected to the labor regulations, also, not registered in social insurance, such as those who work in delivery through electronic apps
– Saudi employers who work in establishments and not registered in the social insurance
– Non-Saudi staff working in foreign international, political or military missions
3- Non-Saudi employees who come to the Kingdom for work that normally takes less than three months to be completed.
– The public (government) sector includes workers subject to civil service regulations and government employees subject to insurance regulations (GOSI).
– The category of domestic workers in Arab states encompasses professions performed within the household, such as maids, cooks, waiters, valets, butlers, laundresses, gardeners, gatekeepers, stable-lads, chauffeurs, caretakers, governesses, babysitters, tutors, secretaries etc.
These professions are classified in the class 9700 of section T of the International Standard Industrial Classification of all Economic Activities (ISIC), Rev. 4.
See: Department of Economic and Social Affairs, Statistics Division. “International Standard Industrial Classification of All Economic Activities Revision 4,” Statistical Papers, Series M No. 4/Rev.4, New York: United Nations, 2008, p. 269
https://unstats.un.org/unsd/publication/seriesm/seriesm_4rev4e.pdf.
Definitions and categories used by GAStat in Labour Markets Statistics (employment; unemployment;
occupation and activity sectors, etc.) are based on international standards:
For LFS methodology and definitions, see: https://www.stats.gov.sa/en/node/9787.
- Institution which provides data
General Authority for Statistics (GAStat)
- Data availability
Since 2021, GAStat has been publishing separately the employment data taken from administrative records, and unemployment/inactivity data as well as general indicators, calculated from the results of the field interviews conducted by GAStat (Labour Force Survey).
The present time-series was taken from the Register-based Labour Market Statistics– Q4, 2022
(English and Arabic versions)
https://www.stats.gov.sa/sites/default/files/LMS_2022_Q4_EN_1.xlsx
https://www.stats.gov.sa/sites/default/files/LMS_2022_Q4_AR_1.xlsx
Register-based Labour Market Statistics reports are accessible from:
https://www.stats.gov.sa/en/814
https://www.stats.gov.sa/ar/814
Date of access: 02 March 2024.
Keywords: Employment, Female Employment, Saudi Arabia, National & Foreign Labour, Domestic Workers
GLMM and GRC cannot guarantee that the link to access the source will not change; that the information will not be removed from the website it was obtained from; that no geo-blockages will be imposed; or that the information will not be available for any another reason.
|
Males |
Females |
Total |
| 2017 Q1 |
1,579,258 |
756,320 |
2,335,578 |
| 2017 Q2 |
1,610,224 |
774,375 |
2,384,599 |
| 2017 Q3 |
1,638,188 |
781,639 |
2,419,827 |
| 2017 Q4 |
1,673,336 |
739,337 |
2,412,673 |
| 2018 Q1 |
1,688,722 |
710,381 |
2,399,103 |
| 2018 Q2 |
1,696,589 |
724,514 |
2,421,103 |
| 2018 Q3 |
1,659,729 |
711,661 |
2,371,390 |
| 2018 Q4 |
1,627,847 |
826,895 |
2,454,742 |
| 2019 Q1 |
1,918,424 |
945,273 |
2,863,697 |
| 2019 Q2 |
2,121,644 |
987,529 |
3,109,173 |
| 2019 Q3 |
2,225,783 |
1,000,002 |
3,225,785 |
| 2019 Q4 |
2,522,113 |
1,168,606 |
3,690,719 |
| 2020 Q1 |
2,598,566 |
1,060,164 |
3,658,730 |
| 2020 Q2 |
2,627,728 |
1,076,913 |
3,704,641 |
| 2020 Q3 |
2,613,110 |
1,065,454 |
3,678,564 |
| 2020 Q4 |
2,619,534 |
1,044,405 |
3,663,939 |
| 2021 Q1 |
2,696,887 |
1,130,139 |
3,827,026 |
| 2021 Q2 |
2,554,628 |
892,039 |
3,446,667 |
| 2021 Q3 |
2,457,691 |
835,119 |
3,292,810 |
| 2021 Q4 |
2,446,355 |
812,013 |
3,258,368 |
| 2022 Q1 |
2,522,773 |
866,978 |
3,389,751 |
| 2022 Q2 |
2,509,842 |
877,227 |
3,387,069 |
| 2022 Q3 |
2,614,666 |
965,294 |
3,579,960 |
| 2022 Q4 |
2,630,027 |
972,012 |
3,602,039 |
| 2023 Q1 |
2,653,447 |
988,014 |
3,641,461 |
| 2023 Q2 |
2,664,212 |
1,026,717 |
3,690,929 |
| 2023 Q3 |
2,682,049 |
1,056,542 |
3,738,591 |
Source: Register-based Labour Market Statistics, General Authority for Statistics (GAStat)
- Data collection methodology
LFS were first conducted in 2001 and became bi-annual after 2006. Data were collected through nationally representative household sample surveys, which sampling was based on most recent censuses.
Since 2016, Labour Force Surveys have been conducted and published on a quarterly basis, based on a household telephone survey conducted by GAStat. Employment data extracted from administrative records were also introduced as a complement to the results of Labour Force Surveys in Labour Market Statistics’ publications, starting on Q1 2017.
The present data is taken from administrative records.
GAStat Labour Market Statistics:
Estimates of figures and characteristics of employment in Saudi Arabia are taken from administrative records from the following institutions:
– Ministry of Human Resources and Social Development (MHRSD) (formerly Ministry of Labour and Social Development):
Supplies data on Government sector’s workers.
– General Organization of Social Insurance (GOSI):
Supplies data on:
- contributors on the job who are subject to social insurance laws and regulations in the private and government sectors;
- workers who terminated their contribution to social insurance during the quarter.
– National Information Center (NIC):
Supplies data on domestic workers (data owner: MHRSD).
The category of domestic workers in Arab states encompasses professions performed within the household, such as maids, cooks, waiters, valets, butlers, laundresses, gardeners, gatekeepers, stable-lads, chauffeurs, caretakers, governesses, babysitters, tutors, secretaries etc.
These professions are classified in the class 9700 of section T of the International Standard Industrial Classification of all Economic Activities (ISIC), Rev. 4.
See: Department of Economic and Social Affairs, Statistics Division. “International Standard Industrial Classification of All Economic Activities Revision 4,” Statistical Papers, Series M No. 4/Rev.4, New York: United Nations, 2008, p. 269
https://unstats.un.org/unsd/publication/seriesm/seriesm_4rev4e.pdf.
Definitions and categories used by GAStat in Labour Markets Statistics (employment; unemployment; occupation and activity sectors, etc.) are based on international standards.
For LFS methodology and definitions, see: https://www.stats.gov.sa/en/node/9787.
- Institution which provides data
General Authority for Statistics (GAStat)
- Data availability
Since 2021, GAStat has been publishing separately the employment data taken from administrative records, and unemployment/inactivity data as well as general indicators, calculated from the results of the field interviews conducted by GAStat (Labour Force Survey).
The present time-series was taken from the Register-based Labour Market Statistics- Q4, 2022
(English and Arabic versions):
https://www.stats.gov.sa/sites/default/files/LMS_2022_Q4_EN_1.xlsx
https://www.stats.gov.sa/sites/default/files/LMS_2022_Q4_AR_1.xlsx
and from relevant quarterly Register-based Labour Market Statistics reports for 2023, accessible from: https://www.stats.gov.sa/en/814
https://www.stats.gov.sa/ar/814
Date of access: 02 March 2024.
GLMM and GRC cannot guarantee that the link to access the source will not change; that the information will not be removed from the website it was obtained from; that no geo-blockages will be imposed; or that the information will not be available for any another reason.
Keywords: Saudi Arabia, Foreign Labour, Domestic Workersez
|
Bahrainis |
Non-Bahrainis |
Total |
|
Males |
Females |
Males |
Females |
Males |
Females |
| 1991 |
161,959 |
158,430 |
128,862 |
53,801 |
290,821 |
212,231 |
| 1992 |
165,932 |
162,294 |
132,967 |
55,265 |
298,899 |
217,559 |
| 1993 |
169,973 |
166,278 |
136,615 |
57,359 |
306,588 |
223,637 |
| 1994 |
174,108 |
170,371 |
140,366 |
59,521 |
314,474 |
229,892 |
| 1995 |
178,328 |
174,572 |
144,227 |
61,752 |
322,555 |
236,324 |
| 1996 |
182,648 |
178,882 |
148,207 |
64,055 |
330,855 |
242,937 |
| 1997 |
187,065 |
183,312 |
152,307 |
66,431 |
339,372 |
249,743 |
| 1998 |
191,577 |
187,858 |
156,523 |
68,884 |
348,100 |
256,742 |
| 1999 |
196,190 |
192,524 |
160,866 |
71,409 |
357,056 |
263,933 |
| 2000 |
200,903 |
197,318 |
165,344 |
74,017 |
366,247 |
271,335 |
| 2001 |
206,909 |
202,710 |
179,802 |
71,895 |
386,711 |
274,605 |
| 2002 |
215,813 |
211,433 |
202,383 |
80,924 |
418,196 |
292,357 |
| 2003 |
225,099 |
220,531 |
227,800 |
91,087 |
452,899 |
311,618 |
| 2004 |
234,786 |
230,021 |
256,408 |
102,526 |
491,194 |
332,547 |
| 2005 |
244,890 |
239,920 |
288,610 |
115,402 |
533,500 |
355,322 |
| 2006 |
255,428 |
250,244 |
324,856 |
129,896 |
580,284 |
380,140 |
| 2007 |
266,419 |
261,013 |
365,654 |
146,209 |
632,073 |
407,222 |
| 2008 |
273,612 |
267,975 |
402,978 |
158,931 |
676,590 |
426,906 |
| 2009 |
282,011 |
276,000 |
449,986 |
170,418 |
731,997 |
446,418 |
| 2010 |
288,452 |
282,235 |
475,905 |
181,951 |
764,357 |
464,186 |
| 2011 |
295,878 |
288,810 |
445,605 |
164,727 |
741,483 |
453,537 |
| 2012 |
305,354 |
294,275 |
455,095 |
154,240 |
760,449 |
448,515 |
| 2013 |
312,945 |
301,885 |
475,436 |
162,925 |
788,381 |
464,810 |
| 2014 |
320,839 |
309,905 |
485,648 |
198,170 |
806,487 |
508,075 |
| 2015 |
328,887 |
318,948 |
517,478 |
205,009 |
846,365 |
523,957 |
| 2016 |
336,834 |
327,873 |
551,555 |
207,464 |
888,389 |
535,337 |
| 2017 |
343,340 |
334,166 |
607,972 |
215,638 |
951,312 |
549,804 |
| 2018 |
349,661 |
340,053 |
597,203 |
216,174 |
946,864 |
556,227 |
| 2019 |
355,633 |
346,194 |
564,931 |
216,998 |
920,564 |
563,192 |
| 2020 |
361,979 |
351,284 |
563,057 |
195,884 |
925,036 |
547,168 |
| 2021 |
365,083 |
354,658 |
560,664 |
223,960 |
925,747 |
578,618 |
| 2022 |
361,587 |
352,424 |
585,450 |
225,232 |
947,037 |
577,656 |
| 2022 (12) |
365,501 |
356,156 |
603,605 |
231,920 |
969,106 |
588,076 |
| 2023 |
368,448 |
358,904 |
611,427 |
238,280 |
979,875 |
597,184 |
Source: Information & eGovernment Authority (IGA)
ANNEXED NOTE
- Technical Notes and Definitions
The table provides mid-year intercensal estimates of Bahrain’s total resident population (nationals and non-nationals).
In October 2015, the Bahraini e-Government Authority merged with the Central Informatics Organization to form the Information and e-Government Authority (IGA), which manages and oversees all national digital assets. The IGA maintains, and is part of, the Government Data Network, established in 1994, which links together 300 governmental entities.
Reference dates of censuses:
1941 January 22nd, 1941
1950 March 1950
1959 May 1959
1965 February 13th, 1965
1971 April 1971
1981 n.d.
1991 n.d.
2001 April 7th, 2001
2010 April 27th, 2010
2020 March 17th, 2020
Censuses’ implementation methods:
Until 1981: field enumeration (household survey)+de jure methodology, i.e. counting persons using their usual place of residence irrespective of where are they at census times
1991; 2001: field enumeration (household survey)+ first use of administrative records
2010: mixed census, based on both administrative records and a household survey sample of 15,000 Bahraini and non-Bahraini households.
2020 census was conducted solely on the basis of administrative records on the de jure population of the Kingdom.
Population of reference: all individuals (nationals and non-nationals) usually present within the State’s borders during time of reference.
The nationality of the person is defined by the passport used to enter the country. A non-Bahraini is considered as such depending on the passport used to enter the country (or obtain the visa)
- Institution which provides data
Information & eGovernment Authority (IGA)
- Data availability
Published results of past censuses (until 2020) are no longer available online, as of 07 February 2024.
Some datasets from census 2020 and the present intercensal population estimates are available on IGA’s Bahrain Open Data Portal:
https://bahrain.opendatasoft.com/pages/homepage/
https://bahrain.opendatasoft.com/explore/?sort=modified&refine.theme=Population
Date of access: February 2024
GLMM and GRC cannot guarantee that the link to access the source will not change; that the information will not be removed from the website it was obtained from; that no geo-blockages will be imposed; or that the information will not be available for any another reason.
Keywords: Bahrain, National Population, Foreign Population
|
Males |
Females |
Total |
| Bahrain |
361,140 |
351,222 |
712,362 |
| GCC countries |
6,601 |
6,698 |
13,299 |
| Other Arab countries |
38,974 |
34,550 |
73,524 |
| Non-Arab Asian countries |
511,901 |
139,095 |
650,996 |
| Non-Arab African countries |
5,676 |
15,826 |
21,502 |
| European countries |
6,067 |
5,683 |
11,750 |
| North America |
11,615 |
4,800 |
16,415 |
| Other countries |
921 |
866 |
1,787 |
| Non-Bahrainis |
581,755 |
207,518 |
789,273 |
| Total |
942,895 |
558,740 |
1,501,635 |
Source: Information & eGovernment Authority (IGA)
ANNEXED NOTE
- Technical Notes and Definitions
In October 2015, the Bahraini e-Government Authority merged with the Central Informatics Organization to form the Information and e-Government Authority (IGA), which manages and oversees all national digital assets. The IGA maintains, and is part of, the Government Data Network, established in 1994, which links together 300 governmental entities.
Census 2020’s implementation method:
Census 2020 was conducted solely on the basis of administrative records on the de jure population of the Kingdom.
Population of reference: all individuals (nationals and non-nationals) usually present within the State’s borders during time of reference.
The nationality of the person is defined by the passport used to enter the country. A non-Bahraini is considered as such depending on the passport used to enter the country (or obtain the visa)
- Institution which provides data
Information & eGovernment Authority (IGA)
- Data availability
Some datasets from census 2020 are available on IGA’s Bahrain Open Data Portal:
https://bahrain.opendatasoft.com/pages/homepage/
https://bahrain.opendatasoft.com/explore/?sort=modified&refine.theme=Population
Date of access: February 2024
GLMM and GRC cannot guarantee that the link to access the source will not change; that the information will not be removed from the website it was obtained from; that no geo-blockages will be imposed; or that the information will not be available for any another reason.
Keywords: Bahrain, National Population, Foreign Population, Asia, Africa, Europe, North America, Arab countries
| |
Bahrainis |
Non-Bahrainis |
Total |
| |
Males |
Females |
Total |
Males |
Females |
Total |
Males |
Females |
Total |
| 0-4 |
32,113 |
31,034 |
63,147 |
15,086 |
14,559 |
29,645 |
47,199 |
45,593 |
92,792 |
| 5-9 |
38,026 |
36,343 |
74,369 |
15,979 |
15,612 |
31,591 |
54,005 |
51,955 |
105,960 |
| 10-14 |
37,141 |
35,763 |
72,904 |
12,879 |
12,300 |
25,179 |
50,020 |
48,063 |
98,083 |
| 15-19 |
33,998 |
32,634 |
66,632 |
10,111 |
7,993 |
18,104 |
44,109 |
40,627 |
84,736 |
| 20-24 |
30,485 |
28,343 |
58,828 |
40,492 |
11,530 |
52,022 |
70,977 |
39,873 |
110,850 |
| 25-29 |
30,306 |
28,376 |
58,682 |
65,439 |
28,651 |
94,090 |
95,745 |
57,027 |
152,772 |
| 30-34 |
28,814 |
27,333 |
56,147 |
102,210 |
36,380 |
138,590 |
131,024 |
63,713 |
194,737 |
| 35-39 |
25,679 |
25,193 |
50,872 |
123,270 |
34,329 |
157,599 |
148,949 |
59,522 |
208,471 |
| 40-44 |
22,737 |
22,284 |
45,021 |
91,773 |
28,361 |
120,134 |
114,510 |
50,645 |
165,155 |
| 45-49 |
19,475 |
19,515 |
38,990 |
59,242 |
20,819 |
80,061 |
78,717 |
40,334 |
119,051 |
| 50-54 |
15,727 |
16,340 |
32,067 |
39,330 |
12,693 |
52,023 |
55,057 |
29,033 |
84,090 |
| 55-59 |
16,123 |
17,286 |
33,409 |
20,854 |
7,711 |
28,565 |
36,977 |
24,997 |
61,974 |
| 60-64 |
13,746 |
14,704 |
28,450 |
9,295 |
4,061 |
13,356 |
23,041 |
18,765 |
41,806 |
| 65-69 |
10,713 |
10,553 |
21,266 |
3,607 |
1,752 |
5,359 |
14,320 |
12,305 |
26,625 |
| 70-74 |
6,949 |
5,752 |
12,701 |
1,090 |
753 |
1,843 |
8,039 |
6,505 |
14,544 |
| 75-79 |
3,271 |
3,438 |
6,709 |
409 |
358 |
767 |
3,680 |
3,796 |
7,476 |
| 80-84 |
1,917 |
2,177 |
4,094 |
179 |
217 |
396 |
2,096 |
2,394 |
4,490 |
| 85 + |
1,228 |
1,836 |
3,064 |
182 |
201 |
383 |
1,410 |
2,037 |
3,447 |
| Total |
368,448 |
358,904 |
727,352 |
611,427 |
238,280 |
849,707 |
979,875 |
597,184 |
1,577,059 |
Source: Information & eGovernment Authority (IGA)
ANNEXED NOTE
- Technical Notes and Definitions
The table provides mid-year estimates of Bahrain’s total resident population (nationals and non-nationals) by age group, based on the results of census 2020.
Census 2020 implementation method:
Census 2020 was conducted solely on the basis of administrative records on the de jure population of the Kingdom.
Population of reference: all individuals (nationals and non-nationals) usually present within the State’s borders during time of reference.
The nationality of the person is defined by the passport used to enter the country. A non-Bahraini is considered as such depending on the passport used to enter the country (or obtain the visa)
- Institution which provides data
Information & eGovernment Authority (IGA)
- Data availability
Some datasets from census 2020 and estimates of population numbers and characteristics based on the census’ results are available on IGA’s Bahrain Open Data Portal:
https://bahrain.opendatasoft.com/pages/homepage/
https://bahrain.opendatasoft.com/explore/?sort=modified&refine.theme=Population
Date of access: February 2024
GLMM and GRC cannot guarantee that the link to access the source will not change; that the information will not be removed from the website it was obtained from; that no geo-blockages will be imposed; or that the information will not be available for any another reason.
Keywords: Bahrain, National Population, Foreign Population
| |
Capital |
Northern |
Southern |
Muharraq |
Total |
| Bahrain |
169,192 |
272,093 |
134,953 |
136,124 |
712,362 |
| GCC countries |
4,679 |
2,725 |
3,341 |
2,554 |
13,299 |
| Other Arab countries |
17,899 |
10,356 |
20,815 |
24,454 |
73,524 |
| Non-Arab Asian countries |
330,946 |
81,916 |
140,090 |
98,044 |
650,996 |
| Non-Arab African countries |
7,091 |
5,793 |
4,587 |
4,031 |
21,502 |
| European countries |
4,189 |
4,715 |
1,047 |
1,799 |
11,750 |
| North America |
13,670 |
1,533 |
473 |
739 |
16,415 |
| Other countries |
679 |
506 |
241 |
361 |
1,787 |
| Non-Bahrainis |
379,153 |
107,544 |
170,594 |
131,982 |
789,273 |
| Total |
548,345 |
379,637 |
305,547 |
268,106 |
1,501,635 |
Source: Information & eGovernment Authority (IGA)
ANNEXED NOTE
- Technical Notes and Definitions
In October 2015, the Bahraini e-Government Authority merged with the Central Informatics Organization to form the Information and e-Government Authority (IGA), which manages and oversees all national digital assets. The IGA maintains, and is part of, the Government Data Network, established in 1994, which links together 300 governmental entities.
Census 2020’s implementation method:
Census 2020 was conducted solely on the basis of administrative records on the de jure population of the Kingdom.
Population of reference: all individuals (nationals and non-nationals) usually present within the State’s borders during time of reference.
The nationality of the person is defined by the passport used to enter the country. A non-Bahraini is considered as such depending on the passport used to enter the country (or obtain the visa)
- Institution which provides data
Information & eGovernment Authority (IGA)
- Data availability
Some datasets from census 2020 are available on IGA’s Bahrain Open Data Portal:
https://bahrain.opendatasoft.com/pages/homepage/
https://bahrain.opendatasoft.com/explore/?sort=modified&refine.theme=Population
Date of access: February 2024
GLMM and GRC cannot guarantee that the link to access the source will not change; that the information will not be removed from the website it was obtained from; that no geo-blockages will be imposed; or that the information will not be available for any another reason.
Keywords: Bahrain, National Population, Foreign Population, Asia, Africa, Europe, North America, Arab countries
| |
Bahrainis |
Non-Bahrainis |
Total |
| |
Males |
Females |
Total |
Males |
Females |
Total |
Males |
Females |
Total |
| 0-4 |
35,703 |
34,441 |
70,144 |
15,962 |
15,528 |
31,490 |
51,665 |
49,969 |
101,634 |
| 5-9 |
38,575 |
36,984 |
75,559 |
14,783 |
14,266 |
29,049 |
53,358 |
51,250 |
104,608 |
| 10-14 |
36,015 |
34,439 |
70,454 |
11,727 |
11,328 |
23,055 |
47,742 |
45,767 |
93,509 |
| 15-19 |
33,282 |
31,501 |
64,783 |
8,512 |
7,139 |
15,651 |
41,794 |
38,640 |
80,434 |
| 20-24 |
31,353 |
29,434 |
60,787 |
32,236 |
10,223 |
42,459 |
63,589 |
39,657 |
103,246 |
| 25-29 |
30,401 |
28,765 |
59,166 |
67,238 |
22,410 |
89,648 |
97,639 |
51,175 |
148,814 |
| 30-34 |
27,638 |
26,517 |
54,155 |
119,746 |
28,000 |
147,746 |
147,384 |
54,517 |
201,901 |
| 35-39 |
24,500 |
23,808 |
48,308 |
104,898 |
26,343 |
131,241 |
129,398 |
50,151 |
179,549 |
| 40-44 |
21,754 |
21,253 |
43,007 |
70,724 |
22,058 |
92,782 |
92,478 |
43,311 |
135,789 |
| 45-49 |
17,317 |
17,480 |
34,797 |
51,106 |
15,621 |
66,727 |
68,423 |
33,101 |
101,524 |
| 50-54 |
16,374 |
17,298 |
33,672 |
33,063 |
10,453 |
43,516 |
49,437 |
27,751 |
77,188 |
| 55-59 |
15,643 |
16,628 |
32,271 |
18,343 |
6,408 |
24,751 |
33,986 |
23,036 |
57,022 |
| 60-64 |
12,940 |
13,229 |
26,169 |
9,516 |
3,248 |
12,764 |
22,456 |
16,477 |
38,933 |
| 65-69 |
9,373 |
7,872 |
17,245 |
3,141 |
1,342 |
4,483 |
12,514 |
9,214 |
21,728 |
| 70-74 |
5,154 |
4,606 |
9,760 |
1,102 |
583 |
1,685 |
6,256 |
5,189 |
11,445 |
| 75-79 |
2,872 |
3,075 |
5,947 |
426 |
307 |
733 |
3,298 |
3,382 |
6,680 |
| 80-84 |
1,817 |
2,236 |
4,053 |
202 |
211 |
413 |
2,019 |
2,447 |
4,466 |
| 85 + |
1,268 |
1,718 |
2,986 |
332 |
416 |
748 |
1,600 |
2,134 |
3,734 |
| Total |
361,979 |
351,284 |
713,263 |
563,057 |
195,884 |
758,941 |
925,036 |
547,168 |
1,472,204 |
Source: Information & eGovernment Authority (IGA)
ANNEXED NOTE
- Technical Notes and Definitions
The table provides mid-year estimates of Bahrain’s total resident population (nationals and non-nationals) by age group, based on the results of census 2020.
Census 2020 implementation method:
Census 2020 was conducted solely on the basis of administrative records on the de jure population of the Kingdom.
Population of reference: all individuals (nationals and non-nationals) usually present within the State’s borders during time of reference.
The nationality of the person is defined by the passport used to enter the country. A non-Bahraini is considered as such depending on the passport used to enter the country (or obtain the visa)
- Institution which provides data
Information & eGovernment Authority (IGA)
- Data availability
Some datasets from census 2020 and estimates of population numbers and characteristics based on the census’ results are available on IGA’s Bahrain Open Data Portal:
https://bahrain.opendatasoft.com/pages/homepage/
https://bahrain.opendatasoft.com/explore/?sort=modified&refine.theme=Population
Date of access: February 2024
GLMM and GRC cannot guarantee that the link to access the source will not change; that the information will not be removed from the website it was obtained from; that no geo-blockages will be imposed; or that the information will not be available for any another reason.
Keywords: Bahrain, National Population, Foreign Population
Source: Information & eGovernment Authority (IGA)
ANNEXED NOTE
- Technical Notes and Definitions
In October 2015, the Bahraini e-Government Authority merged with the Central Informatics Organization to form the Information and e-Government Authority (IGA), which manages and oversees all national digital assets. The IGA maintains, and is part of, the Government Data Network, established in 1994, which links together 300 governmental entities.
Census 2020’s implementation method:
Census 2020 was conducted solely on the basis of administrative records on the de jure population of the Kingdom.
Population of reference: all individuals (nationals and non-nationals) usually present within the State’s borders during time of reference.
The nationality of the person is defined by the passport used to enter the country. A non-Bahraini is considered as such depending on the passport used to enter the country (or obtain the visa)
- Institution which provides data
Information & eGovernment Authority (IGA)
- Data availability
Some datasets from census 2020 are available on IGA’s Bahrain Open Data Portal:
https://bahrain.opendatasoft.com/pages/homepage/
https://bahrain.opendatasoft.com/explore/?sort=modified&refine.theme=Population
Date of access: February 2024
GLMM and GRC cannot guarantee that the link to access the source will not change; that the information will not be removed from the website it was obtained from; that no geo-blockages will be imposed; or that the information will not be available for any another reason.
Keywords: Bahrain, National Population, Foreign Population
| |
Never Married |
Married |
Divorced |
Widowed |
Total non-Bahrainis |
| |
Males |
Females |
Males |
Females |
Males |
Females |
Males |
Females |
Males |
Females |
| 15 – 19 |
7,923 |
6,632 |
138 |
387 |
0 |
6 |
0 |
1 |
8,061 |
7,026 |
| 20 – 24 |
26,428 |
6,257 |
3,187 |
5,137 |
19 |
48 |
10 |
13 |
29,644 |
11,455 |
| 25 – 29 |
57,770 |
11,652 |
13,162 |
13,896 |
69 |
205 |
26 |
57 |
71,027 |
25,810 |
| 30 – 34 |
83,003 |
10,006 |
43,472 |
20,600 |
131 |
363 |
67 |
122 |
126,673 |
31,091 |
| 35 – 39 |
55,544 |
7,274 |
54,059 |
20,153 |
128 |
345 |
41 |
197 |
109,772 |
27,969 |
| 40 – 44 |
28,472 |
5,552 |
44,826 |
17,071 |
86 |
304 |
25 |
228 |
73,409 |
23,155 |
| 45 – 49 |
20,570 |
4,189 |
32,742 |
11,525 |
79 |
238 |
19 |
171 |
53,410 |
16,123 |
| 50 – 54 |
12,255 |
2,949 |
21,105 |
7,504 |
75 |
118 |
17 |
130 |
33,452 |
10,701 |
| 55 – 59 |
6,201 |
1,757 |
12,583 |
4,526 |
67 |
107 |
13 |
112 |
18,864 |
6,502 |
| 60 – 64 |
2,601 |
743 |
6,749 |
2,233 |
46 |
61 |
10 |
92 |
9,406 |
3,129 |
| 65 + |
976 |
500 |
3,606 |
1,642 |
65 |
34 |
27 |
230 |
4,674 |
2,406 |
| Total |
301,743 |
57,511 |
235,629 |
104,674 |
765 |
1,829 |
255 |
1,353 |
538,392 |
165,367 |
Source: Information & eGovernment Authority (IGA)
ANNEXED NOTE
- Technical Notes and Definitions
In October 2015, the Bahraini e-Government Authority merged with the Central Informatics Organization to form the Information and e-Government Authority (IGA), which manages and oversees all national digital assets. The IGA maintains, and is part of, the Government Data Network, established in 1994, which links together 300 governmental entities.
Census 2020’s implementation method:
Census 2020 was conducted solely on the basis of administrative records on the de jure population of the Kingdom.
Population of reference: all individuals (nationals and non-nationals) usually present within the State’s borders during time of reference.
The nationality of the person is defined by the passport used to enter the country. A non-Bahraini is considered as such depending on the passport used to enter the country (or obtain the visa)
- Institution which provides data
Information & eGovernment Authority (IGA)
- Data availability
Some datasets from census 2020 are available on IGA’s Bahrain Open Data Portal:
https://bahrain.opendatasoft.com/pages/homepage/
https://bahrain.opendatasoft.com/explore/?sort=modified&refine.theme=Population
Date of access: February 2024
GLMM and GRC cannot guarantee that the link to access the source will not change; that the information will not be removed from the website it was obtained from; that no geo-blockages will be imposed; or that the information will not be available for any another reason.
Keywords: Bahrain, National Population, Foreign Population
| |
Bahrainis |
Non-Bahrainis |
Total |
| |
Males |
Females |
Total |
Males |
Females |
Total |
Males |
Females |
Total |
| 0-4 |
33,090 |
32,003 |
65,093 |
15,295 |
14,641 |
29,936 |
48,385 |
46,644 |
95,029 |
| 5-9 |
38,302 |
36,673 |
74,975 |
15,102 |
14,766 |
29,868 |
53,404 |
51,439 |
104,843 |
| 10-14 |
36,293 |
34,907 |
71,200 |
12,285 |
11,508 |
23,793 |
48,578 |
46,415 |
94,993 |
| 15-19 |
33,128 |
31,853 |
64,981 |
9,689 |
7,712 |
17,401 |
42,817 |
39,565 |
82,382 |
| 20-24 |
29,889 |
27,922 |
57,811 |
36,034 |
10,774 |
46,808 |
65,923 |
38,696 |
104,619 |
| 25-29 |
30,055 |
28,083 |
58,138 |
61,338 |
27,949 |
89,287 |
91,393 |
56,032 |
147,425 |
| 30-34 |
28,189 |
26,893 |
55,082 |
112,210 |
34,431 |
146,641 |
140,399 |
61,324 |
201,723 |
| 35-39 |
24,829 |
24,291 |
49,120 |
117,938 |
32,139 |
150,077 |
142,767 |
56,430 |
199,197 |
| 40-44 |
22,202 |
21,920 |
44,122 |
81,649 |
26,598 |
108,247 |
103,851 |
48,518 |
152,369 |
| 45-49 |
18,587 |
18,616 |
37,203 |
54,881 |
19,068 |
73,949 |
73,468 |
37,684 |
111,152 |
| 50-54 |
15,641 |
16,467 |
32,108 |
36,513 |
11,850 |
48,363 |
52,154 |
28,317 |
80,471 |
| 55-59 |
15,657 |
16,793 |
32,450 |
18,778 |
7,217 |
25,995 |
34,435 |
24,010 |
58,445 |
| 60-64 |
13,363 |
14,203 |
27,566 |
8,875 |
3,680 |
12,555 |
22,238 |
17,883 |
40,121 |
| 65-69 |
10,086 |
9,431 |
19,517 |
3,195 |
1,567 |
4,762 |
13,281 |
10,998 |
24,279 |
| 70-74 |
6,307 |
5,368 |
11,675 |
972 |
635 |
1,607 |
7,279 |
6,003 |
13,282 |
| 75-79 |
2,971 |
3,121 |
6,092 |
369 |
312 |
681 |
3,340 |
3,433 |
6,773 |
| 80-84 |
1,845 |
2,219 |
4,064 |
172 |
189 |
361 |
2,017 |
2,408 |
4,425 |
| 85 + |
1,153 |
1,661 |
2,814 |
155 |
196 |
351 |
1,308 |
1,857 |
3,165 |
| Total |
361,587 |
352,424 |
714,011 |
585,450 |
225,232 |
810,682 |
947,037 |
577,656 |
1,524,693 |
Source: Information & eGovernment Authority (IGA)
ANNEXED NOTE
- Technical Notes and Definitions
The table provides mid-year estimates of Bahrain’s total resident population (nationals and non-nationals) by age group, based on the results of census 2020.
Census 2020 implementation method:
Census 2020 was conducted solely on the basis of administrative records on the de jure population of the Kingdom.
Population of reference: all individuals (nationals and non-nationals) usually present within the State’s borders during time of reference.
The nationality of the person is defined by the passport used to enter the country. A non-Bahraini is considered as such depending on the passport used to enter the country (or obtain the visa)
- Institution which provides data
Information & eGovernment Authority (IGA)
- Data availability
Some datasets from census 2020 and estimates of population numbers and characteristics based on the census’ results are available on IGA’s Bahrain Open Data Portal:
https://bahrain.opendatasoft.com/pages/homepage/
https://bahrain.opendatasoft.com/explore/?sort=modified&refine.theme=Population
Date of access: February 2024
GLMM and GRC cannot guarantee that the link to access the source will not change; that the information will not be removed from the website it was obtained from; that no geo-blockages will be imposed; or that the information will not be available for any another reason.
Keywords: Bahrain, National Population, Foreign Population
| |
Bahrainis |
Non-Bahrainis |
Total |
| |
Males |
Females |
Total |
Males |
Females |
Total |
Males |
Females |
Total |
| 0-4 |
37,123 |
35,856 |
72,979 |
16,173 |
15,666 |
31,839 |
53,296 |
51,522 |
104,818 |
| 5-9 |
38,139 |
36,316 |
74,455 |
14,415 |
13,962 |
28,377 |
52,554 |
50,278 |
102,832 |
| 10-14 |
35,395 |
33,942 |
69,337 |
11,225 |
10,937 |
22,162 |
46,620 |
44,879 |
91,499 |
| 15-19 |
32,486 |
30,772 |
63,258 |
8,442 |
7,561 |
16,003 |
40,928 |
38,333 |
79,261 |
| 20-24 |
30,951 |
29,000 |
59,951 |
29,830 |
13,004 |
42,834 |
60,781 |
42,004 |
102,785 |
| 25-29 |
29,837 |
28,581 |
58,418 |
77,658 |
31,277 |
108,935 |
107,495 |
59,858 |
167,353 |
| 30-34 |
26,998 |
26,276 |
53,274 |
119,972 |
34,480 |
154,452 |
146,970 |
60,756 |
207,726 |
| 35-39 |
23,643 |
23,422 |
47,065 |
103,321 |
28,628 |
131,949 |
126,964 |
52,050 |
179,014 |
| 40-44 |
20,982 |
20,733 |
41,715 |
69,029 |
22,871 |
91,900 |
90,011 |
43,604 |
133,615 |
| 45-49 |
16,554 |
16,830 |
33,384 |
50,665 |
15,741 |
66,406 |
67,219 |
32,571 |
99,790 |
| 50-54 |
17,026 |
18,106 |
35,132 |
31,629 |
10,523 |
42,152 |
48,655 |
28,629 |
77,284 |
| 55-59 |
15,427 |
16,062 |
31,489 |
18,774 |
6,540 |
25,314 |
34,201 |
22,602 |
56,803 |
| 60-64 |
12,323 |
12,347 |
24,670 |
8,990 |
3,108 |
12,098 |
21,313 |
15,455 |
36,768 |
| 65-69 |
8,926 |
7,423 |
16,349 |
2,840 |
1,274 |
4,114 |
11,766 |
8,697 |
20,463 |
| 70-74 |
4,530 |
4,333 |
8,863 |
955 |
528 |
1,483 |
5,485 |
4,861 |
10,346 |
| 75-79 |
2,704 |
3,008 |
5,712 |
434 |
315 |
749 |
3,138 |
3,323 |
6,461 |
| 80-84 |
1,497 |
1,824 |
3,321 |
218 |
210 |
428 |
1,715 |
2,034 |
3,749 |
| 85 + |
1,092 |
1,363 |
2,455 |
361 |
373 |
734 |
1,453 |
1,736 |
3,189 |
| Total |
355,633 |
346,194 |
701,827 |
564,931 |
216,998 |
781,929 |
920,564 |
563,192 |
1,483,756 |
Source: Information & eGovernment Authority (IGA)
ANNEXED NOTE
- Technical Notes and Definitions
The table provides mid-year estimates of Bahrain’s total resident population (nationals and non-nationals) by age group, based on the results of census 2020.
Census 2020 implementation method:
Census 2020 was conducted solely on the basis of administrative records on the de jure population of the Kingdom.
Population of reference: all individuals (nationals and non-nationals) usually present within the State’s borders during time of reference.
The nationality of the person is defined by the passport used to enter the country. A non-Bahraini is considered as such depending on the passport used to enter the country (or obtain the visa)
- Institution which provides data
Information & eGovernment Authority (IGA)
- Data availability
Some datasets from census 2020 and estimates of population numbers and characteristics based on the census’ results are available on IGA’s Bahrain Open Data Portal:
https://bahrain.opendatasoft.com/pages/homepage/
https://bahrain.opendatasoft.com/explore/?sort=modified&refine.theme=Population
Date of access: February 2024
GLMM and GRC cannot guarantee that the link to access the source will not change; that the information will not be removed from the website it was obtained from; that no geo-blockages will be imposed; or that the information will not be available for any another reason.
Keywords: Bahrain, National Population, Foreign Population
| |
Bahrainis |
Non-Bahrainis |
Total |
| |
Males |
Females |
Total |
Males |
Females |
Total |
Males |
Females |
Total |
| 0-4 |
38,140 |
36,398 |
74,538 |
16,361 |
15,825 |
32,186 |
54,501 |
52,223 |
106,724 |
| 5-9 |
37,374 |
35,923 |
73,297 |
14,132 |
13,562 |
27,694 |
51,506 |
49,485 |
100,991 |
| 10-14 |
34,685 |
33,235 |
67,920 |
10,749 |
10,504 |
21,253 |
45,434 |
43,739 |
89,173 |
| 15-19 |
31,889 |
30,035 |
61,924 |
8,836 |
7,238 |
16,074 |
40,725 |
37,273 |
77,998 |
| 20-24 |
30,591 |
28,932 |
59,523 |
37,636 |
15,380 |
53,016 |
68,227 |
44,312 |
112,539 |
| 25-29 |
29,483 |
28,150 |
57,633 |
99,528 |
33,269 |
132,797 |
129,011 |
61,419 |
190,430 |
| 30-34 |
26,413 |
25,864 |
52,277 |
127,509 |
34,929 |
162,438 |
153,922 |
60,793 |
214,715 |
| 35-39 |
23,336 |
22,813 |
46,149 |
100,783 |
28,062 |
128,845 |
124,119 |
50,875 |
174,994 |
| 40-44 |
20,018 |
19,966 |
39,984 |
68,950 |
21,404 |
90,354 |
88,968 |
41,370 |
130,338 |
| 45-49 |
16,329 |
16,879 |
33,208 |
50,225 |
14,755 |
64,980 |
66,554 |
31,634 |
98,188 |
| 50-54 |
17,016 |
18,068 |
35,084 |
30,551 |
9,897 |
40,448 |
47,567 |
27,965 |
75,532 |
| 55-59 |
14,863 |
15,665 |
30,528 |
18,732 |
5,983 |
24,715 |
33,595 |
21,648 |
55,243 |
| 60-64 |
11,993 |
11,470 |
23,463 |
8,240 |
2,725 |
10,965 |
20,233 |
14,195 |
34,428 |
| 65-69 |
8,102 |
6,508 |
14,610 |
2,641 |
1,148 |
3,789 |
10,743 |
7,656 |
18,399 |
| 70-74 |
4,164 |
4,201 |
8,365 |
1,021 |
526 |
1,547 |
5,185 |
4,727 |
9,912 |
| 75-79 |
2,748 |
2,853 |
5,601 |
469 |
307 |
776 |
3,217 |
3,160 |
6,377 |
| 80-84 |
1,415 |
1,770 |
3,185 |
327 |
213 |
540 |
1,742 |
1,983 |
3,725 |
| 85 + |
1,102 |
1,323 |
2,425 |
513 |
447 |
960 |
1,615 |
1,770 |
3,385 |
| Total |
349,661 |
340,053 |
689,714 |
597,203 |
216,174 |
813,377 |
946,864 |
556,227 |
1,503,091 |
Source: Information & eGovernment Authority (IGA)
ANNEXED NOTE
- Technical Notes and Definitions
The table provides mid-year intercensal estimates of Bahrain’s total resident population (nationals and non-nationals) by age group.
In October 2015, the Bahraini e-Government Authority merged with the Central Informatics Organization to form the Information and e-Government Authority (IGA), which manages and oversees all national digital assets. The IGA maintains, and is part of, the Government Data Network, established in 1994, which links together 300 governmental entities.
Censuses’ implementation methods:
2010: mixed census, based on both administrative records and a household survey sample of 15,000 Bahraini and non-Bahraini households.
Census 2020: Census 2020 was conducted solely on the basis of administrative records on the de jure population of the Kingdom.
Population of reference: all individuals (nationals and non-nationals) usually present within the State’s borders during time of reference.
The nationality of the person is defined by the passport used to enter the country. A non-Bahraini is considered as such depending on the passport used to enter the country (or obtain the visa)
- Institution which provides data
Information & eGovernment Authority (IGA)
- Data availability
Some datasets from census 2020 and estimates of population numbers and characteristics based on the census’ results are available on IGA’s Bahrain Open Data Portal:
https://bahrain.opendatasoft.com/pages/homepage/
https://bahrain.opendatasoft.com/explore/?sort=modified&refine.theme=Population
Date of access: February 2024
GLMM and GRC cannot guarantee that the link to access the source will not change; that the information will not be removed from the website it was obtained from; that no geo-blockages will be imposed; or that the information will not be available for any another reason.
Keywords: Bahrain, National Population, Foreign Population
|
Bahrainis |
Non-Bahrainis |
Total |
| 1991 |
320,389 |
182,663 |
503,052 |
| 1992 |
328,226 |
188,232 |
516,458 |
| 1993 |
336,251 |
193,974 |
530,225 |
| 1994 |
344,479 |
199,887 |
544,366 |
| 1995 |
352,900 |
205,979 |
558,879 |
| 1996 |
361,530 |
212,262 |
573,792 |
| 1997 |
370,377 |
218,738 |
589,115 |
| 1998 |
379,435 |
225,407 |
604,842 |
| 1999 |
388,714 |
232,275 |
620,989 |
| 2000 |
398,221 |
239,361 |
637,582 |
| 2001 |
409,619 |
251,697 |
661,316 |
| 2002 |
427,246 |
283,307 |
710,553 |
| 2003 |
445,630 |
318,887 |
764,517 |
| 2004 |
464,807 |
358,934 |
823,741 |
| 2005 |
484,810 |
404,012 |
888,822 |
| 2006 |
505,672 |
454,752 |
960,424 |
| 2007 |
527,432 |
511,863 |
1,039,295 |
| 2008 |
541,587 |
561,909 |
1,103,496 |
| 2009 |
558,011 |
620,404 |
1,178,415 |
| 2010 |
570,687 |
657,856 |
1,228,543 |
| 2011 |
584,688 |
610,332 |
1,195,020 |
| 2012 |
599,629 |
609,335 |
1,208,964 |
| 2013 |
614,830 |
638,361 |
1,253,191 |
| 2014 |
630,744 |
683,818 |
1,314,562 |
| 2015 |
647,835 |
722,487 |
1,370,322 |
| 2016 |
664,707 |
759,019 |
1,423,726 |
| 2017 |
677,506 |
823,610 |
1,501,116 |
| 2018 |
689,714 |
813,377 |
1,503,091 |
| 2019 |
701,827 |
781,929 |
1,483,756 |
| 2020 |
713,263 |
758,941 |
1,472,204 |
| 2021 |
719,741 |
784,624 |
1,504,365 |
| 2022 |
714,011 |
810,682 |
1,524,693 |
| 2022 (12) |
721,657 |
835,525 |
1,557,182 |
| 2023 |
727,352 |
849,707 |
1,577,059 |
Source: Information & eGovernment Authority (IGA)
ANNEXED NOTE
- Technical Notes and Definitions
The table provides mid-year intercensal estimates of Bahrain’s total resident population (nationals and non-nationals).
In October 2015, the Bahraini e-Government Authority merged with the Central Informatics Organization to form the Information and e-Government Authority (IGA), which manages and oversees all national digital assets. The IGA maintains, and is part of, the Government Data Network, established in 1994, which links together 300 governmental entities.
Reference dates of censuses:
1941 January 22nd, 1941
1950 March 1950
1959 May 1959
1965 February 13th, 1965
1971 April 1971
1981 n.d.
1991 n.d.
2001 April 7th, 2001
2010 April 27th, 2010
2020 March 17th, 2020
Censuses’ implementation methods:
Until 1981: field enumeration (household survey)+de jure methodology, i.e. counting persons using their usual place of residence irrespective of where are they at census times
1991; 2001: field enumeration (household survey)+ first use of administrative records
2010: mixed census, based on both administrative records and a household survey sample of 15,000 Bahraini and non-Bahraini households.
2020 census was conducted solely on the basis of administrative records on the de jure population of the Kingdom.
Population of reference: all individuals (nationals and non-nationals) usually present within the State’s borders during time of reference.
The nationality of the person is defined by the passport used to enter the country. A non-Bahraini is considered as such depending on the passport used to enter the country (or obtain the visa)
- Institution which provides data
Information & eGovernment Authority (IGA)
- Data availability
Published results of past censuses (until 2020) are no longer available online, as of 07 February 2024.
Some datasets from census 2020 and the present intercensal population estimates are available on IGA’s Bahrain Open Data Portal:
https://bahrain.opendatasoft.com/pages/homepage/
https://bahrain.opendatasoft.com/explore/?sort=modified&refine.theme=Population
Date of access: February 2024
GLMM and GRC cannot guarantee that the link to access the source will not change; that the information will not be removed from the website it was obtained from; that no geo-blockages will be imposed; or that the information will not be available for any another reason.
Keywords: Bahrain, National Population, Foreign Population
| |
Qataris |
Non-Qataris |
Total |
| |
Males |
Females |
Total |
Males |
Females |
Total |
Males |
Females |
Total |
| 2012 |
68.1 |
34.6 |
51.3 |
97.7 |
58.4 |
90.7 |
95.7 |
52.4 |
86.5 |
| 2013 |
70.0 |
34.7 |
52.1 |
97.9 |
59.0 |
91.1 |
96.2 |
53.1 |
87.2 |
| 2014 |
68.9 |
35.0 |
51.9 |
97.8 |
59.4 |
91.3 |
96.1 |
53.7 |
87.6 |
| 2015 |
68.6 |
36.1 |
52.1 |
97.8 |
64.9 |
92.1 |
96.3 |
58.7 |
88.6 |
| 2016 |
68.5 |
36.9 |
52.4 |
98.0 |
65.6 |
92.5 |
96.4 |
59.4 |
89.1 |
| 2017 |
68.2 |
36.7 |
52.2 |
97.6 |
64.5 |
91.8 |
96.1 |
58.5 |
88.4 |
| 2018 |
68.1 |
37.1 |
52.2 |
97.6 |
64.2 |
91.7 |
96.0 |
58.5 |
88.3 |
| 2019 |
67.9 |
37.6 |
52.4 |
97.5 |
63.7 |
91.5 |
96.0 |
58.2 |
88.2 |
| 2020 |
66.4 |
37.0 |
51.5 |
97.5 |
64.3 |
91.5 |
95.8 |
58.4 |
88.0 |
| 2021 |
66.7 |
42.0 |
54.2 |
97.2 |
64.2 |
90.8 |
95.4 |
59.6 |
87.4 |
| 2022 |
66.1 |
42.9 |
54.3 |
97.1 |
66.4 |
90.8 |
95.3 |
61.7 |
87.4 |
Source: Annual Bulletin of Labour Force Sample Survey 2022
ANNEXED NOTE
- Technical Notes and Definitions
The data for 2012-2017 is taken from the Labour Force Survey 2017 (yearly synthesis)
The data for 2017-2022 is taken from the Labour Force Survey 2022 (yearly synthesis)
Sampling frame of LFS 2022: Population Census 2020.
Sample size: 65,253 persons, in 10,560 households: 1- Qatari households; 2- Non-Qatari regular (non-collective) households; 3- Non-Qatari small collective households or labour gatherings (2 – 6 persons); 4- Non-Qatari large collective households or large labour gatherings (7 persons or more).
The collective households are a group of persons not related to each other and sharing living conditions in a residential unit, I.e. labour camps, students living boarding schools, nurses in hospitals… etc. The survey covered the small collective households (includes less than 7 persons) and large collective households (includes 7 persons or more).
Data collection: The sample was divided into equal parts to collect data monthly. Each month 1/3 of the quarterly data were collected during the first two weeks of the month.
Reference period for the labour force data: the week prior to data collection day.
The survey did not cover short periods accommodation, i.e. hotels.
The present data includes active population, i.e. employed and unemployed. It does not include persons seeking work for the first time.
- Institution which provides data
Planning and Statistics Authority
https://www.psa.gov.qa/en/Pages/default.aspx
- Data availability
Labour Force Surveys (yearly and quarterly data) can be downloaded from PSA’s website, in PDF and Excel format:
https://www.psa.gov.qa/en/statistics1/pages/topicslisting.aspx?parent=Social&child=LaborForce
Last date of access: January 2024.
GLMM and GRC cannot guarantee that the link to access the source will not change; that the information will not be removed from the website it was obtained from; that no geo-blockages will be imposed; or that the information will not be available for any another reason.
Keywords: Qatar, National & Foreign Labour, National Labour, Foreign Labour, Female Employment
|
Saudis |
Non-Saudis |
Total |
|
Males |
Females |
Total |
Males |
Females |
Total |
Males |
Females |
Total |
| 2016 Q2 |
63.2 |
17.7 |
40.2 |
95.5 |
36.2 |
79.4 |
78.3 |
22.2 |
54.9 |
| 2016 Q3 |
64.6 |
19.0 |
42.0 |
93.3 |
22.8 |
73.1 |
79.3 |
20.1 |
55.3 |
| 2016 Q4 |
64.6 |
19.3 |
42.2 |
94.0 |
31.2 |
76.2 |
79.5 |
22.8 |
56.5 |
| 2017 Q1 |
61.9 |
17.4 |
40.3 |
94.1 |
29.2 |
75.6 |
78.0 |
20.9 |
55.1 |
| 2017 Q2 |
62.1 |
17.4 |
40.3 |
94.0 |
21.6 |
73.4 |
78.2 |
18.7 |
54.2 |
| 2017 Q3 |
62.6 |
17.8 |
40.7 |
93.8 |
24.9 |
74.2 |
78.4 |
19.9 |
54.8 |
| 2017 Q4 |
63.4 |
19.4 |
41.9 |
94.2 |
24.2 |
74.2 |
79.0 |
20.9 |
55.6 |
| 2018 Q1 |
63.5 |
19.5 |
41.9 |
93.6 |
24.5 |
73.9 |
78.8 |
21.0 |
55.5 |
| 2018 Q2 |
63.5 |
19.6 |
42.0 |
93.9 |
29.0 |
75.5 |
79.0 |
22.4 |
56.2 |
| 2018 Q3 |
63.5 |
19.7 |
42.0 |
93.9 |
29.7 |
75.7 |
79.0 |
22.7 |
56.4 |
| 2018 Q4 |
63.0 |
20.2 |
42.0 |
93.8 |
25.9 |
74.5 |
78.7 |
21.9 |
55.9 |
| 2019 Q1 |
63.3 |
20.5 |
42.3 |
94.1 |
27.4 |
75.3 |
79.1 |
22.6 |
56.4 |
| 2019 Q2 |
66.0 |
23.2 |
45.0 |
94.1 |
26.9 |
75.2 |
80.4 |
24.3 |
57.9 |
| 2019 Q3 |
67.0 |
23.2 |
45.5 |
94.5 |
27.6 |
75.6 |
81.1 |
24.5 |
58.4 |
| 2019 Q4 |
66.6 |
26.0 |
46.7 |
93.6 |
28.8 |
75.2 |
80.4 |
26.8 |
58.8 |
| 2020 Q1 |
65.8 |
25.9 |
46.2 |
94.4 |
24.2 |
74.5 |
80.4 |
25.4 |
58.2 |
| 2020 Q2 |
65.6 |
31.4 |
48.8 |
91.8 |
28.7 |
73.9 |
78.9 |
30.6 |
59.4 |
| 2020 Q3 |
66.0 |
31.3 |
49.0 |
92.4 |
26.9 |
73.8 |
79.4 |
30.0 |
59.5 |
| 2020 Q4 |
68.5 |
33.2 |
51.2 |
92.4 |
29.3 |
74.5 |
80.6 |
32.1 |
61.0 |
| 2021 Q1 |
66.2 |
32.3 |
49.5 |
93.0 |
36.9 |
77.1 |
79.7 |
33.6 |
61.1 |
| 2021 Q2 |
65.7 |
32.4 |
49.4 |
92.3 |
37.2 |
76.7 |
79.2 |
33.8 |
60.8 |
| 2021 Q3 |
65.0 |
34.1 |
49.8 |
91.4 |
40.1 |
76.9 |
78.3 |
35.9 |
61.2 |
| 2021 Q4 |
66.8 |
35.6 |
51.5 |
92.0 |
33.3 |
75.4 |
79.5 |
34.9 |
61.5 |
| 2022 Q1 |
66.0 |
33.6 |
50.1 |
91.4 |
32.9 |
74.8 |
78.7 |
33.4 |
60.4 |
| 2022 Q2 |
67.5 |
35.6 |
51.8 |
92.0 |
31.6 |
73.8 |
79.5 |
34.4 |
60.8 |
| 2022 Q3 |
67.4 |
37.0 |
52.5 |
93.0 |
31.9 |
74.6 |
79.9 |
35.5 |
61.5 |
| 2022 Q4 |
68.5 |
36.0 |
52.5 |
93.2 |
31.1 |
74.5 |
80.5 |
34.5 |
61.5 |
| 2023 Q1 |
68.3 |
36.0 |
52.4 |
92.9 |
34.0 |
75.2 |
80.2 |
35.4 |
61.7 |
| 2023 Q2 |
67.5 |
35.3 |
51.7 |
92.8 |
31.1 |
74.2 |
79.7 |
34.1 |
60.8 |
| 2023 Q3 |
66.8 |
35.9 |
51.6 |
93.0 |
31.3 |
74.4 |
79.5 |
34.6 |
60.9 |
Source: Labour Force Survey, in: Labour Market Statistics, General Authority for Statistics (GAStat)
- Data collection methodology
LFS were first conducted in 2001 and became bi-annual after 2006. Data were collected through nationally representative household sample surveys, which sampling was based on most recent censuses.
Since 2016, Labour Force Surveys have been conducted and published on a quarterly basis, based on a household telephone survey conducted by GAStat. Employment data extracted from administrative records were also introduced as a complement to the results of Labour Force Surveys in Labour Market Statistics’ publications, starting on Q1 2017.
The present data is based on estimates drawn from the results of the quarterly Labour Force Survey.
LFS results are published as rates only. Numerical estimates are unavailable.
GAStat Labour Market Statistics: Labour Force Survey (household telephone survey conducted by GAStat)
Sample size: 53,360 households, from all administrative regions of Saudi Arabia.
Population covered: residents in Saudi Arabia, Saudis and non-Saudis. All household members, including domestic workers.
The survey provides estimates of the size of the total and working-age populations (aged 15 years and above), inside and outside the labour force. It highlights the characteristics of the labour force (employed and unemployed populations), and supplies the data to calculate key indicators of labour market such as the unemployment and the labour force participation rates.
Household survey questionnaire:
https://www.stats.gov.sa/sites/default/files/2021_Q3_LFS%20Questionnaire_EN%2022-08-2021.pdf.
Definitions:
Population in the labour force:
Individuals (15 years and above) who contribute or are ready to contribute to the production of commodities and services during the reference period of the survey. The labour force includes the
employed and unemployed populations.
Population outside the labour force:
Individuals (15 years and above) who is not classified as part of the labour force because they do not work, do not seek a job, are unable to work, or are not ready to work during the survey reference period. For example: Students, housewives, retired persons who do not work, individuals unable or unwilling to work, or who do not look for a job for other reasons.
Labour force participation rate = (total labour force ÷ total population of working age (aged 15 years and over)) x 100
Definitions and categories used by GAStat in Labour Markets Statistics (employment; unemployment; occupation and activity sectors, etc.) are based on international standards.
For LFS methodology and definitions, see: https://www.stats.gov.sa/en/node/9787.
- Institution which provides data
General Authority for Statistics (GAStat)
https://www.stats.gov.sa/en
- Data availability
Since 2021, GAStat has been publishing separately the employment data taken from administrative records, and unemployment/inactivity data as well as general indicators, calculated from the results of the field interviews conducted by GAStat (Labour Force Survey).
The present time-series was taken from the Labour Market Statistics- Q2, 2022 and Q3, 2023 (English and Arabic versions)
https://www.stats.gov.sa/en/814
https://www.stats.gov.sa/ar/814
Date of access: January 2024.
GLMM and GRC cannot guarantee that the link to access the source will not change; that the information will not be removed from the website it was obtained from; that no geo-blockages will be imposed; or that the information will not be available for any another reason.
Keywords: Saudi Arabia, National & Foreign Labour, Foreign & National Populations, Labour Market, Employment
| |
|
|
2013 |
2014 |
2015 |
2016 |
2017 |
2018 |
2019 |
2020 |
2021 |
2022 |
| Bahrain |
nationals |
males |
64.0 |
64.1 |
63.4 |
63.2 |
63.2 |
63.2 |
63.2 |
63.2 |
n.a. |
n.a. |
| females |
32.2 |
32.3 |
32.3 |
32.2 |
32.2 |
32.2 |
32.2 |
32.2 |
n.a. |
n.a. |
| non-nationals |
males |
98.1 |
97.6 |
97.9 |
97.8 |
97.8 |
n.a. |
n.a. |
n.a. |
n.a. |
n.a. |
| females |
58.7 |
57.2 |
58.2 |
58.2 |
58.2 |
n.a. |
n.a. |
n.a. |
n.a. |
n.a. |
| Kuwait |
nationals |
males |
56.3 |
54.2 |
52.6 |
47.7 |
47.7 |
n.a. |
n.a. |
n.a. |
47.7 |
n.a. |
| females |
40.3 |
37.6 |
39.3 |
30.8 |
30.8 |
n.a. |
n.a. |
n.a. |
45.0 |
n.a. |
| non-nationals |
males |
84.8 |
94.2 |
95.3 |
95.5 |
95.5 |
n.a. |
n.a. |
n.a. |
91.9 |
n.a. |
| females |
58.6 |
61.3 |
65.8 |
65.5 |
65.5 |
n.a. |
n.a. |
n.a. |
63.5 |
n.a. |
| Oman |
nationals |
males |
n.a. |
n.a. |
n.a. |
39.3 |
39.3 |
39.2 |
40.7 |
40.7 |
n.a. |
n.a. |
| females |
n.a. |
n.a. |
n.a. |
21.7 |
22.4 |
21.7 |
23.7 |
23.7 |
n.a. |
n.a. |
| non-nationals |
males |
n.a. |
n.a. |
n.a. |
n.a. |
n.a. |
n.a. |
n.a. |
n.a. |
n.a. |
n.a. |
| females |
n.a. |
n.a. |
n.a. |
n.a. |
n.a. |
n.a. |
n.a. |
n.a. |
n.a. |
n.a. |
| Qatar |
nationals |
males |
70.0 |
68.9 |
68.6 |
68.5 |
68.2 |
68.1 |
67.9 |
66.4 |
66.7 |
66.1 |
| females |
34.7 |
35.0 |
36.1 |
36.9 |
36.7 |
37.1 |
37.6 |
37.0 |
42.0 |
42.9 |
| non-nationals |
males |
97.9 |
97.8 |
97.8 |
98.0 |
97.6 |
97.6 |
97.5 |
97.5 |
97.2 |
97.1 |
| females |
59.0 |
59.4 |
64.9 |
64.6 |
64.5 |
64.2 |
63.7 |
64.3 |
64.2 |
66.4 |
| Saudi Arabia |
nationals |
males |
64.6 |
64.9 |
63.3 |
64.6 |
63.4 |
63.0 |
66.6 |
68.5 |
66.8 |
68.5 |
| females |
16.4 |
17.6 |
17.4 |
19.0 |
19.4 |
20.2 |
26.0 |
33.2 |
35.6 |
36.0 |
| non-nationals |
males |
94.2 |
93.4 |
93.7 |
93.3 |
94.2 |
93.8 |
93.6 |
92.4 |
92.0 |
93.2 |
| females |
31.2 |
28.7 |
33.1 |
22.8 |
24.2 |
25.9 |
28.8 |
29.3 |
33.3 |
31.1 |
| UAE |
nationals |
males |
n.a. |
n.a. |
n.a. |
64.1 |
62.9 |
60.4 |
62.2 |
62.2 |
n.a. |
n.a. |
| females |
n.a. |
n.a. |
n.a. |
30.9 |
32.4 |
32.3 |
33.2 |
33.2 |
n.a. |
n.a. |
| non-nationals |
males |
n.a. |
n.a. |
n.a. |
95.0 |
94.6 |
95.1 |
94.2 |
n.a. |
n.a. |
n.a. |
| females |
n.a. |
n.a. |
n.a. |
54.3 |
55.9 |
55.9 |
61.1 |
n.a. |
n.a. |
n.a. |
Sources: GCC-Stat Center and national institutes of statistics
1- Definitions and remarks:
Labour Force Participation Rates (LFPR) refer to the percentage of active (employed or unemployed) population aged 15 and above in the category (sex and nationality).
Ex.: 22.8% of foreign women aged 15 and above in Saudi Arabia are economically active in 2016 (i.e.: employed or unemployed).
2- Sources of data:
Data published by the GCC Stat Center are supplied by individual countries and republished without adjustment.
Figures are the same in GCC-Stat and national publications, unless stated otherwise.
NATIONALS:
GCC Stat. Labour Statistics in GCC Countries, issues of 2017; 2019; 2020.
https://gccstat.org/en/statistic/publications/labor-statistics
https://www.gccstat.org/ar/statistic/publications/labor-statistics
National sources.
Bahrain
No data on participation rates available from Information and eGovernment Authority (IGA) and from Bahrain Open Data portal.
Bahrain census 2020 data do not match data for Bahrain as reproduced in GCC-Stat Labour Statistics publication (in table).
Bahraini males’ LFPR: 59.6 percent
Bahraini females’ LFPR: 42.7 percent
Source: census 2020
https://www.data.gov.bh/explore/dataset/population-15-years-and-above-by-labour-force-participation-nationality-and-sex-/
Kuwait
2018-2020; 2022: no data
2021: census data
https://census.csb.gov.kw/CensusData_EN?CatID=5
Oman
No data on participation rates available from NCSI, Oman’s NSO.
Oman Census 2020 data do not match data for Oman as reproduced in GCC-Stat Labour Statistics publication (in table).
Omani males’ LFPR: 70.6 percent
Omani females’ LFPR: 52.6 percent
Source: census 2020
https://portal.ecensus.gov.om/ecen-portal/?lang=en
Qatar
PSA. Annual Bulletin of Labour Force Sample Survey 2022
https://www.psa.gov.qa/en/statistics1/pages/topicslisting.aspx?parent=Social&child=LaborForce
Saudi Arabia
GAStat. Labour Market Statistics, Q4 2022
https://www.stats.gov.sa/en/814
Data from GCC-Stat and GAStat are for Q4 of every given year.
UAE
FCSC. Labour Force Survey results, given years
https://fcsc.gov.ae/en-us/Pages/Statistics/Statistics-by-Subject.aspx#/%3Fsubject=Demography%20and%20Social&folder=Demography%20and%20Social/Labour%20Force/Labor%20Force
2010- 2016: no data
2021-2022: no data disaggregated by nationality in national statistics.
NON-NATIONALS:
GCC Stat. Labour Statistics in GCC Countries 2019
https://gccstat.org/en/statistic/publications/labor-statistics
https://www.gccstat.org/ar/statistic/publications/labor-statistics
- 2017-2020: GCC-Stat publications provide figures for nationals only.
- 2017-2022:
National sources.
Bahrain
No data on participation rates from Information and eGovernment Authority (IGA) and from Bahrain Open Data portal.
Census 2020:
Non-Bahraini males’ economic participation rate: 97.4 percent
Non-Bahraini females’ economic participation rate: 58.6 percent
Source: census 2020
https://www.data.gov.bh/explore/dataset/population-15-years-and-above-by-labour-force-participation-nationality-and-sex-/
Kuwait
2018-2020; 2022: no data
2021: census data
https://census.csb.gov.kw/CensusData_EN?CatID=5
Oman
No data on participation rates available from NCSI, Oman’s NSO.
Unemployment benefit not accessible to non-nationals; no data available on unemployment among non-nationals.
Estimate below is based on inactivity rates calculated from census 2020’s results:
Non-Omani males’ LFPR: 95.5 percent
Non-Omani females’ LFPR: 66.4 percent
Source: census 2020
https://portal.ecensus.gov.om/ecen-portal/?lang=en
Qatar
PSA. Annual Bulletin of Labour Force Sample Survey 2022
https://www.psa.gov.qa/en/statistics1/pages/topicslisting.aspx?parent=Social&child=LaborForce
Saudi Arabia
GAStat. Labour Market Statistics, Q4 2022
https://www.stats.gov.sa/en/814
Data from GCC-Stat and GAStat are for Q4 of every given year.
UAE
2010- 2016: no data
2017-2019:
FCSC. Labour Force Survey results, given years
https://fcsc.gov.ae/en-us/Pages/Statistics/Statistics-by-Subject.aspx#/%3Fsubject=Demography%20and%20Social&folder=Demography%20and%20Social/Labour%20Force/Labor%20Force
2020-2022: no data disaggregated by nationality.
Keywords: Gulf Cooperation Council, Bahrain, Oman, Kuwait, Saudi Arabia, Qatar, United Arab Emirates, National & Foreign Labour, National Labour, Foreign Labour, Female Employment
Last accessed: January 2024.
GLMM and GRC cannot guarantee that the link to access the source will not change; that the information will not be removed from the website it was obtained from; that no geo-blockages will be imposed; or that the information will not be available for any another reason.
| |
Qataris |
Non-Qataris |
Total |
| |
Males |
Females |
Total |
Males |
Females |
Total |
Males |
Females |
Total |
| Primary |
30 |
0 |
30 |
102 |
0 |
102 |
132 |
0 |
132 |
| Preparatory |
45 |
46 |
91 |
117 |
86 |
203 |
162 |
132 |
294 |
| Secondary |
63 |
151 |
214 |
225 |
208 |
433 |
288 |
359 |
647 |
| Diploma |
0 |
0 |
0 |
85 |
32 |
117 |
85 |
32 |
117 |
| University and above |
0 |
91 |
91 |
730 |
788 |
1,518 |
730 |
879 |
1,609 |
| Total |
138 |
288 |
426 |
1,259 |
1,114 |
2,373 |
1,397 |
1,402 |
2,799 |
Source: Annual Bulletin of Labour Force Sample Survey 2022
ANNEXED NOTE
- Technical Notes and Definitions
The data is taken from Labour Force Survey 2022 (yearly synthesis)
Sampling frame: Population Census 2020.
Sample size: 65,253 persons, in 10,560 households: 1- Qatari households; 2- Non-Qatari regular (non-collective) households; 3- Non-Qatari small collective households or labour gatherings (2 – 6 persons); 4- Non-Qatari large collective households or large labour gatherings (7 persons or more).
The collective households are a group of persons not related to each other and sharing living conditions in a residential unit, i.e. labour camps, students living boarding schools, nurses in hospitals… etc. The survey covered the small collective households (includes less than 7 persons) and large collective households (includes 7 persons or more).
Data collection: The sample was divided into equal parts to collect data monthly. Each month 1/3 of the quarterly data were collected during the first two weeks of the month.
Reference period for the labour force data: the week prior to data collection day.
The survey did not cover short periods accommodation, i.e. hotels.
Unemployed:
All persons aged 15 years and over who were, during the week preceding the survey, without work and were willing to work and looking seriously for work.
First time unemployed: persons who never worked previously and were during the week preceding the survey looking actively for work.
Unemployed who previously worked: persons with previous experience work and during the week preceding the survey were actively looking for work.
Education level: highest level completed.
Classification used: the Directory of Standard Classification of Education, based on UNESCO’s International Standard Classification of Education (ISCED).
Information was coded at the five-digit level and tabulated at the broad level only.
- Institution which provides data:
Planning and Statistics Authority
https://www.psa.gov.qa/en/Pages/default.aspx
- Data availability:
Labour Force Surveys (yearly and quarterly data) can be downloaded from PSA’s website, in PDF and Excel format:
https://www.psa.gov.qa/en/statistics1/pages/topicslisting.aspx?parent=Social&child=LaborForce
Last date of access: November 2023.
GLMM and GRC cannot guarantee that the link to access the source will not change; that the information will not be removed from the website it was obtained from; that no geo-blockages will be imposed; or that the information will not be available for any another reason.
Keywords: Qatar, Labour Market, Unemployment, National & Foreign Labour, Education
| |
Qataris |
Non-Qataris |
Total |
| |
Males |
Females |
Total |
Males |
Females |
Total |
Males |
Females |
Total |
| Housewife |
0 |
27,471 |
27,471 |
0 |
107,445 |
107,445 |
0 |
134,916 |
134,916 |
| Student |
22,337 |
28,478 |
50,815 |
44,753 |
43,473 |
88,226 |
67,090 |
71,951 |
139,041 |
| Disabled |
1,471 |
1,136 |
2,607 |
686 |
1,031 |
1,717 |
2,157 |
2,167 |
4,324 |
| Retired |
11,442 |
6,916 |
18,358 |
0 |
0 |
0 |
11,442 |
6,916 |
18,358 |
| Other |
1,754 |
1,073 |
2,827 |
4,656 |
2,537 |
7,193 |
6,410 |
3,610 |
10,020 |
| Total |
37,004 |
65,074 |
102,078 |
50,095 |
154,486 |
204,581 |
87,099 |
219,560 |
306,659 |
Source: Annual Bulletin of Labour Force Sample Survey 2022
ANNEXED NOTE
- Technical Notes and Definitions
The data is taken from Labour Force Survey 2022 (yearly synthesis)
Sampling frame: Population Census 2020.
Sample size: 65,253 persons, in 10,560 households: 1- Qatari households; 2- Non-Qatari regular (non-collective) households; 3- Non-Qatari small collective households or labour gatherings (2 – 6 persons); 4- Non-Qatari large collective households or large labour gatherings (7 persons or more).
The collective households are a group of persons not related to each other and sharing living conditions in a residential unit, i.e. labour camps, students living boarding schools, nurses in hospitals… etc. The survey covered the small collective households (includes less than 7 persons) and large collective households (includes 7 persons or more).
Data collection: The sample was divided into equal parts to collect data monthly. Each month 1/3 of the quarterly data were collected during the first two weeks of the month.
Reference period for the labour force data: the week prior to data collection day.
The survey did not cover short periods accommodation, i.e. hotels.
Economically inactive population (outside the labour force)
Individuals aged 15 years and above who are not included in the labour force (as employed or unemployed) and do not supply labour needed to produce economic goods or services, as they are not working, not looking for work, unable to work or not willing to join the labour force during the period of reference. Inactives can be students, homemakers, pensioners who are unable to work, individuals who are unable to work, who do not want or seek work, and others who are not working for other reasons.
- Institution which provides data
Planning and Statistics Authority
https://www.psa.gov.qa/en/Pages/default.aspx
- Data availability
Labour Force Surveys (yearly and quarterly data) can be downloaded from PSA’s website, in PDF and Excel format:
https://www.psa.gov.qa/en/statistics1/pages/topicslisting.aspx?parent=Social&child=LaborForce
Last date of access: December 2023.
GLMM and GRC cannot guarantee that the link to access the source will not change; that the information will not be removed from the website it was obtained from; that no geo-blockages will be imposed; or that the information will not be available for any another reason.
Keywords: Qatar, Living Conditions, Family Reunification, Foreign & National Populations
| |
Qataris |
Non-Qataris |
Total |
| |
Males |
Females |
Total |
Males |
Females |
Total |
Males |
Females |
Total |
| Illiterate |
387 |
1,722 |
2,109 |
242 |
844 |
1,086 |
629 |
2,566 |
3,195 |
| Read & write |
2,021 |
4,889 |
6,910 |
729 |
14,636 |
15,365 |
2,750 |
19,525 |
22,275 |
| Primary |
2,702 |
6,165 |
8,867 |
8,381 |
17,838 |
26,219 |
11,083 |
24,003 |
35,086 |
| Preparatory |
14,483 |
18,826 |
33,309 |
17,880 |
25,130 |
43,010 |
32,363 |
43,956 |
76,319 |
| Secondary |
12,406 |
16,664 |
29,070 |
18,379 |
40,647 |
59,026 |
30,785 |
57,311 |
88,096 |
| Diploma |
47 |
551 |
598 |
585 |
6,301 |
6,886 |
632 |
6,852 |
7,484 |
| University and above |
4,958 |
16,257 |
21,215 |
3,899 |
49,090 |
52,989 |
8,857 |
65,347 |
74,204 |
| Total |
37,004 |
65,074 |
102,078 |
50,095 |
154,486 |
204,581 |
87,099 |
219,560 |
306,659 |
Source: Annual Bulletin of Labour Force Sample Survey 2022
ANNEXED NOTE
- Technical Notes and Definitions
The data is taken from Labour Force Survey 2022 (yearly synthesis)
Sampling frame: Population Census 2020.
Sample size: 65,253 persons, in 10,560 households: 1- Qatari households; 2- Non-Qatari regular (non-collective) households; 3- Non-Qatari small collective households or labour gatherings (2 – 6 persons); 4- Non-Qatari large collective households or large labour gatherings (7 persons or more).
The collective households are a group of persons not related to each other and sharing living conditions in a residential unit, I.e. labour camps, students living boarding schools, nurses in hospitals… etc. The survey covered the small collective households (includes less than 7 persons) and large collective households (includes 7 persons or more).
Data collection: The sample was divided into equal parts to collect data monthly. Each month 1/3 of the quarterly data were collected during the first two weeks of the month.
Reference period for the labour force data: the week prior to data collection day.
The survey did not cover short periods accommodation, i.e. hotels.
Economically inactive population (outside the labour force)
Individuals aged 15 years and above who are not included in the labour force (as employed or unemployed) and do not supply labour needed to produce economic goods or services, as they are not working, not looking for work, unable to work or not willing to join the labour force during the period of reference.
Inactives can be students, homemakers, pensioners who are unable to work, individuals who are unable to work, who do not want or seek work, and others who are not working for other reasons.
Education level: highest level completed.
Classification used: the Directory of Standard Classification of Education, based on UNESCO’s International Standard Classification of Education (ISCED).
Information was coded at the five-digit level and tabulated at the broad level only.
- Institution which provides data
Planning and Statistics Authority
https://www.psa.gov.qa/en/Pages/default.aspx
- Data availability
Labour Force Surveys (yearly and quarterly data) can be downloaded from PSA’s website, in PDF and Excel format:
https://www.psa.gov.qa/en/statistics1/pages/topicslisting.aspx?parent=Social&child=LaborForce
Last date of access: December 2023.
GLMM and GRC cannot guarantee that the link to access the source will not change; that the information will not be removed from the website it was obtained from; that no geo-blockages will be imposed; or that the information will not be available for any another reason.
Keywords: Qatar, Living Conditions, Family Reunification, Education, Foreign & National Populations
| Country |
Nationals |
Foreign nationals |
% nationals |
% foreign nationals |
| Males |
Females |
Males |
Females |
Males |
Females |
Males |
Females |
| Bahrain |
361,587 |
352,424 |
585,450 |
225,232 |
38.2 |
61.0 |
61.8 |
39.0 |
| Kuwait |
736,938 |
765,958 |
2,065,224 |
1,021,523 |
26.3 |
42.9 |
73.7 |
57.1 |
| Oman |
1,428,177 |
1,407,687 |
1,483,716 |
411,068 |
49.0 |
77.4 |
51.0 |
22.6 |
| Qatar |
173,653* |
175,186* |
1,891,963* |
637,399* |
8.4** |
21.6** |
91.6** |
78.4** |
| Saudi Arabia |
9,434,131 |
9,358,131 |
10,244,464 |
3,138,498 |
47.9 |
74.9 |
52.1 |
25.1 |
| UAE |
NA |
NA |
NA |
NA |
NA |
NA |
NA |
NA |
| Source: National institutes of statistics and GLMM’s estimates based on data published by National |
| Statistical Institutes (see below). |
|
|
|
|
|
|
| * GLMM’s estimate, based on data published by National Statistical Institutes (see below). |
|
| ** Ratio is calculated on the basis of population estimates (see below). |
|
|
1- Definition:
Non-nationals are:
1- persons bearing nationality of a foreign State other than the GCC State of residence, or bearing no proof of nationality from any given state (stateless persons and holders of refugee status and travel document in a third country);
2- Holders of residence permit residing in the given GCC country at date of census, as per definition of residence used in each of the countries.
Figures by nationality for Qatar are author’s estimates.
2- Sources of data:
(1) Bahrain: Bahrain Open Data Portal, “Population” section,
https://www.data.gov.bh/pages/homepage/
Source: administrative records (central Population Register)
(2) Kuwait: Central Bureau of Statistics
https://www.csb.gov.kw/default_en
“Population” statistics, 01-01-2022 and 01-01-2023
The population estimates are based on the results of census 2021.
Kuwait population estimates: based on natural increase (births-deaths), and number of naturalisations during past year.
Non-Kuwaiti population estimates: based on natural increase, and on net migration (entries-exits) (Ministry of Interior data) recorded during the past year.
Source of births and deaths data: the Public Authority for Civil Information (PACI) (inaccessible from outside Kuwait as of December 2023).
The figure for mid-2022 (average of the two figures for 01 January) was calculated by the author.
(3) Oman: National Centre for Statistical Information (NCSI), census 2020 portal
https://portal.ecensus.gov.om/ecen-portal/
Dataset “Population”, updated figures for 01-01-2022 and 01-01-2023.
location of report: public/Census_reports/Public_Datasets/public_population_en.xanalyzer
The figure for mid-2022 (average of the two end-of-year figures) was calculated by the author.
(4) Qatar: Total figures of Qataris and non-Qataris residing in Qatar are not readily available in any published source. The present figures are GLMM’s estimates, using:
- Qatar Planning and Statistics Authority. The Annual Bulletin of the Labour Force Survey 2022
https://www.psa.gov.qa/en/statistics/Statistical%20Releases/Social/LaborForce/2020/LF_Q2_2020_AE.xlsx
which gave:
- the numbers of Qataris and foreigners aged 15 and above for 2022;
- The total resident population in Qatar.
- Qatar Planning and Statistics Authority. Woman and Man in the State of Qatar-A Statistical Profile, 2022,
https://www.psa.gov.qa/en/statistics/Statistical%20Releases/Social/GenrealSocialStatistics/MenWomenProfile/2022/Woman_Man_2022_EN.pdf
which gave:
- the sex ratio of the total population by nationality
- the percentage distribution of population by broad age group for mid-2021, by sex and nationality
(last available data on total national and foreign populations’ age structure, as of December 2023)
These were used to estimate the total population by sex and nationality.
(5) Saudi Arabia: General Authority for Statistics (GAStat) Statistical database, census 2022, Population estimates.
Report name: Population estimates by gender, nationality, and region 2010 – 2022
https://database.stats.gov.sa/home/report/3868
Indicator Definition: KSA Population revised and backcasted with 2022 census population as a base and historical administrative data applied.
Methodology:
https://portal.saudicensus.sa/static-assets/media/content/20230529_Back-Casting%20Methodology.pdf?crafterSite=gastat-portal
(6) UAE: No figures of total (non-disaggregated) population available for 2022, as of December 2023;
Figures of UAE population disaggregated by nationality are unavailable in published sources. For estimates relevant to earlier years, please visit GLMM’s database:
https://gulfmigration.grc.net/glmm-database/demographic-and-economic-module/.
Last date of access: December 2023.
GLMM and GRC cannot guarantee that the link to access the source will not change; that the information will not be removed from the website it was obtained from; that no geo-blockages will be imposed; or that the information will not be available for any another reason.
Keywords: Bahrain, Oman, Kuwait, Saudi Arabia, Qatar, United Arab Emirates, Foreign & National Populations
| |
Legislators, Senior Officials and Managers |
Professionals |
Technicians and Associate Professionals |
Clerks |
Service Workers and Shop and Market Sales Workers |
Skilled Agricultural and Fishery Workers |
Craft and Related Trades Workers |
Plant and Machine Operators and Assemblers |
Elementary Occupations |
Total |
| Agriculture, forestry and fishing |
32 |
16 |
15 |
0 |
0 |
0 |
0 |
0 |
0 |
63 |
| Mining and quarrying |
1,096 |
3,124 |
782 |
1,038 |
77 |
0 |
204 |
266 |
46 |
6,633 |
| Manufacturing |
360 |
583 |
140 |
550 |
0 |
0 |
16 |
123 |
15 |
1,787 |
| Electricity, gas, steam and air conditioning supply |
250 |
766 |
517 |
623 |
0 |
0 |
124 |
0 |
93 |
2,373 |
| Water supply; sewerage, waste management and remediation activities |
32 |
203 |
47 |
310 |
0 |
0 |
0 |
0 |
0 |
592 |
| Construction |
768 |
422 |
110 |
345 |
0 |
0 |
62 |
15 |
0 |
1,722 |
| Wholesale and retail trade; repair of motor vehicles and motorcycles |
374 |
343 |
266 |
621 |
185 |
0 |
0 |
15 |
0 |
1,804 |
| Transportation and storage |
466 |
871 |
856 |
593 |
46 |
0 |
31 |
15 |
60 |
2,938 |
| Accommodation and food service activities |
174 |
378 |
331 |
608 |
30 |
0 |
0 |
48 |
0 |
1,569 |
| Information and communication |
312 |
1,360 |
1,048 |
763 |
15 |
0 |
30 |
0 |
16 |
3,544 |
| Financial and insurance activities |
839 |
1,949 |
312 |
1,724 |
0 |
0 |
0 |
32 |
16 |
4,872 |
| Real estate activities |
453 |
252 |
108 |
174 |
0 |
0 |
0 |
0 |
0 |
987 |
| Professional, scientific and technical activities |
154 |
186 |
63 |
186 |
0 |
0 |
0 |
0 |
0 |
589 |
| Administrative and support service activities |
188 |
405 |
285 |
347 |
0 |
0 |
0 |
0 |
0 |
1,225 |
| Public administration and defence; compulsory social security |
5,070 |
17,227 |
12,216 |
24,468 |
2,308 |
0 |
2,029 |
898 |
495 |
64,711 |
| Education |
1,217 |
8,285 |
1,167 |
2,825 |
568 |
0 |
16 |
16 |
128 |
14,222 |
| Human health and social work activities |
1,146 |
3,143 |
638 |
2,800 |
107 |
0 |
15 |
124 |
580 |
8,553 |
| Arts, entertainment and recreation |
279 |
968 |
276 |
580 |
15 |
0 |
31 |
0 |
31 |
2,180 |
| Other service activities |
16 |
78 |
0 |
63 |
0 |
0 |
0 |
0 |
0 |
157 |
| Activities of households as employers; undifferentiated goods- and services-producing activities of households for own use |
0 |
0 |
0 |
0 |
0 |
0 |
0 |
0 |
0 |
0 |
| Activities of extraterritorial organizations and bodies |
47 |
93 |
15 |
156 |
0 |
0 |
0 |
0 |
0 |
311 |
| Total |
13,273 |
40,652 |
19,192 |
38,774 |
3,351 |
0 |
2,558 |
1,552 |
1,480 |
120,832 |
Source: Annual Bulletin of Labour Force Sample Survey 2022
ANNEXED NOTE
- Technical Notes and Definitions
The data is taken from Labour Force Survey 2022 (yearly synthesis)
Sampling frame: Population Census 2020.
Sample size: 65,253 persons, in 10,560 households: 1- Qatari households; 2- Non-Qatari regular (non-collective) households; 3- Non-Qatari small collective households or labour gatherings (2 – 6 persons); 4- Non-Qatari large collective households or large labour gatherings (7 persons or more).
The collective households are a group of persons not related to each other and sharing living conditions in a residential unit, I.e. labour camps, students living in boarding schools, nurses in hospitals… etc. The survey covered the small collective households (includes less than 7 persons) and large collective households (includes 7 persons or more).
Data Collection: The sample was divided into equal parts to collect data monthly. Each month 1/3 of the quarterly data were collected during the first two weeks of the month.
Reference period for the labour force data: the week prior to data collection day.
The survey did not cover short periods accommodation, i.e. hotels.
The present data includes active population, i.e. employed and unemployed. It does not include persons seeking work for the first time
Classifications used: ISCO-88; ISIC Rev. 4.
- Institution which provides data
Planning and Statistics Authority
https://www.psa.gov.qa/en/Pages/default.aspx
- Data availability
Labour Force Surveys (yearly and quarterly data) can be downloaded from PSA’s website, in PDF and Excel format:
https://www.psa.gov.qa/en/statistics1/pages/topicslisting.aspx?parent=Social&child=LaborForce
Last date of access: November 2023.
GLMM and GRC cannot guarantee that the link to access the source will not change; that the information will not be removed from the website it was obtained from; that no geo-blockages will be imposed; or that the information will not be available for any another reason.
Keywords: Qatar, Labour Market, Employment, National & Foreign Labour, National Labour, Foreign Labour, Highly-Skilled Labour, Low-Skilled Labour
| |
Legislators, Senior Officials and Managers |
Professionals |
Technicians and Associate Professionals |
Clerks |
Service Workers and Shop and Market Sales Workers |
Skilled Agricultural and Fishery Workers |
Craft and Related Trades Workers |
Plant and Machine Operators and Assemblers |
Elementary Occupations |
Total |
| Agriculture, forestry and fishing |
32 |
16 |
15 |
0 |
0 |
0 |
0 |
0 |
0 |
63 |
| Mining and quarrying |
939 |
2,086 |
501 |
729 |
77 |
0 |
204 |
266 |
46 |
4,848 |
| Manufacturing |
345 |
456 |
125 |
503 |
0 |
0 |
16 |
123 |
15 |
1,583 |
| Electricity, gas, steam and air conditioning supply |
144 |
438 |
111 |
347 |
0 |
0 |
124 |
0 |
93 |
1,257 |
| Water supply; sewerage, waste management and remediation activities |
32 |
156 |
47 |
184 |
0 |
0 |
0 |
0 |
0 |
419 |
| Construction |
692 |
313 |
94 |
313 |
0 |
0 |
62 |
15 |
0 |
1,489 |
| Wholesale and retail trade; repair of motor vehicles and motorcycles |
327 |
78 |
156 |
215 |
185 |
0 |
0 |
15 |
0 |
976 |
| Transportation and storage |
246 |
329 |
560 |
234 |
16 |
0 |
31 |
15 |
45 |
1,476 |
| Accommodation and food service activities |
47 |
94 |
62 |
204 |
0 |
0 |
0 |
48 |
0 |
455 |
| Information and communication |
249 |
691 |
720 |
373 |
15 |
0 |
30 |
0 |
16 |
2,094 |
| Financial and insurance activities |
545 |
878 |
204 |
614 |
0 |
0 |
0 |
32 |
16 |
2,289 |
| Real estate activities |
359 |
79 |
77 |
31 |
0 |
0 |
0 |
0 |
0 |
546 |
| Professional, scientific and technical activities |
123 |
108 |
31 |
156 |
0 |
0 |
0 |
0 |
0 |
418 |
| Administrative and support service activities |
77 |
93 |
49 |
63 |
0 |
0 |
0 |
0 |
0 |
282 |
| Public administration and defence; compulsory social security |
4,130 |
9,161 |
10,163 |
17,335 |
2,092 |
0 |
2,029 |
898 |
495 |
46,303 |
| Education |
582 |
1,422 |
186 |
626 |
16 |
0 |
16 |
16 |
16 |
2,880 |
| Human health and social work activities |
660 |
929 |
190 |
1,054 |
16 |
0 |
15 |
124 |
311 |
3,299 |
| Arts, entertainment and recreation |
200 |
329 |
213 |
326 |
15 |
0 |
31 |
0 |
31 |
1,145 |
| Other service activities |
0 |
47 |
0 |
63 |
0 |
0 |
0 |
0 |
0 |
110 |
| Activities of households as employers; undifferentiated goods- and services-producing activities of households for own use |
0 |
0 |
0 |
0 |
0 |
0 |
0 |
0 |
0 |
0 |
| Activities of extraterritorial organizations and bodies |
47 |
77 |
15 |
77 |
0 |
0 |
0 |
0 |
0 |
216 |
| Total |
9,776 |
17,780 |
13,519 |
23,447 |
2,432 |
0 |
2,558 |
1,552 |
1,084 |
72,148 |
Source: Annual Bulletin of Labour Force Sample Survey 2022
ANNEXED NOTE
- Technical Notes and Definitions
The data is taken from Labour Force Survey 2022 (yearly synthesis)
Sampling frame: Population Census 2020.
Sample size: 65,253 persons, in 10,560 households: 1- Qatari households; 2- Non-Qatari regular (non-collective) households; 3- Non-Qatari small collective households or labour gatherings (2 – 6 persons); 4- Non-Qatari large collective households or large labour gatherings (7 persons or more).
The collective households are a group of persons not related to each other and sharing living conditions in a residential unit, I.e. labour camps, students living in boarding schools, nurses in hospitals… etc. The survey covered the small collective households (includes less than 7 persons) and large collective households (includes 7 persons or more).
Data Collection: The sample was divided into equal parts to collect data monthly. Each month 1/3 of the quarterly data were collected during the first two weeks of the month.
Reference period for the labour force data: the week prior to data collection day.
The survey did not cover short periods accommodation, i.e. hotels.
The present data includes active population, i.e. employed and unemployed. It does not include persons seeking work for the first time
Classifications used: ISCO-88; ISIC Rev. 4.
- Institution which provides data
Planning and Statistics Authority
https://www.psa.gov.qa/en/Pages/default.aspx
- Data availability
Labour Force Surveys (yearly and quarterly data) can be downloaded from PSA’s website, in PDF and Excel format:
https://www.psa.gov.qa/en/statistics1/pages/topicslisting.aspx?parent=Social&child=LaborForce
Last date of access: November 2023.
GLMM and GRC cannot guarantee that the link to access the source will not change; that the information will not be removed from the website it was obtained from; that no geo-blockages will be imposed; or that the information will not be available for any another reason.
Keywords: Qatar, Labour Market, Employment, National & Foreign Labour, National Labour, Foreign Labour, Highly-Skilled Labour, Low-Skilled Labour
| |
Legislators, Senior Officials and Managers |
Professionals |
Technicians and Associate Professionals |
Clerks |
Service Workers and Shop and Market Sales Workers |
Skilled Agricultural and Fishery Workers |
Craft and Related Trades Workers |
Plant and Machine Operators and Assemblers |
Elementary Occupations |
Total |
| Agriculture, forestry and fishing |
|
|
|
|
|
|
|
|
|
|
| Mining and quarrying |
157 |
1,038 |
281 |
309 |
0 |
0 |
0 |
0 |
0 |
1,785 |
| Manufacturing |
15 |
127 |
15 |
47 |
0 |
0 |
0 |
0 |
0 |
204 |
| Electricity, gas, steam and air conditioning supply |
106 |
328 |
406 |
276 |
0 |
0 |
0 |
0 |
0 |
1,116 |
| Water supply; sewerage, waste management and remediation activities |
0 |
47 |
0 |
126 |
0 |
0 |
0 |
0 |
0 |
173 |
| Construction |
76 |
109 |
16 |
32 |
0 |
0 |
0 |
0 |
0 |
233 |
| Wholesale and retail trade; repair of motor vehicles and motorcycles |
47 |
265 |
110 |
406 |
0 |
0 |
0 |
0 |
0 |
828 |
| Transportation and storage |
220 |
542 |
296 |
359 |
30 |
0 |
0 |
0 |
15 |
1,462 |
| Accommodation and food service activities |
127 |
284 |
269 |
404 |
30 |
0 |
0 |
0 |
0 |
1,114 |
| Information and communication |
63 |
669 |
328 |
390 |
0 |
0 |
0 |
0 |
0 |
1,450 |
| Financial and insurance activities |
294 |
1,071 |
108 |
1,110 |
0 |
0 |
0 |
0 |
0 |
2,583 |
| Real estate activities |
94 |
173 |
31 |
143 |
0 |
0 |
0 |
0 |
0 |
441 |
| Professional, scientific and technical activities |
31 |
78 |
32 |
30 |
0 |
0 |
0 |
0 |
0 |
171 |
| Administrative and support service activities |
111 |
312 |
236 |
284 |
0 |
0 |
0 |
0 |
0 |
943 |
| Public administration and defence; compulsory social security |
940 |
8,066 |
2,053 |
7,133 |
216 |
0 |
0 |
0 |
0 |
18,408 |
| Education |
635 |
6,863 |
981 |
2,199 |
552 |
0 |
0 |
0 |
112 |
11,342 |
| Human health and social work activities |
486 |
2,214 |
448 |
1,746 |
91 |
0 |
0 |
0 |
269 |
5,254 |
| Arts, entertainment and recreation |
79 |
639 |
63 |
254 |
0 |
0 |
0 |
0 |
0 |
1,035 |
| Other service activities |
16 |
31 |
0 |
0 |
0 |
0 |
0 |
0 |
0 |
47 |
| Activities of households as employers; undifferentiated goods- and services-producing activities of households for own use |
0 |
0 |
0 |
0 |
0 |
0 |
0 |
0 |
0 |
0 |
| Activities of extraterritorial organizations and bodies |
0 |
16 |
0 |
79 |
0 |
0 |
0 |
0 |
0 |
95 |
| Total |
3,497 |
22,872 |
5,673 |
15,327 |
919 |
0 |
0 |
0 |
396 |
48,684 |
Source: Annual Bulletin of Labour Force Sample Survey 2022
ANNEXED NOTE
- Technical Notes and Definitions
The data is taken from Labour Force Survey 2022 (yearly synthesis)
Sampling frame: Population Census 2020.
Sample size: 65,253 persons, in 10,560 households: 1- Qatari households; 2- Non-Qatari regular (non-collective) households; 3- Non-Qatari small collective households or labour gatherings (2 – 6 persons); 4- Non-Qatari large collective households or large labour gatherings (7 persons or more).
The collective households are a group of persons not related to each other and sharing living conditions in a residential unit, I.e. labour camps, students living in boarding schools, nurses in hospitals… etc. The survey covered the small collective households (includes less than 7 persons) and large collective households (includes 7 persons or more).
Data Collection: The sample was divided into equal parts to collect data monthly. Each month 1/3 of the quarterly data were collected during the first two weeks of the month.
Reference period for the labour force data: the week prior to data collection day.
The survey did not cover short periods accommodation, i.e. hotels.
The present data includes active population, i.e. employed and unemployed. It does not include persons seeking work for the first time
Classifications used: ISCO-88; ISIC Rev. 4.
- Institution which provides data
Planning and Statistics Authority
https://www.psa.gov.qa/en/Pages/default.aspx
- Data availability
Labour Force Surveys (yearly and quarterly data) can be downloaded from PSA’s website, in PDF and Excel format:
https://www.psa.gov.qa/en/statistics1/pages/topicslisting.aspx?parent=Social&child=LaborForce
Last date of access: November 2023.
GLMM and GRC cannot guarantee that the link to access the source will not change; that the information will not be removed from the website it was obtained from; that no geo-blockages will be imposed; or that the information will not be available for any another reason.
Keywords: Qatar, Labour Market, Employment, Female Employment, National & Foreign Labour, National Labour, Foreign Labour, Highly-Skilled Labour, Low-Skilled Labour
| |
Legislators, Senior Officials and Managers |
Professionals |
Technicians and Associate Professionals |
Clerks |
Service Workers and Shop and Market Sales Workers |
Skilled Agricultural and Fishery Workers |
Craft and Related Trades Workers |
Plant and Machine Operators and Assemblers |
Elementary Occupations |
Total |
| Agriculture, forestry and fishing |
425 |
259 |
299 |
514 |
314 |
29,913 |
1,850 |
2,729 |
590 |
36,893 |
| Mining and quarrying |
609 |
6,583 |
4,643 |
891 |
447 |
0 |
7,654 |
3,928 |
342 |
25,097 |
| Manufacturing |
2,710 |
6,367 |
10,722 |
6,439 |
4,775 |
203 |
48,251 |
17,985 |
6,522 |
103,974 |
| Electricity, gas, steam and air conditioning supply |
75 |
2,817 |
5,577 |
215 |
716 |
0 |
906 |
70 |
183 |
10,559 |
| Water supply; sewerage, waste management and remediation activities |
140 |
112 |
322 |
140 |
0 |
0 |
1,012 |
1,822 |
266 |
3,814 |
| Construction |
10,388 |
41,957 |
38,455 |
32,255 |
9,433 |
463 |
413,557 |
66,010 |
48,645 |
661,163 |
| Wholesale and retail trade; repair of motor vehicles and motorcycles |
13,423 |
16,707 |
28,187 |
17,489 |
57,879 |
0 |
37,115 |
31,554 |
19,414 |
221,768 |
| Transportation and storage |
2,046 |
12,217 |
12,536 |
8,270 |
12,540 |
0 |
5,542 |
64,833 |
7,021 |
125,005 |
| Accommodation and food service activities |
2,427 |
2,219 |
4,656 |
4,605 |
36,725 |
0 |
2,422 |
9,752 |
3,910 |
66,716 |
| Information and communication |
841 |
8,024 |
4,899 |
1,285 |
312 |
0 |
872 |
625 |
327 |
17,185 |
| Financial and insurance activities |
1,673 |
4,744 |
4,117 |
3,998 |
292 |
0 |
248 |
711 |
923 |
16,706 |
| Real estate activities |
399 |
2,819 |
4,595 |
2,861 |
196 |
0 |
3,530 |
1,639 |
2,369 |
18,408 |
| Professional, scientific and technical activities |
2,120 |
10,565 |
3,734 |
3,353 |
1,632 |
0 |
1,711 |
2,190 |
1,114 |
26,419 |
| Administrative and support service activities |
1,950 |
5,649 |
8,791 |
6,216 |
8,422 |
215 |
15,594 |
13,913 |
100,191 |
160,941 |
| Public administration and defence; compulsory social security |
0 |
13,789 |
3,833 |
16,268 |
2,975 |
0 |
2,732 |
397 |
2,590 |
42,584 |
| Education |
608 |
16,206 |
4,068 |
1,765 |
1,429 |
0 |
481 |
3,385 |
1,504 |
29,446 |
| Human health and social work activities |
738 |
29,889 |
6,342 |
5,179 |
1,822 |
0 |
949 |
2,298 |
2,280 |
49,497 |
| Arts, entertainment and recreation |
394 |
1,682 |
2,576 |
690 |
880 |
531 |
0 |
609 |
1,010 |
8,372 |
| Other service activities |
70 |
1,571 |
2,702 |
491 |
1,227 |
0 |
224 |
495 |
2,541 |
9,321 |
| Activities of households as employers; undifferentiated goods- and services-producing activities of households for own use |
0 |
76 |
32 |
139 |
6,283 |
0 |
43 |
56,450 |
3,727 |
66,750 |
| Activities of extraterritorial organizations and bodies |
140 |
1,609 |
655 |
1,515 |
28 |
0 |
0 |
731 |
0 |
4,678 |
| Total |
41,176 |
185,861 |
151,741 |
114,578 |
148,327 |
31,325 |
544,693 |
282,126 |
205,469 |
1,705,296 |
Source: Annual Bulletin of Labour Force Sample Survey 2022
ANNEXED NOTE
- Technical Notes and Definitions
The data is taken from Labour Force Survey 2022 (yearly synthesis)
Sampling frame: Population Census 2020.
Sample size: 65,253 persons, in 10,560 households: 1- Qatari households; 2- Non-Qatari regular (non-collective) households; 3- Non-Qatari small collective households or labour gatherings (2 – 6 persons); 4- Non-Qatari large collective households or large labour gatherings (7 persons or more).
The collective households are a group of persons not related to each other and sharing living conditions in a residential unit, I.e. labour camps, students living in boarding schools, nurses in hospitals… etc. The survey covered the small collective households (includes less than 7 persons) and large collective households (includes 7 persons or more).
Data Collection: The sample was divided into equal parts to collect data monthly. Each month 1/3 of the quarterly data were collected during the first two weeks of the month.
Reference period for the labour force data: the week prior to data collection day.
The survey did not cover short periods accommodation, i.e. hotels.
The present data includes active population, i.e. employed and unemployed. It does not include persons seeking work for the first time
Classifications used: ISCO-88; ISIC Rev. 4.
- Institution which provides data
Planning and Statistics Authority
https://www.psa.gov.qa/en/Pages/default.aspx
- Data availability
Labour Force Surveys (yearly and quarterly data) can be downloaded from PSA’s website, in PDF and Excel format:
https://www.psa.gov.qa/en/statistics1/pages/topicslisting.aspx?parent=Social&child=LaborForce
Last date of access: November 2023.
GLMM and GRC cannot guarantee that the link to access the source will not change; that the information will not be removed from the website it was obtained from; that no geo-blockages will be imposed; or that the information will not be available for any another reason.
Keywords: Qatar, Labour Market, Employment, National & Foreign Labour, National Labour, Foreign Labour, Highly-Skilled Labour, Low-Skilled Labour
| |
Legislators, Senior Officials and Managers |
Professionals |
Technicians and Associate Professionals |
Clerks |
Service Workers and Shop and Market Sales Workers |
Skilled Agricultural and Fishery Workers |
Craft and Related Trades Workers |
Plant and Machine Operators and Assemblers |
Elementary Occupations |
Total |
| Agriculture, forestry and fishing |
0 |
0 |
0 |
0 |
0 |
0 |
0 |
0 |
0 |
0 |
| Mining and quarrying |
70 |
1,064 |
770 |
521 |
0 |
0 |
0 |
0 |
0 |
2,425 |
| Manufacturing |
150 |
730 |
98 |
337 |
665 |
0 |
70 |
0 |
0 |
2,050 |
| Electricity, gas, steam and air conditioning supply |
0 |
817 |
0 |
785 |
0 |
0 |
0 |
0 |
0 |
1,602 |
| Water supply; sewerage, waste management and remediation activities |
0 |
0 |
0 |
140 |
0 |
0 |
0 |
0 |
0 |
140 |
| Construction |
70 |
2,356 |
1,816 |
1,437 |
1,135 |
0 |
0 |
0 |
75 |
6,889 |
| Wholesale and retail trade; repair of motor vehicles and motorcycles |
430 |
1,346 |
622 |
3,423 |
19,124 |
0 |
0 |
0 |
0 |
24,945 |
| Transportation and storage |
248 |
1,596 |
1,067 |
3,895 |
6,754 |
0 |
0 |
56 |
462 |
14,078 |
| Accommodation and food service activities |
795 |
225 |
650 |
4,051 |
14,618 |
0 |
56 |
0 |
1,282 |
21,677 |
| Information and communication |
70 |
1,939 |
725 |
494 |
70 |
0 |
0 |
0 |
505 |
3,803 |
| Financial and insurance activities |
285 |
2,102 |
1,096 |
970 |
0 |
0 |
0 |
0 |
70 |
4,523 |
| Real estate activities |
70 |
401 |
327 |
570 |
145 |
0 |
0 |
0 |
70 |
1,583 |
| Professional, scientific and technical activities |
453 |
3,593 |
600 |
1,284 |
28 |
0 |
30 |
0 |
0 |
5,988 |
| Administrative and support service activities |
635 |
5,147 |
10,372 |
7,881 |
70 |
0 |
28 |
0 |
4,476 |
28,609 |
| Public administration and defence; compulsory social security |
0 |
2,280 |
720 |
1,663 |
445 |
0 |
0 |
0 |
0 |
5,108 |
| Education |
715 |
23,277 |
2,581 |
1,670 |
2,164 |
0 |
28 |
0 |
0 |
30,435 |
| Human health and social work activities |
210 |
28,939 |
6,836 |
3,038 |
416 |
0 |
0 |
0 |
230 |
39,669 |
| Arts, entertainment and recreation |
70 |
365 |
593 |
1,199 |
28 |
0 |
112 |
0 |
75 |
2,442 |
| Other service activities |
70 |
58 |
75 |
30 |
3,949 |
0 |
0 |
0 |
0 |
4,182 |
| Activities of households as employers; undifferentiated goods- and services-producing activities of households for own use |
0 |
878 |
883 |
0 |
10,583 |
0 |
0 |
438 |
89,094 |
101,876 |
| Activities of extraterritorial organizations and bodies |
210 |
1,280 |
194 |
520 |
0 |
0 |
0 |
0 |
0 |
2,204 |
| Total |
4,551 |
78,393 |
30,025 |
33,908 |
60,194 |
0 |
324 |
494 |
96,339 |
304,228 |
Source: Annual Bulletin of Labour Force Sample Survey 2022
ANNEXED NOTE
- Technical Notes and Definitions
The data is taken from Labour Force Survey 2022 (yearly synthesis)
Sampling frame: Population Census 2020.
Sample size: 65,253 persons, in 10,560 households: 1- Qatari households; 2- Non-Qatari regular (non-collective) households; 3- Non-Qatari small collective households or labour gatherings (2 – 6 persons); 4- Non-Qatari large collective households or large labour gatherings (7 persons or more).
The collective households are a group of persons not related to each other and sharing living conditions in a residential unit, I.e. labour camps, students living in boarding schools, nurses in hospitals… etc. The survey covered the small collective households (includes less than 7 persons) and large collective households (includes 7 persons or more).
Data Collection: The sample was divided into equal parts to collect data monthly. Each month 1/3 of the quarterly data were collected during the first two weeks of the month.
Reference period for the labour force data: the week prior to data collection day.
The survey did not cover short periods accommodation, i.e. hotels.
The present data includes active population, i.e. employed and unemployed. It does not include persons seeking work for the first time
Classifications used: ISCO-88; ISIC Rev. 4.
- Institution which provides data
Planning and Statistics Authority
https://www.psa.gov.qa/en/Pages/default.aspx
- Data availability
Labour Force Surveys (yearly and quarterly data) can be downloaded from PSA’s website, in PDF and Excel format:
https://www.psa.gov.qa/en/statistics1/pages/topicslisting.aspx?parent=Social&child=LaborForce
Last date of access: November 2023.
GLMM and GRC cannot guarantee that the link to access the source will not change; that the information will not be removed from the website it was obtained from; that no geo-blockages will be imposed; or that the information will not be available for any another reason.
Keywords: Qatar, Labour Market, Employment, Female Employment, National & Foreign Labour, National Labour, Foreign Labour, Highly-Skilled Labour, Low-Skilled Labour
|
Qataris |
Non-Qataris |
| Males |
Females |
Total |
Males |
Females |
Total |
|
Number of employees |
Average work hours |
Number of employees |
Average work hours |
Number of employees |
Average work hours |
Number of employees |
Average work hours |
Number of employees |
Average work hours |
Number of employees |
Average work hours |
| Legislators, Senior Officials and Managers |
9,341 |
38 |
3,481 |
37 |
12,822 |
38 |
40,601 |
46 |
4,481 |
43 |
45,082 |
45 |
| Professionals |
17,544 |
38 |
22,297 |
37 |
39,841 |
37 |
183,581 |
43 |
77,010 |
40 |
260,591 |
42 |
| Technicians and Associate Professionals |
13,443 |
38 |
5,500 |
37 |
18,943 |
38 |
150,380 |
46 |
29,922 |
40 |
180,302 |
45 |
| Clerks |
23,385 |
38 |
14,982 |
37 |
38,367 |
38 |
112,930 |
45 |
33,763 |
42 |
146,693 |
44 |
| Service Workers and Shop and Market Sales Workers |
2,244 |
38 |
841 |
37 |
3,085 |
38 |
145,279 |
49 |
59,703 |
45 |
204,982 |
48 |
| Skilled Agricultural and Fishery Workers |
0 |
0 |
0 |
0 |
0 |
0 |
31,017 |
50 |
0 |
0 |
31,017 |
50 |
| Craft and Related Trades Workers |
2,558 |
38 |
0 |
0 |
2,558 |
38 |
535,367 |
51 |
324 |
50 |
535,691 |
51 |
| Plant and Machine Operators and Assemblers |
1,520 |
39 |
0 |
0 |
1,520 |
39 |
277,037 |
50 |
494 |
51 |
277,531 |
50 |
| Elementary Occupations |
1,068 |
38 |
380 |
38 |
1,448 |
38 |
201,761 |
51 |
95,499 |
50 |
297,260 |
50 |
| Total |
71,103 |
38 |
47,481 |
37 |
118,584 |
38 |
1,677,953 |
49 |
301,196 |
47 |
1,979,149 |
48 |
Source: Annual Bulletin of Labour Force Sample Survey 2022
ANNEXED NOTE
- Technical Notes and Definitions
The data is taken from Labour Force Survey 2022 (yearly synthesis)
Sampling frame: Population Census 2020.
Sample size: 65,253 persons, in 10,560 households: 1- Qatari households; 2- Non-Qatari regular (non-collective) households; 3- Non-Qatari small collective households or labour gatherings (2 – 6 persons); 4- Non-Qatari large collective households or large labour gatherings (7 persons or more).
The collective households are a group of persons not related to each other and sharing living conditions in a residential unit, I.e. labour camps, students living in boarding schools, nurses in hospitals… etc. The survey covered the small collective households (includes less than 7 persons) and large collective households (includes 7 persons or more).
Data Collection: The sample was divided into equal parts to collect data monthly. Each month 1/3 of the quarterly data were collected during the first two weeks of the month.
Reference period for the labour force data: the week prior to data collection day.
The survey did not cover short periods accommodation, i.e. hotels.
The present data does not include employed workers temporarily absent from work.
Hours worked during survey week: The number of hours actually worked during the survey week, including normal scheduled hours and additional hours (overtime). “Average hours worked” is the average over all persons at work.
- Institution which provides data
Planning and Statistics Authority
https://www.psa.gov.qa/en/Pages/default.aspx
- Data availability
Labour Force Surveys (yearly and quarterly data) can be downloaded from PSA’s website, in PDF and Excel format:
https://www.psa.gov.qa/en/statistics1/pages/topicslisting.aspx?parent=Social&child=LaborForce
Last date of access: November 2023.
GLMM and GRC cannot guarantee that the link to access the source will not change; that the information will not be removed from the website it was obtained from; that no geo-blockages will be imposed; or that the information will not be available for any another reason.
Keywords: Qatar, Labour Market, Employment, Female Employment, National & Foreign Labour, National Labour, Foreign Labour, Work Conditions
| |
Qataris |
Non-Qataris |
Total |
| |
Males |
Females |
Total |
Males |
Females |
Total |
Males |
Females |
Total |
| Employer |
2,780 |
157 |
2,937 |
3,267 |
355 |
3,622 |
6,047 |
512 |
6,559 |
| Own account worker |
92 |
0 |
92 |
885 |
75 |
960 |
977 |
75 |
1,052 |
| Employee |
69,276 |
48,527 |
117,803 |
1,701,144 |
303,798 |
2,004,942 |
1,770,420 |
352,325 |
2,122,745 |
| Total |
72,148 |
48,684 |
120,832 |
1,705,296 |
304,228 |
2,009,524 |
1,777,444 |
352,912 |
2,130,356 |
Source: Annual Bulletin of Labour Force Sample Survey 2022
ANNEXED NOTE
- Technical Notes and Definitions
The data is taken from Labour Force Survey 2022 (yearly synthesis)
Sampling frame: Population Census 2020.
Sample size: 65,253 persons, in 10,560 households: 1- Qatari households; 2- Non-Qatari regular (non-collective) households; 3- Non-Qatari small collective households or labour gatherings (2 – 6 persons); 4- Non-Qatari large collective households or large labour gatherings (7 persons or more).
The collective households are a group of persons not related to each other and sharing living conditions in a residential unit, I.e. labour camps, students living in boarding schools, nurses in hospitals… etc. The survey covered the small collective households (includes less than 7 persons) and large collective households (includes 7 persons or more).
Data Collection: The sample was divided into equal parts to collect data monthly. Each month 1/3 of the quarterly data were collected during the first two weeks of the month.
Reference period for the labour force data: the week prior to data collection day.
The survey did not cover short periods accommodation, i.e. hotels.
The present data includes active population, i.e. employed and unemployed. It does not include persons seeking work for the first time.
Classification used: The International Classification of Status in Employment (ICSE)
- a) Employers are those workers who, working on their own account or with one or a few partners, hold the type of job defined as a “self-employment” and have engaged one or more persons to work for them in their business as “employees”.
- b) Own-account workers are those workers who, working on their own account or with one or more partners, hold the type of job defined as a “self-employment”, and have not engaged on a continuous basis any “employees”.
- c) Employees are all those workers who hold the type of job defined as “paid employment”.
- Institution which provides data
Planning and Statistics Authority
https://www.psa.gov.qa/en/Pages/default.aspx
- Data availability
Labour Force Surveys (yearly and quarterly data) can be downloaded from PSA’s website, in PDF and Excel format:
https://www.psa.gov.qa/en/statistics1/pages/topicslisting.aspx?parent=Social&child=LaborForce
Last date of access: November 2023.
GLMM and GRC cannot guarantee that the link to access the source will not change; that the information will not be removed from the website it was obtained from; that no geo-blockages will be imposed; or that the information will not be available for any another reason.
Keywords: Qatar, Labour Market, Employment, Female Employment, National & Foreign Labour, National Labour, Foreign Labour
| |
Legislators, Senior Officials and Managers |
Professionals |
Technicians and Associate Professionals |
Clerks |
Service Workers and Shop and Market Sales Workers |
Skilled Agricultural and Fishery Workers |
Craft and Related Trades Workers |
Plant and Machine Operators and Assemblers |
Elementary Occupations |
Total |
| Agriculture, forestry and fishing |
425 |
259 |
299 |
514 |
314 |
29,913 |
1,850 |
2,729 |
590 |
36,893 |
| Mining and quarrying |
679 |
7,647 |
5,413 |
1,412 |
447 |
0 |
7,654 |
3,928 |
342 |
27,522 |
| Manufacturing |
2,860 |
7,097 |
10,820 |
6,776 |
5,440 |
203 |
48,321 |
17,985 |
6,522 |
106,024 |
| Electricity, gas, steam and air conditioning supply |
75 |
3,634 |
5,577 |
1,000 |
716 |
0 |
906 |
70 |
183 |
12,161 |
| Water supply; sewerage, waste management and remediation activities |
140 |
112 |
322 |
280 |
0 |
0 |
1,012 |
1,822 |
266 |
3,954 |
| Construction |
10,458 |
44,313 |
40,271 |
33,692 |
10,568 |
463 |
413,557 |
66,010 |
48,720 |
668,052 |
| Wholesale and retail trade; repair of motor vehicles and motorcycles |
13,853 |
18,053 |
28,809 |
20,912 |
77,003 |
0 |
37,115 |
31,554 |
19,414 |
246,713 |
| Transportation and storage |
2,294 |
13,813 |
13,603 |
12,165 |
19,294 |
0 |
5,542 |
64,889 |
7,483 |
139,083 |
| Accommodation and food service activities |
3,222 |
2,444 |
5,306 |
8,656 |
51,343 |
0 |
2,478 |
9,752 |
5,192 |
88,393 |
| Information and communication |
911 |
9,963 |
5,624 |
1,779 |
382 |
0 |
872 |
625 |
832 |
20,988 |
| Financial and insurance activities |
1,958 |
6,846 |
5,213 |
4,968 |
292 |
0 |
248 |
711 |
993 |
21,229 |
| Real estate activities |
469 |
3,220 |
4,922 |
3,431 |
341 |
0 |
3,530 |
1,639 |
2,439 |
19,991 |
| Professional, scientific and technical activities |
2,573 |
14,158 |
4,334 |
4,637 |
1,660 |
0 |
1,741 |
2,190 |
1,114 |
32,407 |
| Administrative and support service activities |
2,585 |
10,796 |
19,163 |
14,097 |
8,492 |
215 |
15,622 |
13,913 |
104,667 |
189,550 |
| Public administration and defence; compulsory social security |
0 |
16,069 |
4,553 |
17,931 |
3,420 |
0 |
2,732 |
397 |
2,590 |
47,692 |
| Education |
1,323 |
39,483 |
6,649 |
3,435 |
3,593 |
0 |
509 |
3,385 |
1,504 |
59,881 |
| Human health and social work activities |
948 |
58,828 |
13,178 |
8,217 |
2,238 |
0 |
949 |
2,298 |
2,510 |
89,166 |
| Arts, entertainment and recreation |
464 |
2,047 |
3,169 |
1,889 |
908 |
531 |
112 |
609 |
1,085 |
10,814 |
| Other service activities |
140 |
1,629 |
2,777 |
521 |
5,176 |
0 |
224 |
495 |
2,541 |
13,503 |
| Activities of households as employers; undifferentiated goods- and services-producing activities of households for own use |
0 |
954 |
915 |
139 |
16,866 |
0 |
43 |
56,888 |
92,821 |
168,626 |
| Activities of extraterritorial organizations and bodies |
350 |
2,889 |
849 |
2,035 |
28 |
0 |
0 |
731 |
0 |
6,882 |
| Total |
45,727 |
264,254 |
181,766 |
148,486 |
208,521 |
31,325 |
545,017 |
282,620 |
301,808 |
2,009,524 |
Source: Annual Bulletin of Labour Force Sample Survey 2022
ANNEXED NOTE
- Technical Notes and Definitions
The data is taken from Labour Force Survey 2022 (yearly synthesis)
Sampling frame: Population Census 2020.
Sample size: 65,253 persons, in 10,560 households: 1- Qatari households; 2- Non-Qatari regular (non-collective) households; 3- Non-Qatari small collective households or labour gatherings (2 – 6 persons); 4- Non-Qatari large collective households or large labour gatherings (7 persons or more).
The collective households are a group of persons not related to each other and sharing living conditions in a residential unit, I.e. labour camps, students living in boarding schools, nurses in hospitals… etc. The survey covered the small collective households (includes less than 7 persons) and large collective households (includes 7 persons or more).
Data Collection: The sample was divided into equal parts to collect data monthly. Each month 1/3 of the quarterly data were collected during the first two weeks of the month.
Reference period for the labour force data: the week prior to data collection day.
The survey did not cover short periods accommodation, i.e. hotels.
The present data includes active population, i.e. employed and unemployed. It does not include persons seeking work for the first time
Classifications used: ISCO-88; ISIC Rev. 4.
- Institution which provides data
Planning and Statistics Authority
https://www.psa.gov.qa/en/Pages/default.aspx
- Data availability
Labour Force Surveys (yearly and quarterly data) can be downloaded from PSA’s website, in PDF and Excel format:
https://www.psa.gov.qa/en/statistics1/pages/topicslisting.aspx?parent=Social&child=LaborForce
Last date of access: November 2023.
GLMM and GRC cannot guarantee that the link to access the source will not change; that the information will not be removed from the website it was obtained from; that no geo-blockages will be imposed; or that the information will not be available for any another reason.
Keywords: Qatar, Labour Market, Employment, National & Foreign Labour, National Labour, Foreign Labour, Highly-Skilled Labour, Low-Skilled Labour
| |
Qataris |
Non-Qataris |
Total |
| |
Males |
Females |
Total |
Males |
Females |
Total |
Males |
Females |
Total |
| Illiterate |
0 |
0 |
0 |
14,209 |
31 |
14,240 |
14,209 |
31 |
14,240 |
| Read & Write |
217 |
124 |
341 |
162,599 |
15,279 |
177,878 |
162,816 |
15,403 |
178,219 |
| Literacy |
0 |
0 |
0 |
340 |
31 |
371 |
340 |
31 |
371 |
| Primary |
2,734 |
633 |
3,367 |
343,236 |
21,141 |
364,377 |
345,970 |
21,774 |
367,744 |
| Preparatory |
6,201 |
1,740 |
7,941 |
445,391 |
43,277 |
488,668 |
451,592 |
45,017 |
496,609 |
| Vocational Training |
0 |
0 |
0 |
4,911 |
129 |
5,040 |
4,911 |
129 |
5,040 |
| Secondary |
27,549 |
15,480 |
43,029 |
253,531 |
66,183 |
319,714 |
281,080 |
81,663 |
362,743 |
| Diploma |
1,142 |
139 |
1,281 |
81,093 |
13,619 |
94,712 |
82,235 |
13,758 |
95,993 |
| University |
29,053 |
27,281 |
56,334 |
371,737 |
123,725 |
495,462 |
400,790 |
151,006 |
551,796 |
| Higher Diploma |
1,463 |
891 |
2,354 |
4,367 |
5,933 |
10,300 |
5,830 |
6,824 |
12,654 |
| M.A / M.Sc. |
2,459 |
1,628 |
4,087 |
16,062 |
13,047 |
29,109 |
18,521 |
14,675 |
33,196 |
| Ph.D. |
1,330 |
768 |
2,098 |
7,820 |
1,833 |
9,653 |
9,150 |
2,601 |
11,751 |
| Total |
72,148 |
48,684 |
120,832 |
1,705,296 |
304,228 |
2,009,524 |
1,777,444 |
352,912 |
2,130,356 |
Source: Annual Bulletin of Labour Force Sample Survey 2022
ANNEXED NOTE
- Technical Notes and Definitions
The data is taken from Labour Force Survey 2022 (yearly synthesis)
Sampling frame: Population Census 2020.
Sample size: 65,253 persons, in 10,560 households: 1- Qatari households; 2- Non-Qatari regular (non-collective) households; 3- Non-Qatari small collective households or labour gatherings (2 – 6 persons); 4- Non-Qatari large collective households or large labour gatherings (7 persons or more).
The collective households are a group of persons not related to each other and sharing living conditions in a residential unit, i.e. labour camps, students living boarding schools, nurses in hospitals… etc. The survey covered the small collective households (includes less than 7 persons) and large collective households (includes 7 persons or more).
Data Collection: The sample was divided into equal parts to collect data monthly. Each month 1/3 of the quarterly data were collected during the first two weeks of the month.
Reference period for the labour force data: the week prior to data collection day.
The survey did not cover short periods accommodation, i.e. hotels.
The present data includes active population, i.e. employed and unemployed. It does not include persons seeking work for the first time.
Education level: highest level completed.
Classification used: the Directory of Standard Classification of Education, based on UNESCO’s International Standard Classification of Education (ISCED).
Information was coded at the five-digit level and tabulated at the broad level only.
- Institution which provides data
Planning and Statistics Authority
https://www.psa.gov.qa/en/Pages/default.aspx
- Data availability
Labour Force Surveys (yearly and quarterly data) can be downloaded from PSA’s website, in PDF and Excel format:
https://www.psa.gov.qa/en/statistics1/pages/topicslisting.aspx?parent=Social&child=LaborForce
Last date of access: November 2023.
GLMM and GRC cannot guarantee that the link to access the source will not change; that the information will not be removed from the website it was obtained from; that no geo-blockages will be imposed; or that the information will not be available for any another reason.
Keywords: Qatar, Labour Market, Employment, Female Employment, National & Foreign Labour, National Labour, Foreign Labour, Education
| |
Qataris |
Non-Qataris |
Total |
| |
Males |
Females |
Total |
Males |
Females |
Total |
Males |
Females |
Total |
| 15 – 19 |
685 |
31 |
716 |
3,935 |
4,490 |
8,425 |
4,620 |
4,521 |
9,141 |
| 20 – 24 |
9,970 |
2,882 |
12,852 |
128,456 |
44,403 |
172,859 |
138,426 |
47,285 |
185,711 |
| 25 – 29 |
12,355 |
9,942 |
22,297 |
226,568 |
29,524 |
256,092 |
238,923 |
39,466 |
278,389 |
| 30 – 34 |
12,130 |
8,794 |
20,924 |
429,003 |
97,050 |
526,053 |
441,133 |
105,844 |
546,977 |
| 35 – 39 |
10,300 |
9,457 |
19,757 |
327,265 |
34,267 |
361,532 |
337,565 |
43,724 |
381,289 |
| 40 – 44 |
5,353 |
6,088 |
11,441 |
265,537 |
49,170 |
314,707 |
270,890 |
55,258 |
326,148 |
| 45 – 49 |
9,438 |
5,912 |
15,350 |
123,609 |
21,614 |
145,223 |
133,047 |
27,526 |
160,573 |
| 50 – 54 |
5,101 |
2,453 |
7,554 |
120,759 |
14,398 |
135,157 |
125,860 |
16,851 |
142,711 |
| 55 – 59 |
4,776 |
2,736 |
7,512 |
45,685 |
5,912 |
51,597 |
50,461 |
8,648 |
59,109 |
| 60 – 64 |
1,318 |
248 |
1,566 |
24,741 |
2,610 |
27,351 |
26,059 |
2,858 |
28,917 |
| 65 + |
722 |
141 |
863 |
9,738 |
790 |
10,528 |
10,460 |
931 |
11,391 |
| Total |
72,148 |
48,684 |
120,832 |
1,705,296 |
304,228 |
2,009,524 |
1,777,444 |
352,912 |
2,130,356 |
Source: Annual Bulletin of Labour Force Sample Survey 2022
ANNEXED NOTE
- Technical Notes and Definitions
The data is taken from Labour Force Survey 2022 (yearly synthesis)
Sampling frame: Population Census 2020.
Sample size: 65,253 persons, in 10,560 households: 1- Qatari households; 2- Non-Qatari regular (non-collective) households; 3- Non-Qatari small collective households or labour gatherings (2 – 6 persons); 4- Non-Qatari large collective households or large labour gatherings (7 persons or more).
The collective households are a group of persons not related to each other and sharing living conditions in a residential unit, i.e., labour camps, students living boarding schools, nurses in hospitals… etc. The survey covered the small collective households (includes less than 7 persons) and large collective households (includes 7 persons or more).
Data Collection: The sample was divided into equal parts to collect data monthly. Each month 1/3 of the quarterly data were collected during the first two weeks of the month.
Reference period for the labour force data: the week prior to data collection day.
The survey did not cover short periods accommodation, i.e., hotels.
The present data includes active population, i.e., employed and unemployed. It does not include persons seeking work for the first time.
- Institution which provides data
Planning and Statistics Authority
https://www.psa.gov.qa/en/Pages/default.aspx
- Data availability
Labour Force Surveys (yearly and quarterly data) can be downloaded from PSA’s website, in PDF and Excel format:
https://www.psa.gov.qa/en/statistics1/pages/topicslisting.aspx?parent=Social&child=LaborForce
Last date of access: November 2023.
GLMM and GRC cannot guarantee that the link to access the source will not change; that the information will not be removed from the website it was obtained from; that no geo-blockages will be imposed; or that the information will not be available for any another reason.
Keywords: Qatar, Labour Market, Employment, Female Employment, National & Foreign Labour, National Labour, Foreign Labour
| |
Qataris |
Non-Qataris |
Total |
| |
Males |
Females |
Total |
Males |
Females |
Total |
Males |
Females |
Total |
| Government Department |
52,248 |
33,297 |
85,545 |
59,418 |
17,822 |
77,240 |
111,666 |
51,119 |
162,785 |
| Government Company/ Corporation |
7,795 |
6,345 |
14,140 |
45,351 |
17,989 |
63,340 |
53,146 |
24,334 |
77,480 |
| Mixed |
5,939 |
4,407 |
10,346 |
22,896 |
3,454 |
26,350 |
28,835 |
7,861 |
36,696 |
| Private |
5,666 |
4,262 |
9,928 |
1,504,757 |
160,528 |
1,665,285 |
1,510,423 |
164,790 |
1,675,213 |
Diplomatic/International/
Regional |
216 |
95 |
311 |
4,678 |
2,204 |
6,882 |
4,894 |
2,299 |
7,193 |
| Non-profit |
284 |
278 |
562 |
1,446 |
355 |
1,801 |
1,730 |
633 |
2,363 |
| Domestic |
0 |
0 |
0 |
66,750 |
101,876 |
168,626 |
66,750 |
101,876 |
168,626 |
| Total |
72,148 |
48,684 |
120,832 |
1,705,296 |
304,228 |
2,009,524 |
1,777,444 |
352,912 |
2,130,356 |
Source: Annual Bulletin of Labour Force Sample Survey 2022
ANNEXED NOTE
- Technical Notes and Definitions
The data is taken from Labour Force Survey 2022 (yearly synthesis)
Sampling frame: Population Census 2020.
Sample size: 65,253 persons, in 10,560 households: 1- Qatari households; 2- Non-Qatari regular (non-collective) households; 3- Non-Qatari small collective households or labour gatherings (2 – 6 persons); 4- Non-Qatari large collective households or large labour gatherings (7 persons or more).
The collective households are a group of persons not related to each other and sharing living conditions in a residential unit, i.e. labour camps, students living boarding schools, nurses in hospitals… etc. The survey covered the small collective households (includes less than 7 persons) and large collective households (includes 7 persons or more).
Data Collection: The sample was divided into equal parts to collect data monthly. Each month 1/3 of the quarterly data were collected during the first two weeks of the month.
Reference period for the labour force data: the week prior to data collection day.
The survey did not cover short periods accommodation, i.e. hotels.
The present data includes active population, i.e. employed and unemployed. It does not include persons seeking work for the first time.
Definition of activity sectors:
- a) Governmental department:
Government bodies engaged in administrative or service activities, such as ministries, public schools, public health centers, and hospitals.
- b) Government corporation/company:
Companies engaged in productive activities whose capital is entirely owned by government, such as Central Bank of Qatar, Qatar Petroleum.
- c) Private:
Establishments owned by individuals or a group of individuals either Qatari nationals or non-Qataris, whether natural or legal personalities.
- d) Mixed:
Establishments in which the government shares capital with another party, whether national (such as Qatar National Bank) or foreign (such as Gulf Air Corporation).
- e) Diplomatic/International/Regional:
Establishments engaged in diplomatic or consulate activities on behalf of other countries or those belonging to regional or international organizations.
- f) Domestic sector:
Includes all those working in a household for a salary, either males or females, such as housemaids, cooks, drivers, and gardeners.
- Institution which provides data
Planning and Statistics Authority
https://www.psa.gov.qa/en/Pages/default.aspx
- Data availability
Labour Force Surveys (yearly and quarterly data) can be downloaded from PSA’s website, in PDF and Excel format:
https://www.psa.gov.qa/en/statistics1/pages/topicslisting.aspx?parent=Social&child=LaborForce
Last date of access: November 2023.
GLMM and GRC cannot guarantee that the link to access the source will not change; that the information will not be removed from the website it was obtained from; that no geo-blockages will be imposed; or that the information will not be available for any another reason.
Keywords: Qatar, Labour Market, Employment, Female Employment, National & Foreign Labour, National Labour, Foreign Labour, Domestic Workers
| |
Qataris |
Non-Qataris |
Total |
| |
Males |
Females |
Total |
Males |
Females |
Total |
Males |
Females |
Total |
| Legislators, Senior Officials and Managers |
9,776 |
3,497 |
13,273 |
41,176 |
4,551 |
45,727 |
50,952 |
8,048 |
59,000 |
| Professionals |
17,780 |
22,872 |
40,652 |
185,861 |
78,393 |
264,254 |
203,641 |
101,265 |
304,906 |
| Technicians and Associate Professionals |
13,519 |
5,673 |
19,192 |
151,741 |
30,025 |
181,766 |
165,260 |
35,698 |
200,958 |
| Clerks |
23,447 |
15,327 |
38,774 |
114,578 |
33,908 |
148,486 |
138,025 |
49,235 |
187,260 |
| Service Workers and Shop and Market Sales Workers |
2,432 |
919 |
3,351 |
148,327 |
60,194 |
208,521 |
150,759 |
61,113 |
211,872 |
| Skilled Agricultural and Fishery Workers |
0 |
0 |
0 |
31,325 |
0 |
31,325 |
31,325 |
0 |
31,325 |
| Craft and Related Trades Workers |
2,558 |
0 |
2,558 |
544,693 |
324 |
545,017 |
547,251 |
324 |
547,575 |
| Plant and Machine Operators And Assemblers |
1,552 |
0 |
1,552 |
282,126 |
494 |
282,620 |
283,678 |
494 |
284,172 |
| Elementary Occupations |
1,084 |
396 |
1,480 |
205,469 |
96,339 |
301,808 |
206,553 |
96,735 |
303,288 |
| Total |
72,148 |
48,684 |
120,832 |
1,705,296 |
304,228 |
2,009,524 |
1,777,444 |
352,912 |
2,130,356 |
Source: Annual Bulletin of Labour Force Sample Survey 2022
ANNEXED NOTE
- Technical Notes and Definitions
The data is taken from Labour Force Survey 2022 (yearly synthesis)
Sampling frame: Population Census 2020.
Sample size: 65,253 persons, in 10,560 households: 1- Qatari households; 2- non-Qatari regular (non-collective) households; 3- Non-Qatari small collective households or labour gatherings (2 – 6 persons); 4- Non-Qatari large collective households or large labour gatherings (7 persons or more).
The collective households are a group of persons not related to each other and sharing living conditions in a residential unit, i.e. labour camps, students living in boarding schools, nurses in hospitals… etc. The survey covered the small collective households (includes less than 7 persons) and large collective households (includes 7 persons or more).
The survey did not cover short periods accommodation, i.e. hotels.
Data Collection: The sample was divided into equal parts to collect data monthly. Each month 1/3 of the quarterly data were collected during the first two weeks of the month.
Reference period for the labour force data: the week prior to data collection day.
Classification used: ISCO-88
The present data includes active population, i.e. employed and unemployed. It does not include persons seeking work for the first time.
- Institution which provides data
Planning and Statistics Authority
https://www.psa.gov.qa/en/Pages/default.aspx
- Data availability
Labour Force Surveys (yearly and quarterly data) can be downloaded from PSA’s website, in PDF and Excel format:
https://www.psa.gov.qa/en/statistics1/pages/topicslisting.aspx?parent=Social&child=LaborForce
Last date of access: October 2023.
GLMM and GRC cannot guarantee that the link to access the source will not change; that the information will not be removed from the website it was obtained from; that no geo-blockages will be imposed; or that the information will not be available for any another reason.
Keywords: Qatar, Labour Market, Employment, National & Foreign Labour, National Labour, Foreign Labour; Highly-Skilled Labour, Low-Skilled Labour
| |
Qataris |
Non-Qataris |
Total |
| |
Males |
Females |
Total |
Males |
Females |
Total |
Males |
Females |
Total |
| Agriculture, forestry and fishing |
63 |
0 |
63 |
36,893 |
0 |
36,893 |
36,956 |
0 |
36,956 |
| Mining and quarrying |
4,848 |
1,785 |
6,633 |
25,097 |
2,425 |
27,522 |
29,945 |
4,210 |
34,155 |
| Manufacturing |
1,583 |
204 |
1,787 |
103,974 |
2,050 |
106,024 |
105,557 |
2,254 |
107,811 |
| Electricity, gas, steam and air conditioning supply |
1,257 |
1,116 |
2,373 |
10,559 |
1,602 |
12,161 |
11,816 |
2,718 |
14,534 |
| Water supply; sewerage, waste management and remediation activities |
419 |
173 |
592 |
3,814 |
140 |
3,954 |
4,233 |
313 |
4,546 |
| Construction |
1,489 |
233 |
1,722 |
661,163 |
6,889 |
668,052 |
662,652 |
7,122 |
669,774 |
| Wholesale and retail trade; repair of motor vehicles and motorcycles |
976 |
828 |
1,804 |
221,768 |
24,945 |
246,713 |
222,744 |
25,773 |
248,517 |
| Transportation and storage |
1,476 |
1,462 |
2,938 |
125,005 |
14,078 |
139,083 |
126,481 |
15,540 |
142,021 |
| Accommodation and food service activities |
455 |
1,114 |
1,569 |
66,716 |
21,677 |
88,393 |
67,171 |
22,791 |
89,962 |
| Information and communication |
2,094 |
1,450 |
3,544 |
17,185 |
3,803 |
20,988 |
19,279 |
5,253 |
24,532 |
| Financial and insurance activities |
2,289 |
2,583 |
4,872 |
16,706 |
4,523 |
21,229 |
18,995 |
7,106 |
26,101 |
| Real estate activities |
546 |
441 |
987 |
18,408 |
1,583 |
19,991 |
18,954 |
2,024 |
20,978 |
| Professional, scientific and technical activities |
418 |
171 |
589 |
26,419 |
5,988 |
32,407 |
26,837 |
6,159 |
32,996 |
| Administrative and support service activities |
282 |
943 |
1,225 |
160,941 |
28,609 |
189,550 |
161,223 |
29,552 |
190,775 |
| Public administration and defence; compulsory social security |
46,303 |
18,408 |
64,711 |
42,584 |
5,108 |
47,692 |
88,887 |
23,516 |
112,403 |
| Education |
2,880 |
11,342 |
14,222 |
29,446 |
30,435 |
59,881 |
32,326 |
41,777 |
74,103 |
| Human health and social work activities |
3,299 |
5,254 |
8,553 |
49,497 |
39,669 |
89,166 |
52,796 |
44,923 |
97,719 |
| Arts, entertainment and recreation |
1,145 |
1,035 |
2,180 |
8,372 |
2,442 |
10,814 |
9,517 |
3,477 |
12,994 |
| Other service activities |
110 |
47 |
157 |
9,321 |
4,182 |
13,503 |
9,431 |
4,229 |
13,660 |
| Activities of households as employers; undifferentiated goods- and services-producing activities of households for own use |
0 |
0 |
0 |
66,750 |
101,876 |
168,626 |
66,750 |
101,876 |
168,626 |
| Activities of extraterritorial organizations and bodies |
216 |
95 |
311 |
4,678 |
2,204 |
6,882 |
4,894 |
2,299 |
7,193 |
| Total |
72,148 |
48,684 |
120,832 |
1,705,296 |
304,228 |
2,009,524 |
1,777,444 |
352,912 |
2,130,356 |
Source: Annual Bulletin of Labour Force Sample Survey 2022
ANNEXED NOTE
- Technical Notes and Definitions
The data is taken from Labour Force Survey 2022 (yearly synthesis)
Sampling frame: Population Census 2020.
Sample size: 65,253 persons, in 10,560 households: 1- Qatari households; 2- non-Qatari regular (non-collective) households; 3- non-Qatari small collective households or labour gatherings (2 – 6 persons); 4- non-Qatari large collective households or large labour gatherings (7 persons or more).
The collective households are a group of persons not related to each other and sharing living conditions in a residential unit, i.e. labour camps, students living in boarding schools, nurses in hospitals… etc. The survey covered the small collective households (includes less than 7 persons) and large collective households (includes 7 persons or more).
The survey did not cover short periods accommodation, i.e. hotels.
Data Collection: The sample was divided into equal parts to collect data monthly. Each month 1/3 of the quarterly data were collected during the first two weeks of the month.
Reference period for the labour force data: the week prior to data collection day.
Classification used: ISIC-Rev. 4.
The present data refers to the active population, i.e. employed and unemployed. It does not include persons seeking work for the first time.
- Institution which provides data
Planning and Statistics Authority
https://www.psa.gov.qa/en/Pages/default.aspx
- Data availability
Labour Force Surveys (yearly and quarterly data) can be downloaded from PSA’s website, in PDF and Excel format:
https://www.psa.gov.qa/en/statistics1/pages/topicslisting.aspx?parent=Social&child=LaborForce
Last date of access: October 2023.
GLMM and GRC cannot guarantee that the link to access the source will not change; that the information will not be removed from the website it was obtained from; that no geo-blockages will be imposed; or that the information will not be available for any another reason.
Keywords: Qatar, Labour Market, Employment, National & Foreign Labour, National Labour, Foreign Labour, Domestic Workers
| |
Qataris |
Non-Qataris |
Total |
| |
Males |
Females |
Total |
Males |
Females |
Total |
Males |
Females |
Total |
| 2006 |
38,684 |
19,447 |
58,131 |
415,235 |
57,767 |
473,002 |
453,919 |
77,214 |
531,133 |
| 2007 |
40,322 |
21,223 |
61,545 |
686,430 |
79,608 |
766,038 |
726,752 |
100,831 |
827,583 |
| 2008 |
42,770 |
24,815 |
67,585 |
1,002,388 |
97,928 |
1,100,316 |
1,045,158 |
122,743 |
1,167,901 |
| 2009 |
45,242 |
25,402 |
70,644 |
1,092,844 |
97,983 |
1,190,827 |
1,138,086 |
123,385 |
1,261,471 |
| 2010* |
46,168 |
24,908 |
71,076 |
1,070,973 |
128,134 |
1,199,107 |
1,117,141 |
153,042 |
1,270,183 |
| 2011 |
49,228 |
25,145 |
74,373 |
1,068,083 |
127,789 |
1,195,872 |
1,117,311 |
152,934 |
1,270,245 |
| 2012 |
55,609 |
26,992 |
82,601 |
1,117,577 |
140,404 |
1,257,981 |
1,173,186 |
167,396 |
1,340,582 |
| 2013 |
60,877 |
30,256 |
91,133 |
1,284,838 |
163,169 |
1,448,007 |
1,345,715 |
193,425 |
1,539,140 |
| 2014 |
62,202 |
31,282 |
93,484 |
1,419,940 |
173,247 |
1,593,187 |
1,482,142 |
204,529 |
1,686,671 |
| 2015 |
64,101 |
34,322 |
98,423 |
1,628,620 |
226,395 |
1,855,015 |
1,692,721 |
260,717 |
1,953,438 |
| 2016 |
65,023 |
36,394 |
101,417 |
1,716,529 |
234,467 |
1,950,996 |
1,781,552 |
270,861 |
2,052,413 |
| 2017 |
66,859 |
37,057 |
103,916 |
1,711,444 |
238,827 |
1,950,271 |
1,778,303 |
275,884 |
2,054,187 |
| 2018 |
67,610 |
38,428 |
106,038 |
1,742,169 |
246,159 |
1,988,328 |
1,809,779 |
284,587 |
2,094,366 |
| 2019 |
68,210 |
39,277 |
107,487 |
1,754,752 |
245,462 |
2,000,214 |
1,822,962 |
284,739 |
2,107,701 |
| 2020 |
70,047 |
40,238 |
110,285 |
1,765,660 |
252,821 |
2,018,481 |
1,835,707 |
293,059 |
2,128,766 |
| 2021 |
70,247 |
45,191 |
115,438 |
1,643,097 |
262,632 |
1,905,729 |
1,713,344 |
307,823 |
2,021,167 |
| 2022 |
72,086 |
48,684 |
120,770 |
1,705,016 |
304,103 |
2,009,119 |
1,777,102 |
352,787 |
2,129,889 |
Source: Labour Force Sample Surveys, 2006 to 2009 and 2011 to 2022; *: census 2010
ANNEXED NOTE
- Technical Notes and Definitions
Censuses:
Reference period for census 2015: the night of 20 to 21 April 2015.
Reference period for census 2010: the night of 20 to 21 April 2010.
Reference period for census 2020: December 2020 (administrative records-based census).
Population of reference: all individuals (nationals and non-nationals) present within the State’s borders during time of reference, including in labour camps.
Labour force Sample Surveys:
The Statistics Authority conducted the first labour Force Sample Survey in 2001. Starting from 2006, the execution of these surveys came to be on annual basis. Since 2013, data has been collected on a monthly basis and published every 3 months.
| Labour Force Sample Surveys |
Sampling frame |
Sample size |
Reference period/ periodicity of data collection |
| House–holds |
individuals |
| 2006 |
based on independent samples drawn from distinct frames of specially constructed PSUs |
5,492 |
31,439 |
March 2006 |
| 2007 |
nd |
5,492 |
31,439 |
October 2007 |
| 2008 |
nd |
6,104 |
nd |
December 2008 |
| 2009 |
nd |
6,109 |
35,839 |
October 2009 |
| 2011 |
nd |
6,920 |
35,839 |
March 2011 |
| 2012 |
Census 2010 |
6,895 |
37,629 |
April 2012 |
| 2013 |
Census 2010 |
c. 7000 |
n.d. |
Monthly |
| 2014 |
Census 2010 |
8,351 |
53,363 |
Monthly |
| 2015 |
Census 2010 |
6,953 |
44,756 |
Monthly |
| 2016 |
Census 2010 |
9,199 |
60,016 |
Monthly |
| 2017 |
Census 2015 |
9,200 |
60,278 |
Monthly |
| 2018 |
Census 2015 |
9,200 |
60,238 |
Monthly |
| 2019 |
Census 2015 |
8,445 |
54,948 |
Monthly |
| 2020 |
Census 2015 |
9,200 |
60,024 |
Monthly |
| 2021 |
Census 2015 |
9,200 |
59,997 |
Monthly |
| 2022 |
Census 2020 |
10,560 |
65,253 |
Monthly |
Reference period for the labour force data: the week prior to the reference date for data collection.
Population of reference: sample of Qatari and non-Qatari households of the following types: i. Qatari households; ii. Non-Qatari households; iii. Small collective households or labour gatherings; iv. Large collective households or labour gatherings, present in Qatar on the night of survey/ periods of reference.
The collective households are a group of persons not related to each other and sharing living conditions in a residential unit, i.e. labour camps, students living in boarding schools, nurses in hospitals… etc. The survey covered the small collective households (includes less than 7 persons) and large collective households (includes 7 persons or more).
The survey did not cover short periods accommodation, i.e. hotels.
Employed population:
Persons aged 15 years an above, who during the week preceding the survey:
- a) Perform a work for a wage, salary, profits or household gains, whether it was in cash or in kind.
- b) Are temporarily not employed, however, they still have an official relation with their work
- Institution which provides data
Planning and Statistics Authority (PSA)
https://www.psa.gov.qa/en/Pages/default.aspx
- Data availability
Labour Force Surveys (annual and quarterly reports) and earlier labour-related data can be downloaded from PSA’s website, in PDF and Excel formats:
https://www.psa.gov.qa/en/statistics1/pages/topicslisting.aspx?parent=Social&child=LaborForce
Last date of access: October 2023.
GLMM and GRC cannot guarantee that the link to access the source will not change; that the information will not be removed from the website it was obtained from; that no geo-blockages will be imposed; or that the information will not be available for any another reason.
Keywords: Qatar, Employment, Female Employment, National Labour, Foreign Labour
| |
Under 1 |
1-4 |
5-9 |
10-14 |
15-19 |
20-24 |
25-29 |
30-34 |
35-39 |
40-44 |
45-49 |
50-54 |
55-59 |
60-64 |
65-69 |
70-74 |
75+ |
Total |
| Doha |
Male |
5,578 |
23,719 |
27,339 |
20,951 |
16,031 |
66,496 |
138,289 |
167,799 |
148,972 |
104,700 |
68,060 |
44,256 |
25,360 |
14,014 |
5,830 |
2,256 |
1,504 |
881,154 |
| Female |
5,329 |
22,528 |
26,309 |
20,179 |
14,618 |
15,687 |
37,982 |
49,081 |
39,044 |
27,471 |
17,552 |
11,900 |
7,759 |
4,744 |
2,347 |
1,160 |
1,179 |
304,869 |
| Total |
10,907 |
46,247 |
53,648 |
41,130 |
30,649 |
82,183 |
176,271 |
216,880 |
188,016 |
132,171 |
85,612 |
56,156 |
33,119 |
18,758 |
8,177 |
3,416 |
2,683 |
1,186,023 |
| Sex Ratio |
104.7 |
105.3 |
103.9 |
103.8 |
109.7 |
423.9 |
364.1 |
341.9 |
381.5 |
381.1 |
387.8 |
371.9 |
326.8 |
295.4 |
248.4 |
194.5 |
127.6 |
289.0 |
| Al Rayyan |
Male |
5,861 |
24,294 |
30,146 |
25,780 |
19,780 |
40,284 |
74,481 |
90,168 |
77,817 |
56,828 |
37,901 |
24,258 |
14,035 |
8,059 |
3,509 |
1,659 |
1,823 |
536,683 |
| Female |
5,530 |
23,498 |
29,311 |
24,545 |
18,399 |
17,889 |
30,305 |
38,461 |
33,771 |
25,904 |
16,266 |
10,330 |
6,391 |
4,162 |
2,376 |
1,319 |
1,646 |
290,103 |
| Total |
11,391 |
47,792 |
59,457 |
50,325 |
38,179 |
58,173 |
104,786 |
128,629 |
111,588 |
82,732 |
54,167 |
34,588 |
20,426 |
12,221 |
5,885 |
2,978 |
3,469 |
826,786 |
| Sex Ratio |
106.0 |
103.4 |
102.8 |
105.0 |
107.5 |
225.2 |
245.8 |
234.4 |
230.4 |
219.4 |
233.0 |
234.8 |
219.6 |
193.6 |
147.7 |
125.8 |
110.8 |
185.0 |
| Al Wakra |
Male |
1,737 |
7,844 |
9,641 |
7,397 |
5,317 |
13,122 |
25,440 |
31,945 |
29,779 |
21,033 |
14,478 |
8,882 |
4,566 |
2,099 |
846 |
365 |
336 |
184,827 |
| Female |
1,681 |
7,605 |
9,223 |
6,903 |
4,788 |
4,495 |
8,372 |
11,362 |
9,392 |
6,636 |
3,989 |
2,497 |
1,432 |
853 |
455 |
289 |
303 |
80,275 |
| Total |
3,418 |
15,449 |
18,864 |
14,300 |
10,105 |
17,617 |
33,812 |
43,307 |
39,171 |
27,669 |
18,467 |
11,379 |
5,998 |
2,952 |
1,301 |
654 |
639 |
265,102 |
| Sex Ratio |
103.3 |
103.1 |
104.5 |
107.2 |
111.0 |
291.9 |
303.9 |
281.2 |
317.1 |
317.0 |
362.9 |
355.7 |
318.9 |
246.1 |
185.9 |
126.3 |
110.9 |
230.2 |
| Umm Slal |
Male |
956 |
3,944 |
4,463 |
3,721 |
3,103 |
9,578 |
16,920 |
18,592 |
15,469 |
10,390 |
6,348 |
3,785 |
2,051 |
1,152 |
535 |
277 |
320 |
101,604 |
| Female |
988 |
3,807 |
4,292 |
3,573 |
2,835 |
3,258 |
5,624 |
6,679 |
5,499 |
4,046 |
2,602 |
1,773 |
1,235 |
826 |
463 |
278 |
319 |
48,097 |
| Total |
1,944 |
7,751 |
8,755 |
7,294 |
5,938 |
12,836 |
22,544 |
25,271 |
20,968 |
14,436 |
8,950 |
5,558 |
3,286 |
1,978 |
998 |
555 |
639 |
149,701 |
| Sex Ratio |
96.8 |
103.6 |
104.0 |
104.1 |
109.5 |
294.0 |
300.9 |
278.4 |
281.3 |
256.8 |
244.0 |
213.5 |
166.1 |
139.5 |
115.6 |
99.6 |
100.3 |
211.2 |
| Al Khor and Al Thakhira |
Male |
516 |
2,474 |
3,244 |
2,746 |
2,200 |
8,829 |
16,612 |
20,435 |
20,731 |
13,952 |
9,922 |
6,077 |
3,433 |
1,218 |
348 |
114 |
92 |
112,943 |
| Female |
496 |
2,257 |
2,935 |
2,630 |
1,861 |
1,559 |
2,606 |
3,358 |
3,195 |
2,649 |
1,755 |
1,049 |
536 |
300 |
140 |
84 |
100 |
27,510 |
| Total |
1,012 |
4,731 |
6,179 |
5,376 |
4,061 |
10,388 |
19,218 |
23,793 |
23,926 |
16,601 |
11,677 |
7,126 |
3,969 |
1,518 |
488 |
198 |
192 |
140,453 |
| Sex Ratio |
104.0 |
109.6 |
110.5 |
104.4 |
118.2 |
566.3 |
637.5 |
608.5 |
648.9 |
526.7 |
565.4 |
579.3 |
640.5 |
406.0 |
248.6 |
135.7 |
92.0 |
410.6 |
| Al Shamal |
Male |
54 |
220 |
328 |
332 |
245 |
1,224 |
2,317 |
2,606 |
2,222 |
1,528 |
1,103 |
647 |
331 |
161 |
77 |
33 |
29 |
13,457 |
| Female |
56 |
231 |
302 |
319 |
265 |
192 |
298 |
423 |
349 |
288 |
224 |
119 |
74 |
49 |
34 |
19 |
31 |
3,273 |
| Total |
110 |
451 |
630 |
651 |
510 |
1,416 |
2,615 |
3,029 |
2,571 |
1,816 |
1,327 |
766 |
405 |
210 |
111 |
52 |
60 |
16,730 |
| Sex Ratio |
96.4 |
95.2 |
108.6 |
104.1 |
92.5 |
637.5 |
777.5 |
616.1 |
636.7 |
530.6 |
492.4 |
543.7 |
447.3 |
328.6 |
226.5 |
173.7 |
93.5 |
411.2 |
| Al Daayen |
Male |
829 |
3,496 |
4,218 |
3,737 |
2,785 |
4,056 |
6,738 |
7,843 |
6,967 |
5,241 |
3,914 |
2,553 |
1,457 |
856 |
407 |
184 |
185 |
55,466 |
| Female |
830 |
3,363 |
4,033 |
3,529 |
2,688 |
2,521 |
4,909 |
6,230 |
5,592 |
4,215 |
2,706 |
1,551 |
964 |
695 |
384 |
178 |
229 |
44,617 |
| Total |
1,659 |
6,859 |
8,251 |
7,266 |
5,473 |
6,577 |
11,647 |
14,073 |
12,559 |
9,456 |
6,620 |
4,104 |
2,421 |
1,551 |
791 |
362 |
414 |
100,083 |
| Sex Ratio |
99.9 |
104.0 |
104.6 |
105.9 |
103.6 |
160.9 |
137.3 |
125.9 |
124.6 |
124.3 |
144.6 |
164.6 |
151.1 |
123.2 |
106.0 |
103.4 |
80.8 |
124.3 |
| Al Sheehaniya |
Male |
254 |
1,029 |
1,337 |
1,165 |
1,196 |
13,810 |
27,895 |
32,804 |
28,765 |
18,717 |
11,211 |
6,213 |
2,501 |
1,021 |
269 |
99 |
98 |
148,384 |
| Female |
241 |
940 |
1,260 |
1,241 |
945 |
905 |
1,263 |
1,546 |
1,381 |
1,204 |
842 |
493 |
264 |
133 |
82 |
62 |
54 |
12,856 |
| Total |
495 |
1,969 |
2,597 |
2,406 |
2,141 |
14,715 |
29,158 |
34,350 |
30,146 |
19,921 |
12,053 |
6,706 |
2,765 |
1,154 |
351 |
161 |
152 |
161,240 |
| Sex Ratio |
105.4 |
109.5 |
106.1 |
93.9 |
126.6 |
1526.0 |
2208.6 |
2121.9 |
2082.9 |
1554.6 |
1331.5 |
1260.2 |
947.3 |
767.7 |
328.0 |
159.7 |
181.5 |
1154.2 |
| Total Qatar |
Male |
15,785 |
67,020 |
80,716 |
65,829 |
50,657 |
157,399 |
308,692 |
372,192 |
330,722 |
232,389 |
152,937 |
96,671 |
53,734 |
28,580 |
11,821 |
4,987 |
4,387 |
2,034,518 |
| Female |
15,151 |
64,229 |
77,665 |
62,919 |
46,399 |
46,506 |
91,359 |
117,140 |
98,223 |
72,413 |
45,936 |
29,712 |
18,655 |
11,762 |
6,281 |
3,389 |
3,861 |
811,600 |
| Total |
30,936 |
131,249 |
158,381 |
128,748 |
97,056 |
203,905 |
400,051 |
489,332 |
428,945 |
304,802 |
198,873 |
126,383 |
72,389 |
40,342 |
18,102 |
8,376 |
8,248 |
2,846,118 |
| Sex Ratio |
104.2 |
104.3 |
103.9 |
104.6 |
109.2 |
338.4 |
337.9 |
317.7 |
336.7 |
320.9 |
332.9 |
325.4 |
288.0 |
243.0 |
188.2 |
147.2 |
113.6 |
250.7 |
Source: census 2020, PSA
ANNEXED NOTE
- Technical Notes and Definitions
Qatar conducted population censuses in 1970, 1986, 1997, 2004, 2010, 2015 (a “simplified” census) and in 2020.
Reference period for census 2020: December 2020.
Implementation method: Census 2020 was based on administrative records, supplemented by an online self-enumeration platform, completed with field enumeration.
Population of reference: All Qatari and non-Qatari individuals residing in the country at the time of the survey.
- Institution which provides data
Planning and Statistics Authority (PSA)
(https://www.psa.gov.qa/en/Pages/default.aspx;
https://www.psa.gov.qa/ar/pages/default.aspx)
- Data availability
Data reprocessed from the Detailed Results of the Census of Population, Housing and Establishments (December 2020).
Census portal and page:
https://www.psa.gov.qa/en/statistics1/StatisticsSite/Census/Census2020/results/Pages/default.aspx
https://www.psa.gov.qa/en/statistics1/pages/topicslisting.aspx?parent=General&child=Census
Presents main results and detailed results of the census (Excel and PDF formats)
Date of access: October 2023
GLMM and GRC cannot guarantee that the link to access the source will not change; that the information will not be removed from the website it was obtained from; that no geo-blockages will be imposed; or that the information will not be available for any another reason.
Keywords: Qatar, National and Foreign Populations
| Qatari males |
10-14 |
15-24 |
25-34 |
35-44 |
45-54 |
55-64 |
65+ |
Total |
| Illiterate |
0 |
0 |
3 |
2 |
4 |
17 |
399 |
425 |
| Reads and writes / Night school |
7,900 |
196 |
215 |
165 |
231 |
386 |
1,439 |
10,532 |
| Primary |
11,200 |
1,677 |
676 |
741 |
750 |
638 |
693 |
16,375 |
| Preparatory / Vocational |
0 |
12,907 |
1,434 |
1,291 |
749 |
658 |
1,092 |
18,131 |
| Secondary / Post. Secondary |
0 |
10,660 |
7,437 |
5,206 |
3,946 |
2,731 |
993 |
30,973 |
| University and above |
0 |
4,854 |
15,028 |
10,012 |
7,234 |
4,485 |
1,363 |
42,976 |
| Total males |
19,100 |
30,294 |
24,793 |
17,417 |
12,914 |
8,915 |
5,979 |
119,412 |
|
|
|
|
|
|
|
|
|
| Qatari females |
10-14 |
15-24 |
25-34 |
35-44 |
45-54 |
55-64 |
65+ |
Total |
| Illiterate |
0 |
0 |
1 |
2 |
1 |
18 |
1,544 |
1,566 |
| Reads and writes / Night school |
7,477 |
126 |
222 |
337 |
483 |
1,176 |
2,043 |
11,864 |
| Primary |
11,193 |
970 |
512 |
674 |
717 |
948 |
680 |
15,694 |
| Preparatory / Vocational |
0 |
11,521 |
1,161 |
960 |
814 |
762 |
1,098 |
16,316 |
| Secondary / Post. Secondary |
0 |
12,143 |
10,581 |
7,814 |
5,729 |
3,993 |
729 |
40,989 |
| University and above |
0 |
4,757 |
13,122 |
10,546 |
7,126 |
4,108 |
756 |
40,415 |
| Total females |
18,670 |
29,517 |
25,599 |
20,333 |
14,870 |
11,005 |
6,850 |
126,844 |
|
|
|
|
|
|
|
|
|
| Qataris (total) |
10-14 |
15-24 |
25-34 |
35-44 |
45-54 |
55-64 |
65+ |
Total |
| Illiterate |
0 |
0 |
4 |
4 |
5 |
35 |
1,943 |
1,991 |
| Reads and writes / Night school |
15,377 |
322 |
437 |
502 |
714 |
1,562 |
3,482 |
22,396 |
| Primary |
22,393 |
2,647 |
1,188 |
1,415 |
1,467 |
1,586 |
1,373 |
32,069 |
| Preparatory / Vocational |
0 |
24,428 |
2,595 |
2,251 |
1,563 |
1,420 |
2,190 |
34,447 |
| Secondary / Post. Secondary |
0 |
22,803 |
18,018 |
13,020 |
9,675 |
6,724 |
1,722 |
71,962 |
| University and above |
0 |
9,611 |
28,150 |
20,558 |
14,360 |
8,593 |
2,119 |
83,391 |
| Grand total |
37,770 |
59,811 |
50,392 |
37,750 |
27,784 |
19,920 |
12,829 |
246,256 |
Source: census 2020, PSA
ANNEXED NOTE
- Technical Notes and Definitions
Qatar conducted population censuses in 1970, 1986, 1997, 2004, 2010, 2015 (a “simplified” census) and in 2020.
Reference period for census 2020: December 2020.
Implementation method: Census 2020 was based on administrative records, supplemented by an online self-enumeration platform, completed with field enumeration.
Population of reference: All Qatari and non-Qatari individuals residing in the country at the time of the survey.
- Institution which provides data
Planning and Statistics Authority (PSA)
(https://www.psa.gov.qa/en/Pages/default.aspx;
https://www.psa.gov.qa/ar/pages/default.aspx)
- Data availability
Data reprocessed from the Detailed Results of the Census of Population, Housing and Establishments (December 2020).
Census portal and page:
https://www.psa.gov.qa/en/statistics1/StatisticsSite/Census/Census2020/results/Pages/default.aspx
https://www.psa.gov.qa/en/statistics1/pages/topicslisting.aspx?parent=General&child=Census
Presents main results and detailed results of the census (Excel and PDF formats)
Date of access: October 2023
GLMM and GRC cannot guarantee that the link to access the source will not change; that the information will not be removed from the website it was obtained from; that no geo-blockages will be imposed; or that the information will not be available for any another reason.
Keywords: Qatar, National Population, Education
| Non-Qatari males |
10-14 |
15-24 |
25-34 |
35-44 |
45-54 |
55-64 |
65+ |
Total |
| Illiterate |
6 |
1,172 |
6,336 |
6,236 |
2,560 |
609 |
177 |
17,096 |
| Reads and writes / Night school |
10,255 |
17,649 |
71,266 |
53,922 |
23,682 |
5,447 |
2,029 |
184,250 |
| Primary |
36,468 |
30,305 |
109,402 |
88,832 |
35,105 |
9,007 |
1,358 |
310,477 |
| Preparatory / Vocational |
0 |
52,886 |
135,827 |
111,307 |
43,728 |
12,567 |
2,382 |
358,697 |
| Secondary / Post. Secondary |
0 |
51,015 |
154,229 |
122,579 |
53,902 |
16,760 |
2,771 |
401,256 |
| University and above |
0 |
24,735 |
179,031 |
162,818 |
77,717 |
29,009 |
6,499 |
479,809 |
| Total males |
46,729 |
177,762 |
656,091 |
545,694 |
236,694 |
73,399 |
15,216 |
1,751,585 |
|
|
|
|
|
|
|
|
|
| Non-Qatari females |
10-14 |
15-24 |
25-34 |
35-44 |
45-54 |
55-64 |
65+ |
Total |
| Illiterate |
8 |
10 |
35 |
41 |
38 |
74 |
118 |
324 |
| Reads and writes / Night school |
9,702 |
127 |
1,335 |
1,607 |
769 |
269 |
591 |
14,400 |
| Primary |
34,539 |
4,414 |
19,322 |
18,704 |
8,145 |
2,388 |
776 |
88,288 |
| Preparatory / Vocational |
0 |
25,084 |
35,789 |
32,600 |
12,505 |
3,845 |
1,482 |
111,305 |
| Secondary / Post. Secondary |
0 |
24,394 |
38,159 |
27,878 |
12,492 |
4,953 |
2,036 |
109,912 |
| University and above |
0 |
9,359 |
88,260 |
69,473 |
26,829 |
7,883 |
1,678 |
203,482 |
| Total females |
44,249 |
63,388 |
182,900 |
150,303 |
60,778 |
19,412 |
6,681 |
527,711 |
|
|
|
|
|
|
|
|
|
| Non-Qataris (total) |
10-14 |
15-24 |
25-34 |
35-44 |
45-54 |
55-64 |
65+ |
Total |
| Illiterate |
14 |
1,182 |
6,371 |
6,277 |
2,598 |
683 |
295 |
17,420 |
| Reads and writes / Night school |
19,957 |
17,776 |
72,601 |
55,529 |
24,451 |
5,716 |
2,620 |
198,650 |
| Primary |
71,007 |
34,719 |
128,724 |
107,536 |
43,250 |
11,395 |
2,134 |
398,765 |
| Preparatory / Vocational |
0 |
77,970 |
171,616 |
143,907 |
56,233 |
16,412 |
3,864 |
470,002 |
| Secondary / Post. Secondary |
0 |
75,409 |
192,388 |
150,457 |
66,394 |
21,713 |
4,807 |
511,168 |
| University and above |
0 |
34,094 |
267,291 |
232,291 |
104,546 |
36,892 |
8,177 |
683,291 |
| Grand total |
90,978 |
241,150 |
838,991 |
695,997 |
297,472 |
92,811 |
21,897 |
2,279,296 |
Source: census 2020, PSA
ANNEXED NOTE
- Technical Notes and Definitions
Qatar conducted population censuses in 1970, 1986, 1997, 2004, 2010, 2015 (a “simplified” census) and in 2020.
Reference period for census 2020: December 2020.
Implementation method: Census 2020 was based on administrative records, supplemented by an online self-enumeration platform, completed with field enumeration.
Population of reference: All Qatari and non-Qatari individuals residing in the country at the time of the survey.
- Institution which provides data
Planning and Statistics Authority (PSA)
(https://www.psa.gov.qa/en/Pages/default.aspx;
https://www.psa.gov.qa/ar/pages/default.aspx)
- Data availability
Data reprocessed from the Detailed Results of the Census of Population, Housing and Establishments (December 2020).
Census portal and page:
https://www.psa.gov.qa/en/statistics1/StatisticsSite/Census/Census2020/results/Pages/default.aspx
https://www.psa.gov.qa/en/statistics1/pages/topicslisting.aspx?parent=General&child=Census
Presents main results and detailed results of the census (Excel and PDF formats)
Date of access: October 2023
GLMM and GRC cannot guarantee that the link to access the source will not change; that the information will not be removed from the website it was obtained from; that no geo-blockages will be imposed; or that the information will not be available for any another reason.
Keywords: Qatar, Foreign Population, Education
| |
Total population |
Annual growth rates (%) |
| |
males |
females |
total |
males |
females |
total |
| 1986 |
250,328 |
123,067 |
373,395 |
|
|
|
| 1987 |
256,844 |
127,006 |
383,850 |
2.6 |
3.2 |
2.8 |
| 1988 |
263,958 |
131,251 |
395,209 |
2.7 |
3.3 |
2.9 |
| 1989 |
271,685 |
135,886 |
407,571 |
2.9 |
3.5 |
3.1 |
| 1990 |
279,800 |
140,979 |
420,779 |
2.9 |
3.7 |
3.2 |
| 1991 |
288,600 |
145,772 |
434,372 |
3.1 |
3.3 |
3.2 |
| 1992 |
297,992 |
150,579 |
448,571 |
3.2 |
3.2 |
3.2 |
| 1993 |
308,458 |
155,509 |
463,967 |
3.5 |
3.2 |
3.4 |
| 1994 |
319,379 |
160,951 |
480,330 |
3.5 |
3.4 |
3.5 |
| 1995 |
331,111 |
166,440 |
497,551 |
3.6 |
3.4 |
3.5 |
| 1996 |
343,472 |
172,104 |
515,576 |
3.7 |
3.3 |
3.6 |
| 1997 |
353,787 |
182,687 |
536,474 |
3.0 |
6.0 |
4.0 |
| 1998 |
370,742 |
190,248 |
560,990 |
4.7 |
4.1 |
4.5 |
| 1999 |
388,602 |
198,168 |
586,770 |
4.7 |
4.1 |
4.5 |
| 2000 |
407,148 |
206,821 |
613,969 |
4.7 |
4.3 |
4.5 |
| 2001 |
427,316 |
216,048 |
643,364 |
4.8 |
4.4 |
4.7 |
| 2002 |
450,351 |
226,147 |
676,498 |
5.3 |
4.6 |
5.0 |
| 2003 |
476,513 |
237,346 |
713,859 |
5.6 |
4.8 |
5.4 |
| 2004 |
546,116 |
251,943 |
798,059 |
13.6 |
6.0 |
11.1 |
| 2005 |
637,070 |
269,053 |
906,123 |
15.4 |
6.6 |
12.7 |
| 2006 |
754,298 |
288,649 |
1,042,947 |
16.9 |
7.0 |
14.1 |
| 2007 |
905,747 |
312,503 |
1,218,250 |
18.3 |
7.9 |
15.5 |
| 2008 |
1,111,176 |
337,303 |
1,448,479 |
20.4 |
7.6 |
17.3 |
| 2009 |
1,265,146 |
373,480 |
1,638,626 |
13.0 |
10.2 |
12.3 |
| 2010 |
1,296,110 |
414,988 |
1,715,098 |
2.4 |
10.5 |
4.6 |
| 2011 |
1,288,590 |
444,127 |
1,732,717 |
-0.6 |
6.8 |
1.0 |
| 2012 |
1,355,199 |
477,704 |
1,832,903 |
5.0 |
7.3 |
5.6 |
| 2013 |
1,477,632 |
526,068 |
2,003,700 |
8.6 |
9.6 |
8.9 |
| 2014 |
1,652,037 |
564,143 |
2,216,180 |
11.2 |
7.0 |
10.1 |
| 2015 |
1,840,643 |
597,147 |
2,437,790 |
10.8 |
5.7 |
9.5 |
| 2016 |
1,975,536 |
642,098 |
2,617,634 |
7.1 |
7.3 |
7.1 |
| 2017 |
2,046,047 |
678,559 |
2,724,606 |
3.5 |
5.5 |
4.0 |
| 2018 |
2,048,206 |
711,964 |
2,760,170 |
0.1 |
4.8 |
1.3 |
| 2019 |
2,064,276 |
734,926 |
2,799,202 |
0.8 |
3.2 |
1.4 |
| 2020 |
2,025,902 |
807,777 |
2,833,679 |
-1.9 |
9.5 |
1.2 |
| 2021 |
1,970,649 |
777,513 |
2,748,162 |
-2.8 |
-3.8 |
-3.1 |
| 2022 |
2,121,336 |
810,905 |
2,932,241 |
7.4 |
4.2 |
6.5 |
Source: Planning and Statistics Authority (PSA)
ANNEXED NOTE
- Characteristics of data and definitions
The table provides intercensal estimates of Qatar’s total resident population (nationals and non-nationals) based on census results (1986; 1997; 2004; 2010, 2015 and 2020), civil registration of births and deaths, and registration of entries and exits.
Annual growth rates: author’s calculation.
- Institution which provides data
Planning and Statistics Authority (PSA)
https://www.psa.gov.qa/en/Pages/default.aspx
- Period of data coverage:
Mid-year estimates, given years.
- Data availability
The population data is available in the Population and Social Statistics Bulletin (Annual issue, 2022).
https://www.psa.gov.qa/en/statistics/Statistical%20Releases/Population/Population/2022/Population_social_1_2022_AE.xls
https://www.psa.gov.qa/en/statistics/Statistical%20Releases/Population/Population/2022/Population_social_1_2022_AE.pdf
Date of access: October 2023
GLMM and GRC cannot guarantee that the link to access the source will not change; that the information will not be removed from the website it was obtained from; that no geo-blockages will be imposed; or that the information will not be available for any another reason.
Keywords: Qatar, Foreign & National Populations
| |
Households |
Labour camps |
Institutions |
Total |
| males |
females |
total |
males |
females |
total |
males |
females |
total |
males |
females |
total |
| Doha |
291,168 |
267,368 |
558,536 |
587,336 |
37,431 |
624,767 |
2,650 |
70 |
2,720 |
881,154 |
304,869 |
1,186,023 |
| Al Rayyan |
278,200 |
270,312 |
548,512 |
258,453 |
19,779 |
278,232 |
30 |
12 |
42 |
536,683 |
290,103 |
826,786 |
| Al Wakrah |
80,400 |
75,002 |
155,402 |
104,369 |
5,273 |
109,642 |
58 |
0 |
58 |
184,827 |
80,275 |
265,102 |
| Umm Slal |
43,132 |
44,912 |
88,044 |
58,472 |
3,185 |
61,657 |
0 |
0 |
0 |
101,604 |
48,097 |
149,701 |
| Al Khor & Althakhira |
28,381 |
25,893 |
54,274 |
84,562 |
1,617 |
86,179 |
0 |
0 |
0 |
112,943 |
27,510 |
140,453 |
| Al Shamal |
3,181 |
3,039 |
6,220 |
10,276 |
234 |
10,510 |
0 |
0 |
0 |
13,457 |
3,273 |
16,730 |
| Al Dhaayen |
39,518 |
42,627 |
82,145 |
15,948 |
1,990 |
17,938 |
0 |
0 |
0 |
55,466 |
44,617 |
100,083 |
| Al Sheehaniya |
12,192 |
11,640 |
23,832 |
136,159 |
1,216 |
137,375 |
33 |
0 |
33 |
148,384 |
12,856 |
161,240 |
| Total |
776,172 |
740,793 |
1,516,965 |
1,255,575 |
70,725 |
1,326,300 |
2,771 |
82 |
2,853 |
2,034,518 |
811,600 |
2,846,118 |
Source: census 2020, PSA
ANNEXED NOTE
- Technical Notes and Definitions
Qatar conducted population censuses in 1970, 1986, 1997, 2004, 2010, 2015 (a “simplified” census) and in 2020.
Reference period for census 2020: December 2020.
Implementation method: Census 2020 was based on administrative records, supplemented by an online self-enumeration platform, completed with field enumeration.
Population of reference: All Qatari and non-Qatari individuals residing in the country at the time of the survey.
Household: a household is defined as an individual or group of individuals who may or may not be relatives. They live together and make common provisions for food, accommodation and other essentials for living. Anyone who is usually living in the housing unit of the household under enumeration is considered a member of that household (including the servants).
Labour camps (or Labour gatherings)
Small gatherings: A group of persons of the same gender (male of female) usually staying in the housing unit. They live as a group (collectively) but there is no relationship between them and they do not form a living household. Their number ranges between 2 and 6 persons
Large gatherings: A group of persons of the same gender usually staying in housing units. They live as a group (collectively) but there is no relationship between them and they do not form a living household. They are seven or more persons who usually belong to one organization (company, establishment, etc).
Institutions or public housing: It is the collective living quarters (e.g. internal wards in hospitals, dormitories for students, jails, etc.) where individuals reside for a specific purpose. The inmates do not form a family or census household but they have common circumstances to be in public housing.
See the PSA’s “Manual of Statistical Definitions, Concepts & Terms” pertaining to the censuses:
https://www.psa.gov.qa/en/statistics1/dictionary/Pages/default.aspx.
- Institution which provides data
Planning and Statistics Authority (PSA)
https://www.psa.gov.qa/en/Pages/default.aspx
https://www.psa.gov.qa/ar/pages/default.aspx
- Data availability
The table was reproduced from the Bulletin of Population and Social Statistics (Annual issue, 2022)
The Bulletin reprocessed and reproduced a limited set of data from census 2020.
Census portal and page:
https://www.psa.gov.qa/en/statistics1/StatisticsSite/Census/Census2020/results/Pages/default.aspx
https://www.psa.gov.qa/en/statistics1/pages/topicslisting.aspx?parent=General&child=Census
Presents main results and detailed results of the Census of Population, Housing and Establishments (December 2020) (Excel and PDF formats).
Date of access: October 2023
GLMM and GRC cannot guarantee that the link to access the source will not change; that the information will not be removed from the website it was obtained from; that no geo-blockages will be imposed; or that the information will not be available for any another reason.
Keywords: Qatar, housing, labour camp, labour gathering
| Non-Qataris |
Never Married |
Married |
Divorced |
Widow |
Total |
| Male |
Female |
Male |
Female |
Male |
Female |
Male |
Female |
Male |
Female |
| 15-24 |
136,406 |
53,575 |
41,179 |
9,700 |
115 |
99 |
62 |
14 |
177,762 |
63,388 |
| 25-34 |
228,860 |
54,124 |
425,226 |
126,441 |
1,542 |
1,998 |
463 |
337 |
656,091 |
182,900 |
| 35-44 |
77,781 |
21,886 |
465,591 |
124,942 |
1,846 |
2,727 |
476 |
748 |
545,694 |
150,303 |
| 45-54 |
19,395 |
5,579 |
216,002 |
52,952 |
986 |
1,393 |
311 |
854 |
236,694 |
60,778 |
| 55-64 |
5,217 |
1,073 |
67,616 |
16,910 |
391 |
439 |
175 |
990 |
73,399 |
19,412 |
| 65+ |
649 |
180 |
14,233 |
4,867 |
78 |
106 |
256 |
1,528 |
15,216 |
6,681 |
| Total |
468,308 |
136,417 |
1,229,847 |
335,812 |
4,958 |
6,762 |
1,743 |
4,471 |
1,704,856 |
483,462 |
Source: census 2020, PSA
ANNEXED NOTE
- Technical Notes and Definitions
Qatar conducted population censuses in 1970, 1986, 1997, 2004, 2010, 2015 (a “simplified” census) and in 2020.
Reference period for census 2020: December 2020.
Implementation method: Census 2020 was based on administrative records, supplemented by an online self-enumeration platform, completed with field enumeration.
Population of reference: All Qatari and non-Qatari individuals residing in the country at the time of the survey.
- Institution which provides data
Planning and Statistics Authority (PSA)
https://www.psa.gov.qa/en/Pages/default.aspx
https://www.psa.gov.qa/ar/pages/default.aspx.
- Data availability
Data reprocessed from the Detailed Results of the Census of Population, Housing and Establishments (December 2020).
Census portal and page:
https://www.psa.gov.qa/en/statistics1/StatisticsSite/Census/Census2020/results/Pages/default.aspx
https://www.psa.gov.qa/en/statistics1/pages/topicslisting.aspx?parent=General&child=Census
Presents main results and detailed results of the census (Excel and PDF formats)
Date of access: October 2023
GLMM and GRC cannot guarantee that the link to access the source will not change; that the information will not be removed from the website it was obtained from; that no geo-blockages will be imposed; or that the information will not be available for any another reason.
Keywords: Qatar, National Population
| Qataris |
Never Married |
Married |
Divorced |
Widow |
Total |
| Male |
Female |
Male |
Female |
Male |
Female |
Male |
Female |
Male |
Female |
| 15-24 |
28,411 |
26,371 |
1,829 |
2,942 |
51 |
199 |
3 |
5 |
30,294 |
29,517 |
| 25-34 |
9,225 |
8,224 |
14,555 |
15,701 |
1,001 |
1,629 |
12 |
45 |
24,793 |
25,599 |
| 35-44 |
1,994 |
2,952 |
14,357 |
15,674 |
1,053 |
1,572 |
13 |
135 |
17,417 |
20,333 |
| 45-54 |
825 |
1,492 |
11,403 |
11,848 |
655 |
1,142 |
31 |
388 |
12,914 |
14,870 |
| 55-64 |
309 |
854 |
8,201 |
8,306 |
353 |
768 |
52 |
1,077 |
8,915 |
11,005 |
| 65+ |
80 |
186 |
5,514 |
4,177 |
184 |
316 |
201 |
2,171 |
5,979 |
6,850 |
| Total |
40,844 |
40,079 |
55,859 |
58,648 |
3,297 |
5,626 |
312 |
3,821 |
100,312 |
108,174 |
Source: census 2020, PSA
ANNEXED NOTE
- Technical Notes and Definitions
Qatar conducted population censuses in 1970, 1986, 1997, 2004, 2010, 2015 (a “simplified” census) and in 2020.
Reference period for census 2020: December 2020.
Implementation method: Census 2020 was based on administrative records, supplemented by an online self-enumeration platform, completed with field enumeration.
Population of reference: All Qatari and non-Qatari individuals residing in the country at the time of the survey.
- Institution which provides data
Planning and Statistics Authority (PSA)
https://www.psa.gov.qa/en/Pages/default.aspx
https://www.psa.gov.qa/ar/pages/default.aspx.
- Data availability
Data reprocessed from the Detailed Results of the Census of Population, Housing and Establishments (December 2020).
Census portal and page:
https://www.psa.gov.qa/en/statistics1/StatisticsSite/Census/Census2020/results/Pages/default.aspx
https://www.psa.gov.qa/en/statistics1/pages/topicslisting.aspx?parent=General&child=Census
Presents main results and detailed results of the census (Excel and PDF formats)
Date of access: October 2023
GLMM and GRC cannot guarantee that the link to access the source will not change; that the information will not be removed from the website it was obtained from; that no geo-blockages will be imposed; or that the information will not be available for any another reason.
Keywords: Qatar, National Population
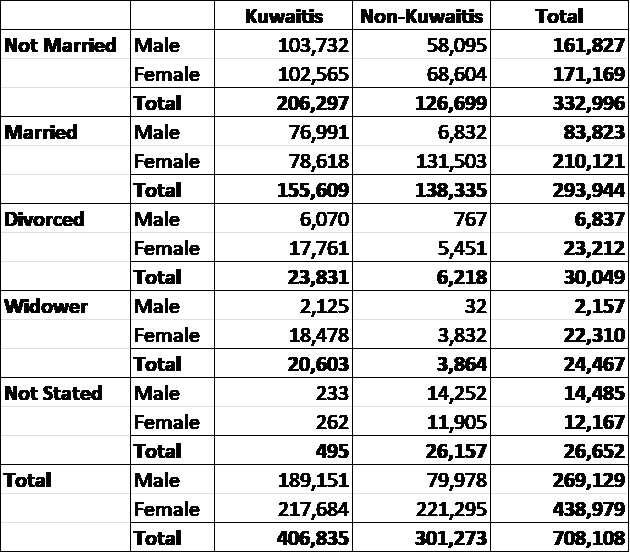
Source: Central Statistics Bureau (CSB)/The Public Authority for Civil Information (PACI)
ANNEXED NOTE
- Characteristics of data and definitions
The 2021 Kuwait census is the eleventh census conducted in the country, and the first to be based on administrative records.
The Ministry of State for Communications and Information Technology has implemented the records-based population, establishments and building census through cooperation with the Central Statistical Bureau (CSB) and the Public Authority for Civil Information (PACI).
The census data was selected from the recommended data basket guide for the Unified Population and Housing Register-based Census 2020 for the countries of the Cooperation Council for the Arab States of the Gulf issued by the Gulf Statistics Center for the year 2019, and from the data basket of the general census of the State of Kuwait 2011.
Individuals outside the workforce: Individuals aged 15 and over who do not work and do not seek employment during the census reference period. This includes:
- Full-time Students: (an individual aged 15 and over) who is studying regularly for the purpose of obtaining a scientific qualification and is not associated with earning work during the period of time attribution, bearing in mind that female domestic chores are not included in the work for the purpose of earning.
- 2. Full-time homemaker: a female (aged 15 and over) who is not employed or working and is not studying regularly and engages in housework for her family or supervises over housemaids working.
This definition does not apply to domestic workers who work in the homes of others and serve them in exchange for cash or interest wages.
- Has an Income:An individual (aged 15 and over) who is capable of working but is not associated with any work during the period of time assignment and does not look for it seriously, and studies irregularly to obtain a scientific qualification. As for females; not working full-time in their homes (or supervising over housemaids’ work).
He/she is an individual who lives from the revenue of his/ her property or real estate, from the interest of shares and bonds owned, or accessed by cash transfers of gifts or sufficient assistance regardless of their sources, whether governmental or private.
- Retired:This individual has retired for any reason and is not linked to any work. An individual (15 years and older) who has been referred to retirement or a retirement application until the date of the time assignment.
Other pensions and receipt of a pension – individuals outside manpower: individuals under 15 years of age, individuals 65 years of age and over who are not employed and totally unable to work during the census reference period.
- Unable to Work:An individual (aged 15 and over) who is unable to work due to a disability or illness that has put him\her out of work and is unable to work even if he\she wishes to.
- 65 Years of Age and over and Not Working:an individual who is 65 years of age and over and does not work.
Definitions and concepts used:
https://census.csb.gov.kw/CensusData_EN
- Institution which provides data
The Central Statistical Bureau (CSB)
https://www.csb.gov.kw/
https://www.csb.gov.kw/default_en
- Data availability
Kuwait Census 2021 page (Population, Housing and Establishments census):
https://census.csb.gov.kw/index_EN
Population census:
https://census.csb.gov.kw/CensusData_EN?id=1
Last date of access: 25 September 2023.
GLMM and GRC cannot guarantee that the link to access the source will not change; that the information will not be removed from the website it was obtained from; that no geo-blockages will be imposed; or that the information will not be available for any another reason.
Keywords: Kuwait, Education, Living Conditions, Foreign Population, National Population
| |
|
Kuwaitis |
Non-Kuwaitis |
|
| |
|
Student |
Full-time home-maker |
Retired – has income |
Total |
Student |
Full-time home-maker |
Retired – has income |
Total |
Total out of the labour force |
| 15-19 |
Male |
62,909 |
0 |
0 |
62,909 |
36,414 |
0 |
0 |
36,414 |
99,323 |
| |
Female |
60,699 |
1 |
0 |
60,700 |
35,103 |
2,892 |
0 |
37,995 |
98,695 |
| |
Total |
123,608 |
1 |
0 |
123,609 |
71,517 |
2,892 |
0 |
74,409 |
198,018 |
| 20-24 |
Male |
34,135 |
0 |
2 |
34,137 |
20,044 |
0 |
0 |
20,044 |
54,181 |
| |
Female |
40,203 |
10 |
0 |
40,213 |
24,243 |
2,966 |
0 |
27,209 |
67,422 |
| |
Total |
74,338 |
10 |
2 |
74,350 |
44,287 |
2,966 |
0 |
47,253 |
121,603 |
| 25-29 |
Male |
9,809 |
0 |
47 |
9,856 |
8,873 |
0 |
0 |
8,873 |
18,729 |
| |
Female |
8,979 |
65 |
10 |
9,054 |
13,281 |
12,533 |
0 |
25,814 |
34,868 |
| |
Total |
18,788 |
65 |
57 |
18,910 |
22,154 |
12,533 |
0 |
34,687 |
53,597 |
| 30-34 |
Male |
4,024 |
0 |
186 |
4,210 |
7,182 |
0 |
0 |
7,182 |
11,392 |
| |
Female |
3,914 |
201 |
86 |
4,201 |
9,341 |
21,401 |
0 |
30,742 |
34,943 |
| |
Total |
7,938 |
201 |
272 |
8,411 |
16,523 |
21,401 |
0 |
37,924 |
46,335 |
| 35-39 |
Male |
2,371 |
0 |
586 |
2,957 |
3,582 |
0 |
2 |
3,584 |
6,541 |
| |
Female |
2,762 |
379 |
528 |
3,669 |
4,710 |
22,867 |
1 |
27,578 |
31,247 |
| |
Total |
5,133 |
379 |
1,114 |
6,626 |
8,292 |
22,867 |
3 |
31,162 |
37,788 |
| 40-44 |
Male |
1,077 |
0 |
3,128 |
4,205 |
1,694 |
0 |
6 |
1,700 |
5,905 |
| |
Female |
1,733 |
852 |
1,951 |
4,536 |
2,733 |
18,234 |
3 |
20,970 |
25,506 |
| |
Total |
2,810 |
852 |
5,079 |
8,741 |
4,427 |
18,234 |
9 |
22,670 |
31,411 |
| 45-49 |
Male |
618 |
0 |
9,007 |
9,625 |
1,104 |
0 |
3 |
1,107 |
10,732 |
| |
Female |
2,213 |
1,712 |
6,662 |
10,587 |
1,735 |
13,772 |
1 |
15,508 |
26,095 |
| |
Total |
2,831 |
1,712 |
15,669 |
20,212 |
2,839 |
13,772 |
4 |
16,615 |
36,827 |
| 50-54 |
Male |
350 |
0 |
13,966 |
14,316 |
433 |
0 |
5 |
438 |
14,754 |
| |
Female |
2,355 |
3,893 |
10,862 |
17,110 |
731 |
11,451 |
3 |
12,185 |
29,295 |
| |
Total |
2,705 |
3,893 |
24,828 |
31,426 |
1,164 |
11,451 |
8 |
12,623 |
44,049 |
| 55-59 |
Male |
97 |
0 |
16,533 |
16,630 |
83 |
0 |
35 |
118 |
16,748 |
| |
Female |
836 |
7,158 |
11,758 |
19,752 |
178 |
8,704 |
2 |
8,884 |
28,636 |
| |
Total |
933 |
7,158 |
28,291 |
36,382 |
261 |
8,704 |
37 |
9,002 |
45,384 |
| 60-64 |
Male |
23 |
0 |
13,166 |
13,189 |
18 |
0 |
35 |
53 |
13,242 |
| |
Female |
245 |
7,527 |
10,484 |
18,256 |
48 |
6,134 |
3 |
6,185 |
24,441 |
| |
Total |
268 |
7,527 |
23,650 |
31,445 |
66 |
6,134 |
38 |
6,238 |
37,683 |
| 65+ |
Male |
8 |
0 |
17,109 |
17,117 |
7 |
0 |
458 |
465 |
17,582 |
| |
Female |
187 |
19,580 |
9,839 |
29,606 |
37 |
8,188 |
0 |
8,225 |
37,831 |
| |
Total |
195 |
19,580 |
26,948 |
46,723 |
44 |
8,188 |
458 |
8,690 |
55,413 |
| Total |
Male |
115,421 |
0 |
73,730 |
189,151 |
79,434 |
0 |
544 |
79,978 |
269,129 |
| |
Female |
124,126 |
41,378 |
52,180 |
217,684 |
92,140 |
129,142 |
13 |
221,295 |
438,979 |
| |
Total |
239,547 |
41,378 |
125,910 |
406,835 |
171,574 |
129,142 |
557 |
301,273 |
708,108 |
Source: Central Statistics Bureau (CSB)/The Public Authority for Civil Information (PACI)
ANNEXED NOTE
- Characteristics of data and definitions
The 2021 Kuwait census is the eleventh census conducted in the country, and the first to be based on administrative records.
The Ministry of State for Communications and Information Technology has implemented the records-based population, establishments and building census through cooperation with the Central Statistical Bureau (CSB) and the Public Authority for Civil Information (PACI).
The census data was selected from the recommended data basket guide for the Unified Population and Housing Register-based Census 2020 for the countries of the Cooperation Council for the Arab States of the Gulf issued by the Gulf Statistics Center for the year 2019, and from the data basket of the general census of the State of Kuwait 2011.
Individuals outside the workforce: Individuals aged 15 and over who do not work and do not seek employment during the census reference period. This includes:
- Full-time Students: (an individual aged 15 and over) who is studying regularly for the purpose of obtaining a scientific qualification and is not associated with earning work during the period of time attribution, bearing in mind that female domestic chores are not included in the work for the purpose of earning.
- 2. Full-time homemaker: a female (aged 15 and over) who is not employed or working and is not studying regularly and engages in housework for her family or supervises over housemaids working.
This definition does not apply to domestic workers who work in the homes of others and serve them in exchange for cash or interest wages.
- Has an Income:An individual (aged 15 and over) who is capable of working but is not associated with any work during the period of time assignment and does not look for it seriously, and studies irregularly to obtain a scientific qualification. As for females; not working full-time in their homes (or supervising over housemaids’ work).
He/she is an individual who lives from the revenue of his/ her property or real estate, from the interest of shares and bonds owned, or accessed by cash transfers of gifts or sufficient assistance regardless of their sources, whether governmental or private.
- Retired:This individual has retired for any reason and is not linked to any work. An individual (15 years and older) who has been referred to retirement or a retirement application until the date of the time assignment.
Other pensions and receipt of a pension – individuals outside manpower: individuals under 15 years of age, individuals 65 years of age and over who are not employed and totally unable to work during the census reference period.
- Unable to Work:An individual (aged 15 and over) who is unable to work due to a disability or illness that has put him\her out of work and is unable to work even if he\she wishes to.
- 65 Years of Age and over and Not Working:an individual who is 65 years of age and over and does not work.
Definitions and concepts used:
https://census.csb.gov.kw/CensusData_EN
- Institution which provides data
The Central Statistical Bureau (CSB)
https://www.csb.gov.kw/
https://www.csb.gov.kw/default_en
- Data availability
Kuwait Census 2021 page (Population, Housing and Establishments census):
https://census.csb.gov.kw/index_EN
Population census:
https://census.csb.gov.kw/CensusData_EN?id=1
Last date of access: 25 September 2023.
GLMM and GRC cannot guarantee that the link to access the source will not change; that the information will not be removed from the website it was obtained from; that no geo-blockages will be imposed; or that the information will not be available for any another reason.
Keywords: Kuwait, Education, Living Conditions, Foreign Population, National Population
| |
Emiratis |
Non-Emiratis |
Total |
| 2018 |
27,055 |
4,953,217 |
4,980,272 |
| 2019 |
26,921 |
5,067,486 |
5,094,407 |
| 2020 |
28,912 |
4,770,284 |
4,799,196 |
| 2021 |
29,810 |
4,880,300 |
4,910,110 |
| 2022 |
50,228 |
5,526,227 |
5,576,455 |
| June 2023 |
79,000 |
5,829,377 |
5,908,377 |
Sources: Labour Market Information System and “News” section, Ministry of Human Resources and Emiratisation (MoHRE)
ANNEXED NOTE
- Characteristics of data
The figures pertain to the number of Emiratis and foreign nationals registered with the MoHRE, as employed in the UAE private sector.
Employed persons: Individuals who are already engaged in productive work: it includes individual who are employed, even if they do not work because of illness or injury, holiday or for irregular work at the facilities in which they work for temporary or incidental reasons. This category also includes full-time and part-time workers.
Figures of Emiratis employed in the private sector since 2018 were publicly disclosed in July 2023, in the “news” section of MoHRE’s website, in an assessment of the “Nafis” programme of Emiratisation of the private sector launched in 2021.
The figures of non-Emiratis in the private sector were calculated on the basis of the annual total figures of employed workers in the sector until 2022 (end of year data) and for June 2023, published on MoHRE’s website. The figures of employed Emiratis since 2018 are the ones disclosed in the news article.
Reference period: end of year, unless stated otherwise.
Workers employed in the Free Zones are not included in the figures.
Total figures published during past years may have been readjusted by MoHRE in this dataset.
- Institution which provides data
Ministry of Human Resources and Emiratisation (MOHRE)
http://www.mohre.gov.ae/en/home.aspx
- Data availability
Total workers’ data is taken from the “open data” section of MoHRE website (“Statistical Reports” section): https://www.mohre.gov.ae/en/data-library/statistical-report.aspx
Total workers 2011-2022 (private sector): https://www.mohre.gov.ae/handlers/download.ashx?YXNzZXQ9Nzc0MQ==
Figures of Emiratis employed in the private sector (2018-June 2023): “Ministry Reveals That 79,000 Emiratis Work In Private Sector As Emiratisation Semi-Annual Deadline Ends”, MoHRE News, 29 July 2023.
Date of access: 22 October 2023.
GLMM and GRC cannot guarantee that the link to access the source will not change; that the information will not be removed from the website it was obtained from; that no geo-blockages will be imposed; or that the information will not be available for any another reason.
Keywords: United Arab Emirates, Labour Market, Employment, National Labour, Foreign Labour.
| |
Kuwaitis |
Non-Kuwaitis |
Total |
| |
Males |
Females |
Total |
Males |
Females |
Total |
Males |
Females |
Total |
| 15-19 |
23 |
9 |
32 |
0 |
0 |
0 |
23 |
9 |
32 |
| 20-24 |
1,107 |
268 |
1,375 |
0 |
0 |
0 |
1,107 |
268 |
1,375 |
| 25-29 |
2,282 |
1,247 |
3,529 |
4 |
6 |
10 |
2,286 |
1,253 |
3,539 |
| 30-34 |
1,799 |
1,583 |
3,382 |
53 |
38 |
91 |
1,852 |
1,621 |
3,473 |
| 35-39 |
1,315 |
1,548 |
2,863 |
151 |
102 |
253 |
1,466 |
1,650 |
3,116 |
| 40-44 |
1,015 |
1,320 |
2,335 |
199 |
98 |
297 |
1,214 |
1,418 |
2,632 |
| 45-49 |
1,029 |
1,217 |
2,246 |
234 |
57 |
291 |
1,263 |
1,274 |
2,537 |
| 50-54 |
821 |
1,011 |
1,832 |
321 |
26 |
347 |
1,142 |
1,037 |
2,179 |
| 55-59 |
650 |
782 |
1,432 |
726 |
28 |
754 |
1,376 |
810 |
2,186 |
| 60-64 |
233 |
70 |
303 |
538 |
22 |
560 |
771 |
92 |
863 |
| 65+ |
559 |
524 |
1,083 |
936 |
41 |
977 |
1,495 |
565 |
2,060 |
| Total |
10,833 |
9,579 |
20,412 |
3,162 |
418 |
3,580 |
13,995 |
9,997 |
23,992 |
Source: Central Statistics Bureau (CSB)/The Public Authority for Civil Information (PACI)
ANNEXED NOTE
- Characteristics of data and definitions
The 2021 Kuwait census is the eleventh census conducted in the country, and the first to be based on administrative records.
The Ministry of State for Communications and Information Technology has implemented the records-based population, establishments and building census through cooperation with the Central Statistical Bureau (CSB) and the Public Authority for Civil Information (PACI).
The census data was selected from the recommended data basket guide for the Unified Population and Housing Register-based Census 2020 for the countries of the Cooperation Council for the Arab States of the Gulf issued by the Gulf Statistics Center for the year 2019, and from the data basket of the general census of the State of Kuwait 2011.
Definition of unemployment:
Unemployed who has previously been employed: An individual (15-64 years) who has previously been engaged in work in Kuwait for the purpose of earning, but who is not associated with any work during the period of time assignment or searching for a job. His\her working hours in the week of time assignment were not less than 15 hours.
Newly unemployed: Any individual (15-64 years) who has never been associated with any fruitful work in the State of Kuwait despite having the motivation to work and searching for a job during the period of time attribution but does not find it.
Definitions and concepts used:
https://census.csb.gov.kw/CensusData_EN
- Institution which provides data
The Central Statistical Bureau (CSB)
https://www.csb.gov.kw/
https://www.csb.gov.kw/default_en
- Data availability
Kuwait Census 2021 page (Population, Housing and Establishments census):
https://census.csb.gov.kw/index_EN
Population census:
https://census.csb.gov.kw/CensusData_EN?id=1
Last date of access: 25 September 2023.
GLMM and GRC cannot guarantee that the link to access the source will not change; that the information will not be removed from the website it was obtained from; that no geo-blockages will be imposed; or that the information will not be available for any another reason.
Keywords: Kuwait, Labour Market, Unemployment, Foreign Labour, National Labour
| |
Kuwaitis |
Non-Kuwaitis |
Total |
| |
Males |
Females |
Total |
Males |
Females |
Total |
Males |
Females |
Total |
| Agriculture, forestry and fishing |
62 |
92 |
154 |
44,485 |
143 |
44,628 |
44,547 |
235 |
44,782 |
| Mining and quarrying |
9,523 |
1,883 |
11,406 |
8,436 |
667 |
9,103 |
17,959 |
2,550 |
20,509 |
| Manufacturing |
8,343 |
3,730 |
12,073 |
118,177 |
5,043 |
123,220 |
126,520 |
8,773 |
135,293 |
| Electricity, gas, steam and air conditioning supply |
4,701 |
782 |
5,483 |
234 |
3 |
237 |
4,935 |
785 |
5,720 |
| Water supply; sewerage, waste management and remediation activities |
8,845 |
1,970 |
10,815 |
422 |
7 |
429 |
9,267 |
1,977 |
11,244 |
| Construction |
10,554 |
10,032 |
20,586 |
304,430 |
16,608 |
321,038 |
314,984 |
26,640 |
341,624 |
| Wholesale and retail trade; repair of motor vehicles and motorcycles |
8,260 |
10,565 |
18,825 |
348,668 |
33,396 |
382,064 |
356,928 |
43,961 |
400,889 |
| Transportation and storage |
7,276 |
2,574 |
9,850 |
57,187 |
1,865 |
59,052 |
64,463 |
4,439 |
68,902 |
| Accommodation and food service activities |
1,100 |
1,432 |
2,532 |
92,173 |
10,793 |
102,966 |
93,273 |
12,225 |
105,498 |
| Information and communication |
5,909 |
2,631 |
8,540 |
5,705 |
897 |
6,602 |
11,614 |
3,528 |
15,142 |
| Financial and insurance activities |
9,184 |
7,774 |
16,958 |
12,058 |
2,282 |
14,340 |
21,242 |
10,056 |
31,298 |
| Real estate activities |
651 |
425 |
1,076 |
10,110 |
600 |
10,710 |
10,761 |
1,025 |
11,786 |
| Professional, scientific and technical activities |
7,153 |
4,385 |
11,538 |
110,290 |
10,036 |
120,326 |
117,443 |
14,421 |
131,864 |
| Administrative and support service activities |
1,308 |
686 |
1,994 |
19,180 |
1,244 |
20,424 |
20,488 |
1,930 |
22,418 |
| Public administration and defence; compulsory social security |
111,855 |
79,054 |
190,909 |
41,528 |
9,513 |
51,041 |
153,383 |
88,567 |
241,950 |
| Education |
17,353 |
83,822 |
101,175 |
21,832 |
27,705 |
49,537 |
39,185 |
111,527 |
150,712 |
| Human health and social work activities |
4,349 |
9,561 |
13,910 |
18,520 |
28,841 |
47,361 |
22,869 |
38,402 |
61,271 |
| Arts, entertainment and recreation |
419 |
773 |
1,192 |
14,812 |
1,141 |
15,953 |
15,231 |
1,914 |
17,145 |
| Other service activities |
1,799 |
1,435 |
3,234 |
30,655 |
14,697 |
45,352 |
32,454 |
16,132 |
48,586 |
| Activities of households as employers; undifferentiated goods- and services-producing activities of households for own use |
0 |
0 |
0 |
309,984 |
326,148 |
636,132 |
309,984 |
326,148 |
636,132 |
| Activities of extraterritorial organizations and bodies |
19 |
6 |
25 |
345 |
134 |
479 |
364 |
140 |
504 |
| Not stated |
1,123 |
1,376 |
2,499 |
37,267 |
3,064 |
40,331 |
38,390 |
4,440 |
42,830 |
| Total |
219,786 |
224,988 |
444,774 |
1,606,498 |
494,827 |
2,101,325 |
1,826,284 |
719,815 |
2,546,099 |
Source: Central Statistics Bureau (CSB)/The Public Authority for Civil Information (PACI)
ANNEXED NOTE
- Characteristics of data and definitions
The 2021 Kuwait census is the eleventh census conducted in the country, and the first to be based on administrative records.
The Ministry of State for Communications and Information Technology has implemented the records-based population, establishments and building census through cooperation with the Central Statistical Bureau (CSB) and the Public Authority for Civil Information (PACI).
The census data was selected from the recommended data basket guide for the Unified Population and Housing Register-based Census 2020 for the countries of the Cooperation Council for the Arab States of the Gulf issued by the Gulf Statistics Center for the year 2019, and from the data basket of the general census of the State of Kuwait 2011.
Definition of employment:
Individuals aged 15 and over and are engaged in any economic activity during the census reference period, including:
- Employer: An employed individual (aged 15 and over) who works in or owns part of an enterprise and under the supervision of at least one employee with a monetary wage (shareholders in shareholding companies are not considered employers even if they are employed).
- Self-Employed: An employed individual (aged 15 years and over) who works in or owns a part of an enterprise and not a monetary-paid employee, including street vendors who do not do business for others.
iii. Paid Worker: Employed person (aged 15 and over) who works for another individual or for his\her enterprise under his\her supervision and receives for his\her employment a lump-sum monetary wage (for the hour, day, week, month or year) this monetary remuneration may be calculated on the basis of production and may be in the form of commission, brokerage or any other way. Workers working in the ministries of the State and its various entities, as well as those working on monetary remuneration in the participating companies, are considered to be in this category.
- Unpaid Worker: An employed individual (aged 15 and over) who works for another relative, has no connection or works in an enterprise, is not paid for his\her work and does not have a lump-sum share of profits. Under this definition, individuals who learn a particular trade even if they are paid a lump sum in cash.
Definitions and concepts used:
https://census.csb.gov.kw/CensusData_EN
Classification of activities: ISIC Rev. 4.
https://ilostat.ilo.org/resources/concepts-and-definitions/classification-economic-activities/
- Institution which provides data
The Central Statistical Bureau (CSB)
https://www.csb.gov.kw/
https://www.csb.gov.kw/default_en
- Data availability
Kuwait Census 2021 page (Population, Housing and Establishments census):
https://census.csb.gov.kw/index_EN
Population census:
https://census.csb.gov.kw/CensusData_EN?id=1
Last date of access: 25 September 2023.
GLMM and GRC cannot guarantee that the link to access the source will not change; that the information will not be removed from the website it was obtained from; that no geo-blockages will be imposed; or that the information will not be available for any another reason.
Keywords: Kuwait, Labour Market, Employment, Foreign Labour, National Labour, Female Employment
| |
Kuwaitis |
Non-Kuwaitis |
Total |
| |
Males |
Females |
Total |
Males |
Females |
Total |
Males |
Females |
Total |
| Illiterate |
0 |
1 |
1 |
255 |
6 |
261 |
255 |
7 |
262 |
| Reads and writes |
25 |
9 |
34 |
427 |
19 |
446 |
452 |
28 |
480 |
| Primary education |
1,141 |
589 |
1,730 |
406 |
13 |
419 |
1,547 |
602 |
2,149 |
| Intermediate |
1,866 |
1,406 |
3,272 |
867 |
40 |
907 |
2,733 |
1,446 |
4,179 |
| Secondary and equivalent |
4,821 |
3,900 |
8,721 |
694 |
70 |
764 |
5,515 |
3,970 |
9,485 |
| Post-secondary and below university |
650 |
771 |
1,421 |
43 |
34 |
77 |
693 |
805 |
1,498 |
| BA or equivalent |
1,258 |
1,971 |
3,229 |
219 |
214 |
433 |
1,477 |
2,185 |
3,662 |
| MA and above |
56 |
32 |
88 |
7 |
3 |
10 |
63 |
35 |
98 |
| Not Stated |
1,016 |
900 |
1,916 |
244 |
19 |
263 |
1,260 |
919 |
2,179 |
| Total |
10,833 |
9,579 |
20,412 |
3,162 |
418 |
3,580 |
13,995 |
9,997 |
23,992 |
Source: Central Statistics Bureau (CSB)/The Public Authority for Civil Information (PACI)
ANNEXED NOTE
- Characteristics of data and definitions
The 2021 Kuwait census is the eleventh census conducted in the country, and the first to be based on administrative records.
The Ministry of State for Communications and Information Technology has implemented the records-based population, establishments and building census through cooperation with the Central Statistical Bureau (CSB) and the Public Authority for Civil Information (PACI).
The census data was selected from the recommended data basket guide for the Unified Population and Housing Register-based Census 2020 for the countries of the Cooperation Council for the Arab States of the Gulf issued by the Gulf Statistics Center for the year 2019, and from the data basket of the general census of the State of Kuwait 2011.
Education level: refers to degree or educational attainment in any language.
Definition of unemployment:
Unemployed who has previously been employed: An individual (15-64 years) who has previously been engaged in work in Kuwait for the purpose of earning, but who is not associated with any work during the period of time assignment or searching for a job. His\her working hours in the week of time assignment were not less than 15 hours.
Newly unemployed: Any individual (15-64 years) who has never been associated with any fruitful work in the State of Kuwait despite having the motivation to work and searching for a job during the period of time attribution but does not find it.
Definitions and concepts used:
https://census.csb.gov.kw/CensusData_EN
- Institution which provides data
The Central Statistical Bureau (CSB)
https://www.csb.gov.kw/
https://www.csb.gov.kw/default_en
- Data availability
Kuwait Census 2021 page (Population, Housing and Establishments census):
https://census.csb.gov.kw/index_EN
Population census:
https://census.csb.gov.kw/CensusData_EN?id=1
Last date of access: 25 September 2023.
GLMM and GRC cannot guarantee that the link to access the source will not change; that the information will not be removed from the website it was obtained from; that no geo-blockages will be imposed; or that the information will not be available for any another reason.
Keywords: Kuwait, Labour Market, Unemployment, Foreign Labour, National Labour
| Kuwaitis |
465,186 |
| GCC citizens |
28,877 |
| Arabs |
596,730 |
| Asians |
1,425,823 |
| Sub-Saharan Africans |
36,137 |
| Europeans |
8,047 |
| North Americans |
7,935 |
| South Americans |
829 |
| Australians/Oceanians |
527 |
| Total non-Kuwaitis |
2,104,905 |
| Total |
2,570,091 |
Source: Central Statistics Bureau (CSB)/The Public Authority for Civil Information (PACI)
ANNEXED NOTE
- Characteristics of data and definitions
The 2021 Kuwait census is the eleventh census conducted in the country, and the first to be based on administrative records.
The Ministry of State for Communications and Information Technology has implemented the records-based population, establishments and building census through cooperation with the Central Statistical Bureau (CSB) and the Public Authority for Civil Information (PACI).
The census data was selected from the recommended data basket guide for the Unified Population and Housing Register-based Census 2020 for the countries of the Cooperation Council for the Arab States of the Gulf issued by the Gulf Statistics Center for the year 2019, and from the data basket of the general census of the State of Kuwait 2011.
Definition of labour force:
Individuals within the labour force are aged 15 and over and are engaged in any economic activity or are seeking employment but do not find it (unemployed) during the census reference period, including:
- Employer: An employed individual (aged 15 and over) who works in or owns part of an enterprise and under the supervision of at least one employee with a monetary wage (shareholders in shareholding companies are not considered employers even if they are employed).
- Self-Employed: An employed individual (aged 15 years and over) who works in or owns a part of an enterprise and not a monetary-paid employee, including street vendors who do not do business for others.
iii. Paid Worker: Employed person (aged 15 and over) who works for another individual or for his\her enterprise under his\her supervision and receives for his\her employment a lump-sum monetary wage (for the hour, day, week, month or year) this monetary remuneration may be calculated on the basis of production and may be in the form of commission, brokerage or any other way. Workers working in the ministries of the State and its various entities, as well as those working on monetary remuneration in the participating companies, are considered to be in this category.
- Unpaid Worker: An employed individual (aged 15 and over) who works for another relative, has no connection or works in an enterprise, is not paid for his\her work and does not have a lump-sum share of profits. Under this definition, individuals who learn a particular trade even if they are paid a lump sum in cash.
- Unemployed who has previously been employed: An individual (15-64 years) who has previously been engaged in work in Kuwait for the purpose of earning, but who is not associated with any work during the period of time assignment or searching for a job. His\her working hours in the week of time assignment were not less than 15 hours.
- Newly Unemployed:Any individual (15-64 years) who has never been associated with any fruitful work in the State of Kuwait despite having the motivation to work and searching for a job during the period of time attribution but does not find it.
Definitions and concepts used in the census:
https://census.csb.gov.kw/CensusData_EN
- Institution which provides data
The Central Statistical Bureau (CSB)
https://www.csb.gov.kw/
https://www.csb.gov.kw/default_en
- Data availability
Kuwait Census 2021 page (Population, Housing and Establishments census):
https://census.csb.gov.kw/index_EN
Population census:
https://census.csb.gov.kw/CensusData_EN?id=1
Last date of access: 05 September 2023.
GLMM and GRC cannot guarantee that the link to access the source will not change; that the information will not be removed from the website it was obtained from; that no geo-blockages will be imposed; or that the information will not be available for any another reason.
Keywords: Kuwait, Labour Market, Employment, Foreign Labour, National Labour, Asia, Africa, Europe, Arab Countries, Oceania, North America, South America
| |
Kuwaitis |
Non-Kuwaitis |
Total |
| |
Males |
Females |
Total |
Males |
Females |
Total |
Males |
Females |
Total |
| Legislators, Senior officials and Managers |
66,359 |
19,330 |
85,689 |
90,957 |
10,660 |
101,617 |
157,316 |
29,990 |
187,306 |
| Professionals |
44,208 |
87,448 |
131,656 |
90,255 |
34,216 |
124,471 |
134,463 |
121,664 |
256,127 |
| Technicians and Associate Professionals |
60,300 |
55,099 |
115,399 |
284,028 |
50,768 |
334,796 |
344,328 |
105,867 |
450,195 |
| Clerical Support Workers |
29,119 |
47,783 |
76,902 |
60,559 |
17,919 |
78,478 |
89,678 |
65,702 |
155,380 |
| Service and Sales Workers |
3,973 |
4,651 |
8,624 |
221,830 |
40,432 |
262,262 |
225,803 |
45,083 |
270,886 |
| Skilled Agricultural, Forestry and Fishery Workers |
195 |
1 |
196 |
14,027 |
1 |
14,028 |
14,222 |
2 |
14,224 |
| Craft and Related Trades Workers |
4,930 |
3,764 |
8,694 |
142,237 |
3,570 |
145,807 |
147,167 |
7,334 |
154,501 |
| Plant and Machine Operators and Assemblers |
3,026 |
505 |
3,531 |
417,056 |
535 |
417,591 |
420,082 |
1,040 |
421,122 |
| Elementary Occupations |
20 |
20 |
40 |
268,878 |
331,904 |
600,782 |
268,898 |
331,924 |
600,822 |
| Not Stated |
7,656 |
6,387 |
14,043 |
16,671 |
4,822 |
21,493 |
24,327 |
11,209 |
35,536 |
| Total |
219,786 |
224,988 |
444,774 |
1,606,498 |
494,827 |
2,101,325 |
1,826,284 |
719,815 |
2,546,099 |
Source: Central Statistics Bureau (CSB)/The Public Authority for Civil Information (PACI)
ANNEXED NOTE
- Characteristics of data and definitions
The 2021 Kuwait census is the eleventh census conducted in the country, and the first to be based on administrative records. The Ministry of State for Communications and Information Technology has implemented the records-based population, establishments and building census through cooperation with the Central Statistical Bureau (CSB) and the Public Authority for Civil Information (PACI).
The census data was selected from the recommended data basket guide for the Unified Population and Housing Register-based Census 2020 for the countries of the Cooperation Council for the Arab States of the Gulf issued by the Gulf Statistics Center for the year 2019, and from the data basket of the general census of the State of Kuwait 2011.
Definition of employment:
Individuals aged 15 and over and are engaged in any economic activity during the census reference period, including:
- Employer: An employed individual (aged 15 and over) who works in or owns part of an enterprise and under the supervision of at least one employee with a monetary wage (shareholders in shareholding companies are not considered employers even if they are employed).
- Self-Employed: An employed individual (aged 15 years and over) who works in or owns a part of an enterprise and not a monetary-paid employee, including street vendors who do not do business for others.
iii. Paid Worker: Employed person (aged 15 and over) who works for another individual or for his\her enterprise under his\her supervision and receives for his\her employment a lump-sum monetary wage (for the hour, day, week, month or year) this monetary remuneration may be calculated on the basis of production and may be in the form of commission, brokerage or any other way. Workers working in the ministries of the State and its various entities, as well as those working on monetary remuneration in the participating companies, are considered to be in this category.
- Unpaid Worker: An employed individual (aged 15 and over) who works for another relative, has no connection or works in an enterprise, is not paid for his\her work and does not have a lump-sum share of profits. Under this definition, individuals who learn a particular trade even if they are paid a lump sum in cash.
Definitions and concepts used:
https://census.csb.gov.kw/CensusData_EN
Classification of occupations used: ISCO-08
https://ilostat.ilo.org/resources/concepts-and-definitions/classification-occupation/
- Institution which provides data
The Central Statistical Bureau (CSB)
https://www.csb.gov.kw/
https://www.csb.gov.kw/default_en
- Data availability
Kuwait Census 2021 page (Population, Housing and Establishments census):
https://census.csb.gov.kw/index_EN
Population census:
https://census.csb.gov.kw/CensusData_EN?id=1
Last date of access: 15 September 2023.
GLMM and GRC cannot guarantee that the link to access the source will not change; that the information will not be removed from the website it was obtained from; that no geo-blockages will be imposed; or that the information will not be available for any another reason.
Keywords: Kuwait, Labour Market, Employment, Foreign Labour, National Labour, Female Employment
| |
Kuwaitis |
Non- Kuwaitis |
Total |
| |
Males |
Females |
Total |
Males |
Females |
Total |
Males |
Females |
Total |
| Less than 1 year |
16,911 |
15,860 |
32,771 |
8,928 |
8,483 |
17,411 |
25,839 |
24,343 |
50,182 |
| 1-4 |
62,966 |
61,810 |
124,776 |
47,627 |
47,086 |
94,713 |
110,593 |
108,896 |
219,489 |
| 5-9 |
87,292 |
82,393 |
169,685 |
75,842 |
71,866 |
147,708 |
163,134 |
154,259 |
317,393 |
| 10-14 |
88,104 |
83,914 |
172,018 |
74,787 |
70,185 |
144,972 |
162,891 |
154,099 |
316,990 |
| 15-19 |
76,609 |
75,089 |
151,698 |
55,679 |
52,907 |
108,586 |
132,288 |
127,996 |
260,284 |
| 20-24 |
66,815 |
65,104 |
131,919 |
62,238 |
44,489 |
106,727 |
129,053 |
109,593 |
238,646 |
| 25-29 |
66,647 |
64,461 |
131,108 |
239,562 |
86,968 |
326,530 |
306,209 |
151,429 |
457,638 |
| 30-34 |
48,975 |
52,607 |
101,582 |
288,214 |
125,939 |
414,153 |
337,189 |
178,546 |
515,735 |
| 35-39 |
52,231 |
56,948 |
109,179 |
363,465 |
164,133 |
527,598 |
415,696 |
221,081 |
636,777 |
| 40-44 |
42,233 |
45,508 |
87,741 |
334,328 |
140,911 |
475,239 |
376,561 |
186,419 |
562,980 |
| 45-49 |
34,203 |
39,923 |
74,126 |
245,893 |
111,643 |
357,536 |
280,096 |
151,566 |
431,662 |
| 50-54 |
29,381 |
34,453 |
63,834 |
181,928 |
75,451 |
257,379 |
211,309 |
109,904 |
321,213 |
| 55-59 |
24,419 |
29,126 |
53,545 |
114,223 |
43,782 |
158,005 |
138,642 |
72,908 |
211,550 |
| 60-64 |
17,572 |
22,913 |
40,485 |
54,780 |
22,135 |
76,915 |
72,352 |
45,048 |
117,400 |
| 65-69 |
12,779 |
17,485 |
30,264 |
24,294 |
10,517 |
34,811 |
37,073 |
28,002 |
65,075 |
| 70-74 |
7,492 |
11,399 |
18,891 |
9,966 |
5,345 |
15,311 |
17,458 |
16,744 |
34,202 |
| 75-79 |
4,791 |
7,473 |
12,264 |
4,196 |
3,095 |
7,291 |
8,987 |
10,568 |
19,555 |
| 80+ |
4,818 |
6,372 |
11,190 |
2,869 |
2,738 |
5,607 |
7,687 |
9,110 |
16,797 |
| Total |
744,238 |
772,838 |
1,517,076 |
2,188,819 |
1,087,673 |
3,276,492 |
2,933,057 |
1,860,511 |
4,793,568 |
Source: Central Statistics Bureau (CSB)
ANNEXED NOTE
- Characteristics of data and definitions
Date of reference: December 2022.
Estimates based on census 2021 as a base year.
The Kuwaiti population for following years is estimated using natural increase figures (births – deaths) and number of naturalised non-nationals during the year.
The non-Kuwaiti population is estimated based on natural increase figures (births – deaths) and net migration (entries – exits).
Source of the births and deaths data (vital statistics records): The Public Authority for Civil Information (PACI).
Source of data on arrivals and departures: Ministry of Interior.
- Institution which provides data
The Central Statistical Bureau (CSB)
https://www.csb.gov.kw/
https://www.csb.gov.kw/default_en
- Data availability
CSB website, “Population Estimates” section; “Population Estimates in Kuwait by Age, Nationality and Sex at 1-1-2023”
https://www.csb.gov.kw/Pages/Statistics_en?ID=67&ParentCatID=1.
Last date of access: 15 September 2023.
GLMM and GRC cannot guarantee that the link to access the source will not change; that the information will not be removed from the website it was obtained from; that no geo-blockages will be imposed; or that the information will not be available for any another reason.
Keywords: Kuwait, National Population, Foreign Population
| |
Male |
Female |
Total |
| Kuwaitis |
230,619 |
234,567 |
465,186 |
| GCC citizens |
24,633 |
4,244 |
28,877 |
| Arabs |
536,985 |
59,745 |
596,730 |
| Asians |
1,027,112 |
398,711 |
1,425,823 |
| Sub-Saharan Africans |
8,946 |
27,191 |
36,137 |
| Europeans |
5,191 |
2,856 |
8,047 |
| North Americans |
5,790 |
2,145 |
7,935 |
| South Americans |
605 |
224 |
829 |
| Australians/Oceanians |
398 |
129 |
527 |
| Total |
1,840,279 |
729,812 |
2,570,091 |
Source: Central Statistics Bureau (CSB)/The Public Authority for Civil Information (PACI)
ANNEXED NOTE
- Characteristics of data and definitions
The 2021 Kuwait census is the eleventh census conducted in the country, and the first to be based on administrative records.
The Ministry of State for Communications and Information Technology has implemented the records-based population, establishments and building census through cooperation with the Central Statistical Bureau (CSB) and the Public Authority for Civil Information (PACI).
The census data was selected from the recommended data basket guide for the Unified Population and Housing Register-based Census 2020 for the countries of the Cooperation Council for the Arab States of the Gulf issued by the Gulf Statistics Center for the year 2019, and from the data basket of the general census of the State of Kuwait 2011.
Definition of labour force:
Individuals within the labour force are aged 15 and over and are engaged in any economic activity or are seeking employment but do not find it (unemployed) during the census reference period, including:
- Employer: An employed individual (aged 15 and over) who works in or owns part of an enterprise and under the supervision of at least one employee with a monetary wage (shareholders in shareholding companies are not considered employers even if they are employed).
- Self-Employed: An employed individual (aged 15 years and over) who works in or owns a part of an enterprise and not a monetary-paid employee, including street vendors who do not do business for others.
iii. Paid Worker: Employed person (aged 15 and over) who works for another individual or for his\her enterprise under his\her supervision and receives for his\her employment a lump-sum monetary wage (for the hour, day, week, month or year) this monetary remuneration may be calculated on the basis of production and may be in the form of commission, brokerage or any other way. Workers working in the ministries of the State and its various entities, as well as those working on monetary remuneration in the participating companies, are considered to be in this category.
- Unpaid Worker: An employed individual (aged 15 and over) who works for another relative, has no connection or works in an enterprise, is not paid for his\her work and does not have a lump-sum share of profits. Under this definition, individuals who learn a particular trade even if they are paid a lump sum in cash.
- Unemployed who has previously been employed: An individual (15-64 years) who has previously been engaged in work in Kuwait for the purpose of earning, but who is not associated with any work during the period of time assignment or searching for a job. His\her working hours in the week of time assignment were not less than 15 hours.
- Newly Unemployed:Any individual (15-64 years) who has never been associated with any fruitful work in the State of Kuwait despite having the motivation to work and searching for a job during the period of time attribution but does not find it.
Definitions and concepts used in the census:
https://census.csb.gov.kw/CensusData_EN
- Institution which provides data
The Central Statistical Bureau (CSB)
https://www.csb.gov.kw/
https://www.csb.gov.kw/default_en
- Data availability
Kuwait Census 2021 page (Population, Housing and Establishments census):
https://census.csb.gov.kw/index_EN
Population census:
https://census.csb.gov.kw/CensusData_EN?id=1
Last date of access: 05 September 2023.
GLMM and GRC cannot guarantee that the link to access the source will not change; that the information will not be removed from the website it was obtained from; that no geo-blockages will be imposed; or that the information will not be available for any another reason.
Keywords: Kuwait, Labour Market, Employment, Foreign Labour, National Labour, Female Employment, Asia, Africa, Europe, Arab Countries, Oceania, North America, South America
| |
Not Married |
Married |
Divorced |
Widower |
Not Stated |
Total |
| |
Male |
Female |
Total |
Male |
Female |
Total |
Male |
Female |
Total |
Male |
Female |
Total |
Male |
Female |
Total |
Male |
Female |
Total |
| 15-19 |
40,157 |
36,468 |
76,625 |
155 |
1,040 |
1,195 |
1 |
63 |
64 |
2 |
1 |
3 |
6,730 |
6,373 |
13,103 |
47,045 |
43,945 |
90,990 |
| 20-24 |
40,769 |
25,749 |
66,518 |
13,186 |
8,907 |
22,093 |
79 |
543 |
622 |
4 |
12 |
16 |
4,758 |
3,923 |
8,681 |
58,796 |
39,134 |
97,930 |
| 25-29 |
130,471 |
33,517 |
163,988 |
107,567 |
47,119 |
154,686 |
582 |
1,548 |
2,130 |
47 |
63 |
110 |
4,850 |
2,964 |
7,814 |
243,517 |
85,211 |
328,728 |
| 30-34 |
140,062 |
36,473 |
176,535 |
160,564 |
90,745 |
251,309 |
1,335 |
2,586 |
3,921 |
83 |
204 |
287 |
2,916 |
1,535 |
4,451 |
304,960 |
131,543 |
436,503 |
| 35-39 |
124,857 |
31,927 |
156,784 |
174,921 |
100,523 |
275,444 |
2,025 |
3,050 |
5,075 |
80 |
315 |
395 |
151 |
75 |
226 |
302,034 |
135,890 |
437,924 |
| 40-44 |
113,720 |
27,758 |
141,478 |
163,072 |
90,171 |
253,243 |
2,180 |
2,733 |
4,913 |
109 |
452 |
561 |
963 |
114 |
1,077 |
280,044 |
121,228 |
401,272 |
| 45-49 |
79,157 |
20,593 |
99,750 |
123,973 |
68,851 |
192,824 |
1,866 |
2,097 |
3,963 |
127 |
576 |
703 |
724 |
149 |
873 |
205,847 |
92,266 |
298,113 |
| 50-54 |
54,391 |
12,563 |
66,954 |
94,348 |
45,659 |
140,007 |
1,887 |
1,740 |
3,627 |
158 |
767 |
925 |
366 |
106 |
472 |
151,150 |
60,835 |
211,985 |
| 55-59 |
26,175 |
5,685 |
31,860 |
62,387 |
25,823 |
88,210 |
1,417 |
1,274 |
2,691 |
168 |
1,040 |
1,208 |
139 |
52 |
191 |
90,286 |
33,874 |
124,160 |
| 60-64 |
7,777 |
1,966 |
9,743 |
31,656 |
12,792 |
44,448 |
916 |
724 |
1,640 |
181 |
1,100 |
1,281 |
38 |
28 |
66 |
40,568 |
16,610 |
57,178 |
| 65 + |
2,139 |
977 |
3,116 |
26,591 |
11,064 |
37,655 |
928 |
822 |
1,750 |
852 |
4,119 |
4,971 |
20 |
18 |
38 |
30,530 |
17,000 |
47,530 |
| Total |
759,675 |
233,676 |
993,351 |
958,420 |
502,694 |
1,461,114 |
13,216 |
17,180 |
30,396 |
1,811 |
8,649 |
10,460 |
21,655 |
15,337 |
36,992 |
1,754,777 |
777,536 |
2,532,313 |
Source: Central Statistics Bureau (CSB)/The Public Authority for Civil Information (PACI)
ANNEXED NOTE
- Characteristics of data and definitions:
The 2021 Kuwait census is the eleventh census conducted in the country, and the first to be based on administrative records.
The Ministry of State for Communications and Information Technology has implemented the records-based population, establishments and building census through cooperation with the Central Statistical Bureau (CSB) and the Public Authority for Civil Information (PACI).
The census data was selected from the recommended data basket guide for the Unified Population and Housing Register-based Census 2020 for the countries of the Cooperation Council for the Arab States of the Gulf issued by the Gulf Statistics Center for the year 2019, and from the data basket of the general census of the State of Kuwait 2011.
Definitions and concepts used in the census:
https://census.csb.gov.kw/CensusData_EN
- Institution which provides data:
The Central Statistical Bureau (CSB)
https://www.csb.gov.kw/
https://www.csb.gov.kw/default_en
- Data availability:
Kuwait Census 2021 page (Population, Housing and Establishments census):
https://census.csb.gov.kw/index_EN
Population census:
https://census.csb.gov.kw/CensusData_EN?id=1
Last date of access: 05 September 2023.
GLMM and GRC cannot guarantee that the link to access the source will not change; that the information will not be removed from the website it was obtained from; that no geo-blockages will be imposed; or that the information will not be available for any another reason.
Keywords: Kuwait, Foreign Population
| |
Not Married |
Married |
Divorced |
Widower |
Not Stated |
Total |
| |
Male |
Female |
Total |
Male |
Female |
Total |
Male |
Female |
Total |
Male |
Female |
Total |
Male |
Female |
Total |
Male |
Female |
Total |
| 15-19 |
75,391 |
71,015 |
146,406 |
126 |
2,456 |
2,582 |
5 |
101 |
106 |
0 |
1 |
1 |
98 |
75 |
173 |
75,620 |
73,648 |
149,268 |
| 20-24 |
59,911 |
46,164 |
106,075 |
6,486 |
16,538 |
23,024 |
450 |
1,769 |
2,219 |
1 |
13 |
14 |
120 |
96 |
216 |
66,968 |
64,580 |
131,548 |
| 25-29 |
32,966 |
23,528 |
56,494 |
29,204 |
35,171 |
64,375 |
2,602 |
5,136 |
7,738 |
9 |
75 |
84 |
10 |
14 |
24 |
64,791 |
63,924 |
128,715 |
| 30-34 |
12,473 |
11,132 |
23,605 |
37,374 |
38,007 |
75,381 |
3,915 |
6,740 |
10,655 |
43 |
190 |
233 |
40 |
31 |
71 |
53,845 |
56,100 |
109,945 |
| 35-39 |
5,817 |
7,085 |
12,902 |
37,229 |
37,362 |
74,591 |
3,906 |
6,926 |
10,832 |
70 |
397 |
467 |
68 |
30 |
98 |
47,090 |
51,800 |
98,890 |
| 40-44 |
2,756 |
4,406 |
7,162 |
32,478 |
32,269 |
64,747 |
3,194 |
6,251 |
9,445 |
122 |
796 |
918 |
84 |
30 |
114 |
38,634 |
43,752 |
82,386 |
| 45-49 |
1,792 |
3,548 |
5,340 |
28,676 |
27,727 |
56,403 |
2,681 |
5,887 |
8,568 |
188 |
1,351 |
1,539 |
63 |
29 |
92 |
33,400 |
38,542 |
71,942 |
| 50-54 |
1,189 |
2,700 |
3,889 |
24,598 |
23,350 |
47,948 |
2,306 |
5,422 |
7,728 |
303 |
1,908 |
2,211 |
48 |
31 |
79 |
28,444 |
33,411 |
61,855 |
| 55-59 |
830 |
2,011 |
2,841 |
20,456 |
18,610 |
39,066 |
1,776 |
4,520 |
6,296 |
401 |
2,923 |
3,324 |
34 |
44 |
78 |
23,497 |
28,108 |
51,605 |
| 60-64 |
477 |
1,360 |
1,837 |
14,518 |
13,347 |
27,865 |
1,141 |
3,258 |
4,399 |
455 |
3,805 |
4,260 |
22 |
42 |
64 |
16,613 |
21,812 |
38,425 |
| 65+ |
539 |
1,643 |
2,182 |
23,643 |
16,705 |
40,348 |
1,465 |
4,971 |
6,436 |
2,565 |
17,325 |
19,890 |
45 |
79 |
124 |
28,257 |
40,723 |
68,980 |
| Total |
194,141 |
174,592 |
368,733 |
254,788 |
261,542 |
516,330 |
23,441 |
50,981 |
74,422 |
4,157 |
28,784 |
32,941 |
632 |
501 |
1,133 |
477,159 |
516,400 |
993,559 |
Source: Central Statistics Bureau (CSB)/The Public Authority for Civil Information (PACI)
ANNEXED NOTE
- Characteristics of data and definitions:
The 2021 Kuwait census is the eleventh census conducted in the country, and the first to be based on administrative records.
The Ministry of State for Communications and Information Technology has implemented the records-based population, establishments and building census through cooperation with the Central Statistical Bureau (CSB) and the Public Authority for Civil Information (PACI).
The census data was selected from the recommended data basket guide for the Unified Population and Housing Register-based Census 2020 for the countries of the Cooperation Council for the Arab States of the Gulf issued by the Gulf Statistics Center for the year 2019, and from the data basket of the general census of the State of Kuwait 2011.
Definitions and concepts used in the census:
https://census.csb.gov.kw/CensusData_EN
- Institution which provides data:
The Central Statistical Bureau (CSB)
https://www.csb.gov.kw/
https://www.csb.gov.kw/default_en
- Data availability:
Kuwait Census 2021 page (Population, Housing and Establishments census):
https://census.csb.gov.kw/index_EN
Population census:
https://census.csb.gov.kw/CensusData_EN?id=1
Last date of access: 05 September 2023.
GLMM and GRC cannot guarantee that the link to access the source will not change; that the information will not be removed from the website it was obtained from; that no geo-blockages will be imposed; or that the information will not be available for any another reason.
Keywords: Kuwait, National Population
| |
Bahrain |
Oman |
Qatar |
Saudi Arabia |
UAE |
Total |
| |
Male |
Female |
Male |
Female |
Male |
Female |
Male |
Female |
Male |
Female |
Male |
Female |
| 0-4 |
102 |
93 |
98 |
75 |
59 |
71 |
4,122 |
3,903 |
29 |
24 |
4,410 |
4,166 |
| 5-9 |
268 |
211 |
113 |
112 |
68 |
71 |
5,687 |
5,493 |
61 |
50 |
6,197 |
5,937 |
| 10-14 |
346 |
324 |
140 |
134 |
85 |
80 |
6,441 |
6,383 |
52 |
59 |
7,064 |
6,980 |
| 15-19 |
363 |
362 |
168 |
163 |
69 |
74 |
6,285 |
6,113 |
54 |
43 |
6,939 |
6,755 |
| 20-24 |
366 |
431 |
207 |
259 |
72 |
64 |
6,462 |
7,084 |
49 |
61 |
7,156 |
7,899 |
| 25-29 |
387 |
470 |
204 |
253 |
131 |
83 |
7,051 |
8,171 |
101 |
96 |
7,874 |
9,073 |
| 30-34 |
299 |
363 |
199 |
197 |
103 |
90 |
6,214 |
6,517 |
72 |
69 |
6,887 |
7,236 |
| 35-39 |
228 |
246 |
197 |
124 |
65 |
72 |
6,031 |
5,589 |
85 |
78 |
6,606 |
6,109 |
| 40-44 |
240 |
194 |
189 |
112 |
55 |
73 |
4,932 |
4,190 |
127 |
76 |
5,543 |
4,645 |
| 45-49 |
269 |
162 |
141 |
84 |
58 |
53 |
3,985 |
2,942 |
78 |
70 |
4,531 |
3,311 |
| 50-54 |
256 |
112 |
110 |
39 |
48 |
32 |
3,387 |
2,010 |
57 |
54 |
3,858 |
2,247 |
| 55-59 |
205 |
96 |
65 |
19 |
32 |
29 |
2,335 |
1,384 |
49 |
55 |
2,686 |
1,583 |
| 60-64 |
143 |
65 |
40 |
13 |
31 |
14 |
1,991 |
1,325 |
50 |
30 |
2,255 |
1,447 |
| 65-69 |
101 |
37 |
42 |
17 |
16 |
11 |
1,601 |
824 |
34 |
16 |
1,794 |
905 |
| 70-74 |
35 |
27 |
54 |
8 |
5 |
2 |
1,016 |
634 |
15 |
5 |
1,125 |
676 |
| 75-79 |
11 |
10 |
25 |
5 |
4 |
3 |
765 |
412 |
8 |
4 |
813 |
434 |
| 80-84 |
10 |
7 |
13 |
4 |
1 |
5 |
409 |
239 |
3 |
3 |
436 |
258 |
| 85+ |
7 |
10 |
7 |
4 |
1 |
1 |
338 |
268 |
7 |
6 |
360 |
289 |
| Total |
3,636 |
3,220 |
2,012 |
1,622 |
903 |
828 |
69,052 |
63,481 |
931 |
799 |
76,534 |
69,950 |
Source: Central Statistics Bureau (CSB)/The Public Authority For Civil Information (PACI)
ANNEXED NOTE
- Characteristics of data and definitions:
The 2021 Kuwait census is the eleventh census conducted in the country, and the first to be based on administrative records.
The Ministry of State for Communications and Information Technology has implemented the records-based population, establishments and building census through cooperation with the Central Statistical Bureau (CSB) and the Public Authority for Civil Information (PACI).
The census data was selected from the recommended data basket guide for the Unified Population and Housing Register-based Census 2020 for the countries of the Cooperation Council for the Arab States of the Gulf issued by the Gulf Statistics Center for the year 2019, and from the data basket of the general census of the State of Kuwait 2011.
Definitions and concepts used:
https://census.csb.gov.kw/CensusData_EN
- Institution which provides data:
The Central Statistical Bureau (CSB)
https://www.csb.gov.kw/
https://www.csb.gov.kw/default_en
- Data availability:
Kuwait Census 2022 page (Population, Housing and Establishments census):
https://census.csb.gov.kw/index_EN
Population census:
https://census.csb.gov.kw/CensusData_EN?id=1
Last date of access: 05 August 2023.
GLMM and GRC cannot guarantee that the link to access the source will not change; that the information will not be removed from the website it was obtained from; that no geo-blockages will be imposed; or that the information will not be available for any another reason.
Keywords: Kuwait, Foreign Population, Arab Countries, Bahrain, Oman, Qatar, Saudi Arabia, United Arab Emirates.
| |
Male |
Female |
Total |
| Bahrain |
3,636 |
3,220 |
6,856 |
| Oman |
2,012 |
1,622 |
3,634 |
| Qatar |
903 |
828 |
1,731 |
| Saudi Arabia |
69,052 |
63,481 |
132,533 |
| UAE |
931 |
799 |
1,730 |
| Total |
76,534 |
69,950 |
146,484 |
Source: Central Statistics Bureau (CSB)/The Public Authority for Civil Information (PACI)
ANNEXED NOTE
- Characteristics of data and definitions:
The 2021 Kuwait census is the eleventh census conducted in the country, and the first to be based on administrative records.
The Ministry of State for Communications and Information Technology has implemented the records-based population, establishments and building census through cooperation with the Central Statistical Bureau (CSB) and the Public Authority for Civil Information (PACI).
The census data was selected from the recommended data basket guide for the Unified Population and Housing Register-based Census 2020 for the countries of the Cooperation Council for the Arab States of the Gulf issued by the Gulf Statistics Center for the year 2019, and from the data basket of the general census of the State of Kuwait 2011.
Definitions and concepts used:
https://census.csb.gov.kw/CensusData_EN
- Institution which provides data:
The Central Statistical Bureau (CSB)
https://www.csb.gov.kw/
https://www.csb.gov.kw/default_en
- Data availability:
Kuwait Census 2022 page (Population, Housing and Establishments census):
https://census.csb.gov.kw/index_EN
Population census:
https://census.csb.gov.kw/CensusData_EN?id=1
Last date of access: 05 August 2023.
GLMM and GRC cannot guarantee that the link to access the source will not change; that the information will not be removed from the website it was obtained from; that no geo-blockages will be imposed; or that the information will not be available for any another reason.
Keywords: Kuwait, Foreign Population, Arab Countries, Bahrain, Oman, Qatar, Saudi Arabia, United Arab Emirates.
| |
Total population |
| Bahrain |
6,856 |
| Oman |
3,634 |
| Qatar |
1,731 |
| Saudi Arabia |
132,533 |
| UAE |
1,730 |
| Total |
146,484 |
Source: Central Statistics Bureau (CSB)/The Public Authority for Civil Information (PACI)
ANNEXED NOTE
- Characteristics of data and definitions:
The 2021 Kuwait census is the eleventh census conducted in the country, and the first to be based on administrative records.
The Ministry of State for Communications and Information Technology has implemented the records-based population, establishments and building census through cooperation with the Central Statistical Bureau (CSB) and the Public Authority for Civil Information (PACI).
The census data was selected from the recommended data basket guide for the Unified Population and Housing Register-based Census 2020 for the countries of the Cooperation Council for the Arab States of the Gulf issued by the Gulf Statistics Center for the year 2019, and from the data basket of the general census of the State of Kuwait 2011.
Definitions and concepts used:
https://census.csb.gov.kw/CensusData_EN
- Institution which provides data:
The Central Statistical Bureau (CSB)
https://www.csb.gov.kw/
https://www.csb.gov.kw/default_en
- Data availability:
Kuwait Census 2022 page (Population, Housing and Establishments census):
https://census.csb.gov.kw/index_EN
Population census:
https://census.csb.gov.kw/CensusData_EN?id=1
Last date of access: 05 August 2023.
GLMM and GRC cannot guarantee that the link to access the source will not change; that the information will not be removed from the website it was obtained from; that no geo-blockages will be imposed; or that the information will not be available for any another reason.
Keywords: Kuwait, Foreign Population, Arab Countries, Bahrain, Oman, Qatar, Saudi Arabia, United Arab Emirates.
| |
|
Arabic |
Asian |
African |
European |
North America |
South America |
Australian |
Total |
| 0-4 |
Male |
33,130 |
14,371 |
387 |
340 |
384 |
52 |
33 |
48,697 |
| |
Female |
31,797 |
13,752 |
336 |
306 |
344 |
48 |
41 |
46,624 |
| |
Total |
64,927 |
28,123 |
723 |
646 |
728 |
100 |
74 |
95,321 |
| 5-9 |
Male |
37,641 |
12,573 |
171 |
256 |
389 |
52 |
42 |
51,124 |
| |
Female |
36,196 |
11,775 |
176 |
284 |
333 |
41 |
47 |
48,852 |
| |
Total |
73,837 |
24,348 |
347 |
540 |
722 |
93 |
89 |
99,976 |
| 10-14 |
Male |
31,110 |
9,714 |
90 |
228 |
318 |
56 |
46 |
41,562 |
| |
Female |
29,745 |
9,197 |
101 |
250 |
320 |
46 |
42 |
39,701 |
| |
Total |
60,855 |
18,911 |
191 |
478 |
638 |
102 |
88 |
81,263 |
| 15-19 |
Male |
21,876 |
5,941 |
53 |
147 |
193 |
48 |
26 |
28,284 |
| |
Female |
21,286 |
5,466 |
44 |
149 |
181 |
50 |
22 |
27,198 |
| |
Total |
43,162 |
11,407 |
97 |
296 |
374 |
98 |
48 |
55,482 |
| 20-24 |
Male |
17,301 |
3,183 |
36 |
67 |
81 |
48 |
16 |
20,732 |
| |
Female |
17,663 |
3,118 |
46 |
108 |
110 |
38 |
17 |
21,100 |
| |
Total |
34,964 |
6,301 |
82 |
175 |
191 |
86 |
33 |
41,832 |
| 25-29 |
Male |
16,641 |
2,110 |
51 |
69 |
96 |
44 |
21 |
19,032 |
| |
Female |
16,126 |
1,854 |
103 |
83 |
148 |
44 |
24 |
18,382 |
| |
Total |
32,767 |
3,964 |
154 |
152 |
244 |
88 |
45 |
37,414 |
| 30-34 |
Male |
16,171 |
1,528 |
49 |
91 |
176 |
40 |
30 |
18,085 |
| |
Female |
14,066 |
1,345 |
106 |
78 |
192 |
34 |
19 |
15,840 |
| |
Total |
30,237 |
2,873 |
155 |
169 |
368 |
74 |
49 |
33,925 |
| 35-39 |
Male |
17,058 |
1,953 |
47 |
126 |
182 |
40 |
26 |
19,432 |
| |
Female |
14,146 |
1,475 |
57 |
102 |
154 |
33 |
22 |
15,989 |
| |
Total |
31,204 |
3,428 |
104 |
228 |
336 |
73 |
48 |
35,421 |
| 40-44 |
Male |
13,505 |
2,064 |
24 |
114 |
137 |
14 |
28 |
15,886 |
| |
Female |
10,225 |
1,154 |
19 |
73 |
93 |
9 |
13 |
11,586 |
| |
Total |
23,730 |
3,218 |
43 |
187 |
230 |
23 |
41 |
27,472 |
| 45-49 |
Male |
9,041 |
1,483 |
12 |
107 |
109 |
18 |
11 |
10,781 |
| |
Female |
6,741 |
704 |
14 |
36 |
62 |
2 |
4 |
7,563 |
| |
Total |
15,782 |
2,187 |
26 |
143 |
171 |
20 |
15 |
18,344 |
| 50-54 |
Male |
6,833 |
1,031 |
9 |
83 |
126 |
27 |
16 |
8,125 |
| |
Female |
5,106 |
572 |
4 |
36 |
67 |
5 |
9 |
5,799 |
| |
Total |
11,939 |
1,603 |
13 |
119 |
193 |
32 |
25 |
13,924 |
| 55-59 |
Male |
4,179 |
569 |
9 |
44 |
133 |
17 |
29 |
4,980 |
| |
Female |
2,770 |
266 |
4 |
21 |
63 |
5 |
12 |
3,141 |
| |
Total |
6,949 |
835 |
13 |
65 |
196 |
22 |
41 |
8,121 |
| 60-64 |
Male |
1,912 |
236 |
6 |
19 |
82 |
19 |
9 |
2,283 |
| |
Female |
1,019 |
97 |
1 |
7 |
24 |
2 |
2 |
1,152 |
| |
Total |
2,931 |
333 |
7 |
26 |
106 |
21 |
11 |
3,435 |
| 65-69 |
Male |
981 |
68 |
3 |
7 |
34 |
5 |
4 |
1,102 |
| |
Female |
345 |
40 |
1 |
1 |
7 |
1 |
0 |
395 |
| |
Total |
1,326 |
108 |
4 |
8 |
41 |
6 |
4 |
1,497 |
| 70-74 |
Male |
546 |
27 |
1 |
3 |
14 |
3 |
0 |
594 |
| |
Female |
124 |
9 |
0 |
3 |
0 |
0 |
0 |
136 |
| |
Total |
670 |
36 |
1 |
6 |
14 |
3 |
0 |
730 |
| 75-79 |
Male |
436 |
9 |
0 |
2 |
2 |
0 |
0 |
449 |
| |
Female |
76 |
6 |
0 |
0 |
0 |
0 |
0 |
82 |
| |
Total |
512 |
15 |
0 |
2 |
2 |
0 |
0 |
531 |
| 80-84 |
Male |
206 |
0 |
0 |
0 |
1 |
0 |
1 |
208 |
| |
Female |
28 |
1 |
0 |
0 |
1 |
0 |
0 |
30 |
| |
Total |
234 |
1 |
0 |
0 |
2 |
0 |
1 |
238 |
| 85+ |
Male |
114 |
1 |
0 |
0 |
0 |
0 |
0 |
115 |
|
Female |
40 |
0 |
0 |
0 |
0 |
0 |
0 |
40 |
|
Total |
154 |
1 |
0 |
0 |
0 |
0 |
0 |
155 |
| Total |
Male |
228,681 |
56,861 |
948 |
1,703 |
2,457 |
483 |
338 |
291,471 |
| |
Female |
207,499 |
50,831 |
1,012 |
1,537 |
2,099 |
358 |
274 |
263,610 |
| |
Total |
436,180 |
107,692 |
1,960 |
3,240 |
4,556 |
841 |
612 |
555,081 |
Source: Central Statistics Bureau (CSB)/The Public Authority for Civil Information (PACI)
ANNEXED NOTE
- Characteristics of data and definitions
The 2021 Kuwait census is the eleventh census conducted in the country, and the first to be based on administrative records.
The Ministry of State for Communications and Information Technology has implemented the records-based population, establishments and building
census through cooperation with the Central Statistical Bureau (CSB) and the Public Authority for Civil Information (PACI).
The census data was selected from the recommended data basket guide for the Unified Population and Housing Register-based Census 2020
for the countries of the Cooperation Council for the Arab States of the Gulf issued by the Gulf Statistics Center for the year 2019,
and from the data basket of the general census of the State of Kuwait 2011.
Definitions and concepts used:
https://census.csb.gov.kw/CensusData_EN
- Institution which provides data
The Central Statistical Bureau (CSB)
https://www.csb.gov.kw/
https://www.csb.gov.kw/default_en
- Data availability
Kuwait Census 2022 page (Population, Housing and Establishments census):
https://census.csb.gov.kw/index_EN
Population census:
https://census.csb.gov.kw/CensusData_EN?id=1
Last date of access: 05 August 2023.
GLMM and GRC cannot guarantee that the link to access the source will not change; that the information will not be removed from the website it was obtained from; that no geo-blockages will be imposed; or that the information will not be available for any another reason.
Keywords: Kuwait, Foreign Population, Identity, Second Generation.
| |
|
GCC countries |
Arab countries |
Asia |
SS Africa |
Europe |
North America |
South America |
Oceania |
Total |
| Capital Governorate |
Male |
144,354 |
45,550 |
118,393 |
991 |
953 |
1,000 |
115 |
105 |
311,461 |
| Female |
150,029 |
22,018 |
84,561 |
4,759 |
971 |
887 |
88 |
65 |
263,378 |
| Total |
294,383 |
67,568 |
202,954 |
5,750 |
1,924 |
1,887 |
203 |
170 |
574,839 |
| Hawalli Governorate |
Male |
124,551 |
224,700 |
162,749 |
1,477 |
3,890 |
4,549 |
369 |
353 |
522,638 |
| Female |
127,709 |
127,931 |
133,244 |
5,883 |
4,098 |
3,979 |
372 |
316 |
403,532 |
| Total |
252,260 |
352,631 |
295,993 |
7,360 |
7,988 |
8,528 |
741 |
669 |
926,170 |
| Al-Ahmadi Governorate |
Male |
176,599 |
98,007 |
312,505 |
3,214 |
1,717 |
3,239 |
312 |
139 |
595,732 |
| Female |
179,803 |
40,929 |
99,448 |
5,282 |
983 |
1,376 |
145 |
86 |
328,052 |
| Total |
356,402 |
138,936 |
411,953 |
8,496 |
2,700 |
4,615 |
457 |
225 |
923,784 |
| Al-Jahra Governorate |
Male |
138,772 |
85,450 |
94,286 |
1,630 |
262 |
260 |
115 |
59 |
320,834 |
| Female |
141,876 |
57,551 |
40,935 |
5,068 |
268 |
198 |
81 |
50 |
246,027 |
| Total |
280,648 |
143,001 |
135,221 |
6,698 |
530 |
458 |
196 |
109 |
566,861 |
| Al-Farwaniya Governorate |
Male |
130,514 |
273,035 |
369,097 |
2,551 |
463 |
493 |
91 |
59 |
776,303 |
| Female |
135,497 |
74,258 |
117,987 |
4,927 |
383 |
352 |
79 |
33 |
333,516 |
| Total |
266,011 |
347,293 |
487,084 |
7,478 |
846 |
845 |
170 |
92 |
1,109,819 |
| Mubarak Al-Kabeer Governorate |
Male |
89,764 |
7,764 |
42,714 |
339 |
359 |
650 |
87 |
31 |
141,708 |
| Female |
92,949 |
5,429 |
35,767 |
2,856 |
417 |
452 |
66 |
22 |
137,958 |
| Total |
182,713 |
13,193 |
78,481 |
3,195 |
776 |
1,102 |
153 |
53 |
279,666 |
| Not Stated |
Male |
1,618 |
581 |
338 |
21 |
10 |
15 |
5 |
2 |
2,590 |
| Female |
1,165 |
568 |
208 |
17 |
6 |
19 |
3 |
2 |
1,988 |
| Total |
2,783 |
1,149 |
546 |
38 |
16 |
34 |
8 |
4 |
4,578 |
| Total |
Male |
806,172 |
735,087 |
1,100,082 |
10,223 |
7,654 |
10,206 |
1,094 |
748 |
2,671,266 |
| Female |
829,028 |
328,684 |
512,150 |
28,792 |
7,126 |
7,263 |
834 |
574 |
1,714,451 |
| Total |
1,635,200 |
1,063,771 |
1,612,232 |
39,015 |
14,780 |
17,469 |
1,928 |
1,322 |
4,385,717 |
Source: Central Statistics Bureau (CSB)/The Public Authority for Civil Information (PACI)
ANNEXED NOTE
- Characteristics of data and definitions
The 2021 Kuwait census is the eleventh census conducted in the country, and the first to be based on administrative records.
The Ministry of State for Communications and Information Technology has implemented the records-based population, establishments and building
census through cooperation with the Central Statistical Bureau (CSB) and the Public Authority for Civil Information (PACI).
The census data was selected from the recommended data basket guide for the Unified Population and Housing Register-based Census 2020
for the countries of the Cooperation Council for the Arab States of the Gulf issued by the Gulf Statistics Center for the year 2019,
and from the data basket of the general census of the State of Kuwait 2011.
Definitions and concepts used:
https://census.csb.gov.kw/CensusData_EN
- Institution which provides data
The Central Statistical Bureau (CSB)
https://www.csb.gov.kw/
https://www.csb.gov.kw/default_en
- Data availability
Kuwait Census 2022 page (Population, Housing and Establishments census):
https://census.csb.gov.kw/index_EN
Population census:
https://census.csb.gov.kw/CensusData_EN?id=1
Last date of access: 05 August 2023.
GLMM and GRC cannot guarantee that the link to access the source will not change; that the information will not be removed from the website it was obtained from; that no geo-blockages will be imposed; or that the information will not be available for any another reason.
Keywords: Kuwait, Foreign Population, National Population, Asia, Africa, Europe, North America, South America, Oceania, Arab Countries.
| |
Kuwaiti |
Non-Kuwaiti |
Total |
| Governorate |
Male |
Female |
Total |
Male |
Female |
Total |
Male |
Female |
Total |
| The Capital |
138,639 |
144,940 |
283,579 |
172,822 |
118,438 |
291,260 |
311,461 |
263,378 |
574,839 |
| Hawalli |
119,799 |
124,120 |
243,919 |
402,839 |
279,412 |
682,251 |
522,638 |
403,532 |
926,170 |
| Al-Ahmadi |
162,729 |
166,392 |
329,121 |
433,003 |
161,660 |
594,663 |
595,732 |
328,052 |
923,784 |
| Al-Jahra |
103,272 |
108,888 |
212,160 |
217,562 |
137,139 |
354,701 |
320,834 |
246,027 |
566,861 |
| Al-Farwaniya |
118,602 |
125,310 |
243,912 |
657,701 |
208,206 |
865,907 |
776,303 |
333,516 |
1,109,819 |
| Mubarak Al-Kabeer |
86,430 |
89,314 |
175,744 |
55,278 |
48,644 |
103,922 |
141,708 |
137,958 |
279,666 |
| Not Stated |
167 |
114 |
281 |
2,423 |
1,874 |
4,297 |
2,590 |
1,988 |
4,578 |
| Total |
729,638 |
759,078 |
1,488,716 |
1,941,628 |
955,373 |
2,897,001 |
2,671,266 |
1,714,451 |
4,385,717 |
Source: Central Statistics Bureau (CSB)/The Public Authority for Civil Information (PACI)
ANNEXED NOTE
- Characteristics of data and definitions
The 2021 Kuwait census is the eleventh census conducted in the country, and the first to be based on administrative records.
The Ministry of State for Communications and Information Technology has implemented the records-based population, establishments and building
census through cooperation with the Central Statistical Bureau (CSB) and the Public Authority for Civil Information (PACI).
The census data was selected from the recommended data basket guide for the Unified Population and Housing Register-based Census 2020
for the countries of the Cooperation Council for the Arab States of the Gulf issued by the Gulf Statistics Center for the year 2019,
and from the data basket of the general census of the State of Kuwait 2011.
Definitions and concepts used:
https://census.csb.gov.kw/CensusData_EN
- Institution which provides data
The Central Statistical Bureau (CSB)
https://www.csb.gov.kw/
https://www.csb.gov.kw/default_en
- Data availability
Kuwait Census 2022 page (Population, Housing and Establishments census):
https://census.csb.gov.kw/index_EN
Population census:
https://census.csb.gov.kw/CensusData_EN?id=1
Last date of access: 05 August 2023.
GLMM and GRC cannot guarantee that the link to access the source will not change; that the information will not be removed from the website it was obtained from; that no geo-blockages will be imposed; or that the information will not be available for any another reason.
Keywords: Kuwait, Foreign Population, National Population.
| |
Male |
Female |
Total |
| GCC countries |
806,172 |
829,028 |
1,635,200 |
| Arab countries |
735,087 |
328,684 |
1,063,771 |
| Asia |
1,100,082 |
512,150 |
1,612,232 |
| Sub-Saharan Africa |
10,223 |
28,792 |
39,015 |
| Europe |
7,654 |
7,126 |
14,780 |
| North America |
10,206 |
7,263 |
17,469 |
| South America |
1,094 |
834 |
1,928 |
| Oceania |
748 |
574 |
1,322 |
| Total |
2,671,266 |
1,714,451 |
4,385,717 |
Source: Central Statistics Bureau (CSB)/The Public Authority for Civil Information (PACI)
ANNEXED NOTE
- Characteristics of data and definitions
The 2021 Kuwait census is the eleventh census conducted in the country, and the first to be based on administrative records.
The Ministry of State for Communications and Information Technology has implemented the records-based population, establishments and building
census through cooperation with the Central Statistical Bureau (CSB) and the Public Authority for Civil Information (PACI).
The census data was selected from the recommended data basket guide for the Unified Population and Housing Register-based Census 2020
for the countries of the Cooperation Council for the Arab States of the Gulf issued by the Gulf Statistics Center for the year 2019,
and from the data basket of the general census of the State of Kuwait 2011.
Definitions and concepts used:
https://census.csb.gov.kw/CensusData_EN
- Institution which provides data
The Central Statistical Bureau (CSB)
https://www.csb.gov.kw/
https://www.csb.gov.kw/default_en
- Data availability
Kuwait Census 2022 page (Population, Housing and Establishments census):
https://census.csb.gov.kw/index_EN
Population census:
https://census.csb.gov.kw/CensusData_EN?id=1
Last date of access: 05 August 2023.
GLMM and GRC cannot guarantee that the link to access the source will not change; that the information will not be removed from the website it was obtained from; that no geo-blockages will be imposed; or that the information will not be available for any another reason.
Keywords: Kuwait, Foreign Population, National Population, Asia, Africa, Europe, North America, South America, Oceania, Arab Countries.
| |
Born inside Kuwait |
Born outside Kuwait |
Total |
| |
Male |
Female |
Total |
Male |
Female |
Total |
Male |
Female |
Total |
| 0-4 |
48,697 |
46,624 |
95,321 |
5,953 |
5,666 |
11,619 |
54,650 |
52,290 |
106,940 |
| 5-9 |
51,124 |
48,852 |
99,976 |
16,491 |
15,569 |
32,060 |
67,615 |
64,421 |
132,036 |
| 10-14 |
41,562 |
39,701 |
81,263 |
20,289 |
18,962 |
39,251 |
61,851 |
58,663 |
120,514 |
| 15-19 |
28,284 |
27,198 |
55,482 |
18,529 |
16,544 |
35,073 |
46,813 |
43,742 |
90,555 |
| 20-24 |
20,732 |
21,100 |
41,832 |
36,859 |
17,335 |
54,194 |
57,591 |
38,435 |
96,026 |
| 25-29 |
19,032 |
18,382 |
37,414 |
220,549 |
62,608 |
283,157 |
239,581 |
80,990 |
320,571 |
| 30-34 |
18,085 |
15,840 |
33,925 |
283,744 |
110,336 |
394,080 |
301,829 |
126,176 |
428,005 |
| 35-39 |
19,432 |
15,989 |
35,421 |
279,731 |
115,250 |
394,981 |
299,163 |
131,239 |
430,402 |
| 40-44 |
15,886 |
11,586 |
27,472 |
260,375 |
105,620 |
365,995 |
276,261 |
117,206 |
393,467 |
| 45-49 |
10,781 |
7,563 |
18,344 |
192,623 |
81,867 |
274,490 |
203,404 |
89,430 |
292,834 |
| 50-54 |
8,125 |
5,799 |
13,924 |
141,372 |
53,082 |
194,454 |
149,497 |
58,881 |
208,378 |
| 55-59 |
4,980 |
3,141 |
8,121 |
84,391 |
29,333 |
113,724 |
89,371 |
32,474 |
121,845 |
| 60-64 |
2,283 |
1,152 |
3,435 |
37,177 |
14,201 |
51,378 |
39,460 |
15,353 |
54,813 |
| 65-69 |
1,102 |
395 |
1,497 |
15,471 |
6,692 |
22,163 |
16,573 |
7,087 |
23,660 |
| 70-74 |
594 |
136 |
730 |
6,257 |
3,504 |
9,761 |
6,851 |
3,640 |
10,491 |
| 75-79 |
449 |
82 |
531 |
2,602 |
1,916 |
4,518 |
3,051 |
1,998 |
5,049 |
| 80-84 |
208 |
30 |
238 |
1,127 |
972 |
2,099 |
1,335 |
1,002 |
2,337 |
| 85 + |
115 |
40 |
155 |
660 |
708 |
1,368 |
775 |
748 |
1,523 |
| Total |
291,471 |
263,610 |
555,081 |
1,624,200 |
660,165 |
2,284,365 |
1,915,671 |
923,775 |
2,839,446 |
Source: Central Statistics Bureau (CSB)/The Public Authority for Civil Information (PACI)
ANNEXED NOTE
- Characteristics of data and definitions
The 2021 Kuwait census is the eleventh census conducted in the country, and the first to be based on administrative records.
The Ministry of State for Communications and Information Technology has implemented the records-based population, establishments and building
census through cooperation with the Central Statistical Bureau (CSB) and the Public Authority for Civil Information (PACI).
The census data was selected from the recommended data basket guide for the Unified Population and Housing Register-based Census 2020
for the countries of the Cooperation Council for the Arab States of the Gulf issued by the Gulf Statistics Center for the year 2019,
and from the data basket of the general census of the State of Kuwait 2011.
Definitions and concepts used:
https://census.csb.gov.kw/CensusData_EN
- Institution which provides data
The Central Statistical Bureau (CSB)
https://www.csb.gov.kw/
https://www.csb.gov.kw/default_en
- Data availability
Kuwait Census 2022 page (Population, Housing and Establishments census):
https://census.csb.gov.kw/index_EN
Population census:
https://census.csb.gov.kw/CensusData_EN?id=1
Last date of access: 05 August 2023.
GLMM and GRC cannot guarantee that the link to access the source will not change; that the information will not be removed from the website it was obtained from; that no geo-blockages will be imposed; or that the information will not be available for any another reason.
Keywords: Kuwait, Foreign Population, National Population, Asia, Africa, Europe, North America, South America, Oceania, Arab Countries.
| |
Total |
| GCC countries |
1,635,200 |
| Arab countries |
1,063,771 |
| Asia |
1,612,232 |
| Sub-Saharan Africa |
39,015 |
| Europe |
14,780 |
| North America |
17,469 |
| South America |
1,928 |
| Oceania |
1,322 |
| Total |
4,385,717 |
Source: Central Statistics Bureau (CSB)/The Public Authority for Civil Information (PACI)
ANNEXED NOTE
- Characteristics of data and definitions
The 2021 Kuwait census is the eleventh census conducted in the country, and the first to be based on administrative records.
The Ministry of State for Communications and Information Technology has implemented the records-based population, establishments and building
census through cooperation with the Central Statistical Bureau (CSB) and the Public Authority for Civil Information (PACI).
The census data was selected from the recommended data basket guide for the Unified Population and Housing Register-based Census 2020
for the countries of the Cooperation Council for the Arab States of the Gulf issued by the Gulf Statistics Center for the year 2019,
and from the data basket of the general census of the State of Kuwait 2011.
Definitions and concepts used:
https://census.csb.gov.kw/CensusData_EN
- Institution which provides data
The Central Statistical Bureau (CSB)
https://www.csb.gov.kw/
https://www.csb.gov.kw/default_en
- Data availability
Kuwait Census 2022 page (Population, Housing and Establishments census):
https://census.csb.gov.kw/index_EN
Population census:
https://census.csb.gov.kw/CensusData_EN?id=1
Last date of access: 05 August 2023.
GLMM and GRC cannot guarantee that the link to access the source will not change; that the information will not be removed from the website it was obtained from; that no geo-blockages will be imposed; or that the information will not be available for any another reason.
Keywords: Kuwait, Foreign Population, National Population, Asia, Africa, Europe, North America, South America, Oceania, Arab Countries.
| |
Never Married |
Married |
Divorced |
Widowed |
Total Population |
| |
Males |
Females |
Males |
Females |
Males |
Females |
Males |
Females |
Males |
Females |
| 15-19 |
165,406 |
149,171 |
9,087 |
13,807 |
240 |
337 |
277 |
130 |
175,010 |
163,445 |
| 20-24 |
526,118 |
121,385 |
159,626 |
73,612 |
5,612 |
4,091 |
5,367 |
679 |
696,723 |
199,767 |
| 25-29 |
1,098,777 |
153,172 |
524,203 |
230,739 |
11,256 |
13,372 |
9,560 |
2,374 |
1,643,796 |
399,657 |
| 30-34 |
937,977 |
132,523 |
910,859 |
338,052 |
13,463 |
17,355 |
9,078 |
4,368 |
1,871,377 |
492,298 |
| 35-39 |
599,867 |
92,293 |
1,058,335 |
323,995 |
9,638 |
16,062 |
4,805 |
5,910 |
1,672,645 |
438,260 |
| 40-44 |
363,017 |
49,148 |
906,560 |
227,493 |
6,976 |
12,587 |
3,404 |
6,699 |
1,279,957 |
295,927 |
| 45-49 |
209,614 |
26,150 |
635,579 |
146,672 |
4,193 |
8,416 |
1,981 |
6,662 |
851,367 |
187,900 |
| 50-54 |
146,776 |
12,633 |
462,025 |
95,186 |
3,126 |
5,305 |
1,899 |
7,428 |
613,826 |
120,552 |
| 55-59 |
87,217 |
5,542 |
301,110 |
58,566 |
1,941 |
2,801 |
1,602 |
7,436 |
391,870 |
74,345 |
| 60-64 |
42,957 |
2,934 |
162,336 |
36,145 |
1,130 |
1,706 |
1,343 |
8,459 |
207,766 |
49,244 |
| 65-69 |
14,768 |
1,324 |
68,842 |
17,000 |
481 |
841 |
1,048 |
7,019 |
85,139 |
26,184 |
| 70-74 |
4,696 |
670 |
29,238 |
7,714 |
212 |
405 |
868 |
5,964 |
35,014 |
14,753 |
| 75-79 |
1,455 |
355 |
11,175 |
3,292 |
68 |
192 |
535 |
3,849 |
13,233 |
7,688 |
| 80+ |
1,089 |
554 |
9,747 |
2,765 |
74 |
215 |
776 |
4,747 |
11,686 |
8,281 |
| Total |
4,199,734 |
747,854 |
5,248,722 |
1,575,038 |
58,410 |
83,685 |
42,543 |
71,724 |
9,549,409 |
2,478,301 |
Source: GAStat, Saudi Arabia census 2022
ANNEXED NOTE
- Technical Notes and Definitions
Source: Saudi census 2022
Date of reference: 10 May 2022
Population of reference: Families and individual citizens and residents within the Kingdom, regardless of the status of their identification documents. Visitors for Hajj, Umrah and tourism are excluded from the census.
Methodology:
The first phase of the 2020 census began on 3 February 2020 (enumeration of buildings and households). Census 2022 used geospatial data, including satellite images, electricity consumption and mobile phone data, to improve the accuracy and geographic coverage of address canvassing.
The second stage (“actual enumeration”) was due to start on the original reference date (17 March 2020), but was suspended by the outbreak of the COVID-19 crisis. This stage was conducted in October 2021.
The 2022 census used a combined methodology – administrative records, fieldwork and digital self-enumeration. Household data were collected from e-portals of self-enumeration (on residents’ mobile devices, laptops or personal computers, or self-enumeration stations/kiosks, located in shopping centers). The digital self-enumeration process was complemented by face-to-face interviews, using digital tablets.
Census 2022 used a de jure approach: enumerating people according to their usual place of residence.
Administrative data from multiple sources was used to cross-validate collected census data.
Census 2022 was designed as a launchpad for several new secure statistical data registers for population, housing, and businesses.
See census methodology in:
https://portal.saudicensus.sa/portal/public/methodology
Portal of the Saudi census:
https://portal.saudicensus.sa/portal
Population data for 2010-22 were revised and backcasted, based on 2022 population census and past years’ administrative data.
Technical note on backcasting:
https://portal.saudicensus.sa/static-assets/media/content/20230529_Back-Casting%20Methodology.pdf?crafterSite=gastat-portal
- Institution which provides data
General Authority for Statistics (GAStat)
- Data availability
The table was retrieved from the Saudi census portal on GAStat website:
https://portal.saudicensus.sa/portal
“Population” section, then “data tables”-
https://portal.saudicensus.sa/portal/public/1/15?type=TABLE
Selected, pre-set tables can be downloaded from the thematic section.
Date of access: 20 July 2023.
GLMM and GRC cannot guarantee that the link to access the source will not change; that the information will not be removed from the website it was obtained from; that no geo-blockages will be imposed; or that the information will not be available for any another reason.
Keywords: Saudi Arabia, National Population
| Saudis |
No schooling |
Early childhood education |
Primary |
Intermediate education (general or vocational) |
Secondary education (general or vocational) |
Diploma |
Post-secondary non-tertiary education |
Short-cycle tertiary education |
Graduate or Equivalent |
Higher Diploma – Master’s degree |
Master’s degree or equivalent |
Ph.D |
Grand Total |
|
M |
F |
M |
F |
M |
F |
M |
F |
M |
F |
M |
F |
M |
F |
M |
F |
M |
F |
M |
F |
M |
F |
M |
F |
M |
F |
| 2016 Q2 |
34.1 |
1.1 |
|
|
42.4 |
2.2 |
37.2 |
2.4 |
65.2 |
8.0 |
87.6 |
60.8 |
|
|
|
|
90.2 |
66.2 |
89.7 |
70.4 |
|
|
83.2 |
89.3 |
63.2 |
17.7 |
| 2016 Q3 |
36.8 |
1.6 |
|
|
53.1 |
3.6 |
39.2 |
2.4 |
66.0 |
7.0 |
90.8 |
73.1 |
|
|
|
|
91.4 |
70.4 |
91.9 |
76.4 |
|
|
86.7 |
92.5 |
64.6 |
19.0 |
| 2016 Q4 |
31.2 |
1.3 |
|
|
46.4 |
2.7 |
40.7 |
2.6 |
64.2 |
8.2 |
88.8 |
69.5 |
|
|
|
|
90.4 |
64.2 |
90.6 |
83.2 |
|
|
90.9 |
79.1 |
64.6 |
19.3 |
| 2017 Q1 |
31.7 |
1.8 |
|
|
40.5 |
3.6 |
37.5 |
2.3 |
63.5 |
7.8 |
85.1 |
63.6 |
|
|
|
|
89.5 |
61.8 |
84.5 |
82.8 |
|
|
89.8 |
83.3 |
61.9 |
17.4 |
| 2017 Q2 |
29.1 |
1.6 |
|
|
37.4 |
2.8 |
34.7 |
2.4 |
65.8 |
6.8 |
85.0 |
62.7 |
|
|
|
|
87.8 |
60.1 |
88.8 |
75.8 |
|
|
78.2 |
61.3 |
62.1 |
17.4 |
| 2017 Q3 |
27.5 |
1.6 |
|
|
41.3 |
3.0 |
36.4 |
2.4 |
63.6 |
6.6 |
86.6 |
61.6 |
|
|
|
|
88.2 |
60.6 |
86.1 |
69.6 |
|
|
84.1 |
84.7 |
62.6 |
17.8 |
| 2017 Q4 |
24.2 |
1.8 |
|
|
40.9 |
3.6 |
36.4 |
2.7 |
65.1 |
8.7 |
86.7 |
67.1 |
|
|
|
|
90.2 |
64.2 |
87.4 |
81.9 |
|
|
83.9 |
74.4 |
63.4 |
19.4 |
| 2018 Q1 |
24.9 |
2.1 |
|
|
41.0 |
2.9 |
37.2 |
2.7 |
65.9 |
8.4 |
87.2 |
67.7 |
|
|
|
|
88.9 |
64.7 |
85.5 |
75.6 |
|
|
81.6 |
66.1 |
63.5 |
19.5 |
| 2018 Q2 |
23.7 |
1.9 |
|
|
36.9 |
3.7 |
33.9 |
2.5 |
66.3 |
8.3 |
87.5 |
65.1 |
|
|
|
|
89.9 |
65.6 |
83.6 |
82.3 |
|
|
91.0 |
88.1 |
63.5 |
19.6 |
| 2018 Q3 |
22.5 |
1.2 |
34.9 |
1.8 |
39.2 |
5.3 |
34.8 |
3.5 |
65.1 |
9.1 |
86.7 |
60.8 |
|
|
|
|
87.8 |
60.5 |
|
|
87.7 |
77.2 |
87.6 |
95.4 |
63.5 |
19.7 |
| 2018 Q4 |
17.4 |
1.3 |
29.3 |
2.3 |
38.2 |
4.0 |
34.3 |
3.1 |
64.8 |
9.1 |
86.6 |
62.6 |
|
|
|
|
89.1 |
63.5 |
|
|
86.6 |
83.6 |
78.3 |
85.9 |
63.0 |
20.2 |
| 2019 Q1 |
25.7 |
2.5 |
38.6 |
4.0 |
43.1 |
4.8 |
34.8 |
3.1 |
64.2 |
10.1 |
87.3 |
64.3 |
|
|
|
|
89.1 |
62.1 |
|
|
90.6 |
86.4 |
84.9 |
85.5 |
63.3 |
20.5 |
| 2019 Q2 |
35.2 |
4.1 |
41.4 |
7.7 |
48.7 |
7.1 |
35.8 |
5.2 |
66.8 |
13.0 |
88.1 |
67.8 |
|
|
|
|
91.0 |
61.6 |
|
|
89.0 |
70.3 |
79.6 |
#### |
66.0 |
23.2 |
| 2019 Q3 |
38.9 |
4.2 |
45.9 |
4.3 |
53.7 |
6.7 |
38.5 |
4.7 |
66.4 |
12.7 |
87.9 |
64.7 |
|
|
|
|
90.8 |
62.1 |
|
|
90.3 |
77.5 |
86.6 |
92.4 |
67.0 |
23.2 |
| 2019 Q4 |
37.3 |
5.5 |
47.5 |
12.4 |
49.8 |
8.7 |
35.6 |
6.2 |
66.6 |
15.3 |
86.6 |
58.2 |
|
|
|
|
91.1 |
66.2 |
|
|
91.8 |
82.9 |
77.3 |
81.6 |
66.6 |
26.0 |
| 2020 Q1 |
26.7 |
5.4 |
41.9 |
7.1 |
46.4 |
8.2 |
33.9 |
7.2 |
66.2 |
15.3 |
86.8 |
64.6 |
|
|
|
|
90.2 |
63.5 |
|
|
87.9 |
83.4 |
89.3 |
94.8 |
65.8 |
25.9 |
| 2020 Q2 |
21.0 |
3.5 |
26.4 |
6.3 |
38.0 |
10.2 |
32.5 |
9.8 |
65.7 |
20.6 |
87.0 |
64.6 |
|
|
|
|
91.2 |
68.3 |
|
|
92.0 |
82.8 |
91.8 |
86.3 |
65.6 |
31.4 |
| 2020 Q3 |
22.7 |
5.4 |
34.3 |
7.6 |
41.7 |
13.0 |
32.9 |
10.6 |
66.2 |
22.2 |
85.6 |
58.8 |
|
|
|
|
90.0 |
64.5 |
|
|
90.8 |
81.4 |
89.3 |
72.1 |
66.0 |
31.3 |
| 2020 Q4 |
23.2 |
6.7 |
35.8 |
9.8 |
44.1 |
15.6 |
34.7 |
12.7 |
70.3 |
24.9 |
87.9 |
63.6 |
|
|
|
|
91.4 |
64.5 |
|
|
91.2 |
86.9 |
90.9 |
91.2 |
68.5 |
33.2 |
| 2021 Q1 |
24.0 |
8.3 |
38.0 |
18.5 |
34.5 |
14.6 |
35.2 |
14.3 |
69.6 |
24.2 |
|
|
88.6 |
66.0 |
86.8 |
66.7 |
89.9 |
60.4 |
|
|
90.8 |
84.8 |
95.9 |
88.7 |
66.2 |
32.3 |
| 2021 Q2 |
22.1 |
8.9 |
31.3 |
13.4 |
40.8 |
17.6 |
33.0 |
14.0 |
67.2 |
24.9 |
|
|
83.9 |
60.3 |
82.0 |
60.5 |
87.4 |
57.4 |
|
|
89.9 |
82.9 |
93.2 |
95.3 |
65.7 |
32.4 |
| 2021 Q3 |
26.0 |
10.6 |
36.7 |
15.0 |
45.3 |
20.4 |
31.4 |
14.1 |
66.5 |
25.3 |
|
|
83.2 |
60.8 |
83.7 |
62.4 |
87.9 |
62.3 |
|
|
89.5 |
85.5 |
89.4 |
86.4 |
65.0 |
34.1 |
| 2021 Q4 |
27.6 |
10.2 |
34.0 |
16.7 |
43.4 |
19.7 |
31.6 |
13.5 |
68.4 |
27.6 |
|
|
84.2 |
64.0 |
84.8 |
63.7 |
89.4 |
63.5 |
|
|
89.4 |
81.8 |
94.1 |
91.6 |
66.8 |
35.6 |
| 2022 Q1 |
24.4 |
9.4 |
33.6 |
14.1 |
40.1 |
17.8 |
30.7 |
11.9 |
67.8 |
26.0 |
|
|
85.3 |
62.7 |
84.1 |
64.6 |
88.7 |
60.3 |
|
|
90.7 |
80.4 |
89.1 |
87.8 |
66.0 |
33.6 |
| 2022 Q2 |
27.9 |
9.8 |
31.6 |
12.7 |
37.7 |
16.2 |
32.8 |
14.3 |
70.5 |
28.4 |
|
|
84.0 |
62.3 |
84.2 |
63.8 |
90.5 |
63.5 |
|
|
90.8 |
85.0 |
91.1 |
87.2 |
67.5 |
35.6 |
| 2022 Q3 |
25.8 |
9.1 |
35.8 |
13.6 |
43.5 |
18.3 |
31.7 |
13.8 |
68.0 |
28.6 |
|
|
83.5 |
60.1 |
83.1 |
64.7 |
90.1 |
67.1 |
|
|
91.8 |
86.2 |
86.4 |
90.9 |
67.4 |
37.0 |
| 2022 Q4 |
22.2 |
7.9 |
36.6 |
13.8 |
41.9 |
17.6 |
28.8 |
13.3 |
69.7 |
28.0 |
|
|
86.1 |
58.9 |
86.7 |
62.9 |
90.1 |
61.9 |
|
|
91.8 |
83.8 |
92.7 |
88.6 |
68.5 |
36.0 |
Source: GAStat, Labour Market Statistics, Statistical database
ANNEXED NOTES
- Data collection methodology
LFS were first conducted in 2001 and became bi-annual after 2006. Data were collected through nationally representative household sample surveys, which sampling was based on most recent censuses. Since 2016, Labour Force Surveys have been conducted and published on a quarterly basis, based on a household telephone survey conducted by GAStat. Employment data extracted from administrative records were also introduced as a complement to the results of Labour Force Surveys in Labour Market Statistics’ publications, starting on Q1 2017.
The present data is based on estimates drawn from the results of the quarterly Labour Force Survey. LFS results are published as rates only. Numerical estimates are unavailable.
GAStat Labour Market Statistics: Labour Force Survey (household telephone survey conducted by GAStat)
Sample size: 53,360 households, from all administrative regions of Saudi Arabia.
Population covered: residents in Saudi Arabia, Saudis and non-Saudis. All household members, including domestic workers, aged 15 and above.
The survey provides estimates of the size of the total and working-age populations (aged 15 years and above), inside and outside the labour force. It highlights the characteristics of the labour force (employed and unemployed populations), and supplies the data to calculate key indicators of labour market such as the unemployment and the labour force participation rates.
Household survey questionnaire: https://www.stats.gov.sa/sites/default/files/2021_Q3_LFS%20Questionnaire_EN%2022-08-2021.pdf.
Definitions:
Population in the labour force:
Individuals (15 years and above) who contribute or are ready to contribute to the production of commodities and services during the reference period of the survey. The labour force includes the employed and unemployed populations.
Population outside the labour force:
Individuals (15 years and above) who is not classified as part of the labour force because they do not work, do not seek a job, are unable to work, or are not ready to work during the survey reference period. For example: Students, housewives, retired persons who do not work, individuals unable or unwilling to work, or who do not look for a job for other reasons.
Labour force participation rate = (total labour force ÷ total population of working age (aged 15 years and over)) x 100-
Definitions and categories used by GAStat in Labour Markets Statistics (employment; unemployment; occupation and activity sectors, etc.) are based on international standards.
For LFS methodology and definitions, see: https://www.stats.gov.sa/en/node/9787
- Institution which provides data
General Authority for Statistics (GAStat)
- Data availability
Since 2021, GAStat has been publishing separately the employment data taken from administrative records, and unemployment/inactivity data as well as general indicators, calculated from the results of the field interviews conducted by GAStat (Labour Force Survey).
The present time-series was taken from the Labour Market Statistics in GAStat’s Statistical database:
https://database.stats.gov.sa/home/report/316
Date of access: 01 August 2023
GLMM and GRC cannot guarantee that the link to access the source will not change; that the information will not be removed from the website it was obtained from; that no geo-blockages will be imposed; or that the information will not be available for any another reason.
Keywords: Saudi Arabia, National & Foreign Labour, Foreign & National Populations, Labour Market, Employment
| Non-Saudis |
No schooling |
Early childhood education |
Primary |
Intermediate education (general or vocational) |
Secondary education (general or vocational) |
Diploma |
Post-secondary non-tertiary education |
Short-cycle tertiary education |
Graduate or Equivalent |
Higher Diploma – Master’s degree |
Master’s degree or equivalent |
Ph.D |
Grand Total |
|
M |
F |
M |
F |
M |
F |
M |
F |
M |
F |
M |
F |
M |
F |
M |
F |
M |
F |
M |
F |
M |
F |
M |
F |
M |
F |
| 2016 Q2 |
96.0 |
44.9 |
|
|
96.3 |
50.2 |
92.7 |
41.7 |
94.2 |
21.5 |
98.9 |
43.6 |
|
|
|
|
98.5 |
19.9 |
99.4 |
28.7 |
|
|
98.7 |
74.7 |
95.5 |
36.2 |
| 2016 Q3 |
96.3 |
34.6 |
|
|
96.8 |
30.5 |
91.1 |
26.7 |
88.2 |
11.6 |
98.3 |
29.9 |
|
|
|
|
97.5 |
15.0 |
85.9 |
26.7 |
|
|
96.1 |
61.5 |
93.3 |
22.8 |
| 2016 Q4 |
95.0 |
41.3 |
|
|
96.1 |
48.1 |
90.1 |
34.9 |
92.5 |
16.1 |
97.9 |
28.5 |
|
|
|
|
97.5 |
20.6 |
90.7 |
36.7 |
|
|
97.6 |
80.9 |
94.0 |
31.2 |
| 2017 Q1 |
95.1 |
41.4 |
|
|
95.2 |
38.9 |
91.3 |
33.9 |
91.7 |
17.0 |
98.0 |
25.7 |
|
|
|
|
97.4 |
17.7 |
94.1 |
38.1 |
|
|
98.2 |
80.3 |
94.1 |
29.2 |
| 2017 Q2 |
95.7 |
32.7 |
|
|
95.0 |
32.0 |
90.3 |
22.6 |
92.0 |
8.9 |
99.1 |
27.0 |
|
|
|
|
97.1 |
17.8 |
95.9 |
40.6 |
|
|
96.5 |
86.7 |
94.0 |
21.6 |
| 2017 Q3 |
95.3 |
34.2 |
|
|
96.0 |
42.1 |
90.3 |
27.8 |
90.6 |
8.5 |
98.6 |
18.6 |
|
|
|
|
97.4 |
20.2 |
95.7 |
42.3 |
|
|
98.8 |
51.9 |
93.8 |
24.9 |
| 2017 Q4 |
95.8 |
35.7 |
|
|
95.2 |
40.2 |
90.7 |
29.2 |
92.4 |
11.2 |
97.6 |
17.8 |
|
|
|
|
97.7 |
13.5 |
94.8 |
29.2 |
|
|
97.8 |
73.7 |
94.2 |
24.2 |
| 2018 Q1 |
94.9 |
32.6 |
|
|
95.4 |
40.9 |
90.3 |
30.7 |
90.7 |
11.2 |
98.2 |
19.9 |
|
|
|
|
97.3 |
14.6 |
91.7 |
34.9 |
|
|
95.5 |
80.2 |
93.6 |
24.5 |
| 2018 Q2 |
95.0 |
36.6 |
|
|
94.8 |
42.6 |
91.2 |
36.5 |
90.7 |
12.9 |
98.5 |
32.5 |
|
|
|
|
97.6 |
20.6 |
96.9 |
29.8 |
|
|
97.6 |
70.0 |
93.9 |
29.0 |
| 2018 Q3 |
93.4 |
41.1 |
96.6 |
33.2 |
96.6 |
44.7 |
90.4 |
36.2 |
91.4 |
17.1 |
98.3 |
41.6 |
|
|
|
|
97.9 |
20.9 |
|
|
91.5 |
14.0 |
95.8 |
70.7 |
93.9 |
29.7 |
| 2018 Q4 |
91.7 |
29.4 |
92.7 |
22.8 |
96.5 |
34.7 |
90.8 |
30.4 |
92.0 |
12.8 |
98.7 |
41.2 |
|
|
|
|
96.6 |
24.9 |
|
|
96.1 |
32.8 |
98.5 |
85.7 |
93.8 |
25.9 |
| 2019 Q1 |
91.2 |
19.7 |
95.7 |
36.8 |
95.7 |
44.8 |
91.3 |
29.8 |
92.7 |
14.9 |
98.3 |
50.2 |
|
|
|
|
97.4 |
19.7 |
|
|
95.5 |
25.6 |
97.2 |
75.4 |
94.1 |
27.4 |
| 2019 Q2 |
89.8 |
19.5 |
95.5 |
34.8 |
96.6 |
43.7 |
91.1 |
32.3 |
92.5 |
12.4 |
99.3 |
49.7 |
|
|
|
|
97.1 |
20.4 |
|
|
95.1 |
24.9 |
96.2 |
68.4 |
94.1 |
26.9 |
| 2019 Q3 |
92.6 |
21.5 |
95.8 |
25.7 |
96.9 |
44.2 |
91.6 |
35.7 |
92.4 |
13.4 |
98.3 |
46.8 |
|
|
|
|
98.2 |
20.3 |
|
|
97.8 |
32.0 |
95.4 |
75.6 |
94.5 |
27.6 |
| 2019 Q4 |
88.7 |
20.5 |
96.7 |
36.6 |
96.6 |
47.9 |
90.1 |
35.1 |
91.5 |
15.6 |
97.8 |
32.0 |
|
|
|
|
97.3 |
21.3 |
|
|
90.9 |
29.3 |
99.7 |
75.6 |
93.6 |
28.8 |
| 2020 Q1 |
90.2 |
15.8 |
97.1 |
27.6 |
96.2 |
39.1 |
91.1 |
28.5 |
93.2 |
14.1 |
98.9 |
34.7 |
|
|
|
|
97.7 |
19.4 |
|
|
96.9 |
23.0 |
97.8 |
67.3 |
94.4 |
24.2 |
| 2020 Q2 |
88.4 |
38.7 |
96.0 |
33.8 |
93.1 |
40.8 |
88.4 |
32.6 |
88.0 |
17.3 |
95.1 |
21.2 |
|
|
|
|
96.0 |
20.9 |
|
|
96.9 |
42.1 |
99.0 |
76.4 |
91.8 |
28.7 |
| 2020 Q3 |
89.3 |
35.3 |
94.5 |
18.4 |
93.7 |
33.6 |
89.2 |
34.4 |
89.2 |
19.9 |
97.7 |
23.2 |
|
|
|
|
96.5 |
18.1 |
|
|
95.9 |
34.3 |
97.9 |
76.4 |
92.4 |
26.9 |
| 2020 Q4 |
91.3 |
35.4 |
94.9 |
28.0 |
93.1 |
40.2 |
88.0 |
35.0 |
89.3 |
20.8 |
98.5 |
28.5 |
|
|
|
|
97.0 |
23.5 |
|
|
96.0 |
28.7 |
98.9 |
77.4 |
92.4 |
29.3 |
| 2021 Q1 |
94.0 |
51.6 |
96.1 |
54.8 |
93.3 |
46.4 |
86.6 |
39.7 |
90.7 |
33.2 |
|
|
97.2 |
21.2 |
97.5 |
26.0 |
97.6 |
21.0 |
|
|
96.6 |
29.0 |
98.7 |
67.9 |
93.0 |
36.9 |
| 2021 Q2 |
92.3 |
45.7 |
95.3 |
58.9 |
92.9 |
49.5 |
87.1 |
39.0 |
88.8 |
34.0 |
|
|
98.9 |
39.0 |
97.8 |
43.3 |
96.8 |
21.5 |
|
|
96.8 |
30.2 |
98.2 |
58.0 |
92.3 |
37.2 |
| 2021 Q3 |
92.8 |
57.0 |
93.7 |
55.6 |
91.8 |
47.9 |
81.0 |
34.6 |
89.0 |
37.2 |
|
|
98.0 |
33.1 |
95.4 |
21.5 |
96.8 |
28.1 |
|
|
92.8 |
39.5 |
97.0 |
78.2 |
91.4 |
40.1 |
| 2021 Q4 |
91.8 |
42.0 |
92.6 |
52.1 |
91.0 |
40.9 |
83.8 |
27.5 |
90.9 |
33.5 |
|
|
96.2 |
25.2 |
97.2 |
29.5 |
97.1 |
24.3 |
|
|
97.0 |
33.8 |
97.4 |
74.8 |
92.0 |
33.3 |
| 2022 Q1 |
89.3 |
43.2 |
91.7 |
44.6 |
90.9 |
39.1 |
84.3 |
26.4 |
90.5 |
32.5 |
|
|
95.8 |
29.7 |
97.6 |
24.0 |
96.2 |
25.1 |
|
|
96.7 |
40.0 |
95.2 |
69.9 |
91.4 |
32.9 |
| 2022 Q2 |
89.2 |
40.1 |
93.6 |
47.6 |
91.6 |
38.5 |
84.7 |
25.3 |
92.2 |
29.5 |
|
|
97.7 |
22.7 |
97.1 |
22.5 |
97.4 |
25.7 |
|
|
95.2 |
43.6 |
96.0 |
81.9 |
92.0 |
31.6 |
| 2022 Q3 |
89.2 |
39.4 |
93.1 |
35.3 |
94.3 |
39.9 |
86.2 |
26.1 |
92.4 |
30.1 |
|
|
98.4 |
28.0 |
97.7 |
26.2 |
98.1 |
27.8 |
|
|
97.1 |
39.6 |
98.4 |
85.0 |
93.0 |
31.9 |
| 2022 Q4 |
89.1 |
39.1 |
90.8 |
31.6 |
95.1 |
39.3 |
86.5 |
25.9 |
92.7 |
27.9 |
|
|
98.4 |
35.7 |
98.0 |
27.0 |
97.7 |
27.2 |
|
|
98.0 |
38.1 |
96.9 |
76.2 |
93.2 |
31.1 |
Source: GAStat, Labour Market Statistics, Statistical database
ANNEXED NOTES
- Data collection methodology
LFS were first conducted in 2001 and became bi-annual after 2006. Data were collected through nationally representative household sample surveys, which sampling was based on most recent censuses. Since 2016, Labour Force Surveys have been conducted and published on a quarterly basis, based on a household telephone survey conducted by GAStat. Employment data extracted from administrative records were also introduced as a complement to the results of Labour Force Surveys in Labour Market Statistics’ publications, starting on Q1 2017.
The present data is based on estimates drawn from the results of the quarterly Labour Force Survey. LFS results are published as rates only. Numerical estimates are unavailable.
GAStat Labour Market Statistics: Labour Force Survey (household telephone survey conducted by GAStat)
Sample size: 53,360 households, from all administrative regions of Saudi Arabia.
Population covered: residents in Saudi Arabia, Saudis and non-Saudis. All household members, including domestic workers, aged 15 and above.
The survey provides estimates of the size of the total and working-age populations (aged 15 years and above), inside and outside the labour force. It highlights the characteristics of the labour force (employed and unemployed populations), and supplies the data to calculate key indicators of labour market such as the unemployment and the labour force participation rates.
Household survey questionnaire: https://www.stats.gov.sa/sites/default/files/2021_Q3_LFS%20Questionnaire_EN%2022-08-2021.pdf.
Definitions:
Population in the labour force:
Individuals (15 years and above) who contribute or are ready to contribute to the production of commodities and services during the reference period of the survey. The labour force includes the employed and unemployed populations.
Population outside the labour force:
Individuals (15 years and above) who is not classified as part of the labour force because they do not work, do not seek a job, are unable to work, or are not ready to work during the survey reference period. For example: Students, housewives, retired persons who do not work, individuals unable or unwilling to work, or who do not look for a job for other reasons.
Labour force participation rate = (total labour force ÷ total population of working age (aged 15 years and over)) x 100-
Definitions and categories used by GAStat in Labour Markets Statistics (employment; unemployment; occupation and activity sectors, etc.) are based on international standards.
For LFS methodology and definitions, see: https://www.stats.gov.sa/en/node/9787
- Institution which provides data
General Authority for Statistics (GAStat)
- Data availability
Since 2021, GAStat has been publishing separately the employment data taken from administrative records, and unemployment/inactivity data as well as general indicators, calculated from the results of the field interviews conducted by GAStat (Labour Force Survey).
The present time-series was taken from the Labour Market Statistics in GAStat’s Statistical database:
https://database.stats.gov.sa/home/report/316
Date of access: 01 August 2023
GLMM and GRC cannot guarantee that the link to access the source will not change; that the information will not be removed from the website it was obtained from; that no geo-blockages will be imposed; or that the information will not be available for any another reason.
Keywords: Saudi Arabia, National & Foreign Labour, Foreign & National Populations, Labour Market, Employment
| |
Saudis |
Non-Saudis |
Total |
| |
Males |
Females |
Total |
Males |
Females |
Total |
Males |
Females |
Total |
| 0-4 |
1,106,938 |
1,067,017 |
2,173,955 |
207,304 |
196,900 |
404,204 |
1,314,242 |
1,263,917 |
2,578,159 |
| 5-9 |
1,148,999 |
1,108,681 |
2,257,680 |
258,552 |
246,085 |
504,637 |
1,407,551 |
1,354,766 |
2,762,317 |
| 10-14 |
1,068,186 |
1,031,817 |
2,100,003 |
229,199 |
217,212 |
446,411 |
1,297,385 |
1,249,029 |
2,546,414 |
| 15-19 |
941,806 |
916,439 |
1,858,245 |
175,010 |
163,445 |
338,455 |
1,116,816 |
1,079,884 |
2,196,700 |
| 20-24 |
868,712 |
850,780 |
1,719,492 |
696,723 |
199,767 |
896,490 |
1,565,435 |
1,050,547 |
2,615,982 |
| 25-29 |
859,531 |
842,731 |
1,702,262 |
1,643,796 |
399,657 |
2,043,453 |
2,503,327 |
1,242,388 |
3,745,715 |
| 30-34 |
770,595 |
758,562 |
1,529,157 |
1,871,377 |
492,298 |
2,363,675 |
2,641,972 |
1,250,860 |
3,892,832 |
| 35-39 |
679,028 |
675,023 |
1,354,051 |
1,672,645 |
438,260 |
2,110,905 |
2,351,673 |
1,113,283 |
3,464,956 |
| 40-44 |
534,889 |
543,104 |
1,077,993 |
1,279,957 |
295,927 |
1,575,884 |
1,814,846 |
839,031 |
2,653,877 |
| 45-49 |
381,557 |
404,356 |
785,913 |
851,367 |
187,900 |
1,039,267 |
1,232,924 |
592,256 |
1,825,180 |
| 50-54 |
310,703 |
343,291 |
653,994 |
613,826 |
120,552 |
734,378 |
924,529 |
463,843 |
1,388,372 |
| 55-59 |
252,068 |
276,936 |
529,004 |
391,870 |
74,345 |
466,215 |
643,938 |
351,281 |
995,219 |
| 60-64 |
186,840 |
203,802 |
390,642 |
207,766 |
49,244 |
257,010 |
394,606 |
253,046 |
647,652 |
| 65-69 |
127,205 |
129,931 |
257,136 |
85,139 |
26,184 |
111,323 |
212,344 |
156,115 |
368,459 |
| 70-74 |
75,465 |
80,111 |
155,576 |
35,014 |
14,753 |
49,767 |
110,479 |
94,864 |
205,343 |
| 75-79 |
54,159 |
56,412 |
110,571 |
13,233 |
7,688 |
20,921 |
67,392 |
64,100 |
131,492 |
| 80+ |
67,450 |
69,138 |
136,588 |
11,686 |
8,281 |
19,967 |
79,136 |
77,419 |
156,555 |
| Total |
9,434,131 |
9,358,131 |
18,792,262 |
10,244,464 |
3,138,498 |
13,382,962 |
19,678,595 |
12,496,629 |
32,175,224 |
Source: GAStat, Saudi Arabia census 2022
ANNEXED NOTE
- Technical Notes and Definitions
Source: Saudi census 2022
Date of reference: 10 May 2022
Population of reference: Families and individual citizens and residents within the Kingdom, regardless of the status of their identification documents. Visitors for Hajj, Umrah and tourism are excluded from the census.
Methodology:
The first phase of the 2020 census began on 3 February 2020 (enumeration of buildings and households). Census 2022 used geospatial data, including satellite images, electricity consumption and mobile phone data, to improve the accuracy and geographic coverage of address canvassing.
The second stage (“actual enumeration”) was due to start on the original reference date (17 March 2020), but was suspended by the outbreak of the COVID-19 crisis. This stage was conducted in October 2021.
The 2022 census used a combined methodology – administrative records, fieldwork and digital self-enumeration. Household data were collected from e-portals of self-enumeration (on residents’ mobile devices, laptops or personal computers, or self-enumeration stations/kiosks, located in shopping centers). The digital self-enumeration process was complemented by face-to-face interviews, using digital tablets.
Census 2022 used a de jure approach: enumerating people according to their usual place of residence.
Administrative data from multiple sources was used to cross-validate collected census data.
Census 2022 was designed as a launchpad for several new secure statistical data registers for population, housing, and businesses.
See census methodology in:
https://portal.saudicensus.sa/portal/public/methodology
Portal of the Saudi census:
https://portal.saudicensus.sa/portal
Population data for 2010-22 were revised and backcasted, based on 2022 population census and past years’ administrative data.
Technical note on backcasting:
https://portal.saudicensus.sa/static-assets/media/content/20230529_Back-Casting%20Methodology.pdf?crafterSite=gastat-portal
- Institution which provides data
General Authority for Statistics (GAStat)
- Data availability
The table was retrieved from the Saudi census portal on GAStat website:
https://portal.saudicensus.sa/portal
“Population” section, then “data tables”-
https://portal.saudicensus.sa/portal/public/1/15?type=TABLE
Selected, pre-set tables can be downloaded from the thematic section.
Date of access: 20 July 2023.
GLMM and GRC cannot guarantee that the link to access the source will not change; that the information will not be removed from the website it was obtained from; that no geo-blockages will be imposed; or that the information will not be available for any another reason.
Keywords: Saudi Arabia, Foreign Population, National Population, Foreign & National Populations
| |
Saudis |
Non-Saudis |
Total |
| 2010 |
14,046,164 |
9,932,323 |
23,978,487 |
| 2011 |
14,342,129 |
10,749,738 |
25,091,867 |
| 2012 |
14,683,546 |
11,485,315 |
26,168,861 |
| 2013 |
15,079,401 |
12,544,603 |
27,624,004 |
| 2014 |
15,535,036 |
12,774,237 |
28,309,273 |
| 2015 |
15,968,071 |
13,848,311 |
29,816,382 |
| 2016 |
16,355,312 |
14,598,886 |
30,954,198 |
| 2017 |
16,696,980 |
14,280,375 |
30,977,355 |
| 2018 |
17,085,636 |
13,110,645 |
30,196,281 |
| 2019 |
17,507,171 |
12,556,628 |
30,063,799 |
| 2020 |
17,978,587 |
13,573,923 |
31,552,510 |
| 2021 |
18,380,669 |
12,403,714 |
30,784,383 |
| 2022 |
18,792,262 |
13,382,962 |
32,175,224 |
Source: GAStat, Saudi Arabia census 2022
ANNEXED NOTE
- Technical Notes and Definitions
Source: Saudi census 2022
Date of reference: 10 May 2022
Population of reference: Families and individual citizens and residents within the Kingdom, regardless of the status of their identification documents. Visitors for Hajj, Umrah and tourism are excluded from the census.
Methodology:
The first phase of the 2020 census began on 3 February 2020 (enumeration of buildings and households). Census 2022 used geospatial data, including satellite images, electricity consumption and mobile phone data, to improve the accuracy and geographic coverage of address canvassing.
The second stage (“actual enumeration”) was due to start on the original reference date (17 March 2020), but was suspended by the outbreak of the COVID-19 crisis. This stage was conducted in October 2021.
The 2022 census used a combined methodology – administrative records, fieldwork and digital self-enumeration. Household data were collected from e-portals of self-enumeration (on residents’ mobile devices, laptops or personal computers, or self-enumeration stations/kiosks, located in shopping centers). The digital self-enumeration process was complemented by face-to-face interviews, using digital tablets.
Census 2022 used a de jure approach: enumerating people according to their usual place of residence.
Administrative data from multiple sources was used to cross-validate collected census data.
Census 2022 was designed as a launchpad for several new secure statistical data registers for population, housing, and businesses.
See census methodology in:
https://portal.saudicensus.sa/portal/public/methodology
Portal of the Saudi census:
https://portal.saudicensus.sa/portal
Population data for 2010-22 were revised and backcasted, based on 2022 population census and past years’ administrative data.
Technical note on backcasting:
https://portal.saudicensus.sa/static-assets/media/content/20230529_Back-Casting%20Methodology.pdf?crafterSite=gastat-portal
- Institution which provides data
General Authority for Statistics (GAStat)
- Data availability
The table was retrieved from the Saudi census portal on GAStat website:
https://portal.saudicensus.sa/portal
“Population” section, then “data tables”-
https://portal.saudicensus.sa/portal/public/1/15?type=TABLE
Selected, pre-set tables can be downloaded from the thematic section.
Date of access: 20 July 2023.
GLMM and GRC cannot guarantee that the link to access the source will not change; that the information will not be removed from the website it was obtained from; that no geo-blockages will be imposed; or that the information will not be available for any another reason.
Keywords: Saudi Arabia, Foreign Population, National Population, Foreign & National Populations
| |
Never Married |
Married |
Divorced |
Widowed |
Total Saudis |
| |
Males |
Females |
Males |
Females |
Males |
Females |
Males |
Females |
Males |
Females |
| 15-19 |
930,729 |
873,240 |
9,637 |
40,348 |
656 |
2,436 |
784 |
415 |
941,806 |
916,439 |
| 20-24 |
810,176 |
596,455 |
55,058 |
234,970 |
2,107 |
18,406 |
1,371 |
949 |
868,712 |
850,780 |
| 25-29 |
557,912 |
303,603 |
291,134 |
492,688 |
9,143 |
43,978 |
1,342 |
2,462 |
859,531 |
842,731 |
| 30-34 |
236,355 |
141,225 |
516,131 |
558,203 |
17,137 |
54,193 |
972 |
4,941 |
770,595 |
758,562 |
| 35-39 |
108,559 |
81,775 |
550,889 |
530,641 |
18,767 |
53,473 |
813 |
9,134 |
679,028 |
675,023 |
| 40-44 |
56,487 |
44,935 |
462,191 |
436,106 |
15,331 |
46,695 |
880 |
15,368 |
534,889 |
543,104 |
| 45-49 |
30,542 |
22,399 |
339,711 |
321,980 |
10,462 |
37,002 |
842 |
22,975 |
381,557 |
404,356 |
| 50-54 |
19,329 |
12,942 |
282,658 |
261,941 |
7,547 |
30,979 |
1,169 |
37,429 |
310,703 |
343,291 |
| 55-59 |
12,183 |
7,196 |
232,611 |
195,107 |
5,613 |
23,850 |
1,661 |
50,783 |
252,068 |
276,936 |
| 60-64 |
6,719 |
4,311 |
174,583 |
123,754 |
3,468 |
16,724 |
2,070 |
59,013 |
186,840 |
203,802 |
| 65-69 |
3,582 |
2,339 |
119,424 |
62,862 |
1,996 |
9,775 |
2,203 |
54,955 |
127,205 |
129,931 |
| 70-74 |
1,925 |
1,077 |
70,573 |
29,021 |
907 |
5,438 |
2,060 |
44,575 |
75,465 |
80,111 |
| 75-79 |
1,460 |
590 |
49,603 |
14,706 |
660 |
3,546 |
2,436 |
37,570 |
54,159 |
56,412 |
| 80+ |
3,546 |
710 |
57,413 |
9,643 |
811 |
4,246 |
5,680 |
54,539 |
67,450 |
69,138 |
| Total |
2,779,504 |
2,092,797 |
3,211,616 |
3,311,970 |
94,605 |
350,741 |
24,283 |
395,108 |
6,110,008 |
6,150,616 |
Source: GAStat, Saudi Arabia census 2022
ANNEXED NOTE
- Technical Notes and Definitions
Source: Saudi census 2022
Date of reference: 10 May 2022
Population of reference: Families and individual citizens and residents within the Kingdom, regardless of the status of their identification documents. Visitors for Hajj, Umrah and tourism are excluded from the census.
Methodology:
The first phase of the 2020 census began on 3 February 2020 (enumeration of buildings and households). Census 2022 used geospatial data, including satellite images, electricity consumption and mobile phone data, to improve the accuracy and geographic coverage of address canvassing.
The second stage (“actual enumeration”) was due to start on the original reference date (17 March 2020), but was suspended by the outbreak of the COVID-19 crisis. This stage was conducted in October 2021.
The 2022 census used a combined methodology – administrative records, fieldwork and digital self-enumeration. Household data were collected from e-portals of self-enumeration (on residents’ mobile devices, laptops or personal computers, or self-enumeration stations/kiosks, located in shopping centers). The digital self-enumeration process was complemented by face-to-face interviews, using digital tablets.
Census 2022 used a de jure approach: enumerating people according to their usual place of residence.
Administrative data from multiple sources was used to cross-validate collected census data.
Census 2022 was designed as a launchpad for several new secure statistical data registers for population, housing, and businesses.
See census methodology in:
https://portal.saudicensus.sa/portal/public/methodology
Portal of the Saudi census:
https://portal.saudicensus.sa/portal
Population data for 2010-22 were revised and backcasted, based on 2022 population census and past years’ administrative data.
Technical note on backcasting:
https://portal.saudicensus.sa/static-assets/media/content/20230529_Back-Casting%20Methodology.pdf?crafterSite=gastat-portal
- Institution which provides data
General Authority for Statistics (GAStat)
- Data availability
The table was retrieved from the Saudi census portal on GAStat website:
https://portal.saudicensus.sa/portal
“Population” section, then “data tables”-
https://portal.saudicensus.sa/portal/public/1/15?type=TABLE
Selected, pre-set tables can be downloaded from the thematic section.
Date of access: 20 July 2023.
GLMM and GRC cannot guarantee that the link to access the source will not change; that the information will not be removed from the website it was obtained from; that no geo-blockages will be imposed; or that the information will not be available for any another reason.
Keywords: Saudi Arabia, National Population
|
Workers |
Dependents |
|
Males |
Females |
Total |
Males |
Females |
Total |
| India |
218,828 |
14,141 |
232,969 |
20,963 |
45,168 |
66,131 |
| Bangladesh |
105,771 |
191 |
105,962 |
996 |
1,997 |
2,993 |
| Pakistan |
59,681 |
1,103 |
60,784 |
3,708 |
7,648 |
11,356 |
| Philippines |
10,718 |
16,484 |
27,202 |
1,287 |
2,241 |
3,528 |
| Nepal |
17,916 |
2,132 |
20,048 |
N.A. |
N.A. |
N.A. |
| Egypt |
10,002 |
1,690 |
11,692 |
5,123 |
8,042 |
13,165 |
| Sri Lanka |
3,773 |
646 |
4,419 |
444 |
1,097 |
1,541 |
| Jordan |
2,526 |
488 |
3,014 |
1,636 |
2,585 |
4,221 |
| Yemen |
2,831 |
115 |
2,946 |
1,455 |
2,328 |
3,783 |
| Kenya |
1,493 |
867 |
2,360 |
N.A. |
N.A. |
N.A. |
| Uganda |
1,864 |
391 |
2,255 |
N.A. |
N.A. |
N.A. |
| Cameroon |
1,583 |
454 |
2,037 |
N.A. |
N.A. |
N.A. |
| UK |
1,450 |
542 |
1,992 |
584 |
957 |
1,541 |
| Morocco |
518 |
1,474 |
1,992 |
N.A. |
N.A. |
N.A. |
| Thailand |
499 |
1,344 |
1,843 |
N.A. |
N.A. |
N.A. |
| Sudan |
1,553 |
226 |
1,779 |
N.A. |
N.A. |
N.A. |
| Nigeria |
1,582 |
141 |
1,723 |
N.A. |
N.A. |
N.A. |
| Syria |
1,523 |
184 |
1,707 |
884 |
1,403 |
2,287 |
| Ghana |
1,335 |
251 |
1,586 |
N.A. |
N.A. |
N.A. |
| China |
860 |
354 |
1,214 |
N.A. |
N.A. |
N.A. |
| Total |
455,385 |
47,784 |
503,169 |
40,817 |
80,548 |
121,365 |
Source: Labour Market Regulatory Authority (LMRA), Expatriate Management System (EMS)
ANNEXED NOTE
- Technical Notes and Definitions
The data displays the stocks, at a given date, of expats visa holders, registered as workers or as family dependants (LMRA Law 19/2006) in EMS.
Non-Bahraini workers (for male, female and both sexes) are Expat visa applications (GCC workers are not included).
The scope of the system covers regular, temporary and investor work visas for foreign workers, their dependents, in the commercial sector, the government sector and the non-commercial, non-government sector.
It presently excludes domestic workers, and work visas for artists and certain other categories of workers in non-civilian organizations.
The system tracks visa applications, renewals, mobility of workers between employers and from one occupation to another as well as notification of termination and runaway workers, and in general all operations of LMRA including inspection and offence management.
The system is updated continuously and linked with other labour-related databases of the Kingdom, including CIO, GDNPR, GOSI, PFC, CSB, Ministry of Labour (MoL), and Ministry of Industry and Commerce (MOIC).
Work Visa is a legal certificate to allow a foreign worker to enter the country for working purposes for a period of two years with the possibility of renewal.
The LMRA Expat Management System (EMS) distinguishes four types of visas for operational purposes: regular work visas for workers with 24-month validity; temporary work visas issued for workers with 6-month validity; investor work visas issued for investors investing up to BD 100,000; and dependent visas issued for dependent members of eligible foreign workers.
Worker is a generic term that refers to an employed person in general, or to an employee, a self-employed, or a particular category of worker,
such as full-time or part-time worker, depending on the context in which the term is used. Four major categories of workers in terms of their status in employment are employees, employers, own-account workers, and unpaid family workers.
https://blmi.lmra.gov.bh/mi_glossary.xml#LMRA%20Expatriate%20Management%20System%20(EMS)
N.A.: Not available.
- Institution which provides data
Labour Market Regulatory Authority (LMRA).
- Data availability
Labour Market Regulatory Authority (LMRA), Kingdom of Bahrain, based on data from Bahrain Labour Market Indicators website:
http://www.lmra.bh/blmi.
The data can be retrieved from the data section of LMRA website. Tables are updated on a quarterly basis and are available in PDF and in Excel formats.
Last date of access: June 2023.
GLMM and GRC cannot guarantee that the link to access the source will not change; that the information will not be removed from the website it was obtained from; that no geo-blockages will be imposed; or that the information will not be available for any another reason.
Keywords: Bahrain, Foreign Population, Foreign Labour, Family Reunification, India, Egypt, Pakistan, Jordan, Bangladesh, Philippines, Yemen, Sri Lanka, United Kingdom, Syria
| |
2015 |
2016 |
2017 |
2018 |
2019 |
Q2 2020 |
Q2 2021 |
Q2 2022 |
Q4 2022 |
Males |
Females |
Males |
Females |
Males |
Females |
Males |
Females |
Males |
Females |
Males |
Females |
Males |
Females |
Males |
Females |
Males |
Females |
|
| India |
418,275 |
36,953 |
479,773 |
39,693 |
512,227 |
41,554 |
531,444 |
43,534 |
542,735 |
44,947 |
514,461 |
44,977 |
423,328 |
41,742 |
405,738 |
41,240 |
452,893 |
44,194 |
|
| Egypt |
390,636 |
28,452 |
422,920 |
30,151 |
432,844 |
30,960 |
450,138 |
31,536 |
478,971 |
32,061 |
483,435 |
32,685 |
433,982 |
30,892 |
423,497 |
31,313 |
450,990 |
32,193 |
|
| Kuwait |
154,276 |
188,141 |
155,671 |
193,121 |
158,099 |
200,755 |
162,395 |
212,409 |
166,301 |
222,452 |
168,489 |
228,172 |
176,995 |
242,589 |
185,155 |
253,404 |
186,845 |
255,802 |
|
| Bangladesh |
134,173 |
3,938 |
144,657 |
3,888 |
159,889 |
3,791 |
172,434 |
3,870 |
177,125 |
4,035 |
178,700 |
4,319 |
159,633 |
3,884 |
152,788 |
3,719 |
157,961 |
3,966 |
|
| Pakistan |
90,783 |
1,353 |
89,773 |
1,478 |
87,583 |
1,499 |
79,832 |
1,528 |
78,241 |
1,512 |
75,929 |
1,553 |
69,904 |
1,540 |
66,200 |
2,479 |
65,840 |
3,003 |
|
| Philippines |
35,207 |
37,189 |
38,239 |
39,489 |
38,273 |
40,337 |
37,670 |
39,218 |
37,740 |
40,884 |
35,432 |
40,604 |
30,261 |
37,397 |
27,712 |
35,872 |
28,855 |
38,059 |
|
| Syria |
58,743 |
5,132 |
59,026 |
5,415 |
58,791 |
5,617 |
56,612 |
5,828 |
56,664 |
6,074 |
56,803 |
6,353 |
56,582 |
6,546 |
56,469 |
7,152 |
56,508 |
7,389 |
|
| Nepal |
37,135 |
2,187 |
41,098 |
2,421 |
42,970 |
2,743 |
48,835 |
3,809 |
52,519 |
4,716 |
49,161 |
5,434 |
37,078 |
5,009 |
41,433 |
6,301 |
52,728 |
10,202 |
|
| Jordan |
|
|
|
|
18,798 |
6,321 |
18,517 |
6,613 |
18,867 |
6,869 |
19,023 |
7,223 |
18,031 |
7,201 |
18,573 |
7,834 |
19,217 |
8,178 |
|
| Sri Lanka |
18,324 |
6,051 |
19,060 |
6,089 |
|
|
|
|
|
|
|
|
|
|
|
|
16,029 |
5,092 |
|
| Lebanon |
|
|
|
|
|
|
|
|
|
|
|
|
|
|
13,616 |
6,187 |
|
|
|
| Iran |
25,097 |
1,844 |
24,688 |
1,902 |
23,986 |
1,936 |
20,834 |
1,980 |
20,554 |
2,076 |
20,026 |
2,130 |
18,503 |
2,148 |
|
|
|
|
|
| Other countries |
102,703 |
28,915 |
108,508 |
31,183 |
108,199 |
31,899 |
110,047 |
32,573 |
112,234 |
34,017 |
108,718 |
35,384 |
93,889 |
32,769 |
98,336 |
30,847 |
105,630 |
35,416 |
|
| Total |
1,465,352 |
340,155 |
1,583,413 |
354,830 |
1,641,659 |
367,412 |
1,688,758 |
382,898 |
1,741,951 |
399,643 |
1,710,177 |
408,834 |
1,518,186 |
411,717 |
1,489,517 |
426,348 |
1,593,496 |
443,494 |
|
Source: Central Statistical Bureau (CSB), Labour Market Information System (LMIS), Integrated Database
ANNEXED NOTE
- Characteristics of data and definitions
Kuwait’s Labour Market Information System (KLMIS) was developed by the Central Statistical Bureau (CSB), in collaboration with relevant other government agencies.
https://lmis.csb.gov.kw/ar/Default.aspx
https://lmis.csb.gov.kw/En/Docs/KLMI%20Report%20English%20-%20Final%20Version.pdf.
KLMIS’s Integrated database, updated on a quarterly basis, tabulates basic data on nationals’ and foreign migrants’ employment, taken from four administrative sources:
the Civil Service Commission (CSC) (public sector’s statistics);
the Public Authority for Civil Information (PACI) (public entities which are not included in the Civil Service Commission records);
the Public Authority for Manpower (PAM) (statistics on workers in the private sector);
Ministry of Interior (MoI) (domestic workers).
Information on LMIS’s data sources is taken from:
Al Daas, M. Labor Statistics for evidence-based policies,
https://www.iaos-isi.org/images/IAOS2017-19/2016Conference/P5C/Mona_Al_daas_paper.pdf, p. 3.
- Institution which provides data
The Central Statistical Bureau (CSB)
https://www.csb.gov.kw/
https://www.csb.gov.kw/default_en
- Period of data coverage
30/06, given years; Q4 2022.
- Data availability
Kuwait: Central Statistical Bureau. Integrated Database – LMIS
https://lmis.csb.gov.kw/
https://lmis.csb.gov.kw/default_En
Data are available in Arabic and English, by quarter, for every year since 2014.
https://lmis.csb.gov.kw/IntegratedDataView_En
Last date of access: June 2023.
GLMM and GRC cannot guarantee that the link to access the source will not change; that the information will not be removed from the website it was obtained from; that no geo-blockages will be imposed; or that the information will not be available for any another reason.
Keywords: Kuwait, Foreign Labour, National & Foreign Labour, Employment, Labour Market, India, Bangladesh, Pakistan, Philippines, Nepal, Sri Lanka, Syria, Jordan, Lebanon, Iran
| |
Q2 2015 |
Q2 2016 |
Q2 2017 |
Q2 2018 |
Q2 2019 |
Q2 2020 |
Q2 2021 |
Q2 2022 |
Q4 2022 |
| India |
455,228 |
519,466 |
553,781 |
574,978 |
587,682 |
559,438 |
465,070 |
446,978 |
497,087 |
| Egypt |
419,088 |
453,071 |
463,804 |
481,674 |
511,032 |
516,120 |
464,874 |
454,810 |
483,183 |
| Kuwait |
342,417 |
348,792 |
358,854 |
374,804 |
388,753 |
396,661 |
419,584 |
438,559 |
442,647 |
| Bangladesh |
138,111 |
148,545 |
163,680 |
176,304 |
181,160 |
183,019 |
163,517 |
156,507 |
161,927 |
| Pakistan |
92,136 |
91,251 |
89,082 |
81,360 |
79,753 |
77,482 |
71,444 |
68,679 |
68,843 |
| Philippines |
72,396 |
77,728 |
78,610 |
76,888 |
78,624 |
76,036 |
67,658 |
63,584 |
66,914 |
| Syria |
63,875 |
64,441 |
64,408 |
62,440 |
62,738 |
63,156 |
63,128 |
63,621 |
63,897 |
| Nepal |
39,322 |
43,519 |
45,713 |
52,644 |
57,235 |
54,595 |
42,087 |
47,734 |
62,930 |
| Jordan |
|
|
25,119 |
25,130 |
25,736 |
26,246 |
25,232 |
26,407 |
27,395 |
| Sri Lanka |
24,375 |
25,149 |
|
|
|
|
|
|
21,121 |
| Lebanon |
|
|
|
|
|
|
|
19,803 |
|
| Iran |
26,941 |
26,590 |
25,922 |
22,814 |
22,630 |
22,156 |
20,651 |
|
|
| Other countries |
131,618 |
139691 |
140,098 |
142,620 |
146,251 |
144,102 |
126,658 |
129,183 |
141,046 |
| Total |
1,805,507 |
1,938,243 |
2,009,071 |
2,071,656 |
2,141,594 |
2,119,011 |
1,929,903 |
1,915,865 |
2,036,990 |
Source: Central Statistical Bureau (CSB), Labour Market Information System (LMIS), Integrated Database
ANNEXED NOTE
- Characteristics of data and definitions
Kuwait’s Labour Market Information System (KLMIS) was developed by the Central Statistical Bureau (CSB), in collaboration with relevant other government agencies.
https://lmis.csb.gov.kw/ar/Default.aspx;
https://lmis.csb.gov.kw/En/Docs/KLMI%20Report%20English%20-%20Final%20Version.pdf.
KLMIS’s Integrated database, updated on a quarterly basis, tabulates basic data on nationals’ and foreign migrants’ employment, taken from four administrative sources:
the Civil Service Commission (CSC) (public sector’s statistics);
the Public Authority for Civil Information (PACI) (public entities which are not included in the Civil Service Commission records);
the Public Authority for Manpower (PAM) (statistics on workers in the private sector);
Ministry of Interior (MoI) (domestic workers).
Information on LMIS’s data sources is taken from:
Al Daas, M. Labor Statistics for evidence-based policies,
https://www.iaos-isi.org/images/IAOS2017-19/2016Conference/P5C/Mona_Al_daas_paper.pdf, p. 3.
- Institution which provides data
The Central Statistical Bureau (CSB)
https://www.csb.gov.kw/
https://www.csb.gov.kw/default_en
- Period of data coverage
30/06, given years; Q4 2022.
- Data availability
Kuwait: Central Statistical Bureau. Integrated Database – LMIS
https://lmis.csb.gov.kw/
https://lmis.csb.gov.kw/default_En
Data are available in Arabic and English, by quarter, for every year since 2014.
https://lmis.csb.gov.kw/IntegratedDataView_En
Last date of access: June 2023.
GLMM and GRC cannot guarantee that the link to access the source will not change; that the information will not be removed from the website it was obtained from; that no geo-blockages will be imposed; or that the information will not be available for any another reason.
Keywords: Kuwait, Foreign Labour, National & Foreign Labour, Employment, Labour Market, India, Bangladesh, Pakistan, Philippines, Nepal, Sri Lanka, Syria, Jordan, Lebanon, Iran
| |
Saudis |
Non-Saudis |
Total |
| Riyadh |
4,439,210 |
4,152,538 |
8,591,748 |
| Makkah Al Mukarramah |
4,153,723 |
3,867,740 |
8,021,463 |
| Eastern Region |
2,949,854 |
2,175,400 |
5,125,254 |
| Al Madinah Al Munawwarah |
1,352,146 |
785,837 |
2,137,983 |
| Aseer |
1,444,688 |
579,597 |
2,024,285 |
| Jazan |
1,002,779 |
402,218 |
1,404,997 |
| Al Qaseem |
926,490 |
409,689 |
1,336,179 |
| Tabuk |
637,601 |
248,435 |
886,036 |
| Hail |
527,885 |
218,521 |
746,406 |
| Al Jawf |
440,264 |
155,558 |
595,822 |
| Najran |
394,976 |
197,324 |
592,300 |
| Northern Borders |
271,358 |
102,219 |
373,577 |
| Al Bahah |
251,288 |
87,886 |
339,174 |
| Total |
18,792,262 |
13,382,962 |
32,175,224 |
Source: Saudi Arabia census 2022
ANNEXED NOTE
- Technical Notes and Definitions
Source: Saudi census 2022
Date of reference: 10 May 2022
Population of reference: Families and individual citizens and residents within the Kingdom, regardless of the status of their identification documents. Visitors for Hajj, Umrah and tourism are excluded from the census.
Methodology:
The first phase of the 2020 census began on 3 February 2020 (enumeration of buildings and households). Census 2022 used geospatial data, including satellite images, electricity consumption and mobile phone data, to improve the accuracy and geographic coverage of address canvassing.
The second stage (“actual enumeration”) was due to start on the original reference date (17 March 2020), but was suspended by the outbreak of the COVID-19 crisis. This stage was conducted in October 2021.
The 2022 census used a combined methodology – administrative records, fieldwork and digital self-enumeration. Household data were collected from e-portals of self-enumeration (on residents’ mobile devices, laptops or personal computers, or self-enumeration stations/kiosks, located in shopping centers). The digital self-enumeration process was complemented by face-to-face interviews, using digital tablets.
Census 2022 used a de jure approach: enumerating people according to their usual place of residence.
Administrative data from multiple sources was used to cross-validate collected census data.
Census 2022 was designed as a launchpad for several new secure statistical data registers for population, housing, and businesses.
See census methodology in:
https://portal.saudicensus.sa/portal/public/methodology
Portal of the Saudi census:
https://portal.saudicensus.sa/portal
- Institution which provides data
General Authority for Statistics (GAStat)
- Data availability
The table was retrieved from the Saudi census portal on GAStat website:
https://portal.saudicensus.sa/portal
“Population” section, then “data tables”-
https://portal.saudicensus.sa/portal/public/1/15?type=TABLE
Selected, pre-set tables can be downloaded from the thematic section.
Date of access: 15 June 2023.
GLMM and GRC cannot guarantee that the link to access the source will not change; that the information will not be removed from the website it was obtained from; that no geo-blockages will be imposed; or that the information will not be available for any another reason.
Keywords: Saudi Arabia, Foreign Population, National Population, Foreign & National Populations
| |
Saudis |
Non-Saudis |
Total population |
| |
Males |
Females |
Total |
Males |
Females |
Total |
Males |
Females |
Total |
| 2010 |
7,066,599 |
6,979,565 |
14,046,164 |
7,156,237 |
2,776,086 |
9,932,323 |
14,222,836 |
9,755,651 |
23,978,487 |
| 2011 |
7,210,243 |
7,131,886 |
14,342,129 |
7,896,884 |
2,852,854 |
10,749,738 |
15,107,127 |
9,984,740 |
25,091,867 |
| 2012 |
7,380,972 |
7,302,574 |
14,683,546 |
8,568,573 |
2,916,742 |
11,485,315 |
15,949,545 |
10,219,316 |
26,168,861 |
| 2013 |
7,581,015 |
7,498,386 |
15,079,401 |
9,469,421 |
3,075,182 |
12,544,603 |
17,050,436 |
10,573,568 |
27,624,004 |
| 2014 |
7,812,695 |
7,722,341 |
15,535,036 |
9,641,977 |
3,132,260 |
12,774,237 |
17,454,672 |
10,854,601 |
28,309,273 |
| 2015 |
8,029,058 |
7,939,013 |
15,968,071 |
10,621,855 |
3,226,456 |
13,848,311 |
18,650,913 |
11,165,469 |
29,816,382 |
| 2016 |
8,218,925 |
8,136,387 |
16,355,312 |
11,296,387 |
3,302,499 |
14,598,886 |
19,515,312 |
11,438,886 |
30,954,198 |
| 2017 |
8,383,654 |
8,313,326 |
16,696,980 |
10,949,843 |
3,330,532 |
14,280,375 |
19,333,497 |
11,643,858 |
30,977,355 |
| 2018 |
8,578,445 |
8,507,191 |
17,085,636 |
10,002,472 |
3,108,173 |
13,110,645 |
18,580,917 |
11,615,364 |
30,196,281 |
| 2019 |
8,790,733 |
8,716,438 |
17,507,171 |
9,553,850 |
3,002,778 |
12,556,628 |
18,344,583 |
11,719,216 |
30,063,799 |
| 2020 |
9,030,279 |
8,948,308 |
17,978,587 |
10,248,548 |
3,325,375 |
13,573,923 |
19,278,827 |
12,273,683 |
31,552,510 |
| 2021 |
9,228,524 |
9,152,145 |
18,380,669 |
9,341,023 |
3,062,691 |
12,403,714 |
18,569,547 |
12,214,836 |
30,784,383 |
| 2022 |
9,434,131 |
9,358,131 |
18,792,262 |
10,244,464 |
3,138,498 |
13,382,962 |
19,678,595 |
12,496,629 |
32,175,224 |
Source: Saudi Arabia census 2022
ANNEXED NOTE
- Technical Notes and Definitions
Source: Saudi census 2022
Date of reference: 10 May 2022
Population of reference: Families and individual citizens and residents within the Kingdom, regardless of the status of their identification documents. Visitors for Hajj, Umrah and tourism are excluded from the census.
Methodology:
The first phase of the 2020 census began on 3 February 2020 (enumeration of buildings and households). Census 2022 used geospatial data, including satellite images, electricity consumption and mobile phone data, to improve the accuracy and geographic coverage of address canvassing.
The second stage (“actual enumeration”) was due to start on the original reference date (17 March 2020), but was suspended by the outbreak of the COVID-19 crisis. This stage was conducted in October 2021.
The 2022 census used a combined methodology – administrative records, fieldwork and digital self-enumeration. Household data were collected from e-portals of self-enumeration (on residents’ mobile devices, laptops or personal computers, or self-enumeration stations/kiosks, located in shopping centers). The digital self-enumeration process was complemented by face-to-face interviews, using digital tablets.
Census 2022 used a de jure approach: enumerating people according to their usual place of residence.
Administrative data from multiple sources was used to cross-validate collected census data.
Census 2022 was designed as a launchpad for several new secure statistical data registers for population, housing, and businesses.
See census methodology in:
https://portal.saudicensus.sa/portal/public/methodology
Portal of the Saudi census:
https://portal.saudicensus.sa/portal
Population data for 2010-22 were revised and backcasted, based on 2022 population census and past years’ administrative data.
Technical note on backcasting:
https://portal.saudicensus.sa/static-assets/media/content/20230529_Back-Casting%20Methodology.pdf?crafterSite=gastat-portal
- Institution which provides data
General Authority for Statistics (GAStat)
- Data availability
The table was retrieved from the Saudi census portal on GAStat website:
https://portal.saudicensus.sa/portal
“Population” section, then “data tables”-
https://portal.saudicensus.sa/portal/public/1/15?type=TABLE
Selected, pre-set tables can be downloaded from the thematic section.
Date of access: 15 June 2023.
GLMM and GRC cannot guarantee that the link to access the source will not change; that the information will not be removed from the website it was obtained from; that no geo-blockages will be imposed; or that the information will not be available for any another reason.
Keywords: Saudi Arabia, Foreign Population, National Population, Foreign & National Populations
| |
Males |
Females |
| Illiterate |
Read and write |
Less than general diploma |
General diploma |
Higher Diploma |
Bachelor or more |
Unknown |
Total males |
Illiterate |
Read and write |
Less than general diploma |
General diploma |
Higher Diploma |
Bachelor or more |
Unknown |
Total females |
| Omanis |
10-14 |
383 |
91 |
158,546 |
4 |
– |
1 |
1,539 |
160,564 |
206 |
67 |
153,796 |
– |
– |
– |
1,214 |
155,283 |
| 15-19 |
349 |
81 |
99,886 |
18,539 |
8 |
335 |
441 |
119,639 |
247 |
75 |
87,582 |
26,902 |
4 |
494 |
417 |
115,721 |
| 20-24 |
353 |
214 |
28,229 |
69,725 |
1,601 |
9,736 |
119 |
109,977 |
271 |
175 |
12,839 |
71,429 |
2,311 |
19,660 |
172 |
106,857 |
| 25-29 |
546 |
478 |
37,711 |
43,793 |
8,050 |
27,691 |
77 |
118,346 |
486 |
475 |
14,883 |
30,154 |
11,321 |
57,171 |
115 |
114,605 |
| 30-34 |
739 |
848 |
29,333 |
55,662 |
8,972 |
27,515 |
125 |
123,194 |
751 |
1,096 |
14,126 |
50,746 |
12,079 |
41,221 |
175 |
120,194 |
| 35-39 |
858 |
1,557 |
29,419 |
51,030 |
6,036 |
24,832 |
127 |
113,859 |
1,051 |
2,260 |
18,298 |
50,246 |
8,774 |
31,059 |
188 |
111,876 |
| 40-44 |
927 |
1,828 |
25,511 |
38,490 |
2,671 |
19,385 |
102 |
88,914 |
1,493 |
2,915 |
22,632 |
36,166 |
4,577 |
20,100 |
263 |
88,146 |
| 45-49 |
796 |
2,210 |
19,716 |
25,514 |
2,211 |
11,188 |
95 |
61,730 |
2,026 |
3,866 |
22,410 |
22,104 |
2,556 |
8,761 |
279 |
62,002 |
| 50-54 |
1,062 |
3,102 |
15,756 |
14,233 |
1,667 |
5,531 |
121 |
41,472 |
3,663 |
5,825 |
18,219 |
7,935 |
1,643 |
2,499 |
332 |
40,116 |
| 55-59 |
1,727 |
4,763 |
12,044 |
8,685 |
635 |
2,937 |
135 |
30,926 |
6,559 |
7,299 |
13,618 |
3,803 |
411 |
715 |
409 |
32,814 |
| 60-64 |
3,310 |
6,890 |
9,217 |
5,012 |
183 |
1,085 |
176 |
25,873 |
9,623 |
8,185 |
9,442 |
2,026 |
64 |
168 |
284 |
29,792 |
| 65-69 |
4,428 |
5,807 |
4,412 |
2,346 |
27 |
295 |
102 |
17,417 |
10,056 |
6,346 |
4,920 |
978 |
5 |
44 |
113 |
22,462 |
| 70-74 |
4,471 |
4,481 |
2,399 |
1,233 |
14 |
91 |
59 |
12,748 |
8,472 |
4,316 |
2,337 |
501 |
3 |
18 |
65 |
15,712 |
| 75-79 |
4,030 |
2,959 |
1,111 |
530 |
9 |
43 |
37 |
8,719 |
6,333 |
2,590 |
993 |
218 |
1 |
2 |
31 |
10,168 |
| 80+ |
6,440 |
3,241 |
740 |
373 |
6 |
31 |
35 |
10,866 |
9,325 |
2,433 |
733 |
167 |
– |
3 |
46 |
12,707 |
| Total |
30,419 |
38,550 |
474,030 |
335,169 |
32,090 |
130,696 |
3,290 |
1,044,244 |
60,562 |
47,923 |
396,828 |
303,375 |
43,749 |
181,915 |
4,103 |
1,038,455 |
|
|
|
|
|
|
|
|
|
|
|
|
|
|
|
|
|
|
|
|
|
|
|
|
|
|
|
|
|
|
|
|
|
|
|
|
| |
Males |
Females |
| Illiterate |
Read and write |
Less than general diploma |
General diploma |
Higher Diploma |
Bachelor or more |
Unknown |
Total males |
Illiterate |
Read and write |
Less than general diploma |
General diploma |
Higher Diploma |
Bachelor or more |
Unknown |
Total females |
| Non-Omanis |
10-14 |
82 |
1,490 |
20,628 |
1 |
– |
– |
2,631 |
24,832 |
54 |
1,177 |
19,363 |
– |
– |
– |
2,395 |
22,989 |
| 15-19 |
61 |
1,372 |
14,064 |
1,034 |
10 |
39 |
1,942 |
18,522 |
63 |
1,178 |
12,923 |
1,036 |
7 |
31 |
1,845 |
17,083 |
| 20-24 |
530 |
63,500 |
41,633 |
12,882 |
576 |
2,070 |
5,358 |
126,549 |
268 |
13,871 |
6,890 |
4,943 |
245 |
812 |
2,458 |
29,487 |
| 25-29 |
591 |
103,980 |
92,010 |
44,933 |
2,958 |
8,618 |
4,677 |
257,767 |
390 |
23,414 |
12,059 |
9,140 |
920 |
3,498 |
2,771 |
52,192 |
| 30-34 |
554 |
111,819 |
124,620 |
60,962 |
5,621 |
16,869 |
3,425 |
323,870 |
498 |
29,832 |
17,402 |
12,909 |
1,985 |
6,842 |
2,075 |
71,543 |
| 35-39 |
443 |
99,755 |
114,174 |
58,887 |
7,008 |
23,785 |
2,388 |
306,440 |
497 |
26,951 |
16,805 |
12,825 |
2,694 |
8,795 |
1,376 |
69,943 |
| 40-44 |
340 |
65,964 |
76,935 |
40,637 |
5,938 |
21,703 |
1,488 |
213,005 |
354 |
18,983 |
12,700 |
10,005 |
2,080 |
7,091 |
880 |
52,093 |
| 45-49 |
156 |
35,771 |
44,777 |
25,502 |
4,542 |
17,135 |
764 |
128,647 |
251 |
10,866 |
9,088 |
6,541 |
1,552 |
5,263 |
605 |
34,166 |
| 50-54 |
100 |
22,400 |
28,311 |
16,298 |
3,454 |
13,096 |
443 |
84,102 |
194 |
5,746 |
5,416 |
3,823 |
904 |
3,267 |
439 |
19,789 |
| 55-59 |
58 |
11,480 |
14,442 |
8,070 |
2,091 |
8,028 |
330 |
44,499 |
195 |
3,134 |
3,196 |
2,030 |
504 |
1,583 |
283 |
10,925 |
| 60-64 |
30 |
4,605 |
5,798 |
3,815 |
1,147 |
4,499 |
247 |
20,141 |
158 |
1,840 |
1,887 |
1,188 |
228 |
727 |
177 |
6,205 |
| 65-69 |
50 |
2,055 |
2,245 |
1,532 |
560 |
2,234 |
232 |
8,908 |
162 |
1,219 |
1,083 |
642 |
118 |
283 |
121 |
3,628 |
| 70-74 |
33 |
612 |
546 |
401 |
153 |
778 |
251 |
2,774 |
112 |
773 |
609 |
369 |
42 |
108 |
81 |
2,094 |
| 75-79 |
37 |
318 |
203 |
138 |
47 |
228 |
215 |
1,186 |
92 |
410 |
279 |
140 |
14 |
49 |
44 |
1,028 |
| 80+ |
34 |
227 |
114 |
88 |
24 |
63 |
402 |
952 |
87 |
307 |
194 |
102 |
17 |
10 |
69 |
786 |
| Total |
3,099 |
525,348 |
580,500 |
275,180 |
34,129 |
119,145 |
24,793 |
1,562,194 |
3,375 |
139,701 |
119,894 |
65,693 |
11,310 |
38,359 |
15,619 |
393,951 |
Source: National Centre for Statistics and Information (NCSI)
ANNEXED NOTE
- Technical Notes and Definitions
Period of reference: 01/01/2023.
Source of the data: data updated from e-census 2020, based on administrative records. Population data: based on vital statistics records (births and deaths) produced by the Ministry of Health (MOH), and the National Registration System (Royal Oman Police).
The civil registration records all Omani and expatriate residents. It is based on the civil status system and is maintained by the General Directorate of Civil Status, a part of the Royal Oman Police.
Since 2004, registration of all vital events taking place in the Sultanate (births, death, marriages and divorces) in the civil register is mandatory for Omanis and foreign residents of the Sultanate.
e-census 2020:
Population data and statistics: methodology explained in publication “Electronic Census System for the E-Census for Population, Residences & Establishments 2020”, especially pp. 15-16; 19-20
https://portal.ecensus.gov.om/ecen-portal/indicators/83/viewer
Portal of e-census 2020 and data updates for December 2021 and 2022:
https://portal.ecensus.gov.om/ecen-portal/
Characteristics of data:
Figures refer to:
- Omanis holding an official valid document registered in the National Registration System, or expired for less than ten years
- Foreign residents holding valid visas, or visas expired for lesss than two years; dependents holding valid visas, providing that they are in the country.
Residence visa for expatriates includes residence visa for a wife of an Omani, student resident, multiple entry visa, employment visa, employment contracting visa, official visit visa, investor visa. The dependent visa includes Family Reunion visas and relative/ friend visit visa.
- Institution which provides data
National Center for Statistics and Information (NCSI)
- Data availability
Data retrieved from e-census portal, datasets building tool:
https://portal.ecensus.gov.om/ecen-portal/indicators/261/viewer
Date of access: 5 June 2023.
GLMM and GRC cannot guarantee that the link to access the source will not change; that the information will not be removed from the website it was obtained from; that no geo-blockages will be imposed; or that the information will not be available for any another reason.
Keywords: Oman, Foreign & National Population, Education
| |
Employed |
Unemployed |
Inactive |
Total |
| |
Omanis |
Expatriates |
Omanis |
Expatriates |
Omanis |
Expatriates |
Omanis |
Expatriates |
| |
Males |
Females |
Males |
Females |
Males |
Females |
Males |
Females |
Males |
Females |
Males |
Females |
Males |
Females |
Males |
Females |
| 15 – 19 |
4,089 |
1,442 |
402 |
307 |
2,098 |
258 |
N/A |
N/A |
113,452 |
114,021 |
18,120 |
16,776 |
119,639 |
115,721 |
18,522 |
17,083 |
| 20 – 24 |
37,102 |
9,238 |
118,716 |
14,013 |
13,379 |
6,907 |
N/A |
N/A |
59,496 |
90,712 |
7,833 |
15,474 |
109,977 |
106,857 |
126,549 |
29,487 |
| 25 – 29 |
89,756 |
30,093 |
254,437 |
30,770 |
6,612 |
19,577 |
N/A |
N/A |
21,978 |
64,935 |
3,330 |
21,422 |
118,346 |
114,605 |
257,767 |
52,192 |
| 30 – 34 |
108,986 |
47,937 |
321,061 |
47,120 |
1,975 |
11,781 |
N/A |
N/A |
12,233 |
60,476 |
2,809 |
24,423 |
123,194 |
120,194 |
323,870 |
71,543 |
| 35 – 39 |
102,140 |
52,495 |
303,673 |
47,741 |
1,097 |
4,805 |
N/A |
N/A |
10,622 |
54,576 |
2,767 |
22,202 |
113,859 |
111,876 |
306,440 |
69,943 |
| 40 – 44 |
78,954 |
41,208 |
210,648 |
35,448 |
669 |
1,679 |
N/A |
N/A |
9,291 |
45,259 |
2,357 |
16,645 |
88,914 |
88,146 |
213,005 |
52,093 |
| 45 – 49 |
53,152 |
22,393 |
126,911 |
22,540 |
307 |
571 |
N/A |
N/A |
8,271 |
39,038 |
1,736 |
11,626 |
61,730 |
62,002 |
128,647 |
34,166 |
| 50 – 54 |
33,421 |
11,157 |
82,734 |
11,787 |
127 |
138 |
N/A |
N/A |
7,924 |
28,821 |
1,368 |
8,002 |
41,472 |
40,116 |
84,102 |
19,789 |
| 55 – 59 |
22,139 |
6,721 |
43,348 |
5,308 |
46 |
46 |
N/A |
N/A |
8,741 |
26,047 |
1,151 |
5,617 |
30,926 |
32,814 |
44,499 |
10,925 |
| 60 – 64 |
14,572 |
4,645 |
18,842 |
1,911 |
14 |
11 |
N/A |
N/A |
11,287 |
25,136 |
1,299 |
4,294 |
25,873 |
29,792 |
20,141 |
6,205 |
| 65 – 69 |
8,448 |
2,637 |
7,229 |
430 |
N/A |
N/A |
N/A |
N/A |
8,969 |
19,825 |
1,679 |
3,198 |
17,417 |
22,462 |
8,908 |
3,628 |
| 70 – 74 |
5,753 |
1,453 |
1,423 |
101 |
N/A |
N/A |
N/A |
N/A |
6,995 |
14,259 |
1,351 |
1,993 |
12,748 |
15,712 |
2,774 |
2,094 |
| 75 – 79 |
3,556 |
911 |
275 |
21 |
N/A |
N/A |
N/A |
N/A |
5,163 |
9,257 |
911 |
1,007 |
8,719 |
10,168 |
1,186 |
1,028 |
| >= 80 |
3,813 |
802 |
64 |
11 |
N/A |
N/A |
N/A |
N/A |
7,053 |
11,905 |
888 |
775 |
10,866 |
12,707 |
952 |
786 |
| Total |
565,881 |
233,132 |
1,489,763 |
217,508 |
26,324 |
45,773 |
N/A |
N/A |
291,475 |
604,267 |
47,599 |
153,454 |
883,680 |
883,172 |
1,537,362 |
370,962 |
Source: National Centre for Statistics and Information (NCSI)
ANNEXED NOTE
- Technical Notes and Definitions
Period of reference: 01/01/2023.
Source of the data: data updated from e-census 2020; based on vital statistics (births and deaths) produced by the Ministry of Health (MOH), and the National Registration System (Royal Oman Police).
The civil registration records all Omani and expatriate residents. It is based on the civil status system and is maintained by the General Directorate of Civil Status, a part of the Royal Oman Police.
Since 2004, registration of all vital events taking place in the Sultanate (births, death, marriages and divorces) in the civil register is mandatory for Omanis and foreign residents of the Sultanate.
e-census 2020:
Population data and statistics: methodology explained in publication “Electronic Census System for the E-Census for Population, Residences & Establishments 2020”, especially pp. 15-16; 19-20
https://portal.ecensus.gov.om/ecen-portal/indicators/83/viewer
Portal of e-census 2020 and data updates for December 2021 and 2022:
https://portal.ecensus.gov.om/ecen-portal/
Characteristics of data:
Figures refer to:
- Omanis holding an official valid document registered in the National Registration System, or expired for less than ten years
- Foreign residents holding valid visas, or visas expired for lesss than two years; dependents holding valid visas, providing that they are in the country.
Residence visa for expatriates includes residence visa for a wife of an Omani, student resident, multiple entry visa, employment visa, employment contracting visa, official visit visa, investor visa. The dependent visa includes Family Reunion visas and relative/ friend visit visa.
N/A: Not applicable
Unemployment benefit is not opened to non-nationals and to Omanis aged above 65.
No metadata or definitions of terms and categories used in the census are available in the e-portal of the census.
- Institution which provides data
National Center for Statistics and Information (NCSI)
- Data availability
Data retrieved from e-census portal, datasets building tool:
https://portal.ecensus.gov.om/ecen-portal/indicators/261/viewer
Date of access: 5 June 2023.
GLMM and GRC cannot guarantee that the link to access the source will not change; that the information will not be removed from the website it was obtained from; that no geo-blockages will be imposed; or that the information will not be available for any another reason.
Keywords: Oman, Foreign & National Population, Employment, Unemployment, National & Foreign Labour, Female Employment
| |
Omanis |
Expatriates |
Total |
| |
Males |
Females |
Males |
Females |
Males |
Females |
| Illiterate |
30,419 |
60,562 |
3,099 |
3,375 |
33,518 |
63,937 |
| Read and write |
38,550 |
47,923 |
525,348 |
139,701 |
563,898 |
187,624 |
| Less than general diploma |
474,030 |
396,828 |
580,500 |
119,894 |
1,054,530 |
516,722 |
| General diploma |
335,169 |
303,375 |
275,180 |
65,693 |
610,349 |
369,068 |
| Higher Diploma |
32,090 |
43,749 |
34,129 |
11,310 |
66,219 |
55,059 |
| Bachelor or more |
130,696 |
181,915 |
119,145 |
38,359 |
249,841 |
220,274 |
| Unknown |
3,290 |
4,103 |
24,793 |
15,619 |
28,083 |
19,722 |
| Total |
1,044,244 |
1,038,455 |
1,562,194 |
393,951 |
2,606,438 |
1,432,406 |
Source: National Centre for Statistics and Information (NCSI)
ANNEXED NOTE
- Technical Notes and Definitions
Period of reference: 01/01/2023.
Source of the data: data updated from e-census 2020, based on administrative records. Population data: based on vital statistics records (births and deaths) produced by the Ministry of Health (MOH), and the National Registration System (Royal Oman Police).
The civil registration records all Omani and expatriate residents. It is based on the civil status system and is maintained by the General Directorate of Civil Status, a part of the Royal Oman Police.
Since 2004, registration of all vital events taking place in the Sultanate (births, death, marriages and divorces) in the civil register is mandatory for Omanis and foreign residents of the Sultanate.
e-census 2020:
Population data and statistics: methodology explained in publication “Electronic Census System for the E-Census for Population, Residences & Establishments 2020”, especially pp. 15-16; 19-20
https://portal.ecensus.gov.om/ecen-portal/indicators/83/viewer
Portal of e-census 2020 and data updates for December 2021 and 2022:
https://portal.ecensus.gov.om/ecen-portal/
Characteristics of data:
Figures refer to:
- Omanis holding an official valid document registered in the National Registration System, or expired for less than ten years
- Foreign residents holding valid visas, or visas expired for lesss than two years; dependents holding valid visas, providing that they are in the country.
Residence visa for expatriates includes residence visa for a wife of an Omani, student resident, multiple entry visa, employment visa, employment contracting visa, official visit visa, investor visa. The dependent visa includes Family Reunion visas and relative/ friend visit visa.
- Institution which provides data
National Center for Statistics and Information (NCSI)
- Data availability
Data retrieved from e-census portal, datasets building tool:
https://portal.ecensus.gov.om/ecen-portal/indicators/261/viewer
Date of access: 5 June 2023.
GLMM and GRC cannot guarantee that the link to access the source will not change; that the information will not be removed from the website it was obtained from; that no geo-blockages will be imposed; or that the information will not be available for any another reason.
Keywords: Oman, Foreign & National Population, Education
| |
Males |
Females |
Total |
| Bangladesh |
1,950,943 |
165,249 |
2,116,192 |
| India |
1,712,780 |
171,696 |
1,884,476 |
| Pakistan |
1,647,704 |
166,974 |
1,814,678 |
| Yemen |
1,334,481 |
468,988 |
1,803,469 |
| Egypt |
1,181,180 |
290,202 |
1,471,382 |
| Sudan |
673,689 |
145,886 |
819,575 |
| Philippines |
274,305 |
451,588 |
725,893 |
| Syria |
259,632 |
189,682 |
449,314 |
| Nepal |
293,049 |
4,512 |
297,561 |
| Jordan |
N.A. |
N.A. |
204,249 |
| Indonesia |
N.A. |
N.A. |
175,342 |
| Burma |
N.A. |
N.A. |
163,717 |
| Ethiopia |
N.A. |
N.A. |
159,221 |
| Afghanistan |
N.A. |
N.A. |
132,282 |
| Palestine |
N.A. |
N.A. |
129,869 |
| Uganda |
N.A. |
N.A. |
127,932 |
| Kenya |
N.A. |
N.A. |
91,802 |
| Sri Lanka |
N.A. |
N.A. |
84,794 |
| Nigeria |
N.A. |
N.A. |
79,547 |
| Lebanon |
N.A. |
N.A. |
52,779 |
| Kuwait |
N.A. |
N.A. |
50,282 |
| Morocco |
N.A. |
N.A. |
48,796 |
| Eritrea |
N.A. |
N.A. |
47,258 |
| Chad |
N.A. |
N.A. |
46,193 |
| Somalia |
N.A. |
N.A. |
45,709 |
| Mali |
N.A. |
N.A. |
38,360 |
| Niger |
N.A. |
N.A. |
33,579 |
| Turkey |
N.A. |
N.A. |
25,838 |
| Tunisia |
N.A. |
N.A. |
24,818 |
| USA |
N.A. |
N.A. |
20,485 |
| Mauritania |
N.A. |
N.A. |
18,006 |
| UK |
N.A. |
N.A. |
17,865 |
| Bahrain |
N.A. |
N.A. |
16,652 |
| China |
N.A. |
N.A. |
14,619 |
| Total non-Saudis |
10,244,464 |
3,138,498 |
13,382,962 |
| Total population |
19,678,595 |
12,496,629 |
32,175,224 |
Source: GAStat, Saudi Arabia census 2022
ANNEXED NOTE
- Technical Notes and Definitions:
Source: Saudi census 2022
Date of reference: 10 May 2022
Population of reference: Households and individual citizens and residents within the Kingdom, regardless of the status of their identification documents.
Visitors for Hajj, Umrah and tourism are excluded from the census.
Methodology:
The first phase of the 2020 census began on 3 February 2020 (enumeration of buildings and households). Census 2022 used geospatial data, including satellite images, electricity consumption and mobile phone data, to improve the accuracy and geographic coverage of address canvassing.
The second stage (“actual enumeration”) was due to start on the original reference date (17 March 2020) but was suspended by the outbreak of the COVID-19 crisis. The enumeration stage was conducted in October 2021.
The 2022 census data collection used a combined/ hybrid methodology, based on administrative records, fieldwork and digital self-enumeration. Household data were collected from e-portals of self-enumeration (on residents’ mobile devices, laptops or personal computers, or self-enumeration stations/kiosks, located in shopping centres). The digital self-enumeration process was complemented by face-to-face interviews, using digital tablets.
Census 2022 used a de jure approach: enumerating people according to their usual place of residence.
Administrative data from multiple sources was used to cross-validate collected census data.
Census 2022 was used as a launchpad for several new secure statistical data registers for population, housing, and businesses.
See census methodology in: https://portal.saudicensus.sa/portal/public/methodology
Portal of the Saudi census: https://portal.saudicensus.sa/portal
N.A.: Not available.
- Institution which provides data:
General Authority for Statistics (GAStat)
- Data availability:
The table was built by GLMM based on Figure 3, p. 4 in the “Population” summary report.
https://portal.saudicensus.sa/static-assets/media/content/20230531_GASTAT_Population_Report.pdf?crafterSite=gastat-portal
Date of access: 5 June 2023.
GLMM and GRC cannot guarantee that the link to access the source will not change; that the information will not be removed from the website it was obtained from; that no geo-blockages will be imposed; or that the information will not be available for any another reason.
Keywords: Saudi Arabia, Foreign Population, Burma, India, Indonesia, Pakistan, Bangladesh, Philippines, Nepal, Sri Lanka, Afghanistan, Iran, China, Bahrain, Egypt, Iraq, Jordan, Kuwait, Lebanon, Mauritania, Morocco, Palestine, Sudan, Tunisia, Turkey, Eritrea, Ethiopia, Chad, Mali, Niger, Nigeria, Somalia, Uganda, Kenya, UK, Europe, North America, Asia, Africa, Oceania, USA, Arab Countries,
|
Males |
Females |
| Illiterate |
Read and write |
Less than general diploma |
General diploma |
Higher Diploma |
Bachelor or more |
Unknown |
Total males |
Illiterate |
Read and write |
Less than general diploma |
General diploma |
Higher Diploma |
Bachelor or more |
Unknown |
Total females |
| Omanis |
10-14 |
562 |
139 |
141,138 |
3 |
– |
– |
846 |
142,688 |
347 |
101 |
136,698 |
1 |
– |
– |
701 |
137,848 |
| 15-19 |
358 |
138 |
82,727 |
29,157 |
7 |
6 |
316 |
112,709 |
264 |
122 |
72,621 |
36,066 |
17 |
24 |
281 |
109,395 |
| 20-24 |
417 |
333 |
32,799 |
68,845 |
4,637 |
4,017 |
25 |
111,073 |
349 |
254 |
13,801 |
74,501 |
5,693 |
12,662 |
52 |
107,312 |
| 25-29 |
687 |
593 |
37,371 |
52,911 |
13,266 |
19,367 |
15 |
124,210 |
638 |
718 |
14,477 |
41,624 |
17,363 |
45,870 |
48 |
120,738 |
| 30-34 |
857 |
1,195 |
28,947 |
57,593 |
11,122 |
21,520 |
49 |
121,283 |
939 |
1,631 |
15,921 |
54,331 |
14,035 |
31,661 |
83 |
118,601 |
| 35-39 |
998 |
1,775 |
28,576 |
48,518 |
5,669 |
20,127 |
45 |
105,708 |
1,296 |
2,667 |
20,172 |
46,001 |
8,367 |
25,296 |
73 |
103,872 |
| 40-44 |
878 |
1,997 |
24,370 |
34,308 |
2,426 |
15,539 |
39 |
79,557 |
1,787 |
3,384 |
24,568 |
31,655 |
3,871 |
14,519 |
93 |
79,877 |
| 45-49 |
962 |
2,691 |
18,379 |
20,636 |
2,666 |
7,717 |
50 |
53,101 |
2,806 |
5,044 |
20,879 |
14,932 |
2,536 |
4,775 |
102 |
51,074 |
| 50-54 |
1,329 |
3,813 |
13,913 |
11,421 |
1,171 |
4,007 |
84 |
35,738 |
5,382 |
6,779 |
15,844 |
5,413 |
1,057 |
1,371 |
154 |
36,000 |
| 55-59 |
2,415 |
6,191 |
11,416 |
6,940 |
412 |
1,852 |
124 |
29,350 |
8,253 |
7,957 |
11,195 |
2,868 |
167 |
348 |
189 |
30,977 |
| 60-64 |
4,503 |
7,136 |
7,026 |
3,729 |
88 |
524 |
112 |
23,118 |
10,731 |
8,050 |
7,122 |
1,473 |
32 |
76 |
76 |
27,560 |
| 65-69 |
4,634 |
5,364 |
3,280 |
1,776 |
16 |
135 |
56 |
15,261 |
9,583 |
5,476 |
3,393 |
755 |
4 |
32 |
24 |
19,267 |
| 70-74 |
4,923 |
4,274 |
1,828 |
1,014 |
16 |
59 |
37 |
12,151 |
8,290 |
3,766 |
1,633 |
367 |
2 |
7 |
9 |
14,074 |
| 75-79 |
4,448 |
2,874 |
864 |
406 |
4 |
18 |
23 |
8,637 |
6,505 |
2,274 |
731 |
200 |
– |
3 |
5 |
9,718 |
| 80+ |
6,294 |
2,921 |
528 |
283 |
5 |
19 |
17 |
10,067 |
8,693 |
2,095 |
519 |
122 |
– |
2 |
6 |
11,437 |
| Total |
34,265 |
41,434 |
433,162 |
337,540 |
41,505 |
94,907 |
1,838 |
984,651 |
65,863 |
50,318 |
359,574 |
310,309 |
53,144 |
136,646 |
1,896 |
977,750 |
|
|
|
|
|
|
|
|
|
|
|
|
|
|
|
|
|
|
|
|
|
|
|
|
|
|
|
|
|
|
|
|
|
|
|
|
|
|
|
|
|
|
|
|
|
|
|
|
|
|
|
|
|
|
|
Males |
Females |
| Illiterate |
Read and write |
Less than general diploma |
General diploma |
Higher Diploma |
Bachelor or more |
Unknown |
Total males |
Illiterate |
Read and write |
Less than general diploma |
General diploma |
Higher Diploma |
Bachelor or more |
Unknown |
Total females |
| Non-Omanis |
10-14 |
30 |
410 |
18,206 |
– |
– |
– |
2,915 |
21,561 |
28 |
342 |
17,397 |
– |
– |
– |
2,654 |
20,421 |
| 15-19 |
53 |
881 |
11,400 |
1,152 |
10 |
1 |
2,444 |
15,941 |
63 |
677 |
10,237 |
1,316 |
12 |
3 |
2,102 |
14,410 |
| 20-24 |
144 |
32,960 |
16,056 |
12,624 |
592 |
1,362 |
3,288 |
67,026 |
126 |
6,445 |
5,252 |
4,679 |
217 |
661 |
2,146 |
19,526 |
| 25-29 |
470 |
91,318 |
94,627 |
41,605 |
2,644 |
6,769 |
2,836 |
240,269 |
283 |
17,763 |
14,298 |
8,939 |
1,005 |
2,936 |
1,943 |
47,167 |
| 30-34 |
622 |
105,505 |
124,432 |
52,722 |
5,038 |
15,453 |
1,616 |
305,388 |
430 |
22,550 |
20,158 |
12,419 |
2,765 |
6,771 |
1,308 |
66,401 |
| 35-39 |
573 |
83,730 |
95,737 |
42,861 |
5,367 |
20,063 |
983 |
249,314 |
391 |
17,159 |
16,481 |
10,842 |
2,753 |
7,611 |
887 |
56,124 |
| 40-44 |
535 |
51,063 |
61,839 |
29,147 |
4,456 |
17,874 |
598 |
165,512 |
268 |
12,596 |
12,809 |
8,002 |
2,034 |
6,340 |
674 |
42,723 |
| 45-49 |
391 |
31,766 |
39,916 |
19,245 |
3,399 |
14,590 |
384 |
109,691 |
209 |
7,748 |
8,482 |
4,878 |
1,412 |
4,539 |
524 |
27,792 |
| 50-54 |
285 |
20,638 |
25,615 |
11,828 |
2,620 |
10,572 |
313 |
71,871 |
189 |
4,379 |
5,205 |
2,737 |
822 |
2,569 |
346 |
16,247 |
| 55-59 |
161 |
10,713 |
12,984 |
5,906 |
1,462 |
6,776 |
227 |
38,229 |
155 |
2,385 |
2,900 |
1,556 |
440 |
1,401 |
176 |
9,013 |
| 60-64 |
73 |
5,365 |
6,659 |
3,473 |
914 |
4,081 |
216 |
20,781 |
156 |
1,365 |
1,538 |
853 |
188 |
631 |
114 |
4,845 |
| 65-69 |
36 |
1,370 |
1,623 |
1,012 |
310 |
1,700 |
236 |
6,287 |
122 |
794 |
747 |
464 |
84 |
250 |
62 |
2,523 |
| 70-74 |
41 |
425 |
349 |
265 |
90 |
567 |
229 |
1,966 |
99 |
541 |
399 |
244 |
31 |
81 |
55 |
1,450 |
| 75-79 |
20 |
161 |
109 |
89 |
36 |
158 |
204 |
777 |
57 |
267 |
191 |
103 |
19 |
38 |
34 |
709 |
| 80+ |
20 |
161 |
82 |
67 |
21 |
36 |
310 |
697 |
68 |
231 |
139 |
79 |
12 |
8 |
59 |
596 |
| Total |
3,454 |
436,466 |
509,634 |
221,996 |
26,959 |
100,002 |
16,799 |
1,315,310 |
2,644 |
95,242 |
116,233 |
57,111 |
11,794 |
33,839 |
13,084 |
329,947 |
Source: National Centre for Statistics and Information (NCSI)
ANNEXED NOTE
- Technical Notes and Definitions
Period of reference: 12/12/2020.
Source of the data: E-census 2020, based on administrative records. Population data: based on vital statistics records (births and deaths) produced by the Ministry of Health (MOH), and the National Registration System (Royal Oman Police).
The civil registration records all Omani and expatriate residents. It is based on the civil status system and is maintained by the General Directorate of Civil Status, a part of the Royal Oman Police.
Since 2004, registration of all vital events taking place in the Sultanate (births, death, marriages and divorces) in the civil register is mandatory for Omanis and foreign residents of the Sultanate.
e-census 2020:
Population data and statistics: methodology explained in publication “Electronic Census System for the E-Census for Population, Residences & Establishments 2020”, especially pp. 15-16; 19-20
https://portal.ecensus.gov.om/ecen-portal/indicators/83/viewer
Portal of e-census 2020 and data updates for December 2021 and 2022:
https://portal.ecensus.gov.om/ecen-portal/
Characteristics of data:
Figures refer to:
- Omanis holding an official valid document registered in the National Registration System, or expired for less than ten years
- Foreign residents holding valid visas, or visas expired for lesss than two years; dependents holding valid visas, providing that they are in the country.
Residence visa for expatriates includes residence visa for a wife of an Omani, student resident, multiple entry visa, employment visa, employment contracting visa, official visit visa, investor visa. The dependent visa includes Family Reunion visas and relative/ friend visit visa.
- Institution which provides data
National Center for Statistics and Information (NCSI)
- Data availability
Data retrieved from e-census portal, datasets building tool:
https://portal.ecensus.gov.om/ecen-portal/indicators/261/viewer
Date of access: 5 June 2023.
GLMM and GRC cannot guarantee that the link to access the source will not change; that the information will not be removed from the website it was obtained from; that no geo-blockages will be imposed; or that the information will not be available for any another reason.
Keywords: Oman, Foreign & National Population, Education
|
Males |
Females |
| Illiterate |
Read and write |
Less than general diploma |
General diploma |
Higher Diploma |
Bachelor or more |
Unknown |
Total males |
Illiterate |
Read and write |
Less than general diploma |
General diploma |
Higher Diploma |
Bachelor or more |
Unknown |
Total females |
| Omanis |
10-14 |
471 |
117 |
149,377 |
4 |
– |
– |
1,195 |
151,164 |
267 |
87 |
145,134 |
– |
– |
– |
968 |
146,456 |
| 15-19 |
348 |
99 |
84,108 |
30,788 |
2 |
1 |
397 |
115,743 |
266 |
93 |
75,396 |
35,979 |
3 |
3 |
349 |
112,089 |
| 20-24 |
377 |
267 |
29,206 |
71,646 |
4,665 |
3,786 |
63 |
110,010 |
306 |
205 |
12,850 |
74,493 |
5,684 |
12,990 |
110 |
106,638 |
| 25-29 |
617 |
546 |
38,128 |
49,483 |
13,717 |
19,602 |
24 |
122,117 |
554 |
595 |
14,793 |
35,788 |
17,717 |
48,798 |
74 |
118,319 |
| 30-34 |
835 |
999 |
28,320 |
57,689 |
11,324 |
22,443 |
62 |
121,672 |
882 |
1,348 |
14,849 |
52,991 |
12,992 |
35,847 |
99 |
119,008 |
| 35-39 |
936 |
1,688 |
29,333 |
50,647 |
6,495 |
21,825 |
58 |
110,982 |
1,183 |
2,490 |
19,189 |
49,113 |
8,649 |
28,203 |
95 |
108,922 |
| 40-44 |
898 |
1,930 |
25,213 |
36,622 |
2,653 |
17,283 |
54 |
84,653 |
1,669 |
3,201 |
24,251 |
34,054 |
4,014 |
17,606 |
151 |
84,946 |
| 45-49 |
899 |
2,486 |
19,163 |
23,310 |
2,618 |
9,318 |
59 |
57,853 |
2,486 |
4,565 |
21,731 |
18,403 |
2,611 |
6,479 |
157 |
56,432 |
| 50-54 |
1,217 |
3,486 |
14,700 |
12,579 |
1,345 |
4,698 |
80 |
38,105 |
4,709 |
6,590 |
17,087 |
6,345 |
1,345 |
1,862 |
224 |
38,162 |
| 55-59 |
2,114 |
5,701 |
11,926 |
7,670 |
491 |
2,357 |
114 |
30,373 |
7,788 |
7,737 |
12,144 |
3,248 |
232 |
454 |
267 |
31,870 |
| 60-64 |
3,926 |
6,983 |
7,822 |
4,151 |
117 |
724 |
142 |
23,865 |
10,226 |
8,175 |
7,788 |
1,667 |
37 |
124 |
150 |
28,167 |
| 65-69 |
4,696 |
5,533 |
3,703 |
1,989 |
16 |
220 |
68 |
16,225 |
9,922 |
5,790 |
3,983 |
856 |
6 |
40 |
61 |
20,658 |
| 70-74 |
4,584 |
4,241 |
2,008 |
1,051 |
15 |
82 |
35 |
12,016 |
8,054 |
3,936 |
1,830 |
397 |
1 |
11 |
23 |
14,252 |
| 75-79 |
4,130 |
2,801 |
922 |
447 |
5 |
31 |
26 |
8,362 |
6,313 |
2,334 |
820 |
219 |
1 |
2 |
13 |
9,702 |
| 80+ |
6,053 |
2,841 |
599 |
324 |
6 |
27 |
23 |
9,873 |
8,501 |
2,079 |
550 |
132 |
– |
3 |
20 |
11,285 |
| Total |
32,101 |
39,718 |
444,528 |
348,400 |
43,469 |
102,397 |
2,400 |
1,013,013 |
63,126 |
49,225 |
372,395 |
313,685 |
53,292 |
152,422 |
2,761 |
1,006,906 |
|
|
|
|
|
|
|
|
|
|
|
|
|
|
|
|
|
|
|
|
|
|
|
|
|
|
|
|
|
|
|
|
|
|
|
|
|
|
|
|
|
|
|
|
|
|
|
|
|
|
|
|
|
|
|
Males |
Females |
| Illiterate |
Read and write |
Less than general diploma |
General diploma |
Higher Diploma |
Bachelor or more |
Unknown |
Total males |
Illiterate |
Read and write |
Less than general diploma |
General diploma |
Higher Diploma |
Bachelor or more |
Unknown |
Total females |
| Non-Omanis |
10-14 |
65 |
889 |
19,000 |
1 |
– |
– |
2,372 |
22,327 |
33 |
744 |
18,018 |
– |
– |
– |
2,181 |
20,976 |
| 15-19 |
44 |
922 |
12,501 |
934 |
9 |
1 |
2,158 |
16,569 |
43 |
705 |
11,389 |
1,033 |
17 |
2 |
1,982 |
15,171 |
| 20-24 |
157 |
29,842 |
21,826 |
11,191 |
465 |
1,627 |
4,806 |
69,914 |
145 |
5,372 |
4,312 |
4,411 |
213 |
681 |
2,230 |
17,364 |
| 25-29 |
386 |
82,349 |
83,890 |
41,769 |
2,428 |
7,603 |
4,289 |
222,714 |
264 |
16,356 |
11,208 |
8,521 |
880 |
3,149 |
2,395 |
42,773 |
| 30-34 |
371 |
94,928 |
115,077 |
54,671 |
4,927 |
16,088 |
2,736 |
288,798 |
383 |
21,977 |
16,883 |
12,428 |
2,171 |
6,619 |
1,939 |
62,400 |
| 35-39 |
332 |
80,897 |
97,058 |
48,726 |
5,863 |
21,857 |
1,759 |
256,492 |
400 |
18,904 |
15,422 |
11,665 |
2,687 |
8,091 |
1,351 |
58,520 |
| 40-44 |
232 |
49,833 |
62,274 |
32,342 |
4,817 |
19,361 |
980 |
169,839 |
257 |
13,437 |
11,667 |
8,729 |
2,071 |
6,652 |
938 |
43,751 |
| 45-49 |
156 |
30,159 |
39,029 |
21,476 |
3,782 |
15,584 |
511 |
110,697 |
188 |
8,334 |
8,347 |
5,579 |
1,499 |
4,884 |
665 |
29,496 |
| 50-54 |
109 |
19,285 |
24,952 |
13,330 |
2,864 |
11,713 |
368 |
72,621 |
176 |
4,385 |
4,869 |
3,137 |
814 |
2,865 |
409 |
16,655 |
| 55-59 |
59 |
10,224 |
12,938 |
6,631 |
1,727 |
7,172 |
282 |
39,033 |
152 |
2,455 |
2,843 |
1,777 |
467 |
1,454 |
209 |
9,357 |
| 60-64 |
32 |
4,467 |
5,638 |
3,352 |
942 |
4,123 |
203 |
18,757 |
154 |
1,427 |
1,562 |
944 |
198 |
655 |
142 |
5,082 |
| 65-69 |
39 |
1,523 |
1,798 |
1,215 |
401 |
1,860 |
239 |
7,075 |
130 |
915 |
874 |
547 |
103 |
282 |
84 |
2,935 |
| 70-74 |
35 |
437 |
362 |
328 |
108 |
629 |
235 |
2,134 |
91 |
548 |
445 |
288 |
33 |
88 |
58 |
1,551 |
| 75-79 |
28 |
233 |
156 |
115 |
40 |
179 |
214 |
965 |
66 |
297 |
232 |
135 |
17 |
48 |
40 |
835 |
| 80+ |
26 |
198 |
98 |
77 |
20 |
46 |
349 |
814 |
78 |
249 |
146 |
89 |
16 |
6 |
60 |
644 |
| Total |
2,071 |
406,186 |
496,597 |
236,158 |
28,393 |
107,843 |
21,501 |
1,298,749 |
2,560 |
96,105 |
108,217 |
59,283 |
11,186 |
35,476 |
14,683 |
327,510 |
Source: National Centre for Statistics and Information (NCSI)
ANNEXED NOTE
- Technical Notes and Definitions
Period of reference: 01/01/2022.
Source of the data: data updated from e-census 2020, based on administrative records. Population data: based on vital statistics records (births and deaths) produced by the Ministry of Health (MOH), and the National Registration System (Royal Oman Police).
The civil registration records all Omani and expatriate residents. It is based on the civil status system and is maintained by the General Directorate of Civil Status, a part of the Royal Oman Police.
Since 2004, registration of all vital events taking place in the Sultanate (births, death, marriages and divorces) in the civil register is mandatory for Omanis and foreign residents of the Sultanate.
e-census 2020:
Population data and statistics: methodology explained in publication “Electronic Census System for the E-Census for Population, Residences & Establishments 2020”, especially pp. 15-16; 19-20
https://portal.ecensus.gov.om/ecen-portal/indicators/83/viewer
Portal of e-census 2020 and data updates for December 2021 and 2022:
https://portal.ecensus.gov.om/ecen-portal/
Characteristics of data:
Figures refer to:
- Omanis holding an official valid document registered in the National Registration System, or expired for less than ten years
- Foreign residents holding valid visas, or visas expired for lesss than two years; dependents holding valid visas, providing that they are in the country.
Residence visa for expatriates includes residence visa for a wife of an Omani, student resident, multiple entry visa, employment visa, employment contracting visa, official visit visa, investor visa. The dependent visa includes Family Reunion visas and relative/ friend visit visa.
- Institution which provides data
National Center for Statistics and Information (NCSI)
- Data availability
Data retrieved from e-census portal, datasets building tool:
https://portal.ecensus.gov.om/ecen-portal/indicators/261/viewer
Date of access: 5 June 2023.
GLMM and GRC cannot guarantee that the link to access the source will not change; that the information will not be removed from the website it was obtained from; that no geo-blockages will be imposed; or that the information will not be available for any another reason.
Keywords: Oman, Foreign & National Population, Education
| |
Omanis |
Expatriates |
Total |
| |
Males |
Females |
Total |
Males |
Females |
Total |
Males |
Females |
Total |
| 0-4 |
200,547 |
193,196 |
393,743 |
23,100 |
21,869 |
44,969 |
223,647 |
215,065 |
438,712 |
| 5-9 |
198,948 |
191,507 |
390,455 |
26,797 |
25,304 |
52,101 |
225,745 |
216,811 |
442,556 |
| 10-14 |
151,164 |
146,456 |
297,620 |
22,327 |
20,976 |
43,303 |
173,491 |
167,432 |
340,923 |
| 15-19 |
115,743 |
112,089 |
227,832 |
16,569 |
15,171 |
31,740 |
132,312 |
127,260 |
259,572 |
| 20-24 |
110,010 |
106,638 |
216,648 |
69,914 |
17,364 |
87,278 |
179,924 |
124,002 |
303,926 |
| 25-29 |
122,117 |
118,319 |
240,436 |
222,714 |
42,773 |
265,487 |
344,831 |
161,092 |
505,923 |
| 30-34 |
121,672 |
119,008 |
240,680 |
288,798 |
62,400 |
351,198 |
410,470 |
181,408 |
591,878 |
| 35-39 |
110,982 |
108,922 |
219,904 |
256,492 |
58,520 |
315,012 |
367,474 |
167,442 |
534,916 |
| 40-44 |
84,653 |
84,946 |
169,599 |
169,839 |
43,751 |
213,590 |
254,492 |
128,697 |
383,189 |
| 45-49 |
57,853 |
56,432 |
114,285 |
110,697 |
29,496 |
140,193 |
168,550 |
85,928 |
254,478 |
| 50-54 |
38,105 |
38,162 |
76,267 |
72,621 |
16,655 |
89,276 |
110,726 |
54,817 |
165,543 |
| 55-59 |
30,373 |
31,870 |
62,243 |
39,033 |
9,357 |
48,390 |
69,406 |
41,227 |
110,633 |
| 60-64 |
23,865 |
28,167 |
52,032 |
18,757 |
5,082 |
23,839 |
42,622 |
33,249 |
75,871 |
| 65-69 |
16,225 |
20,658 |
36,883 |
7,075 |
2,935 |
10,010 |
23,300 |
23,593 |
46,893 |
| 70-74 |
12,016 |
14,252 |
26,268 |
2,134 |
1,551 |
3,685 |
14,150 |
15,803 |
29,953 |
| 75-79 |
8,362 |
9,702 |
18,064 |
965 |
835 |
1,800 |
9,327 |
10,537 |
19,864 |
| > 80 |
9,873 |
11,285 |
21,158 |
814 |
644 |
1,458 |
10,687 |
11,929 |
22,616 |
| Total |
1,412,508 |
1,391,609 |
2,804,117 |
1,348,646 |
374,683 |
1,723,329 |
2,761,154 |
1,766,292 |
4,527,446 |
Source: National Centre for Statistics and Information
ANNEXED NOTE
- Technical Notes and Definitions
Period of reference: 31/12.
Source of the data: data updated from e-census 2020; based on vital statistics (births and deaths) produced by the Ministry of Health (MOH), and National Registration System (Royal Oman Police).
The civil registration records all Omani and expatriate residents. It is based on the civil status system and is maintained by the General Directorate of Civil Status, a part of the Royal Oman Police.
Since 2004, registration of all vital events taking place in the Sultanate (births, death, marriages and divorces) in the civil register is mandatory for Omanis and foreign residents of the Sultanate.
E-census 2020:
Structure of population files in publication “Electronic Census System for the E-Census for Population, Residences & Establishments 2020”, pp. 15-17
https://portal.ecensus.gov.om/ecen-portal/indicators/83/viewer
Characteristics of data:
Figures refer to:
- Omanis holding an official valid document registered in the National Registration System, or expired for less than ten years
- Foreign residents holding valid visas, or visas expired for lesss than two years; dependents holding valid visas, providing that they are in the country.
Residence visa for expatriates includes residence visa for a wife of an Omani, student resident, multiple entry visa, employment visa, employment contracting visa, official visit visa, investor visa. The dependent visa includes Family Reunion visas and relative/ friend visit visa.
- Institution which provides data
National Center for Statistics and Information (NCSI)
- Data availability
Uploaded from NCSI Oman Data portal (annual data):
https://data.gov.om/OMPOP2016/population
2021 data last available data from this source, as of date of access.
Data also available on e-census portal:
https://portal.ecensus.gov.om/ecen-portal/indicators/261/viewer
Date of access: 5 June 2023.
GLMM and GRC cannot guarantee that the link to access the source will not change; that the information will not be removed from the website it was obtained from; that no geo-blockages will be imposed; or that the information will not be available for any another reason.
Keywords: Oman, Foreign & National Population
| |
Omanis |
Expatriates |
Total |
| |
Males |
Females |
Total |
Males |
Females |
Total |
Males |
Females |
Total |
| 0-4 |
203,080 |
196,027 |
399,107 |
22,505 |
21,547 |
44,052 |
225,585 |
217,574 |
443,159 |
| 5-9 |
188,560 |
181,388 |
369,948 |
25,848 |
24,535 |
50,383 |
214,408 |
205,923 |
420,331 |
| 10-14 |
142,688 |
137,848 |
280,536 |
21,561 |
20,421 |
41,982 |
164,249 |
158,269 |
322,518 |
| 15-19 |
112,709 |
109,395 |
222,104 |
15,941 |
14,410 |
30,351 |
128,650 |
123,805 |
252,455 |
| 20-24 |
111,073 |
107,312 |
218,385 |
67,026 |
19,526 |
86,552 |
178,099 |
126,838 |
304,937 |
| 25-29 |
124,210 |
120,738 |
244,948 |
240,269 |
47,167 |
287,436 |
364,479 |
167,905 |
532,384 |
| 30-34 |
121,283 |
118,601 |
239,884 |
305,388 |
66,401 |
371,789 |
426,671 |
185,002 |
611,673 |
| 35-39 |
105,708 |
103,872 |
209,580 |
249,314 |
56,124 |
305,438 |
355,022 |
159,996 |
515,018 |
| 40-44 |
79,557 |
79,877 |
159,434 |
165,512 |
42,723 |
208,235 |
245,069 |
122,600 |
367,669 |
| 45-49 |
53,101 |
51,074 |
104,175 |
109,691 |
27,792 |
137,483 |
162,792 |
78,866 |
241,658 |
| 50-54 |
35,738 |
36,000 |
71,738 |
71,871 |
16,247 |
88,118 |
107,609 |
52,247 |
159,856 |
| 55-59 |
29,350 |
30,977 |
60,327 |
38,229 |
9,013 |
47,242 |
67,579 |
39,990 |
107,569 |
| 60-64 |
23,118 |
27,560 |
50,678 |
20,781 |
4,845 |
25,626 |
43,899 |
32,405 |
76,304 |
| 65-69 |
15,261 |
19,267 |
34,528 |
6,287 |
2,523 |
8,810 |
21,548 |
21,790 |
43,338 |
| 70-74 |
12,151 |
14,074 |
26,225 |
1,966 |
1,450 |
3,416 |
14,117 |
15,524 |
29,641 |
| 75-79 |
8,637 |
9,718 |
18,355 |
777 |
709 |
1,486 |
9,414 |
10,427 |
19,841 |
| > 80 |
10,067 |
11,437 |
21,504 |
697 |
596 |
1,293 |
10,764 |
12,033 |
22,797 |
| Total |
1,376,291 |
1,355,165 |
2,731,456 |
1,363,663 |
376,029 |
1,739,692 |
2,739,954 |
1,731,194 |
4,471,148 |
Source: National Centre for Statistics and Information
ANNEXED NOTE
- Technical Notes and Definitions
Period of reference: 12/12/2020.
Source of the data: e-census 2020; based on vital statistics (births and deaths) produced by the Ministry of Health (MOH), and National Registration System (Royal Oman Police).
The civil registration records all Omani and expatriate residents. It is based on the civil status system and is maintained by the General Directorate of Civil Status, a part of the Royal Oman Police.
Since 2004, registration of all vital events taking place in the Sultanate (births, death, marriages and divorces) in the civil register is mandatory for Omanis and foreign residents of the Sultanate.
E-census 2020:
Structure of population data: in publication “Electronic Census System for the E-Census for Population, Residences & Establishments 2020”, pp. 15-17
https://portal.ecensus.gov.om/ecen-portal/indicators/83/viewer
Characteristics of data:
Figures refer to:
- Omanis holding an official valid document registered in the National Registration System, or expired for less than ten years
- Foreign residents holding valid visas, or visas expired for less than two years; dependents holding valid visas, providing that they are in the country.
Residence visa for expatriates includes residence visa for a wife of an Omani, student resident, multiple entry visa, employment visa, employment contracting visa, official visit visa, investor visa. The dependent visa includes Family Reunion visas and relative/ friend visit visa.
- Institution which provides data
National Center for Statistics and Information (NCSI)
- Data availability
Data available on e-census portal:
https://portal.ecensus.gov.om/ecen-portal/indicators/261/viewer
Date of access: 5 June 2023.
GLMM and GRC cannot guarantee that the link to access the source will not change; that the information will not be removed from the website it was obtained from; that no geo-blockages will be imposed; or that the information will not be available for any another reason.
Keywords: Oman, Foreign & National Population
| |
Omanis |
Expatriates |
Total |
| |
Males |
Females |
Total |
Males |
Females |
Total |
Males |
Females |
Total |
| 2000 |
|
|
1,777,685 |
|
|
623,571 |
|
|
2,401,256 |
| 2001 |
928,747 |
897,377 |
1,826,124 |
522,294 |
129,269 |
651,563 |
1,451,041 |
1,026,646 |
2,477,687 |
| 2002 |
950,666 |
918,914 |
1,869,580 |
492,650 |
175,512 |
668,162 |
1,443,316 |
1,094,426 |
2,537,742 |
| 2003* |
900,540 |
881,018 |
1,781,558 |
412,699 |
146,558 |
559,257 |
1,313,239 |
1,027,576 |
2,340,815 |
| 2004 |
911,135 |
891,796 |
1,802,931 |
449,756 |
162,889 |
612,645 |
1,360,891 |
1,054,685 |
2,415,576 |
| 2005 |
931,007 |
911,677 |
1,842,684 |
527,838 |
138,315 |
666,153 |
1,458,845 |
1,049,992 |
2,508,837 |
| 2006 |
951,440 |
932,136 |
1,883,576 |
546,703 |
146,783 |
693,486 |
1,498,143 |
1,078,919 |
2,577,062 |
| 2007 |
970,489 |
952,208 |
1,922,697 |
651,630 |
169,172 |
820,802 |
1,622,119 |
1,121,380 |
2,743,499 |
| 2008 |
994,120 |
973,060 |
1,967,180 |
693,294 |
206,954 |
900,248 |
1,687,414 |
1,180,014 |
2,867,428 |
| 2009 |
1,019,322 |
998,237 |
2,017,559 |
951,793 |
204,565 |
1,156,358 |
1,971,115 |
1,202,802 |
3,173,917 |
| 2010* |
990,590 |
966,746 |
1,957,336 |
621,818 |
194,325 |
816,143 |
1,612,408 |
1,161,071 |
2,773,479 |
| 2011 |
1,024,923 |
988,235 |
2,013,158 |
1,065,960 |
216,180 |
1,530,437 |
2,090,883 |
1,204,415 |
3,295,298 |
| 2012 |
1,062,918 |
1,029,642 |
2,092,560 |
1,269,769 |
260,672 |
1,530,437 |
1,699,894 |
1,290,314 |
3,622,997 |
| 2013 |
1,100,614 |
1,071,388 |
2,172,002 |
1,401,621 |
281,583 |
1,683,204 |
2,502,235 |
1,352,971 |
3,855,206 |
| 2014 |
1,143,579 |
1,117,126 |
2,260,705 |
1,436,232 |
295,956 |
1,732,188 |
2,579,811 |
1,413,082 |
3,992,893 |
| 2015 |
1,184,430 |
1,160,516 |
2,344,646 |
1,500,414 |
313,742 |
1,814,156 |
2,684,844 |
1,474,258 |
4,159,102 |
| 2016 |
1,225,390 |
1,202,435 |
2,427,825 |
1,660,693 |
325,533 |
1,986,226 |
2,886,083 |
1,527,968 |
4,414,051 |
| 2017 |
1,263,764 |
1,241,605 |
2,505,369 |
1,720,640 |
333,954 |
2,054,594 |
2,984,404 |
1,575,559 |
4,559,963 |
| 2018 |
1,299,741 |
1,279,495 |
2,579,236 |
1,690,362 |
332,108 |
2,022,470 |
2,990,103 |
1,611,603 |
4,601,706 |
| 2019 |
1,337,021 |
1,318,123 |
2,655,144 |
1,608,233 |
354,550 |
1,962,783 |
2,945,254 |
1,672,673 |
4,617,927 |
| 2020* |
1,378,561 |
1,357,405 |
2,735,966 |
1,366,662 |
378,414 |
1,745,076 |
2,745,223 |
1,735,819 |
4,481,042 |
| 2021* |
1,412,508 |
1,391,609 |
2,804,117 |
1,348,646 |
374,683 |
1,723,329 |
2,761,154 |
1,766,292 |
4,527,446 |
Source: National Centre for Statistics and Information
ANNEXED NOTE
- Technical Notes and Definitions
Period of reference: mid-year, except census years 2003* and 2010*: end of year.
2020*-2021*: 31/12.
Source of the data: censuses; vital statistics (births and deaths) produced by the Ministry of Health (MOH), and data provided by the Royal Oman Police (ROP) on Omani and non-Omani residents.
1- Censuses held in 1993; 2003, 2010, and 2020.
Censuses’ reference dates: 1993: n.a.; 2003: 7-8 December; 2010: 12-13 December; 2020: 12 December 2020.
2- National Registration System (2011- )
The civil registration records all Omani and expatriate residents. It is based on the civil status system and is maintained by the General Directorate of Civil Status, a part of the Royal Oman Police.
Since 2004, registration of all vital events taking place in the Sultanate (births, death, marriages and divorces) in the civil register is mandatory for Omanis and foreign residents of the Sultanate.
Characteristics of data:
Figures refer to:
- Omanis holding an official valid document registered in the National Registration System, or expired for less than ten years
- Foreign residents holding valid visas, or visas expired for less than two years; dependents holding valid visas, providing that they are in the country.
Residence visa for expatriates includes residence visa for a wife of an Omani, student resident, multiple entry visa, employment visa, employment contracting visa, official visit visa, investor visa. The dependent visa includes Family Reunion visas and relative/ friend visit visa.
- Institution which provides data
National Center for Statistics and Information (NCSI)
- Data availability
Figures for 2000 to 2021 were uploaded from NCSI Oman Data portal (annual data):
https://data.gov.om/OMPOP2016/population
No monthly data disaggregated by sex. 2021 data last available data as of date of access.
Date of access: 5 June 2023.
GLMM and GRC cannot guarantee that the link to access the source will not change; that the information will not be removed from the website it was obtained from; that no geo-blockages will be imposed; or that the information will not be available for any another reason.
Keywords: Oman, Foreign & National Population
| |
Omanis |
Expatriates |
Total |
| 2000 |
1,777,685 |
623,571 |
2,401,256 |
| 2001 |
1,826,124 |
651,563 |
2,477,687 |
| 2002 |
1,869,580 |
668,162 |
2,537,742 |
| 2003* |
1,781,558 |
559,257 |
2,340,815 |
| 2004 |
1,802,931 |
612,645 |
2,415,576 |
| 2005 |
1,842,684 |
666,153 |
2,508,837 |
| 2006 |
1,883,576 |
693,486 |
2,577,062 |
| 2007 |
1,922,697 |
820,802 |
2,743,499 |
| 2008 |
1,967,180 |
900,248 |
2,867,428 |
| 2009 |
2,017,559 |
1,156,358 |
3,173,917 |
| 2010* |
1,957,336 |
816,143 |
2,773,479 |
| 2011 |
2,013,158 |
1,282,140 |
3,295,298 |
| 2012 |
2,092,560 |
1,530,441 |
3,623,001 |
| 2013 |
2,172,002 |
1,683,204 |
3,855,206 |
| 2014 |
2,260,705 |
1,732,188 |
3,992,893 |
| 2015 |
2,344,646 |
1,814,456 |
4,159,102 |
| 2016 |
2,427,825 |
1,986,226 |
4,414,051 |
| 2017 |
2,505,369 |
2,054,594 |
4,559,963 |
| 2018 |
2,579,236 |
2,022,470 |
4,601,706 |
| 2019 |
2,655,453 |
1,962,815 |
4,618,268 |
| 2020* |
2,735,966 |
1,745,076 |
4,481,042 |
| 2021* |
2,804,117 |
1,723,329 |
4,527,446 |
| 2022 |
2,833,715 |
1,894,657 |
4,728,372 |
| 2023 |
2,891,988 |
2,168,238 |
4,527,446 |
Source: National Centre for Statistics and Information
ANNEXED NOTE
- Technical Notes and Definitions
Period of reference: mid-year, except census years 2003* and 2010*: end of year.
2020*; 2021*: 31/12; 2023: 4 June.
Source of the data: censuses; vital statistics (births and deaths) produced by the Ministry of Health (MOH), and data provided by the Royal Oman Police (ROP) on Omani and non-Omani residents.
1- Censuses were held in 1993; 2003, 2010, and 2020.
Censuses’ reference dates: 1993: n.a.; 2003: 7-8 December; 2010: 12-13 December; 2020: 12 December 2020.
2- National Registration System (2011- )
The civil registration records all Omani and expatriate residents. It is based on the civil status system and is maintained by the General Directorate of Civil Status, a part of the Royal Oman Police.
Since 2004, registration of all vital events taking place in the Sultanate (births, death, marriages and divorces) in the civil register is mandatory for Omanis and foreign residents of the Sultanate.
Characteristics of data:
Figures refer to:
- Omanis holding an official valid document registered in the National Registration System, or expired for less than ten years;
- Foreign residents holding valid visas, or visas expired for lesss than two years; dependents holding valid visas, providing that they are in the country.
Residence visa for expatriates includes residence visa for a wife of an Omani, student resident, multiple entry visa, employment visa, employment contracting visa, official visit visa, investor visa. The dependent visa includes Family Reunion visas and relative/ friend visit visa.
- Institution which provides data
National Center for Statistics and Information (NCSI)
- Data availability
Figures for 2000 to 2022 were uploaded from NCSI Oman Data portal (annual and monthly data):
https://data.gov.om/OMPOP2016/population
Figures for 4 June 2023: NCSI’s homepage, population clock:
https://www.ncsi.gov.om/Pages/NCSI.aspx
Date of access: 5 June 2023.
GLMM and GRC cannot guarantee that the link to access the source will not change; that the information will not be removed from the website it was obtained from; that no geo-blockages will be imposed; or that the information will not be available for any another reason.
Keywords: Oman, Foreign & National Population
| |
Omanis |
Expatriates |
Total |
| Agriculture, forestry & fishing |
1,593 |
82,717 |
84,310 |
| Mining & quarrying |
29,618 |
12,856 |
42,474 |
| Manufacturing |
33,669 |
171,296 |
204,965 |
| Electricity, gas, steam and air conditioning supply |
2,784 |
968 |
3,752 |
| Water supply, sewerage, waste management and remediation activities |
1,517 |
5 |
1,522 |
| Construction |
52,897 |
353,584 |
406,481 |
| Wholesale & Retail Trade; Repair of motor vehicles & motorcycles |
40,575 |
206,868 |
247,443 |
| Transport, Storage |
21,669 |
62,310 |
83,979 |
| Accommodation and food service activities |
10,070 |
103,471 |
113,541 |
| Information and communications |
5,357 |
7,926 |
13,283 |
| Financial and insurance activities |
18,865 |
2,771 |
21,636 |
| Real estate activities |
1,645 |
10,076 |
11,721 |
| Professional, scientific and technical activities |
11,421 |
19,446 |
30,867 |
| Administrative and support services activities |
21,587 |
67,125 |
88,712 |
| Education |
7,821 |
12,826 |
20,647 |
| Human health and social work activities |
3,924 |
11,793 |
15,717 |
| Arts, entertainment and recreation |
588 |
3,069 |
3,657 |
| Other service activities |
1,190 |
53,911 |
55,101 |
| Activities of households as employers; undifferentiated goods- and services-producing activities of households for own use |
0 |
182,600 |
182,600 |
| Activities of extraterritorial organizations and bodies |
9 |
864 |
873 |
| Total |
266,799 |
1,371,477 |
1,638,276 |
Source: NCSI. Monthly Statistical Bulletin
ANNEXED NOTE
- Technical Notes and Definitions
Period of reference: end of year.
Data refer to:
- the Omani population employed in the private sector (insured labourers)
Source : Public Authority for Social Insurance (PASI), Petroleum Development Oman (PDO)
- expatriates employed in the private and domestic sectors (agregated figures).
Source: Royal Oman Police (ROP)
Classification of economic activities: ISIC Rev.4 (2008).
- Institution which provides data
National Center for Statistics and Information (NCSI)
- Data availability
The data is available in NCSI’s Monthly Statistical Bulletins (January of the year following the reference year).
https://www.ncsi.gov.om/Elibrary/Pages/LibraryContentView.aspx
Last date of access: December 2022.
GLMM and GRC cannot guarantee that the link to access the source will not change; that the information will not be removed from the website it was obtained from; that no geo-blockages will be imposed; or that the information will not be available for any another reason.
Keywords: Oman, National Labour, Foreign Labour, Employment
| |
2013 |
2014 |
2015 |
2016 |
2017 |
2018 |
2019 |
2020 |
2021 |
2022 |
| Egypt |
22,941 |
23,325 |
24,532 |
25,985 |
28,510 |
31,725 |
35,048 |
30,961 |
30,998 |
37,832 |
| Sudan |
|
|
|
|
|
|
|
|
7,771 |
|
| Yemen |
|
|
|
|
|
|
|
|
|
11,417 |
| Bangladesh |
501,357 |
540,481 |
590,170 |
698,881 |
692,164 |
658,222 |
630,681 |
553,963 |
531,053 |
654,529 |
| India |
599,473 |
603,473 |
669,882 |
689,600 |
688,226 |
660,736 |
617,730 |
492,303 |
471,178 |
529,884 |
| Pakistan |
223,984 |
214,333 |
220,112 |
232,426 |
234,163 |
217,602 |
207,288 |
180,629 |
194,048 |
261,300 |
| Philippines |
28,958 |
31,287 |
34,511 |
40,976 |
45,063 |
47,896 |
49,456 |
44,097 |
45,388 |
48,030 |
| Sri Lanka |
12,344 |
13,481 |
15,752 |
19,210 |
20,640 |
20,925 |
23,099 |
20,717 |
19,129 |
26,232 |
| Nepal |
12,842 |
12,808 |
13,292 |
15,308 |
17,194 |
17,057 |
16,571 |
14,025 |
16,800 |
20,623 |
| Indonesia |
29,759 |
37,619 |
32,535 |
19,216 |
|
|
|
|
|
|
| Ethiopia |
43,873 |
34,000 |
24,009 |
16,673 |
|
|
|
|
|
|
| Tanzania |
|
|
|
|
11,709 |
13,818 |
14,742 |
13,555 |
12,224 |
11,526 |
| Uganda |
|
|
|
|
24,449 |
31,288 |
20,997 |
11,098 |
|
|
| Other countries |
51,710 |
59,325 |
72,876 |
89,900 |
92,762 |
88,178 |
97,186 |
81,780 |
80,884 |
105,935 |
| Total |
1,527,241 |
1,570,132 |
1,697,671 |
1,848,175 |
1,854,880 |
1,787,447 |
1,712,798 |
1,443,128 |
1,409,473 |
1,707,308 |
Source: NCSI, Monthly Statistical Bulletin
ANNEXED NOTE
- Technical Notes and Definitions
Period of reference: December of the given year.
Data refer to the foreign population employed in all sectors (governmental, private and domestic sectors).
Independent, own-account workers are classified in the domestic sector.
The top-9 most numerous nationalities are listed every year.
Original source of the data: Royal Oman Police (ROP) records.
- Institution which provides data
National Center for Statistics and Information (NCSI)
- Data availability
The data is available in NCSI’s Monthly Statistical Bulletins (January of the year following the reference year).
https://www.ncsi.gov.om/Elibrary/Pages/LibraryContentView.aspx
Last date of access: May 2023.
GLMM and GRC cannot guarantee that the link to access the source will not change; that the information will not be removed from the website it was obtained from; that no geo-blockages will be imposed; or that the information will not be available for any another reason.
Keywords: Oman, Foreign Labour, Employment, Female Employment, India, Indonesia, Bangladesh, Pakistan, Ethiopia, Uganda, Tanzania, Philippines, Egypt, Nepal, Sri Lanka, Sudan, Yemen
| |
Omanis |
Expatriates |
Total |
| |
Males |
Females |
Total |
Males |
Females |
Total |
Males |
Females |
Total |
| 0-4 |
193,274 |
186,880 |
380,154 |
26,794 |
25,299 |
52,093 |
220,068 |
212,179 |
438,712 |
| 5-9 |
206,328 |
198,430 |
404,758 |
29,798 |
28,203 |
58,001 |
236,126 |
226,633 |
442,556 |
| 10-14 |
160,564 |
155,283 |
315,847 |
24,832 |
22,989 |
47,821 |
185,396 |
178,272 |
340,923 |
| 15-19 |
119,639 |
115,721 |
235,360 |
18,522 |
17,083 |
35,605 |
138,161 |
132,804 |
259,572 |
| 20-24 |
109,977 |
106,857 |
216,834 |
126,549 |
29,487 |
156,036 |
236,526 |
136,344 |
303,926 |
| 25-29 |
118,346 |
114,605 |
232,951 |
257,767 |
52,192 |
309,959 |
376,113 |
166,797 |
505,923 |
| 30-34 |
123,194 |
120,194 |
243,388 |
323,870 |
71,543 |
395,413 |
447,064 |
191,737 |
591,878 |
| 35-39 |
113,859 |
111,876 |
225,735 |
306,440 |
69,943 |
376,383 |
420,299 |
181,819 |
534,916 |
| 40-44 |
88,914 |
88,146 |
177,060 |
213,005 |
52,093 |
265,098 |
301,919 |
140,239 |
383,189 |
| 45-49 |
61,730 |
62,002 |
123,732 |
128,647 |
34,166 |
162,813 |
190,377 |
96,168 |
254,478 |
| 50-54 |
41,472 |
40,116 |
81,588 |
84,102 |
19,789 |
103,891 |
125,574 |
59,905 |
165,543 |
| 55-59 |
30,926 |
32,814 |
63,740 |
44,499 |
10,925 |
55,424 |
75,425 |
43,739 |
110,633 |
| 60-64 |
25,873 |
29,792 |
55,665 |
20,141 |
6,205 |
26,346 |
46,014 |
35,997 |
75,871 |
| 65-69 |
17,417 |
22,462 |
39,879 |
8,908 |
3,628 |
12,536 |
26,325 |
26,090 |
46,893 |
| 70-74 |
12,748 |
15,712 |
28,460 |
2,774 |
2,094 |
4,868 |
15,522 |
17,806 |
29,953 |
| 75-79 |
8,719 |
10,168 |
18,887 |
1186 |
1028 |
2,214 |
9,905 |
11,196 |
19,864 |
| > 80 |
10,866 |
12,707 |
23,573 |
952 |
786 |
1,738 |
11,818 |
13,493 |
22,616 |
| Total |
1,443,846 |
1,423,765 |
2,867,611 |
1,618,786 |
447,453 |
2,066,239 |
3,062,632 |
1,871,218 |
4,933,850 |
Source: National Centre for Statistics and Information
ANNEXED NOTE
- Technical Notes and Definitions
Period of reference: 31/12.
Source of the data: data updated from e-census 2020; based on vital statistics (births and deaths) produced by the Ministry of Health (MOH), and National Registration System (Royal Oman Police).
The civil registration records all Omani and expatriate residents. It is based on the civil status system and is maintained by the General Directorate of Civil Status, a part of the Royal Oman Police.
Since 2004, registration of all vital events taking place in the Sultanate (births, death, marriages and divorces) in the civil register is mandatory for Omanis and foreign residents of the Sultanate.
E-census 2020:
Structure of population data: in publication “Electronic Census System for the E-Census for Population, Residences & Establishments 2020”, pp. 15-17
https://portal.ecensus.gov.om/ecen-portal/indicators/83/viewer
Characteristics of data:
Figures refer to:
- Omanis holding an official valid document registered in the National Registration System, or expired for less than ten years
- Foreign residents holding valid visas, or visas expired for lesss than two years; dependents holding valid visas, providing that they are in the country.
Residence visa for expatriates includes residence visa for a wife of an Omani, student resident, multiple entry visa, employment visa, employment contracting visa, official visit visa, investor visa. The dependent visa includes Family Reunion visas and relative/ friend visit visa.
- Institution which provides data
National Center for Statistics and Information (NCSI)
- Data availability
Data available on e-census portal:
https://portal.ecensus.gov.om/ecen-portal/indicators/261/viewer
Date of access: 5 June 2023.
GLMM and GRC cannot guarantee that the link to access the source will not change; that the information will not be removed from the website it was obtained from; that no geo-blockages will be imposed; or that the information will not be available for any another reason.
Keywords: Oman, Foreign & National Population
|
2011 |
2012 |
2013 |
2014 |
2015 |
2016 |
2017 |
2018 |
2019 |
2020 |
2021 |
2022 |
| Section (14) Temporary residence |
140,008 |
112,907 |
81,811 |
119,868 |
127,938 |
21,714 |
26,109 |
29,771 |
29,910 |
12,078 |
19,158 |
33,315 |
| Section (17) Employment government sector |
1,170 |
560 |
458 |
534 |
970 |
1,016 |
819 |
1,136 |
1,488 |
1,110 |
2,561 |
1,270 |
| Section (18) Employment private sector |
67,774 |
69,289 |
58,114 |
57,769 |
54,840 |
16,184 |
16,332 |
20,650 |
20,072 |
3,391 |
1,323 |
22,258 |
| Section (19) Freelancing |
33 |
29 |
14 |
29 |
21 |
9 |
15 |
37 |
22 |
7 |
16 |
12 |
| Section (20) Employment domestic sector |
26,775 |
25,474 |
24,393 |
24,439 |
24,873 |
16,625 |
15,942 |
26,341 |
25,665 |
5,994 |
8,156 |
42,820 |
| Section (22) Family reunion |
8,758 |
9,215 |
15,122 |
9,668 |
11,563 |
14,092 |
16,946 |
18,718 |
17,705 |
7,815 |
12,414 |
23,416 |
| Section (23) Studying |
32 |
30 |
9 |
9 |
16 |
81 |
28 |
23 |
33 |
24 |
9 |
49 |
| Section (24) Self-sponsorship |
136 |
143 |
133 |
108 |
95 |
246 |
310 |
253 |
236 |
169 |
232 |
219 |
| Total |
244,686 |
217,647 |
180,054 |
212,424 |
220,316 |
69,967 |
76,501 |
96,929 |
95,131 |
30,588 |
43,869 |
123,359 |
Source: Central Statistical Bureau, Migration Statistics Bulletin, given years.
ANNEXED NOTE
- Definitions
Processing by CSB of Ministry of Interior’s (Directorate of Migration’s) annual records of residency permits granted to foreign residents by type/ purpose of permit, sex and regional origin of holder.
The present figures include permits delivered for all purposes of stay in Kuwait:
1- Labour in all sectors: governmental (n°17); private sector (n°18); business (n°19) and domestic (n°20) sectors
2- Residence: temporary residence (n°14); as family dependent (permit n°22); for the purpose of studying (n°23) and for self-sponsorship (n°24).
Residency procedures do not apply to GCC nationals and to Bidouns (stateless residents of Kuwait).
The table thus excludes the Bidouns, the non-Kuwaiti GCC citizens and those in irregular situation.
- Institution which provides data
Migration Department, Ministry of Interior (MoI) and Central Statistical Bureau (CSB), Ministry of Planning.
- Period of data coverage
December 31st, given years.
- Data availability
The present data is taken from the “Migration Statistics” reports, published annually by the CSB.
The report (in Arabic and English, PDF format with Excel tables) is available on CSB’s website (Population Statistics, then Migration Statistics)
https://www.csb.gov.kw/Pages/Statistics_en?ID=56&ParentCatID=1
https://www.csb.gov.kw/Pages/Statistics?ID=56&ParentCatID=1
Date of access: May 2023
GLMM and GRC cannot guarantee that the link to access the source will not change; that the information will not be removed from the website it was obtained from; that no geo-blockages will be imposed; or that the information will not be available for any another reason.
Keywords: Kuwait, Foreign Population, Employment, Legal Document, Residence Conditions
|
2011 |
2012 |
2013 |
2014 |
2015 |
2016 |
2017 |
2018 |
2019 |
2020 |
2021 |
2022 |
| Arab countries |
51,135 |
51,526 |
49,936 |
44,376 |
43,118 |
25,419 |
30,732 |
33,503 |
30,115 |
11,217 |
15,925 |
36,441 |
| Non‐Arab Asian countries |
174,289 |
149,163 |
117,996 |
152,609 |
160,576 |
41,863 |
43,153 |
60,347 |
62,051 |
17,650 |
25,071 |
82,997 |
| Non‐Arab African countries |
9,980 |
9,027 |
6,640 |
11,235 |
12,765 |
706 |
695 |
944 |
733 |
423 |
701 |
957 |
| Europe |
2,121 |
1,914 |
1,503 |
1,315 |
1,110 |
605 |
624 |
711 |
733 |
496 |
852 |
1,099 |
| North America |
6,769 |
5,663 |
3,622 |
2,632 |
2,568 |
1,238 |
1,152 |
1,270 |
1,326 |
698 |
1,120 |
1,575 |
| South and Central America |
215 |
198 |
212 |
117 |
80 |
73 |
89 |
96 |
116 |
63 |
125 |
221 |
| Australia and Pacific |
175 |
155 |
145 |
139 |
98 |
62 |
56 |
57 |
57 |
41 |
74 |
69 |
| Other |
2 |
1 |
0 |
1 |
1 |
1 |
0 |
1 |
0 |
0 |
1 |
0 |
| Total |
244,686 |
217,647 |
180,054 |
212,424 |
220,316 |
69,967 |
76,501 |
96,929 |
95,131 |
30,588 |
43,869 |
123,359 |
Source: Central Statistical Bureau, Migration Statistics Bulletin, given years.
ANNEXED NOTE
- Definitions
Processing by CSB of Ministry of Interior’s (Directorate of Migration’s) annual records of residency permits granted to foreign residents by type/ purpose of permit, sex and regional origin of holder.
The present figures include permits delivered for all purposes of stay in Kuwait:
1- Labour in all sectors: governmental (n°17); private sector (n°18); business (n°19) and domestic (n°20) sectors
2- Residence: temporary residence (n°14); as family dependent (permit n°22); for the purpose of studying (n°23) and for self-sponsorship (n°24).
Residency procedures do not apply to GCC nationals and to Bidouns (stateless residents of Kuwait).
The table thus excludes the Bidouns, the non-Kuwaiti GCC citizens and those in irregular situation.
- Institution which provides data
Migration Department, Ministry of Interior (MoI) and Central Statistical Bureau (CSB), Ministry of Planning.
- Period of data coverage
December 31st, given years.
- Data availability
The present data is taken from the “Migration Statistics” reports, published annually by the CSB.
The report (in Arabic and English, PDF format with Excel tables) is available on CSB’s website (Population Statistics, then Migration Statistics)
https://www.csb.gov.kw/Pages/Statistics_en?ID=56&ParentCatID=1
https://www.csb.gov.kw/Pages/Statistics?ID=56&ParentCatID=1
Date of access: May 2023
GLMM and GRC cannot guarantee that the link to access the source will not change; that the information will not be removed from the website it was obtained from; that no geo-blockages will be imposed; or that the information will not be available for any another reason.
Keywords: Kuwait, Foreign Population, Employment, Legal Document, Residence Conditions, Asia, Africa, Europe, North America, South America, Oceania
|
2015 |
2016 |
2017 |
2018 |
2019 |
2020 |
2021 |
2022 |
| Section (14) Temporary residence |
15,725 |
18,827 |
21,693 |
18,978 |
23,449 |
36,837 |
32,032 |
30,417 |
| Section (17) Employment government sector |
931 |
1,016 |
1,048 |
1,062 |
1,143 |
1,176 |
1,370 |
687 |
| Section (18) Employment private sector |
27,996 |
29,898 |
29,486 |
26,664 |
29,822 |
28,698 |
35,604 |
29,720 |
| Section (19) Freelancing |
44 |
45 |
46 |
50 |
52 |
51 |
59 |
20 |
| Section (20) Employment domestic sector |
59,953 |
60,632 |
59,133 |
46,833 |
56,100 |
58,239 |
73,612 |
65,961 |
| Section (22) Family reunion |
6,735 |
6,679 |
6,790 |
6,576 |
6,808 |
5,783 |
8,452 |
6,369 |
| Section (23) Studying |
9 |
5 |
8 |
6 |
7 |
6 |
76 |
8 |
| Section (24) Self-sponsorship |
334 |
359 |
372 |
392 |
427 |
431 |
482 |
258 |
| Total |
111,727 |
117,461 |
118,576 |
100,561 |
117,808 |
131,221 |
151,687 |
133,440 |
Source: Central Statistical Bureau, Migration Statistics Bulletin, given years.
ANNEXED NOTE
- Definitions
These are stock data.
The figures refer to the cumulated numbers of foreign residents contravening the law on residency, present in Kuwait since the year 1992 until the 31st of December of each year.
CSB reprocessed data from Ministry of Interior’s (Directorate of Migration’s) annual records of residency permits granted to foreign residents by type/ purpose of permit,
sex and regional origin of holder.
The present figures include permits delivered for all purposes of stay in Kuwait:
1- Labour in all sectors: governmental (n°17); private sector (n°18); business (n°19) and domestic (n°20) sectors
2- Residence: temporary residence (n°14); as family dependent (permit n°22); for the purpose of studying (n°23) and for self-sponsorship (n°24).
Residency procedures do not apply to GCC nationals and to Bidouns (stateless residents of Kuwait).
The table thus excludes the Bidouns, the non-Kuwaiti GCC citizens and those in irregular situation.
- Institution which provides data
Migration Department, Ministry of Interior (MoI) and Central Statistical Bureau (CSB), Ministry of Planning.
- Period of data coverage
December 31st, given years.
- Data availability
The present data is taken from the “Migration Statistics” reports, published annually by the CSB.
The report (in Arabic and English, PDF format with Excel tables) is available on CSB’s website (Population Statistics, then Migration Statistics)
https://www.csb.gov.kw/Pages/Statistics_en?ID=56&ParentCatID=1
https://www.csb.gov.kw/Pages/Statistics?ID=56&ParentCatID=1
Date of access: May 2023
GLMM and GRC cannot guarantee that the link to access the source will not change; that the information will not be removed from the website it was obtained from; that no geo-blockages will be imposed; or that the information will not be available for any another reason.
Keywords: Kuwait, Irregular Migration, Legal Document, Residence Conditions
| |
2015 |
2016 |
2017 |
2018 |
2019 |
2020 |
2021 |
2022 |
| Arab countries |
16,205 |
18,823 |
18,370 |
17,360 |
20,220 |
20,919 |
24,757 |
19,385 |
| Non‐Arab Asian countries |
80,353 |
83,956 |
85,601 |
68,203 |
79,166 |
89,178 |
103,167 |
93,397 |
| Non‐Arab African countries |
14,073 |
13,568 |
13,462 |
13,777 |
17,170 |
19,433 |
21,990 |
19,131 |
| Europe |
300 |
319 |
333 |
393 |
409 |
556 |
591 |
514 |
| North America |
637 |
635 |
654 |
660 |
684 |
930 |
976 |
816 |
| South and Central America |
102 |
105 |
98 |
115 |
116 |
141 |
150 |
151 |
| Australia and Pacific |
50 |
46 |
51 |
46 |
36 |
58 |
49 |
39 |
| Other |
7 |
9 |
7 |
7 |
7 |
6 |
7 |
7 |
| Total |
111,727 |
117,461 |
118,576 |
100,561 |
117,808 |
131,221 |
151,687 |
133,440 |
Source: Central Statistical Bureau, Migration Statistics Bulletin, given years.
ANNEXED NOTE
- Definitions
These are stock data.
The figures refer to the cumulated numbers of foreign residents contravening the law on residency, present in Kuwait since the year 1992 until the 31st of December of each year.
CSB reprocessed data from Ministry of Interior’s (Directorate of Migration’s) annual records of residency permits granted to foreign residents by type/ purpose of permit,
sex and regional origin of holder.
The present figures include permits delivered for all purposes of stay in Kuwait:
1- Labour in all sectors: governmental (n°17); private sector (n°18); business (n°19) and domestic (n°20) sectors
2- Residence: temporary residence (n°14); as family dependent (permit n°22); for the purpose of studying (n°23) and for self-sponsorship (n°24).
Residency procedures do not apply to GCC nationals and to Bidouns (stateless residents of Kuwait).
The table thus excludes the Bidouns, the non-Kuwaiti GCC citizens and those in irregular situation.
- Institution which provides data
Migration Department, Ministry of Interior (MoI) and Central Statistical Bureau (CSB), Ministry of Planning.
- Period of data coverage
December 31st, given years.
- Data availability
The present data is taken from the “Migration Statistics” reports, published annually by the CSB.
The report (in Arabic and English, PDF format with Excel tables) is available on CSB’s website (Population Statistics, then Migration Statistics)
https://www.csb.gov.kw/Pages/Statistics_en?ID=56&ParentCatID=1
https://www.csb.gov.kw/Pages/Statistics?ID=56&ParentCatID=1
Date of access: May 2023
GLMM and GRC cannot guarantee that the link to access the source will not change; that the information will not be removed from the website it was obtained from; that no geo-blockages will be imposed; or that the information will not be available for any another reason.
Keywords: Kuwait, Irregular Migration, Legal Document, Residence Conditions, Foreign Population, Asia, Africa, Europe, North America, South America, Oceania
| |
2015 |
2016 |
2017 |
2018 |
2019 |
2020 |
2021 |
2022 |
| Section (14) Temporary residence |
3,460 |
4,260 |
9,027 |
8,408 |
9,912 |
22,506 |
6,462 |
8,993 |
| Section (17) Employment government sector |
98 |
124 |
119 |
94 |
131 |
96 |
244 |
117 |
| Section (18) Employment private sector |
4,284 |
4,803 |
6,715 |
6,216 |
7,678 |
5,880 |
11,121 |
6,579 |
| Section (19) Freelancing |
1 |
2 |
1 |
6 |
4 |
1 |
9 |
3 |
| Section (20) Employment domestic sector |
15,046 |
11,932 |
13,333 |
12,308 |
16,357 |
12,632 |
20,585 |
9,480 |
| Section (22) Family reunion |
2,178 |
1,581 |
2,410 |
2,242 |
2,200 |
1,099 |
3,497 |
2,410 |
| Section (23) Studying |
1 |
2 |
3 |
0 |
1 |
0 |
68 |
4 |
| Section (24) Self-sponsorship |
38 |
34 |
34 |
36 |
51 |
20 |
64 |
104 |
| Total |
25,106 |
22,738 |
31,642 |
29,310 |
36,334 |
42,234 |
42,050 |
27,690 |
Source: Central Statistical Bureau, Migration Statistics Bulletin, given years.
ANNEXED NOTE
- Definitions
These are flow data.
The figures refer to foreign residents living in Kuwait at the end of the reference year, who became contravenors to the law on residency during the year.
CSB reprocessed data from Ministry of Interior’s (Directorate of Migration’s) annual records of residency permits granted to foreign residents by type/ purpose of permit, sex and regional origin of holder.
The present figures include permits delivered for all purposes of stay in Kuwait:
1- Labour in all sectors: governmental (n°17); private sector (n°18); business (n°19) and domestic (n°20) sectors
2- Residence: temporary residence (n°14); as family dependent (permit n°22); for the purpose of studying (n°23) and for self-sponsorship (n°24).
Residency procedures do not apply to GCC nationals and to Bidouns (stateless residents of Kuwait).
The table thus excludes the Bidouns, the non-Kuwaiti GCC citizens and those in irregular situation.
- Institution which provides data
Migration Department, Ministry of Interior (MoI) and Central Statistical Bureau (CSB), Ministry of Planning.
- Period of data coverage
December 31st, given years.
- Data availability
The present data is taken from the “Migration Statistics” reports, published annually by the CSB.
The report (in Arabic and English, PDF format with Excel tables) is available on CSB’s website (Population Statistics, then Migration Statistics)
https://www.csb.gov.kw/Pages/Statistics_en?ID=56&ParentCatID=1
https://www.csb.gov.kw/Pages/Statistics?ID=56&ParentCatID=1
Date of access: May 2023
GLMM and GRC cannot guarantee that the link to access the source will not change; that the information will not be removed from the website it was obtained from; that no geo-blockages will be imposed; or that the information will not be available for any another reason.
Keywords: Kuwait, Irregular Migration, Legal Document, Residence Conditions
|
2015 |
2016 |
2017 |
2018 |
2019 |
2020 |
2021 |
2022 |
| Arab countries |
4,274 |
4,942 |
7,107 |
6,994 |
8,342 |
9,072 |
9,449 |
7,582 |
| Non‐Arab Asian countries |
14,866 |
14,199 |
20,761 |
17,218 |
21,515 |
27,289 |
27,571 |
17,850 |
| Non‐Arab African countries |
5,848 |
3,508 |
3,635 |
4,922 |
6,352 |
5,368 |
4,759 |
2,103 |
| Europe |
43 |
38 |
49 |
78 |
40 |
162 |
77 |
46 |
| North America |
51 |
36 |
62 |
69 |
66 |
284 |
154 |
69 |
| South and Central America |
19 |
10 |
16 |
23 |
18 |
35 |
30 |
36 |
| Australia and Pacific |
5 |
5 |
12 |
6 |
1 |
24 |
10 |
4 |
| Other |
0 |
0 |
0 |
0 |
0 |
0 |
0 |
0 |
| Total |
25,106 |
22,738 |
31,642 |
29,310 |
36,334 |
42,234 |
42,050 |
27,690 |
Source: Central Statistical Bureau, Migration Statistics Bulletin, given years.
ANNEXED NOTE
- Definitions
These are flow data.
The figures refer to foreign residents living in Kuwait at the end of the reference year, who became contravenors to the law on residency during the year.
CSB reprocessed data from Ministry of Interior’s (Directorate of Migration’s) annual records of residency permits granted to foreign residents by type/ purpose of permit, sex and regional origin of holder.
The present figures include permits delivered for all purposes of stay in Kuwait:
1- Labour in all sectors: governmental (n°17); private sector (n°18); business (n°19) and domestic (n°20) sectors
2- Residence: temporary residence (n°14); as family dependent (permit n°22); for the purpose of studying (n°23) and for self-sponsorship (n°24).
Residency procedures do not apply to GCC nationals and to Bidouns (stateless residents of Kuwait).
The table thus excludes the Bidouns, the non-Kuwaiti GCC citizens and those in irregular situation.
- Institution which provides data
Migration Department, Ministry of Interior (MoI) and Central Statistical Bureau (CSB), Ministry of Planning.
- Period of data coverage
December 31st, given years.
- Data availability
The present data is taken from the “Migration Statistics” reports, published annually by the CSB.
The report (in Arabic and English, PDF format with Excel tables) is available on CSB’s website (Population Statistics, then Migration Statistics)
https://www.csb.gov.kw/Pages/Statistics_en?ID=56&ParentCatID=1
https://www.csb.gov.kw/Pages/Statistics?ID=56&ParentCatID=1
Date of access: May 2023
GLMM and GRC cannot guarantee that the link to access the source will not change; that the information will not be removed from the website it was obtained from; that no geo-blockages will be imposed; or that the information will not be available for any another reason.
Keywords: Kuwait, Irregular Migration, Legal Document, Residence Conditions, Foreign Population, Asia, Africa, Europe, North America, South America, Oceania
| ISCED 2011 level |
No schooling |
Primary education |
Intermedi-ate education (Lower secondary) |
Upper secondary education |
Post-secondary non-tertiary education |
Short-cycle tertiary education |
Bachelor’s or equivalent level |
Master’s or equivalent level |
Doctoral or equivalent level |
Other/Not specified |
Total |
| 0 |
1 |
2 |
3 |
4 |
5 |
6 |
7 |
8 |
|
|
| MALES |
Saudi Arabia |
11,157 |
24,659 |
58,625 |
102,262 |
75,628 |
29,737 |
321,572 |
32,568 |
14,545 |
6,151 |
676,904 |
| Algeria |
4 |
|
|
|
|
|
4 |
13 |
164 |
3 |
188 |
| Bahrain |
|
|
|
|
|
|
1 |
|
2 |
0 |
3 |
| Egypt |
136 |
1 |
27 |
1 |
31 |
|
1,923 |
1,911 |
3,444 |
193 |
7,667 |
| Iraq |
|
|
|
|
|
|
2 |
|
3 |
0 |
5 |
| Jordan |
28 |
|
3 |
|
4 |
|
126 |
325 |
69 |
638 |
1,193 |
| Kuwait |
|
|
|
|
|
|
|
|
1 |
0 |
1 |
| Lebanon |
|
|
|
|
|
|
5 |
8 |
22 |
0 |
35 |
| Libya |
|
|
|
|
|
|
|
1 |
1 |
0 |
2 |
| Mauritania |
|
|
|
|
|
|
1 |
2 |
14 |
1 |
18 |
| Morocco |
1 |
|
1 |
|
|
|
3 |
5 |
39 |
0 |
49 |
| Palestine |
1 |
|
2 |
1 |
1 |
|
24 |
9 |
14 |
24 |
76 |
| Sudan |
96 |
|
21 |
1 |
26 |
|
2,512 |
449 |
1,299 |
113 |
4,517 |
| Syria |
7 |
|
14 |
|
19 |
|
744 |
36 |
298 |
352 |
1,470 |
| Tunisia |
21 |
|
4 |
|
9 |
|
67 |
97 |
726 |
6 |
930 |
| Yemen |
14 |
|
|
|
1 |
|
65 |
44 |
367 |
11 |
502 |
| Arab countries |
308 |
1 |
72 |
3 |
91 |
0 |
5,477 |
2,900 |
6,463 |
1,341 |
16,656 |
| Afghanistan |
|
|
|
|
|
|
1 |
2 |
3 |
0 |
6 |
| Azerbaijan |
|
|
|
|
|
|
2 |
|
1 |
1 |
4 |
| Bangladesh |
|
|
2 |
|
1 |
|
14 |
49 |
83 |
137 |
286 |
| Brunei |
|
|
|
|
|
|
|
|
|
1 |
1 |
| China |
|
|
|
|
|
|
2 |
|
7 |
0 |
9 |
| India |
35 |
1 |
31 |
2 |
49 |
|
53 |
663 |
896 |
486 |
2,216 |
| Indonesia |
|
|
|
|
2 |
|
7 |
1 |
16 |
0 |
26 |
| Japan |
|
|
|
|
|
|
|
1 |
1 |
0 |
2 |
| Kazakhstan |
|
|
|
|
|
|
|
|
1 |
1 |
2 |
| Malaysia |
1 |
|
|
|
2 |
|
2 |
4 |
11 |
0 |
20 |
| Nepal |
|
|
|
|
|
|
|
1 |
1 |
0 |
2 |
| Pakistan |
13 |
|
17 |
|
14 |
|
88 |
458 |
561 |
761 |
1,912 |
| Philippines |
24 |
|
57 |
1 |
22 |
|
183 |
2 |
13 |
23 |
325 |
| Singapore |
|
|
|
|
|
|
|
1 |
1 |
0 |
2 |
| South Korea |
|
|
|
|
|
|
|
1 |
4 |
0 |
5 |
| Sri Lanka |
|
|
|
|
|
|
|
4 |
1 |
0 |
5 |
| Turkey |
|
|
|
|
|
|
4 |
2 |
2 |
20 |
28 |
| Uzbekistan |
|
|
|
|
|
|
|
2 |
3 |
0 |
5 |
| Asian countries |
73 |
1 |
107 |
3 |
90 |
0 |
356 |
1,191 |
1,605 |
1,430 |
4,856 |
| Botswana |
4 |
4 |
2 |
15 |
6 |
|
59 |
2 |
2 |
0 |
94 |
| Cameroon |
|
|
|
|
|
|
|
|
2 |
1 |
3 |
| Chad |
|
|
|
|
|
|
|
|
2 |
0 |
2 |
| Comoros |
|
|
|
|
|
|
2 |
|
|
0 |
2 |
| Djibouti |
|
|
1 |
|
|
|
1 |
|
|
0 |
2 |
| Ethiopia |
|
1 |
1 |
|
|
|
|
|
4 |
0 |
6 |
| Ghana |
|
|
1 |
|
|
|
1 |
2 |
1 |
0 |
5 |
| Guinea |
|
|
|
|
|
|
|
1 |
|
0 |
1 |
| Ivory Coast |
|
|
|
|
|
|
1 |
|
|
0 |
1 |
| Kenya |
|
|
|
|
|
|
|
1 |
2 |
0 |
3 |
| Mali |
|
|
|
|
|
|
|
|
1 |
0 |
1 |
| Nigeria |
1 |
|
2 |
|
1 |
|
13 |
19 |
56 |
121 |
213 |
| Senegal |
|
|
|
|
|
|
|
|
1 |
0 |
1 |
| Sierra Leone |
|
|
|
|
|
|
|
|
1 |
1 |
2 |
| Somalia |
|
|
2 |
|
|
|
1 |
1 |
2 |
1 |
7 |
| South Africa |
|
|
|
|
|
|
12 |
5 |
1 |
0 |
18 |
| Tanzania |
|
|
|
|
|
|
1 |
1 |
|
0 |
2 |
| Togo |
|
|
|
|
|
|
|
|
1 |
0 |
1 |
| Uganda |
|
|
|
|
|
|
|
1 |
|
0 |
1 |
| SS African countries |
5 |
5 |
9 |
15 |
7 |
0 |
91 |
33 |
76 |
124 |
365 |
| Belgium |
|
|
|
|
|
|
|
1 |
3 |
0 |
4 |
| Bosnia |
|
|
|
|
|
|
|
1 |
2 |
0 |
3 |
| Czech Republic |
|
|
|
|
|
|
|
|
1 |
0 |
1 |
| Denmark |
|
|
|
|
|
|
|
|
5 |
0 |
5 |
| Finland |
|
|
|
|
|
|
|
|
1 |
0 |
1 |
| France |
|
|
|
|
|
|
|
1 |
26 |
0 |
27 |
| Germany |
|
|
|
|
|
|
|
|
25 |
0 |
25 |
| Greece |
|
|
|
|
|
|
|
|
15 |
1 |
16 |
| Hungary |
|
|
|
|
|
|
|
|
1 |
0 |
1 |
| Ireland |
|
|
|
|
|
|
1 |
3 |
9 |
0 |
13 |
| Italy |
|
|
|
|
|
|
|
|
6 |
0 |
6 |
| Netherlands |
|
|
|
|
|
|
1 |
|
3 |
0 |
4 |
| Norway |
|
|
|
|
|
|
|
|
2 |
0 |
2 |
| Poland |
|
|
|
|
|
|
|
|
1 |
0 |
1 |
| Romania |
|
|
|
|
|
|
|
2 |
4 |
0 |
6 |
| Russia |
|
|
|
|
|
|
12 |
6 |
4 |
0 |
22 |
| Spain |
|
|
|
|
|
|
|
|
3 |
0 |
3 |
| Sweden |
|
|
|
|
|
|
|
|
5 |
0 |
5 |
| UK |
3 |
|
|
|
|
1 |
22 |
58 |
73 |
4 |
161 |
| Ukraine |
|
|
|
|
|
|
2 |
|
|
0 |
2 |
| Europe |
3 |
0 |
0 |
0 |
0 |
1 |
38 |
72 |
189 |
5 |
308 |
| Canada |
6 |
|
|
|
|
|
9 |
16 |
119 |
0 |
150 |
| Colombia |
|
|
|
|
|
|
|
|
1 |
0 |
1 |
| Cuba |
|
|
|
|
|
|
1 |
1 |
2 |
108 |
112 |
| USA |
4 |
|
|
|
|
|
27 |
4 |
56 |
37 |
128 |
| Americas |
10 |
0 |
0 |
0 |
0 |
0 |
37 |
21 |
178 |
145 |
391 |
| Australia |
|
|
|
|
|
|
2 |
7 |
29 |
0 |
38 |
| New Zealand |
|
|
|
|
|
|
|
|
3 |
0 |
3 |
| Oceania |
0 |
0 |
0 |
0 |
0 |
0 |
2 |
7 |
32 |
0 |
41 |
| Unspecified |
|
|
|
|
4 |
|
9 |
3 |
5 |
2 |
23 |
| Total male foreign workers |
399 |
7 |
188 |
21 |
192 |
1 |
6,010 |
4,227 |
8,548 |
3,047 |
22,640 |
| Total male workers gov. sector |
11,556 |
24,666 |
58,813 |
102,283 |
75,820 |
29,738 |
327,582 |
36,795 |
23,093 |
9,198 |
699,544 |
|
|
|
|
|
|
|
|
|
|
|
|
|
| FEMALES |
Saudi Arabia |
7,859 |
424 |
26,449 |
18,286 |
75,884 |
794 |
3,455 |
22,999 |
8,955 |
324,090 |
489,195 |
| Algeria |
|
|
|
|
|
|
|
5 |
42 |
0 |
47 |
| Bahrain |
|
|
1 |
|
1 |
|
|
|
|
0 |
2 |
| Egypt |
87 |
|
8 |
|
57 |
1 |
942 |
662 |
183 |
1,801 |
3,741 |
| Iraq |
|
|
|
|
|
|
1 |
|
2 |
1 |
4 |
| Jordan |
12 |
|
5 |
|
6 |
|
19 |
14 |
117 |
129 |
302 |
| Kuwait |
|
|
|
|
1 |
|
1 |
|
3 |
0 |
5 |
| Lebanon |
1 |
|
|
|
|
|
2 |
|
7 |
0 |
10 |
| Libya |
|
|
|
|
|
|
|
1 |
1 |
0 |
2 |
| Mauritania |
|
|
|
|
|
|
|
|
1 |
0 |
1 |
| Morocco |
|
|
11 |
|
|
|
2 |
1 |
11 |
0 |
25 |
| Oman |
|
|
|
|
|
|
1 |
|
|
0 |
1 |
| Palestine |
|
|
5 |
|
|
|
9 |
|
2 |
8 |
24 |
| Sudan |
72 |
|
31 |
|
3 |
|
2,575 |
376 |
911 |
77 |
4,045 |
| Syria |
1 |
|
21 |
|
11 |
|
18 |
58 |
33 |
96 |
238 |
| Tunisia |
8 |
|
1 |
|
36 |
|
3 |
64 |
433 |
41 |
586 |
| UAE |
|
|
|
|
|
|
|
|
1 |
0 |
1 |
| Yemen |
1 |
|
3 |
|
2 |
|
13 |
12 |
47 |
3 |
81 |
| Arab countries |
182 |
0 |
86 |
0 |
117 |
1 |
3,586 |
1,193 |
1,794 |
2,156 |
9,115 |
| Afghanistan |
|
|
|
|
|
|
1 |
|
|
0 |
1 |
| Bangladesh |
|
|
15 |
|
13 |
|
26 |
12 |
6 |
6 |
78 |
| China |
|
|
1 |
|
5 |
|
2 |
|
|
0 |
8 |
| India |
15 |
|
51 |
|
2,375 |
|
1,582 |
22 |
324 |
734 |
5,103 |
| Indonesia |
|
|
1 |
|
129 |
|
1 |
|
3 |
10 |
144 |
| Malaysia |
|
|
|
|
6 |
|
5 |
3 |
11 |
54 |
79 |
| Pakistan |
2 |
|
83 |
|
25 |
|
277 |
14 |
15 |
420 |
836 |
| Philippines |
18 |
|
884 |
|
44 |
|
3,324 |
27 |
17 |
523 |
4,837 |
| South Korea |
|
|
2 |
|
|
|
|
|
|
1 |
3 |
| Sri Lanka |
|
|
1 |
|
1 |
|
1 |
|
1 |
0 |
4 |
| Thailand |
|
|
|
|
|
|
1 |
|
|
0 |
1 |
| Turkey |
|
|
|
|
|
|
|
|
1 |
0 |
1 |
| Asian countries |
35 |
0 |
1,038 |
0 |
2,598 |
0 |
5,220 |
78 |
378 |
1,748 |
11,095 |
| Botswana |
|
|
4 |
1 |
5 |
|
25 |
1 |
|
2 |
38 |
| Djibouti |
|
|
|
|
|
|
1 |
|
|
0 |
1 |
| Eritrea |
|
|
|
|
|
|
1 |
|
|
0 |
1 |
| Ghana |
|
|
1 |
|
|
|
|
|
|
0 |
1 |
| Ivory Coast |
1 |
|
|
|
|
|
|
|
1 |
0 |
2 |
| Kenya |
|
|
|
|
|
|
|
|
|
1 |
1 |
| Nigeria |
1 |
|
4 |
|
2 |
|
35 |
1 |
4 |
2 |
49 |
| Sierra Leone |
|
|
|
|
1 |
|
|
|
|
0 |
1 |
| Somalia |
|
|
6 |
|
3 |
|
2 |
|
|
3 |
14 |
| South Africa |
|
|
|
|
|
|
5 |
|
|
0 |
5 |
| SS African countries |
2 |
0 |
15 |
1 |
11 |
0 |
69 |
2 |
5 |
8 |
113 |
| France |
|
|
|
|
|
|
|
|
8 |
1 |
9 |
| Germany |
|
|
|
|
|
|
|
1 |
3 |
0 |
4 |
| Greece |
|
|
|
|
|
|
|
1 |
2 |
0 |
3 |
| Netherlands |
|
|
|
|
|
|
1 |
|
1 |
1 |
3 |
| Romania |
|
|
|
|
|
|
|
1 |
1 |
0 |
2 |
| Russia |
|
|
|
|
|
|
8 |
2 |
|
0 |
10 |
| Sweden |
|
|
|
|
|
|
|
1 |
1 |
0 |
2 |
| UK |
|
|
|
|
|
|
6 |
8 |
1 |
9 |
24 |
| Ukraine |
|
|
|
|
|
|
2 |
|
|
0 |
2 |
| Europe |
0 |
0 |
0 |
0 |
0 |
0 |
17 |
14 |
17 |
11 |
59 |
| Argentina |
|
|
|
|
|
|
1 |
|
|
0 |
1 |
| Canada |
|
|
|
|
|
|
5 |
4 |
17 |
0 |
26 |
| Cuba |
|
|
|
|
|
|
12 |
69 |
|
0 |
81 |
| USA |
|
|
1 |
|
|
|
3 |
5 |
13 |
1 |
23 |
| Venezuela |
|
|
|
|
|
|
|
|
1 |
0 |
1 |
| Americas |
0 |
0 |
1 |
0 |
0 |
0 |
21 |
78 |
31 |
1 |
132 |
| Australia |
|
|
|
|
|
|
|
1 |
3 |
0 |
4 |
| New Zealand |
|
|
|
|
|
|
|
1 |
1 |
0 |
2 |
| Oceania |
0 |
0 |
0 |
0 |
0 |
0 |
0 |
2 |
4 |
0 |
6 |
| Unspecified |
|
|
1 |
|
2 |
|
4 |
1 |
5 |
7 |
20 |
| Total female foreign workers |
219 |
0 |
1,141 |
1 |
2,728 |
1 |
8,917 |
1,368 |
2,234 |
3,931 |
20,540 |
| Total female workers gov. sector |
8,078 |
424 |
27,590 |
18,287 |
78,612 |
795 |
12,372 |
24,367 |
11,189 |
328,021 |
509,735 |
Source: Ministry of Human Resources and Social Development (MHRSD)
ANNEXED NOTE
- Technical Notes and Definitions
Data do not include employees in the security and military sectors.
No metadata available. The administrative records used as a source of data is unmentioned.
The original dataset’s title (“Manpower in the Public sector during year 2020”), likely refers to Civil Service’s employees.
When compared to the results of GAStat Labour Force Survey (LFS) for Q4 of 2022, the totals of foreign workers in the “public” sector (43,027 in 2022, see table) were closer to the LFS’s figures of foreign workers in the Civil Service (44,065), than to the figures of foreign workers in the government sector (158,000). It is thus likely that MHRSD’s figures of workers in the “Public” sector are referring to Civil service workers.
Saudi and non-Saudi workers subscribing to the Social Insurance (GOSI) and working for the public sector (non-civil servants) are thus not included in the figures of workers in the government sector.
Education levels in the original dataset were grouped according to the ISCED 2011 classification of education levels.
http://uis.unesco.org/en/isced-mappings
- Institution which provides data
Saudi Arabia: Ministry of Human Resources and Social Development (MHRSD)
- Data availability
Ministry of Human Resources and Social Development (MHRSD).
Datasets: “Workforce in the Government sector during year 2022” parts 1; 2; and 3, by administrative region.
https://od.data.gov.sa/Data/en/dataset/the-workforce-in-the-government-sector-during-the-year-2022
Datasets present data at the level of individuals, and indicate the worker’s gender, country of citizenship, age in single years, education level, educational speciality, the type of staff to which the employee belongs (education; health; employee; contract worker and others), location of the post (cities) and administrative region.
The dataset is only available in the Saudi government Open Data Portal – DATA.GOV.SA , Labor data.
Datasets are in Arabic only.
Last date of access: May 2023.
GLMM and GRC cannot guarantee that the link to access the source will not change; that the information will not be removed from the website it was obtained from; that no geo-blockages will be imposed; or that the information will not be available for any another reason.
Keywords: Saudi Arabia, India, Indonesia, Pakistan, Bangladesh, Philippines, Nepal, Sri Lanka, Afghanistan, Iran, China, Thailand, Korea (South), Egypt, Iraq, Jordan, Lebanon, Morocco, Palestine, Sudan, Tunisia, Turkey, Eritrea, Ethiopia, Europe, North America, Asia, Africa, Oceania, USA, Arab Countries, Labour Market, Employment, Female Employment, National & Foreign Labour, National Labour, Foreign Labour, Education.
| |
No schooling |
Primary education |
Intermediate education (Lower secondary) |
Upper secondary education |
Post-secondary non-tertiary education |
Short-cycle tertiary education |
Bachelor’s or equivalent level |
Master’s or equivalent level |
Doctoral or equivalent level |
Other/ Not specified |
Total |
| ISCED 2011 level |
0 |
1 |
2 |
3 |
4 |
5 |
6 |
7 |
8 |
|
|
| Saudi Arabia |
19,016 |
28,683 |
85,074 |
120,548 |
151,512 |
37,677 |
625,627 |
55,567 |
23,500 |
18,895 |
1,166,099 |
| Algeria |
4 |
0 |
0 |
0 |
0 |
0 |
4 |
18 |
26 |
183 |
235 |
| Bahrain |
0 |
0 |
1 |
0 |
1 |
0 |
1 |
0 |
2 |
0 |
5 |
| Egypt |
223 |
1 |
17 |
1 |
88 |
1 |
2,865 |
2,573 |
5,247 |
392 |
11,408 |
| Iraq |
0 |
0 |
0 |
0 |
0 |
0 |
3 |
0 |
5 |
1 |
9 |
| Jordan |
4 |
0 |
8 |
0 |
1 |
0 |
145 |
465 |
87 |
785 |
1,495 |
| Kuwait |
0 |
0 |
0 |
0 |
1 |
0 |
1 |
0 |
4 |
0 |
6 |
| Lebanon |
1 |
0 |
0 |
0 |
0 |
0 |
7 |
8 |
29 |
0 |
45 |
| Libya |
0 |
0 |
0 |
0 |
0 |
0 |
0 |
2 |
2 |
0 |
4 |
| Mauritania |
0 |
0 |
0 |
0 |
0 |
0 |
1 |
2 |
15 |
1 |
19 |
| Morocco |
1 |
0 |
12 |
0 |
0 |
0 |
5 |
6 |
5 |
45 |
74 |
| Oman |
0 |
0 |
0 |
0 |
0 |
0 |
1 |
0 |
0 |
0 |
1 |
| Palestine |
1 |
0 |
7 |
1 |
1 |
0 |
33 |
9 |
16 |
32 |
100 |
| Sudan |
168 |
0 |
52 |
1 |
56 |
0 |
587 |
825 |
221 |
6,652 |
8,562 |
| Syria |
8 |
0 |
35 |
0 |
3 |
0 |
852 |
418 |
331 |
61 |
1,708 |
| Tunisia |
29 |
0 |
14 |
0 |
45 |
0 |
97 |
161 |
1,159 |
11 |
1,516 |
| UAE |
0 |
0 |
0 |
0 |
0 |
0 |
0 |
0 |
1 |
0 |
1 |
| Yemen |
15 |
0 |
3 |
0 |
3 |
0 |
78 |
56 |
414 |
14 |
583 |
| Arab countries |
454 |
1 |
149 |
3 |
199 |
1 |
4,680 |
4,543 |
7,564 |
8,177 |
25,771 |
| Afghanistan |
0 |
0 |
0 |
0 |
0 |
0 |
2 |
2 |
3 |
0 |
7 |
| Azerbaijan |
0 |
0 |
0 |
0 |
0 |
0 |
2 |
0 |
1 |
1 |
4 |
| Bangladesh |
0 |
0 |
17 |
0 |
14 |
0 |
166 |
61 |
89 |
17 |
364 |
| Brunei |
0 |
0 |
0 |
0 |
0 |
0 |
0 |
0 |
0 |
1 |
1 |
| China |
0 |
0 |
1 |
0 |
5 |
0 |
4 |
0 |
7 |
0 |
17 |
| India |
5 |
1 |
541 |
2 |
2,424 |
0 |
285 |
865 |
122 |
3,074 |
7,319 |
| Indonesia |
0 |
0 |
1 |
0 |
131 |
0 |
17 |
1 |
19 |
1 |
170 |
| Japan |
0 |
0 |
0 |
0 |
0 |
0 |
0 |
1 |
1 |
0 |
2 |
| Kazakhstan |
0 |
0 |
0 |
0 |
0 |
0 |
0 |
0 |
1 |
1 |
2 |
| Malaysia |
1 |
0 |
0 |
0 |
62 |
0 |
7 |
7 |
22 |
0 |
99 |
| Nepal |
0 |
0 |
0 |
0 |
0 |
0 |
0 |
1 |
1 |
0 |
2 |
| Pakistan |
15 |
0 |
1 |
0 |
219 |
0 |
185 |
598 |
666 |
1,064 |
2,748 |
| Philippines |
42 |
0 |
941 |
1 |
426 |
0 |
357 |
47 |
3 |
3,345 |
5,162 |
| Singapore |
0 |
0 |
0 |
0 |
0 |
0 |
0 |
1 |
1 |
0 |
2 |
| South Korea |
0 |
0 |
2 |
0 |
0 |
0 |
0 |
1 |
4 |
1 |
8 |
| Sri Lanka |
0 |
0 |
1 |
0 |
1 |
0 |
1 |
4 |
2 |
0 |
9 |
| Thailand |
0 |
0 |
0 |
0 |
0 |
0 |
1 |
0 |
0 |
0 |
1 |
| Turkey |
0 |
0 |
0 |
0 |
0 |
0 |
4 |
2 |
21 |
2 |
29 |
| Uzbekistan |
0 |
0 |
0 |
0 |
0 |
0 |
0 |
2 |
3 |
0 |
5 |
| Asian countries |
63 |
1 |
1,505 |
3 |
3,282 |
0 |
1,031 |
1,593 |
966 |
7,507 |
15,951 |
| Botswana |
4 |
4 |
6 |
16 |
11 |
0 |
84 |
3 |
2 |
2 |
132 |
| Cameroon |
0 |
0 |
0 |
0 |
0 |
0 |
0 |
0 |
2 |
1 |
3 |
| Chad |
0 |
0 |
0 |
0 |
0 |
0 |
0 |
0 |
2 |
0 |
2 |
| Comoros |
0 |
0 |
0 |
0 |
0 |
0 |
2 |
0 |
0 |
0 |
2 |
| Djibouti |
0 |
0 |
1 |
0 |
0 |
0 |
2 |
0 |
0 |
0 |
3 |
| Eritrea |
0 |
0 |
0 |
0 |
0 |
0 |
1 |
0 |
0 |
0 |
1 |
| Ethiopia |
0 |
1 |
1 |
0 |
0 |
0 |
0 |
0 |
4 |
0 |
6 |
| Ghana |
0 |
0 |
2 |
0 |
0 |
0 |
1 |
2 |
1 |
0 |
6 |
| Guinea |
0 |
0 |
0 |
0 |
0 |
0 |
0 |
1 |
0 |
0 |
1 |
| Ivory Coast |
1 |
0 |
0 |
0 |
0 |
0 |
1 |
0 |
1 |
0 |
3 |
| Kenya |
0 |
0 |
0 |
0 |
0 |
0 |
0 |
1 |
2 |
1 |
4 |
| Mali |
0 |
0 |
0 |
0 |
0 |
0 |
0 |
0 |
1 |
0 |
1 |
| Nigeria |
2 |
0 |
6 |
0 |
3 |
0 |
165 |
2 |
6 |
78 |
262 |
| Senegal |
0 |
0 |
0 |
0 |
0 |
0 |
0 |
0 |
1 |
0 |
1 |
| Sierra Leone |
0 |
0 |
0 |
0 |
1 |
0 |
0 |
0 |
1 |
1 |
3 |
| Somalia |
0 |
0 |
8 |
0 |
3 |
0 |
3 |
1 |
2 |
4 |
21 |
| South Africa |
0 |
0 |
0 |
0 |
0 |
0 |
17 |
5 |
1 |
0 |
23 |
| Tanzania |
0 |
0 |
0 |
0 |
0 |
0 |
1 |
1 |
0 |
0 |
2 |
| Togo |
0 |
0 |
0 |
0 |
0 |
0 |
0 |
0 |
1 |
0 |
1 |
| Uganda |
0 |
0 |
0 |
0 |
0 |
0 |
0 |
1 |
0 |
0 |
1 |
| SS African countries |
7 |
5 |
24 |
16 |
18 |
0 |
277 |
17 |
27 |
87 |
478 |
| Belgium |
0 |
0 |
0 |
0 |
0 |
0 |
0 |
1 |
3 |
0 |
4 |
| Bosnia |
0 |
0 |
0 |
0 |
0 |
0 |
0 |
1 |
2 |
0 |
3 |
| Czech Republic |
0 |
0 |
0 |
0 |
0 |
0 |
0 |
0 |
1 |
0 |
1 |
| Denmark |
0 |
0 |
0 |
0 |
0 |
0 |
0 |
0 |
5 |
0 |
5 |
| Finland |
0 |
0 |
0 |
0 |
0 |
0 |
0 |
0 |
1 |
0 |
1 |
| France |
0 |
0 |
0 |
0 |
0 |
0 |
0 |
1 |
34 |
1 |
36 |
| Germany |
0 |
0 |
0 |
0 |
0 |
0 |
0 |
1 |
28 |
0 |
29 |
| Greece |
0 |
0 |
0 |
0 |
0 |
0 |
0 |
1 |
17 |
1 |
19 |
| Hungary |
0 |
0 |
0 |
0 |
0 |
0 |
0 |
0 |
1 |
0 |
1 |
| Ireland |
0 |
0 |
0 |
0 |
0 |
0 |
1 |
3 |
9 |
0 |
13 |
| Italy |
0 |
0 |
0 |
0 |
0 |
0 |
0 |
0 |
6 |
0 |
6 |
| Netherlands |
0 |
0 |
0 |
0 |
0 |
0 |
2 |
0 |
4 |
1 |
7 |
| Norway |
0 |
0 |
0 |
0 |
0 |
0 |
0 |
0 |
2 |
0 |
2 |
| Poland |
0 |
0 |
0 |
0 |
0 |
0 |
0 |
0 |
1 |
0 |
1 |
| Romania |
0 |
0 |
0 |
0 |
0 |
0 |
0 |
3 |
5 |
0 |
8 |
| Russia |
0 |
0 |
0 |
0 |
0 |
0 |
2 |
8 |
4 |
18 |
32 |
| Spain |
0 |
0 |
0 |
0 |
0 |
0 |
0 |
0 |
3 |
0 |
3 |
| Sweden |
0 |
0 |
0 |
0 |
0 |
0 |
0 |
1 |
6 |
0 |
7 |
| UK |
3 |
0 |
0 |
0 |
0 |
1 |
28 |
66 |
83 |
4 |
185 |
| Ukraine |
0 |
0 |
0 |
0 |
0 |
0 |
2 |
0 |
0 |
0 |
2 |
| Europe |
3 |
0 |
0 |
0 |
0 |
1 |
35 |
86 |
215 |
25 |
365 |
| Argentina |
0 |
0 |
0 |
0 |
0 |
0 |
3 |
0 |
0 |
0 |
3 |
| Canada |
6 |
0 |
0 |
0 |
0 |
0 |
14 |
2 |
136 |
18 |
176 |
| Colombia |
0 |
0 |
0 |
0 |
0 |
0 |
0 |
0 |
1 |
0 |
1 |
| Cuba |
0 |
0 |
0 |
0 |
0 |
0 |
22 |
169 |
2 |
0 |
193 |
| USA |
4 |
0 |
1 |
0 |
0 |
0 |
3 |
45 |
69 |
29 |
151 |
| Venezuela |
0 |
0 |
0 |
0 |
0 |
0 |
0 |
0 |
1 |
0 |
1 |
| Americas |
10 |
0 |
1 |
0 |
0 |
0 |
42 |
216 |
209 |
47 |
525 |
| Australia |
0 |
0 |
0 |
0 |
0 |
0 |
2 |
8 |
32 |
0 |
42 |
| New Zealand |
0 |
0 |
0 |
0 |
0 |
0 |
0 |
1 |
4 |
0 |
5 |
| Oceania |
0 |
0 |
0 |
0 |
0 |
0 |
2 |
9 |
36 |
0 |
47 |
| Unspecified |
0 |
0 |
1 |
0 |
6 |
0 |
13 |
4 |
1 |
18 |
43 |
| Total foreign workers |
537 |
7 |
1,680 |
22 |
3,505 |
2 |
6,080 |
6,468 |
9,018 |
15,861 |
43,180 |
| Total workers gov. sector |
19,553 |
28,690 |
86,754 |
120,570 |
155,017 |
37,679 |
631,707 |
62,035 |
32,518 |
34,756 |
1,209,279 |
Source: Ministry of Human Resources and Social Development (MHRSD)
ANNEXED NOTE
- Technical Notes and Definitions
Data do not include employees in the security and military sectors.
No metadata available. The administrative records used as a source of data is unmentioned.
The original dataset’s title (“Manpower in the Public sector during year 2020”), likely refers to Civil Service’s employees.
When compared to the results of GAStat Labour Force Survey (LFS) for Q4 of 2022, the totals of foreign workers in the “public” sector (43,027 in 2022, see table) were closer to the LFS’s figures of foreign workers in the Civil Service (44,065), than to the figures of foreign workers in the government sector (158,000). It is thus likely that MHRSD’s figures of workers in the “Public” sector are referring to Civil service workers.
Saudi and non-Saudi workers subscribing to the Social Insurance (GOSI) and working for the public sector (non-civil servants) are thus not included in the figures of workers in the government sector.
Education levels in the original dataset were grouped according to the ISCED 2011 classification of education levels.
http://uis.unesco.org/en/isced-mappings
- Institution which provides data
Saudi Arabia: Ministry of Human Resources and Social Development (MHRSD)
- Data availability
Ministry of Human Resources and Social Development (MHRSD).
Datasets: “Workforce in the Government sector during year 2022” parts 1; 2; and 3, by administrative region.
https://od.data.gov.sa/Data/en/dataset/the-workforce-in-the-government-sector-during-the-year-2022
Datasets present data at the level of individuals, and indicate the worker’s gender, country of citizenship, age in single years, education level, educational speciality, the type of staff to which the employee belongs (education; health; employee; contract worker and others), location of the post (cities) and administrative region.
The dataset is only available in the Saudi government Open Data Portal – DATA.GOV.SA , Labor data.
Datasets are in Arabic only.
Last date of access: May 2023.
GLMM and GRC cannot guarantee that the link to access the source will not change; that the information will not be removed from the website it was obtained from; that no geo-blockages will be imposed; or that the information will not be available for any another reason.
Keywords: Saudi Arabia, India, Indonesia, Pakistan, Bangladesh, Philippines, Nepal, Sri Lanka, Afghanistan, Iran, China, Thailand, Korea (South), Egypt, Iraq, Jordan, Lebanon, Morocco, Palestine, Sudan, Tunisia, Turkey, Eritrea, Ethiopia, Europe, North America, Asia, Africa, Oceania, USA, Arab Countries, Labour Market, Employment, Female Employment, National & Foreign Labour, National Labour, Foreign Labour, Education.
| |
Riyadh |
Eastern Province |
Madina al-Munawwara |
Qassim |
Ha’il |
Mekka |
Norther Borders |
‘Asir |
Al-Baha |
Al-Jawf |
Tabouk |
Najran |
Jizan |
| |
M |
F |
M |
F |
M |
F |
M |
F |
M |
F |
M |
F |
M |
F |
M |
F |
M |
F |
M |
F |
M |
F |
M |
F |
M |
F |
| Saudi Arabia |
266,261 |
174,589 |
64,473 |
47,856 |
38,574 |
28,340 |
33,344 |
26,545 |
17,928 |
13,978 |
101,398 |
74,179 |
11,199 |
7,095 |
48,117 |
45,132 |
12,631 |
11,023 |
16,678 |
10,774 |
19,495 |
14,835 |
18,826 |
10,981 |
27,980 |
23,868 |
|
| Algeria |
53 |
14 |
35 |
3 |
13 |
3 |
5 |
3 |
8 |
|
19 |
5 |
5 |
5 |
21 |
9 |
|
|
14 |
2 |
6 |
1 |
4 |
|
5 |
2 |
|
| Bahrain |
|
|
3 |
2 |
|
|
|
|
|
|
|
|
|
|
|
|
|
|
|
|
|
|
|
|
|
|
|
| Egypt |
1,658 |
776 |
838 |
401 |
578 |
370 |
594 |
346 |
251 |
136 |
1,508 |
745 |
256 |
118 |
582 |
267 |
179 |
69 |
282 |
109 |
288 |
143 |
270 |
114 |
383 |
147 |
|
| Iraq |
2 |
1 |
1 |
|
1 |
|
|
|
|
|
1 |
1 |
|
|
|
1 |
|
1 |
|
|
|
|
|
|
|
|
|
| Jordan |
265 |
50 |
216 |
57 |
67 |
18 |
90 |
31 |
62 |
25 |
151 |
40 |
78 |
23 |
52 |
10 |
14 |
1 |
41 |
8 |
88 |
20 |
42 |
16 |
27 |
3 |
|
| Kuwait |
|
1 |
1 |
1 |
|
1 |
|
|
|
|
|
|
|
|
|
1 |
|
|
|
1 |
|
|
|
|
|
|
|
| Lebanon |
12 |
7 |
8 |
2 |
|
|
2 |
|
|
|
6 |
1 |
1 |
|
4 |
|
|
|
|
|
1 |
|
|
|
1 |
|
|
| Libya |
2 |
|
|
|
|
|
|
1 |
|
|
|
1 |
|
|
|
|
|
|
|
|
|
|
|
|
|
|
|
| Mauritania |
3 |
|
|
|
3 |
|
2 |
1 |
1 |
|
4 |
|
|
|
2 |
|
|
|
2 |
|
|
|
1 |
|
|
|
|
| Morocco |
22 |
6 |
4 |
3 |
|
3 |
1 |
1 |
|
|
13 |
5 |
2 |
|
5 |
2 |
|
|
|
|
1 |
1 |
|
3 |
1 |
1 |
|
| Oman |
|
1 |
|
|
|
|
|
|
|
|
|
|
|
|
|
|
|
|
|
|
|
|
|
|
|
|
|
| Palestine |
29 |
9 |
10 |
5 |
3 |
2 |
3 |
1 |
2 |
|
14 |
4 |
5 |
1 |
2 |
1 |
1 |
|
|
1 |
|
|
2 |
|
5 |
|
|
| Sudan |
937 |
775 |
392 |
340 |
221 |
330 |
309 |
339 |
156 |
163 |
508 |
443 |
216 |
150 |
564 |
458 |
124 |
116 |
185 |
136 |
270 |
238 |
303 |
261 |
332 |
296 |
|
| Syria |
277 |
56 |
174 |
30 |
111 |
23 |
107 |
21 |
73 |
13 |
170 |
25 |
102 |
9 |
109 |
20 |
58 |
9 |
114 |
15 |
72 |
12 |
54 |
3 |
49 |
2 |
|
| Tunisia |
231 |
138 |
111 |
82 |
42 |
41 |
55 |
28 |
17 |
7 |
212 |
135 |
79 |
63 |
76 |
43 |
6 |
1 |
29 |
10 |
34 |
19 |
15 |
3 |
23 |
16 |
|
| UAE |
|
1 |
|
|
|
|
|
|
|
|
|
|
|
|
|
|
|
|
|
|
|
|
|
|
|
|
|
| Yemen |
79 |
8 |
91 |
11 |
29 |
5 |
31 |
6 |
3 |
|
44 |
8 |
13 |
5 |
80 |
12 |
6 |
1 |
1 |
|
10 |
|
98 |
19 |
17 |
6 |
|
| Arab countries |
3,570 |
1,843 |
1,884 |
937 |
1,068 |
796 |
1,199 |
778 |
573 |
344 |
2,650 |
1,413 |
757 |
374 |
1,497 |
824 |
388 |
198 |
668 |
282 |
770 |
434 |
789 |
419 |
843 |
473 |
|
| Afghanistan |
|
|
2 |
|
1 |
1 |
|
|
|
|
3 |
|
|
|
|
|
|
|
|
|
|
|
|
|
|
|
|
| Azerbaidjan |
2 |
|
|
|
|
|
|
|
|
|
|
|
1 |
|
|
|
|
|
1 |
|
|
|
|
|
|
|
|
| Bangladesh |
56 |
18 |
40 |
7 |
10 |
6 |
11 |
3 |
5 |
1 |
35 |
9 |
4 |
|
30 |
20 |
11 |
2 |
12 |
1 |
17 |
1 |
17 |
2 |
38 |
8 |
|
| Brunei |
1 |
|
|
|
|
|
|
|
|
|
|
|
|
|
|
|
|
|
|
|
|
|
|
|
|
|
|
| China |
|
|
5 |
1 |
|
|
|
|
1 |
|
|
5 |
|
|
|
1 |
1 |
1 |
1 |
|
|
|
|
|
1 |
|
|
| India |
520 |
1,004 |
408 |
678 |
94 |
287 |
102 |
361 |
46 |
144 |
296 |
599 |
57 |
172 |
295 |
638 |
30 |
181 |
54 |
129 |
53 |
101 |
76 |
377 |
185 |
432 |
|
| Indonesia |
4 |
11 |
9 |
9 |
2 |
43 |
|
9 |
|
7 |
9 |
19 |
|
6 |
1 |
20 |
1 |
5 |
|
1 |
|
1 |
|
8 |
|
5 |
|
| Japan |
1 |
|
|
|
|
|
|
|
|
|
1 |
|
|
|
|
|
|
|
|
|
|
|
|
|
|
|
|
| Kazakhstan |
1 |
|
1 |
|
|
|
|
|
|
|
|
|
|
|
|
|
|
|
|
|
|
|
|
|
|
|
|
| Malaysia |
5 |
23 |
1 |
22 |
2 |
2 |
1 |
2 |
|
|
7 |
21 |
1 |
|
1 |
2 |
|
|
1 |
|
|
2 |
|
5 |
1 |
|
|
| Nepal |
|
|
1 |
|
|
|
|
|
1 |
|
|
|
|
|
|
|
|
|
|
|
|
|
|
|
|
|
|
| Pakistan |
348 |
116 |
348 |
101 |
90 |
46 |
141 |
121 |
69 |
28 |
341 |
136 |
117 |
50 |
149 |
86 |
53 |
26 |
38 |
14 |
54 |
26 |
64 |
57 |
100 |
29 |
|
| Philippines |
54 |
670 |
164 |
607 |
19 |
498 |
9 |
366 |
1 |
166 |
11 |
649 |
5 |
139 |
8 |
559 |
7 |
300 |
2 |
130 |
8 |
83 |
9 |
421 |
28 |
249 |
|
| Singapore |
1 |
|
1 |
|
|
|
|
|
|
|
|
|
|
|
|
|
|
|
|
|
|
|
|
|
|
|
|
| South Korea |
1 |
1 |
3 |
|
|
|
|
1 |
|
|
1 |
1 |
|
|
|
|
|
|
|
|
|
|
|
|
|
|
|
| Sri Lanka |
|
2 |
2 |
1 |
|
|
|
|
|
|
2 |
|
|
|
|
1 |
|
|
|
|
|
|
1 |
|
|
|
|
| Thailand |
|
|
|
|
|
|
|
|
|
|
|
1 |
|
|
|
|
|
|
|
|
|
|
|
|
|
|
|
| Turkey |
8 |
|
10 |
1 |
2 |
|
|
|
|
|
7 |
|
|
|
|
|
|
|
|
|
|
|
|
|
1 |
|
|
| Uzbekistan |
|
|
|
|
5 |
|
|
|
|
|
|
|
|
|
|
|
|
|
|
|
|
|
|
|
|
|
|
| Asian countries |
1,002 |
1,845 |
995 |
1,427 |
225 |
883 |
264 |
863 |
123 |
346 |
713 |
1440 |
185 |
367 |
484 |
1327 |
103 |
515 |
109 |
275 |
132 |
214 |
167 |
870 |
354 |
723 |
|
| Botswana |
40 |
12 |
7 |
|
5 |
6 |
4 |
|
2 |
1 |
14 |
8 |
1 |
|
7 |
7 |
2 |
1 |
2 |
|
2 |
|
6 |
2 |
2 |
1 |
|
| Cameroon |
1 |
|
1 |
|
1 |
|
|
|
|
|
|
|
|
|
|
|
|
|
|
|
|
|
|
|
|
|
|
| Chad |
1 |
|
|
|
|
|
|
|
|
|
1 |
|
|
|
|
|
|
|
|
|
|
|
|
|
|
|
|
| Comoros |
1 |
|
|
|
1 |
|
|
|
|
|
|
|
|
|
|
|
|
|
|
|
|
|
|
|
|
|
|
| Djibouti |
1 |
|
|
1 |
|
|
|
|
|
|
|
|
|
|
|
|
|
|
|
|
|
|
|
|
1 |
|
|
| Eritrea |
|
|
|
|
|
|
|
|
|
|
|
|
|
|
|
|
|
|
|
|
|
|
|
|
|
1 |
|
| Ethiopia |
2 |
|
1 |
|
2 |
|
|
|
|
|
|
|
|
|
|
|
|
|
|
|
|
|
|
|
1 |
|
|
| Ghana |
1 |
|
2 |
|
|
|
|
|
|
|
|
|
|
|
|
|
|
|
|
|
|
|
1 |
|
1 |
1 |
|
| Guinea |
|
|
|
|
|
|
|
|
|
|
|
|
|
|
|
|
|
|
|
|
|
|
|
|
1 |
|
|
| Ivory Coast |
|
1 |
|
|
|
|
|
|
|
1 |
1 |
|
|
|
|
|
|
|
|
|
|
|
|
|
|
|
|
| Kenya |
|
|
|
|
1 |
|
1 |
|
|
|
1 |
|
|
|
|
|
|
|
|
|
|
|
|
|
|
1 |
|
| Mali |
|
|
|
|
|
|
|
|
|
|
1 |
|
|
|
|
|
|
|
|
|
|
|
|
|
|
|
|
| Nigeria |
20 |
4 |
55 |
5 |
6 |
4 |
10 |
3 |
10 |
1 |
24 |
13 |
8 |
1 |
27 |
7 |
6 |
|
2 |
4 |
5 |
|
11 |
3 |
29 |
4 |
|
| Senegal |
|
|
1 |
|
|
|
|
|
|
|
|
|
|
|
|
|
|
|
|
|
|
|
|
|
|
|
|
| Sierra Leone |
|
|
1 |
1 |
|
|
|
|
|
|
|
|
|
|
1 |
|
|
|
|
|
|
|
|
|
|
|
|
| Somalia |
2 |
7 |
1 |
|
1 |
1 |
|
|
|
|
1 |
2 |
|
1 |
|
1 |
1 |
|
|
1 |
|
|
|
|
1 |
1 |
|
| South Africa |
|
|
7 |
|
1 |
|
|
|
|
|
10 |
5 |
|
|
|
|
|
|
|
|
|
|
|
|
|
|
|
| Tanzania |
|
|
1 |
|
|
|
|
|
|
|
1 |
|
|
|
|
|
|
|
|
|
|
|
|
|
|
|
|
| Togo |
|
|
1 |
|
|
|
|
|
|
|
|
|
|
|
|
|
|
|
|
|
|
|
|
|
|
|
|
| Uganda |
|
|
1 |
|
|
|
|
|
|
|
|
|
|
|
|
|
|
|
|
|
|
|
|
|
|
|
|
| SS African countries |
69 |
24 |
79 |
7 |
18 |
11 |
15 |
3 |
12 |
3 |
54 |
28 |
9 |
2 |
35 |
15 |
9 |
1 |
4 |
5 |
7 |
0 |
18 |
5 |
36 |
9 |
|
| Belgium |
1 |
|
2 |
|
|
|
1 |
|
|
|
|
|
|
|
|
|
|
|
|
|
|
|
|
|
|
|
|
| Bosnia |
|
|
|
|
|
|
1 |
|
|
|
1 |
|
|
|
|
|
|
|
|
|
1 |
|
|
|
|
|
|
| Czech Republic |
|
|
|
|
|
|
|
|
|
|
|
|
|
|
|
|
|
|
|
|
|
|
|
|
1 |
|
|
| Denmark |
1 |
|
4 |
|
|
|
|
|
|
|
|
|
|
|
|
|
|
|
|
|
|
|
|
|
|
|
|
| Finland |
|
|
|
|
|
|
|
|
|
|
1 |
|
|
|
|
|
|
|
|
|
|
|
|
|
|
|
|
| France |
8 |
4 |
8 |
1 |
|
1 |
|
|
|
|
9 |
3 |
|
|
2 |
|
|
|
|
|
|
|
|
|
|
|
|
| Germany |
2 |
|
9 |
2 |
3 |
1 |
2 |
|
|
|
7 |
1 |
|
|
1 |
|
|
|
|
|
|
|
|
|
1 |
|
|
| Greece |
9 |
2 |
5 |
1 |
|
|
|
|
|
|
2 |
|
|
|
|
|
|
|
|
|
|
|
|
|
|
|
|
| Hungary |
|
|
|
|
|
|
|
|
|
|
|
|
1 |
|
|
|
|
|
|
|
|
|
|
|
|
|
|
| Ireland |
1 |
|
6 |
|
1 |
|
|
|
1 |
|
3 |
|
1 |
|
|
|
|
|
|
|
|
|
|
|
|
|
|
| Italy |
|
|
4 |
|
1 |
|
|
|
|
|
1 |
|
|
|
|
|
|
|
|
|
|
|
|
|
|
|
|
| Netherlands |
|
|
2 |
2 |
|
|
|
|
1 |
|
|
1 |
|
|
1 |
|
|
|
|
|
|
|
|
|
|
|
|
| Norway |
|
|
1 |
|
|
|
|
|
|
|
|
|
|
|
|
|
|
|
|
|
|
|
1 |
|
|
|
|
| Poland |
1 |
|
|
|
|
|
|
|
|
|
|
|
|
|
|
|
|
|
|
|
|
|
|
|
|
|
|
| Romania |
|
1 |
1 |
1 |
|
|
1 |
|
|
|
|
|
|
|
2 |
|
|
|
|
|
2 |
|
|
|
|
|
|
| Russia |
1 |
3 |
3 |
|
|
|
5 |
3 |
2 |
2 |
3 |
|
|
|
3 |
|
1 |
|
1 |
1 |
|
|
1 |
1 |
2 |
|
|
| Spain |
|
|
2 |
|
|
|
|
|
|
|
1 |
|
|
|
|
|
|
|
|
|
|
|
|
|
|
|
|
| Sweden |
1 |
1 |
3 |
|
1 |
|
|
|
|
|
|
1 |
|
|
|
|
|
|
|
|
|
|
|
|
|
|
|
| UK |
20 |
8 |
48 |
4 |
23 |
3 |
4 |
|
2 |
|
49 |
9 |
|
|
4 |
|
1 |
|
1 |
|
3 |
|
1 |
|
5 |
|
|
| Ukraine |
|
|
|
|
|
|
|
|
|
|
|
1 |
|
|
|
|
|
|
|
|
|
|
|
|
|
1 |
|
| Europe |
45 |
19 |
98 |
11 |
29 |
5 |
14 |
3 |
6 |
2 |
77 |
16 |
2 |
0 |
13 |
0 |
2 |
0 |
2 |
1 |
6 |
0 |
3 |
1 |
9 |
1 |
|
| Argentina |
2 |
1 |
|
|
|
|
|
|
|
|
|
|
|
|
|
|
|
|
|
|
|
|
|
|
|
|
|
| Canada |
21 |
6 |
74 |
9 |
6 |
4 |
2 |
|
2 |
|
30 |
7 |
1 |
|
4 |
|
|
|
|
|
7 |
|
1 |
|
2 |
|
|
| Colombia |
|
|
1 |
|
|
|
|
|
|
|
|
|
|
|
|
|
|
|
|
|
|
|
|
|
|
|
|
| Cuba |
33 |
28 |
2 |
3 |
|
|
|
|
3 |
1 |
19 |
12 |
|
1 |
3 |
3 |
|
|
7 |
3 |
3 |
2 |
6 |
8 |
36 |
20 |
|
| USA |
9 |
11 |
66 |
5 |
7 |
|
3 |
|
1 |
1 |
33 |
5 |
1 |
|
1 |
|
|
|
|
|
4 |
|
2 |
|
1 |
1 |
|
| Venezuela |
|
1 |
|
|
|
|
|
|
|
|
|
|
|
|
|
|
|
|
|
|
|
|
|
|
|
|
|
| Americas |
65 |
47 |
143 |
17 |
13 |
4 |
5 |
0 |
6 |
2 |
82 |
24 |
2 |
1 |
8 |
3 |
0 |
0 |
7 |
3 |
14 |
2 |
9 |
8 |
39 |
21 |
|
| Australia |
7 |
1 |
24 |
2 |
|
|
|
|
|
|
5 |
1 |
|
|
1 |
|
|
|
|
|
|
|
|
|
1 |
|
|
| New Zealand |
|
|
2 |
|
1 |
|
|
|
|
|
|
1 |
|
|
|
1 |
|
|
|
|
|
|
|
|
|
|
|
| Oceania |
7 |
1 |
26 |
2 |
1 |
0 |
0 |
0 |
0 |
0 |
5 |
2 |
0 |
0 |
1 |
1 |
0 |
0 |
0 |
0 |
0 |
0 |
0 |
0 |
1 |
0 |
|
| Unspecified |
6 |
7 |
5 |
2 |
2 |
3 |
|
|
|
|
4 |
2 |
|
|
1 |
1 |
2 |
|
1 |
|
|
2 |
|
2 |
2 |
1 |
|
| Total foreign workers |
4,764 |
3,786 |
3,230 |
2,403 |
1,356 |
1,702 |
1,497 |
1,647 |
720 |
697 |
3,585 |
2,925 |
955 |
744 |
2,039 |
2,171 |
504 |
714 |
791 |
566 |
929 |
652 |
986 |
1,305 |
1,284 |
1,228 |
|
| Total workers |
271,025 |
178,375 |
67,703 |
50,259 |
39,930 |
30,042 |
34,841 |
28,192 |
18,648 |
14,675 |
104,983 |
77,104 |
12,154 |
7,839 |
50,156 |
47,303 |
13,135 |
11,737 |
17,469 |
11,340 |
20,424 |
15,487 |
19,812 |
12,286 |
29,264 |
25,096 |
|
Source: Ministry of Human Resources and Social Development (MHRSD)
ANNEXED NOTE
- 1. Technical Notes and Definitions
Data do not include employees in the security and military sectors.
No metadata available. The administrative records used as a source of data is unmentioned.
The original dataset’s title (“Manpower in the Public sector during year 2020”), likely refers to Civil Service’s employees. When compared to the results of GAStat Labour Force Survey (LFS) for Q4 of 2022, the totals of foreign workers in the “public” sector (43,027 in 2022, see table) were closer to the LFS’s figures of foreign workers in the Civil Service (44,065), than to the figures of foreign workers in the government sector (158,000). It is thus likely that MHRSD’s figures of workers in the “Public” sector are referring to Civil service workers.
Saudi and non-Saudi workers subscribing to the Social Insurance (GOSI) and working for the public sector (non-civil servants) are thus not included in the figures of workers in the government sector.
- 2. Institution which provides data
Saudi Arabia: Ministry of Human Resources and Social Development (MHRSD)
- 3. Data availability
Ministry of Human Resources and Social Development (MHRSD).
Datasets: “Workforce in the Government sector during year 2022” parts 1; 2; and 3, by administrative region.
https://od.data.gov.sa/Data/en/dataset/the-workforce-in-the-government-sector-during-the-year-2022
Datasets present data at the level of individuals, and indicate the worker’s gender, country of citizenship, age in single years, education level, educational speciality, the type of staff to which the employee belongs (education; health; employee; contract worker and others), location of the post (cities) and administrative region.
The dataset is only available in the Saudi government Open Data Portal – DATA.GOV.SA , Labor data.
Datasets are in Arabic only.
Last date of access: May 2023.
GLMM and GRC cannot guarantee that the link to access the source will not change; that the information will not be removed from the website it was obtained from; that no geo-blockages will be imposed; or that the information will not be available for any another reason.
Keywords: Saudi Arabia, India, Indonesia, Pakistan, Bangladesh, Philippines, Nepal, Sri Lanka, Afghanistan, Iran, China, Thailand, Korea (South), Egypt, Iraq, Jordan, Lebanon, Morocco, Palestine, Sudan, Tunisia, Turkey, Eritrea, Ethiopia, Europe, North America, Asia, Africa, Oceania, USA, Arab Countries, Labour Market, Employment, Female Employment, National & Foreign Labour, National Labour, Foreign Labour
| |
Males |
Females |
Total |
| Saudi Arabia |
676,904 |
489,195 |
1,166,099 |
| Algeria |
188 |
47 |
235 |
| Bahrain |
3 |
2 |
5 |
| Egypt |
7,667 |
3,741 |
11,408 |
| Iraq |
5 |
4 |
9 |
| Jordan |
1,193 |
302 |
1,495 |
| Kuwait |
1 |
5 |
6 |
| Lebanon |
35 |
10 |
45 |
| Libya |
2 |
2 |
4 |
| Mauritania |
18 |
1 |
19 |
| Morocco |
49 |
25 |
74 |
| Oman |
0 |
1 |
1 |
| Palestine |
76 |
24 |
100 |
| Sudan |
4,517 |
4,045 |
8,562 |
| Syria |
1,470 |
238 |
1,708 |
| Tunisia |
930 |
586 |
1,516 |
| UAE |
0 |
1 |
1 |
| Yemen |
502 |
81 |
583 |
| Arab countries |
16,656 |
9,115 |
25,771 |
| Afghanistan |
6 |
1 |
7 |
| Azerbaijan |
4 |
0 |
4 |
| Bangladesh |
286 |
78 |
364 |
| Brunei |
1 |
0 |
1 |
| China |
9 |
8 |
17 |
| India |
2,216 |
5,103 |
7,319 |
| Indonesia |
26 |
144 |
170 |
| Japan |
2 |
0 |
2 |
| Kazakhstan |
2 |
0 |
2 |
| Malaysia |
20 |
79 |
99 |
| Nepal |
2 |
0 |
2 |
| Pakistan |
1,912 |
836 |
2,748 |
| Philippines |
325 |
4,837 |
5,162 |
| Singapore |
2 |
0 |
2 |
| South Korea |
5 |
3 |
8 |
| Sri Lanka |
5 |
4 |
9 |
| Thailand |
0 |
1 |
1 |
| Turkey |
28 |
1 |
29 |
| Uzbekistan |
5 |
0 |
5 |
| Asian countries |
4,856 |
11,095 |
15,951 |
| Botswana |
94 |
38 |
132 |
| Cameroon |
3 |
0 |
3 |
| Chad |
2 |
0 |
2 |
| Comoros |
2 |
0 |
2 |
| Djibouti |
2 |
1 |
3 |
| Eritrea |
0 |
1 |
1 |
| Ethiopia |
6 |
0 |
6 |
| Ghana |
5 |
1 |
6 |
| Guinea |
1 |
0 |
1 |
| Ivory Coast |
1 |
2 |
3 |
| Kenya |
3 |
1 |
4 |
| Mali |
1 |
0 |
1 |
| Nigeria |
213 |
49 |
262 |
| Senegal |
1 |
0 |
1 |
| Sierra Leone |
2 |
1 |
3 |
| Somalia |
7 |
14 |
21 |
| South Africa |
18 |
5 |
23 |
| Tanzania |
2 |
0 |
2 |
| Togo |
1 |
0 |
1 |
| Uganda |
1 |
0 |
1 |
| SS African countries |
365 |
113 |
478 |
| Belgium |
4 |
0 |
4 |
| Bosnia |
3 |
0 |
3 |
| Czech Republic |
1 |
0 |
1 |
| Denmark |
5 |
0 |
5 |
| Finland |
1 |
0 |
1 |
| France |
27 |
9 |
36 |
| Germany |
25 |
4 |
29 |
| Greece |
16 |
3 |
19 |
| Hungary |
1 |
0 |
1 |
| Ireland |
13 |
0 |
13 |
| Italy |
6 |
0 |
6 |
| Netherlands |
4 |
3 |
7 |
| Norway |
2 |
0 |
2 |
| Poland |
1 |
0 |
1 |
| Romania |
6 |
2 |
8 |
| Russia |
22 |
10 |
32 |
| Spain |
3 |
0 |
3 |
| Sweden |
5 |
2 |
7 |
| UK |
161 |
24 |
185 |
| Ukraine |
0 |
2 |
2 |
| Europe |
306 |
59 |
365 |
| Argentina |
2 |
1 |
3 |
| Canada |
150 |
26 |
176 |
| Colombia |
1 |
0 |
1 |
| Cuba |
112 |
81 |
193 |
| USA |
128 |
23 |
151 |
| Venezuela |
0 |
1 |
1 |
| Americas |
393 |
132 |
525 |
| Australia |
38 |
4 |
42 |
| New Zealand |
3 |
2 |
5 |
| Oceania |
41 |
6 |
47 |
| Unspecified |
23 |
20 |
43 |
| Total foreign workers |
22,640 |
20,540 |
43,180 |
| Total workers gov. sector |
699,544 |
509,735 |
1,209,279 |
Source: Ministry of Human Resources and Social Development (MHRSD)
ANNEXED NOTE
- 1. Technical Notes and Definitions
Data do not include employees in the security and military sectors.
No metadata available. The administrative records used as a source of data is unmentioned.
The original dataset’s title (“Manpower in the Public sector during year 2020”), likely refers to Civil Service’s employees. When compared to the results of GAStat Labour Force Survey (LFS) for Q4 of 2022, the totals of foreign workers in the “public” sector (43,027 in 2022, see table) were closer to the LFS’s figures of foreign workers in the Civil Service (44,065), than to the figures of foreign workers in the government sector (158,000). It is thus likely that MHRSD’s figures of workers in the “Public” sector are referring to Civil service workers.
Saudi and non-Saudi workers subscribing to the Social Insurance (GOSI) and working for the public sector (non-civil servants) are thus not included in the figures of workers in the government sector.
- 2. Institution which provides data
Saudi Arabia: Ministry of Human Resources and Social Development (MHRSD)
- 3. Data availability
Ministry of Human Resources and Social Development (MHRSD).
Datasets: “Workforce in the Government sector during year 2022” parts 1; 2; and 3, by administrative region.
https://od.data.gov.sa/Data/en/dataset/the-workforce-in-the-government-sector-during-the-year-2022
Datasets present data at the level of individuals, and indicate the worker’s gender, country of citizenship, age in single years, education level, educational speciality, the type of staff to which the employee belongs (education; health; employee; contract worker and others), location of the post (cities) and administrative region.
The dataset is only available in the Saudi government Open Data Portal – DATA.GOV.SA , Labor data.
Datasets are in Arabic only.
Last date of access: May 2023.
GLMM and GRC cannot guarantee that the link to access the source will not change; that the information will not be removed from the website it was obtained from; that no geo-blockages will be imposed; or that the information will not be available for any another reason.
Keywords: Saudi Arabia, India, Indonesia, Pakistan, Bangladesh, Philippines, Nepal, Sri Lanka, Afghanistan, Iran, China, Thailand, Korea (South), Egypt, Iraq, Jordan, Lebanon, Morocco, Palestine, Sudan, Tunisia, Turkey, Eritrea, Ethiopia, Europe, North America, Asia, Africa, Oceania, USA, Arab Countries, Labour Market, Employment, Female Employment, National & Foreign Labour, National Labour, Foreign Labour
| |
Al-Baha |
Northern Borders |
Al-Jawf |
Medina |
Al-Qassim |
Riyadh |
Eastern Province |
‘Asir |
Ha’il |
Jizan |
Mecca |
Najran |
Tabuk |
Saudi Arabia |
| Saudi Arabia |
23,654 |
18,294 |
27,452 |
66,914 |
59,889 |
440,850 |
112,329 |
93,249 |
31,906 |
51,848 |
175,577 |
29,807 |
34,330 |
1,166,099 |
| Algeria |
|
10 |
16 |
16 |
8 |
67 |
38 |
30 |
8 |
7 |
24 |
4 |
7 |
235 |
| Bahrain |
|
|
0 |
|
|
|
5 |
|
|
|
|
|
|
5 |
| Egypt |
248 |
374 |
391 |
948 |
940 |
2,434 |
1,239 |
849 |
387 |
530 |
2,253 |
384 |
431 |
11,408 |
| Iraq |
1 |
|
0 |
1 |
|
3 |
1 |
1 |
|
|
2 |
|
|
9 |
| Jordan |
15 |
101 |
49 |
85 |
121 |
315 |
273 |
62 |
87 |
30 |
191 |
58 |
108 |
1,495 |
| Kuwait |
|
|
1 |
1 |
|
1 |
2 |
1 |
|
|
|
|
|
6 |
| Lebanon |
|
1 |
0 |
|
2 |
19 |
10 |
4 |
|
1 |
7 |
|
1 |
45 |
| Libya |
|
|
0 |
|
1 |
2 |
|
|
|
|
1 |
|
|
4 |
| Mauritania |
|
|
2 |
3 |
3 |
3 |
|
2 |
1 |
|
4 |
1 |
|
19 |
| Morocco |
|
2 |
0 |
3 |
2 |
28 |
7 |
7 |
|
2 |
18 |
3 |
2 |
74 |
| Oman |
|
|
0 |
|
|
1 |
|
|
|
|
|
|
|
1 |
| Palestine |
1 |
6 |
1 |
5 |
4 |
38 |
15 |
3 |
2 |
5 |
18 |
2 |
|
100 |
| Sudan |
240 |
366 |
321 |
551 |
648 |
1,712 |
732 |
1,022 |
319 |
628 |
951 |
564 |
508 |
8,562 |
| Syria |
67 |
111 |
129 |
134 |
128 |
333 |
204 |
129 |
86 |
51 |
195 |
57 |
84 |
1,708 |
| Tunisia |
7 |
142 |
39 |
83 |
83 |
369 |
193 |
119 |
24 |
39 |
347 |
18 |
53 |
1,516 |
| UAE |
|
|
0 |
|
|
1 |
|
|
|
|
|
|
|
1 |
| Yemen |
7 |
18 |
1 |
34 |
37 |
87 |
102 |
92 |
3 |
23 |
52 |
117 |
10 |
583 |
| Arab countries |
586 |
1,131 |
950 |
1,864 |
1,977 |
5,413 |
2,821 |
2,321 |
917 |
1,316 |
4,063 |
1,208 |
1,204 |
25,771 |
| Afghanistan |
|
|
0 |
2 |
|
|
2 |
|
|
|
3 |
|
|
7 |
| Azerbaijan |
|
1 |
1 |
|
|
2 |
|
|
|
|
|
|
|
4 |
| Bangladesh |
13 |
4 |
13 |
16 |
14 |
74 |
47 |
50 |
6 |
46 |
44 |
19 |
18 |
364 |
| Brunei |
|
|
0 |
|
|
1 |
|
|
|
|
|
|
|
1 |
| China |
2 |
|
1 |
|
|
|
6 |
1 |
1 |
1 |
5 |
|
|
17 |
| India |
211 |
229 |
183 |
381 |
463 |
1,524 |
1,086 |
933 |
190 |
617 |
895 |
453 |
154 |
7,319 |
| Indonesia |
6 |
6 |
1 |
45 |
9 |
15 |
18 |
21 |
7 |
5 |
28 |
8 |
1 |
170 |
| Japan |
|
|
0 |
|
|
1 |
|
|
|
|
1 |
|
|
2 |
| Kazakhstan |
|
|
0 |
|
|
1 |
1 |
|
|
|
|
|
|
2 |
| Malaysia |
|
1 |
1 |
4 |
3 |
28 |
23 |
3 |
|
1 |
28 |
5 |
2 |
99 |
| Nepal |
|
|
0 |
|
|
|
1 |
|
1 |
|
|
|
|
2 |
| Pakistan |
79 |
167 |
52 |
136 |
262 |
464 |
449 |
235 |
97 |
129 |
477 |
121 |
80 |
2,748 |
| Philippines |
307 |
144 |
132 |
517 |
375 |
724 |
771 |
567 |
167 |
277 |
660 |
430 |
91 |
5,162 |
| Singapore |
|
|
0 |
|
|
1 |
1 |
|
|
|
|
|
|
2 |
| South Korea |
|
|
0 |
|
1 |
2 |
3 |
|
|
|
2 |
|
|
8 |
| Sri Lanka |
|
|
0 |
|
|
2 |
3 |
1 |
|
|
2 |
1 |
|
9 |
| Thailand |
|
|
0 |
|
|
|
|
|
|
|
1 |
|
|
1 |
| Turkey |
|
|
0 |
2 |
|
8 |
11 |
|
|
1 |
7 |
|
|
29 |
| Uzbekistan |
|
|
0 |
5 |
|
|
|
|
|
|
|
|
|
5 |
| Asian countries |
618 |
552 |
384 |
1,108 |
1,127 |
2,847 |
2,422 |
1,811 |
469 |
1,077 |
2,153 |
1,037 |
346 |
15,521 |
| Botswana |
3 |
1 |
2 |
11 |
4 |
52 |
7 |
14 |
3 |
3 |
22 |
8 |
2 |
132 |
| Cameroon |
|
|
0 |
1 |
|
1 |
1 |
|
|
|
|
|
|
3 |
| Chad |
|
|
0 |
|
|
1 |
|
|
|
|
1 |
|
|
2 |
| Comoros |
|
|
0 |
1 |
|
1 |
|
|
|
|
|
|
|
2 |
| Djibouti |
|
|
0 |
|
|
1 |
1 |
|
|
1 |
|
|
|
3 |
| Eritrea |
|
|
0 |
|
|
|
|
|
|
1 |
|
|
|
1 |
| Ethiopia |
|
|
0 |
2 |
|
2 |
1 |
|
|
1 |
|
|
|
6 |
| Ghana |
|
|
0 |
|
|
1 |
2 |
|
|
2 |
|
1 |
|
6 |
| Guinea |
|
|
0 |
|
|
|
|
|
|
1 |
|
|
|
1 |
| Ivory Coast |
|
|
0 |
|
|
1 |
|
|
1 |
|
1 |
|
|
3 |
| Kenya |
|
|
0 |
1 |
1 |
|
|
|
|
1 |
1 |
|
|
4 |
| Mali |
|
|
0 |
|
|
|
|
|
|
|
1 |
|
|
1 |
| Nigeria |
6 |
9 |
6 |
10 |
13 |
24 |
60 |
34 |
11 |
33 |
37 |
14 |
5 |
262 |
| Senegal |
|
|
0 |
|
|
|
1 |
|
|
|
|
|
|
1 |
| Sierra Leone |
|
|
0 |
|
|
|
2 |
1 |
|
|
|
|
|
3 |
| Somalia |
1 |
1 |
1 |
2 |
|
9 |
1 |
1 |
|
2 |
3 |
|
|
21 |
| South Africa |
|
|
0 |
1 |
|
|
7 |
|
|
|
15 |
|
|
23 |
| Tanzania |
|
|
0 |
|
|
|
1 |
|
|
|
1 |
|
|
2 |
| Togo |
|
|
0 |
|
|
|
1 |
|
|
|
|
|
|
1 |
| Uganda |
|
|
0 |
|
|
|
1 |
|
|
|
|
|
|
1 |
| SS African countries |
10 |
11 |
9 |
29 |
18 |
93 |
86 |
50 |
15 |
45 |
82 |
23 |
7 |
478 |
| Belgium |
|
|
0 |
|
1 |
1 |
2 |
|
|
|
|
|
|
4 |
| Bosnia |
|
|
0 |
|
1 |
|
|
|
|
|
1 |
|
1 |
3 |
| Czech Republic |
|
|
0 |
|
|
|
|
|
|
1 |
|
|
|
1 |
| Denmark |
|
|
0 |
|
|
1 |
4 |
|
|
|
|
|
|
5 |
| Finland |
|
|
0 |
|
|
|
|
|
|
|
1 |
|
|
1 |
| France |
|
|
0 |
1 |
|
12 |
9 |
2 |
|
|
12 |
|
|
36 |
| Germany |
|
|
0 |
4 |
2 |
2 |
11 |
1 |
|
1 |
8 |
|
|
29 |
| Greece |
|
|
0 |
|
|
11 |
6 |
|
|
|
2 |
|
|
19 |
| Hungary |
|
1 |
0 |
|
|
|
|
|
|
|
|
|
|
1 |
| Ireland |
|
1 |
0 |
1 |
|
1 |
6 |
|
1 |
|
3 |
|
|
13 |
| Italy |
|
|
0 |
1 |
|
|
4 |
|
|
|
1 |
|
|
6 |
| Netherlands |
|
|
0 |
|
|
|
4 |
1 |
1 |
|
1 |
|
|
7 |
| Norway |
|
|
0 |
|
|
|
1 |
|
|
|
|
1 |
|
2 |
| Poland |
|
|
0 |
|
|
1 |
|
|
|
|
|
|
|
1 |
| Romania |
|
|
0 |
|
1 |
1 |
2 |
2 |
|
|
|
|
2 |
8 |
| Russia |
1 |
|
2 |
|
8 |
4 |
3 |
3 |
4 |
2 |
3 |
2 |
|
32 |
| Spain |
|
|
0 |
|
|
|
2 |
|
|
|
1 |
|
|
3 |
| Sweden |
|
|
0 |
1 |
|
2 |
3 |
|
|
|
1 |
|
|
7 |
| UK |
1 |
|
1 |
26 |
4 |
28 |
52 |
4 |
2 |
5 |
58 |
1 |
3 |
185 |
| Ukraine |
|
|
0 |
|
|
|
|
|
|
1 |
1 |
|
|
2 |
| Europe |
2 |
2 |
3 |
34 |
17 |
64 |
109 |
13 |
8 |
10 |
93 |
4 |
6 |
365 |
| Argentina |
|
|
0 |
|
|
3 |
|
|
|
|
|
|
|
3 |
| Canada |
|
1 |
0 |
10 |
2 |
27 |
83 |
4 |
2 |
2 |
37 |
1 |
7 |
176 |
| Colombia |
|
|
0 |
|
|
|
1 |
|
|
|
|
|
|
1 |
| Cuba |
|
1 |
10 |
|
|
61 |
5 |
6 |
4 |
56 |
31 |
14 |
5 |
193 |
| USA |
|
1 |
0 |
7 |
3 |
20 |
71 |
1 |
2 |
2 |
38 |
2 |
4 |
151 |
| Venezuela |
|
|
|
|
|
1 |
|
|
|
|
|
|
|
1 |
| Americas |
0 |
3 |
10 |
17 |
5 |
112 |
160 |
11 |
8 |
60 |
106 |
17 |
16 |
525 |
| Australia |
|
|
0 |
|
|
8 |
26 |
1 |
|
1 |
6 |
|
|
42 |
| New Zealand |
|
|
0 |
1 |
|
|
2 |
1 |
|
|
1 |
|
|
5 |
| Oceania |
0 |
0 |
0 |
1 |
0 |
8 |
28 |
2 |
0 |
1 |
7 |
0 |
0 |
47 |
| Unspecified |
2 |
|
1 |
5 |
|
13 |
7 |
2 |
|
3 |
6 |
2 |
2 |
43 |
| Total foreign workers |
1,218 |
1,699 |
1,357 |
3,058 |
3,144 |
8,550 |
5,633 |
4,210 |
1,417 |
2,512 |
6,510 |
2,291 |
1,581 |
43,180 |
| Total workers |
24,872 |
19,993 |
28,809 |
69,972 |
63,033 |
449,400 |
117,962 |
97,459 |
33,323 |
54,360 |
182,087 |
32,098 |
35,911 |
1,209,279 |
Source: Ministry of Human Resources and Social Development (MHRSD)
ANNEXED NOTE
- 1. Technical Notes and Definitions
Data do not include employees in the security and military sectors.
No metadata available. The administrative records used as a source of data is unmentioned.
The original dataset’s title (“Manpower in the Public sector during year 2020”), likely refers to Civil Service’s employees. When compared to the results of GAStat Labour Force Survey (LFS) for Q4 of 2022, the totals of foreign workers in the “public” sector (43,027 in 2022, see table) were closer to the LFS’s figures of foreign workers in the Civil Service (44,065), than to the figures of foreign workers in the government sector (158,000). It is thus likely that MHRSD’s figures of workers in the “Public” sector are referring to Civil service workers.
Saudi and non-Saudi workers subscribing to the Social Insurance (GOSI) and working for the public sector (non-civil servants) are thus not included in the figures of workers in the government sector.
- 2. Institution which provides data
Saudi Arabia: Ministry of Human Resources and Social Development (MHRSD)
- 3. Data availability
Ministry of Human Resources and Social Development (MHRSD).
Datasets: “Workforce in the Government sector during year 2022” parts 1; 2; and 3, by administrative region.
https://od.data.gov.sa/Data/en/dataset/the-workforce-in-the-government-sector-during-the-year-2022
Datasets present data at the level of individuals, and indicate the worker’s gender, country of citizenship, age in single years, education level, educational speciality, the type of staff to which the employee belongs (education; health; employee; contract worker and others), location of the post (cities) and administrative region.
The dataset is only available in the Saudi government Open Data Portal – DATA.GOV.SA , Labor data.
Datasets are in Arabic only.
Last date of access: May 2023.
GLMM and GRC cannot guarantee that the link to access the source will not change; that the information will not be removed from the website it was obtained from; that no geo-blockages will be imposed; or that the information will not be available for any another reason.
Keywords: Saudi Arabia, India, Indonesia, Pakistan, Bangladesh, Philippines, Nepal, Sri Lanka, Afghanistan, Iran, China, Thailand, Korea (South), Egypt, Iraq, Jordan, Lebanon, Morocco, Palestine, Sudan, Tunisia, Turkey, Eritrea, Ethiopia, Europe, North America, Asia, Africa, Oceania, USA, Arab Countries, Labour Market, Employment, Female Employment, National & Foreign Labour, National Labour, Foreign Labour
|
2013 |
2014 |
2015 |
2016 |
2017 |
2018 |
2019 |
2020 |
2021 |
2022 |
| Section (14) Temporary residence |
54,422 |
50,814 |
48,696 |
5,319 |
5,424 |
7,913 |
5,277 |
586,851 |
19,003 |
12,911 |
| Section (17) Employment government sector |
1,111 |
1,032 |
1,504 |
2,440 |
1,830 |
2,501 |
2,928 |
13,976 |
6,380 |
4,769 |
| Section (18) Employment private sector |
42,693 |
45,312 |
45,717 |
16,413 |
16,141 |
15,734 |
22,161 |
276,319 |
16,853 |
17,376 |
| Section (19) Freelancing |
15 |
7 |
6 |
4 |
8 |
10 |
8 |
28 |
4 |
5 |
| Section (20) Employment domestic sector |
26,112 |
67,335 |
76,865 |
4,077 |
3,617 |
4,348 |
3,724 |
94,084 |
5,533 |
5,871 |
| Section (22) Family reunion |
12,437 |
9,634 |
6,958 |
7,886 |
12,546 |
12,262 |
12,306 |
63,935 |
11,136 |
15,131 |
| Section (23) Studying |
15 |
61 |
142 |
2 |
190 |
220 |
257 |
119 |
47 |
112 |
| Section (24) Self-sponsorship |
48 |
50 |
61 |
110 |
153 |
116 |
111 |
406 |
45 |
104 |
| Total |
136,853 |
174,245 |
179,949 |
36,251 |
39,909 |
43,104 |
46,772 |
1,035,718 |
59,001 |
56,279 |
Source: Central Statistical Bureau, Migration Statistics Bulletin, given years.
ANNEXED NOTE
- Definitions
Ministry of Interior’s (Directorate of Migration’s) annual records of residency permits granted to foreign residents by type/ purpose of permit, sex and regional origin of holder.
The present figures include permits delivered for all purposes of stay in Kuwait:
1- Labour in all sectors: governmental (n°17); private sector (n°18); business (n°19) and domestic (n°20) sectors
2- Residence: temporary residence (n°14); as family dependent (permit n°22); for the purpose of studying (n°23) and for self-sponsorship (n°24).
A residency permit is cancelled upon the holder’s end of service and departure from Kuwait, or if the holder stays abroad for more than 6 months.
Residency procedures do not apply to GCC nationals and to Bidouns (stateless residents of Kuwait).
The table thus excludes the Bidouns, the non-Kuwaiti GCC citizens and those in irregular situation.
- Institution which provides data
Central Statistical Bureau (CSB), Ministry of Planning.
- Period of data coverage
December 31st, given years.
- Data availability
The present data is taken from the “Migration Statistics” reports, published annually by the CSB.
The report (in Arabic and English, PDF format with Excel tables) is available on CSB’s website (Population Statistics, then Migration Statistics)
https://www.csb.gov.kw/Pages/Statistics_en?ID=56&ParentCatID=1
https://www.csb.gov.kw/Pages/Statistics?ID=56&ParentCatID=1
Date of access: April 2023
GLMM and GRC cannot guarantee that the link to access the source will not change; that the information will not be removed from the website it was obtained from; that no geo-blockages will be imposed; or that the information will not be available for any another reason.
Keywords: Kuwait, Foreign Population, Employment, Legal Document, Residence Conditions
| |
2013 |
2014 |
2015 |
2016 |
2017 |
2018 |
2019 |
2020 |
2021 |
2022 |
| Arab countries |
38,123 |
36,757 |
34,342 |
15,569 |
19,673 |
21,015 |
20,139 |
337,674 |
21,199 |
23,468 |
| Non‐Arab Asian countries |
87,582 |
122,204 |
129,603 |
18,324 |
18,210 |
20,109 |
24,098 |
671,035 |
35,124 |
30,391 |
| Non‐Arab African countries |
6,252 |
11,863 |
12,924 |
786 |
648 |
661 |
764 |
18,140 |
1,023 |
871 |
| Europe |
1,325 |
1,011 |
842 |
614 |
562 |
478 |
654 |
3,094 |
593 |
516 |
| North America |
3,289 |
2,194 |
2,079 |
867 |
694 |
734 |
984 |
4,878 |
912 |
933 |
| South and Central America |
151 |
94 |
73 |
38 |
62 |
68 |
82 |
586 |
86 |
53 |
| Australia and Pacific |
126 |
120 |
83 |
53 |
56 |
38 |
51 |
311 |
63 |
47 |
| Other |
5 |
2 |
3 |
0 |
4 |
1 |
0 |
0 |
1 |
0 |
| Total |
136,853 |
174,245 |
179,949 |
36,251 |
39,909 |
43,104 |
46,772 |
1,035,718 |
59,001 |
56,279 |
Source: Central Statistical Bureau, Migration Statistics Bulletin, given years.
ANNEXED NOTE
- Definitions
Ministry of Interior’s (Directorate of Migration’s) annual records of residency permits granted to foreign residents by type/ purpose of permit, sex and regional origin of holder.
The present figures include permits delivered for all purposes of stay in Kuwait:
1- Labour in all sectors: governmental (n°17); private sector (n°18); business (n°19) and domestic (n°20) sectors
2- Residence: temporary residence (n°14); as family dependent (permit n°22); for the purpose of studying (n°23) and for self-sponsorship (n°24).
A residency permit is cancelled upon the holder’s end of service and departure from Kuwait, or if the holder stays abroad for more than 6 months.
Residency procedures do not apply to GCC nationals and to Bidouns (stateless residents of Kuwait).
The table thus excludes the Bidouns, the non-Kuwaiti GCC citizens and those in irregular situation.
- Institution which provides data
Central Statistical Bureau (CSB), Ministry of Planning.
- Period of data coverage
December 31st, given years.
- Data availability
The present data is taken from the “Migration Statistics” reports, published annually by the CSB.
The report (in Arabic and English, PDF format with Excel tables) is available on CSB’s website (Population Statistics, then Migration Statistics)
https://www.csb.gov.kw/Pages/Statistics_en?ID=56&ParentCatID=1
https://www.csb.gov.kw/Pages/Statistics?ID=56&ParentCatID=1
Date of access: April 2023
GLMM and GRC cannot guarantee that the link to access the source will not change; that the information will not be removed from the website it was obtained from; that no geo-blockages will be imposed; or that the information will not be available for any another reason.
Keywords: Kuwait, Foreign Population, Employment, Legal Document, Residence Conditions
| |
Workers in government sector |
| Saudi Arabia |
1,166,099 |
| Algeria |
235 |
| Bahrain |
5 |
| Egypt |
11,408 |
| Iraq |
9 |
| Jordan |
1,495 |
| Kuwait |
6 |
| Lebanon |
45 |
| Libya |
4 |
| Mauritania |
19 |
| Morocco |
74 |
| Oman |
1 |
| Palestine |
100 |
| Sudan |
8,562 |
| Syria |
1,708 |
| Tunisia |
1,516 |
| UAE |
1 |
| Yemen |
583 |
| Arab countries |
25,771 |
| Afghanistan |
7 |
| Azerbaidjan |
4 |
| Bangladesh |
364 |
| Brunei |
1 |
| China |
17 |
| India |
7,319 |
| Indonesia |
170 |
| Japan |
2 |
| Kazakhstan |
2 |
| Malaysia |
99 |
| Nepal |
2 |
| Pakistan |
2,748 |
| Philippines |
5,162 |
| Singapore |
2 |
| South Korea |
8 |
| Sri Lanka |
9 |
| Thailand |
1 |
| Turkey |
29 |
| Uzbekistan |
5 |
| Asian countries |
15,951 |
| Botswana |
132 |
| Cameroon |
3 |
| Chad |
2 |
| Comoros |
2 |
| Djibouti |
3 |
| Eritrea |
1 |
| Ethiopia |
6 |
| Ghana |
6 |
| Guinea |
1 |
| Ivory Coast |
3 |
| Kenya |
4 |
| Mali |
1 |
| Nigeria |
262 |
| Senegal |
1 |
| Sierra Leone |
3 |
| Somalia |
21 |
| South Africa |
23 |
| Tanzania |
2 |
| Togo |
1 |
| Uganda |
1 |
| SS African countries |
478 |
| Belgium |
4 |
| Bosnia |
3 |
| Czech Republic |
1 |
| Denmark |
5 |
| Finland |
1 |
| France |
36 |
| Germany |
29 |
| Greece |
19 |
| Hungary |
1 |
| Ireland |
13 |
| Italy |
6 |
| Netherlands |
7 |
| Norway |
2 |
| Poland |
1 |
| Romania |
8 |
| Russia |
32 |
| Spain |
3 |
| Sweden |
7 |
| UK |
185 |
| Ukraine |
2 |
| Europe |
365 |
| Argentina |
3 |
| Canada |
176 |
| Colombia |
1 |
| Cuba |
193 |
| USA |
151 |
| Venezuela |
1 |
| Americas |
525 |
| Australia |
42 |
| New Zealand |
5 |
| Oceania |
47 |
| Unspecified |
43 |
| Total foreign workers |
43,180 |
| Total workers |
1,209,279 |
Source: Ministry of Human Resources and Social Development (MHRSD)
ANNEXED NOTE
- Technical Notes and Definitions
Data do not include employees in the security and military sectors.
No metadata available. The administrative records used as a source of data is unmentioned.
The original dataset’s title (“Manpower in the Public sector during year 2020”), likely refers to Civil Service’s employees.
When compared to the results of GAStat Labour Force Survey (LFS) for Q4 of 2022, the totals of foreign workers in the “public” sector (43,027 in 2022, see table) were closer to the LFS’s figures of foreign workers in the Civil Service (44,065), than to the figures of foreign workers in the government sector (158,000). It is thus likely that MHRSD’s figures of workers in the “Public” sector are referring to Civil service workers.
Saudi and non-Saudi workers subscribing to the Social Insurance (GOSI) and working for the public sector (non-civil servants) are thus not included in the figures of workers in the government sector.
- Institution which provides data
Saudi Arabia: Ministry of Human Resources and Social Development (MHRSD)
- Data availability
Ministry of Human Resources and Social Development (MHRSD).
Datasets: “Workforce in the Government sector during year 2022” parts 1; 2; and 3, by administrative region.
https://od.data.gov.sa/Data/en/dataset/the-workforce-in-the-government-sector-during-the-year-2022
Datasets present data at the level of individuals, and indicate the worker’s gender, country of citizenship, age in single years, education level, educational speciality, the type of staff to which the employee belongs (education; health; employee; contract worker and others), location of the post (cities) and administrative region.
The dataset is only available in the Saudi government Open Data Portal – DATA.GOV.SA , Labor data.
Datasets are in Arabic only.
Last date of access: May 2023.
GLMM and GRC cannot guarantee that the link to access the source will not change; that the information will not be removed from the website it was obtained from; that no geo-blockages will be imposed; or that the information will not be available for any another reason.
Keywords: Saudi Arabia, India, Indonesia, Pakistan, Bangladesh, Philippines, Nepal, Sri Lanka, Afghanistan, Iran, China, Thailand, Korea (South), Egypt, Iraq, Jordan, Lebanon, Morocco, Palestine, Sudan, Tunisia, Turkey, Eritrea, Ethiopia, Europe, North America, Asia, Africa, Oceania, USA, Arab Countries, Labour Market, Employment, National & Foreign Labour, National Labour, Foreign Labour
| |
2019 |
2020 |
2021 |
2022 |
| |
Males |
Females |
Total |
Males |
Females |
Total |
Males |
Females |
Total |
Males |
Females |
Total |
| Arab countries |
3,403 |
187 |
3,590 |
3,210 |
173 |
3,383 |
3,204 |
158 |
3,362 |
3,612 |
151 |
3,763 |
| Non‐Arab Asian countries |
347,133 |
347,565 |
694,698 |
321,707 |
317,569 |
639,276 |
289,284 |
281,573 |
570,857 |
341,180 |
391,139 |
732,319 |
| Non‐Arab African countries |
3,268 |
29,812 |
33,080 |
2,722 |
21,959 |
24,681 |
2,297 |
14,841 |
17,138 |
2,690 |
14,383 |
17,073 |
| Europe |
2 |
1 |
3 |
1 |
3 |
4 |
2 |
4 |
6 |
1 |
3 |
4 |
| North America |
0 |
0 |
0 |
0 |
0 |
0 |
0 |
0 |
0 |
0 |
0 |
0 |
| South and Central America |
4 |
0 |
4 |
4 |
0 |
4 |
4 |
0 |
4 |
4 |
1 |
5 |
| Australia and Pacific |
0 |
1 |
1 |
1 |
1 |
2 |
1 |
0 |
1 |
1 |
0 |
1 |
| Other |
0 |
0 |
0 |
0 |
0 |
0 |
0 |
0 |
0 |
0 |
0 |
0 |
| Total |
353,810 |
377,566 |
731,376 |
327,645 |
339,705 |
667,350 |
294,792 |
296,576 |
591,368 |
347,488 |
405,677 |
753,165 |
Source: Central Statistical Bureau, Migration Statistics Bulletin, given years.
ANNEXED NOTE
- Definitions
Ministry of Interior’s (Directorate of Migration’s) annual records of residency permits granted to foreign residents by type/ purpose of permit, sex and regional origin of holder.
Data presented in the table are stock data: non-national residents holding a residence permit on December 31st, the given year (residencies delivered for the first time a given year+residencies renewed that year).
Residencies are valid for 1 to 5 years.
The present figures include permits delivered for the purpose of working in the domestic sector in Kuwait (as cleaner, driver, cook, domestic gardener, shepherd, nannie, etc.).
Residency procedures do not apply to GCC nationals and to Bidouns (stateless residents of Kuwait).
The table thus excludes the Bidouns, the non-Kuwaiti GCC citizens and those in irregular situation.
Permits 17, 18, 19 and 20 are only granted after Ministry of Labour issues a work permit.
- Institution which provides data
Central Statistical Bureau (CSB), Ministry of Planning.
- Period of data coverage
December 31st, given years.
- Data availability
The present data is taken from the “Migration Statistics” reports, published annually by the CSB.
The report (in Arabic and English, PDF format with Excel tables) is available on CSB’s website (Population Statistics, then Migration Statistics)
https://www.csb.gov.kw/Pages/Statistics_en?ID=56&ParentCatID=1
https://www.csb.gov.kw/Pages/Statistics?ID=56&ParentCatID=1
Date of access: April 2023.
GLMM and GRC cannot guarantee that the link to access the source will not change; that the information will not be removed from the website it was obtained from; that no geo-blockages will be imposed; or that the information will not be available for any another reason.
Keywords: Kuwait, Foreign Population, Employment, Legal Document, Residence Conditions, Domestic Workers, Asia, Africa, Europe, North America, South America, Oceania
| |
2019 |
2020 |
2021 |
2022 |
| |
Males |
Females |
Total |
Males |
Females |
Total |
Males |
Females |
Total |
Males |
Females |
Total |
| Arab countries |
37,003 |
19,309 |
56,312 |
34,865 |
18,878 |
53,743 |
33,542 |
18,454 |
51,996 |
33,634 |
18,766 |
52,400 |
| Non‐Arab Asian countries |
28,609 |
18,368 |
46,977 |
26,277 |
17,670 |
43,947 |
24,885 |
17,526 |
42,411 |
24,652 |
18,300 |
42,952 |
| Non‐Arab African countries |
351 |
146 |
497 |
321 |
152 |
473 |
322 |
142 |
464 |
346 |
143 |
489 |
| Europe |
598 |
413 |
1,011 |
544 |
369 |
913 |
509 |
296 |
805 |
605 |
298 |
903 |
| North America |
856 |
183 |
1,039 |
803 |
187 |
990 |
813 |
196 |
1,009 |
814 |
201 |
1,015 |
| South and Central America |
59 |
22 |
81 |
51 |
23 |
74 |
46 |
22 |
68 |
52 |
19 |
71 |
| Australia and Pacific |
44 |
9 |
53 |
40 |
9 |
49 |
42 |
6 |
48 |
41 |
8 |
49 |
| Other |
0 |
0 |
0 |
0 |
0 |
0 |
0 |
2 |
2 |
0 |
1 |
1 |
| Total |
67,520 |
38,450 |
105,970 |
62,901 |
37,288 |
100,189 |
60,159 |
36,644 |
96,803 |
60,144 |
37,736 |
97,880 |
Source: Central Statistical Bureau, Migration Statistics Bulletin, given years.
ANNEXED NOTE
- Definitions
Ministry of Interior’s (Directorate of Migration’s) annual records of residency permits granted to foreign residents by type/ purpose of permit, sex and regional origin of holder.
Data presented in the table are stock data: non-national residents holding a residence permit on December 31st, the given year (residencies delivered for the first time a given year+residencies renewed that year).
Residencies are valid for 1 to 5 years.
The present figures include permits delivered for the purpose of working in the government sector in Kuwait.
Residency procedures do not apply to GCC nationals and to Bidouns (stateless residents of Kuwait).
The table thus excludes the Bidouns, the non-Kuwaiti GCC citizens and those in irregular situation.
Permits 17, 18, 19 and 20 are only granted after Ministry of Labour issues a work permit.
- Institution which provides data
Central Statistical Bureau (CSB), Ministry of Planning.
- Period of data coverage
December 31st, given years.
- Data availability
The present data is taken from the “Migration Statistics” reports, published annually by the CSB.
The report (in Arabic and English, PDF format with Excel tables) is available on CSB’s website
(Population Statistics, then Migration Statistics)
https://www.csb.gov.kw/Pages/Statistics_en?ID=56&ParentCatID=1
https://www.csb.gov.kw/Pages/Statistics?ID=56&ParentCatID=1
Date of access: April 2023.
GLMM and GRC cannot guarantee that the link to access the source will not change; that the information will not be removed from the website it was obtained from; that no geo-blockages will be imposed; or that the information will not be available for any another reason.
Keywords: Kuwait, Foreign Population, Employment, Legal Document, Residence Conditions, Asia, Africa, Europe, North America, South America, Oceania
| |
2019 |
2020 |
2021 |
2022 |
| |
Males |
Females |
Total |
Males |
Females |
Total |
Males |
Females |
Total |
Males |
Females |
Total |
| Arab countries |
130,873 |
208,720 |
339,593 |
128,923 |
203,358 |
332,281 |
124,092 |
193,578 |
317,670 |
128,970 |
203,646 |
332,616 |
| Non‐Arab Asian countries |
63,436 |
120,943 |
184,379 |
61,564 |
114,795 |
176,359 |
59,386 |
106,171 |
165,557 |
61,334 |
109,909 |
171,243 |
| Non‐Arab African countries |
604 |
1,350 |
1,954 |
559 |
1,260 |
1,819 |
583 |
1,154 |
1,737 |
633 |
1,278 |
1,911 |
| Europe |
1,804 |
3,301 |
5,105 |
1,688 |
3,056 |
4,744 |
1,629 |
2,894 |
4,523 |
1,704 |
2,968 |
4,672 |
| North America |
4,111 |
5,091 |
9,202 |
4,048 |
4,916 |
8,964 |
3,967 |
4,689 |
8,656 |
3,970 |
4,812 |
8,782 |
| South and Central America |
288 |
580 |
868 |
275 |
518 |
793 |
268 |
469 |
737 |
297 |
521 |
818 |
| Australia and Pacific |
299 |
429 |
728 |
282 |
416 |
698 |
273 |
384 |
657 |
256 |
356 |
612 |
| Other |
0 |
1 |
1 |
0 |
1 |
1 |
0 |
0 |
0 |
0 |
0 |
0 |
| Total |
201,415 |
340,415 |
541,830 |
197,339 |
328,320 |
525,659 |
190,198 |
309,339 |
499,537 |
197,164 |
323,490 |
520,654 |
Source: Central Statistical Bureau, Migration Statistics Bulletin, given years.
ANNEXED NOTE
- Definitions
Ministry of Interior’s (Directorate of Migration’s) annual records of residency permits granted to foreign residents by type/ purpose of permit, sex and regional origin of holder.
Data presented in the table are stock data: non-national residents holding a residence permit on December 31st, the given year (residencies delivered for the first time a given year+residencies renewed that year).
Residencies are valid for 1 to 5 years.
The present figures include permits delivered for the purpose of residing in Kuwait, as a worker’s family member.
Spouse, children or elderly dependent relatives can join holder of visas n°17 and 18 (the sponsor) in Kuwait, if the expatriate has obtained a residency and meets the salary requirements.
A working wife cannot sponsor her husband as a dependent. Sons over the age of 21 years cannot be sponsored as dependents, though adult daughters and parents may be permitted. Dependent family members are not allowed to work on a Dependent Visa.
Every foreign resident including new-born babies must hold a residency permit.
Residency procedures do not apply to GCC nationals and to Bidouns (stateless residents of Kuwait).
The table thus excludes the Bidouns, the non-Kuwaiti GCC citizens and those in irregular situation.
Permits 17, 18, 19 and 20 are only granted after Ministry of Labour issues a work permit.
- Institution which provides data
Central Statistical Bureau (CSB), Ministry of Planning.
- Period of data coverage
December 31st, given years.
- Data availability
The present data is taken from the “Migration Statistics” reports, published annually by the CSB.
The report (in Arabic and English, PDF format with Excel tables) is available on CSB’s website (Population Statistics, then Migration Statistics)
https://www.csb.gov.kw/Pages/Statistics_en?ID=56&ParentCatID=1
https://www.csb.gov.kw/Pages/Statistics?ID=56&ParentCatID=1
Date of access: April 2023.
GLMM and GRC cannot guarantee that the link to access the source will not change; that the information will not be removed from the website it was obtained from; that no geo-blockages will be imposed; or that the information will not be available for any another reason.
Keywords: Kuwait, Foreign Population, Employment, Legal Document, Residence Conditions, Family Reunification, Asia, Africa, Europe, North America, South America, Oceania
| |
2019 |
2020 |
2021 |
2022 |
| |
Males |
Females |
Total |
Males |
Females |
Total |
Males |
Females |
Total |
Males |
Females |
Total |
| Arab countries |
192 |
14 |
206 |
194 |
14 |
208 |
328 |
21 |
349 |
441 |
22 |
463 |
| Non‐Arab Asian countries |
115 |
3 |
118 |
115 |
3 |
118 |
186 |
9 |
195 |
240 |
9 |
249 |
| Non‐Arab African countries |
0 |
0 |
0 |
0 |
0 |
0 |
0 |
0 |
0 |
0 |
0 |
0 |
| Europe |
4 |
2 |
6 |
4 |
2 |
6 |
8 |
2 |
10 |
7 |
3 |
10 |
| North America |
17 |
1 |
18 |
20 |
0 |
20 |
35 |
2 |
37 |
38 |
1 |
39 |
| South and Central America |
5 |
0 |
5 |
5 |
0 |
5 |
7 |
1 |
8 |
8 |
2 |
10 |
| Australia and Pacific |
1 |
0 |
1 |
1 |
0 |
1 |
2 |
0 |
2 |
2 |
0 |
2 |
| Other |
0 |
0 |
0 |
0 |
0 |
0 |
0 |
0 |
0 |
0 |
0 |
0 |
| Total |
334 |
20 |
354 |
339 |
19 |
358 |
566 |
35 |
601 |
736 |
37 |
773 |
Source: Central Statistical Bureau, Migration Statistics Bulletin, given years.
ANNEXED NOTE
- Definitions
Ministry of Interior’s (Directorate of Migration’s) annual records of residency permits granted to foreign residents by type/ purpose of permit, sex and regional origin of holder.
Data presented in the table are stock data: non-national residents holding a residence permit on December 31st, the given year
(residencies delivered for the first time a given year+residencies renewed that year).
Residencies are valid for 1 to 5 years.
The present figures include permits delivered for the purpose of working as a freelancer in Kuwait.
Residency procedures do not apply to GCC nationals and to Bidouns (stateless residents of Kuwait).
The table thus excludes the Bidouns, the non-Kuwaiti GCC citizens and those in irregular situation.
Permits 17, 18, 19 and 20 are only granted after Ministry of Labour issues a work permit.
- Institution which provides data
Central Statistical Bureau (CSB), Ministry of Planning.
- Period of data coverage
December 31st, given years.
- Data availability
The present data is taken from the “Migration Statistics” reports, published annually by the CSB.
The report (in Arabic and English, PDF format with Excel tables) is available on CSB’s website
(Population Statistics, then Migration Statistics)
https://www.csb.gov.kw/Pages/Statistics_en?ID=56&ParentCatID=1
https://www.csb.gov.kw/Pages/Statistics?ID=56&ParentCatID=1
Date of access: April 2023.
GLMM and GRC cannot guarantee that the link to access the source will not change; that the information will not be removed from the website it was obtained from; that no geo-blockages will be imposed; or that the information will not be available for any another reason.
Keywords: Kuwait, Foreign Population, Employment, Legal Document, Residence Conditions, Asia, Africa, Europe, North America, South America, Oceania
| |
2019 |
2020 |
2021 |
2022 |
| |
Males |
Females |
Total |
Males |
Females |
Total |
Males |
Females |
Total |
Males |
Females |
Total |
| Arab countries |
835 |
965 |
1,800 |
826 |
996 |
1,822 |
821 |
1,068 |
1,889 |
693 |
1,029 |
1,722 |
| Non‐Arab Asian countries |
190 |
280 |
470 |
184 |
278 |
462 |
194 |
299 |
493 |
168 |
284 |
452 |
| Non‐Arab African countries |
4 |
7 |
11 |
4 |
10 |
14 |
4 |
14 |
18 |
3 |
13 |
16 |
| Europe |
35 |
26 |
61 |
33 |
23 |
56 |
35 |
24 |
59 |
40 |
23 |
63 |
| North America |
46 |
22 |
68 |
50 |
22 |
72 |
55 |
27 |
82 |
50 |
21 |
71 |
| South and Central America |
11 |
5 |
16 |
10 |
5 |
15 |
10 |
6 |
16 |
12 |
6 |
18 |
| Australia and Pacific |
8 |
6 |
14 |
9 |
6 |
15 |
9 |
6 |
15 |
5 |
5 |
10 |
| Other |
0 |
0 |
0 |
0 |
0 |
0 |
0 |
0 |
0 |
0 |
0 |
0 |
| Total |
1,129 |
1,311 |
2,440 |
1,116 |
1,340 |
2,456 |
1,128 |
1,444 |
2,572 |
971 |
1,381 |
2,352 |
Source: Central Statistical Bureau, Migration Statistics Bulletin, given years.
ANNEXED NOTE
- Definitions
Ministry of Interior’s (Directorate of Migration’s) annual records of residency permits granted to foreign residents by type/ purpose of permit, sex and regional origin of holder.
Data presented in the table are stock data: non-national residents holding a residence permit on December 31st, the given year (residencies delivered for the first time a given year+residencies renewed that year).
The present figures include permits delivered for the purpose of residing in Kuwait, as a self-sponsored resident.
Self-residence permit: Expatriates may sponsor themselves under article 24 of the regulations and obtain a residence for two to five years under several conditions, among which: being aged 60 and more, having worked no less than 25 years in Kuwait, owning a capital of 10,000 KD at least; holding a certificate of good conduct, effectively reside in Kuwait, etc.
This form of residence can be renewed upon expiry. Self-sponsored expatriates may sponsor their wives and children.
Residency procedures do not apply to GCC nationals and to Bidouns (stateless residents of Kuwait).
The table thus excludes the Bidouns, the non-Kuwaiti GCC citizens and those in irregular situation.
- Institution which provides data
Central Statistical Bureau (CSB), Ministry of Planning.
- Period of data coverage
December 31st, given years.
- Data availability
The present data is taken from the “Migration Statistics” reports, published annually by the CSB.
The report (in Arabic and English, PDF format with Excel tables) is available on CSB’s website (Population Statistics, then Migration Statistics)
https://www.csb.gov.kw/Pages/Statistics_en?ID=56&ParentCatID=1
https://www.csb.gov.kw/Pages/Statistics?ID=56&ParentCatID=1
Date of access: April 2023.
GLMM and GRC cannot guarantee that the link to access the source will not change; that the information will not be removed from the website it was obtained from; that no geo-blockages will be imposed; or that the information will not be available for any another reason.
Keywords: Kuwait, Foreign Population, Employment, Legal Document, Residence Conditions, Sponsorship, Asia, Africa, Europe, North America, South America, Oceania
| |
2019 |
2020 |
2021 |
2022 |
| |
Males |
Females |
Total |
Males |
Females |
Total |
Males |
Females |
Total |
Males |
Females |
Total |
| Arab countries |
51 |
19 |
70 |
47 |
25 |
72 |
37 |
27 |
64 |
37 |
19 |
56 |
| Non‐Arab Asian countries |
265 |
108 |
373 |
203 |
64 |
267 |
161 |
48 |
209 |
188 |
72 |
260 |
| Non‐Arab African countries |
265 |
66 |
331 |
247 |
71 |
318 |
165 |
48 |
213 |
227 |
57 |
284 |
| Europe |
21 |
16 |
37 |
15 |
10 |
25 |
12 |
7 |
19 |
14 |
8 |
22 |
| North America |
1 |
0 |
1 |
1 |
0 |
1 |
2 |
0 |
2 |
1 |
0 |
1 |
| South and Central America |
0 |
1 |
1 |
0 |
1 |
1 |
0 |
1 |
1 |
0 |
1 |
1 |
| Australia and Pacific |
0 |
1 |
1 |
0 |
0 |
0 |
0 |
0 |
0 |
2 |
6 |
8 |
| Other |
0 |
0 |
0 |
0 |
0 |
0 |
0 |
0 |
0 |
0 |
0 |
0 |
| Total |
603 |
211 |
814 |
513 |
171 |
684 |
377 |
131 |
508 |
469 |
163 |
632 |
Source: Central Statistical Bureau, Migration Statistics Bulletin, given years.
ANNEXED NOTE
- Definitions
Ministry of Interior’s (Directorate of Migration’s) annual records of residency permits granted to foreign residents by type/ purpose of permit, sex and regional origin of holder.
Data presented in the table are stock data: non-national residents holding a residence permit on December 31st, the given year (residencies delivered for the first time a given year+residencies renewed that year).
Residencies are valid for 1 to 5 years.
The present figures include permits delivered for the purpose of residing in Kuwait, as a student.
Residency procedures do not apply to GCC nationals and to Bidouns (stateless residents of Kuwait).
The table thus excludes the Bidouns, the non-Kuwaiti GCC citizens and those in irregular situation.
- Institution which provides data
Central Statistical Bureau (CSB), Ministry of Planning.
- Period of data coverage
December 31st, given years.
- Data availability
The present data is taken from the “Migration Statistics” reports, published annually by the CSB.
The report (in Arabic and English, PDF format with Excel tables) is available on CSB’s website (Population Statistics, then Migration Statistics)
https://www.csb.gov.kw/Pages/Statistics_en?ID=56&ParentCatID=1
https://www.csb.gov.kw/Pages/Statistics?ID=56&ParentCatID=1
Date of access: April 2023.
GLMM and GRC cannot guarantee that the link to access the source will not change; that the information will not be removed from the website it was obtained from; that no geo-blockages will be imposed; or that the information will not be available for any another reason.
Keywords: Kuwait, Foreign Population, Employment, Legal Document, Residence Conditions, Asia, Africa, Europe, North America, South America, Oceania
| |
2019 |
2020 |
2021 |
2022 |
| |
Males |
Females |
Total |
Males |
Females |
Total |
Males |
Females |
Total |
Males |
Females |
Total |
| Arab countries |
538,791 |
38,013 |
576,804 |
502,682 |
36,901 |
539,583 |
468,023 |
37,858 |
505,881 |
510,700 |
41,810 |
552,510 |
| Non‐Arab Asian countries |
857,629 |
87,032 |
944,661 |
741,213 |
81,173 |
822,386 |
646,865 |
75,635 |
722,500 |
746,837 |
89,858 |
836,695 |
| Non‐Arab African countries |
6,259 |
2,507 |
8,766 |
5,529 |
2,258 |
7,787 |
5,156 |
2,140 |
7,296 |
8,092 |
2,840 |
10,932 |
| Europe |
4,883 |
2,194 |
7,077 |
4,127 |
1,873 |
6,000 |
3,561 |
1,871 |
5,432 |
3,683 |
2,041 |
5,724 |
| North America |
6,192 |
2,198 |
8,390 |
5,320 |
1,903 |
7,223 |
4,580 |
1,807 |
6,387 |
5,228 |
1,960 |
7,188 |
| South and Central America |
675 |
211 |
886 |
592 |
208 |
800 |
553 |
203 |
756 |
673 |
248 |
921 |
| Australia and Pacific |
471 |
150 |
621 |
431 |
126 |
557 |
358 |
125 |
483 |
339 |
134 |
473 |
| Other |
0 |
0 |
0 |
0 |
0 |
0 |
0 |
0 |
0 |
0 |
0 |
0 |
| Total |
1,414,900 |
132,305 |
1,547,205 |
1,259,894 |
124,442 |
1,384,336 |
1,129,096 |
119,639 |
1,248,735 |
1,275,552 |
138,891 |
1,414,443 |
Source: Central Statistical Bureau, Migration Statistics Bulletin, given years.
ANNEXED NOTE
- Definitions
Ministry of Interior’s (Directorate of Migration’s) annual records of residency permits granted to foreign residents by type/ purpose of permit, sex and regional origin of holder.
Data presented in the table are stock data: non-national residents holding a residence permit on December 31st, the given year.
The present figures include permits delivered for the purpose of working in the private (non-governmental) sector in Kuwait.
Residency procedures do not apply to GCC nationals and to Bidouns (stateless residents of Kuwait).
The table thus excludes the Bidouns, the non-Kuwaiti GCC citizens and those in irregular situation.
Permits 17, 18, 19 and 20 are only granted after Ministry of Labour issues a work permit.
- Institution which provides data
Central Statistical Bureau (CSB), Ministry of Planning.
- Period of data coverage
December 31st, given years.
- Data availability
The present data is taken from the “Migration Statistics” reports, published annually by the CSB.
The report (in Arabic and English, PDF format with Excel tables) is available on CSB’s website
(Population Statistics, then Migration Statistics)
https://www.csb.gov.kw/Pages/Statistics_en?ID=56&ParentCatID=1
https://www.csb.gov.kw/Pages/Statistics?ID=56&ParentCatID=1
Date of access: April 2023.
GLMM and GRC cannot guarantee that the link to access the source will not change; that the information will not be removed from the website it was obtained from; that no geo-blockages will be imposed; or that the information will not be available for any another reason.
Keywords: Kuwait, Foreign Population, Employment, Legal Document, Residence Conditions, Asia, Africa, Europe, North America, South America, Oceania
| Purpose of permits |
Reference number of permits |
Type of permits |
2015 |
2016 |
2017 |
2018 |
2019 |
2020 |
2021 |
2022 |
| work |
17 |
Governmental sector permits |
107,710 |
109,714 |
110,245 |
107,657 |
105,970 |
100,189 |
96,803 |
97,880 |
| 18 |
Private sector permits |
1,293,578 |
1,373,378 |
1,442,608 |
1,531,234 |
1,547,205 |
1,384,336 |
1,248,735 |
1,414,443 |
| 19 |
Business |
383 |
369 |
359 |
360 |
354 |
358 |
601 |
773 |
| 20 |
Domestic work |
651,386 |
666,422 |
677,592 |
707,061 |
731,376 |
667,350 |
591,368 |
753,165 |
| residence |
22 |
Dependent permits |
536,326 |
544,150 |
540,904 |
541,630 |
541,830 |
525,659 |
499,537 |
520,654 |
| 23 |
Study |
630 |
865 |
861 |
869 |
814 |
684 |
508 |
632 |
| 24 |
Self-residence permits |
2,263 |
2,297 |
2,386 |
2,444 |
2,440 |
2,456 |
2,572 |
2,352 |
| Total residencies 1 year and more |
2,592,276 |
2,697,195 |
2,774,955 |
2,891,255 |
2,929,989 |
2,681,032 |
2,440,124 |
2,789,899 |
| Temporary residence |
14 |
Temporary residence |
n.a. |
n.a. |
n.a. |
n.a. |
70,624 |
65,407 |
80,177 |
48,714 |
| Total residencies |
|
n.a. |
n.a. |
n.a. |
n.a. |
3,000,613 |
2,746,439 |
2,520,301 |
2,838,613 |
Source: Central Statistical Bureau, Migration Statistics Bulletin, given years.
ANNEXED NOTE
- Definitions
Ministry of Interior’s (Directorate of Migration’s) annual records of residency permits granted to foreign residents by type/ purpose of permit, sex and regional origin of holder.
Data presented in the table are stock data: all the non-national residents holding a residence permit on December 31st, the given year.
The present figures include permits delivered for all purposes of stay in Kuwait:
1- Labour in all sectors: governmental sector (n°17); private sector (n°18); business (freelance) (n°19) and domestic sector (n°20)
2- Residence: as family dependent (permit n°22); studies (n°23) and self-residence (n°24).
Residency procedures do not apply to GCC nationals and to Bidouns (stateless residents of Kuwait).
The table thus excludes the Bidouns, the non-Kuwaiti GCC citizens and those in irregular situation.
The number of holders of permit n°14 (temporary residents) is not available before 2019.
Dependent permit: spouse, children or elderly dependent relatives can join visa holder (sponsor) in Kuwait, if the expatriate has obtained a residency and meets the salary requirements.
A working wife cannot sponsor her husband as a dependent. Sons over the age of 21 years cannot be sponsored as dependents, though adult daughters and parents may be permitted. Dependent family members are not allowed to work on a Dependent Visa.
Every foreign resident including new-born babies must hold a residency permit.
Self-residence permit: Expatriates may sponsor themselves under article 24 of the regulations and obtain a residence for two to five years under several conditions, among which: being aged 60 and more, having worked no less than 25 years in Kuwait, owning a capital of 10,000 KD at least; holding a certificate of good conduct, effectively reside in Kuwait, etc.
This form of residence can be renewed upon expiry. Self-sponsored expatriates may sponsor their wives and children.
Permits 17, 18, 19 and 20 are only granted after Ministry of Labour issues a work permit.
- Institution which provides data
Central Statistical Bureau (CSB), Ministry of Planning.
- Period of data coverage
December 31st, given years.
- Data availability
The present data is taken from the “Migration Statistics” reports, published annually by the CSB.
The report (in Arabic and English, PDF format with Excel tables) is available on CSB’s website
(Population Statistics, then Migration Statistics)
https://www.csb.gov.kw/Pages/Statistics_en?ID=56&ParentCatID=1
https://www.csb.gov.kw/Pages/Statistics?ID=56&ParentCatID=1
Date of access: April 2023.
GLMM and GRC cannot guarantee that the link to access the source will not change; that the information will not be removed from the website it was obtained from; that no geo-blockages will be imposed; or that the information will not be available for any another reason.
Keywords: Kuwait, Foreign Population, Employment, Legal Document, Residence Conditions, Family Reunification
| |
2011 |
2012 |
2013 |
2014 |
2015 |
2016 |
2017 |
2018 |
2019 |
2020 |
2021 |
2022 |
| Arab countries |
722,575 |
750,426 |
802,213 |
837,363 |
877,959 |
898,660 |
916,169 |
952,261 |
978,375 |
931,092 |
881,211 |
943,530 |
| Non‐Arab Asian countries |
1,338,340 |
1,391,040 |
1,458,161 |
1,525,083 |
1,620,129 |
1,714,717 |
1,775,919 |
1,849,050 |
1,871,676 |
1,682,815 |
1,502,222 |
1,784,170 |
| Non‐Arab African countries |
73,403 |
83,144 |
93,004 |
73,300 |
61,070 |
49,634 |
47,254 |
53,778 |
44,639 |
35,092 |
26,866 |
30,705 |
| Europe |
10,216 |
10,554 |
10,921 |
11,443 |
12,081 |
12,482 |
13,565 |
13,726 |
13,300 |
11,748 |
10,854 |
11,398 |
| North America |
19,191 |
19,311 |
18,244 |
18,297 |
18,403 |
18,860 |
19,079 |
19,223 |
18,718 |
17,270 |
16,173 |
17,096 |
| South and Central America |
1,121 |
1,131 |
1,109 |
1,104 |
1,179 |
1,343 |
1,499 |
1,746 |
1,861 |
1,692 |
1,590 |
1,844 |
| Australia and Pacific |
1,416 |
1,408 |
1,426 |
1,419 |
1,452 |
1,495 |
1,467 |
1,469 |
1,419 |
1,322 |
1,206 |
1,155 |
| Other |
13 |
13 |
11 |
9 |
3 |
4 |
3 |
2 |
1 |
1 |
2 |
1 |
| Total |
2,166,275 |
2,257,027 |
2,385,089 |
2,468,018 |
2,592,276 |
2,697,195 |
2,774,955 |
2,891,255 |
2,929,989 |
2,681,032 |
2,440,124 |
2,789,899 |
Source: Central Statistical Bureau, Migration Statistics Bulletin, given years.
ANNEXED NOTE
- Definitions
Ministry of Interior’s (Directorate of Migration’s) annual records of residency permits granted to foreign residents by type/ purpose of permit, sex and regional origin of holder.
Data presented in the table are stock data: all the non-national residents holding a residence permit on December 31st, the given year, EXCEPT the holders of permit n°14 (temporary residents).
The present figures include permits delivered for all purposes of stay in Kuwait:
1- Labour in all sectors: governmental (n°17); private sector (n°18); business (n°19) and domestic (n°20) sectors
2- Residence: as family dependent (permit n°22); for the purpose of studying (n°23) and for self-residence (n°24).
Residency procedures do not apply to GCC nationals and to Bidouns (stateless residents of Kuwait).
The table thus excludes the Bidouns, the non-Kuwaiti GCC citizens and those in irregular situation.
Holders of permit n°14 (temporary residents) are not included in the figures.
- Institution which provides data
Central Statistical Bureau (CSB), Ministry of Planning.
- Period of data coverage
December 31st, given years.
- Data availability
The present data is taken from the “Migration Statistics” reports, published annually by the CSB.
The report (in Arabic and English, PDF format with Excel tables) is available on CSB’s website (Population Statistics, then Migration Statistics)
https://www.csb.gov.kw/Pages/Statistics_en?ID=56&ParentCatID=1
https://www.csb.gov.kw/Pages/Statistics?ID=56&ParentCatID=1
Date of access: April 2023
GLMM and GRC cannot guarantee that the link to access the source will not change; that the information will not be removed from the website it was obtained from; that no geo-blockages will be imposed; or that the information will not be available for any another reason.
Keywords: Kuwait, Foreign Population, Employment, Legal Document, Residence Conditions, Asia, Africa, Europe, North America, South America, Oceania
| Country of citizenship |
Number |
| Saudi Arabia |
2,193,007 |
| Algeria |
2,001 |
| Bahrain |
4 |
| Egypt |
837,134 |
| Iraq |
1,312 |
| Jordan |
66,072 |
| Kuwait |
10 |
| Lebanon |
30,245 |
| Libya |
19 |
| Mauritania |
1,157 |
| Morocco |
18,028 |
| Oman |
7 |
| Palestine |
10,055 |
| Pal. with Jordanian travel documents |
26 |
| Pal. with Syrian travel documents |
1,004 |
| Pal. with Iraqi travel documents |
5 |
| Pal. with Lebanese travel documents |
1,296 |
| Pal. with Egyptian travel documents |
20,584 |
| Qatar |
3 |
| Sudan |
354,988 |
| Syria |
140,953 |
| Tunisia |
12,311 |
| UAE |
4 |
| Yemen |
840,881 |
| Displaced tribes |
24 |
| Arab countries |
2,338,123 |
| Afghanistan |
68,380 |
| Azerbaidjan |
237 |
| Bangladesh |
1,748,060 |
| Brunei |
5 |
| Cambodia |
4 |
| China |
12,209 |
| Hong Kong |
|
| India |
1,401,187 |
| Indonesia |
76,901 |
| Iran |
5 |
| Japan |
266 |
| Kazakhstan |
265 |
| Kirgyzstan |
167 |
| Laos |
9 |
| Macau |
1 |
| Malaysia |
962 |
| Maldives |
4 |
| Myanmar |
2,280 |
| Myanmar/ holder of a Pakistani passport |
6,227 |
| Myanmar/ holder of a Bangladeshi passport |
5,445 |
| Myanmar/ resident |
17,275 |
| Nepal |
311,846 |
| Pakistan |
1,214,314 |
| Philippines |
302,337 |
| Singapore |
133 |
| South Korea |
1,010 |
| Sri Lanka |
45,273 |
| Taiwan |
170 |
| Tajikistan |
87 |
| Thailand |
854 |
| Turkey |
21,033 |
| Turkmenistan |
29 |
| Uzbekistan |
364 |
| Vietnam |
462 |
| Other countries/ residents |
92 |
| Asian countries |
5,237,893 |
| Angola |
1 |
| Benin |
19 |
| Botswana |
4 |
| Burkina Faso |
448 |
| Burundi |
182 |
| Cabo Verde |
2 |
| Cameroon |
248 |
| Central African Republic |
1 |
| Chad |
6,075 |
| Comoros |
32 |
| Congo |
12 |
| Djibouti |
495 |
| Equatorial Guinea |
|
| Eritrea |
13,500 |
| Ethiopia |
16,719 |
| Gabon |
3 |
| Gambia |
55 |
| Ghana |
8,440 |
| Guinea |
129 |
| Guinea Bissau |
2 |
| Ivory Coast |
147 |
| Kenya |
22,415 |
| Lesotho |
2 |
| Liberia |
8 |
| Madagascar |
4 |
| Malawi |
11 |
| Mali |
3,497 |
| Mauritius |
23 |
| Mozambique |
38 |
| Namibia |
2 |
| Niger |
2,297 |
| Nigeria |
10,651 |
| Rwanda |
135 |
| Senegal |
1,476 |
| Seychelles |
2 |
| Sierra Leone |
22 |
| Somalia |
10,759 |
| South Africa |
2,763 |
| South-Sudan |
12 |
| Swaziland |
2 |
| Tanzania |
688 |
| Togo |
12 |
| Uganda |
34,922 |
| Zambia |
243 |
| Zimbabwe |
346 |
| Sub-Saharan African countries |
136,844 |
| Albania |
63 |
| Armenia |
30 |
| Austria |
105 |
| Belarus |
38 |
| Belgium |
166 |
| Bosnia |
169 |
| Bulgaria |
44 |
| Croatia |
155 |
| Cyprus |
93 |
| Czech Republic |
50 |
| Denmark |
62 |
| Estonia |
9 |
| Finland |
34 |
| France |
1,793 |
| Georgia |
43 |
| Germany |
694 |
| Greece |
531 |
| Hungary |
57 |
| Iceland |
1 |
| Ireland |
596 |
| Italy |
935 |
| Kosovo |
11 |
| Latvia |
10 |
| Lithuania |
25 |
| Luxembourg |
37 |
| Macedonia |
4 |
| Malta |
11 |
| Moldavia |
6 |
| Netherlands |
347 |
| Norway |
40 |
| Poland |
216 |
| Portugal |
367 |
| Romania |
383 |
| Russia |
445 |
| San Marino |
1 |
| Serbia and Montenegro |
162 |
| Slovakia |
39 |
| Slovenia |
18 |
| Spain |
1,000 |
| Sweden |
196 |
| Switzerland |
100 |
| UK |
8,766 |
| Ukraine |
319 |
| Europe |
18,171 |
| Argentina |
136 |
| Belize |
10 |
| Bolivia |
17 |
| Brazil |
365 |
| Canada |
3,589 |
| Chile |
41 |
| Colombia |
328 |
| Costa Rica |
9 |
| Cuba |
7 |
| Dominica |
85 |
| Dominican Republic |
7 |
| Ecuador |
31 |
| Guatemala |
8 |
| Haiti |
1 |
| Honduras |
7 |
| Jamaica |
79 |
| Mexico |
235 |
| Nicaragua |
2 |
| Panama |
19 |
| Peru |
74 |
| San Salvador |
6 |
| Surinam |
2 |
| Trinidad and Tobago |
73 |
| Uruguay |
6 |
| USA |
5,990 |
| Venezuela |
410 |
| Other |
103 |
| Americas |
11,640 |
| Australia |
1,145 |
| New Zealand |
161 |
| Oceania |
1,312 |
| Residents |
143 |
| Unspecified |
13 |
| Total foreign workers |
7,744,139 |
| Total workers |
9,937,146 |
Source: Ministry of Human Resources and Social Development (MHRSD)
ANNEXED NOTE
1. Technical Notes and Definitions
No metadata available. The administrative records used as a source of data is unmentioned.
The dataset is presumably based on Social Insurance (GOSI) records.
The category of “resident” presumably refers to de facto refugee populations granted residency permits in Saudi Arabia, such as some Rohingya refugees from Myanmar
(https://english.alarabiya.net/News/gulf/2017/01/25/Over-190-000-Myanmar-nationals-granted-Saudi-residency).
2. Institution which provides data
Saudi Arabia Ministry of Human Resources and Social Development (MHRSD)
3. Data availability
The raw dataset “Statistics of establishments and workers in the private sector for the year 2022”
https://od.data.gov.sa/Data/en/dataset/statistics-of-establishments-and-workers-in-the-private-sector-2022/resource/4d5309c9-cc02-4772-ae8a-49859296ad62
is only available in the Saudi government Open Data Portal – https://od.data.gov.sa/en
https://od.data.gov.sa/Data/en/group/labor_market
Datasets are in Arabic only.
Last date of access: March 2023.
GLMM and GRC cannot guarantee that the link to access the source will not change; that the information will not be removed from the website it was obtained from; that no geo-blockages will be imposed; or that the information will not be available for any another reason.
Keywords: Saudi Arabia, India, Indonesia, Pakistan, Bangladesh, Philippines, Nepal, Sri Lanka, Afghanistan, Iran, China, Thailand, Korea (South), Egypt, Iraq, Jordan, Lebanon, Morocco, Palestine, Sudan, Tunisia, Turkey, Eritrea, Ethiopia, Europe, North America, Asia, Africa, Oceania, USA, Arab Countries, Labour Market, Employment, National & Foreign Labour, National Labour, Foreign Labour
| |
Males |
Females |
Total |
| India |
218,828 |
14,141 |
232,969 |
| Bangladesh |
105,771 |
191 |
105,962 |
| Pakistan |
59,681 |
1,103 |
60,784 |
| Philippines |
10,718 |
16,484 |
27,202 |
| Nepal |
17,916 |
2,132 |
20,048 |
| Egypt |
10,002 |
1,690 |
11,692 |
| Sri Lanka |
3,773 |
646 |
4,419 |
| Jordan |
2,526 |
488 |
3,014 |
| Yemen |
2,831 |
115 |
2,946 |
| Kenya |
1,493 |
867 |
2,360 |
| Uganda |
1,864 |
391 |
2,255 |
| Cameron |
1,583 |
454 |
2,037 |
| United Kingdom |
1,450 |
542 |
1,992 |
| Morocco |
518 |
1,474 |
1,992 |
| Thailand |
499 |
1,344 |
1,843 |
| Sudan |
1,553 |
226 |
1,779 |
| Nigeria |
1,582 |
141 |
1,723 |
| Syria |
1,523 |
184 |
1,707 |
| Ghana |
1,335 |
251 |
1,586 |
| China |
860 |
354 |
1,214 |
| Total |
455,385 |
47,784 |
503,169 |
Source: BLMI, Labour Market Regulation Authority (LMRA)
ANNEXED NOTE
1. Technical Notes and Definitions
Data are extracted from the files submitted by Expatriate Management System (LMRA-EMS)
EMS data refer to Expat visa applications (GCC workers not included).
Data refer to foreign workers in the public and private sectors.
LMRA data do not include non-civilian employees (engaged in military, defence and other relevant entities and ranked as so).
1. From 2008 Q2 onward, “Public sector” for non-Bahraini workers refers to workers in the “Government sector” of the Expatriate Management System (EMS) of LMRA.
2. “Private Sector” for non-Bahraini workers refers to the sum of “Commercial” and “Non-Commercial, Non-Government” (NCNG) sectors of LMRA’s EMS system.
Employment as defined by the LMRA is in line with the ILO resolution concerning statistics of the economically active population, employment, unemployment and underemployment.
It includes all persons above a specific age during a specific period either in paid employment or in self-employment and includes the following:
(a) paid employment
(a1) at work: persons who during the reference period performed some work for wage or salary, in cash or in kind, even for one hour
(a2) with a job but not at work: persons who, having already worked in their present job, were temporarily not at work during the reference period and had a formal attachment to their job
(e.g., absence because of illness or injury, holiday or vacation, strike or lockout, educational or training leave, maternity or parental leave, reduction in economic activity, etc.)
(b) self employment
(b1) at work: persons who during the reference period performed some work for profit or family gain, in cash or in kind
(b2) with an enterprise but not at work: persons with an enterprise, which may be a business enterprise, a farm or a service undertaking, who were temporarily not at work during the reference period for any specific reason.
2. Institution which provides data
Labour Market Regulatory Authority (LMRA)
3. Data availability
Labour Market Regulatory Authority (LMRA), Kingdom of Bahrain, based on data from Bahrain Labour Market Indicators (https://blmi.lmra.gov.bh/2022/12/data/lmr/Table_A.xlsx).
Data are tabulated in PDF and Excel formats.
The definitions that the LMRA adopts for its data can be found in the Glossary section: (http://blmi.lmra.bh/mi_glossary.xml)
Date of access: March 2023.
GLMM and GRC cannot guarantee that the link to access the source will not change; that the information will not be removed from the website it was obtained from; that no geo-blockages will be imposed; or that the information will not be available for any another reason.
Keywords: Bahrain, Foreign Labour, Employment, Female Employment, Egypt, Jordan, Yemen, India, Bangladesh, Pakistan, Philippines, Nepal, Sri Lanka, Kenya, Ethiopia, Uganda, Cameroon, United Kingdom, Morocco, Thailand, Sudan, Nigeria, Syria, Ghana, China
| |
Q4 2015 |
Q4 2016 |
Q4 2017 |
Q4 2018 |
Q4 2019 |
Q4 2020 |
Q4 2021 |
Q4 2022 |
|
|
|
|
| Egypt |
8,951 |
9,141 |
10,193 |
11,380 |
11,348 |
10,262 |
10,524 |
11,692 |
|
|
| Jordan |
3,160 |
3,093 |
3,163 |
3,246 |
3,230 |
2,847 |
2,986 |
3,014 |
|
|
| Yemen |
2,417 |
2,486 |
2,517 |
2,719 |
2,719 |
2,517 |
2,696 |
2,946 |
|
|
| India |
212,750 |
221,449 |
235,858 |
241,473 |
236,546 |
206,720 |
207,195 |
232,969 |
|
|
| Bangladesh |
114,886 |
164,377 |
129,729 |
126,967 |
124,257 |
125,855 |
108,642 |
105,962 |
|
|
| Pakistan |
42,615 |
44,771 |
45,933 |
43,240 |
45,473 |
45,910 |
48,555 |
60,784 |
|
|
| Philippines |
28,613 |
30,539 |
31,328 |
32,419 |
31,636 |
27,562 |
26,464 |
27,202 |
|
|
| Nepal |
13,882 |
14,178 |
15,711 |
17,168 |
17,559 |
15,852 |
16,936 |
20,048 |
|
|
| Sri Lanka |
6,051 |
4,271 |
4,103 |
4,046 |
4,017 |
3,513 |
3,252 |
4,419 |
|
|
| Kenya |
906 |
1,223 |
1,536 |
1,974 |
2,168 |
2,107 |
2,180 |
2,360 |
|
|
| Ethiopia |
874 |
960 |
1,121 |
1,109 |
1,137 |
1,027 |
|
|
|
|
| Uganda |
|
|
|
|
1,390 |
1,435 |
1,780 |
2,255 |
|
|
| Cameroon |
|
|
|
|
990 |
1,020 |
1,593 |
2,037 |
|
|
| Total |
455,223 |
518,582 |
504,721 |
511,556 |
507,171 |
468,325 |
456,427 |
487,020 |
|
|
Source: BLMI, Labour Market Regulation Authority (LMRA)
ANNEXED NOTE
- Technical Notes and Definitions
Data are extracted from the files submitted by Expatriate Management System (LMRA-EMS)
EMS data refer to Expat visa applications (GCC workers not included).
Data refer to foreign workers in the public and private sectors.
LMRA data do not include non-civilian employees (engaged in military, defense and other relevant entities and ranked as so).
- From 2008 Q2 onward, “Public sector” for non-Bahraini workers refers to workers in the “Government sector” of the Expatriate Management System (EMS) of LMRA.
- “Private Sector” for non-Bahraini workers refers to the sum of “Commercial” and “Non-Commercial, Non-Government” (NCNG) sectors of LMRA’s EMS system.
Employment as defined by the LMRA is in line with the ILO resolution concerning statistics of the economically active population, employment, unemployment and underemployment.
It includes all persons above a specific age during a specific period either in paid employment or in self-employment and includes the following:
(a) paid employment
(a1) at work: persons who during the reference period performed some work for wage or salary, in cash or in kind, even for one hour
(a2) with a job but not at work: persons who, having already worked in their present job, were temporarily not at work during the reference period and had a formal attachment to their job
(e.g., absence because of illness or injury, holiday or vacation, strike or lockout, educational or training leave, maternity or parental leave, reduction in economic activity, etc.)
(b) self employment
(b1) at work: persons who during the reference period performed some work for profit or family gain, in cash or in kind
(b2) with an enterprise but not at work: persons with an enterprise, which may be a business enterprise, a farm or a service undertaking,
who were temporarily not at work during the reference period for any specific reason.
- Institution which provides data
Labour Market Regulatory Authority (LMRA)
- Data availability
Labour Market Regulatory Authority (LMRA), Kingdom of Bahrain, based on data from Bahrain Labour Market Indicators (https://blmi.lmra.gov.bh/2022/12/data/lmr/Table_A.xlsx).
Data are tabulated in PDF and Excel formats.
The definitions that the LMRA adopts for its data can be found in the Glossary section: (http://blmi.lmra.bh/mi_glossary.xml)
Date of access: March 2023.
GLMM and GRC cannot guarantee that the link to access the source will not change; that the information will not be removed from the website it was obtained from; that no geo-blockages will be imposed; or that the information will not be available for any another reason.
Keywords: Bahrain, National Labour, Foreign Labour, Employment, Egypt, Jordan, Yemen, India, Bangladesh, Pakistan, Philippines, Nepal, Sri Lanka, Kenya, Ethiopia, Uganda, Cameroon
| |
Males |
Females |
Total |
| 2016 |
Q1 |
22,579 |
71,315 |
93,894 |
| Q2 |
23,242 |
74,363 |
97,605 |
| Q3 |
23,404 |
73,968 |
97,372 |
| Q4 |
23,828 |
73,905 |
97,733 |
| 2017 |
Q1 |
24,112 |
75,305 |
99,417 |
| Q2 |
23,809 |
76,249 |
100,058 |
| Q3 |
23,288 |
75,088 |
98,376 |
| Q4 |
23,044 |
75,859 |
98,903 |
| 2018 |
Q1 |
23,646 |
79,876 |
103,522 |
| Q2 |
22,478 |
69,375 |
91,853 |
| Q3 |
22,275 |
67,887 |
90,162 |
| Q4 |
22,552 |
68,040 |
90,592 |
| 2019 |
Q1 |
23,254 |
64,488 |
87,742 |
| Q2 |
23,506 |
63,938 |
87,444 |
| Q3 |
23,677 |
63,409 |
87,086 |
| Q4 |
24,033 |
63,470 |
87,503 |
| 2020 |
Q1 |
24,351 |
63,759 |
88,110 |
| Q2 |
22,939 |
57,512 |
80,451 |
| Q3 |
22,064 |
53,344 |
75,408 |
| Q4 |
21,758 |
51,236 |
72,994 |
| 2021 |
Q1 |
21,720 |
51,276 |
72,996 |
| Q2 |
21,620 |
51,012 |
72,632 |
| Q3 |
21,475 |
50,169 |
71,644 |
| Q4 |
21,681 |
50,789 |
72,470 |
| 2022 |
Q1 |
21,886 |
51,793 |
73,679 |
| Q2 |
22,148 |
52,748 |
74,896 |
| Q3 |
22,415 |
53,839 |
76,254 |
| Q4 |
22,677 |
55,030 |
77,707 |
Source: BLMI, Labour Market Regulation Authority (LMRA)
ANNEXED NOTE
- Technical Notes and Definitions
Data are extracted from the Domestic Workers System of the Labour Market Regulation Authority (LMRA).
The drop in number of domestic workers in Q2 2018 is due to data cleansing of domestic records during Q2 at LMRA.
Includes active domestic work permits for which a residence permit has been issued.
From Q1 2019 onwards, figures of domestic permits were reviewed to include the domestic workers holding active work permit, in addition to in-progress permits issued with a residence permit.
The figures also include domestic work permits due for renewal that have not been terminated or cancelled by the employer.
- Institution which provides data
Labour Market Regulatory Authority (LMRA)
- Data availability
Labour Market Regulatory Authority (LMRA), Kingdom of Bahrain, based on data from Bahrain Labour Market Indicators (https://blmi.lmra.gov.bh/2022/12/mi_data.xml).
Data are tabulated in PDF and Excel formats.
The definitions that the LMRA adopts for its data can be found in the Glossary section: (http://blmi.lmra.bh/mi_glossary.xml)
Date of access: March 2023.
GLMM and GRC cannot guarantee that the link to access the source will not change; that the information will not be removed from the website it was obtained from; that no geo-blockages will be imposed; or that the information will not be available for any another reason.
Keywords: Bahrain, National Labour, Foreign Labour, Employment, Female Employment, Domestic Workers
| |
Q4 2018 |
Q4 2019 |
Q4 2020 |
Q4 2021 |
Q4 2022 |
| Males |
Females |
Males |
Females |
Males |
Females |
Males |
Females |
Males |
Females |
| India |
9,222 |
11,411 |
9,574 |
10,569 |
8,687 |
8,310 |
8,660 |
9,479 |
9,049 |
11,397 |
| Philippines |
552 |
19,359 |
537 |
18,167 |
477 |
16,105 |
494 |
19,185 |
484 |
20,878 |
| Bangladesh |
8,598 |
1,007 |
8,546 |
880 |
7,556 |
748 |
8,100 |
691 |
8,128 |
654 |
| Indonesia |
46 |
6,616 |
50 |
5,891 |
46 |
4,590 |
41 |
5,297 |
42 |
5,392 |
| Sri Lanka |
392 |
3,032 |
395 |
2,930 |
360 |
2,613 |
361 |
2,792 |
420 |
3,167 |
| Pakistan |
2,496 |
93 |
2,766 |
102 |
2,638 |
84 |
2,947 |
81 |
3,402 |
114 |
| Ethiopia |
57 |
21,590 |
45 |
15,649 |
37 |
10,800 |
35 |
9,075 |
42 |
10,005 |
| Kenya |
29 |
3,665 |
31 |
5,227 |
34 |
4,319 |
36 |
2,796 |
40 |
1,758 |
| Total |
22,552 |
68,039 |
23,036 |
60,974 |
20,779 |
49,095 |
21,681 |
50,789 |
77,707 |
53,365 |
Source: BLMI, Labour Market Regulation Authority (LMRA)
ANNEXED NOTE
- Technical Notes and Definitions
Data are extracted from the Domestic Workers System of the Labour Market Regulation Authority (LMRA)
The drop in number of domestic workers in Q2 2018 is due to data cleansing of domestic records during Q2 at LMRA
Includes active domestic work permits for which a residence permit has been issued.
From Q1 2019 onwards, figures of domestic permits were reviewed to include the domestic workers holding active work permit, in addition to in-progress permits issued with a residence permit.
The figures also include domestic work permits due for renewal that have not been terminated or cancelled by the employer.
- Institution which provides data
Labour Market Regulatory Authority (LMRA)
- Data availability
Labour Market Regulatory Authority (LMRA), Kingdom of Bahrain, based on data from Bahrain Labour Market Indicators (https://blmi.lmra.gov.bh/2022/12/mi_data.xml).
Data are tabulated in PDF and Excel formats.
The definitions that the LMRA adopts for its data can be found in the Glossary section: (http://blmi.lmra.bh/mi_glossary.xml)
Date of access: March 2023.
GLMM and GRC cannot guarantee that the link to access the source will not change; that the information will not be removed from the website it was obtained from; that no geo-blockages will be imposed; or that the information will not be available for any another reason.
Keywords: Bahrain, National Labour, Foreign Labour, Employment, Domestic Workers, India, Bangladesh, Pakistan, Philippines, Nepal, Sri Lanka, Kenya, Ethiopia
| |
Males |
Females |
Total |
| Housemaid |
0 |
53,642 |
53,642 |
| Private chauffeur |
13,056 |
21 |
13,077 |
| Servant |
4,581 |
1 |
4,582 |
| Gardener (Private homes) |
2,598 |
|
2,598 |
| Cook (Private homes) |
1,525 |
291 |
1,816 |
| Nursemaid |
|
832 |
832 |
| Cook |
543 |
180 |
723 |
| Concierge (private residences) |
217 |
|
217 |
| Yachtsman |
122 |
|
122 |
| Nurse (general) |
10 |
37 |
47 |
| Aide (nursing) |
8 |
12 |
20 |
| Cook (assistant) |
12 |
2 |
14 |
| Nurse (general) |
|
11 |
11 |
| Waiter (private service) |
5 |
1 |
6 |
| Total |
22,677 |
55,030 |
77,707 |
Source: BLMI, Labour Market Regulation Authority (LMRA)
ANNEXED NOTE
- Technical Notes and Definitions
Data are extracted from the Domestic Workers System of the Labour Market Regulation Authority (LMRA)
The drop in number of domestic workers in Q2 2018 is due to data cleansing of domestic records during Q2 at LMRA
Includes active domestic work permits for which a residence permit has been issued.
From Q1 2019 onwards, figures of domestic permits were reviewed to include the domestic workers holding active work permit, in addition to in-progress permits issued with a residence permit.
The figures also include domestic work permits due for renewal that have not been terminated or cancelled by the employer.
- Institution which provides data
Labour Market Regulatory Authority (LMRA)
- Data availability
Labour Market Regulatory Authority (LMRA), Kingdom of Bahrain, based on data from Bahrain Labour Market Indicators (https://blmi.lmra.gov.bh/2022/12/mi_data.xml).
Data are tabulated in PDF and Excel formats.
The definitions that the LMRA adopts for its data can be found in the Glossary section: (http://blmi.lmra.bh/mi_glossary.xml)
Date of access: March 2023.
GLMM and GRC cannot guarantee that the link to access the source will not change; that the information will not be removed from the website it was obtained from; that no geo-blockages will be imposed; or that the information will not be available for any another reason.
Keywords: Bahrain, National Labour, Foreign Labour, Employment, Domestic Workers, Female Employment
|
Q4 2018 |
Q4 2019 |
Q4 2020 |
Q4 2021 |
Q4 2022 |
|
| India |
20,633 |
20,143 |
16,997 |
18,139 |
20,446 |
| Philippines |
19,911 |
18,704 |
16,582 |
19,679 |
21,362 |
| Bangladesh |
9,605 |
9,426 |
8,304 |
8,791 |
8,782 |
| Indonesia |
6,662 |
5,941 |
4,636 |
5,338 |
5,434 |
| Sri Lanka |
3,424 |
3,325 |
2,973 |
3,153 |
3,587 |
| Pakistan |
2,589 |
2,868 |
2,722 |
3,028 |
3,516 |
| Ethiopia |
21,647 |
15,694 |
10,837 |
9,110 |
10,047 |
| Kenya |
3,694 |
5,258 |
4,353 |
2,832 |
1,798 |
| Total |
90,591 |
84,010 |
69,874 |
72,470 |
77,707 |
Source: BLMI, Labour Market Regulation Authority (LMRA)
ANNEXED NOTE
- Technical Notes and Definitions
Data are extracted from the Domestic Workers System of the Labour Market Regulation Authority (LMRA)
The drop in number of domestic workers in Q2 2018 is due to data cleansing of domestic records during Q2 at LMRA
Includes active domestic work permits for which a residence permit has been issued.
From Q1 2019 onwards, figures of domestic permits were reviewed to include the domestic workers holding active work permit, in addition to in-progress permits issued with a residence permit.
The figures also include domestic work permits due for renewal that have not been terminated or cancelled by the employer.
- Institution which provides data
Labour Market Regulatory Authority (LMRA)
- Data availability
Labour Market Regulatory Authority (LMRA), Kingdom of Bahrain, based on data from Bahrain Labour Market Indicators (https://blmi.lmra.gov.bh/2022/12/mi_data.xml).
Data are tabulated in PDF and Excel formats.
The definitions that the LMRA adopts for its data can be found in the Glossary section: (http://blmi.lmra.bh/mi_glossary.xml)
Date of access: March 2023.
GLMM and GRC cannot guarantee that the link to access the source will not change; that the information will not be removed from the website it was obtained from; that no geo-blockages will be imposed; or that the information will not be available for any another reason.
Keywords: Bahrain, National Labour, Foreign Labour, Employment, Domestic Workers, India, Bangladesh, Pakistan, Philippines, Nepal, Sri Lanka, Kenya, Ethiopia
|
Public Sector |
Private Sector |
Domestic Workers |
Total workers (all sectors) |
| Bahrainis |
Non-Bahrainis |
Total |
Bahrainis |
Non-Bahrainis |
Total |
Bahrainis |
Non-Bahrainis |
Total |
Bahrainis |
Non-Bahrainis |
Total |
| 2018 |
Q1 |
53,977 |
9,865 |
63,842 |
104,399 |
498,941 |
603,340 |
0 |
103,527 |
103,527 |
158,376 |
612,333 |
770,709 |
| Q2 |
53,932 |
9,730 |
63,662 |
104,882 |
499,879 |
604,761 |
0 |
91,852 |
91,852 |
158,814 |
601,461 |
760,275 |
| Q3 |
53,688 |
9,626 |
63,314 |
104,499 |
497,270 |
601,769 |
0 |
90,160 |
90,160 |
158,187 |
597,056 |
755,243 |
| Q4 |
53,947 |
9,635 |
63,582 |
105,214 |
503,006 |
608,220 |
0 |
90,591 |
90,591 |
159,161 |
603,232 |
762,393 |
| 2019 |
Q1 |
49,271 |
9,634 |
58,905 |
104,661 |
501,641 |
606,302 |
0 |
87,742 |
87,742 |
153,932 |
599,017 |
752,949 |
| Q2 |
46,712 |
9,468 |
56,180 |
106,391 |
499,127 |
605,518 |
0 |
87,444 |
87,444 |
153,103 |
596,039 |
749,142 |
| Q3 |
46,130 |
9,328 |
55,458 |
106,782 |
498,291 |
605,073 |
0 |
87,086 |
87,086 |
152,912 |
594,705 |
747,617 |
| Q4 |
46,883 |
9,224 |
56,107 |
106,825 |
498,999 |
605,824 |
0 |
87,503 |
87,503 |
153,708 |
595,726 |
749,434 |
| 2020 |
Q1 |
47,435 |
9,183 |
56,618 |
109,311 |
494,485 |
603,796 |
0 |
88,110 |
88,110 |
156,746 |
591,778 |
748,524 |
| Q2 |
47,787 |
9,334 |
57,121 |
109,022 |
492,373 |
601,395 |
0 |
80,451 |
80,451 |
156,809 |
582,158 |
738,967 |
| Q3 |
47,846 |
9,449 |
57,295 |
106,007 |
468,057 |
574,064 |
0 |
75,408 |
75,408 |
153,853 |
552,914 |
706,767 |
| Q4 |
47,993 |
9,438 |
57,431 |
104,685 |
460,022 |
564,707 |
0 |
72,994 |
72,994 |
152,678 |
542,454 |
695,132 |
| 2021 |
Q1 |
47,998 |
9,283 |
57,281 |
105,759 |
457,335 |
563,094 |
0 |
72,996 |
72,996 |
153,757 |
539,614 |
693,371 |
| Q2 |
48,129 |
9,425 |
57,554 |
107,618 |
452,034 |
559,652 |
0 |
72,632 |
72,632 |
155,747 |
534,091 |
689,838 |
| Q3 |
48,246 |
9,286 |
57,532 |
107,532 |
437,434 |
544,966 |
0 |
71,644 |
71,644 |
155,778 |
518,364 |
674,142 |
| Q4 |
48,651 |
9,204 |
57,855 |
109,378 |
448,485 |
557,863 |
0 |
72,470 |
72,470 |
158,029 |
530,159 |
688,188 |
| 2022 |
Q1 |
49,093 |
9,110 |
58,203 |
110,607 |
465,248 |
575,855 |
0 |
73,679 |
73,679 |
159,700 |
548,037 |
707,737 |
| Q2 |
49,465 |
8,954 |
58,419 |
111,965 |
479,482 |
591,447 |
0 |
74,896 |
74,896 |
161,430 |
563,332 |
724,762 |
| Q3 |
49,761 |
8,782 |
58,543 |
111,851 |
489,406 |
601,257 |
0 |
76,254 |
76,254 |
161,612 |
574,442 |
736,054 |
| Q4 |
50,242 |
8,649 |
58,891 |
113,229 |
496,318 |
609,547 |
0 |
77,707 |
77,707 |
163,471 |
582,674 |
746,145 |
Source: BLMI, Labour Market Regulation Authority (LMRA)
ANNEXED NOTE
1. Technical Notes and Definitions
Data are extracted from the files submitted by Expatriate Management System (LMRA-EMS), General Organisation for Social Insurance (GOSI), Pension Fund Commission (PFC), and Civil Service Bureau (CSB) monthly data files to LMRA.
LMRA data do not include non-civilian employees (engaged in military, defence and other relevant entities and ranked as so).
1. From 2008 Q2 onward, “Public sector” for non-Bahraini workers refers to workers in the “Government sector” of the Expatriate Management System (EMS) of LMRA.
2. “Private Sector” for non-Bahraini workers refers to the sum of “Commercial” and “Non-Commercial, Non-Government” (NCNG) sectors of LMRA’s EMS system.
3. Male population includes persons with unrecorded sex attribute.
4. Details may not add up to totals due to rounding error. Also, data from this table may differ from totals obtained from other tables in the series (Tables A1, A2, A06, A07, A10 and A99).
5. The drop in number of domestic workers in Q2 2018 is due to data cleansing of domestic records during Q2 at LMRA
6. From the period 2019 Q1 onwards the Domestic permit counts have been reviewed to include the domestic workers holding active work permits in addition to in-progress permits issued with a residence permit. The count also includes domestic permits due for renewal that have not been terminated or cancelled by the employer.
Employment as defined by the LMRA is in line with the ILO resolution concerning statistics of the economically active population, employment, unemployment and underemployment.
It includes all persons above a specific age during a specific period either in paid employment or in self-employment and includes the following:
(a) paid employment
(a1) at work: persons who during the reference period performed some work for wage or salary, in cash or in kind, even for one hour
(a2) with a job but not at work: persons who, having already worked in their present job, were temporarily not at work during the reference period and had a formal attachment to their job
(e.g., absence because of illness or injury, holiday or vacation, strike or lockout, educational or training leave, maternity or parental leave, reduction in economic activity, etc.)
(b) self employment
(b1) at work: persons who during the reference period performed some work for profit or family gain, in cash or in kind
(b2) with an enterprise but not at work: persons with an enterprise, which may be a business enterprise, a farm or a service undertaking,
who were temporarily not at work during the reference period for any specific reason.
2. Institution which provides data
Labour Market Regulatory Authority (LMRA)
3. Data availability
Labour Market Regulatory Authority (LMRA), Kingdom of Bahrain, based on data from Bahrain Labour Market Indicators (https://blmi.lmra.gov.bh/2022/12/data/lmr/Table_A.xlsx).
Data are tabulated in PDF and Excel formats.
The definitions that the LMRA adopts for its data can be found in the Glossary section: (http://blmi.lmra.bh/mi_glossary.xml)
Date of access: March 2023.
GLMM and GRC cannot guarantee that the link to access the source will not change; that the information will not be removed from the website it was obtained from; that no geo-blockages will be imposed; or that the information will not be available for any another reason.
Keywords: Bahrain, National Labour, Foreign Labour, Employment, Domestic Workers
| |
2015 |
2016 |
2017 |
2018 |
2019 |
2020 |
2021 |
2022 |
| Males |
Females |
Males |
Females |
Males |
Females |
Males |
Females |
Males |
Females |
Males |
Females |
Males |
Females |
Males |
Females |
| India |
184,719 |
84,383 |
217,191 |
83,841 |
221,905 |
70,620 |
230,313 |
79,334 |
238,582 |
98,499 |
225,555 |
98,526 |
210,135 |
92,237 |
213,081 |
89,605 |
| Philippines |
858 |
114,909 |
999 |
154,166 |
959 |
163,133 |
859 |
139,581 |
851 |
147,929 |
819 |
147,090 |
779 |
137,155 |
937 |
161,104 |
| Bangladesh |
52,289 |
1,338 |
18,618 |
1,026 |
74,429 |
1,079 |
91,880 |
1,205 |
87,746 |
1,105 |
77,355 |
903 |
78,913 |
932 |
76,900 |
821 |
| Sri Lanka |
17,330 |
60,679 |
51,540 |
56,322 |
16,815 |
51,517 |
15,936 |
56,252 |
16,266 |
64,734 |
15,635 |
60,618 |
15,473 |
58,112 |
15,456 |
57,314 |
| Ethiopia |
3,159 |
43,664 |
1,557 |
28,653 |
1,288 |
19,520 |
1,230 |
16,864 |
1,204 |
21,177 |
1,077 |
16,773 |
998 |
13,397 |
888 |
9,026 |
| Nepal |
2,567 |
19,203 |
1,981 |
20,110 |
1,716 |
22,715 |
1,479 |
23,872 |
1,186 |
18,648 |
995 |
14,053 |
940 |
12,597 |
929 |
12,754 |
| Indonesia |
33 |
8,873 |
24 |
4,272 |
19 |
3,708 |
14 |
3,232 |
12 |
2,903 |
12 |
2,371 |
10 |
2,533 |
9 |
2,232 |
| Ghana |
296 |
4,337 |
483 |
7,577 |
320 |
4,782 |
205 |
2,134 |
|
|
|
|
|
|
|
|
| Madagascar |
6 |
1,970 |
3 |
1,784 |
12 |
5,437 |
11 |
4,356 |
6 |
2,578 |
3 |
1,711 |
|
|
|
|
| Pakistan |
1,972 |
26 |
1,953 |
26 |
|
|
|
|
1,815 |
12 |
|
|
1,619 |
9 |
1,533 |
6 |
| Ivory Coast |
|
|
|
|
231 |
2,019 |
285 |
3,816 |
246 |
3,786 |
179 |
2,175 |
159 |
1,230 |
|
|
| Benin |
|
|
|
|
|
|
|
|
|
|
100 |
2,181 |
96 |
1,777 |
149 |
2,687 |
| Sudan |
|
|
|
|
|
|
|
|
|
|
|
|
|
|
1,485 |
4 |
| Other countries |
4,350 |
2,975 |
5,035 |
5,001 |
7,137 |
5,902 |
7,616 |
8,110 |
6,357 |
8,790 |
7,262 |
4,869 |
5,410 |
4,549 |
4,178 |
3,666 |
| Total |
267,579 |
342,357 |
299,384 |
362,778 |
324,831 |
350,432 |
349,828 |
338,756 |
354,271 |
370,161 |
328,992 |
351,270 |
314,532 |
324,528 |
315,545 |
339,219 |
Source: Central Statistical Bureau (CSB), Labour Market Information System (LMIS), Integrated Database
ANNEXED NOTE
1. Characteristics of data and definitions
Kuwait’s Labour Market Information System (KLMIS) was developed by the Central Statistical Bureau (CSB), in collaboration with relevant other government agencies.
https://lmis.csb.gov.kw/ar/Default.aspx;
https://lmis.csb.gov.kw/En/Docs/KLMI%20Report%20English%20-%20Final%20Version.pdf.
KLMIS’s Integrated database, updated on a quarterly basis, tabulates basic data on nationals’ and foreign migrants’ employment, taken from four administrative sources:
the Civil Service Commission (CSC) (public sector’s statistics);
the Public Authority for Civil Information (PACI) (public entities which are not included in the Civil Service Commission records);
the Public Authority for Manpower (PAM) (statistics on workers in the private sector);
Ministry of Interior (MoI) (domestic workers).
Information on LMIS’s data sources is taken from:
Al Daas, M. Labor Statistics for evidence-based policies,
https://www.iaos-isi.org/images/IAOS2017-19/2016Conference/P5C/Mona_Al_daas_paper.pdf, p. 3.
2. Institution which provides data
The Central Statistical Bureau (CSB)
https://www.csb.gov.kw/
https://www.csb.gov.kw/default_en
3. Period of data coverage
30/06, given years.
4. Data availability
Kuwait: Central Statistical Bureau. Integrated Database – LMIS
https://lmis.csb.gov.kw/
https://lmis.csb.gov.kw/default_En
Data are available in Arabic and English, by quarter, for every year since 2014.
https://lmis.csb.gov.kw/IntegratedDataView_En
Last date of access: December 2022.
GLMM and GRC cannot guarantee that the link to access the source will not change; that the information will not be removed from the website it was obtained from; that no geo-blockages will be imposed; or that the information will not be available for any another reason.
Keywords: Kuwait, Domestic Workers, Foreign Labour, Employment, Labour Market, India, Bangladesh, Pakistan, Philippines, Nepal, Sri Lanka, Kenya, Ethiopia, Madagascar, Ivory Coast, Benin, Sudan
| |
Q2 2015
|
Q2 2016
|
Q2 2017
|
Q2 2018
|
Q2 2019
|
Q2 2020
|
Q2 2021
|
Q2 2022
|
| India |
269,102
|
301,032
|
292,525
|
309,647
|
337,081
|
324,081
|
302,372
|
302,686
|
| Philippines |
115,767
|
155,165
|
164,092
|
140,440
|
148,780
|
147,909
|
137,934
|
162,041
|
| Bangladesh |
53,627
|
52,566
|
75,508
|
93,085
|
88,851
|
78,258
|
79,845
|
77,721
|
| Sri Lanka |
78,009
|
74,940
|
68,332
|
72,188
|
81,000
|
76,253
|
73,585
|
72,770
|
| Ethiopia |
46,823
|
30,210
|
20,808
|
18,094
|
22,381
|
17,850
|
14,395
|
9,914
|
| Nepal |
21,770
|
22,091
|
24,431
|
25,351
|
19,834
|
15,048
|
13,537
|
13,683
|
| Indonesia |
8,906
|
4,296
|
3,727
|
3,246
|
2,915
|
2,383
|
2,543
|
2,241
|
| Ghana |
4,633
|
8,060
|
5,102
|
2,339
|
|
|
|
|
| Madagascar |
1,976
|
1,787
|
5,449
|
4,367
|
2,584
|
1,714
|
|
|
| Pakistan |
1,998
|
1,979
|
|
|
1,827
|
|
1,628
|
1,539
|
| Ivory Coast |
|
|
2,250
|
4,101
|
4,032
|
2,354
|
1,389
|
|
| Benin |
|
|
|
|
|
2,281
|
1,873
|
2,836
|
| Sudan |
|
|
|
|
|
|
|
1,489
|
| Other countries |
7,325
|
10,036
|
13,039
|
15,726
|
15,147
|
12,131
|
9,959
|
7,844
|
| Total |
609,936
|
662,162
|
675,263
|
688,584
|
724,432
|
680,262
|
639,060
|
654,764
|
Source: Central Statistical Bureau (CSB), Labour Market Information System (LMIS), Integrated Database
ANNEXED NOTE
1. Characteristics of data and definitions
Kuwait’s Labour Market Information System (KLMIS) was developed by the Central Statistical Bureau (CSB), in collaboration with relevant other government agencies.
https://lmis.csb.gov.kw/ar/Default.aspx;
https://lmis.csb.gov.kw/En/Docs/KLMI%20Report%20English%20-%20Final%20Version.pdf.
KLMIS’s Integrated database, updated on a quarterly basis, tabulates basic data on nationals’ and foreign migrants’ employment, taken from four administrative sources:
the Civil Service Commission (CSC) (public sector’s statistics);
the Public Authority for Civil Information (PACI) (public entities which are not included in the Civil Service Commission records);
the Public Authority for Manpower (PAM) (statistics on workers in the private sector);
Ministry of Interior (MoI) (domestic workers).
Information on LMIS’s data sources is taken from:
Al Daas, M. Labor Statistics for evidence-based policies,
https://www.iaos-isi.org/images/IAOS2017-19/2016Conference/P5C/Mona_Al_daas_paper.pdf, p. 3.
2. Institution which provides data
The Central Statistical Bureau (CSB)
https://www.csb.gov.kw/
https://www.csb.gov.kw/default_en
3. Period of data coverage
30/06, given years.
4. Data availability
Kuwait: Central Statistical Bureau. Integrated Database – LMIS
https://lmis.csb.gov.kw/
https://lmis.csb.gov.kw/default_En
Data are available in Arabic and English, by quarter, for every year since 2014.
https://lmis.csb.gov.kw/IntegratedDataView_En
Last date of access: December 2022.
GLMM and GRC cannot guarantee that the link to access the source will not change; that the information will not be removed from the website it was obtained from; that no geo-blockages will be imposed; or that the information will not be available for any another reason.
Keywords: Kuwait, Domestic Workers, Foreign Labour, Employment, Labour Market, India, Bangladesh, Pakistan, Philippines, Nepal, Sri Lanka, Kenya, Ethiopia, Madagascar, Ivory Coast, Benin, Sudan
| |
|
Govern-ment Dpt
|
Govern-ment Company/ Corpora-tion
|
Mixed
|
Private
|
Diplomatic/Internatio-nal/ Regional
|
Non-profit
|
Domestic
|
Total
|
|
Illiterate
|
males |
0
|
0
|
0
|
14,697
|
0
|
0
|
0
|
14,697
|
| females |
0
|
0
|
0
|
0
|
0
|
0
|
98
|
98
|
|
Read & write
|
males |
411
|
668
|
483
|
151,253
|
0
|
0
|
10,591
|
163,406
|
| females |
0
|
0
|
0
|
2,532
|
0
|
0
|
11,819
|
14,351
|
|
Primary
|
males |
2,836
|
980
|
1,605
|
318,476
|
41
|
17
|
21,815
|
345,770
|
| females |
215
|
0
|
0
|
4,910
|
0
|
0
|
20,285
|
25,410
|
|
Preparatory
|
males |
6,815
|
3,533
|
3,049
|
406,889
|
86
|
25
|
24,865
|
445,262
|
| females |
391
|
836
|
54
|
12,724
|
0
|
0
|
30,225
|
44,230
|
|
Secondary
|
males |
16,756
|
6,969
|
2,833
|
204,799
|
1,963
|
277
|
6,830
|
240,427
|
| females |
1,732
|
2,266
|
139
|
25,234
|
367
|
195
|
29,057
|
58,990
|
|
Pre.U. Diploma
|
males |
2,551
|
1,979
|
2,245
|
37,329
|
123
|
0
|
201
|
44,428
|
| females |
322
|
1,092
|
82
|
9,551
|
0
|
0
|
865
|
11,912
|
|
University and above
|
males |
30,422
|
23,797
|
10,703
|
320,548
|
2,735
|
977
|
111
|
389,293
|
| females |
14,283
|
10,872
|
1,849
|
75,176
|
1,520
|
81
|
4,024
|
107,805
|
|
Total
|
males |
59,791
|
37,926
|
20,918
|
1,453,991
|
4,948
|
1,296
|
64,413
|
1,643,283
|
| females |
16,943
|
15,066
|
2,124
|
130,127
|
1,887
|
276
|
96,373
|
262,796
|
Source: Annual Bulletin of Labour Force Sample Survey 2021
ANNEXED NOTE
1. Technical Notes and Definitions
The data is taken from 2021 Labour Force Survey (yearly synthesis)
Sampling frame: Population Census 2015.
Sample size: 59,997 persons, in 9,200 households: 1- Qatari households; 2- Non-Qatari regular (non-collective) households; 3- Non-Qatari small collective households or labour gatherings (2 – 6 persons); 4- Non-Qatari large collective households or large labour gatherings (7 persons or more)
Data Collection: The sample was divided into equal parts to collect data monthly. Each month 1/3 of the quarterly data were collected during the first two weeks of the month.
Reference period for the labour force data: the week prior to data collection day.
Population of reference: all Qatari and non-Qatari households present in Qatar on the night of survey, living in normal and collective households.
The collective households are a group of persons not related to each other and sharing living conditions in a residential unit, I.e. labour camps, students living boarding
schools, nurses in hospitals… etc. The survey covered the small collective households (includes less than 7 persons) and large collective households (includes 7 persons or more).
The survey did not cover short periods accommodation, i.e. hotels.
The present data includes active population, i.e. employed and unemployed. It does not include persons seeking work for the first time.
“Mixed” sector refers to establishments in which the government shares capital with another party, whether national, regional or foreign.
The “Government” sector may not include employees in the security and military sectors.
2. Institution which provides data
Planning and Statistics Authority (PSA)
(https://www.psa.gov.qa/en/Pages/default.aspx)
3. Data availability
The Statistics Authority conducted the first labour Force Sample Survey in 2001. After 2006, surveys were conducted on an annual basis.
After 2013, LFS surveys were conducted on a quarterly basis.
Labour Force Surveys (yearly and quarterly data) can be downloaded from PSA’s website, in PDF and Excel format:
https://www.psa.gov.qa/en/statistics1/pages/topicslisting.aspx?parent=Social&child=LaborForce
Last date of access: March 2023.
GLMM and GRC cannot guarantee that the link to access the source will not change;
that the information will not be removed from the website it was obtained from;
that no geo-blockages will be imposed; or that the information will not be available for any another reason.
Keywords: Qatar, Labour Market, Employment, National & Foreign Labour, National Labour, Foreign Labour, Domestic Workers
| |
Males
|
Females
|
Total
|
| Housekeepers |
1,331
|
1,194
|
2,525
|
| Drivers |
1,741,062
|
117
|
1,741,179
|
| Servants and house cleaners |
687,185
|
866,303
|
1,553,488
|
| Cooks and food providers |
53,053
|
2,959
|
56,012
|
| House guards |
23,977
|
12
|
23,989
|
| Gardeners/farmers |
2,113
|
1
|
2,114
|
| Private tailors |
530
|
699
|
1,229
|
| Nurses and health professionals at homes |
565
|
1,238
|
1,803
|
| Private teachers and nannies at homes |
26
|
4,704
|
4,730
|
| Total |
2,509,842
|
877,227
|
3,387,069
|
Source: Register-based Labour Market Statistics, General Authority for Statistics (GAStat)
1. Data collection methodology
LFS were first conducted in 2001 and became bi-annual after 2006. Data were collected through nationally representative household sample surveys, which sampling was based on most recent censuses. Since 2016, Labour Force Surveys have been conducted and published on a quarterly basis, based on a household telephone survey conducted by GAStat. Employment data extracted from administrative records were also introduced as a complement to the results of Labour Force Surveys in Labour Market Statistics’ publications, starting on Q1 2017.
The present data is taken from administrative records.
GAStat Labour Market Statistics: administrative records
Estimates of figures and characteristics of employment in Saudi Arabia are taken from administrative records from the following institutions:
– Ministry of Human Resources and Social Development (MHRSD)
(formerly Ministry of Labour and Social Development):
Supplies data on Government sector’s workers.
– General Organization of Social Insurance (GOSI):
Supplies data on:
a. contributors on the job who are subject to social insurance laws and regulations in the private
and government sector;
b. workers who terminated their contribution to social insurance during the quarter.
– National Information Center (NIC), Ministry of Interior:
Supplies data on domestic workers.
2. Institution which provides data
General Authority for Statistics (GAStat) https://www.stats.gov.sa/en
3. Data availability
Data on foreign labourers employed in the domestic sector have been published quarterly since Q2, 2016 in GAStat’s Labour Force Surveys.
https://www.stats.gov.sa/en/813
The present data is taken from Labour Force Survey 2022 (Q2) (Excel format).
Last date of access: March 2023.
GLMM and GRC cannot guarantee that the link to access the source will not change; that the information will not be removed from the website it was obtained from; that no geo-blockages will be imposed; or that the information will not be available for any another reason.
Keywords: Domestic Workers, Saudi Arabia, Foreign Labour
| |
Govern-ment |
Govern-ment Company/ Corporation |
Mixed |
Private |
Diplo-matic/
Interna-tional/ Regional |
Non profit |
Domestic |
Total |
| Bahrain |
Bahrainis |
Males |
22,976 |
n/a |
n/a |
75,352 |
n/a |
n/a |
0 |
98,328 |
| Females |
26,489 |
n/a |
n/a |
36,613 |
n/a |
n/a |
0 |
63,102 |
| Total |
49,465 |
n/a |
n/a |
111,965 |
n/a |
n/a |
0 |
161,430 |
| Non-Bahrainis |
Males |
5,582 |
n/a |
n/a |
436,480 |
n/a |
n/a |
22,148 |
464,210 |
| Females |
3,372 |
n/a |
n/a |
43,002 |
n/a |
n/a |
52,748 |
99,122 |
| Total |
8,954 |
n/a |
n/a |
479,482 |
n/a |
n/a |
74,896 |
563,332 |
| Total |
Males |
28,558 |
n/a |
n/a |
511,832 |
n/a |
n/a |
22,148 |
562,538 |
| Females |
29,861 |
n/a |
n/a |
79,615 |
n/a |
n/a |
52,748 |
162,224 |
| Total |
58,419 |
n/a |
n/a |
591,447 |
n/a |
n/a |
74,896 |
724,762 |
| Kuwait |
Kuwaitis |
Males |
148,158 |
n/a |
n/a |
36,997 |
n/a |
n/a |
0 |
185,155 |
| Females |
218,080 |
n/a |
n/a |
35,324 |
n/a |
n/a |
0 |
253,404 |
| Total |
366,238 |
n/a |
n/a |
72,321 |
n/a |
n/a |
0 |
438,559 |
| Non-Kuwaitis |
Males |
50,829 |
n/a |
n/a |
1,253,533 |
n/a |
n/a |
315,545 |
1,619,907 |
| Females |
40,082 |
n/a |
n/a |
132,862 |
n/a |
n/a |
339,219 |
512,163 |
| Total |
90,911 |
n/a |
n/a |
1,386,395 |
n/a |
n/a |
654,764 |
2,132,070 |
| Total |
Males |
198,987 |
n/a |
n/a |
1,290,530 |
n/a |
n/a |
315,545 |
1,805,062 |
| Females |
258,162 |
n/a |
n/a |
168,186 |
n/a |
n/a |
339,219 |
765,567 |
| Total |
457,149 |
n/a |
n/a |
1,458,716 |
n/a |
n/a |
654,764 |
2,570,629 |
| Oman |
Omanis |
Males |
N.A. |
n/a |
n/a |
N.A. |
n/a |
n/a |
N.A. |
N.A. |
| Females |
N.A. |
n/a |
n/a |
N.A. |
n/a |
n/a |
N.A. |
N.A. |
| Total |
N.A. |
n/a |
n/a |
282,363 |
n/a |
n/a |
N.A. |
N.A. |
| Non-Omanis |
Males |
N.A. |
n/a |
n/a |
N.A. |
n/a |
n/a |
N.A. |
N.A. |
| Females |
N.A. |
n/a |
n/a |
N.A. |
n/a |
n/a |
N.A. |
N.A. |
| Total |
31,125 |
n/a |
n/a |
1,250,880 |
n/a |
n/a |
271,976 |
1,553,981 |
| Total |
Males |
N.A. |
n/a |
n/a |
N.A. |
n/a |
n/a |
N.A. |
N.A. |
| Females |
N.A. |
n/a |
n/a |
N.A. |
n/a |
n/a |
N.A. |
N.A. |
| Total |
|
n/a |
n/a |
N.A. |
n/a |
n/a |
N.A. |
N.A. |
| Qatar |
Qataris |
Males |
50,843 |
7,558 |
5,680 |
5,921 |
164 |
148 |
0 |
70,314 |
| Females |
31,292 |
5,936 |
4,048 |
3,634 |
98 |
183 |
0 |
45,191 |
| Total |
82,135 |
13,494 |
9,728 |
9,555 |
262 |
331 |
0 |
115,505 |
| Non-Qataris |
Males |
59,791 |
37,926 |
20,918 |
1,453,991 |
4,948 |
1,296 |
64,413 |
1,643,283 |
| Females |
16,943 |
15,066 |
2,124 |
130,127 |
1,887 |
276 |
96,373 |
262,796 |
| Total |
76,734 |
52,992 |
23,042 |
1,584,118 |
6,835 |
1,572 |
160,786 |
1,906,079 |
| Total |
Males |
110,634 |
45,484 |
26,598 |
1,459,912 |
5,112 |
1,444 |
64,413 |
1,713,597 |
| Females |
48,235 |
21,002 |
6,172 |
133,761 |
1,985 |
459 |
96,373 |
307,987 |
| Total |
158,869 |
66,486 |
32,770 |
1,593,673 |
7,097 |
1,903 |
160,786 |
2,021,584 |
| Saudi Arabia |
Saudis |
Males |
955,378 |
n/a |
n/a |
1,307,157 |
n/a |
n/a |
0 |
2,262,535 |
| Females |
588,923 |
n/a |
n/a |
786,686 |
n/a |
n/a |
0 |
1,375,609 |
| Total |
1,544,301 |
n/a |
n/a |
2,093,843 |
n/a |
n/a |
0 |
3,638,144 |
| Non-Saudis |
Males |
97,271 |
n/a |
n/a |
6,713,866 |
n/a |
n/a |
2,509,842 |
9,320,979 |
| Females |
62,212 |
n/a |
n/a |
271,201 |
n/a |
n/a |
877,227 |
1,210,640 |
| Total |
159,483 |
n/a |
n/a |
6,985,067 |
n/a |
n/a |
3,387,069 |
10,531,619 |
| Total |
Males |
1,052,649 |
n/a |
n/a |
8,021,023 |
n/a |
n/a |
2,509,842 |
11,583,514 |
| Females |
651,135 |
n/a |
n/a |
1,057,887 |
n/a |
n/a |
877,227 |
2,586,249 |
| Total |
1,703,784 |
n/a |
n/a |
9,078,910 |
n/a |
n/a |
3,387,069 |
14,169,763 |
| UAE |
Emiratis |
Males |
N.A. |
n/a |
n/a |
N.A. |
n/a |
n/a |
N.A. |
N.A. |
| Females |
N.A. |
n/a |
n/a |
N.A. |
n/a |
n/a |
N.A. |
N.A. |
| Total |
N.A. |
n/a |
n/a |
N.A. |
n/a |
n/a |
N.A. |
N.A. |
| Non-Emiratis |
Males |
N.A. |
n/a |
n/a |
N.A. |
n/a |
n/a |
N.A. |
N.A. |
| Females |
N.A. |
n/a |
n/a |
N.A. |
n/a |
n/a |
N.A. |
N.A. |
| Total |
N.A. |
n/a |
n/a |
N.A. |
n/a |
n/a |
N.A. |
N.A. |
| Total |
Males |
N.A. |
n/a |
n/a |
4,608,834 |
n/a |
n/a |
N.A. |
N.A. |
| Females |
N.A. |
n/a |
n/a |
584,904 |
n/a |
n/a |
N.A. |
N.A. |
| Total |
N.A. |
n/a |
n/a |
5,193,738 |
n/a |
n/a |
N.A. |
N.A. |
Sources: national institutes of statistics
1- Definitions and remarks:
n/a: not applicable (sector is not singled out in country’s statistics)
N.A.: Not available (data is not published)
Period of reference: Q2, 2022
Qatar: 2021 data.
UAE: end of year data.
“Mixed” sector refers to establishments in which the government shares capital with another party,
whether national, regional or foreign.
The listed sectors only exist in Qatar (and the UAE), or are not singled out in other countries’ statistics.
The “Government” sector may not include employees in the security and military sectors.
Administrative records usually do not include self-employed persons.
Qatar: population of reference: labour force.
UAE: total population employed in private sector. Figures disaggregated by nationality are not available. No figures available for public sector and domestic sector employment.
2- Sources of data:
Bahrain: Labour Market Regulation Authority (LMRA). Bahrain Labour Market Indicators (BLMI), Q2 2022,
Tables A; A1; A2
http://blmi.lmra.bh/2021/12/data/lmr/Table_A.xlsx
Kuwait: Central Statistical Bureau. Integrated Database – LMIS, Q2, 2022 data.
https://lmis.csb.gov.kw/
Oman: Royal Oman Police in National Center for Statistics and Information (NCSI). Monthly Statistical Bulletin July 2022 (June 2022 data)
https://www.ncsi.gov.om/Elibrary/Pages/LibraryContentView.aspx
Qatar: Planning and Statistics Authority. Annual Bulletins of Labour Force Sample Survey 2021
https://www.psa.gov.qa/en/statistics/Statistical%20Releases/Social/LaborForce/2021/Annual_Bulletin_Labour_force_2021_AE.xlsx
Saudi Arabia: General Authority for Statistics (GAStat). Labour Force Survey, Q2, 2022 data.
https://www.stats.gov.sa/en/814
UAE: Labour Market Information System, Ministry of Human Resources and Emiratisation (MoHRE).
https://www.mohre.gov.ae/en/data-library/statistical-report.aspx
Last accessed: March 2023.
GLMM and GRC cannot guarantee that the link to access the source will not change; that the information will not be removed from the website it was obtained from; that no geo-blockages will be imposed; or that the information will not be available for any another reason.
Keywords: Bahrain, Kuwait, Qatar, Oman, Saudi Arabia, United Arab Emirates, Labour Market, Employment, National & Foreign Labour, National Labour, Foreign Labour, Domestic Workers
|
1991 |
2001 |
2010 |
2020 |
| Bahrainis |
323,305 |
405,667 |
570,687 |
712,362 |
| GCC |
4,728 |
6,823 |
8,690 |
13,299 |
| Other Arabs |
17,877 |
20,050 |
58,213 |
73,524 |
| Non-Bahraini Arabs |
22,605 |
26,873 |
66,903 |
86,823 |
| Asians |
154,090 |
205,626 |
562,040 |
650,996 |
| Africans |
345 |
2,924 |
19,548 |
21,502 |
| Europeans |
5,992 |
5,788 |
11,763 |
11,750 |
| North Americans |
1,303 |
3,195 |
4,149 |
16,415 |
| South Americans |
93 |
70 |
474 |
1,787 |
| Oceanians |
304 |
461 |
1,295 |
| Non-Arabs |
162,127 |
218,064 |
599,269 |
702,450 |
| Total non-Bahrainis |
184,732 |
244,937 |
666,172 |
789,273 |
| Total |
508,037 |
650,604 |
1,236,859 |
1,501,635 |
Source: Central Informatics Organization (CIO)/ Information & eGovernment Authority (IGA)
ANNEXED NOTE
- Technical Notes and Definitions
In October 2015, the Bahraini e-Government Authority merged with the Central Informatics Organization to form the Information and e-Government Authority (IGA), which manages and oversees all national digital assets.
The IGA maintains, and is part of, the Government Data Network, established in 1994, which links together 300 governmental entities.
Reference dates of censuses:
| 1941 |
January 22nd, 1941 |
| 1950 |
March 1950 |
|
| 1959 |
May 1959 |
|
| 1965 |
February 13th, 1965 |
| 1971 |
April 1971 |
|
| 1981 |
n.d. |
|
| 1991 |
n.d. |
|
| 2001 |
April 7th, 2001 |
| 2010 |
April 27th, 2010 |
| 2020 |
March 17th, 2020 |
Censuses’ implementation methods:
Until 1981: field enumeration (household survey)+de jure methodology, i.e. counting persons using their usual place of residence irrespective of where are they at census times
1991; 2001: field enumeration (household survey)+ first use of administrative records
2010: mixed census, based on both administrative records and a household survey sample of 15,000 Bahraini and non-Bahraini households.
2020 census was conducted solely on the basis of administrative records on the de jure population of the Kingdom.
Population of reference: all individuals (nationals and non-nationals) usually present within the State’s borders during time of reference.
Nationality of the person is defined by the passport used to enter the country. A non-Bahraini is considered as such depending on the passport used to enter the country (or obtain the visa)
- Institution which provides data
Central Informatics Organization/Information & eGovernment Authority (IGA)
- Data availability
Published results of censuses 2001, 2010 and 2020 are available on IGA’s Bahrain Open Data Portal:
https://www.data.gov.bh/en/ResourceCenter
https://www.data.gov.bh/ar/resourcecenter
section “documents”.
Date of access: March 2023
GLMM and GRC cannot guarantee that the link to access the source will not change; that the information will not be removed from the website it was obtained from; that no geo-blockages will be imposed; or that the information will not be available for any another reason.
Keywords:
Bahrain, National Population, Foreign Population, Asia, Africa, Europe, North America, South America, Oceania, Arab countries.
| |
Bahrainis |
Non-Bahrainis |
Total |
| Census |
Males |
Females |
Total |
Males |
Females |
Total |
Males |
Females |
Total |
| 1941 |
… |
… |
74,040 |
… |
… |
15,930 |
… |
… |
89,970 |
| 1950 |
… |
… |
91,179 |
… |
… |
18,471 |
… |
… |
109,650 |
| 1959 |
59,913 |
58,821 |
118,734 |
17,709 |
6,692 |
24,401 |
77,622 |
65,513 |
143,135 |
| 1965 |
72,368 |
71,446 |
143,814 |
27,016 |
11,373 |
38,389 |
99,384 |
82,819 |
182,203 |
| 1971 |
89,772 |
88,421 |
178,193 |
26,542 |
11,343 |
37,885 |
116,314 |
99,764 |
216,078 |
| 1981 |
119,924 |
118,496 |
238,420 |
84,869 |
27,509 |
112,378 |
204,793 |
146,005 |
350,798 |
| 1991 |
163,453 |
159,852 |
323,305 |
130,893 |
53,839 |
184,732 |
294,346 |
213,691 |
508,037 |
| 2001 |
204,623 |
201,044 |
405,667 |
169,026 |
75,911 |
244,937 |
373,649 |
276,955 |
650,604 |
| 2010 |
287,239 |
281,160 |
568,399 |
481,175 |
184,997 |
666,172 |
768,414 |
466,157 |
1,234,571 |
| 2020 |
361,140 |
351,222 |
712,362 |
581,755 |
207,518 |
789,273 |
942,895 |
558,740 |
1,501,635 |
Source: Central Informatics Organization (CIO)/ Information & eGovernment Authority (IGA)
ANNEXED NOTE
- Technical Notes and Definitions
In October 2015, the Bahraini e-Government Authority merged with the Central Informatics Organization to form the Information and e-Government Authority (IGA), which manages and oversees all national digital assets.
The IGA maintains, and is part of, the Government Data Network, established in 1994, which links together 300 governmental entities.
Reference dates of censuses:
| 1941 |
January 22nd, 1941 |
| 1950 |
March 1950 |
|
| 1959 |
May 1959 |
|
| 1965 |
February 13th, 1965 |
| 1971 |
April 1971 |
|
| 1981 |
n.d. |
|
| 1991 |
n.d. |
|
| 2001 |
April 7th, 2001 |
| 2010 |
April 27th, 2010 |
| 2020 |
March 17th, 2020 |
Censuses’ implementation methods:
Until 1981: field enumeration (household survey)+de jure methodology, i.e. counting persons using their usual place of residence irrespective of where are they at census times
1991; 2001: field enumeration (household survey)+ first use of administrative records
2010: mixed census, based on both administrative records and a household survey sample of 15,000 Bahraini and non-Bahraini households.
2020 census was conducted solely on the basis of administrative records on the de jure population of the Kingdom.
Population of reference: all individuals (nationals and non-nationals) usually present within the State’s borders during time of reference.
Nationality of the person is defined by the passport used to enter the country. A non-Bahraini is considered as such depending on the passport used to enter the country (or obtain the visa)
- Institution which provides data
Central Informatics Organization/Information & eGovernment Authority (IGA)
- Data availability
Published results of censuses 2001, 2010 and 2020 are available on IGA’s Bahrain Open Data Portal:
https://www.data.gov.bh/en/ResourceCenter
https://www.data.gov.bh/ar/resourcecenter
section “documents”.
Date of access: March 2023
GLMM and GRC cannot guarantee that the link to access the source will not change; that the information will not be removed from the website it was obtained from; that no geo-blockages will be imposed; or that the information will not be available for any another reason.
Keywords:
Bahrain, Foreign Population, National Population
| |
|
Bahrainis |
Non-Bahrainis |
TOTAL |
| |
|
Males |
Females |
Total |
Males |
Females |
Total |
Males |
Females |
Total |
| In Labour Force |
Employed |
146,212 |
95,528 |
241,740 |
524,386 |
96,962 |
621,348 |
670,598 |
192,490 |
863,088 |
| Unemployed |
3,217 |
9,253 |
12,470 |
0 |
0 |
0 |
3,217 |
9,253 |
12,470 |
| Total |
149,429 |
104,781 |
254,210 |
524,386 |
96,962 |
621,348 |
673,815 |
201,743 |
875,558 |
| Outside Labour Force |
Student |
48,647 |
47,113 |
95,760 |
9,560 |
9,963 |
19,523 |
58,207 |
57,076 |
115,283 |
| Housewife |
0 |
78,127 |
78,127 |
0 |
56,669 |
56,669 |
0 |
134,796 |
134,796 |
| Unable to work |
1,738 |
1,556 |
3,294 |
28 |
28 |
56 |
1,766 |
1,584 |
3,350 |
| Retired |
30,517 |
10,858 |
41,375 |
96 |
12 |
108 |
30,613 |
10,870 |
41,483 |
| Others |
17,205 |
2,311 |
19,516 |
3,860 |
1,641 |
5,501 |
21,065 |
3,952 |
25,017 |
| 65 and Above |
2,986 |
335 |
3,321 |
462 |
92 |
554 |
3,448 |
427 |
3,875 |
| Total |
101,093 |
140,300 |
241,393 |
14,006 |
68,405 |
82,411 |
115,099 |
208,705 |
323,804 |
| TOTAL |
250,522 |
245,081 |
495,603 |
538,392 |
165,367 |
703,759 |
788,914 |
410,448 |
1,199,362 |
Source: Central Informatics Organization (CIO)/ Information & eGovernment Authority (IGA)
ANNEXED NOTE
- Technical Notes and Definitions
In October 2015, the Bahraini e-Government Authority merged with the Central Informatics Organization to form the Information and e-Government Authority (IGA), which manages and oversees all national digital assets.
The IGA maintains, and is part of, the Government Data Network, established in 1994, which links together 300 governmental entities.
Reference dates of censuses:
| 1941 |
January 22nd, 1941 |
| 1950 |
March 1950 |
|
| 1959 |
May 1959 |
|
| 1965 |
February 13th, 1965 |
| 1971 |
April 1971 |
|
| 1981 |
n.d. |
|
| 1991 |
n.d. |
|
| 2001 |
April 7th, 2001 |
| 2010 |
April 27th, 2010 |
| 2020 |
March 17th, 2020 |
Censuses’ implementation methods:
Until 1981: field enumeration (household survey)+de jure methodology, i.e. counting persons using their usual place of residence irrespective of where are they at census times
1991; 2001: field enumeration (household survey)+ first use of administrative records
2010: mixed census, based on both administrative records and a household survey sample of 15,000 Bahraini and non-Bahraini households.
2020 census was conducted solely on the basis of administrative records on the de jure population of the Kingdom.
Population of reference: all individuals (nationals and non-nationals) usually present within the State’s borders during time of reference.
Nationality of the person is defined by the passport used to enter the country. A non-Bahraini is considered as such depending on the passport used to enter the country (or obtain the visa)
- Institution which provides data
Central Informatics Organization/Information & eGovernment Authority (IGA)
- Data availability
Published results of censuses 2001, 2010 and 2020 are available on IGA’s Bahrain Open Data Portal:
https://www.data.gov.bh/en/ResourceCenter
https://www.data.gov.bh/ar/resourcecenter
section “documents”.
Date of access: March 2023
GLMM and GRC cannot guarantee that the link to access the source will not change; that the information will not be removed from the website it was obtained from; that no geo-blockages will be imposed; or that the information will not be available for any another reason.
Keywords:
Bahrain, Labour Market, Employment, Unemployment, Female Employment, National & Foreign Labour, National Labour, Foreign Labour
|
Asian countries |
Arab countries |
Western countries |
| CEO/MD – Multinational |
30,997 |
37,555 |
36,704 |
| CEO/MD – Local Company |
19,278 |
23,632 |
25,551 |
| Human Resources – Manager |
10,598 |
11,666 |
11,690 |
| Information Technology – Manager |
10,908 |
14,130 |
14,209 |
| Sales/Marketing – Account Manager |
5,520 |
7,185 |
8,038 |
| Legal – Lawyer Marketer/Manager |
8,940 |
11,725 |
11,673 |
| Facilities Management – Manager |
7,608 |
9,648 |
10,032 |
| Finance & Accounting – Manager |
7,371 |
10,073 |
10,433 |
| Recruitment – Manager |
6,356 |
8,561 |
8,323 |
| Healthcare – General Practitioner/ Manager |
8,692 |
10,865 |
10,322 |
| Real Estate – Manager |
6,743 |
9,809 |
10,657 |
| Banking – Branch Manager |
7,774 |
10,864 |
12,007 |
| Banking – Treasury Manager |
11,305 |
13,738 |
15,426 |
| Banking – Retail/Personal Banking Manager |
8,113 |
10,873 |
11,833 |
| Media – Advertising Creative Manager |
7,742 |
9,035 |
10,089 |
| Media – Public Relations Manager |
6,866 |
8,359 |
9,366 |
| Media – Publishing Editor |
5,437 |
7,362 |
7,658 |
| Construction – Project Manager |
9,513 |
12,484 |
15,072 |
| Events – Manager |
5,159 |
7,310 |
7,169 |
| Executive Secretary/PA |
3,753 |
5,557 |
5,647 |
Source: Gulf Business, April 2017
ANNEXED NOTE
- Technical Notes and Definitions
The Gulf Business 2017 Salary Survey polled the average remuneration for 20 professions and sectors, including finance, real estate and media, across the six Gulf countries.
The 2017 salary survey was compiled based on inputs from regional recruitment companies including Nadia and Charterhouse.
- 2. Institution which provides data
Gulf Business Magazine (https://gulfbusiness.com/)
- Data availability
Robert Anderson. “Revealed: The Gulf Business 2017 Salary Survey”, Gulf Business, April 16, 2017.
Revealed: The Gulf Business 2017 salary survey
Date of access: February 2023.
GLMM and GRC cannot guarantee that the link to access the source will not change; that the information will not be removed from the website it was obtained from; that no geo-blockages will be imposed; or that the information will not be available for any another reason.
Keywords:
United Arab Emirates, Work Conditions, Foreign Labour
|
Asian countries |
Arab countries |
Western countries |
| CEO/MD – Multinational |
34,824 |
41,716 |
42,389 |
| CEO/MD – Local Company |
22,251 |
26,487 |
27,632 |
| Human Resources – Manager |
10,070 |
12,924 |
13,015 |
| Information Technology – Manager |
12,112 |
15,528 |
15,052 |
| Sales/Marketing – Account Manager |
5,950 |
8,054 |
9,297 |
| Legal – Lawyer Marketer/Manager |
9,773 |
12,814 |
12,784 |
| Facilities Management – Manager |
8,607 |
11,222 |
11,895 |
| Finance & Accounting – Manager |
8,369 |
11,459 |
10,996 |
| Recruitment – Manager |
8,098 |
10,639 |
10,491 |
| Healthcare – General Practitioner/ Manager |
11,194 |
14,033 |
13,105 |
| Real Estate – Manager |
10,152 |
14,330 |
13,352 |
| Banking – Branch Manager |
9,356 |
13,219 |
13,295 |
| Banking – Treasury Manager |
13,644 |
16,874 |
16,873 |
| Banking – Retail/Personal Banking Manager |
8,892 |
12,598 |
11,991 |
| Media – Advertising Creative Manager |
8,988 |
10,551 |
12,120 |
| Media – Public Relations Manager |
8,178 |
9,672 |
10,577 |
| Media – Publishing Editor |
6,128 |
7,747 |
7,962 |
| Construction – Project Manager |
10,897 |
15,009 |
16,876 |
| Events – Manager |
5,146 |
8,256 |
8,762 |
| Executive Secretary/PA |
4,437 |
6,192 |
5,774 |
Source: Gulf Business, April 2017
ANNEXED NOTE
- Technical Notes and Definitions
The Gulf Business 2017 Salary Survey polled the average remuneration for 20 professions and sectors, including finance, real estate and media, across the six Gulf countries.
The 2017 salary survey was compiled based on inputs from regional recruitment companies including Nadia and Charterhouse.
- 2. Institution which provides data
Gulf Business Magazine (https://gulfbusiness.com/)
- Data availability
Robert Anderson. “Revealed: The Gulf Business 2017 Salary Survey”, Gulf Business, April 16, 2017.
Revealed: The Gulf Business 2017 salary survey
Date of access: February 2023.
GLMM and GRC cannot guarantee that the link to access the source will not change; that the information will not be removed from the website it was obtained from; that no geo-blockages will be imposed; or that the information will not be available for any another reason.
Keywords:
Saudi Arabia, Work Conditions, Foreign Labour
|
Asian countries |
Arab countries |
Western countries |
| CEO/MD – Multinational |
33,319 |
43,017 |
40,702 |
| CEO/MD – Local Company |
20,981 |
27,012 |
26,924 |
| Human Resources – Manager |
9,544 |
9,000 |
12,597 |
| Information Technology – Manager |
11,929 |
15,733 |
14,988 |
| Sales/Marketing – Account Manager |
5,390 |
8,079 |
8,186 |
| Legal – Lawyer Marketer/Manager |
9,405 |
12,575 |
12,131 |
| Facilities Management – Manager |
8,330 |
10,400 |
10,765 |
| Finance & Accounting – Manager |
8,268 |
11,461 |
10,872 |
| Recruitment – Manager |
7,045 |
7,000 |
8,896 |
| Healthcare – General Practitioner/ Manager |
9,330 |
11,800 |
10,976 |
| Real Estate – Manager |
11,147 |
12,800 |
12,330 |
| Banking – Branch Manager |
8,093 |
11,350 |
13,146 |
| Banking – Treasury Manager |
12,096 |
14,800 |
17,063 |
| Banking – Retail/Personal Banking Manager |
8,570 |
11,420 |
12,891 |
| Media – Advertising Creative Manager |
7,896 |
7,300 |
10,495 |
| Media – Public Relations Manager |
7,463 |
9,488 |
10,037 |
| Media – Publishing Editor |
6,205 |
5,500 |
7,802 |
| Construction – Project Manager |
10,620 |
14,126 |
15,610 |
| Events – Manager |
5,047 |
8,000 |
7,898 |
| Executive Secretary/PA |
4,232 |
6,137 |
6,029 |
Source: Gulf Business, April 2017
ANNEXED NOTE
- Technical Notes and Definitions
The Gulf Business 2017 Salary Survey polled the average remuneration for 20 professions and sectors, including finance, real estate and media, across the six Gulf countries.
The 2017 salary survey was compiled based on inputs from regional recruitment companies including Nadia and Charterhouse.
- 2. Institution which provides data
Gulf Business Magazine (https://gulfbusiness.com/)
- Data availability
Robert Anderson. “Revealed: The Gulf Business 2017 Salary Survey”, Gulf Business, April 16, 2017.
Revealed: The Gulf Business 2017 salary survey
Date of access: February 2023.
GLMM and GRC cannot guarantee that the link to access the source will not change; that the information will not be removed from the website it was obtained from; that no geo-blockages will be imposed; or that the information will not be available for any another reason.
Keywords:
Qatar, Work Conditions, Foreign Labour
|
Asian countries |
Arab countries |
Western countries |
| CEO/MD – Multinational |
28,505 |
29,202 |
33,098 |
| CEO/MD – Local Company |
17,155 |
20,339 |
20,581 |
| Human Resources – Manager |
8,244 |
9,333 |
11,061 |
| Information Technology – Manager |
9,956 |
12,710 |
12,211 |
| Sales/Marketing – Account Manager |
4,755 |
5,928 |
7,259 |
| Legal – Lawyer Marketer/Manager |
7,922 |
9,749 |
9,958 |
| Facilities Management – Manager |
6,930 |
8,533 |
8,913 |
| Finance & Accounting – Manager |
6,746 |
8,070 |
8,858 |
| Recruitment – Manager |
6,343 |
7,460 |
7,367 |
| Healthcare – General Practitioner/ Manager |
8,257 |
9,779 |
9,779 |
| Real Estate – Manager |
9,050 |
8,904 |
8,610 |
| Banking – Branch Manager |
6,432 |
8,233 |
9,438 |
| Banking – Treasury Manager |
10,544 |
10,929 |
12,910 |
| Banking – Retail/Personal Banking Manager |
7,184 |
8,471 |
10,420 |
| Media – Advertising Creative Manager |
6,774 |
8,115 |
8,668 |
| Media – Public Relations Manager |
5,849 |
7,280 |
7,905 |
| Media – Publishing Editor |
5,589 |
6,789 |
6,494 |
| Construction – Project Manager |
8,347 |
10,574 |
11,808 |
| Events – Manager |
4,410 |
6,113 |
5,708 |
| Executive Secretary/PA |
3,505 |
4,572 |
4,787 |
Source: Gulf Business, April 2017
ANNEXED NOTE
- Technical Notes and Definitions
The Gulf Business 2017 Salary Survey polled the average remuneration for 20 professions and sectors, including finance, real estate and media, across the six Gulf countries.
The 2017 salary survey was compiled based on inputs from regional recruitment companies including Nadia and Charterhouse.
- 2. Institution which provides data
Gulf Business Magazine (https://gulfbusiness.com/)
- Data availability
Robert Anderson. “Revealed: The Gulf Business 2017 Salary Survey”, Gulf Business, April 16, 2017.
Revealed: The Gulf Business 2017 salary survey
Date of access: February 2023.
GLMM and GRC cannot guarantee that the link to access the source will not change; that the information will not be removed from the website it was obtained from; that no geo-blockages will be imposed; or that the information will not be available for any another reason.
Keywords:
Oman, Work Conditions, Foreign Labour
|
Asian countries |
Arab countries |
Western countries |
| CEO/MD – Multinational |
31,322 |
35,789 |
35,701 |
| CEO/MD – Local Company |
18,653 |
23,366 |
24,514 |
| Human Resources – Manager |
8,358 |
9,759 |
10,121 |
| Information Technology – Manager |
10,163 |
13,592 |
12,537 |
| Sales/Marketing – Account Manager |
5,022 |
6,360 |
7,736 |
| Legal – Lawyer Marketer/Manager |
8,619 |
10,963 |
11,484 |
| Facilities Management – Manager |
7,402 |
9,233 |
9,969 |
| Finance & Accounting – Manager |
7,403 |
8,827 |
9,502 |
| Recruitment – Manager |
6,609 |
8,438 |
7,850 |
| Healthcare – General Practitioner/ Manager |
8,257 |
10,322 |
9,670 |
| Real Estate – Manager |
8,700 |
9,424 |
10,707 |
| Banking – Branch Manager |
7,019 |
9,489 |
12,222 |
| Banking – Treasury Manager |
10,761 |
13,256 |
15,656 |
| Banking – Retail/Personal Banking Manager |
7,855 |
9,537 |
11,483 |
| Media – Advertising Creative Manager |
7,429 |
8,630 |
9,778 |
| Media – Public Relations Manager |
6,796 |
7,831 |
8,768 |
| Media – Publishing Editor |
5,323 |
7,069 |
6,600 |
| Construction – Project Manager |
9,233 |
12,358 |
13,969 |
| Events – Manager |
4,400 |
7,047 |
6,656 |
| Executive Secretary/PA |
3,640 |
5,063 |
5,482 |
Source: Gulf Business, April 2017
ANNEXED NOTE
- Technical Notes and Definitions
The Gulf Business 2017 Salary Survey polled the average remuneration for 20 professions and sectors, including finance, real estate and media, across the six Gulf countries.
The 2017 salary survey was compiled based on inputs from regional recruitment companies including Nadia and Charterhouse.
- 2. Institution which provides data
Gulf Business Magazine (https://gulfbusiness.com/)
- Data availability
Robert Anderson. “Revealed: The Gulf Business 2017 Salary Survey”, Gulf Business, April 16, 2017.
Revealed: The Gulf Business 2017 salary survey
Date of access: February 2023.
GLMM and GRC cannot guarantee that the link to access the source will not change; that the information will not be removed from the website it was obtained from; that no geo-blockages will be imposed; or that the information will not be available for any another reason.
Keywords:
Kuwait, Work Conditions, Foreign Labour
| |
Asian countries |
Arab countries |
Western countries |
| BAH |
KUW |
OMN |
QAT |
SA |
UAE |
BAH |
KUW |
OMN |
QAT |
SA |
UAE |
BAH |
KUW |
OMN |
QAT |
SA |
UAE |
|
| CEO/MD – Multinational |
23,292 |
31,322 |
28,505 |
33,319 |
34,824 |
30,997 |
33,990 |
35,789 |
29,202 |
43,017 |
41,716 |
37,555 |
34,740 |
35,701 |
33,098 |
40,702 |
42,389 |
36,704 |
|
| CEO/MD – Local Company |
16,541 |
18,653 |
17,155 |
20,981 |
22,251 |
19,278 |
21,841 |
23,366 |
20,339 |
27,012 |
26,487 |
23,632 |
22,646 |
24,514 |
20,581 |
26,924 |
27,632 |
25,551 |
|
| Human Resources – Manager |
7,378 |
8,358 |
8,244 |
9,544 |
10,070 |
10,598 |
9,338 |
9,759 |
9,333 |
9,000 |
12,924 |
11,666 |
9,861 |
10,121 |
11,061 |
12,597 |
13,015 |
11,690 |
|
| Information Technology – Manager |
9,089 |
10,163 |
9,956 |
11,929 |
12,112 |
10,908 |
12,177 |
13,592 |
12,710 |
15,733 |
15,528 |
14,130 |
12,072 |
12,537 |
12,211 |
14,988 |
15,052 |
14,209 |
|
| Sales/Marketing – Account Manager |
4,918 |
5,022 |
4,755 |
5,390 |
5,950 |
5,520 |
6,096 |
6,360 |
5,928 |
8,079 |
8,054 |
7,185 |
6,868 |
7,736 |
7,259 |
8,186 |
9,297 |
8,038 |
|
| Legal – Lawyer Marketer/Manager |
7,406 |
8,619 |
7,922 |
9,405 |
9,773 |
8,940 |
10,652 |
10,963 |
9,749 |
12,575 |
12,814 |
11,725 |
9,976 |
11,484 |
9,958 |
12,131 |
12,784 |
11,673 |
|
| Facilities Management – Manager |
5,567 |
7,402 |
6,930 |
8,330 |
8,607 |
7,608 |
7,514 |
9,233 |
8,533 |
10,400 |
11,222 |
9,648 |
7,850 |
9,969 |
8,913 |
10,765 |
11,895 |
10,032 |
|
| Finance & Accounting – Manager |
6,269 |
7,403 |
6,746 |
8,268 |
8,369 |
7,371 |
8,882 |
8,827 |
8,070 |
11,461 |
11,459 |
10,073 |
8,967 |
9,502 |
8,858 |
10,872 |
10,996 |
10,433 |
|
| Recruitment – Manager |
5,532 |
6,609 |
6,343 |
7,045 |
8,098 |
6,356 |
7,014 |
8,438 |
7,460 |
7,000 |
10,639 |
8,561 |
6,673 |
7,850 |
7,367 |
8,896 |
10,491 |
8,323 |
|
| Healthcare – General Practitioner/ Manager |
7,313 |
8,257 |
8,257 |
9,330 |
11,194 |
8,692 |
9,140 |
10,322 |
9,779 |
11,800 |
14,033 |
10,865 |
8,603 |
9,670 |
9,779 |
10,976 |
13,105 |
10,322 |
|
| Real Estate – Manager |
8,213 |
8,700 |
9,050 |
11,147 |
10,152 |
6,743 |
9,271 |
9,424 |
8,904 |
12,800 |
14,330 |
9,809 |
11,283 |
10,707 |
8,610 |
12,330 |
13,352 |
10,657 |
|
| Banking – Branch Manager |
7,499 |
7,019 |
6,432 |
8,093 |
9,356 |
7,774 |
8,824 |
9,489 |
8,233 |
11,350 |
13,219 |
10,864 |
11,717 |
12,222 |
9,438 |
13,146 |
13,295 |
12,007 |
|
| Banking – Treasury Manager |
9,417 |
10,761 |
10,544 |
12,096 |
13,644 |
11,305 |
11,405 |
13,256 |
10,929 |
14,800 |
16,874 |
13,738 |
14,635 |
15,656 |
12,910 |
17,063 |
16,873 |
15,426 |
|
| Banking – Retail/Personal Banking Manager |
6,846 |
7,855 |
7,184 |
8,570 |
8,892 |
8,113 |
8,918 |
9,537 |
8,471 |
11,420 |
12,598 |
10,873 |
10,747 |
11,483 |
10,420 |
12,891 |
11,991 |
11,833 |
|
| Media – Advertising Creative Manager |
7,262 |
7,429 |
6,774 |
7,896 |
8,988 |
7,742 |
8,096 |
8,630 |
8,115 |
7,300 |
10,551 |
9,035 |
8,614 |
9,778 |
8,668 |
10,495 |
12,120 |
10,089 |
|
| Media – Public Relations Manager |
5,536 |
6,796 |
5,849 |
7,463 |
8,178 |
6,866 |
7,170 |
7,831 |
7,280 |
9,488 |
9,672 |
8,359 |
7,895 |
8,768 |
7,905 |
10,037 |
10,577 |
9,366 |
|
| Media – Publishing Editor |
5,080 |
5,323 |
5,589 |
6,205 |
6,128 |
5,437 |
6,540 |
7,069 |
6,789 |
5,500 |
7,747 |
7,362 |
6,241 |
6,600 |
6,494 |
7,802 |
7,962 |
7,658 |
|
| Construction – Project Manager |
8,300 |
9,233 |
8,347 |
10,620 |
10,897 |
9,513 |
11,338 |
12,358 |
10,574 |
14,126 |
15,009 |
12,484 |
12,551 |
13,969 |
11,808 |
15,610 |
16,876 |
15,072 |
|
| Events – Manager |
4,295 |
4,400 |
4,410 |
5,047 |
5,146 |
5,159 |
5,892 |
7,047 |
6,113 |
8,000 |
8,256 |
7,310 |
5,463 |
6,656 |
5,708 |
7,898 |
8,762 |
7,169 |
|
| Executive Secretary/PA |
3,317 |
3,640 |
3,505 |
4,232 |
4,437 |
3,753 |
5,155 |
5,063 |
4,572 |
6,137 |
6,192 |
5,557 |
5,124 |
5,482 |
4,787 |
6,029 |
5,774 |
5,647 |
|
Source: Gulf Business, April 2017
ANNEXED NOTE
- Technical Notes and Definitions
The Gulf Business 2017 Salary Survey polled the average remuneration for 20 professions and sectors, including finance, real estate and media, across the six Gulf countries.
The 2017 salary survey was compiled based on inputs from regional recruitment companies including Nadia and Charterhouse.
- 2. Institution which provides data
Gulf Business Magazine (https://gulfbusiness.com/)
- Data availability
Robert Anderson. “Revealed: The Gulf Business 2017 Salary Survey”, Gulf Business, April 16, 2017.
Revealed: The Gulf Business 2017 salary survey
Date of access: February 2023.
GLMM and GRC cannot guarantee that the link to access the source will not change; that the information will not be removed from the website it was obtained from; that no geo-blockages will be imposed; or that the information will not be available for any another reason.
Keywords:
Gulf Cooperation Council, Bahrain, Kuwait, Oman, Qatar, Saudi Arabia, United Arab Emirates, Work Conditions, Foreign Labour
|
Asian countries |
Arab countries |
Western countries |
| CEO/MD – Multinational |
23,292 |
33,990 |
34,740 |
| CEO/MD – Local Company |
16,541 |
21,841 |
22,646 |
| Human Resources – Manager |
7,378 |
9,338 |
9,861 |
| Information Technology – Manager |
9,089 |
12,177 |
12,072 |
| Sales/Marketing – Account Manager |
4,918 |
6,096 |
6,868 |
| Legal – Lawyer Marketer/Manager |
7,406 |
10,652 |
9,976 |
| Facilities Management – Manager |
5,567 |
7,514 |
7,850 |
| Finance & Accounting – Manager |
6,269 |
8,882 |
8,967 |
| Recruitment – Manager |
5,532 |
7,014 |
6,673 |
| Healthcare – General Practitioner/ Manager |
7,313 |
9,140 |
8,603 |
| Real Estate – Manager |
8,213 |
9,271 |
11,283 |
| Banking – Branch Manager |
7,499 |
8,824 |
11,717 |
| Banking – Treasury Manager |
9,417 |
11,405 |
14,635 |
| Banking – Retail/Personal Banking Manager |
6,846 |
8,918 |
10,747 |
| Media – Advertising Creative Manager |
7,262 |
8,096 |
8,614 |
| Media – Public Relations Manager |
5,536 |
7,170 |
7,895 |
| Media – Publishing Editor |
5,080 |
6,540 |
6,241 |
| Construction – Project Manager |
8,300 |
11,338 |
12,551 |
| Events – Manager |
4,295 |
5,892 |
5,463 |
| Executive Secretary/PA |
3,317 |
5,155 |
5,124 |
Source: Gulf Business, April 2017
ANNEXED NOTE
- Technical Notes and Definitions
The Gulf Business 2017 Salary Survey polled the average remuneration for 20 professions and sectors, including finance, real estate and media, across the six Gulf countries.
The 2017 salary survey was compiled based on inputs from regional recruitment companies including Nadia and Charterhouse.
- 2. Institution which provides data
Gulf Business Magazine (https://gulfbusiness.com/)
- Data availability
Robert Anderson. “Revealed: The Gulf Business 2017 Salary Survey”, Gulf Business, April 16, 2017.
Revealed: The Gulf Business 2017 salary survey
Date of access: February 2023.
GLMM and GRC cannot guarantee that the link to access the source will not change; that the information will not be removed from the website it was obtained from; that no geo-blockages will be imposed; or that the information will not be available for any another reason.
Keywords:
Bahrain, Work Conditions, Foreign Labour
|
2011 |
2012 |
2013 |
2014 |
2015 |
2016 |
2017 |
2018 |
2019 |
|
Male |
Female |
Male |
Female |
Male |
Female |
Male |
Female |
Male |
Female |
Male |
Female |
Male |
Female |
Male |
Female |
Male |
Female |
|
| Agriculture |
24,627 |
577 |
26,009 |
722 |
27,080 |
911 |
33,013 |
1,349 |
33,214 |
1,262 |
31,740 |
858 |
35,020 |
910 |
34,813 |
949 |
33,935 |
708 |
|
| Fishing |
9,793 |
9 |
10,316 |
4 |
10,221 |
3 |
10,815 |
4 |
10,934 |
4 |
11,084 |
4 |
10,983 |
14 |
10,492 |
18 |
9,786 |
20 |
|
| Mining and quarrying |
56,638 |
2,042 |
61,455 |
2,146 |
61,397 |
2,378 |
64,534 |
2,774 |
65,856 |
2,830 |
64,071 |
2,823 |
63,480 |
2,729 |
61,792 |
2,760 |
57,551 |
2,942 |
|
| Manufacturing |
399,782 |
10,781 |
410,821 |
11,110 |
407,088 |
11,452 |
442,906 |
12,767 |
458,059 |
13,186 |
458,826 |
13,219 |
460,295 |
13,396 |
449,572 |
13,394 |
454,997 |
13,919 |
|
| Electricity, gas and water supply |
5,240 |
181 |
5,395 |
188 |
5,690 |
185 |
6,217 |
224 |
6,986 |
231 |
7,459 |
242 |
7,280 |
246 |
7,411 |
250 |
7,111 |
247 |
|
| Construction |
1,436,561 |
18,026 |
1,418,225 |
18,821 |
1,332,186 |
19,785 |
1,448,774 |
23,454 |
1,552,772 |
25,437 |
1,607,056 |
26,153 |
1,683,973 |
27,788 |
1,653,737 |
28,679 |
1,609,864 |
31,860 |
|
| Trade and repair services |
796,428 |
82,396 |
840,694 |
92,451 |
856,674 |
98,939 |
940,591 |
113,016 |
982,774 |
120,136 |
990,873 |
123,167 |
997,025 |
124,717 |
972,262 |
122,764 |
978,479 |
125,436 |
|
| Hotels and restaurants |
127,709 |
15,112 |
141,771 |
18,181 |
151,234 |
20,794 |
173,954 |
24,067 |
187,651 |
25,890 |
198,075 |
27,270 |
207,387 |
28,162 |
209,489 |
28,501 |
219,558 |
30,309 |
|
| Transport, storage and communications |
243,876 |
10,891 |
261,239 |
12,264 |
277,680 |
13,372 |
316,931 |
15,201 |
341,222 |
16,047 |
352,618 |
15,902 |
351,898 |
16,433 |
333,756 |
16,657 |
336,520 |
16,965 |
|
| Financial intermediation |
36,623 |
12,937 |
37,776 |
13,862 |
39,326 |
14,626 |
43,440 |
16,304 |
47,469 |
18,101 |
48,964 |
18,666 |
51,458 |
19,709 |
52,508 |
20,440 |
51,166 |
20,909 |
|
| Business activities |
311,656 |
45,363 |
341,731 |
50,972 |
365,065 |
57,356 |
418,023 |
69,714 |
452,255 |
78,700 |
468,106 |
83,654 |
501,039 |
92,753 |
511,149 |
99,794 |
537,808 |
111,437 |
|
| Education |
24,935 |
29,857 |
25,725 |
34,857 |
26,374 |
36,322 |
28,799 |
42,217 |
29,913 |
46,335 |
30,972 |
51,161 |
32,186 |
55,690 |
32,131 |
59,497 |
31,366 |
61,786 |
|
| Health and social work |
19,518 |
18,789 |
21,727 |
22,047 |
24,018 |
25,129 |
27,859 |
30,817 |
32,000 |
36,700 |
35,162 |
41,957 |
37,398 |
45,316 |
38,979 |
48,685 |
38,899 |
51,129 |
|
| Social and personal services |
84,255 |
24,177 |
88,664 |
28,866 |
90,739 |
31,564 |
99,361 |
36,483 |
103,853 |
39,001 |
107,016 |
41,165 |
110,723 |
43,771 |
115,365 |
43,569 |
146,013 |
47,514 |
|
| Public administration |
|
|
|
|
|
|
|
|
|
|
|
|
|
|
1,103 |
268 |
4,682 |
1,142 |
|
| Extraterritorial organizations |
11 |
5 |
14 |
11 |
17 |
9 |
7 |
10 |
8 |
12 |
13 |
21 |
15 |
30 |
21 |
31 |
23 |
32 |
|
| Private households |
17 |
|
20 |
|
26 |
|
33 |
|
34 |
1 |
30 |
1 |
22 |
2 |
19 |
2 |
22 |
1 |
|
| Undefined/other activities |
3,456 |
423 |
3,658 |
516 |
3,833 |
673 |
4,231 |
838 |
4,434 |
978 |
16,010 |
1,749 |
15,299 |
2,203 |
22,184 |
2,863 |
55,731 |
4,916 |
|
| Total |
3,581,125 |
271,566 |
3,695,240 |
307,018 |
3,678,648 |
333,498 |
4,059,488 |
389,239 |
4,309,434 |
424,851 |
4,428,075 |
448,012 |
4,565,481 |
473,869 |
4,506,783 |
489,121 |
4,573,511 |
521,272 |
|
Source: GLMM’s elaboration, based on data from the Labour Market Information System, Ministry of Human Resources and Emiratisation (MoHRE)
ANNEXED NOTE
- Characteristics of data
The figures pertain to the number of workers registered in the UAE’s private sector, with the MoHRE.
The “labour force” includes all economically active individuals in the community, whether they are already working or looking for work
https://www.mohre.gov.ae/en/definitions.aspx
Employed persons: Individuals who are already engaged in productive work: it includes individual who are employed, even if they do not work because of illness or injury, holiday or for irregular work at the facilities in which they work for temporary or incidental reasons. This category also includes full-time and part-time workers.
Unemployed: Individuals who are able to work and wishing to do so, were still searching jobs during the survey. This category includes the unemployed who never entered the labour market, and who have previously worked and had to leave their jobs for any reason as a result of labour market conditions.
Reference period: end of year.
Workers employed in the Free Zones are not included in the figures.
Classification of activities: ISIC rev. 3.1
- Institution which provides data
Ministry of Human Resources and Emiratisation (MOHRE): http://www.mohre.gov.ae/en/home.aspx
- Data availability
The data is taken from the “open data” section of MoHRE website:
https://www.mohre.gov.ae/en/data-library/statistical-report.aspx
These data for 2011-2019 are available in a raw dataset downloadable in Excel (.csv) format.
https://www.mohre.gov.ae/handlers/download.ashx?YXNzZXQ9NjAzNQ==
Distributions of private sector workers by activity available for the period 2020-2022 are not disaggregated by sex.
Total figures published in this 2011-2019 dataset may have been readjusted by MoHRE in later publications.
Date of access: February 2023.
GLMM and GRC cannot guarantee that the link to access the source will not change; that the information will not be removed from the website it was obtained from; that no geo-blockages will be imposed; or that the information will not be available for any another reason.
Keywords:
United Arab Emirates, Labour Market, Employment, Female Employment
| |
2011 |
2012 |
2013 |
2014 |
2015 |
2016 |
2017 |
2018 |
2019 |
2020 |
2021 |
2022 |
| Managers |
85,314 |
96,211 |
109,415 |
128,108 |
143,732 |
153,421 |
165,686 |
175,018 |
198,765 |
N.A. |
239,231 |
290,410 |
| Professionals |
237,610 |
254,818 |
275,785 |
322,765 |
367,499 |
394,816 |
420,913 |
436,397 |
455,044 |
N.A. |
461,138 |
540,208 |
| Technicians and associate professionals |
210,681 |
218,451 |
226,955 |
255,486 |
276,668 |
285,110 |
299,571 |
304,759 |
316,546 |
N.A. |
331,844 |
407,069 |
| Clerical support workers |
256,220 |
283,134 |
302,138 |
344,048 |
368,352 |
373,653 |
380,384 |
374,220 |
391,712 |
N.A. |
475,335 |
512,817 |
| Service and sales workers |
547,696 |
598,271 |
625,676 |
699,073 |
731,065 |
740,400 |
750,770 |
746,648 |
764,004 |
N.A. |
786,193 |
856,146 |
| Skilled agricultural, forestry and fishery workers |
9,504 |
9,959 |
9,828 |
10,622 |
10,867 |
11,399 |
12,019 |
11,807 |
11,655 |
N.A. |
14,625 |
15,784 |
| Craft and related trades workers |
1,029,822 |
1,035,940 |
985,443 |
1,072,763 |
1,143,756 |
1,168,838 |
1,207,833 |
1,171,991 |
1,143,592 |
N.A. |
1,117,677 |
1,213,752 |
| Plant and machine operators, and assemblers |
385,020 |
402,447 |
416,412 |
464,830 |
496,154 |
516,460 |
524,809 |
513,577 |
518,484 |
N.A. |
490,091 |
560,030 |
| Elementary occupations |
1,090,766 |
1,102,983 |
1,060,462 |
1,151,002 |
1,196,164 |
1,231,971 |
1,277,356 |
1,261,468 |
1,294,972 |
N.A. |
987,478 |
1,081,146 |
| NA |
58 |
44 |
32 |
30 |
28 |
19 |
9 |
19 |
9 |
N.A. |
|
4 |
| Total |
3,852,691 |
4,002,258 |
4,012,146 |
4,448,727 |
4,734,285 |
4,876,087 |
5,039,350 |
4,995,904 |
5,094,783 |
N.A. |
4,903,612 |
5,477,366 |
Source: Labour Market Information System, Ministry of Human Resources and Emiratisation (MoHRE)
ANNEXED NOTE
- Characteristics of data:
The figures pertain to the number of workers registered in the UAE’s private sector, with the MoHRE.
The labour force includes all economically active individuals in the community, whether they are already working or looking for work https://www.mohre.gov.ae/en/definitions.aspx
Employed persons: Individuals who are already engaged in productive work: it includes individual who are employed, even if they do not work because of illness or injury, holiday or for irregular work at the facilities in which they work for temporary or incidental reasons. This category also includes full-time and part-time workers.
Unemployed: Individuals who are able to work and wishing to do so, were still searching jobs during the survey. This category includes the unemployed who never entered the labour market, and who have previously worked and had to leave their jobs for any reason as a result of labour market conditions.
Reference period: end of year.
Workers employed in the Free Zones are not included in the figures.
Classification of occupations: ISCO-08
- Institution which provides data:
Ministry of Human Resources and Emiratisation (MOHRE): http://www.mohre.gov.ae/en/home.aspx
- Data availability:
The data is taken from the “open data” section of MoHRE website:
https://www.mohre.gov.ae/en/data-library/statistical-report.aspx
Data is downloadable in Excel (.csv) format, for the current year.
Past years: data for 2011-2019 is available in a raw dataset
https://www.mohre.gov.ae/handlers/download.ashx?YXNzZXQ9NjAzNQ==
No archive of data available for the period 2020-2022, as of February 2023.
Total figures published in the 2011-2019 dataset may have been readjusted by MoHRE in later publications.
Date of access: February 2023.
GLMM and GRC cannot guarantee that the link to access the source will not change; that the information will not be removed from the website it was obtained from; that no geo-blockages will be imposed; or that the information will not be available for any another reason.
Keywords:
United Arab Emirates, Labour Market, Employment
|
Dubai |
Abu Dhabi |
Sharjah |
Ajman |
Ras Al Khaimah |
Fujairah |
Um Al Quwwain |
Total |
| Agriculture |
20,099 |
13,429 |
312 |
167 |
436 |
179 |
21 |
34,643 |
| Fishing |
1,615 |
1,345 |
2,450 |
816 |
1,539 |
1,225 |
816 |
9,806 |
| Mining and quarrying |
3,149 |
51,537 |
629 |
224 |
321 |
4,570 |
63 |
60,493 |
| Manufacturing |
180,859 |
94,154 |
102,855 |
50,238 |
14,046 |
8,292 |
18,472 |
468,916 |
| Electricity, gas and water supply |
1,872 |
2,233 |
411 |
1,337 |
430 |
209 |
866 |
7,358 |
| Construction |
868,433 |
420,654 |
187,508 |
81,094 |
42,808 |
28,122 |
13,105 |
1,641,724 |
| Trade and repair services |
631,670 |
219,403 |
147,737 |
49,043 |
27,856 |
21,236 |
6,970 |
1,103,915 |
| Hotels and restaurants |
120,805 |
71,456 |
27,251 |
12,836 |
9,230 |
5,411 |
2,878 |
249,867 |
| Transport, storage and communications |
207,507 |
92,700 |
25,976 |
7,659 |
7,543 |
10,374 |
1,726 |
353,485 |
| Financial intermediation |
48,531 |
15,822 |
6,347 |
458 |
482 |
297 |
138 |
72,075 |
| Business activities |
362,671 |
223,812 |
33,310 |
14,510 |
8,430 |
4,702 |
1,810 |
649,245 |
| Education |
39,615 |
28,655 |
15,606 |
5,013 |
1,956 |
1,660 |
647 |
93,152 |
| Health and social work |
39,560 |
37,024 |
7,452 |
3,053 |
1,216 |
1,420 |
303 |
90,028 |
| Social and personal services |
78,522 |
70,064 |
22,713 |
9,815 |
7,113 |
4,031 |
1,269 |
193,527 |
| Public administration |
3,248 |
1,520 |
441 |
490 |
46 |
40 |
39 |
5,824 |
| Extraterritorial organizations |
28 |
1 |
26 |
|
|
|
|
55 |
| Private households |
6 |
10 |
7 |
|
|
|
|
23 |
| Undefined/other activities |
16,919 |
38,000 |
3,176 |
1,671 |
624 |
186 |
71 |
60,647 |
| Total |
2,625,109 |
1,381,819 |
584,207 |
238,424 |
124,076 |
91,954 |
49,194 |
5,094,783 |
Source: GLMM’s elaboration, based on data from the Labour Market Information System, Ministry of Human Resources and Emiratisation (MoHRE)
ANNEXED NOTE
- Characteristics of data
The figures pertain to the number of workers registered in the UAE’s private sector, with the MoHRE.
The “labour force” includes all economically active individuals in the community, whether they are already working or looking for work
https://www.mohre.gov.ae/en/definitions.aspx
Employed persons: Individuals who are already engaged in productive work: it includes individual who are employed, even if they do not work because of illness or injury, holiday or for irregular work at the facilities in which they work for temporary or incidental reasons. This category also includes full-time and part-time workers.
Unemployed: Individuals who are able to work and wishing to do so, were still searching jobs during the survey. This category includes the unemployed who never entered the labour market, and who have previously worked and had to leave their jobs for any reason as a result of labour market conditions.
Reference period: end of year.
Workers employed in the Free Zones are not included in the figures.
Classification of activities: ISIC rev. 3.1
- Institution which provides data
Ministry of Human Resources and Emiratisation (MOHRE): http://www.mohre.gov.ae/en/home.aspx
- Data availability
The data is taken from the “open data” section of MoHRE website:
https://www.mohre.gov.ae/en/data-library/statistical-report.aspx
These data for 2011-2019 are available in a raw dataset downloadable in Excel (.csv) format.
https://www.mohre.gov.ae/handlers/download.ashx?YXNzZXQ9NjAzNQ==
Distributions of private sector workers by activity available for the period 2020-2022 are not disaggregated by Emirate.
Total figures published in this 2011-2019 dataset may have been readjusted by MoHRE in later publications.
Date of access: February 2023.
GLMM and GRC cannot guarantee that the link to access the source will not change; that the information will not be removed from the website it was obtained from; that no geo-blockages will be imposed; or that the information will not be available for any another reason.
Keywords:
United Arab Emirates, Labour Market, Employment
|
Dubai |
Abu Dhabi |
Sharjah |
Ajman |
Ras Al Khaimah |
Fujairah |
Um Al Quwwain |
Total |
| Agriculture |
15,133 |
18,149 |
332 |
114 |
479 |
238 |
31 |
34,476 |
| Fishing |
1,799 |
1,743 |
2,364 |
1,140 |
1,771 |
1,209 |
912 |
10,938 |
| Mining and quarrying |
2,950 |
61,088 |
816 |
228 |
146 |
3,429 |
29 |
68,686 |
| Manufacturing |
180,015 |
99,197 |
104,023 |
52,201 |
15,265 |
8,991 |
11,553 |
471,245 |
| Electricity, gas and water supply |
2,017 |
2,633 |
209 |
1,178 |
365 |
125 |
690 |
7,217 |
| Construction |
716,914 |
543,491 |
171,543 |
71,843 |
39,989 |
24,837 |
9,592 |
1,578,209 |
| Trade and repair services |
626,905 |
229,702 |
145,441 |
45,676 |
28,385 |
20,311 |
6,490 |
1,102,910 |
| Hotels and restaurants |
107,030 |
59,652 |
23,349 |
9,939 |
7,163 |
4,150 |
2,258 |
213,541 |
| Transport, storage and communications |
208,947 |
97,778 |
23,308 |
6,917 |
7,577 |
11,283 |
1,459 |
357,269 |
| Financial intermediation |
44,152 |
13,561 |
6,294 |
522 |
465 |
403 |
173 |
65,570 |
| Business activities |
277,897 |
200,935 |
29,601 |
10,646 |
7,452 |
3,506 |
918 |
530,955 |
| Education |
34,109 |
22,688 |
12,162 |
3,893 |
1,670 |
1,337 |
389 |
76,248 |
| Health and social work |
31,046 |
27,983 |
5,723 |
1,748 |
845 |
1,172 |
183 |
68,700 |
| Social and personal services |
52,434 |
52,043 |
20,520 |
6,866 |
6,336 |
3,543 |
1,112 |
142,854 |
| Public administration |
|
|
|
|
|
|
|
|
| Extraterritorial organizations |
16 |
1 |
3 |
|
|
|
|
20 |
| Private households |
|
22 |
13 |
|
|
|
|
35 |
| Undefined/other activities |
4,427 |
563 |
156 |
19 |
187 |
60 |
|
5,412 |
| Total |
2,305,791 |
1,431,229 |
545,857 |
212,930 |
118,095 |
84,594 |
35,789 |
4,734,285 |
Source: GLMM’s elaboration, based on data from the Labour Market Information System, Ministry of Human Resources and Emiratisation (MoHRE)
ANNEXED NOTE
- Characteristics of data
The figures pertain to the number of workers registered in the UAE’s private sector, with the MoHRE.
The “labour force” includes all economically active individuals in the community, whether they are already working or looking for work
https://www.mohre.gov.ae/en/definitions.aspx
Employed persons: Individuals who are already engaged in productive work: it includes individual who are employed, even if they do not work because of illness or injury, holiday or for irregular work at the facilities in which they work for temporary or incidental reasons. This category also includes full-time and part-time workers.
Unemployed: Individuals who are able to work and wishing to do so, were still searching jobs during the survey. This category includes the unemployed who never entered the labour market, and who have previously worked and had to leave their jobs for any reason as a result of labour market conditions.
Reference period: end of year.
Workers employed in the Free Zones are not included in the figures.
Classification of activities: ISIC rev. 3.1
- Institution which provides data
Ministry of Human Resources and Emiratisation (MOHRE): http://www.mohre.gov.ae/en/home.aspx
- Data availability
The data is taken from the “open data” section of MoHRE website:
https://www.mohre.gov.ae/en/data-library/statistical-report.aspx
These data for 2011-2019 are available in a raw dataset downloadable in Excel (.csv) format.
https://www.mohre.gov.ae/handlers/download.ashx?YXNzZXQ9NjAzNQ==
Distributions of private sector workers by activity available for the period 2020-2022 are not disaggregated by Emirate.
Total figures published in this 2011-2019 dataset may have been readjusted by MoHRE in later publications.
Date of access: February 2023.
GLMM and GRC cannot guarantee that the link to access the source will not change; that the information will not be removed from the website it was obtained from; that no geo-blockages will be imposed; or that the information will not be available for any another reason.
Keywords:
United Arab Emirates, Labour Market, Employment
|
Dubai |
Abu Dhabi |
Sharjah |
Ajman |
Ras Al Khaimah |
Fujairah |
Um Al Quwwain |
Total |
| Agriculture |
10,093 |
13,909 |
435 |
101 |
449 |
195 |
22 |
25,204 |
| Fishing |
1,713 |
1,504 |
2,041 |
826 |
1,803 |
1,059 |
856 |
9,802 |
| Mining and quarrying |
3,453 |
52,200 |
742 |
106 |
178 |
1,977 |
24 |
58,680 |
| Manufacturing |
151,968 |
88,592 |
95,165 |
43,617 |
13,746 |
8,704 |
8,771 |
410,563 |
| Electricity, gas and water supply |
1,336 |
1,971 |
195 |
881 |
282 |
125 |
631 |
5,421 |
| Construction |
552,848 |
612,235 |
162,148 |
57,692 |
39,199 |
22,039 |
8,426 |
1,454,587 |
| Trade and repair services |
461,607 |
199,325 |
134,289 |
36,859 |
24,592 |
17,172 |
4,980 |
878,824 |
| Hotels and restaurants |
65,904 |
39,677 |
19,052 |
6,935 |
5,215 |
4,281 |
1,757 |
142,821 |
| Transport, storage and communications |
137,972 |
76,837 |
20,633 |
4,748 |
5,295 |
8,171 |
1,111 |
254,767 |
| Financial intermediation |
30,294 |
10,918 |
6,838 |
466 |
350 |
456 |
238 |
49,560 |
| Business activities |
162,442 |
150,600 |
26,991 |
7,302 |
5,630 |
3,462 |
592 |
357,019 |
| Education |
22,835 |
16,972 |
9,343 |
2,919 |
1,561 |
893 |
269 |
54,792 |
| Health and social work |
18,953 |
12,622 |
4,155 |
1,190 |
513 |
654 |
220 |
38,307 |
| Social and personal services |
34,897 |
41,129 |
17,714 |
5,343 |
5,440 |
2,917 |
992 |
108,432 |
| Public administration |
|
|
|
|
|
|
|
|
| Extraterritorial organizations |
16 |
|
|
|
|
|
|
16 |
| Private households |
|
12 |
5 |
|
|
|
|
17 |
| Undefined/other activities |
3,334 |
192 |
115 |
13 |
203 |
22 |
|
3,879 |
| Total |
1,659,665 |
1,318,695 |
499,861 |
168,998 |
104,456 |
72,127 |
28,889 |
3,852,691 |
Source: GLMM’s elaboration, based on data from the Labour Market Information System, Ministry of Human Resources and Emiratisation (MoHRE)
ANNEXED NOTE
- Characteristics of data
The figures pertain to the number of workers registered in the UAE’s private sector, with the MoHRE.
The “labour force” includes all economically active individuals in the community, whether they are already working or looking for work
https://www.mohre.gov.ae/en/definitions.aspx
Employed persons: Individuals who are already engaged in productive work: it includes individual who are employed, even if they do not work because of illness or injury, holiday or for irregular work at the facilities in which they work for temporary or incidental reasons. This category also includes full-time and part-time workers.
Unemployed: Individuals who are able to work and wishing to do so, were still searching jobs during the survey. This category includes the unemployed who never entered the labour market, and who have previously worked and had to leave their jobs for any reason as a result of labour market conditions.
Reference period: end of year.
Workers employed in the Free Zones are not included in the figures.
Classification of activities: ISIC rev. 3.1
- Institution which provides data
Ministry of Human Resources and Emiratisation (MOHRE): http://www.mohre.gov.ae/en/home.aspx
- Data availability
The data is taken from the “open data” section of MoHRE website:
https://www.mohre.gov.ae/en/data-library/statistical-report.aspx
These data for 2011-2019 are available in a raw dataset downloadable in Excel (.csv) format.
https://www.mohre.gov.ae/handlers/download.ashx?YXNzZXQ9NjAzNQ==
Distributions of private sector workers by activity available for the period 2020-2022 are not disaggregated by Emirate.
Total figures published in this 2011-2019 dataset may have been readjusted by MoHRE in later publications.
Date of access: February 2023.
GLMM and GRC cannot guarantee that the link to access the source will not change; that the information will not be removed from the website it was obtained from; that no geo-blockages will be imposed; or that the information will not be available for any another reason.
Keywords:
United Arab Emirates, Labour Market, Employment
| |
Bahrain |
Kuwait* |
Oman |
Qatar |
Saudi Arabia |
UAE |
| 2000 |
398,221 |
841,790 |
1,777,685 |
NA |
14,905,300 |
NA |
| 2001 |
409,615 |
870,283 |
1,826,124 |
NA |
15,275,721 |
NA |
| 2002 |
427,246 |
898,285 |
1,869,580 |
NA |
15,655,332 |
NA |
| 2003 |
445,634 |
927,686 |
1,781,558 |
NA |
16,044,362 |
NA |
| 2004 |
464,809 |
956,234 |
1,802,931 |
NA |
16,443,987 |
NA |
| 2005 |
484,806 |
992,217 |
1,842,684 |
NA |
16,854,157 |
NA |
| 2006 |
505,674 |
1,023,316 |
1,883,576 |
NA |
17,270,181 |
NA |
| 2007 |
527,433 |
1,054,598 |
1,922,697 |
NA |
17,691,336 |
NA |
| 2008 |
541,587 |
1,087,552 |
1,967,180 |
NA |
18,115,550 |
NA |
| 2009 |
558,011 |
1,118,911 |
2,017,559 |
NA |
18,543,246 |
NA |
| 2010 |
570,687 |
1,148,363 |
1,957,336 |
NA |
18,973,615 |
NA |
| 2011 |
584,688 |
1,183,185 |
2,013,158 |
NA |
19,405,685 |
NA |
| 2012 |
599,629 |
1,212,436 |
2,092,564 |
NA |
19,838,448 |
NA |
| 2013 |
614,830 |
1,242,499 |
2,172,002 |
NA |
19,209,753 |
NA |
| 2014 |
630,744 |
1,275,857 |
2,260,705 |
NA |
19,312,696 |
NA |
| 2015 |
647,835 |
1,307,605 |
2,344,946 |
NA |
19,692,639 |
NA |
| 2016 |
664,707 |
1,337,693 |
2,427,825 |
NA |
20,081,582 |
NA |
| 2017 |
677,506 |
1,370,013 |
2,505,369 |
NA |
20,427,576 |
NA |
| 2018 |
689,714 |
1,403,113 |
2,579,236 |
NA |
20,768,627 |
NA |
| 2019 |
701,827 |
1,432,045 |
2,655,144 |
NA |
21,103,198 |
NA |
| 2020 |
713,263 |
1,459,970 |
2,622,526 |
NA |
21,430,128 |
NA |
| 2021 |
719,333 |
1,488,716 |
2,766,808 |
NA |
21,690,648 |
NA |
*: end of year figures
NA: No data available as of 2 February 2023.
Sources:
(1) Bahrain: Information and EGovernment Authority (IGA), “Documents” section, Population 2021, https://www.data.gov.bh/en/ResourceCenter
Source: administrative records (central Population Register)
(2) Kuwait: Public Authority for Civil Information (PACI), Statistics Service System, Population publications, 31/12 issues, given years
https://www.paci.gov.kw/ (inaccessible from outside Kuwait as of 2 February 2023).
(3) Oman: National Center for Statistics and Information (NCSI), data portal (2000-2020) and NCSI’s homepage, population clock (30 June 2021) https://www.ncsi.gov.om/aboutus/Pages/PopulationClock.aspx.
(4) Qatar: No population data broken down by nationality.
(5) Saudi Arabia: Saudi Arabia Monetary Agency (SAMA), Yearly Statistics 2022;
Population estimates by the General Authority for Statistics (GAStat), based on the results of the Population Censuses (1974, 1992, 2004, 2010), on the Demographic Research Bulletin 2016 (2013-2017), and on administrative records: vital statistics records (births and deaths records) and im/emigration records (General Authority for Statistics)
https://www.sama.gov.sa/en-US/EconomicReports/pages/yearlystatistics.aspx.
(6) UAE: No population data broken down by nationality.
Last date of access: 2 February 2023.
GLMM and GRC cannot guarantee that the link to access the source will not change; that the information will not be removed from the website it was obtained from; that no geo-blockages will be imposed; or that the information will not be available for any another reason.
Keywords:
GCC, Bahrain, Oman, Kuwait, Saudi Arabia, Qatar, United Arab Emirates, National Population, Gulf Cooperation Council, GCC
|
Males |
Females |
Total |
| 2017 |
4,539,473 |
473,161 |
5,012,634 |
| 2018 |
4,491,771 |
488,501 |
4,980,272 |
| 2019 |
4,569,274 |
525,133 |
5,094,407 |
| 2020 |
4,292,692 |
506,504 |
4,799,196 |
| 2021 |
4,359,741 |
550,369 |
4,910,110 |
| 2022 |
4,857,927 |
619,439 |
5,477,366 |
Source: Labour Market Information System, Ministry of Human
Resources and Emiratisation (MoHRE)
ANNEXED NOTE
- Characteristics of data:
The figures pertain to the number of Emiratis and foreign nationals registered with the MoHRE, as employed in the UAE private sector.
The labour force includes all economically active individuals in the community, whether they are already working or looking for work
Employed persons: Individuals who are already engaged in productive work: it includes individual who are employed, even if they do not work because of illness or injury,
holiday or for irregular work at the facilities in which they work for temporary or incidental reasons. This category also includes full-time and part-time workers.
Unemployed: Individuals who are able to work and wishing to do so, were still searching jobs during the survey. This category includes the unemployed who never entered the labour market,
and who have previously worked and had to leave their jobs for any reason as a result of labour market conditions.
https://www.mohre.gov.ae/en/definitions.aspx
Reference period: end of year.
Workers employed in the Free Zones are not included in the figures.
Total figures published during past years may have been readjusted by MoHRE in this dataset.
- Institution which provides data:
Ministry of Human Resources and Emiratisation (MOHRE): http://www.mohre.gov.ae/en/home.aspx
- Data availability:
The data is taken from the “open data” section of MoHRE website:
https://www.mohre.gov.ae/en/data-library/statistical-report.aspx
Data is downloadable in Excel (.csv) format, for the current year.
Past years: data for 2011-2019 is available in a raw dataset
https://www.mohre.gov.ae/handlers/download.ashx?YXNzZXQ9NjAzNw==
No archive of data available for the period 2020-2021, as of Decembre 2022.
Date of access: 25 January 2023.
GLMM and GRC cannot guarantee that the link to access the source will not change; that the information will not be removed from the website it was obtained from; that no geo-blockages will be imposed; or that the information will not be available for any another reason.
Keywords:
United Arab Emirates, Labour Market, Employment, Female Employment
|
2017 |
2018 |
2019 |
2020 |
2021 |
2022 |
| Agriculture |
35,930 |
35,762 |
34,643 |
N.A. |
23,443 |
28,009 |
| Fishing |
10,997 |
10,510 |
9,806 |
N.A. |
9,350 |
11,668 |
| Mining and quarrying |
66,209 |
64,552 |
60,493 |
N.A. |
13,986 |
8,300 |
| Manufacturing |
473,691 |
462,966 |
468,916 |
N.A. |
572,390 |
660,863 |
| Electricity, gas and water supply |
7,526 |
7,661 |
7,358 |
N.A. |
9,672 |
9,455 |
| Construction |
1,711,761 |
1,682,416 |
1,641,724 |
N.A. |
1,301,359 |
1,386,498 |
| Trade and repair services |
1,121,742 |
1,095,026 |
1,103,915 |
N.A. |
1,041,800 |
1,129,192 |
| Hotels and restaurants |
235,549 |
237,990 |
249,867 |
N.A. |
256,506 |
286,935 |
| Transport, storage and communications |
368,331 |
350,413 |
353,485 |
N.A. |
283,709 |
297,330 |
| Financial intermediation |
71,167 |
72,948 |
72,075 |
N.A. |
64,012 |
77,246 |
| Business activities |
593,792 |
610,943 |
649,245 |
N.A. |
908,158 |
1,068,497 |
| Education |
87,876 |
91,628 |
93,152 |
N.A. |
69,158 |
67,495 |
| Health and social work |
82,714 |
87,664 |
90,028 |
N.A. |
76,197 |
84,846 |
| Social and personal services |
154,494 |
158,934 |
193,527 |
N.A. |
233,988 |
306,913 |
| Public administration |
|
1,371 |
5,824 |
N.A. |
|
51,253 |
| Extraterritorial organizations |
45 |
52 |
55 |
N.A. |
|
|
| Private households |
24 |
21 |
23 |
N.A. |
|
|
| Undefined/other activities |
17,502 |
25,047 |
60,647 |
N.A. |
39,884 |
2,866 |
| Total |
5,039,350 |
4,995,904 |
5,094,783 |
4,799,196 |
4,903,612 |
5,477,366 |
Source: Labour Market Information System, Ministry of Human Resources and Emiratisation (MoHRE)
ANNEXED NOTE
- Characteristics of data:
The figures pertain to the number of workers registered in the UAE’s private sector, with the MoHRE.
The labour force includes all economically active individuals in the community, whether they are already working or looking for work
https://www.mohre.gov.ae/en/definitions.aspx
Employed persons: Individuals who are already engaged in productive work: it includes individual who are employed, even if they do not work because of illness or injury,
holiday or for irregular work at the facilities in which they work for temporary or incidental reasons. This category also includes full-time and part-time workers.
Unemployed: Individuals who are able to work and wishing to do so, were still searching jobs during the survey. This category includes the unemployed who never entered the labour market, and who have previously worked and had to leave their jobs for any reason as a result of labour market conditions.
Reference period: end of year.
Workers employed in the Free Zones are not included in the figures.
Classification of activities: ISIC rev. 3.1
- Institution which provides data:
Ministry of Human Resources and Emiratisation (MOHRE): http://www.mohre.gov.ae/en/home.aspx
- Data availability:
The data is taken from the “open data” section of MoHRE website:
https://www.mohre.gov.ae/en/data-library/statistical-report.aspx
Data is downloadable in Excel (.csv) format, for the current year.
Past years: data for 2011-2019 is available in a raw dataset
https://www.mohre.gov.ae/handlers/download.ashx?YXNzZXQ9NjAzNQ==
No archive of data available for the period 2020-2021, as of Decembre 2022.
Total figures published in the 2011-2019 dataset may have been readjusted by MoHRE in later publications.
Date of access: 07 December 2022.
GLMM and GRC cannot guarantee that the link to access the source will not change; that the information will not be removed from the website it was obtained from; that no geo-blockages will be imposed; or that the information will not be available for any another reason.
Keywords:
United Arab Emirates, Labour Market, Employment
|
Total |
| 2017 |
5,012,634 |
| 2018 |
4,980,272 |
| 2019 |
5,094,407 |
| 2020 |
4,799,196 |
| 2021 |
4,910,110 |
| 2022 |
5,477,366 |
Source: Labour Market Information System, Ministry
of Human Resources and Emiratisation (MoHRE)
ANNEXED NOTE
- Characteristics of data:
The figures pertain to the number of Emiratis and foreign nationals registered with the MoHRE, as employed in the UAE private sector.
The labour force includes all economically active individuals in the community, whether they are already working or looking for work
Employed persons: Individuals who are already engaged in productive work: it includes individual who are employed, even if they do not work because of illness or injury,
holiday or for irregular work at the facilities in which they work for temporary or incidental reasons. This category also includes full-time and part-time workers.
Unemployed: Individuals who are able to work and wishing to do so, were still searching jobs during the survey. This category includes the unemployed who never entered the labour market,
and who have previously worked and had to leave their jobs for any reason as a result of labour market conditions.
https://www.mohre.gov.ae/en/definitions.aspx
Reference period: end of year.
Workers employed in the Free Zones are not included in the figures.
Total figures published during past years may have been readjusted by MoHRE in this dataset.
- Institution which provides data:
Ministry of Human Resources and Emiratisation (MOHRE): http://www.mohre.gov.ae/en/home.aspx
- Data availability:
The data is taken from the “open data” section of MoHRE website:
https://www.mohre.gov.ae/en/data-library/statistical-report.aspx
Data is downloadable in Excel (.csv) format, for the current year.
Past years: data for 2011-2019 is available in a raw dataset
https://www.mohre.gov.ae/handlers/download.ashx?YXNzZXQ9NjAzNw==
No archive of data available for the period 2020-2021, as of Decembre 2022.
Date of access: 25 January 2023.
GLMM and GRC cannot guarantee that the link to access the source will not change; that the information will not be removed from the website it was obtained from; that no geo-blockages will be imposed; or that the information will not be available for any another reason.
Keywords:
United Arab Emirates, Labour Market, Employment
|
Bahrain |
Kuwait* |
Oman* |
Qatar |
Saudi Arabia |
UAE |
|
Males |
Females |
Males |
Females |
Males |
Females |
Males |
Females |
Males |
Females |
Males |
Females |
| 15-19 |
8,409 |
7,350 |
47,045 |
43,945 |
16,569 |
15,171 |
31,124 |
24,383 |
290,033 |
268,582 |
N.A. |
N.A. |
| 20-24 |
29,557 |
10,659 |
58,796 |
39,134 |
69,914 |
17,364 |
110,358 |
47,186 |
248,511 |
230,645 |
N.A. |
N.A. |
| 25-29 |
55,868 |
27,542 |
243,517 |
85,211 |
222,714 |
42,773 |
240,839 |
61,223 |
590,908 |
423,649 |
N.A. |
N.A. |
| 30-34 |
116,300 |
34,500 |
304,960 |
131,543 |
288,798 |
62,400 |
373,785 |
81,727 |
827,188 |
451,181 |
N.A. |
N.A. |
| 35-39 |
108,811 |
32,126 |
302,034 |
135,890 |
256,492 |
58,520 |
297,637 |
59,623 |
1,361,986 |
590,636 |
N.A. |
N.A. |
| 40-44 |
74,925 |
26,544 |
280,044 |
121,228 |
169,839 |
43,751 |
281,574 |
57,903 |
1,366,152 |
541,376 |
N.A. |
N.A. |
| 45-49 |
53,458 |
19,150 |
205,847 |
92,266 |
110,697 |
29,496 |
146,364 |
32,855 |
1,091,448 |
343,523 |
N.A. |
N.A. |
| 50-54 |
36,096 |
12,406 |
151,150 |
60,835 |
72,621 |
16,655 |
122,707 |
21,948 |
735,903 |
131,909 |
N.A. |
N.A. |
| 55-59 |
20,231 |
7,830 |
90,286 |
33,874 |
39,033 |
9,357 |
52,527 |
13,170 |
455,271 |
79,713 |
N.A. |
N.A. |
| 60-64 |
10,483 |
4,192 |
40,568 |
16,610 |
18,757 |
5,082 |
25,043 |
5,908 |
252,924 |
52,188 |
N.A. |
N.A. |
| Total |
514,138 |
182,299 |
1,724,247 |
760,536 |
1,265,434 |
300,569 |
1,681,958 |
405,926 |
7,220,324 |
3,113,402 |
N.A. |
N.A. |
Source: National institutes of statistics
1- Definition:
Non-nationals are:
1- persons bearing nationality of a foreign State other than the GCC State of residence, or bearing no proof of nationality from any given state (stateless persons and holders of refugee status and travel document in a third country);
2- Holders of residence permit residing in the given GCC country at date of census, as per definition of residence used in each of the countries.
N.A: Non-Available
*: end of year data.
2- Sources of data:
(1) Bahrain Open Data Portal, “Documents” section, Population 2021, https://www.data.gov.bh/en/ResourceCenter
Source: administrative records (central Population Register)
(2) Statistics Service System, Kuwait Public Authority for Civil Information (PACI). Population, June 2021.
https://www.paci.gov.kw/ (inaccessible from outside Kuwait since 2019)
(3) National Centre for Statistical Information (NCSI). Population Statistics 2021, NCSI, 2022.
https://www.ncsi.gov.om/Elibrary/Pages/LibraryContentView.aspx
(4) Qatar Planning and Statistics Authority, Annual Bulletin of Labour Force 2021
https://www.psa.gov.qa/en/statistics/Statistical%20Releases/Social/LaborForce/2021/Annual_Bulletin_Labour_force_2021_AE.xlsx
https://www.psa.gov.qa/en/statistics/Statistical%20Releases/Social/LaborForce/2021/Annual_Bulletin_Labour_force_2021_AE.pdf
(5) Saudi Arabia General Authority for Statistics, population estimates for mid-2021. Population estimates are based on the results of the Population Censuses (1974, 1992, 2004, 2010), on the Demographic Research Bulletin 2016 (2013-2017), and on administrative records: vital statistics records (births and deaths records) and im/emigration records.
https://www.stats.gov.sa/en/43
https://www.stats.gov.sa/ar/43
(6) UAE: No figures of total (non-disaggregated) population available for 2021, as of 4 December 2022. Figures of UAE population disaggregated by nationality are unavailable in published sources.
Last date of access: December 2022.
GLMM and GRC cannot guarantee that the link to access the source will not change; that the information will not be removed from the website it was obtained from; that no geo-blockages will be imposed; or that the information will not be available for any another reason.
Keywords:
Gulf Cooperation Council, Bahrain, Oman, Kuwait, Saudi Arabia, Qatar, United Arab Emirates, Foreign Labour
|
Bahrain |
Kuwait* |
Oman* |
Qatar |
Saudi Arabia |
UAE |
|
Males |
Females |
Males |
Females |
Males |
Females |
Males |
Females |
Males |
Females |
Males |
Females |
| 15-19 |
33,322 |
31,809 |
75,620 |
73,648 |
115,743 |
112,089 |
13,505 |
14,434 |
951,818 |
894,816 |
N.A. |
N.A. |
| 20-24 |
31,083 |
29,034 |
66,968 |
64,580 |
110,010 |
106,638 |
17,262 |
14,954 |
1,074,376 |
998,140 |
N.A. |
N.A. |
| 25-29 |
30,448 |
28,670 |
64,791 |
63,924 |
122,117 |
118,319 |
14,286 |
14,483 |
1,041,974 |
1,026,056 |
N.A. |
N.A. |
| 30-34 |
28,301 |
27,053 |
53,845 |
56,100 |
121,672 |
119,008 |
11,483 |
10,247 |
936,104 |
941,473 |
N.A. |
N.A. |
| 35-39 |
25,011 |
24,344 |
47,090 |
51,800 |
110,982 |
108,922 |
8,579 |
10,627 |
856,123 |
821,573 |
N.A. |
N.A. |
| 40-44 |
22,309 |
21,841 |
38,634 |
43,752 |
84,653 |
84,946 |
6,933 |
8,769 |
684,143 |
673,694 |
N.A. |
N.A. |
| 45-49 |
17,990 |
18,086 |
33,400 |
38,542 |
57,853 |
56,432 |
6,876 |
8,877 |
593,073 |
560,761 |
N.A. |
N.A. |
| 50-54 |
16,175 |
16,855 |
28,444 |
33,411 |
38,105 |
38,162 |
7,678 |
7,449 |
474,238 |
450,961 |
N.A. |
N.A. |
| 55-59 |
15,956 |
17,094 |
23,497 |
28,108 |
30,373 |
31,870 |
6,284 |
7,339 |
377,003 |
350,308 |
N.A. |
N.A. |
| 60-64 |
13,195 |
13,689 |
16,613 |
21,812 |
23,865 |
28,167 |
4,767 |
5,117 |
258,833 |
245,608 |
N.A. |
N.A. |
| Total |
233,790 |
228,475 |
448,902 |
475,677 |
815,373 |
804,553 |
97,653 |
102,296 |
7,247,685 |
6,963,390 |
N.A. |
N.A. |
Source: National institutes of statistics
1- Definition:
Non-nationals are:
1- persons bearing nationality of a foreign State other than the GCC State of residence, or bearing no proof of nationality from any given state (stateless persons and holders of refugee status and travel document in a third country);
2- Holders of residence permit residing in the given GCC country at date of census, as per definition of residence used in each of the countries.
N.A: Non-Available
*: end of year data.
2- Sources of data:
(1) Bahrain Open Data Portal, “Documents” section, Population 2021, https://www.data.gov.bh/en/ResourceCenter
Source: administrative records (central Population Register)
(2) Statistics Service System, Kuwait Public Authority for Civil Information (PACI). Population, June 2021.
https://www.paci.gov.kw/ (inaccessible from outside Kuwait since 2019)
(3) National Centre for Statistical Information (NCSI). Population Statistics 2021, NCSI, 2022.
https://www.ncsi.gov.om/Elibrary/Pages/LibraryContentView.aspx
(4) Qatar Planning and Statistics Authority, Annual Bulletin of Labour Force 2021
https://www.psa.gov.qa/en/statistics/Statistical%20Releases/Social/LaborForce/2021/Annual_Bulletin_Labour_force_2021_AE.xlsx
https://www.psa.gov.qa/en/statistics/Statistical%20Releases/Social/LaborForce/2021/Annual_Bulletin_Labour_force_2021_AE.pdf
(5) Saudi Arabia General Authority for Statistics, population estimates for mid-2021. Population estimates are based on the results of the Population Censuses (1974, 1992, 2004, 2010), on the Demographic Research Bulletin 2016 (2013-2017), and on administrative records: vital statistics records (births and deaths records) and im/emigration records.
https://www.stats.gov.sa/en/43
https://www.stats.gov.sa/ar/43
(6) UAE: No figures of total (non-disaggregated) population available for 2021, as of 4 December 2022. Figures of UAE population disaggregated by nationality are unavailable in published sources.
Last date of access: December 2022.
GLMM and GRC cannot guarantee that the link to access the source will not change; that the information will not be removed from the website it was obtained from; that no geo-blockages will be imposed; or that the information will not be available for any another reason.
Keywords:
Gulf Cooperation Council, Bahrain, Oman, Kuwait, Saudi Arabia, Qatar, United Arab Emirates, National Labour
| |
Bahrain |
Kuwait* |
Oman* |
Qatar |
Saudi Arabia |
UAE |
| |
Nationals |
Non-nationals |
Nationals |
Non-nationals |
Nationals |
Non-nationals |
Nationals |
Non-nationals |
Nationals |
Non-nationals |
Nationals |
Non-nationals |
| 15-19 |
65,131 |
15,759 |
149,268 |
90,990 |
227,832 |
31,740 |
27,939 |
55,507 |
1,846,634 |
558,615 |
N.A. |
N.A. |
| 20-24 |
60,117 |
40,216 |
131,548 |
97,930 |
216,648 |
87,278 |
32,216 |
157,544 |
2,072,516 |
479,156 |
N.A. |
N.A. |
| 25-29 |
59,118 |
83,410 |
128,715 |
328,728 |
240,436 |
265,487 |
28,769 |
302,062 |
2,068,030 |
1,014,557 |
N.A. |
N.A. |
| 30-34 |
55,354 |
150,800 |
109,945 |
436,503 |
240,680 |
351,198 |
21,730 |
455,512 |
1,877,577 |
1,278,369 |
N.A. |
N.A. |
| 35-39 |
49,355 |
140,937 |
98,890 |
437,924 |
219,904 |
315,012 |
19,206 |
357,260 |
1,677,696 |
1,952,622 |
N.A. |
N.A. |
| 40-44 |
44,150 |
101,469 |
82,386 |
401,272 |
169,599 |
213,590 |
15,702 |
339,477 |
1,357,837 |
1,907,528 |
N.A. |
N.A. |
| 45-49 |
36,076 |
72,608 |
71,942 |
298,113 |
114,285 |
140,193 |
15,753 |
179,219 |
1,153,834 |
1,434,971 |
N.A. |
N.A. |
| 50-54 |
33,030 |
48,502 |
61,855 |
211,985 |
76,267 |
89,276 |
15,127 |
144,655 |
925,199 |
867,812 |
N.A. |
N.A. |
| 55-59 |
33,050 |
28,061 |
51,605 |
124,160 |
62,243 |
48,390 |
13,623 |
65,697 |
727,311 |
534,984 |
N.A. |
N.A. |
| 60-64 |
26,884 |
14,675 |
38,425 |
57,178 |
52,032 |
23,839 |
9,884 |
30,951 |
504,441 |
305,112 |
N.A. |
N.A. |
| Total |
462,265 |
696,437 |
924,579 |
2,484,783 |
1,619,926 |
1,566,003 |
199,949 |
2,087,884 |
14,211,075 |
10,333,726 |
N.A. |
N.A. |
Source: National institutes of statistics
1- Definition:
Non-nationals are:
1- persons bearing nationality of a foreign State other than the GCC State of residence, or bearing no proof of nationality from any given state (stateless persons and holders of refugee status and travel document in a third country);
2- Holders of residence permit residing in the given GCC country at date of census, as per definition of residence used in each of the countries.
N.A: Non-Available
*: end of year data.
2- Sources of data:
(1) Bahrain Open Data Portal, “Documents” section, Population 2021, https://www.data.gov.bh/en/ResourceCenter
Source: administrative records (central Population Register)
(2) Statistics Service System, Kuwait Public Authority for Civil Information (PACI). Population, June 2021.
https://www.paci.gov.kw/ (inaccessible from outside Kuwait since 2019)
(3) National Centre for Statistical Information (NCSI). Population Statistics 2021, NCSI, 2022.
https://www.ncsi.gov.om/Elibrary/Pages/LibraryContentView.aspx
(4) Qatar Planning and Statistics Authority, Annual Bulletin of Labour Force 2021
https://www.psa.gov.qa/en/statistics/Statistical%20Releases/Social/LaborForce/2021/Annual_Bulletin_Labour_force_2021_AE.xlsx
https://www.psa.gov.qa/en/statistics/Statistical%20Releases/Social/LaborForce/2021/Annual_Bulletin_Labour_force_2021_AE.pdf
(5) Saudi Arabia General Authority for Statistics, population estimates for mid-2021. Population estimates are based on the results of the Population Censuses (1974, 1992, 2004, 2010), on the Demographic Research Bulletin 2016 (2013-2017), and on administrative records: vital statistics records (births and deaths records) and im/emigration records.
https://www.stats.gov.sa/en/43
https://www.stats.gov.sa/ar/43
(6) UAE: No figures of total (non-disaggregated) population available for 2021, as of 4 December 2022. Figures of UAE population disaggregated by nationality are unavailable in published sources.
Last date of access: December 2022.
GLMM and GRC cannot guarantee that the link to access the source will not change; that the information will not be removed from the website it was obtained from; that no geo-blockages will be imposed; or that the information will not be available for any another reason.
Keywords:
Gulf Cooperation Council, Bahrain, Oman, Kuwait, Saudi Arabia, Qatar, United Arab Emirates, National & Foreign Labour, National Labour, Foreign Labour
| |
Bahrain |
Kuwait* |
Oman* |
Qatar |
Saudi Arabia |
| |
Males |
Females |
Males |
Females |
Males |
Females |
Males |
Females |
Males |
Females |
| 0-4 |
14,775 |
14,223 |
56,135 |
53,590 |
23,100 |
21,869 |
N.A. |
N.A. |
260,073 |
240,984 |
| 5-9 |
13,428 |
13,091 |
68,530 |
65,277 |
26,797 |
25,304 |
N.A. |
N.A. |
369,455 |
354,872 |
| 10-14 |
11,100 |
10,582 |
62,186 |
58,970 |
22,327 |
20,976 |
N.A. |
N.A. |
321,032 |
303,024 |
| 15-19 |
8,409 |
7,350 |
47,045 |
43,945 |
16,569 |
15,171 |
31,124 |
24,383 |
290,033 |
268,582 |
| 20-24 |
29,557 |
10,659 |
58,796 |
39,134 |
69,914 |
17,364 |
110,358 |
47,186 |
248,511 |
230,645 |
| 25-29 |
55,868 |
27,542 |
243,517 |
85,211 |
222,714 |
42,773 |
240,839 |
61,223 |
590,908 |
423,649 |
| 30-34 |
116,300 |
34,500 |
304,960 |
131,543 |
288,798 |
62,400 |
373,785 |
81,727 |
827,188 |
451,181 |
| 35-39 |
108,811 |
32,126 |
302,034 |
135,890 |
256,492 |
58,520 |
297,637 |
59,623 |
1,361,986 |
590,636 |
| 40-44 |
74,925 |
26,544 |
280,044 |
121,228 |
169,839 |
43,751 |
281,574 |
57,903 |
1,366,152 |
541,376 |
| 45-49 |
53,458 |
19,150 |
205,847 |
92,266 |
110,697 |
29,496 |
146,364 |
32,855 |
1,091,448 |
343,523 |
| 50-54 |
36,096 |
12,406 |
151,150 |
60,835 |
72,621 |
16,655 |
122,707 |
21,948 |
735,903 |
131,909 |
| 55-59 |
20,231 |
7,830 |
90,286 |
33,874 |
39,033 |
9,357 |
52,527 |
13,170 |
455,271 |
79,713 |
| 60-64 |
10,483 |
4,192 |
40,568 |
16,610 |
18,757 |
5,082 |
25,043 |
5,908 |
252,924 |
52,188 |
| 65-69 |
4,201 |
1,856 |
17,588 |
7,973 |
7,075 |
2,935 |
5,141 |
2,686 |
164,766 |
72,241 |
| 70-74 |
1,532 |
816 |
7,371 |
4,275 |
2,134 |
1,551 |
2,604 |
753 |
| 75-79 |
709 |
461 |
3,256 |
2,427 |
965 |
835 |
1,595 |
1,201 |
| 80-84 |
352 |
275 |
1,438 |
1,268 |
814 |
644 |
| 85+ |
621 |
573 |
877 |
1,057 |
| Total |
560,856 |
224,176 |
1,941,628 |
955,373 |
1,348,646 |
374,683 |
1,691,298 |
410,566 |
8,335,650 |
4,084,523 |
Source: National institutes of statistics
1- Definition:
Non-nationals are:
1- persons bearing nationality of a foreign State other than the GCC State of residence, or bearing no proof of nationality from any given state (stateless persons and holders of refugee status and travel document in a third country);
2- Holders of residence permit residing in the given GCC country at date of census, as per definition of residence used in each of the countries.
*: end of year data.
2- Sources of data:
(1) Bahrain Open Data Portal, “Documents” section, Population 2021, https://www.data.gov.bh/en/ResourceCenter
Source: administrative records (central Population Register)
(2) Statistics Service System, Kuwait Public Authority for Civil Information (PACI). Population, June 2021.
https://www.paci.gov.kw/
(3) National Centre for Statistical Information (NCSI). Population Statistics 2021, NCSI, 2022.
https://www.ncsi.gov.om/Elibrary/Pages/LibraryContentView.aspx
(4) Qatar Planning and Statistics Authority, Annual Bulletin of Labour Force 2021
https://www.psa.gov.qa/en/statistics/Statistical%20Releases/Social/LaborForce/2021/Annual_Bulletin_Labour_force_2021_AE.xlsx;
https://www.psa.gov.qa/en/statistics/Statistical%20Releases/Social/LaborForce/2021/Annual_Bulletin_Labour_force_2021_AE.pdf
No figures of population aged 0-14 disaggregated by nationality available.
(5) Saudi Arabia General Authority for Statistics, population estimates for mid-2021.
Population estimates are based on the results of the Population Censuses (1974, 1992, 2004, 2010), on the Demographic Research Bulletin 2016 (2013-2017), and on administrative records: vital statistics records (births and deaths records) and im/emigration records.
https://www.stats.gov.sa/en/43
https://www.stats.gov.sa/ar/43
(6) No figures of total (non-disaggregated) population available for 2021, as of 4 December 2022. Figures of UAE population disaggregated by nationality are unavailable in published sources.
Last date of access: December 2022.
GLMM and GRC cannot guarantee that the link to access the source will not change; that the information will not be removed from the website it was obtained from; that no geo-blockages will be imposed; or that the information will not be available for any another reason.
Keywords: Bahrain, Kuwait, Oman, Qatar, Saudi Arabia, Foreign & National Populations
| |
Bahrain |
Kuwait* |
Oman* |
Qatar |
Saudi Arabia |
| |
Males |
Females |
Males |
Females |
Males |
Females |
Males |
Females |
Males |
Females |
| 0-4 |
34,434 |
33,273 |
83,414 |
79,546 |
200,547 |
193,196 |
N.A. |
N.A. |
1,103,151 |
1,085,223 |
| 5-9 |
38,620 |
36,955 |
85,289 |
81,776 |
198,948 |
191,507 |
N.A. |
N.A. |
1,165,051 |
1,097,326 |
| 10-14 |
36,425 |
34,921 |
83,776 |
81,356 |
151,164 |
146,456 |
N.A. |
N.A. |
1,043,917 |
1,032,094 |
| 15-19 |
33,322 |
31,809 |
75,620 |
73,648 |
115,743 |
112,089 |
13,505 |
14,434 |
951,818 |
894,816 |
| 20-24 |
31,083 |
29,034 |
66,968 |
64,580 |
110,010 |
106,638 |
17,262 |
14,954 |
1,074,376 |
998,140 |
| 25-29 |
30,448 |
28,670 |
64,791 |
63,924 |
122,117 |
118,319 |
14,286 |
14,483 |
1,041,974 |
1,026,056 |
| 30-34 |
28,301 |
27,053 |
53,845 |
56,100 |
121,672 |
119,008 |
11,483 |
10,247 |
936,104 |
941,473 |
| 35-39 |
25,011 |
24,344 |
47,090 |
51,800 |
110,982 |
108,922 |
8,579 |
10,627 |
856,123 |
821,573 |
| 40-44 |
22,309 |
21,841 |
38,634 |
43,752 |
84,653 |
84,946 |
6,933 |
8,769 |
684,143 |
673,694 |
| 45-49 |
17,990 |
18,086 |
33,400 |
38,542 |
57,853 |
56,432 |
6,876 |
8,877 |
593,073 |
560,761 |
| 50-54 |
16,175 |
16,855 |
28,444 |
33,411 |
38,105 |
38,162 |
7,678 |
7,449 |
474,238 |
450,961 |
| 55-59 |
15,956 |
17,094 |
23,497 |
28,108 |
30,373 |
31,870 |
6,284 |
7,339 |
377,003 |
350,308 |
| 60-64 |
13,195 |
13,689 |
16,613 |
21,812 |
23,865 |
28,167 |
4,767 |
5,117 |
258,833 |
245,608 |
| 65-69 |
9,878 |
8,893 |
11,990 |
16,791 |
16,225 |
20,658 |
3,501 |
2,776 |
468,202 |
484,609 |
| 70-74 |
5,736 |
4,876 |
6,822 |
10,791 |
12,016 |
14,252 |
1,641 |
1,449 |
| 75-79 |
2,969 |
3,182 |
4,671 |
6,865 |
8,362 |
9,702 |
2,753 |
1,730 |
| 80-84 |
1,811 |
2,161 |
2,909 |
3,664 |
9,873 |
11,285 |
| 85+ |
1,228 |
1,706 |
1,865 |
2,612 |
| Total |
364,891 |
354,442 |
729,638 |
759,078 |
1,412,508 |
1,391,609 |
105,548 |
108,251 |
11,028,006 |
10,662,642 |
Source: National institutes of statistics
1- Definition:
Non-nationals are:
1- persons bearing nationality of a foreign State other than the GCC State of residence, or bearing no proof of nationality from any given state (stateless persons and holders of refugee status and travel document in a third country);
2- Holders of residence permit residing in the given GCC country at date of census, as per definition of residence used in each of the countries.
*: end of year data.
2- Sources of data:
(1) Bahrain Open Data Portal, “Documents” section, Population 2021, https://www.data.gov.bh/en/ResourceCenter
Source: administrative records (central Population Register)
(2) Statistics Service System, Kuwait Public Authority for Civil Information (PACI). Population, June 2021.
https://www.paci.gov.kw/
(3) National Centre for Statistical Information (NCSI). Population Statistics 2021, NCSI, 2022.
https://www.ncsi.gov.om/Elibrary/Pages/LibraryContentView.aspx
(4) Qatar Planning and Statistics Authority, Annual Bulletin of Labour Force 2021
https://www.psa.gov.qa/en/statistics/Statistical%20Releases/Social/LaborForce/2021/Annual_Bulletin_Labour_force_2021_AE.xlsx;
https://www.psa.gov.qa/en/statistics/Statistical%20Releases/Social/LaborForce/2021/Annual_Bulletin_Labour_force_2021_AE.pdf
No figures of population aged 0-14 disaggregated by nationality available.
(5) Saudi Arabia General Authority for Statistics, population estimates for mid-2021.
Population estimates are based on the results of the Population Censuses (1974, 1992, 2004, 2010), on the Demographic Research Bulletin 2016 (2013-2017), and on administrative records: vital statistics records (births and deaths records) and im/emigration records.
https://www.stats.gov.sa/en/43
https://www.stats.gov.sa/ar/43
(6) No figures of total (non-disaggregated) population available for 2021, as of 4 December 2022. Figures of UAE population disaggregated by nationality are unavailable in published sources.
Last date of access: December 2022.
GLMM and GRC cannot guarantee that the link to access the source will not change; that the information will not be removed from the website it was obtained from; that no geo-blockages will be imposed; or that the information will not be available for any another reason.
Keywords: Bahrain, Kuwait, Oman, Qatar, Saudi Arabia, Foreign & National Populations
| |
Bahrain |
Kuwait* |
Oman* |
Qatar |
Saudi Arabia |
| |
Nationals |
Non-nationals |
Nationals |
Non-nationals |
Nationals |
Non-nationals |
Nationals |
Non-nationals |
Nationals |
Non-nationals |
| 0-4 |
67,707 |
28,998 |
162,960 |
109,725 |
393,743 |
44,969 |
N.A. |
N.A. |
2,188,374 |
501,057 |
| 5-9 |
75,575 |
26,519 |
167,065 |
133,807 |
390,455 |
52,101 |
N.A. |
N.A. |
2,262,377 |
724,327 |
| 10-14 |
71,346 |
21,682 |
165,132 |
121,156 |
297,620 |
43,303 |
N.A. |
N.A. |
2,076,011 |
624,056 |
| 15-19 |
65,131 |
15,759 |
149,268 |
90,990 |
227,832 |
31,740 |
27,939 |
55,507 |
1,846,634 |
558,615 |
| 20-24 |
60,117 |
40,216 |
131,548 |
97,930 |
216,648 |
87,278 |
32,216 |
157,544 |
2,072,516 |
479,156 |
| 25-29 |
59,118 |
83,410 |
128,715 |
328,728 |
240,436 |
265,487 |
28,769 |
302,062 |
2,068,030 |
1,014,557 |
| 30-34 |
55,354 |
150,800 |
109,945 |
436,503 |
240,680 |
351,198 |
21,730 |
455,512 |
1,877,577 |
1,278,369 |
| 35-39 |
49,355 |
140,937 |
98,890 |
437,924 |
219,904 |
315,012 |
19,206 |
357,260 |
1,677,696 |
1,952,622 |
| 40-44 |
44,150 |
101,469 |
82,386 |
401,272 |
169,599 |
213,590 |
15,702 |
339,477 |
1,357,837 |
1,907,528 |
| 45-49 |
36,076 |
72,608 |
71,942 |
298,113 |
114,285 |
140,193 |
15,753 |
179,219 |
1,153,834 |
1,434,971 |
| 50-54 |
33,030 |
48,502 |
61,855 |
211,985 |
76,267 |
89,276 |
15,127 |
144,655 |
925,199 |
867,812 |
| 55-59 |
33,050 |
28,061 |
51,605 |
124,160 |
62,243 |
48,390 |
13,623 |
65,697 |
727,311 |
534,984 |
| 60-64 |
26,884 |
14,675 |
38,425 |
57,178 |
52,032 |
23,839 |
9,884 |
30,951 |
504,441 |
305,112 |
| 65-69 |
18,771 |
6,057 |
28,781 |
25,561 |
36,883 |
10,010 |
6,277 |
7,827 |
952,811 |
237,007 |
| 70-74 |
10,612 |
2,348 |
17,613 |
11,646 |
26,268 |
3,685 |
3,090 |
3,357 |
| 75-79 |
6,151 |
1,170 |
11,536 |
5,683 |
18,064 |
1,800 |
4,483 |
2,796 |
| 80-84 |
3,972 |
627 |
6,573 |
2,706 |
21,158 |
1,458 |
| 85+ |
2,934 |
1,194 |
4,477 |
1,934 |
| Total |
719,333 |
785,032 |
1,488,716 |
2,897,001 |
2,804,117 |
1,723,329 |
213,799 |
2,101,864 |
21,690,648 |
12,420,173 |
Source: National institutes of statistics
1- Definition:
Non-nationals are:
1- persons bearing nationality of a foreign State other than the GCC State of residence, or bearing no proof of nationality from any given state (stateless persons and holders of refugee status and travel document in a third country);
2- Holders of residence permit residing in the given GCC country at date of census, as per definition of residence used in each of the countries.
*: end of year data.
2- Sources of data:
(1) Bahrain Open Data Portal, “Documents” section, Population 2021, https://www.data.gov.bh/en/ResourceCenter
Source: administrative records (central Population Register)
(2) Statistics Service System, Kuwait Public Authority for Civil Information (PACI). Population, June 2021.
https://www.paci.gov.kw/
(3) National Centre for Statistical Information (NCSI). Population Statistics 2021, NCSI, 2022.
https://www.ncsi.gov.om/Elibrary/Pages/LibraryContentView.aspx
(4) Qatar Planning and Statistics Authority, Annual Bulletin of Labour Force 2021
https://www.psa.gov.qa/en/statistics/Statistical%20Releases/Social/LaborForce/2021/Annual_Bulletin_Labour_force_2021_AE.xlsx;
https://www.psa.gov.qa/en/statistics/Statistical%20Releases/Social/LaborForce/2021/Annual_Bulletin_Labour_force_2021_AE.pdf
No figures of population aged 0-14 disaggregated by nationality available.
(5) Saudi Arabia General Authority for Statistics, population estimates for mid-2021.
Population estimates are based on the results of the Population Censuses (1974, 1992, 2004, 2010), on the Demographic Research Bulletin 2016 (2013-2017), and on administrative records: vital statistics records (births and deaths records) and im/emigration records.
https://www.stats.gov.sa/en/43
https://www.stats.gov.sa/ar/43
(6) No figures of total (non-disaggregated) population available for 2021, as of 4 December 2022. Figures of UAE population disaggregated by nationality are unavailable in published sources.
Last date of access: December 2022.
GLMM and GRC cannot guarantee that the link to access the source will not change; that the information will not be removed from the website it was obtained from; that no geo-blockages will be imposed; or that the information will not be available for any another reason.
Keywords: Bahrain, Kuwait, Oman, Qatar, Saudi Arabia, Foreign & National Populations
|
Saudis |
Non-Saudis |
Total |
|
Males |
Females |
Total |
Males |
Females |
Total |
Males |
Females |
Total |
| 2017 Q1 |
61.90 |
17.40 |
40.30 |
94.10 |
29.20 |
75.60 |
78.00 |
20.90 |
55.10 |
| 2017 Q2 |
62.10 |
17.40 |
40.30 |
94.00 |
21.60 |
73.40 |
78.20 |
18.70 |
54.20 |
| 2017 Q3 |
62.60 |
17.80 |
40.70 |
93.80 |
24.90 |
74.20 |
78.40 |
19.90 |
54.80 |
| 2017 Q4 |
63.40 |
19.40 |
41.90 |
94.20 |
24.20 |
74.20 |
79.00 |
20.90 |
55.60 |
| 2018 Q1 |
63.50 |
19.50 |
41.90 |
93.60 |
24.50 |
73.90 |
78.80 |
21.00 |
55.50 |
| 2018 Q2 |
63.50 |
19.60 |
42.00 |
93.90 |
29.00 |
75.50 |
79.00 |
22.40 |
56.20 |
| 2018 Q3 |
63.50 |
19.70 |
42.00 |
93.90 |
29.70 |
75.70 |
79.00 |
22.70 |
56.40 |
| 2018 Q4 |
63.00 |
20.20 |
42.00 |
93.80 |
25.90 |
74.50 |
78.70 |
21.90 |
55.90 |
| 2019 Q1 |
63.30 |
20.50 |
42.30 |
94.10 |
27.40 |
75.30 |
79.10 |
22.60 |
56.40 |
| 2019 Q2 |
66.00 |
23.20 |
45.00 |
94.10 |
26.90 |
75.20 |
80.40 |
24.30 |
57.90 |
| 2019 Q3 |
67.00 |
23.20 |
45.50 |
94.50 |
27.60 |
75.60 |
81.10 |
24.50 |
58.40 |
| 2019 Q4 |
66.60 |
26.00 |
46.70 |
93.60 |
28.80 |
75.20 |
80.40 |
26.80 |
58.80 |
| 2020 Q1 |
65.80 |
25.90 |
46.20 |
94.40 |
24.20 |
74.50 |
80.40 |
25.40 |
58.20 |
| 2020 Q2 |
65.60 |
31.40 |
48.80 |
91.80 |
28.70 |
73.90 |
78.90 |
30.60 |
59.40 |
| 2020 Q3 |
66.00 |
31.30 |
49.00 |
92.40 |
26.90 |
73.80 |
79.40 |
30.00 |
59.50 |
| 2020 Q4 |
68.50 |
33.20 |
51.20 |
92.40 |
29.30 |
74.50 |
80.60 |
32.10 |
61.00 |
| 2021 Q1 |
66.20 |
32.30 |
49.50 |
93.00 |
36.90 |
77.10 |
79.70 |
33.60 |
61.10 |
| 2021 Q2 |
65.70 |
32.40 |
49.40 |
92.30 |
37.20 |
76.70 |
79.20 |
33.80 |
60.80 |
| 2021 Q3 |
65.00 |
34.10 |
49.80 |
91.40 |
40.10 |
76.90 |
78.30 |
35.90 |
61.20 |
| 2021 Q4 |
66.80 |
35.60 |
51.50 |
92.00 |
33.30 |
75.40 |
79.50 |
34.90 |
61.50 |
| 2022 Q1 |
66.00 |
33.60 |
50.10 |
91.40 |
32.90 |
74.80 |
78.70 |
33.40 |
60.40 |
| 2022 Q2 |
67.50 |
35.60 |
51.80 |
92.00 |
31.60 |
73.80 |
79.50 |
34.40 |
60.80 |
Source: Labour Force Survey, in: Labour Market Statistics, General Authority for Statistics (GAStat)
ANNEXED NOTES
1. Data collection methodology
LFS were first conducted in 2001 and became bi-annual after 2006. Data were collected through
nationally representative household sample surveys, which sampling was based on most recent
censuses. Since 2016, Labour Force Surveys have been conducted and published on a quarterly basis,
based on a household telephone survey conducted by GAStat. Employment data extracted from
administrative records were also introduced as a complement to the results of Labour Force Surveys
in Labour Market Statistics' publications, starting on Q1 2017.
The present data is based on estimates drawn from the results of the quarterly Labour Force
Survey. LFS results are published as rates only. Numerical estimates are unavailable.
GAStat Labour Market Statistics: Labour Force Survey (household telephone survey conducted by
GAStat)
Sample size: 53,360 households, from all administrative regions of Saudi Arabia.
Population covered: residents in Saudi Arabia, Saudis and non-Saudis. All household members,
including domestic workers.
The survey provides estimates of the size of the total and working-age populations (aged 15 years
and above), inside and outside the labour force. It highlights the characteristics of the labour force
(employed and unemployed populations), and supplies the data to calculate key indicators of labour
market such as the unemployment and the labour force participation rates.
Household survey questionnaire:
https://www.stats.gov.sa/sites/default/files/2021_Q3_LFS%20Questionnaire_EN%2022-08-2021.pdf.
Definitions:
Population in the labour force:
Individuals (15 years and above) who contribute or are ready to contribute to the production of
commodities and services during the reference period of the survey. The labour force includes the
employed and unemployed populations.
Population outside the labour force:
Individuals (15 years and above) who is not classified as part of the labour force because they do not
work, do not seek a job, are unable to work, or are not ready to work during the survey reference
period. For example: Students, housewives, retired persons who do not work, individuals unable or
unwilling to work, or who do not look for a job for other reasons.
Labour force participation rate = (total labour force ÷ total population of working age (aged 15 years
and over)) x 100-
Definitions and categories used by GAStat in Labour Markets Statistics (employment; unemployment;
occupation and activity sectors, etc.) are based on international standards.
For LFS methodology and definitions, see: https://www.stats.gov.sa/en/node/9787.
2. Institution which provides data
General Authority for Statistics (GAStat)
3. Data availability
Since 2021, GAStat has been publishing separately the employment data taken from administrative
records, and unemployment/inactivity data as well as general indicators, calculated from the results
of the field interviews conducted by GAStat (Labour Force Survey).
The present time-series was taken from the Register-based Labour Market Statistics Q2, 2022
(English and Arabic versions)
https://www.stats.gov.sa/sites/default/files/LM%20tables_Q2_2022_EN%28%25%29.xlsx;
https://www.stats.gov.sa/sites/default/files/LM%20tables_Q2_2022_AR%28%25%29.xlsx
Date of access: 07 December 2022.
GLMM and GRC cannot guarantee that the link to access the source will not change; that the
information will not be removed from the website it was obtained from; that no geo-blockages will
be imposed; or that the information will not be available for any another reason.
Keywords:
Saudi Arabia, National & Foreign Labour, Foreign & National Populations, Labour Market,
Employment
|
Saudis |
Non-Saudis |
Total |
|
Males |
Females |
Total |
Males |
Females |
Total |
Males |
Females |
Total |
| 2017 Q1 |
7.20 |
33.00 |
12.70 |
0.50 |
2.10 |
0.70 |
3.20 |
20.30 |
5.80 |
| 2017 Q2 |
7.40 |
33.10 |
12.80 |
0.70 |
3.30 |
0.90 |
3.30 |
22.90 |
6.00 |
| 2017 Q3 |
7.40 |
32.70 |
12.80 |
0.40 |
1.60 |
0.50 |
3.20 |
21.10 |
5.80 |
| 2017 Q4 |
7.50 |
31.00 |
12.80 |
0.50 |
2.50 |
0.70 |
3.20 |
21.10 |
6.00 |
| 2018 Q1 |
7.60 |
30.90 |
12.90 |
0.70 |
2.60 |
0.90 |
3.40 |
21.00 |
6.10 |
| 2018 Q2 |
7.60 |
31.10 |
12.90 |
0.50 |
2.50 |
0.70 |
3.30 |
20.00 |
6.00 |
| 2018 Q3 |
7.50 |
30.90 |
12.80 |
0.60 |
3.10 |
0.90 |
3.30 |
19.90 |
6.00 |
| 2018 Q4 |
6.60 |
32.50 |
12.70 |
0.60 |
4.40 |
1.00 |
2.90 |
22.60 |
6.00 |
| 2019 Q1 |
6.60 |
31.70 |
12.50 |
0.40 |
2.50 |
0.60 |
2.80 |
21.00 |
5.70 |
| 2019 Q2 |
6.00 |
31.10 |
12.30 |
0.20 |
0.90 |
0.30 |
2.50 |
21.00 |
5.60 |
| 2019 Q3 |
5.80 |
30.80 |
12.00 |
0.20 |
1.00 |
0.30 |
2.50 |
20.70 |
5.50 |
| 2019 Q4 |
4.90 |
30.80 |
12.00 |
0.30 |
1.30 |
0.40 |
2.20 |
21.30 |
5.70 |
| 2020 Q1 |
5.60 |
28.20 |
11.80 |
0.40 |
2.00 |
0.50 |
2.50 |
20.70 |
5.70 |
| 2020 Q2 |
8.10 |
31.40 |
15.40 |
2.30 |
9.50 |
3.10 |
4.70 |
25.30 |
9.00 |
| 2020 Q3 |
7.90 |
30.20 |
14.90 |
1.90 |
9.10 |
2.70 |
4.40 |
24.60 |
8.50 |
| 2020 Q4 |
7.10 |
24.40 |
12.60 |
1.70 |
9.10 |
2.60 |
4.00 |
20.20 |
7.40 |
| 2021 Q1 |
7.20 |
21.20 |
11.70 |
1.30 |
5.50 |
1.90 |
3.70 |
16.10 |
6.50 |
| 2021 Q2 |
6.10 |
22.30 |
11.30 |
1.80 |
6.30 |
2.40 |
3.50 |
17.10 |
6.60 |
| 2021 Q3 |
5.90 |
21.90 |
11.30 |
1.50 |
7.40 |
2.40 |
3.30 |
17.10 |
6.60 |
| 2021 Q4 |
5.20 |
22.50 |
11.00 |
2.00 |
9.00 |
2.90 |
3.30 |
18.70 |
6.90 |
| 2022 Q1 |
5.10 |
20.20 |
10.10 |
1.60 |
6.40 |
2.20 |
3.10 |
16.20 |
6.00 |
| 2022 Q2 |
4.70 |
19.30 |
9.70 |
1.30 |
6.20 |
1.90 |
2.80 |
15.80 |
5.80 |
Source: Labour Force Survey, in: Labour Market Statistics, General Authority for Statistics (GAStat)
ANNEXED NOTES
1. Data collection methodology
LFS were first conducted in 2001 and became bi-annual after 2006. Data were collected through
nationally representative household sample surveys, which sampling was based on most recent
censuses. Since 2016, Labour Force Surveys have been conducted and published on a quarterly basis,
based on a household telephone survey conducted by GAStat. Employment data extracted from
administrative records were also introduced as a complement to the results of Labour Force Surveys
in Labour Market Statistics' publications, starting on Q1 2017.
The present data is based on estimates drawn from the results of the quarterly Labour Force
Survey. LFS results are published as rates only. Numerical estimates are unavailable.
GAStat Labour Market Statistics: Labour Force Survey (household telephone survey conducted by
GAStat)
Sample size: 53,360 households, from all administrative regions of Saudi Arabia.
Population covered: residents in Saudi Arabia, Saudis and non-Saudis. All household members,
including domestic workers.
The survey provides estimates of the size of the total and working-age populations (aged 15 years
and above), inside and outside the labour force. It highlights the characteristics of the labour force
(employed and unemployed populations), and supplies the data to calculate key indicators of labour
market such as the unemployment and the labour force participation rates.
Household survey questionnaire:
https://www.stats.gov.sa/sites/default/files/2021_Q3_LFS%20Questionnaire_EN%2022-08-2021.pdf.
Definitions:
– Unemployed individuals:
Individuals (15 years and above) who were:
1. Without a job in the week preceding the household contact.
2. Seriously looking for work during the four weeks prior to contacting the family. This includes those
who did not search for work during the four weeks prior to the survey because they were waiting to
find work, or to establish their own business during the next period, providing they searched for a job
before the reference period.
3. People who were able to work and ready to join whenever necessary during the week preceding
the household contact or the following two weeks.
– Unemployed individuals who have been working:
Unemployed individuals (15 years and above) who had been working, then left their jobs for any
reason, and who during the time reference were: unemployed, seriously seeking a job and ready to
start working.
Unemployment rate= (number of unemployed individuals ÷ total labour force) x 100
Definitions and categories used by GAStat in Labour Markets Statistics (employment; unemployment;
occupation and activity sectors, etc.) are based on international standards.
For LFS methodology and definitions, see: https://www.stats.gov.sa/en/node/9787.
2. Institution which provides data
General Authority for Statistics (GAStat)
3. Data availability
Since 2021, GAStat has been publishing separately the employment data taken from administrative
records, and unemployment/inactivity data as well as general indicators, calculated from the results
of the field interviews conducted by GAStat (Labour Force Survey).
The present time-series was taken from the Labour Market Statistics Q2, 2022
English and Arabic versions:
https://www.stats.gov.sa/sites/default/files/LM%20tables_Q2_2022_EN%28%25%29.xlsx;
https://www.stats.gov.sa/sites/default/files/LM%20tables_Q2_2022_AR%28%25%29.xlsx
Date of access: 07 December 2022.
GLMM and GRC cannot guarantee that the link to access the source will not change; that the
information will not be removed from the website it was obtained from; that no geo-blockages will
be imposed; or that the information will not be available for any another reason.
Keywords:
Unemployment, Saudi Arabia, National & Foreign Labour
|
Saudis |
Non-Saudis |
Total |
|
Males |
Females |
Total |
Males |
Females |
Total |
Males |
Females |
Total |
| 2017 Q1 |
2,021,865 |
1,017,080 |
3,038,945 |
9,859,039 |
991,153 |
10,850,192 |
11,880,904 |
2,008,233 |
13,889,137 |
| 2017 Q2 |
2,029,786 |
1,022,663 |
3,052,449 |
9,777,916 |
1,010,793 |
10,788,709 |
11,807,702 |
2,033,456 |
13,841,158 |
| 2017 Q3 |
2,035,745 |
1,027,999 |
3,063,744 |
9,674,729 |
1,019,591 |
10,694,320 |
11,710,474 |
2,047,590 |
13,758,064 |
| 2017 Q4 |
2,080,601 |
1,083,245 |
3,163,846 |
9,442,163 |
975,132 |
10,417,295 |
11,522,764 |
2,058,377 |
13,581,141 |
| 2018 Q1 |
2,067,976 |
1,082,433 |
3,150,409 |
9,231,869 |
951,235 |
10,183,104 |
11,299,845 |
2,033,668 |
13,333,513 |
| 2018 Q2 |
2,053,189 |
1,072,154 |
3,125,343 |
8,927,862 |
964,861 |
9,892,723 |
10,981,051 |
2,037,015 |
13,018,066 |
| 2018 Q3 |
2,043,585 |
1,066,402 |
3,109,987 |
8,622,890 |
955,165 |
9,578,055 |
10,666,475 |
2,021,567 |
12,688,042 |
| 2018 Q4 |
2,040,742 |
1,070,457 |
3,111,199 |
8,356,943 |
1,072,476 |
9,429,419 |
10,397,685 |
2,142,933 |
12,540,618 |
| 2019 Q1 |
2,036,142 |
1,075,887 |
3,112,029 |
8,458,199 |
1,195,013 |
9,653,212 |
10,494,341 |
2,270,900 |
12,765,241 |
| 2019 Q2 |
2,027,964 |
1,062,284 |
3,090,248 |
8,529,419 |
1,237,365 |
9,766,784 |
10,557,383 |
2,299,649 |
12,857,032 |
| 2019 Q3 |
2,023,910 |
1,076,902 |
3,100,812 |
8,572,339 |
1,254,757 |
9,827,096 |
10,596,249 |
2,331,659 |
12,927,908 |
| 2019 Q4 |
2,054,858 |
1,115,414 |
3,170,272 |
8,792,516 |
1,428,187 |
10,220,703 |
10,847,374 |
2,543,601 |
13,390,975 |
| 2020 Q1 |
2,066,553 |
1,136,870 |
3,203,423 |
9,092,998 |
1,339,191 |
10,432,189 |
11,159,551 |
2,476,061 |
13,635,612 |
| 2020 Q2 |
2,055,767 |
1,115,655 |
3,171,422 |
9,101,286 |
1,357,746 |
10,459,032 |
11,157,053 |
2,473,401 |
13,630,454 |
| 2020 Q3 |
2,100,702 |
1,152,574 |
3,253,276 |
8,866,940 |
1,334,922 |
10,201,862 |
10,967,642 |
2,487,496 |
13,455,138 |
| 2020 Q4 |
2,079,331 |
1,172,867 |
3,252,198 |
8,753,985 |
1,312,515 |
10,066,500 |
10,833,316 |
2,485,382 |
13,318,698 |
| 2021 Q1 |
2,081,446 |
1,225,152 |
3,306,598 |
8,773,896 |
1,403,319 |
10,177,215 |
10,855,342 |
2,628,471 |
13,483,813 |
| 2021 Q2 |
2,098,831 |
1,181,183 |
3,280,014 |
8,449,536 |
1,170,338 |
9,619,874 |
10,548,367 |
2,351,521 |
12,899,888 |
| 2021 Q3 |
2,127,551 |
1,215,287 |
3,342,838 |
8,244,566 |
1,118,241 |
9,362,807 |
10,372,117 |
2,333,528 |
12,705,645 |
| 2021 Q4 |
2,180,320 |
1,269,737 |
3,450,057 |
8,481,117 |
1,114,064 |
9,595,181 |
10,661,437 |
2,383,801 |
13,045,238 |
| 2022 Q1 |
2,233,351 |
1,338,525 |
3,571,876 |
8,971,450 |
1,187,323 |
10,158,773 |
11,204,801 |
2,525,848 |
13,730,649 |
| 2022 Q2 |
2,262,535 |
1,375,609 |
3,638,144 |
9,320,979 |
1,210,640 |
10,531,619 |
11,583,514 |
2,586,249 |
14,169,763 |
| 2022 Q3 |
2,274,628 |
1,417,858 |
3,692,486 |
9,593,551 |
1,304,906 |
10,898,457 |
11,868,179 |
2,722,764 |
14,590,943 |
Source: Register-based Labour Market Statistics, General Authority for Statistics (GAStat)
1. Data collection methodology
LFS were first conducted in 2001 and became bi-annual after 2006. Data were collected through
nationally representative household sample surveys, which sampling was based on most recent
censuses.
Since 2016, Labour Force Surveys have been conducted and published on a quarterly basis, based on
a household telephone survey conducted by GAStat. Employment data extracted from administrative
records were also introduced as a complement to the results of Labour Force Surveys in Labour
Market Statistics' publications, starting on Q1 2017.
The present data is taken from administrative records.
GAStat Labour Market Statistics: administrative records
Estimates of figures and characteristics of employment in Saudi Arabia are taken from administrative
records from the following institutions:
– Ministry of Human Resources and Social Development (MHRSD) (formerly Ministry of Labour and
Social Development):
Supplies data on Government sector’s workers.
– General Organization of Social Insurance (GOSI):
Supplies data on:
a. contributors on the job who are subject to social insurance laws and regulations in the private
and government sector;
b. workers who terminated their contribution to social insurance during the quarter.
– National Information Center (NIC):
Supplies data on domestic workers.
Definitions and categories used by GAStat in Labour Markets Statistics (employment; unemployment;
occupation and activity sectors, etc.) are based on international standards:
For LFS methodology and definitions, see: https://www.stats.gov.sa/en/node/9787.
2. Institution which provides data
General Authority for Statistics (GAStat)
3. Data availability
Since 2021, GAStat has been publishing separately the employment data taken from administrative
records, and unemployment/inactivity data as well as general indicators, calculated from the results
of the field interviews conducted by GAStat (Labour Force Survey).
The present time-series was taken from the Register-based Labour Market Statistics- Q3, 2022
(English and Arabic versions)
https://www.stats.gov.sa/sites/default/files/LMS_2022_Q3_EN.xlsx
https://www.stats.gov.sa/sites/default/files/LMS_2022_Q3_AR.xlsx
Date of access: 02 January 2023.
GLMM and GRC cannot guarantee that the link to access the source will not change; that the
information will not be removed from the website it was obtained from; that no geo-blockages will
be imposed; or that the information will not be available for any another reason.
Keywords:
Employment, Female Employment, Saudi Arabia, National & Foreign Labour
| |
In labour force |
Out of labour force |
Not stated |
TOTAL |
| Governmental sector |
Non-governmental sector |
Domestic
sector |
Unemployed |
Total |
Student |
Housewife |
Retired or has income |
Total |
| 15-19 |
M |
8 |
536 |
71 |
0 |
615 |
37,594 |
0 |
0 |
37,594 |
8,836 |
47,045 |
| F |
2 |
37 |
26 |
0 |
65 |
35,605 |
2,892 |
0 |
38,497 |
5,383 |
43,945 |
| T |
10 |
573 |
97 |
0 |
680 |
73,199 |
2,892 |
0 |
76,091 |
14,219 |
90,990 |
| 20-24 |
M |
432 |
24,300 |
7,461 |
0 |
32,193 |
21,804 |
0 |
0 |
21,804 |
4,799 |
58,796 |
| F |
490 |
2,877 |
2,321 |
0 |
5,688 |
25,241 |
2,967 |
0 |
28,208 |
5,238 |
39,134 |
| T |
922 |
27,177 |
9,782 |
0 |
37,881 |
47,045 |
2,967 |
0 |
50,012 |
10,037 |
97,930 |
| 25-29 |
M |
2,497 |
171,088 |
54,512 |
4 |
228,101 |
10,582 |
0 |
0 |
10,582 |
4,834 |
243,517 |
| F |
2,260 |
14,168 |
35,571 |
7 |
52,006 |
14,054 |
12,538 |
0 |
26,592 |
6,613 |
85,211 |
| T |
4,757 |
185,256 |
90,083 |
11 |
280,107 |
24,636 |
12,538 |
0 |
37,174 |
11,447 |
328,728 |
| 30-34 |
M |
7,699 |
226,540 |
57,343 |
59 |
291,641 |
8,811 |
0 |
0 |
8,811 |
4,508 |
304,960 |
| F |
6,480 |
25,091 |
61,086 |
41 |
92,698 |
10,295 |
21,410 |
0 |
31,705 |
7,140 |
131,543 |
| T |
14,179 |
251,631 |
118,429 |
100 |
384,339 |
19,106 |
21,410 |
0 |
40,516 |
11,648 |
436,503 |
| 35-39 |
M |
12,937 |
222,740 |
54,606 |
158 |
290,441 |
4,216 |
0 |
2 |
4,218 |
7,375 |
302,034 |
| F |
10,361 |
26,158 |
63,391 |
103 |
100,013 |
5,055 |
22,892 |
1 |
27,948 |
7,929 |
135,890 |
| T |
23,298 |
248,898 |
117,997 |
261 |
390,454 |
9,271 |
22,892 |
3 |
32,166 |
15,304 |
437,924 |
| 40-44 |
M |
13,370 |
205,194 |
53,235 |
208 |
272,007 |
1,996 |
0 |
6 |
2,002 |
6,035 |
280,044 |
| F |
8,251 |
21,388 |
63,730 |
101 |
93,470 |
2,830 |
18,249 |
3 |
21,082 |
6,676 |
121,228 |
| T |
21,621 |
226,582 |
116,965 |
309 |
365,477 |
4,826 |
18,249 |
9 |
23,084 |
12,711 |
401,272 |
| 45-49 |
M |
11,862 |
149,160 |
39,057 |
242 |
200,321 |
1,174 |
0 |
4 |
1,178 |
4,348 |
205,847 |
| F |
6,263 |
15,165 |
50,232 |
61 |
71,721 |
1,765 |
13,778 |
1 |
15,544 |
5,001 |
92,266 |
| T |
18,125 |
164,325 |
89,289 |
303 |
272,042 |
2,939 |
13,778 |
5 |
16,722 |
9,349 |
298,113 |
| 50-54 |
M |
9,687 |
110,815 |
26,656 |
343 |
147,501 |
446 |
0 |
6 |
452 |
3,197 |
151,150 |
| F |
3,220 |
11,130 |
30,201 |
28 |
44,579 |
741 |
11,456 |
3 |
12,200 |
4,056 |
60,835 |
| T |
12,907 |
121,945 |
56,857 |
371 |
192,080 |
1,187 |
11,456 |
9 |
12,652 |
7,253 |
211,985 |
| 55-59 |
M |
8,123 |
68,481 |
11,178 |
753 |
88,535 |
83 |
0 |
35 |
118 |
1,633 |
90,286 |
| F |
1,620 |
6,815 |
13,443 |
32 |
21,910 |
184 |
8,704 |
2 |
8,890 |
3,074 |
33,874 |
| T |
9,743 |
75,296 |
24,621 |
785 |
110,445 |
267 |
8,704 |
37 |
9,008 |
4,707 |
124,160 |
| 60-64 |
M |
5,756 |
27,213 |
4,259 |
556 |
37,784 |
19 |
0 |
36 |
55 |
2,729 |
40,568 |
| F |
848 |
2,710 |
4,481 |
24 |
8,063 |
50 |
6,134 |
3 |
6,187 |
2,360 |
16,610 |
| T |
6,604 |
29,923 |
8,740 |
580 |
45,847 |
69 |
6,134 |
39 |
6,242 |
5,089 |
57,178 |
| > 65 |
M |
2,662 |
18,774 |
1,535 |
1,229 |
24,200 |
8 |
0 |
513 |
521 |
5,809 |
30,530 |
| F |
314 |
1,543 |
1,668 |
48 |
3,573 |
41 |
10,082 |
0 |
10,123 |
3,304 |
17,000 |
| T |
2,976 |
20,317 |
3,203 |
1,277 |
27,773 |
49 |
10,082 |
513 |
10,644 |
9,113 |
47,530 |
| Total |
M |
75,033 |
1,224,841 |
309,913 |
3,552 |
1,613,339 |
86,733 |
0 |
602 |
87,335 |
54,103 |
1,754,777 |
| F |
40,109 |
127,082 |
326,150 |
445 |
493,786 |
95,861 |
131,102 |
13 |
226,976 |
56,774 |
777,536 |
| T |
115,142 |
1,351,923 |
636,063 |
3,997 |
2,107,125 |
182,594 |
131,102 |
615 |
314,311 |
110,877 |
2,532,313 |
Source: PACI
ANNEXED NOTE
- Characteristics of data and definitions
The source of data used here is the Public Authority for Civil Information (PACI), an independant government body in charge of:
1- centralising all population and labour force data in order to manage a fully computerised population register
2- issuing mandatory civil identification cards to every resident of the country, regardless of age and nationality.
Another source of demographic and socioeconomic data on Kuwait is the Central Statistical Office (CSO), operating within the Planning Ministry. The CSO has conducted ten population and housing censuses since its inception in 1957.
Since 1995 a marked discrepancy was witnessed between PACI’s and CSO’s population figures. PACI’s database is connected electronically with other administrations and bodies registering demographic events and professional/ residency issues (births and death; departures and arrivals; end of service, residency and ID deliveries, etc.).
PACI’s records of residents’ movements is thus regularly updated, which limits the risk of population overcount. Therefore, it is more likely that residents were undercounted during CSO- Ministry of Planning’s census operations (see: Shah, N. Population of Kuwait. Structure and Dynamics, Kuwait: Kuwait University Academic Publication Council, 2010, chapter 1).
(a) Kuwaiti: the Kuwaiti nationality rests upon a document of Kuwaiti nationality or a certificate proving Kuwaiti nationality issued by the Ministry of Interior of Kuwait.
(b) Non-Kuwaiti: his/ her nationality is determined by the name of the State which issued the passport. The foreign national also entered Kuwait legally and has a stamp of residence.
This category includes the Bidoon, a category of stateless persons living in the Emirate. Kuwait’s Bidoon population originates from three broad categories:
1) those whose ancestors failed to apply for nationality or lacked necessary documentation at the time of Kuwait’s independence in 1961;
2) those recruited to work in Kuwait’s army or police force during the 1960s who permanently settled in Kuwait, along with their families;
3) children of Kuwaiti mothers and stateless or foreign fathers (see Human Rights Watch. Prisoners of the Past. Kuwaiti Bidun and the Burden of Statelessness, June 2011, p. 3).
(The children of Kuwaiti mothers and non-Kuwaiti fathers (with specific nationality) inherit the father’s nationality. They are stateless if the father is stateless).
“Non-governmental sector” is presumably the private sector.
- Institution which provides data
The Public Authority for Civil Information (PACI)
- Period of data coverage: 31 December
The database is updated twice a year and the website presents only the most recent data.
- Data availability
The statistics section of PACI’s website (http://www.paci.gov.kw/en/ (English); http://www.paci.gov.kw/ (Arabic)) provides population and socio-economic data broken down by nationality (Kuwaiti/ non-Kuwaiti). Some data are displayed by nationality groups.
Analytical tables and data crosstabulations are available for download in PDF, html, .png and Excel (.csv) formats.
PACI website has been inaccessible from outside Kuwait since 2019.
Last date of access: December 2022.
GLMM and GRC cannot guarantee that the link to access the source will not change; that the information will not be removed from the website it was obtained from; that no geo-blockages will be imposed; or that the information will not be available for any another reason.
| |
In labour force |
Out of labour force |
Not stated |
TOTAL |
| Governmental sector |
Non-governmental sector |
Unemployed |
Total |
Student |
Housewife |
Retired or has income |
Total |
| 15-19 |
M |
190 |
132 |
26 |
348 |
68,308 |
0 |
0 |
68,308 |
6,964 |
75,620 |
| F |
30 |
48 |
10 |
88 |
64,823 |
1 |
0 |
64,824 |
8,736 |
73,648 |
| T |
220 |
180 |
36 |
436 |
133,131 |
1 |
0 |
133,132 |
15,700 |
149,268 |
| 20-24 |
M |
12,994 |
2,575 |
1,230 |
16,799 |
41,547 |
0 |
2 |
41,549 |
8,620 |
66,968 |
| F |
11,055 |
1,552 |
304 |
12,911 |
45,935 |
10 |
0 |
45,945 |
5,724 |
64,580 |
| T |
24,049 |
4,127 |
1,534 |
29,710 |
87,482 |
10 |
2 |
87,494 |
14,344 |
131,548 |
| 25-29 |
M |
35,087 |
8,104 |
2,596 |
45,787 |
11,196 |
0 |
49 |
11,245 |
7,759 |
64,791 |
| F |
38,513 |
5,775 |
1,460 |
45,748 |
10,290 |
66 |
10 |
10,366 |
7,810 |
63,924 |
| T |
73,600 |
13,879 |
4,056 |
91,535 |
21,486 |
66 |
59 |
21,611 |
15,569 |
128,715 |
| 30-34 |
M |
34,520 |
9,046 |
1,999 |
45,565 |
4,471 |
0 |
192 |
4,663 |
3,617 |
53,845 |
| F |
38,556 |
6,595 |
1,788 |
46,939 |
4,405 |
201 |
88 |
4,694 |
4,467 |
56,100 |
| T |
73,076 |
15,641 |
3,787 |
92,504 |
8,876 |
201 |
280 |
9,357 |
8,084 |
109,945 |
| 35-39 |
M |
32,346 |
7,231 |
1,407 |
40,984 |
2,544 |
0 |
597 |
3,141 |
2,965 |
47,090 |
| F |
35,289 |
6,583 |
1,698 |
43,570 |
3,037 |
381 |
540 |
3,958 |
4,272 |
51,800 |
| T |
67,635 |
13,814 |
3,105 |
84,554 |
5,581 |
381 |
1,137 |
7,099 |
7,237 |
98,890 |
| 40-44 |
M |
26,489 |
4,471 |
1,061 |
32,021 |
1,203 |
0 |
3,199 |
4,402 |
2,211 |
38,634 |
| F |
28,361 |
5,504 |
1,425 |
35,290 |
1,997 |
854 |
1,993 |
4,844 |
3,618 |
43,752 |
| T |
54,850 |
9,975 |
2,486 |
67,311 |
3,200 |
854 |
5,192 |
9,246 |
5,829 |
82,386 |
| 45-49 |
M |
18,012 |
3,024 |
1,067 |
22,103 |
649 |
0 |
9,212 |
9,861 |
1,436 |
33,400 |
| F |
19,119 |
4,389 |
1,281 |
24,789 |
2,304 |
1,715 |
6,866 |
10,885 |
2,868 |
38,542 |
| T |
37,131 |
7,413 |
2,348 |
46,892 |
2,953 |
1,715 |
16,078 |
20,746 |
4,304 |
71,942 |
| 50-54 |
M |
9,826 |
1,943 |
859 |
12,628 |
356 |
0 |
14,242 |
14,598 |
1,218 |
28,444 |
| F |
9,545 |
2,932 |
1,048 |
13,525 |
2,410 |
3,898 |
11,197 |
17,505 |
2,381 |
33,411 |
| T |
19,371 |
4,875 |
1,907 |
26,153 |
2,766 |
3,898 |
25,439 |
32,103 |
3,599 |
61,855 |
| 55-59 |
M |
3,649 |
1,058 |
690 |
5,397 |
99 |
0 |
17,109 |
17,208 |
892 |
23,497 |
| F |
3,417 |
1,451 |
801 |
5,669 |
858 |
7,174 |
12,060 |
20,092 |
2,347 |
28,108 |
| T |
7,066 |
2,509 |
1,491 |
11,066 |
957 |
7,174 |
29,169 |
37,300 |
3,239 |
51,605 |
| 60-64 |
M |
1,252 |
733 |
267 |
2,252 |
23 |
0 |
13,776 |
13,799 |
562 |
16,613 |
| F |
993 |
762 |
72 |
1,827 |
258 |
7,542 |
10,821 |
18,621 |
1,364 |
21,812 |
| T |
2,245 |
1,495 |
339 |
4,079 |
281 |
7,542 |
24,597 |
32,420 |
1,926 |
38,425 |
| > 65 |
M |
1,657 |
1,426 |
717 |
3,800 |
13 |
0 |
19,228 |
19,241 |
5,216 |
28,257 |
| F |
886 |
704 |
554 |
2,144 |
208 |
25,294 |
10,309 |
35,811 |
2,768 |
40,723 |
| T |
2,543 |
2,130 |
1,271 |
5,944 |
221 |
25,294 |
29,537 |
55,052 |
7,984 |
68,980 |
| Total |
M |
176,022 |
39,743 |
11,919 |
227,684 |
130,409 |
0 |
77,606 |
208,015 |
41,460 |
477,159 |
| F |
185,764 |
36,295 |
10,441 |
232,500 |
136,525 |
47,136 |
53,884 |
237,545 |
46,355 |
516,400 |
| T |
361,786 |
76,038 |
22,360 |
460,184 |
266,934 |
47,136 |
131,490 |
445,560 |
87,815 |
993,559 |
Source: PACI
ANNEXED NOTE
- Characteristics of data and definitions
The source of data used here is the Public Authority for Civil Information (PACI), an independant government body in charge of :
1- centralising all population and labour force data in order to manage a fully computerised population register
2- issuing mandatory civil identification cards to every resident of the country, regardless of age and nationality.
Another source of demographic and socioeconomic data on Kuwait is the Central Statistical Office (CSO), operating within the Planning Ministry. The CSO has conducted ten population and housing censuses since its inception in 1957.
Since 1995 a marked discrepancy was witnessed between PACI’s and CSO’s population figures. PACI’s database is connected electronically with other administrations and bodies registering demographic events and professional/ residency issues (births and death; departures and arrivals; end of service, residency and ID deliveries, etc.).
PACI’s records of residents’ movements is thus regularly updated, which limits the risk of population overcount. Therefore, it is more likely that residents were undercounted during CSO- Ministry of Planning’s census operations (see: Shah, N. Population of Kuwait. Structure and Dynamics, Kuwait: Kuwait University Academic Publication Council, 2010, chapter 1).
(a) Kuwaiti: the Kuwaiti nationality rests upon a document of Kuwaiti nationality or a certificate proving Kuwaiti nationality issued by the Ministry of Interior of Kuwait.
(b) Non-Kuwaiti: his/ her nationality is determined by the name of the State which issued the passport. The foreign national also entered Kuwait legally and has a stamp of residence.
This category includes the Bidoon, a category of stateless persons living in the Emirate. Kuwait’s Bidoon population originates from three broad categories:
1) those whose ancestors failed to apply for nationality or lacked necessary documentation at the time of Kuwait’s independence in 1961;
2) those recruited to work in Kuwait’s army or police force during the 1960s who permanently settled in Kuwait, along with their families;
3) children of Kuwaiti mothers and stateless or foreign fathers (see Human Rights Watch. Prisoners of the Past. Kuwaiti Bidun and the Burden of Statelessness, June 2011, p. 3).
(The children of Kuwaiti mothers and non-Kuwaiti fathers (with specific nationality) inherit the father’s nationality. They are stateless if the father is stateless).
“Non-governmental sector” is presumably the private sector.
- Institution which provides data
The Public Authority for Civil Information (PACI)
- Period of data coverage: 31 December
The database is updated twice a year and the website presents only the most recent data.
- Data availability
The statistics section of PACI’s website (http://www.paci.gov.kw/en/ (English); http://www.paci.gov.kw/ (Arabic)) provides population and socio-economic data broken down by nationality (Kuwaiti/ non-Kuwaiti). Some data are displayed by nationality groups.
Analytical tables and data crosstabulations are available for download in PDF, html, .png and Excel (.csv) formats.
PACI website has been inaccessible from outside Kuwait since 2019.
Last date of access: December 2022.
GLMM and GRC cannot guarantee that the link to access the source will not change; that the information will not be removed from the website it was obtained from; that no geo-blockages will be imposed; or that the information will not be available for any another reason.
| |
Kuwaitis |
Non-Kuwaitis |
Total |
| |
Males |
Females |
Total |
Males |
Females |
Total |
Males |
Females |
Total |
| In labour force |
Gov.
sector |
176,022 |
185,764 |
361,786 |
75,033 |
40,109 |
115,142 |
251,055 |
225,873 |
476,928 |
| Non-gov.
sector |
39,743 |
36,295 |
76,038 |
1,224,841 |
127,082 |
1,351,923 |
1,264,584 |
163,377 |
1,427,961 |
| Domestic sector |
0 |
0 |
0 |
309,913 |
326,150 |
636,063 |
309,913 |
326,150 |
636,063 |
| Unemployed |
11,919 |
10,441 |
22,360 |
3,552 |
445 |
3,997 |
15,471 |
10,886 |
26,357 |
| Total |
227,684 |
232,500 |
460,184 |
1,613,339 |
493,786 |
2,107,125 |
1,841,023 |
726,286 |
2,567,309 |
| Out of labour force |
Student |
130,409 |
136,525 |
266,934 |
86,733 |
95,861 |
182,594 |
217,142 |
232,386 |
449,528 |
| Housewife |
0 |
47,136 |
47,136 |
0 |
131,102 |
131,102 |
0 |
178,238 |
178,238 |
| Retired or has income |
77,606 |
53,884 |
131,490 |
602 |
13 |
615 |
78,208 |
53,897 |
132,105 |
| Total |
208,015 |
237,545 |
445,560 |
87,335 |
226,976 |
314,311 |
295,350 |
464,521 |
759,871 |
| Not stated |
41,460 |
46,355 |
87,815 |
54,103 |
56,774 |
110,877 |
95,563 |
103,129 |
198,692 |
| Total |
477,159 |
516,400 |
993,559 |
1,754,777 |
777,536 |
2,532,313 |
2,231,936 |
1,293,936 |
3,525,872 |
Source: PACI
ANNEXED NOTE
- Characteristics of data and definitions
The source of data used here is the Public Authority for Civil Information (PACI), an independant government body in charge of:
1- centralising all population and labour force data in order to manage a fully computerised population register
2- issuing mandatory civil identification cards to every resident of the country, regardless of age and nationality.
Another source of demographic and socioeconomic data on Kuwait is the Central Statistical Office (CSO), operating within the Planning Ministry. The CSO has conducted ten population and housing censuses since its inception in 1957.
Since 1995 a marked discrepancy was witnessed between PACI’s and CSO’s population figures. PACI’s database is connected electronically with other administrations and bodies registering demographic events and professional/ residency issues (births and death; departures and arrivals; end of service, residency and ID deliveries, etc.).
PACI’s records of residents’ movements is thus regularly updated, which limits the risk of population overcount. Therefore, it is more likely that residents were undercounted during CSO- Ministry of Planning’s census operations (see: Shah, N. Population of Kuwait. Structure and Dynamics, Kuwait: Kuwait University Academic Publication Council, 2010, chapter 1).
(a) Kuwaiti: the Kuwaiti nationality rests upon a document of Kuwaiti nationality or a certificate proving Kuwaiti nationality issued by the Ministry of Interior of Kuwait.
(b) Non-Kuwaiti: his/ her nationality is determined by the name of the State which issued the passport. The foreign national also entered Kuwait legally and has a stamp of residence.
This category includes the Bidoon, a category of stateless persons living in the Emirate. Kuwait’s Bidoon population originates from three broad categories:
1) those whose ancestors failed to apply for nationality or lacked necessary documentation at the time of Kuwait’s independence in 1961;
2) those recruited to work in Kuwait’s army or police force during the 1960s who permanently settled in Kuwait, along with their families;
3) children of Kuwaiti mothers and stateless or foreign fathers (see Human Rights Watch. Prisoners of the Past. Kuwaiti Bidun and the Burden of Statelessness, June 2011, p. 3).
(The children of Kuwaiti mothers and non-Kuwaiti fathers (with specific nationality) inherit the father’s nationality. They are stateless if the father is stateless).
“Non-governmental sector” is presumably the private sector.
- Institution which provides data
The Public Authority for Civil Information (PACI)
- Period of data coverage: 31 December
The database is updated twice a year and the website presents only the most recent data.
- Data availability
The statistics section of PACI’s website (http://www.paci.gov.kw/en/ (English); http://www.paci.gov.kw/ (Arabic)) provides population and socio-economic data broken down by nationality (Kuwaiti/ non-Kuwaiti). Some data are displayed by nationality groups.
Analytical tables and data crosstabulations are available for download in PDF, html, .png and Excel (.csv) formats.
PACI website has been inaccessible from outside Kuwait since 2019.
Last date of access: December 2022.
GLMM and GRC cannot guarantee that the link to access the source will not change; that the information will not be removed from the website it was obtained from; that no geo-blockages will be imposed; or that the information will not be available for any another reason.
| |
|
Illiterate |
Read and Write |
Primary |
Interme–diate |
Secondary |
Diploma |
University |
Post-Graduate |
Not Stated |
Total |
| 10-14 |
Males |
52 |
3,673 |
35,823 |
0 |
0 |
0 |
0 |
0 |
22,638 |
62,186 |
|
| Females |
49 |
3,227 |
34,223 |
0 |
0 |
0 |
0 |
0 |
21,471 |
58,970 |
|
| Total |
101 |
6,900 |
70,046 |
0 |
0 |
0 |
0 |
0 |
44,109 |
121,156 |
|
| 15-19 |
Males |
88 |
1,708 |
5,497 |
30,975 |
3,705 |
0 |
0 |
0 |
5,072 |
47,045 |
|
| Females |
81 |
1,380 |
4,619 |
29,043 |
4,282 |
0 |
0 |
0 |
4,540 |
43,945 |
|
| Total |
169 |
3,088 |
10,116 |
60,018 |
7,987 |
0 |
0 |
0 |
9,612 |
90,990 |
|
| 20-24 |
Males |
524 |
16,459 |
4,666 |
23,248 |
6,436 |
290 |
338 |
2 |
6,833 |
58,796 |
|
| Females |
243 |
5,324 |
3,533 |
16,551 |
7,581 |
328 |
708 |
2 |
4,864 |
39,134 |
|
| Total |
767 |
21,783 |
8,199 |
39,799 |
14,017 |
618 |
1,046 |
4 |
11,697 |
97,930 |
|
| 25-29 |
Males |
5,469 |
121,733 |
12,598 |
68,141 |
17,228 |
3,126 |
4,464 |
50 |
10,708 |
243,517 |
|
| Females |
2,074 |
33,967 |
7,560 |
18,431 |
9,632 |
1,584 |
4,771 |
46 |
7,146 |
85,211 |
|
| Total |
7,543 |
155,700 |
20,158 |
86,572 |
26,860 |
4,710 |
9,235 |
96 |
17,854 |
328,728 |
|
| 30-34 |
Males |
6,413 |
142,672 |
10,311 |
85,805 |
25,197 |
8,744 |
15,546 |
327 |
9,945 |
304,960 |
|
| Females |
3,685 |
57,698 |
5,652 |
28,833 |
13,479 |
4,062 |
10,280 |
240 |
7,614 |
131,543 |
|
| Total |
10,098 |
200,370 |
15,963 |
114,638 |
38,676 |
12,806 |
25,826 |
567 |
17,559 |
436,503 |
|
| 35-39 |
Males |
7,322 |
127,289 |
9,661 |
80,825 |
28,853 |
11,707 |
18,847 |
890 |
16,640 |
302,034 |
|
| Females |
3,902 |
57,066 |
5,671 |
27,936 |
13,977 |
6,406 |
12,541 |
539 |
7,852 |
135,890 |
|
| Total |
11,224 |
184,355 |
15,332 |
108,761 |
42,830 |
18,113 |
31,388 |
1,429 |
24,492 |
437,924 |
|
| 40-44 |
Males |
6,776 |
100,753 |
9,977 |
64,913 |
24,847 |
10,600 |
16,579 |
878 |
44,721 |
280,044 |
|
| Females |
3,871 |
51,118 |
5,598 |
25,288 |
11,515 |
5,082 |
8,939 |
482 |
9,335 |
121,228 |
|
| Total |
10,647 |
151,871 |
15,575 |
90,201 |
36,362 |
15,682 |
25,518 |
1,360 |
54,056 |
401,272 |
|
| 45-49 |
Males |
6,691 |
70,629 |
8,962 |
45,503 |
20,888 |
8,791 |
12,663 |
647 |
31,073 |
205,847 |
|
| Females |
4,092 |
36,726 |
4,575 |
20,375 |
8,155 |
3,885 |
6,252 |
314 |
7,892 |
92,266 |
|
| Total |
10,783 |
107,355 |
13,537 |
65,878 |
29,043 |
12,676 |
18,915 |
961 |
38,965 |
298,113 |
|
| 50-54 |
Males |
7,829 |
48,084 |
8,578 |
32,733 |
18,755 |
7,293 |
9,480 |
487 |
17,911 |
151,150 |
|
| Females |
4,114 |
22,013 |
2,866 |
12,708 |
6,810 |
2,486 |
3,958 |
203 |
5,677 |
60,835 |
|
| Total |
11,943 |
70,097 |
11,444 |
45,441 |
25,565 |
9,779 |
13,438 |
690 |
23,588 |
211,985 |
|
| 55-60 |
Males |
6,961 |
25,137 |
7,111 |
16,822 |
12,563 |
4,850 |
8,252 |
448 |
8,142 |
90,286 |
|
| Females |
3,610 |
10,169 |
1,708 |
5,872 |
4,846 |
1,553 |
2,817 |
135 |
3,164 |
33,874 |
|
| Total |
10,571 |
35,306 |
8,819 |
22,694 |
17,409 |
6,403 |
11,069 |
583 |
11,306 |
124,160 |
|
| 60-64 |
Males |
3,075 |
9,569 |
3,895 |
7,224 |
6,080 |
2,360 |
5,347 |
413 |
2,605 |
40,568 |
|
| Females |
2,820 |
3,878 |
967 |
2,420 |
2,609 |
866 |
1,690 |
96 |
1,264 |
16,610 |
|
| Total |
5,895 |
13,447 |
4,862 |
9,644 |
8,689 |
3,226 |
7,037 |
509 |
3,869 |
57,178 |
|
| 65 + |
Males |
3,035 |
5,922 |
3,393 |
4,166 |
4,326 |
1,884 |
5,074 |
686 |
2,044 |
30,530 |
|
| Females |
5,632 |
2,903 |
1,105 |
2,021 |
2,055 |
785 |
1,436 |
113 |
950 |
17,000 |
|
| Total |
8,667 |
8,825 |
4,498 |
6,187 |
6,381 |
2,669 |
6,510 |
799 |
2,994 |
47,530 |
|
| Total |
Males |
54,235 |
673,628 |
120,472 |
460,355 |
168,878 |
59,645 |
96,590 |
4,828 |
178,332 |
1,816,963 |
|
| Females |
34,173 |
285,469 |
78,077 |
189,478 |
84,941 |
27,037 |
53,392 |
2,170 |
81,769 |
836,506 |
|
| Total |
88,408 |
959,097 |
198,549 |
649,833 |
253,819 |
86,682 |
149,982 |
6,998 |
260,101 |
2,653,469 |
|
Source: PACI
ANNEXED NOTE
- Characteristics of data and definitions
The source of data used here is the Public Authority for Civil Information (PACI), an independent government body in charge of :
1- centralising all population and labour force data in order to manage a fully computerised population register
2- issuing mandatory civil identification cards to every resident of the country, regardless of age and nationality.
Another source of demographic and socioeconomic data on Kuwait is the Central Statistical Office (CSO), operating within the Planning Ministry. The CSO has conducted ten population and housing censuses since its inception in 1957.
Since 1995 a marked discrepancy was witnessed between PACI’s and CSO’s population figures. PACI’s database is connected electronically with other administrations and bodies registering demographic events and professional/ residency issues (births and death; departures and arrivals; end of service, residency and ID deliveries, etc.).
PACI’s records of residents’ movements is thus regularly updated, which limits the risk of population overcount. Therefore, it is more likely that residents were undercounted during CSO- Ministry of Planning’s census operations (see: Shah, N. Population of Kuwait. Structure and Dynamics, Kuwait: Kuwait University Academic Publication Council, 2010, chapter 1).
(a) Kuwaiti: the Kuwaiti nationality rests upon a document of Kuwaiti nationality or a certificate proving Kuwaiti nationality issued by the Ministry of Interior of Kuwait.
(b) Non-Kuwaiti: his/ her nationality is determined by the name of the State which issued the passport. The foreign national also entered Kuwait legally and has a stamp of residence.
This category includes the Bidoon, a category of stateless persons living in the Emirate. Kuwait’s Bidoon population originates from three broad categories:
1) those whose ancestors failed to apply for nationality or lacked necessary documentation at the time of Kuwait’s independence in 1961;
2) those recruited to work in Kuwait’s army or police force during the 1960s who permanently settled in Kuwait, along with their families;
3) children of Kuwaiti mothers and stateless or foreign fathers (see Human Rights Watch. Prisoners of the Past. Kuwaiti Bidun and the Burden of Statelessness, June 2011, p. 3).
(The children of Kuwaiti mothers and non-Kuwaiti fathers (with specific nationality) inherit the father’s nationality. They are stateless if the father is stateless).
Classification used for education levels: ISCED.
- Institution which provides data
The Public Authority for Civil Information (PACI)
- Period of data coverage: 31 December
The database is updated twice a year and the website presents only the most recent data.
- Data availability
The statistics section of PACI’s website (http://www.paci.gov.kw/en/ (English); http://www.paci.gov.kw/ (Arabic)) provides population and socio-economic data broken down by nationality (Kuwaiti/ non-Kuwaiti). Some data are displayed by nationality groups.
Analytical tables and data crosstabulations are available for download in PDF, html, .png and Excel (.csv) formats.
PACI website has been inaccessible from outside Kuwait since 2019.
Last date of access: September 2022.
GLMM and GRC cannot guarantee that the link to access the source will not change; that the information will not be removed from the website it was obtained from; that no geo-blockages will be imposed; or that the information will not be available for any another reason.
| |
|
Illiterate |
Read and Write |
Primary |
Interme–diate |
Secondary |
Diploma |
University |
Post-Graduate |
Not Stated |
Total |
| 10-14 |
Males |
0 |
605 |
61,006 |
0 |
0 |
0 |
0 |
0 |
22,165 |
83,776 |
| Females |
0 |
304 |
60,246 |
0 |
0 |
0 |
0 |
0 |
20,806 |
81,356 |
| Total |
0 |
909 |
121,252 |
0 |
0 |
0 |
0 |
0 |
42,971 |
165,132 |
| 15-19 |
Males |
0 |
263 |
3,893 |
54,097 |
15,378 |
0 |
0 |
0 |
1,989 |
75,620 |
| Females |
0 |
160 |
2,488 |
49,561 |
19,976 |
0 |
0 |
0 |
1,463 |
73,648 |
| Total |
0 |
423 |
6,381 |
103,658 |
35,354 |
0 |
0 |
0 |
3,452 |
149,268 |
| 20-24 |
Males |
1 |
233 |
3,457 |
29,967 |
23,774 |
1,596 |
5,529 |
18 |
2,393 |
66,968 |
| Females |
2 |
175 |
1,100 |
19,941 |
34,887 |
1,150 |
5,692 |
26 |
1,607 |
64,580 |
| Total |
3 |
408 |
4,557 |
49,908 |
58,661 |
2,746 |
11,221 |
44 |
4,000 |
131,548 |
| 25-29 |
Males |
2 |
44 |
6,391 |
15,051 |
16,432 |
8,155 |
15,822 |
851 |
2,043 |
64,791 |
| Females |
16 |
251 |
2,054 |
8,604 |
19,289 |
7,130 |
24,549 |
419 |
1,612 |
63,924 |
| Total |
18 |
295 |
8,445 |
23,655 |
35,721 |
15,285 |
40,371 |
1,270 |
3,655 |
128,715 |
| 30-34 |
Males |
4 |
32 |
5,203 |
10,723 |
12,601 |
9,562 |
12,926 |
961 |
1,833 |
53,845 |
| Females |
43 |
543 |
2,432 |
5,354 |
12,591 |
12,175 |
20,562 |
559 |
1,841 |
56,100 |
| Total |
47 |
575 |
7,635 |
16,077 |
25,192 |
21,737 |
33,488 |
1,520 |
3,674 |
109,945 |
| 35-39 |
Males |
1 |
33 |
3,227 |
11,067 |
10,839 |
9,717 |
9,590 |
1,127 |
1,489 |
47,090 |
| Females |
32 |
467 |
1,801 |
6,505 |
9,188 |
13,924 |
17,207 |
759 |
1,917 |
51,800 |
| Total |
33 |
500 |
5,028 |
17,572 |
20,027 |
23,641 |
26,797 |
1,886 |
3,406 |
98,890 |
| 40-44 |
Males |
0 |
29 |
3,294 |
9,756 |
9,283 |
6,926 |
7,088 |
987 |
1,271 |
38,634 |
| Females |
24 |
271 |
2,110 |
6,565 |
7,626 |
9,308 |
15,264 |
628 |
1,956 |
43,752 |
| Total |
24 |
300 |
5,404 |
16,321 |
16,909 |
16,234 |
22,352 |
1,615 |
3,227 |
82,386 |
| 45-49 |
Males |
1 |
53 |
4,603 |
9,163 |
6,038 |
5,524 |
5,853 |
734 |
1,431 |
33,400 |
| Females |
21 |
178 |
2,484 |
8,413 |
5,266 |
6,324 |
12,704 |
478 |
2,674 |
38,542 |
| Total |
22 |
231 |
7,087 |
17,576 |
11,304 |
11,848 |
18,557 |
1,212 |
4,105 |
71,942 |
| 50-54 |
Males |
1 |
24 |
2,590 |
9,514 |
5,265 |
4,790 |
4,446 |
624 |
1,190 |
28,444 |
| Females |
57 |
100 |
2,353 |
8,881 |
5,111 |
4,561 |
8,893 |
281 |
3,174 |
33,411 |
| Total |
58 |
124 |
4,943 |
18,395 |
10,376 |
9,351 |
13,339 |
905 |
4,364 |
61,855 |
| 55-60 |
Males |
2 |
16 |
1,449 |
6,333 |
5,440 |
3,983 |
4,692 |
455 |
1,127 |
23,497 |
| Females |
72 |
52 |
2,286 |
6,473 |
4,348 |
4,341 |
6,552 |
209 |
3,775 |
28,108 |
| Total |
74 |
68 |
3,735 |
12,806 |
9,788 |
8,324 |
11,244 |
664 |
4,902 |
51,605 |
| 60-64 |
Males |
98 |
218 |
1,191 |
4,019 |
3,067 |
3,087 |
3,861 |
616 |
456 |
16,613 |
| Females |
2,526 |
1,059 |
1,891 |
4,347 |
2,697 |
3,922 |
4,293 |
213 |
864 |
21,812 |
| Total |
2,624 |
1,277 |
3,082 |
8,366 |
5,764 |
7,009 |
8,154 |
829 |
1,320 |
38,425 |
| 65 + |
Males |
1,259 |
2,521 |
3,624 |
5,834 |
3,392 |
4,025 |
4,865 |
1,417 |
1,320 |
28,257 |
| Females |
14,789 |
4,264 |
3,877 |
5,834 |
2,640 |
4,292 |
3,555 |
458 |
1,014 |
40,723 |
| Total |
16,048 |
6,785 |
7,501 |
11,668 |
6,032 |
8,317 |
8,420 |
1,875 |
2,334 |
68,980 |
| Total |
Males |
1,369 |
4,071 |
99,928 |
165,524 |
111,509 |
57,365 |
74,672 |
7,790 |
38,707 |
560,935 |
| Females |
17,582 |
7,824 |
85,122 |
130,478 |
123,619 |
67,127 |
119,271 |
4,030 |
42,703 |
597,756 |
| Total |
18,951 |
11,895 |
185,050 |
296,002 |
235,128 |
124,492 |
193,943 |
11,820 |
81,410 |
1,158,691 |
Source: PACI
ANNEXED NOTE
- Characteristics of data and definitions
The source of data used here is the Public Authority for Civil Information (PACI), an independent government body in charge of :
1- centralising all population and labour force data in order to manage a fully computerised population register
2- issuing mandatory civil identification cards to every resident of the country, regardless of age and nationality.
Another source of demographic and socioeconomic data on Kuwait is the Central Statistical Office (CSO), operating within the Planning Ministry. The CSO has conducted ten population and housing censuses since its inception in 1957.
Since 1995 a marked discrepancy was witnessed between PACI’s and CSO’s population figures. PACI’s database is connected electronically with other administrations and bodies registering demographic events and professional/ residency issues (births and death; departures and arrivals; end of service, residency and ID deliveries, etc.).
PACI’s records of residents’ movements is thus regularly updated, which limits the risk of population overcount. Therefore, it is more likely that residents were undercounted during CSO- Ministry of Planning’s census operations (see: Shah, N. Population of Kuwait. Structure and Dynamics, Kuwait: Kuwait University Academic Publication Council, 2010, chapter 1).
(a) Kuwaiti: the Kuwaiti nationality rests upon a document of Kuwaiti nationality or a certificate proving Kuwaiti nationality issued by the Ministry of Interior of Kuwait.
(b) Non-Kuwaiti: his/ her nationality is determined by the name of the State which issued the passport. The foreign national also entered Kuwait legally and has a stamp of residence.
This category includes the Bidoon, a category of stateless persons living in the Emirate. Kuwait’s Bidoon population originates from three broad categories:
1) those whose ancestors failed to apply for nationality or lacked necessary documentation at the time of Kuwait’s independence in 1961;
2) those recruited to work in Kuwait’s army or police force during the 1960s who permanently settled in Kuwait, along with their families;
3) children of Kuwaiti mothers and stateless or foreign fathers (see Human Rights Watch. Prisoners of the Past. Kuwaiti Bidun and the Burden of Statelessness, June 2011, p. 3).
(The children of Kuwaiti mothers and non-Kuwaiti fathers (with specific nationality) inherit the father’s nationality. They are stateless if the father is stateless).
Classification used for education levels: ISCED.
- Institution which provides data
The Public Authority for Civil Information (PACI)
- Period of data coverage: 31 December
The database is updated twice a year and the website presents only the most recent data.
- Data availability
The statistics section of PACI’s website (http://www.paci.gov.kw/en/ (English); http://www.paci.gov.kw/ (Arabic)) provides population and socio-economic data broken down by nationality (Kuwaiti/ non-Kuwaiti). Some data are displayed by nationality groups.
Analytical tables and data crosstabulations are available for download in PDF, html, .png and Excel (.csv) formats.
PACI website has been inaccessible from outside Kuwait since 2019.
Last date of access: September 2022.
GLMM and GRC cannot guarantee that the link to access the source will not change; that the information will not be removed from the website it was obtained from; that no geo-blockages will be imposed; or that the information will not be available for any another reason.
| |
Kuwaitis |
Non-Kuwaitis |
Total |
| |
Males |
Females |
Total |
Males |
Females |
Total |
Males |
Females |
Total |
| 0-4 |
83,414 |
79,546 |
162,960 |
56,135 |
53,590 |
109,725 |
139,549 |
133,136 |
272,685 |
| 5-9 |
85,289 |
81,776 |
167,065 |
68,530 |
65,277 |
133,807 |
153,819 |
147,053 |
300,872 |
| 10-14 |
83,776 |
81,356 |
165,132 |
62,186 |
58,970 |
121,156 |
145,962 |
140,326 |
286,288 |
| 15-19 |
75,620 |
73,648 |
149,268 |
47,045 |
43,945 |
90,990 |
122,665 |
117,593 |
240,258 |
| 20-24 |
66,968 |
64,580 |
131,548 |
58,796 |
39,134 |
97,930 |
125,764 |
103,714 |
229,478 |
| 25-29 |
64,791 |
63,924 |
128,715 |
243,517 |
85,211 |
328,728 |
308,308 |
149,135 |
457,443 |
| 30-34 |
53,845 |
56,100 |
109,945 |
304,960 |
131,543 |
436,503 |
358,805 |
187,643 |
546,448 |
| 35-39 |
47,090 |
51,800 |
98,890 |
302,034 |
135,890 |
437,924 |
349,124 |
187,690 |
536,814 |
| 40-44 |
38,634 |
43,752 |
82,386 |
280,044 |
121,228 |
401,272 |
318,678 |
164,980 |
483,658 |
| 45-49 |
33,400 |
38,542 |
71,942 |
205,847 |
92,266 |
298,113 |
239,247 |
130,808 |
370,055 |
| 50-54 |
28,444 |
33,411 |
61,855 |
151,150 |
60,835 |
211,985 |
179,594 |
94,246 |
273,840 |
| 55-59 |
23,497 |
28,108 |
51,605 |
90,286 |
33,874 |
124,160 |
113,783 |
61,982 |
175,765 |
| 60-64 |
16,613 |
21,812 |
38,425 |
40,568 |
16,610 |
57,178 |
57,181 |
38,422 |
95,603 |
| 65-69 |
11,990 |
16,791 |
28,781 |
17,588 |
7,973 |
25,561 |
29,578 |
24,764 |
54,342 |
| 70-74 |
6,822 |
10,791 |
17,613 |
7,371 |
4,275 |
11,646 |
14,193 |
15,066 |
29,259 |
| 75-79 |
4,671 |
6,865 |
11,536 |
3,256 |
2,427 |
5,683 |
7,927 |
9,292 |
17,219 |
| 80-84 |
2,909 |
3,664 |
6,573 |
1,438 |
1,268 |
2,706 |
4,347 |
4,932 |
9,279 |
| 85+ |
1,865 |
2,612 |
4,477 |
877 |
1,057 |
1,934 |
2,742 |
3,669 |
6,411 |
| Total |
729,638 |
759,078 |
1,488,716 |
1,941,628 |
955,373 |
2,897,001 |
2,671,266 |
1,714,451 |
4,385,717 |
Source: PACI
ANNEXED NOTE
- Characteristics of data and definitions
The source of data used here is the Public Authority for Civil Information (PACI), an independent government body in charge of :
1- centralising all population and labour force data in order to manage a fully computerised population register
2- issuing mandatory civil identification cards to every resident of the country, regardless of age and nationality.
Another source of demographic and socioeconomic data on Kuwait is the Central Statistical Office (CSO), operating within the Planning Ministry. The CSO has conducted ten population and housing censuses since its inception in 1957.
Since 1995 a marked discrepancy was witnessed between PACI’s and CSO’s population figures. PACI’s database is connected electronically with other administrations and bodies registering demographic events and professional/ residency issues (births and death; departures and arrivals; end of service, residency and ID deliveries, etc.).
PACI’s records of residents’ movements is thus regularly updated, which limits the risk of population overcount. Therefore, it is more likely that residents were undercounted during CSO- Ministry of Planning’s census operations (see: Shah, N. Population of Kuwait. Structure and Dynamics, Kuwait: Kuwait University Academic Publication Council, 2010, chapter 1).
(a) Kuwaiti: the Kuwaiti nationality rests upon a document of Kuwaiti nationality or a certificate proving Kuwaiti nationality issued by the Ministry of Interior of Kuwait.
(b) Non-Kuwaiti: his/ her nationality is determined by the name of the State which issued the passport. The foreign national also entered Kuwait legally and has a stamp of residence.
This category includes the Bidoon, a category of stateless persons living in the Emirate. Kuwait’s Bidoon population originates from three broad categories:
1) those whose ancestors failed to apply for nationality or lacked necessary documentation at the time of Kuwait’s independence in 1961;
2) those recruited to work in Kuwait’s army or police force during the 1960s who permanently settled in Kuwait, along with their families;
3) children of Kuwaiti mothers and stateless or foreign fathers (see Human Rights Watch. Prisoners of the Past. Kuwaiti Bidun and the Burden of Statelessness, June 2011, p. 3).
(The children of Kuwaiti mothers and non-Kuwaiti fathers (with specific nationality) inherit the father’s nationality. They are stateless if the father is stateless).
- Institution which provides data
The Public Authority for Civil Information (PACI)
- Period of data coverage: 31 December
The database is updated twice a year and the website presents only the most recent data.
- Data availability
The statistics section of PACI’s website (http://www.paci.gov.kw/en/ (English); http://www.paci.gov.kw/ (Arabic)) provides population and socio-economic data broken down by nationality (Kuwaiti/ non-Kuwaiti). Some data are displayed by nationality groups.
Analytical tables and data crosstabulations are available for download in PDF, html, .png and Excel (.csv) formats.
PACI website has been inaccessible from outside Kuwait since 2019.
Last date of access: September 2022.
GLMM and GRC cannot guarantee that the link to access the source will not change; that the information will not be removed from the website it was obtained from; that no geo-blockages will be imposed; or that the information will not be available for any another reason.
| |
Arabs |
Asians |
Africans |
Europeans |
North Americans |
South Americans |
Australians/
Oceanians |
| |
M |
F |
T |
M |
F |
T |
M |
F |
T |
M |
F |
T |
M |
F |
T |
M |
F |
T |
M |
F |
T |
| 0-4 |
33,130 |
31,797 |
64,927 |
14,371 |
13,752 |
28,123 |
387 |
336 |
723 |
340 |
306 |
646 |
384 |
344 |
728 |
52 |
48 |
100 |
33 |
41 |
74 |
| 5-9 |
37,641 |
36,196 |
73,837 |
12,573 |
11,775 |
24,348 |
171 |
176 |
347 |
256 |
284 |
540 |
389 |
333 |
722 |
52 |
41 |
93 |
42 |
47 |
89 |
| 10-14 |
31,110 |
29,745 |
60,855 |
9,714 |
9,197 |
18,911 |
90 |
101 |
191 |
228 |
250 |
478 |
318 |
320 |
638 |
56 |
46 |
102 |
46 |
42 |
88 |
| 15-19 |
21,876 |
21,286 |
43,162 |
5,941 |
5,466 |
11,407 |
53 |
44 |
97 |
147 |
149 |
296 |
193 |
181 |
374 |
48 |
50 |
98 |
26 |
22 |
48 |
| 20-24 |
17,301 |
17,663 |
34,964 |
3,183 |
3,118 |
6,301 |
36 |
46 |
82 |
67 |
108 |
175 |
81 |
110 |
191 |
48 |
38 |
86 |
16 |
17 |
33 |
| 25-29 |
16,641 |
16,126 |
32,767 |
2,110 |
1,854 |
3,964 |
51 |
103 |
154 |
69 |
83 |
152 |
96 |
148 |
244 |
44 |
44 |
88 |
21 |
24 |
45 |
| 30-34 |
16,171 |
14,066 |
30,237 |
1,528 |
1,345 |
2,873 |
49 |
106 |
155 |
91 |
78 |
169 |
176 |
192 |
368 |
40 |
34 |
74 |
30 |
19 |
49 |
| 35-39 |
17,058 |
14,146 |
31,204 |
1,953 |
1,475 |
3,428 |
47 |
57 |
104 |
126 |
102 |
228 |
182 |
154 |
336 |
40 |
33 |
73 |
26 |
22 |
48 |
| 40-44 |
13,505 |
10,225 |
23,730 |
2,064 |
1,154 |
3,218 |
24 |
19 |
43 |
114 |
73 |
187 |
137 |
93 |
230 |
14 |
9 |
23 |
28 |
13 |
41 |
| 45-49 |
9,041 |
6,741 |
15,782 |
1,483 |
704 |
2,187 |
12 |
14 |
26 |
107 |
36 |
143 |
109 |
62 |
171 |
18 |
2 |
20 |
11 |
4 |
15 |
| 50+ |
15,207 |
9,508 |
24,715 |
1,941 |
991 |
2,932 |
28 |
10 |
38 |
158 |
68 |
226 |
392 |
162 |
554 |
71 |
13 |
84 |
59 |
23 |
82 |
| Total |
228,681 |
207,499 |
436,180 |
56,861 |
50,831 |
107,692 |
948 |
1,012 |
1,960 |
1,703 |
1,537 |
3,240 |
2,457 |
2,099 |
4,556 |
483 |
358 |
841 |
338 |
274 |
612 |
Source: PACI
ANNEXED NOTE
- Characteristics of data and definitions
The source of data used here is the Public Authority for Civil Information (PACI), an independent government body in charge of :
1- centralising all population and labour force data in order to manage a fully computerised population register
2- issuing mandatory civil identification cards to every resident of the country, regardless of age and nationality.
Another source of demographic and socioeconomic data on Kuwait is the Central Statistical Office (CSO), operating within the Planning Ministry. The CSO has conducted ten population and housing censuses since its inception in 1957.
Since 1995 a marked discrepancy was witnessed between PACI’s and CSO’s population figures. PACI’s database is connected electronically with other administrations and bodies registering demographic events and professional/ residency issues (births and death; departures and arrivals; end of service, residency and ID deliveries, etc.).
PACI’s records of residents’ movements is thus regularly updated, which limits the risk of population overcount. Therefore, it is more likely that residents were undercounted during CSO- Ministry of Planning’s census operations (see: Shah, N. Population of Kuwait. Structure and Dynamics, Kuwait: Kuwait University Academic Publication Council, 2010, chapter 1).
(a) Kuwaiti: the Kuwaiti nationality rests upon a document of Kuwaiti nationality or a certificate proving Kuwaiti nationality issued by the Ministry of Interior of Kuwait.
(b) Non-Kuwaiti: his/ her nationality is determined by the name of the State which issued the passport. The foreign national also entered Kuwait legally and has a stamp of residence.
This category includes the Bidoon, a category of stateless persons living in the Emirate. Kuwait’s Bidoon population originates from three broad categories:
1) those whose ancestors failed to apply for nationality or lacked necessary documentation at the time of Kuwait’s independence in 1961;
2) those recruited to work in Kuwait’s army or police force during the 1960s who permanently settled in Kuwait, along with their families;
3) children of Kuwaiti mothers and stateless or foreign fathers (see Human Rights Watch. Prisoners of the Past. Kuwaiti Bidun and the Burden of Statelessness, June 2011, p. 3).
(The children of Kuwaiti mothers and non-Kuwaiti fathers (with specific nationality) inherit the father’s nationality. They are stateless if the father is stateless).
(c) Nationality group: collected according to the nationality of the head of the household.
Nationalities are grouped according to specific features common to certain population subgroups: language, geographic origin, etc. or according to internationally recognized categories such as: (Arab / non-Arab Asian countries / non-Arab African countries; European countries … etc.).
- Institution which provides data
The Public Authority for Civil Information (PACI)
- Period of data coverage: 31 December
The database is updated twice a year and the website presents only the most recent data.
- Data availability
The statistics section of PACI’s website (http://www.paci.gov.kw/en/ (English); http://www.paci.gov.kw/ (Arabic)) provides population and socio-economic data broken down by nationality (Kuwaiti/ non-Kuwaiti). Some data are displayed by nationality groups.
Analytical tables and data crosstabulations are available for download in PDF, html, .png and Excel (.csv) formats.
PACI website has been inaccessible from outside Kuwait since 2019.
Last date of access: September 2022.
GLMM and GRC cannot guarantee that the link to access the source will not change; that the information will not be removed from the website it was obtained from; that no geo-blockages will be imposed; or that the information will not be available for any another reason.
| |
Born in Kuwait |
Born out of Kuwait |
Total |
| Male |
Female |
Total |
Male |
Female |
Total |
Male |
Female |
Total |
| 0-4 |
48,697 |
46,624 |
95,321 |
7,438 |
6,966 |
14,404 |
56,135 |
53,590 |
109,725 |
| 5-9 |
51,124 |
48,852 |
99,976 |
17,406 |
16,425 |
33,831 |
68,530 |
65,277 |
133,807 |
| 10-14 |
41,562 |
39,701 |
81,263 |
20,624 |
19,269 |
39,893 |
62,186 |
58,970 |
121,156 |
| 15-19 |
28,284 |
27,198 |
55,482 |
18,761 |
16,747 |
35,508 |
47,045 |
43,945 |
90,990 |
| 20-24 |
20,732 |
21,100 |
41,832 |
38,064 |
18,034 |
56,098 |
58,796 |
39,134 |
97,930 |
| 25-29 |
19,032 |
18,382 |
37,414 |
224,485 |
66,829 |
291,314 |
243,517 |
85,211 |
328,728 |
| 30-34 |
18,085 |
15,840 |
33,925 |
286,875 |
115,703 |
402,578 |
304,960 |
131,543 |
436,503 |
| 35-39 |
19,432 |
15,989 |
35,421 |
282,602 |
119,901 |
402,503 |
302,034 |
135,890 |
437,924 |
| 40-44 |
15,886 |
11,586 |
27,472 |
264,158 |
109,642 |
373,800 |
280,044 |
121,228 |
401,272 |
| 45-49 |
10,781 |
7,563 |
18,344 |
195,066 |
84,703 |
279,769 |
205,847 |
92,266 |
298,113 |
| 50-54 |
8,125 |
5,799 |
13,924 |
143,025 |
55,036 |
198,061 |
151,150 |
60,835 |
211,985 |
| 55-59 |
4,980 |
3,141 |
8,121 |
85,306 |
30,733 |
116,039 |
90,286 |
33,874 |
124,160 |
| 60-64 |
2,283 |
1,152 |
3,435 |
38,285 |
15458 |
53,743 |
40,568 |
16,610 |
57,178 |
| 65+ |
2,468 |
683 |
3,151 |
28,062 |
16317 |
44,379 |
30,530 |
17,000 |
47,530 |
| Total |
291,471 |
263,610 |
555,081 |
1,650,157 |
691,763 |
2,341,920 |
1,941,628 |
955,373 |
2,897,001 |
Source: PACI
ANNEXED NOTE
- Characteristics of data and definitions
The source of data used here is the Public Authority for Civil Information (PACI), an independent government body in charge of :
1- centralising all population and labour force data in order to manage a fully computerised population register
2- issuing mandatory civil identification cards to every resident of the country, regardless of age and nationality.
Another source of demographic and socioeconomic data on Kuwait is the Central Statistical Office (CSO), operating within the Planning Ministry. The CSO has conducted ten population and housing censuses since its inception in 1957.
Since 1995 a marked discrepancy was witnessed between PACI’s and CSO’s population figures. PACI’s database is connected electronically with other administrations and bodies registering demographic events and professional/ residency issues (births and death; departures and arrivals; end of service, residency and ID deliveries, etc.).
PACI’s records of residents’ movements is thus regularly updated, which limits the risk of population overcount. Therefore, it is more likely that residents were undercounted during CSO- Ministry of Planning’s census operations (see: Shah, N. Population of Kuwait. Structure and Dynamics, Kuwait: Kuwait University Academic Publication Council, 2010, chapter 1).
(a) Kuwaiti: the Kuwaiti nationality rests upon a document of Kuwaiti nationality or a certificate proving Kuwaiti nationality issued by the Ministry of Interior of Kuwait.
(b) Non-Kuwaiti: his/ her nationality is determined by the name of the State which issued the passport. The foreign national also entered Kuwait legally and has a stamp of residence.
This category includes the Bidoon, a category of stateless persons living in the Emirate. Kuwait’s Bidoon population originates from three broad categories:
1) those whose ancestors failed to apply for nationality or lacked necessary documentation at the time of Kuwait’s independence in 1961;
2) those recruited to work in Kuwait’s army or police force during the 1960s who permanently settled in Kuwait, along with their families;
3) children of Kuwaiti mothers and stateless or foreign fathers (see Human Rights Watch. Prisoners of the Past. Kuwaiti Bidun and the Burden of Statelessness, June 2011, p. 3).
(The children of Kuwaiti mothers and non-Kuwaiti fathers (with specific nationality) inherit the father’s nationality. They are stateless if the father is stateless).
- Institution which provides data
The Public Authority for Civil Information (PACI)
- Period of data coverage: 31 December
The database is updated twice a year and the website presents only the most recent data.
- Data availability
The statistics section of PACI’s website (http://www.paci.gov.kw/en/ (English); http://www.paci.gov.kw/ (Arabic)) provides population and socio-economic data broken down by nationality (Kuwaiti/ non-Kuwaiti). Some data are displayed by nationality groups.
Analytical tables and data crosstabulations are available for download in PDF, html, .png and Excel (.csv) formats.
PACI website has been inaccessible from outside Kuwait since 2019.
Last date of access: September 2022.
GLMM and GRC cannot guarantee that the link to access the source will not change; that the information will not be removed from the website it was obtained from; that no geo-blockages will be imposed; or that the information will not be available for any another reason.
| |
Males |
Females |
Total |
% females |
| Kuwaitis |
729,638 |
759,078 |
1,488,716 |
51.0 |
| Arabs |
811,621 |
398,634 |
1,210,255 |
32.9 |
| Asians |
1,100,082 |
512,150 |
1,612,232 |
31.8 |
| Africans |
10,223 |
28,792 |
39,015 |
73.8 |
| Europeans |
7,654 |
7,126 |
14,780 |
48.2 |
| N. Americans |
10,206 |
7,263 |
17,469 |
41.6 |
| S. Americans |
1,094 |
834 |
1,928 |
43.3 |
| Australians/ Oceanians |
748 |
574 |
1,322 |
43.4 |
| Total non-Kuwaitis |
1,941,628 |
955,373 |
2,897,001 |
33.0 |
| Total |
2,671,266 |
1,714,451 |
4,385,717 |
39.1 |
Source: PACI
ANNEXED NOTE
- Characteristics of data and definitions
The source of data used here is the Public Authority for Civil Information (PACI), an independent government body in charge of:
1- centralising all population and labour force data to manage a fully computerised population register
2- issuing mandatory civil identification cards to every resident of the country, regardless of age and nationality.
(a) Kuwaiti: the Kuwaiti nationality rests upon a document of Kuwaiti nationality or a certificate proving Kuwaiti nationality issued by the Ministry of Interior of Kuwait.
(b) Non-Kuwaiti: his/ her nationality is determined by the name of the State which issued the passport. The foreign national also entered Kuwait legally and has a stamp of residence.
This category includes the Bidoon, a category of stateless persons living in the Emirate.
(c) Nationality group: collected according to the nationality of the head of the household.
Nationalities are grouped according to specific features common to certain population subgroups: language, geographic origin, etc. or according to internationally recognized categories such as: (Arab / non-Arab Asian countries / non-Arab African countries; European countries … etc.).
- Institution which provides data
The Public Authority for Civil Information (PACI)
- Period of data coverage:
31 December.
The database is updated twice a year and the website presents only the most recent data.
- Data availability
The statistics section of PACI’s website (http://www.paci.gov.kw/en/ (English); http://www.paci.gov.kw/ (Arabic)) provides population and socio-economic data broken down by nationality (Kuwaiti/ non-Kuwaiti). Some data are displayed by nationality groups.
Analytical tables and data crosstabulations are available for download in PDF, html, .png and Excel (.csv) formats.
PACI website has been inaccessible from outside Kuwait since 2019.
Last date of attempted access: September 2022.
GLMM and GRC cannot guarantee that the link to access the source will not change; that the information will not be removed from the website it was obtained from; that no geo-blockages will be imposed; or that the information will not be available for any another reason.
| |
|
Kuwaitis |
|
Non-Kuwaitis |
|
Total |
|
| Year |
Male |
Female |
Total |
Male |
Female |
Total |
Male |
Female |
Total |
| 1990 |
286,299 |
292,212 |
578,511 |
944,585 |
628,584 |
1,573,169 |
1,230,884 |
920,796 |
2,151,680 |
| 1993 |
325,892 |
331,601 |
657,493 |
682,161 |
305,973 |
988,134 |
1,008,053 |
637,574 |
1,645,627 |
| 1995 |
351,314 |
356,801 |
708,115 |
841,320 |
409,359 |
1,250,679 |
1,192,634 |
766,160 |
1,958,794 |
| 1996 |
363,476 |
368,927 |
732,403 |
914,327 |
447,159 |
1,361,486 |
1,277,803 |
816,086 |
2,093,889 |
| 1997 |
n.a. |
n.a. |
n.a. |
n.a. |
n.a. |
n.a. |
n.a. |
n.a. |
n.a. |
| 1998 |
388,687 |
397,323 |
786,010 |
1,002,718 |
482,137 |
1,484,855 |
1,391,405 |
879,460 |
2,270,865 |
| 1999 |
401,433 |
410,822 |
812,255 |
970,865 |
471,834 |
1,442,699 |
1,372,298 |
882,656 |
2,254,954 |
| 2000 |
415,613 |
426,177 |
841,790 |
927,023 |
448,445 |
1,375,468 |
1,342,636 |
874,622 |
2,217,258 |
| 2001 |
429,209 |
441,074 |
870,283 |
960,390 |
478,429 |
1,438,819 |
1,389,599 |
919,503 |
2,309,102 |
| 2002 |
442,310 |
455,975 |
898,285 |
1,020,913 |
500,730 |
1,521,643 |
1,463,223 |
956,705 |
2,419,928 |
| 2003 |
456,226 |
471,460 |
927,686 |
1,098,878 |
520,120 |
1,618,998 |
1,555,104 |
991,580 |
2,546,684 |
| 2004 |
469,327 |
486,907 |
956,234 |
1,240,267 |
557,155 |
1,797,422 |
1,709,594 |
1,044,062 |
2,753,656 |
| 2005 |
486,089 |
506,128 |
992,217 |
1,391,322 |
607,650 |
1,998,972 |
1,877,411 |
1,113,778 |
2,991,189 |
| 2006 |
501,148 |
522,168 |
1,023,316 |
1,510,818 |
648,826 |
2,159,644 |
2,011,966 |
1,170,994 |
3,182,960 |
| 2007 |
516,631 |
537,966 |
1,054,597 |
1,615,273 |
729,767 |
2,345,040 |
2,131,904 |
1,267,733 |
3,399,637 |
| 2008 |
532,566 |
554,985 |
1,087,551 |
1,618,766 |
735,496 |
2,354,262 |
2,151,332 |
1,290,481 |
3,441,813 |
| 2009 |
548,290 |
570,620 |
1,118,910 |
1,591,935 |
774,036 |
2,365,971 |
2,140,225 |
1,344,656 |
3,484,881 |
| 2010 |
563,631 |
584,712 |
1,148,343 |
1,586,716 |
846,995 |
2,433,711 |
2,150,347 |
1,431,707 |
3,582,054 |
| 2011 |
580,558 |
602,616 |
1,183,174 |
1,641,135 |
872,983 |
2,514,118 |
2,221,693 |
1,475,599 |
3,697,292 |
| 2012 |
595,365 |
617,071 |
1,212,436 |
1,705,468 |
905,824 |
2,611,292 |
2,300,833 |
1,522,895 |
3,823,728 |
| 2013 |
610,545 |
631,954 |
1,242,499 |
1,772,413 |
950,232 |
2,722,645 |
2,382,958 |
1,582,186 |
3,965,144 |
| 2014 |
626,256 |
649,601 |
1,275,857 |
1,855,279 |
960,857 |
2,816,136 |
2,481,535 |
1,610,458 |
4,091,993 |
| 2015 |
641,282 |
666,323 |
1,307,605 |
1,964,264 |
967,137 |
2,931,401 |
2,605,546 |
1,633,460 |
4,239,006 |
| 2016 |
656,084 |
681,609 |
1,337,693 |
2,089,302 |
984,129 |
3,073,431 |
2,745,386 |
1,665,738 |
4,411,124 |
| 2017 |
671,012 |
699,001 |
1,370,013 |
2,167,409 |
963,054 |
3,130,463 |
2,838,421 |
1,662,055 |
4,500,476 |
| 2018 |
686,475 |
716,638 |
1,403,113 |
2,253,768 |
964,757 |
3,218,525 |
2,940,243 |
1,681,395 |
4,621,638 |
| 2019 |
700,742 |
731,303 |
1,432,045 |
2,303,549 |
1,040,813 |
3,344,362 |
3,004,291 |
1,772,116 |
4,776,407 |
| 2020 |
714,936 |
745,034 |
1,459,970 |
2,177,731 |
1,033,012 |
3,210,743 |
2,892,667 |
1,778,046 |
4,670,713 |
| 2021 |
729,638 |
759,078 |
1,488,716 |
1,941,628 |
955,373 |
2,897,001 |
2,671,266 |
1,714,451 |
4,385,717 |
Source: PACI
ANNEXED NOTE
- Characteristics of data and definitions
The source of data used here is the Public Authority for Civil Information (PACI), an independent government body in charge of:
1- centralising all population and labour force data to manage a fully computerised population register
2- issuing mandatory civil identification cards to every resident of the country, regardless of age and nationality.
Another source of demographic and socioeconomic data on Kuwait is the Central Statistical Office (CSO), operating within the Planning Ministry. The CSO has conducted ten population and housing censuses since its inception in 1957.
Since 1995 a marked discrepancy was witnessed between PACI’s and CSO’s population figures. PACI’s database is connected electronically with other administrations and bodies registering demographic events and professional/ residency issues (births and death; departures and arrivals; end of service, residency and ID deliveries, etc.).
PACI’s records of residents’ movements is thus regularly updated, which limits the risk of population overcount. Therefore, it is more likely that residents were undercounted during CSO- Ministry of Planning’s census operations (see: Shah, N. Population of Kuwait. Structure and Dynamics, Kuwait: Kuwait University Academic Publication Council, 2010, chapter 1).
Nationality:
(a) Kuwaiti: the Kuwaiti nationality rests upon a document of Kuwaiti nationality or a certificate proving Kuwaiti nationality issued by the Ministry of Interior of Kuwait.
(b) Non-Kuwaiti: his/ her nationality is determined by the name of the State which issued the passport. The foreign national also entered Kuwait legally and has a stamp of residence.
This category includes the Bidoon, a category of stateless persons living in the Emirate. Kuwait’s Bidoon population originates from three broad categories:
1) those whose ancestors failed to apply for nationality or lacked necessary documentation at the time of Kuwait’s independence in 1961;
2) those recruited to work in Kuwait’s army or police force during the 1960s who permanently settled in Kuwait, along with their families;
3) children of Kuwaiti mothers and stateless or foreign fathers (see Human Rights Watch. Prisoners of the Past. Kuwaiti Bidun and the Burden of Statelessness, June 2011, p. 3).
The children of Kuwaiti mothers and non-Kuwaiti fathers (with specific nationality) inherit the father’s nationality. They are stateless if the father is stateless.
- Institution which provides data
The Public Authority for Civil Information (PACI)
- Period of data coverage:
31 December.
The database is updated twice a year and the website presents only the most recent data.
- Data availability
The statistics section of PACI’s website (http://www.paci.gov.kw/en/ (English); http://www.paci.gov.kw/ (Arabic)) provides population and socio-economic data broken down by nationality (Kuwaiti/ non-Kuwaiti). Some data are displayed by nationality groups.
Analytical tables and data crosstabulations are available for download in PDF, html, .png and Excel (.csv) formats.
PACI website has been inaccessible from outside Kuwait since 2019.
Last date of attempted access: September 2022.
GLMM and GRC cannot guarantee that the link to access the source will not change; that the information will not be removed from the website it was obtained from; that no geo-blockages will be imposed; or that the information will not be available for any another reason.
| Year |
Kuwaitis |
Non-Kuwaitis |
Total |
| 1990 |
578,511 |
1,573,169 |
2,151,680 |
| 1993 |
657,493 |
988,134 |
1,645,627 |
| 1995 |
708,115 |
1,250,679 |
1,958,794 |
| 1996 |
732,403 |
1,361,486 |
2,093,889 |
| 1998 |
786,010 |
1,484,855 |
2,270,865 |
| 1999 |
812,255 |
1,442,699 |
2,254,954 |
| 2000 |
841,790 |
1,375,468 |
2,217,258 |
| 2001 |
870,283 |
1,438,819 |
2,309,102 |
| 2002 |
898,285 |
1,521,643 |
2,419,928 |
| 2003 |
927,686 |
1,618,998 |
2,546,684 |
| 2004 |
956,234 |
1,797,422 |
2,753,656 |
| 2005 |
992,217 |
1,998,972 |
2,991,189 |
| 2006 |
1,023,316 |
2,159,644 |
3,182,960 |
| 2007 |
1,054,598 |
2,345,039 |
3,399,637 |
| 2008 |
1,087,552 |
2,354,261 |
3,441,813 |
| 2009 |
1,118,911 |
2,365,970 |
3,484,881 |
| 2010 |
1,148,363 |
2,433,691 |
3,582,054 |
| 2011 |
1,183,185 |
2,514,107 |
3,697,292 |
| 2012 |
1,212,436 |
2,611,292 |
3,823,728 |
| 2013 |
1,242,499 |
2,722,645 |
3,965,144 |
| 2014 |
1,275,857 |
2,816,136 |
4,091,993 |
| 2015 |
1,307,605 |
2,931,401 |
4,239,006 |
| 2016 |
1,337,693 |
3,073,431 |
4,411,124 |
| 2017 |
1,370,013 |
3,130,463 |
4,500,476 |
| 2018 |
1,403,113 |
3,218,525 |
4,621,638 |
| 2019 |
1,432,045 |
3,344,362 |
4,776,407 |
| 2020 |
1,459,970 |
3,210,743 |
4,670,713 |
| 2021 |
1,488,716 |
2,897,001 |
4,385,717 |
Source: PACI
ANNEXED NOTE
- Characteristics of data and definitions
The source of data used here is the Public Authority for Civil Information (PACI), an independent government body in charge of:
1- centralising all population and labour force data in order to manage a fully computerised population register
2- issuing mandatory civil identification cards to every resident of the country, regardless of age and nationality.
Another source of demographic and socioeconomic data on Kuwait is the Central Statistical Office (CSO), operating within the Planning Ministry. The CSO has conducted ten population and housing censuses since its inception in 1957.
Since 1995 a marked discrepancy was witnessed between PACI’s and CSO’s population figures. PACI’s database is connected electronically with other administrations and bodies registering demographic events and professional/ residency issues (births and death; departures and arrivals; end of service, residency and ID deliveries, etc.).
PACI’s records of residents’ movements is thus regularly updated, which limits the risk of population overcount. Therefore, it is more likely that residents were undercounted during CSO- Ministry of Planning’s census operations (see: Shah, N. Population of Kuwait. Structure and Dynamics, Kuwait: Kuwait University Academic Publication Council, 2010, chapter 1).
Nationality:
(a) Kuwaiti: the Kuwaiti nationality rests upon a document of Kuwaiti nationality or a certificate proving Kuwaiti nationality issued by the Ministry of Interior of Kuwait.
(b) Non-Kuwaiti: his/ her nationality is determined by the name of the State which issued the passport. The foreign national also entered Kuwait legally and has a stamp of residence.
This category includes the Bidoon, a category of stateless persons living in the Emirate. Kuwait’s Bidoon population originates from three broad categories:
1) those whose ancestors failed to apply for nationality or lacked necessary documentation at the time of Kuwait’s independence in 1961;
2) those recruited to work in Kuwait’s army or police force during the 1960s who permanently settled in Kuwait, along with their families;
3) children of Kuwaiti mothers and stateless or foreign fathers (see Human Rights Watch. Prisoners of the Past. Kuwaiti Bidun and the Burden of Statelessness, June 2011, p. 3).
The children of Kuwaiti mothers and non-Kuwaiti fathers (with specific nationality) inherit the father’s nationality. They are stateless if the father is stateless.
- Institution which provides data
The Public Authority for Civil Information (PACI)
- Period of data coverage:
31 December.
The database is updated twice a year and the website presents only the most recent data.
- Data availability
The statistics section of PACI’s website (http://www.paci.gov.kw/en/ (English); http://www.paci.gov.kw/ (Arabic)) provides population and socio-economic data broken down by nationality (Kuwaiti/ non-Kuwaiti). Some data are displayed by nationality groups.
Analytical tables and data crosstabulations are available for download in PDF, html, .png and Excel (.csv) formats.
PACI website has been inaccessible from outside Kuwait since 2019.
Last date of attempted access: September 2022.
GLMM and GRC cannot guarantee that the link to access the source will not change; that the information will not be removed from the website it was obtained from; that no geo-blockages will be imposed; or that the information will not be available for any another reason.
| Census |
Qataris |
Non-Qataris |
Total |
| 1970 |
45,039 |
66,094 |
111,133 |
| 1986 |
99,754 |
273,638 |
373,392 |
| 1997 |
151,673 |
384,801 |
536,474 |
| 2004 |
192,586 |
605,475 |
798,061 |
| 2010 |
243,073 |
1,456,362 |
1,699,435 |
| 2015 |
301,342* |
2,103,434* |
2,404,776 |
| 2020 |
NA |
NA |
2,846,118 |
Source: MDPS/ PSA and GLMM calculations on the basis of QSA/ MDPS data
* GLMM’s estimate, based on data published by the Planning and Statistics Authority (see below).
ANNEXED NOTE
- Technical Notes and Definitions
Reference periods for each census:
1970: unknown; the nights of March 16th, 1986; March 1st, 1997; March 16th, 2004, April 21st, 2010; April 20th, 2015; December 2020.
Implementation method: de facto, as well as de jure methods (1986-2015)
Census 2020 was based on administrative records, supplemented by an online self-enumeration platform, completed with field enumeration.
Population of reference: all individuals (nationals and non-nationals), present within the country’s borders during night of reference.
– Populations away from usual residence in Qatar for reasons of duty, or on a visit abroad for less than two months, as well as individuals with no personal housing within Qatar staying with a household for more than two months, are counted in their usual/ present residence during census night.
– Populations in transit or visiting Qatar as tourists, as well as residents of public housing or visitors staying in a household for less than two months after night of reference were excluded.
Prior to census 2010, only a sample of foreign residents was covered in censuses.
2015: No population data broken down by nationality was published, based on census results.
We estimated the numbers of Qataris and non-Qataris, using:
- 2015 Labour Force Survey (Q2): Figures of population aged 15 and above, by nationality (period of reference: mid-2015)
Sampling frame of LFS 2015: Population Census 2010.
Sample size: 44,756 persons, in 6,953 households: 1- Qatari households; 2- Non-Qatari regular (non-collective) and collective households;
Reference period for the labour force data: the week prior to data collection day.
Population of reference: all Qatari and non-Qatari households present in Qatar on the night of survey, living in normal and collective households.
- PSA. Women and Men in the State of Qatar- A Statistical Profile, Doha: PSA, 2016.
Figures of population aged 0-14 by nationality (national/ non-national) and sex (period of reference: mid-2015).
The figures of Qataris and non-Qataris by sex were then estimated on the basis of the percentage distribution of population by broad age groups, sex and nationality for mid-2015 (Table 1/3, p. 18).
The figures of Qataris and non-Qataris at the time of census were then calculated, using:
-the ratio of nationals and non-nationals calculated for mid-2015.
-the total figure of the population residing in Qatar during census 2015’s date of reference.
2020: Figures of total population broken down by nationality (Qataris and non-Qataris) are not readily available in any census publication.
No alternative, recent enough source was available as of 20 October 2022, to calculate a reliable estimate of the national and non-national populations at the time of census.
- Institution which provides data
Ministry of Development Planning and Statistics (MDPS)
currently: Planning and Statistics Authority (PSA)
(https://www.psa.gov.qa/en/Pages/default.aspx)
- Data availability
Released parts of censuses (1986; 1997; 2004; 2010, 2015), as well as some analytical volumes, are available on the website of the PSA, in PDF format.
https://www.psa.gov.qa/en/statistics1/StatisticsSite/Census/Pages/default.aspx
Census 2020′ website:
https://www.psa.gov.qa/en/statistics1/StatisticsSite/Census/Census2020/Pages/default.aspx;
https://www.psa.gov.qa/ar/statistics1/statisticssite/census/census2020/pages/default.aspx
Detailed results of the Census of Population, Housing and Establishments (December 2020) (Excel and PDF formats)
https://bit.ly/cenfinalx
https://bit.ly/cenfinal
Main results of the General Census of Population, Housing and Establishments 2020
https://www.psa.gov.qa/en/statistics1/StatisticsSite/Census/census2020/res/Documents/Census_2020_Res_Summary_En.pdf
https://www.psa.gov.qa/en/statistics1/StatisticsSite/Census/census2020/res/Documents/Census_2020_Res_Summary_Ar.pdf
Labour Force Survey Q2-2015:
https://www.psa.gov.qa/en/statistics1/pages/topicslisting.aspx?parent=Social&child=LaborForce
PSA. Women and Men in the State of Qatar- A Statistical Profile, Doha: PSA, 2016.
https://www.psa.gov.qa/en/statistics1/pages/topicslisting.aspx?parent=Social&child=GenrealSocialstatistics
Last date of access: 20 October 2022.
GLMM and GRC cannot guarantee that the link to access the source will not change; that the information will not be removed from the website it was obtained from; that no geo-blockages will be imposed; or that the information will not be available for any another reason.
| |
Bahrain |
Kuwait* |
Oman |
Qatar |
Saudi Arabia |
UAE |
| 2000 |
637,582 |
2,217,258 |
2,401,256 |
613,969 |
20,476,393 |
|
| 2001 |
661,317 |
2,309,102 |
2,477,687 |
643,364 |
20,979,425 |
|
| 2002 |
710,554 |
2,419,928 |
2,537,742 |
676,498 |
21,494,813 |
|
| 2003 |
764,519 |
2,546,684 |
2,340,815 |
713,859 |
22,022,864 |
|
| 2004 |
823,744 |
2,753,656 |
2,415,576 |
798,059 |
22,563,886 |
|
| 2005 |
888,824 |
2,991,189 |
2,508,837 |
906,123 |
23,329,584 |
|
| 2006 |
960,425 |
3,182,960 |
2,577,062 |
1,042,947 |
24,121,890 |
|
| 2007 |
1,039,297 |
3,399,637 |
2,743,499 |
1,218,250 |
24,941,298 |
|
| 2008 |
1,103,496 |
3,441,813 |
2,867,428 |
1,448,479 |
25,787,025 |
|
| 2009 |
1,178,415 |
3,484,881 |
3,173,917 |
1,638,626 |
26,660,857 |
|
| 2010 |
1,228,543 |
3,582,054 |
2,773,479 |
1,715,098 |
27,563,432 |
8,264,070 |
| 2011 |
1,195,020 |
3,697,292 |
3,295,298 |
1,732,717 |
28,376,355 |
8,394,019 |
| 2012 |
1,208,964 |
3,823,728 |
3,623,001 |
1,832,903 |
29,195,895 |
8,526,425 |
| 2013 |
1,253,191 |
3,965,144 |
3,855,206 |
2,003,700 |
29,380,130 |
8,661,345 |
| 2014 |
1,314,562 |
4,091,993 |
3,992,893 |
2,216,180 |
29,997,101 |
8,798,841 |
| 2015 |
1,370,322 |
4,239,006 |
4,159,102 |
2,437,790 |
30,890,736 |
8,938,974 |
| 2016 |
1,423,726 |
4,411,124 |
4,414,051 |
2,617,634 |
31,787,580 |
9,121,167 |
| 2017 |
1,501,116 |
4,500,476 |
4,559,963 |
2,724,606 |
32,612,846 |
9,304,277 |
| 2018 |
1,503,091 |
4,621,638 |
4,601,706 |
2,760,170 |
33,413,660 |
9,366,828 |
| 2019 |
1,483,756 |
4,776,407 |
4,617,927 |
2,799,202 |
34,218,169 |
9,503,738 |
| 2020 |
1,472,204 |
4,670,713 |
4,481,042* |
2,833,679 |
35,013,414 |
9,282,410 |
| 2021 |
1,504,365 |
4,385,717 |
4,479,373 |
2,748,162 |
34,110,821 |
NA |
*: end of year figures
NA: No data available as of 4 October 2022.
Sources:
(1) Bahrain: Information and EGovernment Authority (IGA), “Documents” section, Population 2021, https://www.data.gov.bh/en/ResourceCenter
Source: administrative records (central Population Register)
(2) Kuwait: Public Authority for Civil Information (PACI), Statistics Service System, Population publications, 31/12 issues, given years
https://www.paci.gov.kw/ (inaccessible from outside Kuwait as of 20 October 2022).
(3) Oman: National Center for Statistics and Information (NCSI), data portal (2000-2020) and NCSI’s homepage, population clock (30 June 2021) https://www.ncsi.gov.om/aboutus/Pages/PopulationClock.aspx.
(4) Qatar: Planning and Statistics Authority (PSA), Population and Social Statistics 2021
https://www.psa.gov.qa/en/statistics/Statistical%20Releases/Population/Population/2021/Population_social_1_2021_AE.xls
(5) Saudi Arabia: Saudi Arabia Monetary Agency (SAMA), Yearly Statistics 2022;
Population estimates by the General Authority for Statistics (GAStat), based on the results of the Population Censuses (1974, 1992, 2004, 2010), on the Demographic Research Bulletin 2016 (2013-2017), and on administrative records: vital statistics records (births and deaths records) and im/emigration records (General Authority for Statistics)
https://www.sama.gov.sa/en-US/EconomicReports/pages/yearlystatistics.aspx.
(6) UAE: Federal Competitiveness and Statistics Centre (FCSC), “Population” section.
https://fcsc.gov.ae/en-us/Pages/Statistics/Statistics-by-Subject.aspx#/%3Fyear=&folder=Demography%20and%20Social/Population/Population&subject=Demography%20and%20Social.
Total resident population: Emiratis+foreign residents holding an UAE ID card, added to the non-resident population (seasonal workers staying less than 1 year).
https://fcsc.gov.ae/_layouts/download.aspx?SourceUrl=%2Fen-us%2FLists%2FD_StatisticsSubjectV2%2FAttachments%2F1390%2FSP-15%20Methodology%20for%20Population%20Statistics.pdf
NA: No data available for 2021 as of 4 October 2022.
Last date of access: 4 October 2022.
GLMM and GRC cannot guarantee that the link to access the source will not change; that the information will not be removed from the website it was obtained from; that no geo-blockages will be imposed; or that the information will not be available for any another reason.
| |
Bahrain |
Kuwait* |
Oman |
Qatar |
Saudi Arabia |
UAE |
| 2000 |
239,361 |
1,375,468 |
623,571 |
NA |
5,571,093 |
NA |
| 2001 |
251,702 |
1,438,819 |
651,563 |
NA |
5,703,704 |
NA |
| 2002 |
283,308 |
1,521,643 |
668,162 |
NA |
5,839,481 |
NA |
| 2003 |
318,885 |
1,618,998 |
559,257 |
NA |
5,978,502 |
NA |
| 2004 |
358,935 |
1,797,422 |
612,645 |
NA |
6,119,899 |
NA |
| 2005 |
404,018 |
1,998,972 |
666,153 |
NA |
6,475,427 |
NA |
| 2006 |
454,751 |
2,159,644 |
693,486 |
NA |
6,851,709 |
NA |
| 2007 |
511,864 |
2,345,039 |
820,802 |
NA |
7,249,962 |
NA |
| 2008 |
561,909 |
2,354,261 |
900,248 |
NA |
7,671,475 |
NA |
| 2009 |
620,404 |
2,365,970 |
1,156,358 |
NA |
8,117,611 |
NA |
| 2010 |
657,856 |
2,433,691 |
816,143 |
NA |
8,589,817 |
NA |
| 2011 |
610,332 |
2,514,107 |
1,530,437 |
NA |
8,970,670 |
NA |
| 2012 |
609,335 |
2,611,292 |
1,530,437 |
NA |
9,357,447 |
NA |
| 2013 |
638,361 |
2,722,645 |
1,683,204 |
NA |
10,170,377 |
NA |
| 2014 |
683,818 |
2,816,136 |
1,732,188 |
NA |
10,684,405 |
NA |
| 2015 |
722,487 |
2,931,401 |
1,814,156 |
NA |
11,198,097 |
NA |
| 2016 |
759,019 |
3,073,431 |
1,986,226 |
NA |
11,705,998 |
NA |
| 2017 |
823,610 |
3,130,463 |
2,054,594 |
NA |
12,185,270 |
NA |
| 2018 |
813,377 |
3,218,525 |
2,013,523 |
NA |
12,645,033 |
NA |
| 2019 |
781,929 |
3,344,362 |
1,962,815 |
NA |
13,114,971 |
NA |
| 2020 |
758,941 |
3,210,743 |
1,858,516 |
NA |
13,583,286 |
NA |
| 2021 |
785,032 |
2,897,001 |
1,712,565 |
NA |
12,420,173 |
NA |
*: end of year figures
NA: No data available as of 4 October 2022.
Sources:
(1) Bahrain: Information and EGovernment Authority (IGA), “Documents” section, Population 2021, https://www.data.gov.bh/en/ResourceCenter
Source: administrative records (central Population Register)
(2) Kuwait: Public Authority for Civil Information (PACI), Statistics Service System, Population publications, 31/12 issues, given years
https://www.paci.gov.kw/ (inaccessible from outside Kuwait as of 20 October 2022).
(3) Oman: National Center for Statistics and Information (NCSI), data portal (2000-2020) and NCSI’s homepage, population clock (30 June 2021) https://www.ncsi.gov.om/aboutus/Pages/PopulationClock.aspx.
(4) Qatar: No population data broken down by nationality.
(5) Saudi Arabia: Saudi Arabia Monetary Agency (SAMA), Yearly Statistics 2022;
Population estimates by the General Authority for Statistics (GAStat), based on the results of the Population Censuses (1974, 1992, 2004, 2010), on the Demographic Research Bulletin 2016 (2013-2017), and on administrative records: vital statistics records (births and deaths records) and im/emigration records (General Authority for Statistics)
https://www.sama.gov.sa/en-US/EconomicReports/pages/yearlystatistics.aspx.
(6) UAE: No population data broken down by nationality.
Last date of access: 4 October 2022.
GLMM and GRC cannot guarantee that the link to access the source will not change; that the information will not be removed from the website it was obtained from; that no geo-blockages will be imposed; or that the information will not be available for any another reason.
| |
Q1 |
Q2 |
Q3 |
Q4 |
| |
Saudis |
non-Saudis |
Saudis |
non-Saudis |
Saudis |
non-Saudis |
Saudis |
non-Saudis |
| Agriculture, forestry and fishing |
16,434 |
89,866 |
16,266 |
87,361 |
16,288 |
85,806 |
16,527 |
90,183 |
| Mining and quarrying |
111,099 |
64,007 |
111,003 |
62,227 |
111,765 |
61,459 |
114,420 |
62,230 |
| Manufacturing |
211,568 |
626,216 |
213,760 |
613,277 |
218,854 |
611,982 |
225,917 |
627,008 |
| Electricity, gas, steam and air conditioning supply |
40,952 |
37,403 |
41,032 |
37,410 |
41,242 |
36,521 |
41,596 |
36,533 |
| Water supply; sewerage, waste management and remediation activities |
5,122 |
18,487 |
5,272 |
18,306 |
5,336 |
17,885 |
5,567 |
18,283 |
| Construction |
311,944 |
1,803,570 |
286,699 |
1,742,895 |
290,900 |
1,705,712 |
302,768 |
1,755,671 |
| Wholesale and retail trade; repair of motor vehicles and motorcycles |
446,094 |
1,426,482 |
445,969 |
1,382,250 |
460,134 |
1,353,746 |
460,682 |
1,330,197 |
| Transportation and storage |
66,144 |
192,230 |
67,453 |
193,485 |
70,977 |
193,817 |
75,606 |
205,458 |
| Accommodation and food service activities |
78,333 |
308,053 |
74,799 |
306,689 |
79,822 |
310,997 |
115,570 |
439,731 |
| Information and communication |
40,986 |
38,608 |
41,119 |
37,643 |
42,329 |
38,492 |
44,093 |
38,056 |
| Financial and insurance activities |
63,629 |
12,839 |
64,199 |
12,611 |
64,642 |
12,549 |
65,029 |
12,895 |
| Real estate activities |
13,049 |
25,182 |
13,581 |
24,553 |
14,444 |
24,763 |
14,883 |
24,420 |
| Professional, scientific and technical activities |
44,394 |
88,617 |
44,560 |
87,325 |
46,420 |
86,903 |
49,857 |
88,300 |
| Administrative and support service activities |
139,343 |
883,841 |
131,967 |
844,057 |
138,444 |
807,982 |
140,659 |
837,078 |
| Public administration and defence; compulsory social security |
176,561 |
70,341 |
186,072 |
78,223 |
193,476 |
79,515 |
211,419 |
83,754 |
| Education |
70,741 |
62,365 |
64,313 |
58,392 |
74,797 |
60,562 |
80,054 |
60,845 |
| Human health and social work activities |
200,122 |
229,046 |
202,540 |
234,130 |
209,095 |
235,835 |
219,344 |
251,008 |
| Arts, entertainment and recreation |
8,715 |
18,432 |
9,287 |
18,837 |
10,296 |
19,029 |
10,435 |
19,557 |
| Other service activities |
41,284 |
174,281 |
42,481 |
167,529 |
43,352 |
164,890 |
43,627 |
166,359 |
| Activities of households as employer; Undifferentiated goods- and services-producing activities of households for own use |
32 |
110 |
31 |
114 |
29 |
119 |
28 |
196 |
| Activities of extraterritorial organizations and bodies |
1,052 |
404 |
1,155 |
420 |
1,208 |
419 |
1,314 |
434 |
| Other activities |
1,845 |
131,412 |
1,780 |
117,098 |
1,458 |
114,094 |
1,417 |
142,300 |
| Total |
2,089,443 |
6,301,792 |
2,065,338 |
6,124,832 |
2,135,308 |
6,023,077 |
2,240,812 |
6,290,496 |
Source: Register-based Labour Market Statistics, General Authority for Statistics (GAStat)
- Data collection methodology:
LFS were first conducted in 2001 and became bi-annual after 2006. Data were collected through nationally representative household sample surveys, which sampling was based on most recent censuses. Since 2016, Labour Force Surveys have been conducted and published on a quarterly basis, based on a household telephone survey conducted by GAStat. Employment data extracted from administrative records were also introduced as a complement to the results of Labour Force Surveys in Labour Market Statistics’ publications, starting on Q1 2017.
The present data is taken from administrative records.
Population of reference: workers subject to the rules and regulations of the General Organization of Social Insurance (GOSI):
- contributors on the job who are subject to social insurance laws and regulations in the private and government sector (outside the Civil service);
- workers who terminated their contribution to social insurance during the quarter.
Definitions and categories used by GAStat in Labour Markets Statistics (employment; unemployment;
occupation and activity sectors, etc.) are based on international standards:
For LFS methodology and definitions, see: https://www.stats.gov.sa/en/node/9787.
- Institution which provides data:
General Authority for Statistics (GAStat)
- Data availability:
Since 2021, GAStat has been publishing separately the employment data taken from administrative
records, and unemployment/inactivity data as well as general indicators, calculated from the results
of the field interviews conducted by GAStat (Labour Force Survey).
The present time-series was taken from the Register-based Labour Market Statistics- Q1 to Q4, 2021
(English and Arabic versions)
https://www.stats.gov.sa/en/814.
Last date of access: 4 October 2022.
GLMM and GRC cannot guarantee that the link to access the source will not change; that the information will not be removed from the website it was obtained from; that no geo-blockages will be imposed; or that the information will not be available for any another reason.
| |
Q1 |
Q2 |
Q3 |
Q4 |
| |
Saudis |
non-Saudis |
Saudis |
non-Saudis |
Saudis |
non-Saudis |
Saudis |
non-Saudis |
| Agriculture, forestry and fishing |
15,777 |
85,408 |
15,523 |
89,169 |
16,160 |
88,306 |
16,417 |
88,974 |
| Mining and quarrying |
116,406 |
71,271 |
115,665 |
70,528 |
115,138 |
67,183 |
112,961 |
65,101 |
| Manufacturing |
198,179 |
632,766 |
196,856 |
633,655 |
207,789 |
623,348 |
207,467 |
618,508 |
| Electricity, gas, steam and air conditioning supply |
42,348 |
47,903 |
42,108 |
44,334 |
42,001 |
41,055 |
41,324 |
39,355 |
| Water supply; sewerage, waste management and remediation activities |
4,250 |
13,119 |
4,300 |
12,912 |
4,529 |
12,547 |
4,523 |
14,722 |
| Construction |
286,942 |
2,017,134 |
284,747 |
1,994,218 |
297,040 |
1,898,155 |
287,841 |
1,838,375 |
| Wholesale and retail trade; repair of motor vehicles and motorcycles |
436,323 |
1,516,138 |
426,591 |
1,513,729 |
451,885 |
1,476,786 |
439,209 |
1,454,333 |
| Transportation and storage |
58,042 |
185,281 |
58,108 |
186,520 |
61,909 |
183,161 |
64,774 |
190,408 |
| Accommodation and food service activities |
78,610 |
338,117 |
76,979 |
338,647 |
84,896 |
335,691 |
90,309 |
342,110 |
| Information and communication |
36,481 |
36,835 |
36,060 |
36,969 |
37,395 |
36,309 |
38,980 |
36,198 |
| Financial and insurance activities |
62,458 |
12,624 |
62,177 |
12,595 |
62,663 |
12,285 |
62,709 |
12,162 |
| Real estate activities |
10,971 |
25,903 |
11,168 |
26,138 |
11,995 |
25,556 |
12,246 |
25,218 |
| Professional, scientific and technical activities |
41,326 |
102,795 |
38,242 |
102,613 |
40,240 |
94,661 |
41,810 |
91,249 |
| Administrative and support service activities |
118,057 |
976,021 |
117,488 |
970,564 |
127,326 |
935,312 |
131,458 |
898,379 |
| Public administration and defence; compulsory social security |
160,425 |
58,647 |
161,640 |
62,697 |
163,493 |
63,949 |
171,371 |
68,188 |
| Education |
87,140 |
67,932 |
73,024 |
64,789 |
71,605 |
63,805 |
71,092 |
63,320 |
| Human health and social work activities |
171,960 |
191,384 |
170,074 |
192,395 |
177,037 |
189,355 |
180,310 |
188,433 |
| Arts, entertainment and recreation |
6,719 |
17,979 |
6,699 |
17,917 |
7,565 |
17,727 |
8,381 |
18,470 |
| Other service activities |
40,399 |
181,739 |
40,417 |
181,405 |
43,363 |
177,520 |
41,404 |
176,939 |
| Activities of households as employer; Undifferentiated goods- and services-producing activities of households for own use |
2 |
6 |
6 |
21 |
5 |
39 |
15 |
62 |
| Activities of extraterritorial organizations and bodies |
953 |
394 |
977 |
396 |
988 |
394 |
1,028 |
394 |
| Other activities |
1,756 |
145,983 |
1,762 |
154,237 |
2,279 |
131,870 |
1,908 |
122,789 |
| Total |
1,975,524 |
6,725,379 |
1,940,611 |
6,706,448 |
2,027,301 |
6,475,014 |
2,027,537 |
6,353,687 |
Source: Register-based Labour Market Statistics, General Authority for Statistics (GAStat)
- Data collection methodology:
LFS were first conducted in 2001 and became bi-annual after 2006. Data were collected through nationally representative household sample surveys, which sampling was based on most recent censuses. Since 2016, Labour Force Surveys have been conducted and published on a quarterly basis, based on a household telephone survey conducted by GAStat. Employment data extracted from administrative records were also introduced as a complement to the results of Labour Force Surveys in Labour Market Statistics’ publications, starting on Q1 2017.
The present data is taken from administrative records.
Population of reference: workers subject to the rules and regulations of the General Organization of Social Insurance (GOSI):
- contributors on the job who are subject to social insurance laws and regulations in the private and government sector (outside the Civil service);
- workers who terminated their contribution to social insurance during the quarter.
Definitions and categories used by GAStat in Labour Markets Statistics (employment; unemployment;
occupation and activity sectors, etc.) are based on international standards:
For LFS methodology and definitions, see: https://www.stats.gov.sa/en/node/9787.
- Institution which provides data:
General Authority for Statistics (GAStat)
- Data availability:
Since 2021, GAStat has been publishing separately the employment data taken from administrative records, and unemployment/inactivity data as well as general indicators, calculated from the results of the field interviews conducted by GAStat (Labour Force Survey).
The present time-series was taken from the Register-based Labour Market Statistics- Q3, 2021 (English and Arabic versions)
https://www.stats.gov.sa/sites/default/files/lm_2021_q3_tables_EN.xlsx
https://www.stats.gov.sa/sites/default/files/lm_2021_q3_tables_AR.xlsx
Last date of access: 4 October 2022.
GLMM and GRC cannot guarantee that the link to access the source will not change; that the information will not be removed from the website it was obtained from; that no geo-blockages will be imposed; or that the information will not be available for any another reason.
| |
Q1 |
Q2 |
Q3 |
Q4 |
| |
Saudis |
non-Saudis |
Saudis |
non-Saudis |
Saudis |
non-Saudis |
Saudis |
non-Saudis |
| Agriculture, forestry and fishing |
15,440 |
78,631 |
14,657 |
69,409 |
14,731 |
69,738 |
14,893 |
70,347 |
| Mining and quarrying |
110,856 |
68,424 |
111,661 |
68,312 |
112,653 |
68,935 |
115,250 |
69,279 |
| Manufacturing |
196,027 |
651,455 |
194,396 |
644,590 |
192,805 |
637,782 |
195,893 |
628,843 |
| Electricity, gas, steam and air conditioning supply |
42,595 |
47,381 |
42,529 |
48,230 |
42,483 |
48,795 |
42,660 |
48,388 |
| Water supply; sewerage, waste management and remediation activities |
4,161 |
12,756 |
4,217 |
12,588 |
4,237 |
12,633 |
4,324 |
12,629 |
| Construction |
302,344 |
2,172,028 |
294,131 |
2,063,034 |
285,833 |
2,022,506 |
286,488 |
1,965,769 |
| Wholesale and retail trade; repair of motor vehicles and motorcycles |
439,844 |
1,609,401 |
434,467 |
1,565,901 |
426,727 |
1,538,336 |
430,889 |
1,506,579 |
| Transportation and storage |
56,802 |
185,349 |
56,540 |
184,687 |
56,731 |
187,680 |
57,805 |
183,592 |
| Accommodation and food service activities |
73,920 |
334,037 |
74,651 |
330,000 |
75,004 |
326,130 |
77,060 |
326,591 |
| Information and communication |
33,976 |
36,579 |
34,539 |
35,684 |
35,567 |
35,207 |
36,689 |
35,393 |
| Financial and insurance activities |
60,760 |
13,641 |
60,429 |
13,163 |
60,809 |
12,779 |
61,782 |
12,509 |
| Real estate activities |
9,865 |
26,287 |
9,892 |
25,700 |
10,226 |
25,176 |
10,659 |
24,952 |
| Professional, scientific and technical activities |
34,433 |
103,921 |
34,470 |
101,672 |
38,247 |
102,974 |
38,984 |
101,269 |
| Administrative and support service activities |
113,080 |
897,613 |
112,699 |
937,148 |
113,772 |
943,733 |
116,590 |
948,404 |
| Public administration and defence; compulsory social security |
146,996 |
44,948 |
149,285 |
44,417 |
152,695 |
45,493 |
158,175 |
54,174 |
| Education |
84,101 |
69,943 |
73,403 |
64,975 |
81,335 |
65,393 |
86,817 |
66,737 |
| Human health and social work activities |
159,549 |
176,124 |
158,306 |
173,594 |
162,060 |
178,805 |
169,483 |
182,796 |
| Arts, entertainment and recreation |
5,847 |
16,976 |
6,022 |
17,067 |
6,278 |
17,581 |
6,598 |
17,545 |
| Other service activities |
40,044 |
177,992 |
39,054 |
177,029 |
39,346 |
176,399 |
40,113 |
177,307 |
| Activities of households as employer; Undifferentiated goods- and services-producing activities of households for own use |
0 |
0 |
1 |
4 |
0 |
4 |
0 |
4 |
| Activities of extraterritorial organizations and bodies |
735 |
217 |
793 |
219 |
854 |
216 |
913 |
346 |
| Other activities |
1,737 |
16,692 |
1,681 |
31,245 |
1,697 |
37,180 |
1,705 |
49,663 |
| Total |
1,933,112 |
6,740,395 |
1,907,823 |
6,608,668 |
1,914,090 |
6,553,475 |
1,953,770 |
6,483,116 |
Source: Register-based Labour Market Statistics, General Authority for Statistics (GAStat)
- Data collection methodology:
LFS were first conducted in 2001 and became bi-annual after 2006. Data were collected through nationally representative household sample surveys, which sampling was based on most recent censuses. Since 2016, Labour Force Surveys have been conducted and published on a quarterly basis, based on a household telephone survey conducted by GAStat. Employment data extracted from administrative records were also introduced as a complement to the results of Labour Force Surveys in Labour Market Statistics’ publications, starting on Q1 2017.
The present data is taken from administrative records.
Population of reference: workers subject to the rules and regulations of the General Organization of Social Insurance (GOSI):
- contributors on the job who are subject to social insurance laws and regulations in the private and government sector (outside the Civil service);
- workers who terminated their contribution to social insurance during the quarter.
Definitions and categories used by GAStat in Labour Markets Statistics (employment; unemployment;
occupation and activity sectors, etc.) are based on international standards:
For LFS methodology and definitions, see: https://www.stats.gov.sa/en/node/9787.
- Institution which provides data:
General Authority for Statistics (GAStat)
- Data availability:
GAStat website, Labour Force section, Labour Market Statistics- Q1 to Q4, 2019 (English and Arabic versions) https://www.stats.gov.sa/en/814.
Last date of access: 4 October 2022.
GLMM and GRC cannot guarantee that the link to access the source will not change; that the information will not be removed from the website it was obtained from; that no geo-blockages will be imposed; or that the information will not be available for any another reason.
| Country |
Total population |
Nationals |
Foreign nationals |
% nationals |
% non-nationals |
| Bahrain |
1,504,365 |
719,333 |
785,032 |
47.8 |
52.2 |
| Kuwait |
4,627,674 |
1,473,261 |
3,154,413 |
31.8 |
68.2 |
| Oman |
4,479,373 |
2,766,808 |
1,712,565 |
61.8 |
38.2 |
| Qatar |
2,748,162 |
NA |
NA |
NA |
NA |
| Saudi Arabia |
34,110,821 |
21,690,648 |
12,420,173 |
63.6 |
36.4 |
| UAE |
NA |
NA |
NA |
NA |
NA |
Source: National institutes of statistics
NA: Non-Available
1- Definitions:
Non-nationals are:
1- persons bearing nationality of a foreign State other than the GCC State of residence, or bearing no proof of nationality from any given state (stateless persons and holders of refugee status and travel document in a third country);
2- Holders of residence permit residing in the given GCC country at date of census, as per definition of residence used in each of the countries.
2- Sources of data:
(1) Bahrain Open Data Portal, “Documents” section, Population 2021, https://www.data.gov.bh/en/ResourceCenter
Source: administrative records (Central Population Register)
(2) Statistics Service System, Kuwait Public Authority for Civil Information (PACI). Population, June 2021. https://www.paci.gov.kw/ (inaccessible from outside Kuwait as of 4 October 2022).
(3) National Centre for Statistical Information (NCSI). Monthly Statistical Bulletin, July 2021. https://www.ncsi.gov.om/Elibrary/Pages/LibraryContentView.aspx
(4) Qatar Planning and Statistics Authority, Population and Social Statistics 2021 (Total population estimates by sex). https://www.psa.gov.qa/en/statistics/Statistical%20Releases/Population/Population/2021/Population_social_1_2021_AE.pdf
Qatar’s statistics do not disclose the distribution of the resident population by nationality (nationals/non-nationals). No other, recent enough source was available, as of 4 October 2022, to derive an estimate of the national and non-national populations.
For estimates relevant to earlier years, please visit GLMM’s database:
https://gulfmigration.grc.net/glmm-database/demographic-and-economic-module/ .
(5) Saudi Arabia General Authority for Statistics, population estimates for mid-2021.
Population estimates are based on the results of the Population Censuses (1974, 1992, 2004, 2010), on the Demographic Research Bulletin 2016 (2013-2017), and on administrative records: vital statistics records (births and deaths records) and im/emigration records.
https://www.stats.gov.sa/en/43
https://www.stats.gov.sa/ar/43
(6) No figures of total (non-disaggregated) population available for 2021, as of 4 October 2022; Figures of UAE population disaggregated by nationality are unavailable in published sources.
For estimates relevant to earlier years, please visit GLMM’s database:
https://gulfmigration.grc.net/glmm-database/demographic-and-economic-module/.
Last date of access: 4 October 2022.
GLMM and GRC cannot guarantee that the link to access the source will not change; that the information will not be removed from the website it was obtained from; that no geo-blockages will be imposed; or that the information will not be available for any another reason.
| Country |
Total population |
Nationals |
Foreign nationals |
% nationals |
% non-nationals |
| Bahrain |
1,472,204 |
713,263 |
758,941 |
48.4 |
51.6 |
| Kuwait |
4,816,592 |
1,442,005 |
3,374,587 |
29.9 |
70.1 |
| Oman |
4,578,016 |
2,719,500 |
1,858,516 |
59.4 |
40.6 |
| Qatar |
2,833,679 |
338,000* |
2,495,679* |
11.8** |
88.2** |
| Saudi Arabia |
35,013,414 |
21,430,128 |
13,583,286 |
61.2 |
38.8 |
| UAE |
9,282,410 |
1,215,996* |
8,066,414* |
13.1** |
86.9** |
| Total |
57,996,315 |
27,858,892* |
30,137,423* |
48.0** |
52.0** |
| Source: National institutes of statistics and GLMM’s estimates based on data published by National Statistical Institutes (see below)
* GLMM’s estimate, based on data published by National Statistical Institutes (see below).
** Ratio is calculated on the basis of population estimates (see below). |
1- Definitions:
Non-nationals are:
1- persons bearing nationality of a foreign State other than the GCC State of residence, or bearing no proof of nationality from any given state (stateless persons and holders of refugee status and travel document in a third country);
2- Holders of residence permit residing in the given GCC country at date of census, as per definition of residence used in each of the countries.
Figures by nationality for Qatar and the UAE are GLMM’s estimates.
2- Sources of data:
(1) Bahrain Open Data Portal, “Documents” section, Population 2020, https://www.data.gov.bh/en/ResourceCenter
Source: administrative records (Central Population Register).
(2) Statistics Service System, Kuwait Public Authority for Civil Information (PACI). Population, June 2020.
https://www.paci.gov.kw/ (inaccessible from outside Kuwait as of 4 October 2022).
(3) National Centre for Statistical Information (NCSI). Monthly Statistical Bulletin, July 2020.
https://www.ncsi.gov.om/Elibrary/Pages/LibraryContentView.aspx
(4) Total figures of Qataris and non-Qataris residing in Qatar are not readily available in any published source.
The present figures are GLMM’s estimates, using:
- Qatar Planning and Statistics Authority, Population and Social Statistics 2020
https://www.psa.gov.qa/en/statistics/Statistical%20Releases/Population/Population/2020/Population_social_1_2020_AE.xls, which gave the total population by sex for mid-2020.
- Qatar Planning and Statistics Authority. Woman and Man in the State of Qatar-A Statistical Profile, 2020, https://www.psa.gov.qa/en/statistics/Statistical%20Releases/Social/GenrealSocialStatistics/MenWomenProfile/2020/Woman_Man_2020_EN.pdf (last available data on total national and foreign populations’ age structure, as of September 2022), which gave the percentage distribution of population by broad age group for mid-2019, by sex and nationality
- The Labour Force Survey for the second quarter of 2020
https://www.psa.gov.qa/en/statistics/Statistical%20Releases/Social/LaborForce/2020/LF_Q2_2020_AE.xlsx, which gave the numbers of Qataris and foreigners aged 15 and above for mid-2020 (Q2 2020).
These were used to estimate the number of residents aged below 15 years, by nationality.
(5) Saudi Arabia Monetary Authority. Annual Statistics 2020, table 37. Population estimates by the General Authority for Statistics (GAStat), based on the results of the Population Censuses (1974, 1992, 2004, 2010), on the Demographic Research Bulletin 2016 (2013-2017), and on administrative records: vital statistics records (births and deaths records) and im/emigration records (General Authority for Statistics).
https://www.sama.gov.sa/en-US/EconomicReports/pages/yearlystatistics.aspx.
(6) Figures of UAE population disaggregated by nationality are unavailable in published sources.
The table’s figures of Emirati and non-Emirati populations are GLMM’s estimates, based on 2019’s distribution of resident population by nationality, using:
- Federal Competitiveness and Statistics Center (FCSC). Figures of total (non-disaggregated) population for mid-years 2010 to 2020 (https://fcsc.gov.ae/en-us/Pages/Statistics/Statistics-by-Subject.aspx#/%3Fyear=&folder=Demography%20and%20Social/Population/Population&subject=Demography%20and%20Social).
UAE population figures include residents (one year and more, holding a UAE ID card), and seasonal workers, present for less than one year (see methodology in:
https://fcsc.gov.ae/_layouts/download.aspx?SourceUrl=%2Fen-us%2FLists%2FD_StatisticsSubjectV2%2FAttachments%2F1390%2FSP-15%20Methodology%20for%20Population%20Statistics.pdf
- Post-census 2005 disaggregated estimates of Emirati and non-Emirati populations, published for 2006-2009 (end of year) and 2010 (mid-year) http://original.fcsa.gov.ae/EnglishHome/ReportDetailsEnglish/tabid/121/Default.aspx?ItemId=1914&PTID=104&MenuId=1 (publication no longer available as of September 2022)
- Disaggregated figures of births and deaths (end of year figures), for the years 2009 to 2019
https://fcsc.gov.ae/en-us/Pages/Statistics/Statistics-by-Subject.aspx#/%3Ffolder=Demography%20and%20Social/Vital%20Statistics/Births%20and%20Deaths&subject=Demography%20and%20Social
The size of the Emirati population was then estimated for the period (mid-2010-mid-2019), using Emirati populations’ natural increase only (births-deaths), recalculated for the reference period of the middle of each year. These estimates of the Emirati population, therefore, do not take into account Emirati citizens’ net migration, and possible naturalisations. These are assumed to be only a few.
Estimates of the Emirati population for 2020 were calculated, using the ratio between nationals and non-nationals for 2019 (2020 vital statistics not available as of September 2022).
Estimates of non-Emirati residents were obtained by subtracting estimates of Emirati citizens from figures of total population.
Last date of access: 4 October 2022.
GLMM and GRC cannot guarantee that the link to access the source will not change; that the information will not be removed from the website it was obtained from; that no geo-blockages will be imposed; or that the information will not be available for any another reason.
| Country |
Total population |
Nationals |
Foreign nationals |
% nationals |
% non-nationals |
| Bahrain |
1,483,756 |
701,827 |
781,929 |
47.3 |
52.7 |
| Kuwait |
4,699,023 |
1,417,579 |
3,281,444 |
30.2 |
69.8 |
| Oman |
4,617,927 |
2,655,144 |
1,962,783 |
57.5 |
42.5 |
| Qatar |
2,799,202 |
331,651* |
2,467,551* |
11.8** |
88.2** |
| Saudi Arabia |
34,218,169 |
21,103,198 |
13,114,971 |
61.7 |
38.3 |
| UAE |
9,503,738 |
1,244,638* |
8,259,100* |
13.1** |
86.9** |
| Total |
57,321,815 |
27,454,037* |
29,867,778* |
47.9** |
52.1** |
| Source: National institutes of statistics and author’s calculations based on data published by National Statistical Institutes (see below)
* Our estimate, based on data published by National Statistical Institutes (see below).
** Ratio is calculated on the basis of population estimates (see below). |
1- Definition:
Non-nationals are:
1- Persons bearing nationality of a foreign State other than the GCC State of residence, or bearing no proof of nationality from any given state (stateless persons and holders of refugee status and travel document in a third country);
2- Holders of residence permit residing in the given GCC country at date of census, as per definition of residence used in each of the countries.
Figures by nationality for Qatar and the UAE are estimates.
2- Sources of data:
(1) Bahrain Open Data Portal, “Documents” section, Population 2019, https://www.data.gov.bh/en/ResourceCenter
(2) Statistics Service System, Kuwait Public Authority for Civil Information (PACI). Population, December 2018 and December 2019.
https://www.paci.gov.kw/ (inaccessible from outside Kuwait as of 4 October 2022).
The figures are estimates for mid-2019, obtained the following way: (P(12/2018)+P(12/2019))/2.
(3) National Centre for Statistical Information (NCSI). Population Statistics 2019, Issue 9, 2020.
https://www.ncsi.gov.om/Elibrary/Pages/LibraryContentView.aspx
(4) Disaggregated estimates of the numbers of 1. Qataris and 2. non-Qataris residing in Qatar are not readily available in any published source.
The present figures are GLMM’s estimates, using:
- Qatar Planning and Statistics Authority, Population and social statistics 2019
https://www.psa.gov.qa/en/statistics/Statistical%20Releases/Population/Population/2019/Population_social_1_2019_AE.xls, which gave the total resident population by sex;
- Qatar Planning and Statistics Authority. Woman and Man in the State of Qatar-A Statistical Profile, 2020, https://www.psa.gov.qa/en/statistics/Statistical%20Releases/Social/GenrealSocialStatistics/MenWomenProfile/2020/Woman_Man_2020_EN.pdf, which gave the percentage distribution of population by sex and broad age group for each nationality (Qataris and non-Qataris), by mid-2019.
- The Labour Force Survey for the second quarter of 2019
https://www.psa.gov.qa/en/statistics/Statistical%20Releases/Social/LaborForce/2019/Q2/LF_Q2_2019_AE.xlsx, which gave the numbers of Qataris and foreigners aged 15 and above by sex, for Q2 2020.
The figure for the total Qatari population obtained (Qataris aged 15 and above from Labour Force Survey Q2 2019+Qataris aged 0 to 14 years estimated from source b.) was then subtracted from the total population to obtain the figure of foreign residents.
(5) Saudi Arabia Monetary Authority. Annual Statistics 2019, table 38.
Population estimates by the General Authority for Statistics (GAStat), based on the results of the Population Censuses (1974, 1992, 2004, 2010), on the Demographic Research Bulletin 2016 (2013-2017), and on administrative records: vital statistics records (births and deaths records) and im/emigration records (General Authority for Statistics).
https://www.sama.gov.sa/en-US/EconomicReports/pages/yearlystatistics.aspx
(6) Figures of UAE resident population disaggregated by nationality (Emiratis/non-Emiratis) are unavailable in published sources.
The table’s figures are GLMM’s estimates, using:
- Federal Competitiveness and Statistics Center (FCSC). Figures of total (non-disaggregated) population for mid-years 2010 to 2019; https://fcsc.gov.ae/en-us/Pages/Statistics/Statistics-by-Subject.aspx#/%3Fyear=&folder=Demography%20and%20Social/Population/Population&subject=Demography%20and%20Social.
UAE population figures include residents (one year and more, holding a UAE ID card), and seasonal workers, present for less than one year (see methodology in: https://fcsc.gov.ae/_layouts/download.aspx?SourceUrl=%2Fen-us%2FLists%2FD_StatisticsSubjectV2%2FAttachments%2F1390%2FSP-15%20Methodology%20for%20Population%20Statistics.pdf)
- Post-census 2005 disaggregated estimates of Emirati and non-Emirati populations, published for 2006-2009 (end of year) and 2010 (mid-year)
http://original.fcsa.gov.ae/EnglishHome/ReportDetailsEnglish/tabid/121/Default.aspx?ItemId=1914&PTID=104&MenuId=1 (publication no longer available as of September 2022).
- Disaggregated figures of births and deaths (end of year figures), for the years 2009 to 2019
https://fcsc.gov.ae/en-us/Pages/Statistics/Statistics-by-Subject.aspx#/%3Ffolder=Demography%20and%20Social/Vital%20Statistics/Births%20and%20Deaths&subject=Demography%20and%20Social
The size of the Emirati population was then estimated for the period (mid-2010-mid-2019), using Emirati populations’ natural increase only (births-deaths), recalculated for the reference period of the middle of each year. The Emirati population estimates obtained for mid-2011 to mid-2019, therefore, do not take into account Emirati citizens’ net migration, and possible naturalisations. These are assumed to be only a few.
Estimates of non-Emirati residents were obtained by subtracting estimates of Emirati citizens from figures of total population.
Last date of access: 4 October 2022.
GLMM and GRC cannot guarantee that the link to access the source will not change; that the information will not be removed from the website it was obtained from; that no geo-blockages will be imposed; or that the information will not be available for any another reason.
| |
|
|
Nationals |
Non-nationals |
Total population |
% non-nationals |
| Country |
date/ period |
age group |
numbers |
% |
numbers |
% |
numbers |
% |
in each age group |
| Bahrain (1)
|
Mid-2019
|
0-14 |
216,771 |
31 |
82,378 |
11 |
299,149 |
20 |
28 |
| 15-64 |
448,356 |
64 |
692,043 |
89 |
1,140,399 |
77 |
61 |
| 65+ |
36,700 |
5 |
7,508 |
1 |
44,208 |
3 |
17 |
| Kuwait (2)
|
December 2019
|
0-14 |
492,035 |
34 |
394,255 |
12 |
886,290 |
19 |
44 |
| 15-64 |
877,753 |
61 |
2,900,582 |
87 |
3,778,335 |
79 |
77 |
| 65+ |
62,257 |
4 |
49,525 |
1 |
111,782 |
2 |
44 |
| Oman (3)
|
Mid-2019
|
0-14 |
1,004,909 |
38 |
90,599 |
5 |
1,095,508 |
24 |
8 |
| 15-64 |
1,542,141 |
58 |
1,859,672 |
95 |
3,401,813 |
74 |
55 |
| 65+ |
108,094 |
4 |
12,512 |
1 |
120,606 |
3 |
10 |
| Qatar (4)
|
End of 2019 |
0-14 |
118,883 |
37 |
270,590 |
11 |
389,473 |
14 |
69 |
| 15-64 |
193,431 |
60 |
2,174,777 |
88 |
2,368,208 |
85 |
92 |
| 65+ |
12,080 |
4 |
12,308 |
1 |
24,388 |
1 |
50 |
| Saudi Arabia (5) |
Mid-2019
|
0-14 |
NA |
NA |
NA |
NA |
8,389,963 |
25 |
NA |
| 15-64 |
NA |
NA |
NA |
NA |
24,729,055 |
72 |
NA |
| 65+ |
NA |
NA |
NA |
NA |
1,099,151 |
3 |
NA |
Sources: national institutes of statistics.
ANNEXED NOTE
Sources:
(1) Bahrain Open Data Portal, “Documents” section, Population 2019, https://www.data.gov.bh/en/ResourceCenter
(2) Statistics Service System, Kuwait Public Authority for Civil Information (PACI). Population, 31 December 2019.
https://www.paci.gov.kw/ (inaccessible from outside Kuwait as of June 2022).
(3) National Centre for Statistical Information (NCSI). Population Statistics 2019, Issue 9, 2020.
https://ncsi.gov.om/.
(4) Total figures of Qataris and non-Qataris residing in Qatar are not readily available in any published source.
The present figures are GLMM’s estimates, using:
- Qatar Planning and Statistics Authority, 2019 Annual Bulletin of Labour Force (yearly synthesis)
https://www.psa.gov.qa/en/statistics/Statistical%20Releases/Social/LaborForce/2019/Annual_Bulletin_Labour_force_2019_AE.xls
which gave the numbers of Qataris and non-Qataris aged 15 and above, by five-year age-group;
- 2020’ Woman and Man in the State of Qatar-A Statistical Profile,
https://www.psa.gov.qa/en/statistics/Statistical%20Releases/Social/GenrealSocialStatistics/MenWomenProfile/2020/Woman_Man_2020_EN.pdf
which gave the percentage distribution of population by sex and broad age group for each nationality (Qataris and non-Qataris), by mid-2019.
- These were used to estimate the number of Qataris and non-Qataris aged below 15 years.
(5) Saudi Arabia General Authority for Statistics (GAStat), population estimates for mid-2019
https://www.stats.gov.sa/en/43
NA: Not available
(data no longer disaggregated by nationality since 2018).
(6) UAE: No data available since 2005.
Last date of access: 28 September 2022.
GLMM and GRC cannot guarantee that the link to access the source will not change;
that the information will not be removed from the website it was obtained from;
that no geo-blockages will be imposed; or that the information will not be available for any another reason.
| |
|
age
group |
Nationals |
Non-nationals |
Total population |
% non-nationals |
| Country |
date/ period |
numbers |
% |
numbers |
% |
numbers |
% |
in each age group |
| Bahrain (1) |
Mid-2020
|
0-14 |
216,157 |
30 |
83,594 |
11 |
299,751 |
20 |
28 |
| 15-64 |
457,115 |
64 |
667,285 |
88 |
1,124,400 |
76 |
59 |
| 65+ |
39,991 |
6 |
8,062 |
1 |
48,053 |
3 |
17 |
| Kuwait (2) |
December 2020 |
0-14 |
492,848 |
34 |
385,242 |
12 |
878,090 |
19 |
44 |
| 15-64 |
901,429 |
62 |
2,773,026 |
86 |
3,674,455 |
79 |
75 |
| 65+ |
65,693 |
4 |
52,475 |
2 |
118,168 |
3 |
44 |
| Oman (3)
|
December 2020 |
0-14 |
1,052,012 |
38 |
137,692 |
8 |
1,189,704 |
27 |
12 |
| 15-64 |
1,579,463 |
58 |
1,591,568 |
91 |
3,171,031 |
71 |
50 |
| 65+ |
104,491 |
4 |
15,816 |
1 |
120,307 |
3 |
13 |
| Qatar (4)
|
End of 2020 |
0-14 |
124,526 |
37 |
274,213 |
11 |
398,739 |
14 |
69 |
| 15-64 |
201,684 |
59 |
2,193,981 |
88 |
2,395,665 |
85 |
92 |
| 65+ |
13,553 |
4 |
13,776 |
1 |
27,329 |
1 |
50 |
| Saudi Arabia (5)
|
Mid-2020
|
0-14 |
NA |
NA |
NA |
NA |
8,556,493 |
24 |
NA |
| 15-64 |
NA |
NA |
NA |
NA |
25,334,772 |
72 |
NA |
| 65+ |
NA |
NA |
NA |
NA |
1,122,149 |
3 |
NA |
Sources: national institutes of statistics.
ANNEXED NOTE
Sources:
- Bahrain Open Data Portal, “Documents” section, Population 2019, https://www.data.gov.bh/en/ResourceCenter
- Statistics Service System, Kuwait Public Authority for Civil Information (PACI). Population, 31 December 2020.
https://www.paci.gov.kw/ (inaccessible from outside Kuwait as of June 2022).
- National Centre for Statistical Information (NCSI). Population Statistics 2020, Issue 10, 2021.
https://www.ncsi.gov.om/Elibrary/Pages/LibraryContentView.aspx
- Total figures of Qataris and non-Qataris residing in Qatar are not readily available in any published source.
The present figures are GLMM’s estimates, using:
- Qatar Planning and Statistics Authority, Annual Bulletin of Labour Force 2020 (yearly synthesis)
https://www.psa.gov.qa/en/statistics/Statistical%20Releases/Social/LaborForce/2020/Annual_Bulletin_Labour_force_2020_AE.xlsx
which gave the numbers of Qataris and non-Qataris aged 15 and above, by five-year age-group;
- 2020’ Woman and Man in the State of Qatar-A Statistical Profile,
https://www.psa.gov.qa/en/statistics/Statistical%20Releases/Social/GenrealSocialStatistics/MenWomenProfile/2020/Woman_Man_2020_EN.pdf
which gave the percentage distribution of population by sex and broad age group for each nationality (Qataris and non-Qataris) by mid-2019.
(last available data on total national and foreign populations’ age structure, as of September 2022)
- These were used to estimate the number of Qataris and non-Qataris aged below 15 years.
- Saudi Arabia General Authority for Statistics (GAStat), population estimates for mid-2020
https://www.stats.gov.sa/en/43
(data no longer disaggregated by nationality since 2018).
NA: Not available
- UAE: No data available since 2005.
Last date of access: 28 September 2022.
GLMM and GRC cannot guarantee that the link to access the source will not change; that the information will not be removed from the website it was obtained from; that no geo-blockages will be imposed; or that the information will not be available for any another reason.
| Nationality |
Saudis |
Non-Saudis |
TOTAL |
| Age Groups |
Males |
Females |
Total |
Males |
Females |
Total |
Males |
Females |
Total |
| 0 – 4 |
1,103,151 |
1,085,223 |
2,188,374 |
260,073 |
240,984 |
501,057 |
1,363,224 |
1,326,207 |
2,689,431 |
| 5 – 9 |
1,165,051 |
1,097,326 |
2,262,377 |
369,455 |
354,872 |
724,327 |
1,534,506 |
1,452,198 |
2,986,704 |
| 10 – 14 |
1,043,917 |
1,032,094 |
2,076,011 |
321,032 |
303,024 |
624,056 |
1,364,949 |
1,335,118 |
2,700,067 |
| 15 – 19 |
951,818 |
894,816 |
1,846,634 |
290,033 |
268,582 |
558,615 |
1,241,851 |
1,163,398 |
2,405,249 |
| 20 – 24 |
1,074,376 |
998,140 |
2,072,516 |
248,511 |
230,645 |
479,156 |
1,322,887 |
1,228,785 |
2,551,672 |
| 25 – 29 |
1,041,974 |
1,026,056 |
2,068,030 |
590,908 |
423,649 |
1,014,557 |
1,632,882 |
1,449,705 |
3,082,587 |
| 30 – 34 |
936,104 |
941,473 |
1,877,577 |
827,188 |
451,181 |
1,278,369 |
1,763,292 |
1,392,654 |
3,155,946 |
| 35 – 39 |
856,123 |
821,573 |
1,677,696 |
1,361,986 |
590,636 |
1,952,622 |
2,218,109 |
1,412,209 |
3,630,318 |
| 40 – 44 |
684,143 |
673,694 |
1,357,837 |
1,366,152 |
541,376 |
1,907,528 |
2,050,295 |
1,215,070 |
3,265,365 |
| 45 – 49 |
593,073 |
560,761 |
1,153,834 |
1,091,448 |
343,523 |
1,434,971 |
1,684,521 |
904,284 |
2,588,805 |
| 50 – 54 |
474,238 |
450,961 |
925,199 |
735,903 |
131,909 |
867,812 |
1,210,141 |
582,870 |
1,793,011 |
| 55 – 59 |
377,003 |
350,308 |
727,311 |
455,271 |
79,713 |
534,984 |
832,274 |
430,021 |
1,262,295 |
| 60 – 64 |
258,833 |
245,608 |
504,441 |
252,924 |
52,188 |
305,112 |
511,757 |
297,796 |
809,553 |
| 65+ |
468,202 |
484,609 |
952,811 |
164,766 |
72,241 |
237,007 |
632,968 |
556,850 |
1,189,818 |
| Total |
11,028,006 |
10,662,642 |
21,690,648 |
8,335,650 |
4,084,523 |
12,420,173 |
19,363,656 |
14,747,165 |
34,110,821 |
Source: General Authority for Statistics (GaStat)
ANNEXED NOTE
1. Technical Notes and Definitions
Population estimates based on the results of population censuses 1974; 1992; 2004 and 2010;
on Demographic Research Bulletin 2016 (years 2013 – 2017);
and on recent administrative records: vital statistics records (births and deaths records) and im/emigration records.
https://www.stats.gov.sa/en/43
https://www.stats.gov.sa/ar/43
Reference period: middle of the year
2. Institution which provides data
General Authority for Statistics (GaStat)
http://www.stats.gov.sa/en
https://www.stats.gov.sa/ar/node
3. Data availability
General Authority for Statistics (GAStat), mid-year population estimates
https://www.stats.gov.sa/en/43
https://www.stats.gov.sa/ar/43
Last date of access: September 2022.
|
year |
Saudis |
Non-Saudis |
Total |
|
| males |
females |
total |
males |
females |
total |
males |
females |
total |
| 1974 |
3,166,013 |
2,997,792 |
6,163,805 |
517,178 |
257,219 |
774,397 |
3,683,191 |
3,255,011 |
6,938,202 |
| 1975 |
3,299,247 |
3,129,932 |
6,429,179 |
574,639 |
283,192 |
857,831 |
3,873,886 |
3,413,124 |
7,287,010 |
| 1976 |
3,436,784 |
3,266,657 |
6,703,441 |
638,241 |
311,670 |
949,911 |
4,075,025 |
3,578,327 |
7,653,352 |
| 1977 |
3,578,634 |
3,408,002 |
6,986,636 |
708,602 |
342,876 |
1,051,478 |
4,287,236 |
3,750,878 |
8,038,114 |
| 1978 |
3,724,791 |
3,553,986 |
7,278,777 |
786,393 |
377,049 |
1,163,442 |
4,511,184 |
3,931,035 |
8,442,219 |
| 1979 |
3,875,233 |
3,704,613 |
7,579,846 |
872,345 |
414,448 |
1,286,793 |
4,747,578 |
4,119,061 |
8,866,639 |
| 1980 |
4,029,922 |
3,859,872 |
7,889,794 |
967,252 |
455,350 |
1,422,602 |
4,997,174 |
4,315,222 |
9,312,396 |
| 1981 |
4,188,801 |
4,019,733 |
8,208,534 |
1,071,977 |
500,051 |
1,572,028 |
5,260,778 |
4,519,784 |
9,780,562 |
| 1982 |
4,351,793 |
4,184,148 |
8,535,941 |
1,187,454 |
548,870 |
1,736,324 |
5,539,247 |
4,733,018 |
10,272,265 |
| 1983 |
4,518,803 |
4,353,048 |
8,871,851 |
1,314,694 |
602,145 |
1,916,839 |
5,833,497 |
4,955,193 |
10,788,690 |
| 1984 |
4,689,709 |
4,526,340 |
9,216,049 |
1,454,788 |
660,237 |
2,115,025 |
6,144,497 |
5,186,577 |
11,331,074 |
| 1985 |
4,864,370 |
4,703,911 |
9,568,281 |
1,608,915 |
723,531 |
2,332,446 |
6,473,285 |
5,427,442 |
11,900,727 |
| 1986 |
5,042,619 |
4,885,623 |
9,928,242 |
1,778,342 |
792,434 |
2,570,776 |
6,820,961 |
5,678,057 |
12,499,018 |
| 1987 |
5,224,266 |
5,071,312 |
10,295,578 |
1,964,432 |
867,378 |
2,831,810 |
7,188,698 |
5,938,690 |
13,127,388 |
| 1988 |
5,409,093 |
5,260,787 |
10,669,880 |
2,168,647 |
948,820 |
3,117,467 |
7,577,740 |
6,209,607 |
13,787,347 |
| 1989 |
5,596,859 |
5,453,833 |
11,050,692 |
2,392,552 |
1,037,242 |
3,429,794 |
7,989,411 |
6,491,075 |
14,480,486 |
| 1990 |
5,787,294 |
5,650,206 |
11,437,500 |
2,637,820 |
1,133,151 |
3,770,971 |
8,425,114 |
6,783,357 |
15,208,471 |
| 1991 |
5,980,104 |
5,849,635 |
11,829,739 |
2,906,237 |
1,237,079 |
4,143,316 |
8,886,341 |
7,086,714 |
15,973,055 |
| 1992 |
6,170,757 |
6,047,443 |
12,218,200 |
3,193,111 |
1,347,068 |
4,540,179 |
9,363,868 |
7,394,511 |
16,758,379 |
| 1993 |
6,334,907 |
6,216,789 |
12,551,696 |
3,322,551 |
1,402,925 |
4,725,476 |
9,657,458 |
7,619,714 |
17,277,172 |
| 1994 |
6,488,628 |
6,375,082 |
12,863,710 |
3,397,772 |
1,440,127 |
4,837,899 |
9,886,400 |
7,815,209 |
17,701,609 |
| 1995 |
6,646,071 |
6,537,398 |
13,183,469 |
3,474,692 |
1,478,314 |
4,953,006 |
10,120,763 |
8,015,712 |
18,136,475 |
| 1996 |
6,807,325 |
6,703,837 |
13,511,162 |
3,553,349 |
1,517,511 |
5,070,860 |
10,360,674 |
8,221,348 |
18,582,022 |
| 1997 |
6,972,483 |
6,874,505 |
13,846,988 |
3,633,782 |
1,557,746 |
5,191,528 |
10,606,265 |
8,432,251 |
19,038,516 |
| 1998 |
7,141,639 |
7,049,510 |
14,191,149 |
3,716,031 |
1,599,045 |
5,315,076 |
10,857,670 |
8,648,555 |
19,506,225 |
| 1999 |
7,314,889 |
7,228,960 |
14,543,849 |
3,800,137 |
1,641,438 |
5,441,575 |
11,115,026 |
8,870,398 |
19,985,424 |
| 2000 |
7,492,332 |
7,412,968 |
14,905,300 |
3,886,141 |
1,684,952 |
5,571,093 |
11,378,473 |
9,097,920 |
20,476,393 |
| 2001 |
7,674,070 |
7,601,651 |
15,275,721 |
3,974,087 |
1,729,617 |
5,703,704 |
11,648,157 |
9,331,268 |
20,979,425 |
| 2002 |
7,860,206 |
7,795,126 |
15,655,332 |
4,064,017 |
1,775,464 |
5,839,481 |
11,924,223 |
9,570,590 |
21,494,813 |
| 2003 |
8,050,847 |
7,993,515 |
16,044,362 |
4,155,978 |
1,822,524 |
5,978,502 |
12,206,825 |
9,816,039 |
22,022,864 |
| 2004 |
8,245,575 |
8,198,412 |
16,443,987 |
4,248,335 |
1,871,564 |
6,119,899 |
12,493,910 |
10,069,976 |
22,563,886 |
| 2005 |
8,453,097 |
8,401,060 |
16,854,157 |
4,506,528 |
1,968,899 |
6,475,427 |
12,959,625 |
10,369,959 |
23,329,584 |
| 2006 |
8,663,597 |
8,606,584 |
17,270,181 |
4,780,413 |
2,071,296 |
6,851,709 |
13,444,010 |
10,677,880 |
24,121,890 |
| 2007 |
8,876,666 |
8,814,670 |
17,691,336 |
5,070,944 |
2,179,018 |
7,249,962 |
13,947,610 |
10,993,688 |
24,941,298 |
| 2008 |
9,091,249 |
9,024,301 |
18,115,550 |
5,379,132 |
2,292,343 |
7,671,475 |
14,470,381 |
11,316,644 |
25,787,025 |
| 2009 |
9,307,550 |
9,235,696 |
18,543,246 |
5,706,050 |
2,411,561 |
8,117,611 |
15,013,600 |
11,647,257 |
26,660,857 |
| 2010 |
9,575,257 |
9,201,253 |
18,776,510 |
5,956,214 |
2,503,432 |
8,459,646 |
15,531,471 |
11,704,685 |
27,236,156 |
| 2011 |
9,743,626 |
9,662,059 |
19,405,685 |
6,297,735 |
2,672,935 |
8,970,670 |
16,041,361 |
12,334,994 |
28,376,355 |
| 2012 |
9,962,431 |
9,876,017 |
19,838,448 |
6,591,296 |
2,766,151 |
9,357,447 |
16,553,727 |
12,642,168 |
29,195,895 |
| 2013 |
9,800,955 |
9,408,798 |
19,209,753 |
7,054,434 |
3,115,943 |
10,170,377 |
16,855,389 |
12,524,741 |
29,380,130 |
| 2014 |
9,844,758 |
9,467,938 |
19,312,696 |
7,373,986 |
3,310,419 |
10,684,405 |
17,218,744 |
12,778,357 |
29,997,101 |
| 2015 |
10,034,561 |
9,658,078 |
19,692,639 |
7,696,791 |
3,501,306 |
11,198,097 |
17,731,352 |
13,159,384 |
30,890,736 |
| 2016 |
10,231,364 |
9,850,218 |
20,081,582 |
8,028,355 |
3,677,643 |
11,705,998 |
18,259,719 |
13,527,861 |
31,787,580 |
| 2017 |
10,404,282 |
10,023,075 |
20,427,357 |
8,341,564 |
3,843,720 |
12,185,284 |
18,745,846 |
13,866,795 |
32,612,641 |
| 2018 |
10,575,895 |
10,192,732 |
20,768,627 |
8,665,061 |
3,979,972 |
12,645,033 |
19,240,956 |
14,172,704 |
33,413,660 |
| 2019 |
10,743,666 |
10,359,532 |
21,103,198 |
8,995,390 |
4,119,581 |
13,114,971 |
19,739,056 |
14,479,113 |
34,218,169 |
| 2020 |
10,907,568 |
10,522,560 |
21,430,128 |
9,323,857 |
4,259,429 |
13,583,286 |
20,231,425 |
14,781,989 |
35,013,414 |
| 2021 |
11,028,006 |
10,662,642 |
21,690,648 |
8,335,650 |
4,084,523 |
12,420,173 |
19,363,656 |
14,747,165 |
34,110,821 |
Source: Central Department for Statistics and Information (CDSI)/ General Authority for Statistics (GaStat)
ANNEXED NOTE
Technical notes and definitions
Population estimates based on the results of population censuses 1974; 1992; 2004 and 2010; on Demographic Research Bulletin 2016 (years 2013 – 2017), and on recent administrative records: vital statistics records (births and deaths records) and im/emigration records.
https://www.stats.gov.sa/en/43
https://www.stats.gov.sa/ar/43
Reference periods: middle of given years
Institution which provides data
Central Department of Statistics and Information (CDSI), Ministry of Economy and Planning/
General Authority for Statistics (GaStat)
http://www.stats.gov.sa/en
https://www.stats.gov.sa/ar/node
Data availability
Results of censuses conducted in 1992, 2004 and 2010 and Demographic Survey 2016 are available
on the website of the General Authority for Statistics (previously CDSI), in downloadable Excel and PDF formats.
https://www.stats.gov.sa/en/13
https://www.stats.gov.sa/ar/13
https://www.stats.gov.sa/en/4522
GaStat Statistical Yearbooks (https://www.stats.gov.sa/en/46) and yearly estimates (https://www.stats.gov.sa/en/43)
do not offer time series.
In 2019 and 2020, GAStat stopped publishing yearly estimates of population disaggregated by nationality (Saudis/non-Saudis).
Mid-year estimates of population in Saudi Arabia since 1974 (time series) are available in the website of the
Saudi Central Bank (previously: Saudi Arabia Monetary Agency) (SAMA), section “yearly statistics”
http://www.sama.gov.sa/en-US/EconomicReports/Pages/YearlyStatistics.aspx
Since 2022, data is available in the Saudi Central Bank’s portal for open data:
https://www.sama.gov.sa/en-us/economicreports/pages/database.aspx
Last date of access: September 2022.
|
Saudis |
Non-Saudis |
Total |
| 1974 |
6,163,805 |
774,397 |
6,938,202 |
| 1975 |
6,429,179 |
857,831 |
7,287,010 |
| 1976 |
6,703,441 |
949,911 |
7,653,352 |
| 1977 |
6,986,636 |
1,051,478 |
8,038,114 |
| 1978 |
7,278,777 |
1,163,442 |
8,442,219 |
| 1979 |
7,579,846 |
1,286,793 |
8,866,639 |
| 1980 |
7,889,794 |
1,422,602 |
9,312,396 |
| 1981 |
8,208,534 |
1,572,028 |
9,780,562 |
| 1982 |
8,535,941 |
1,736,324 |
10,272,265 |
| 1983 |
8,871,851 |
1,916,839 |
10,788,690 |
| 1984 |
9,216,049 |
2,115,025 |
11,331,074 |
| 1985 |
9,568,281 |
2,332,446 |
11,900,727 |
| 1986 |
9,928,242 |
2,570,776 |
12,499,018 |
| 1987 |
10,295,578 |
2,831,810 |
13,127,388 |
| 1988 |
10,669,880 |
3,117,467 |
13,787,347 |
| 1989 |
11,050,692 |
3,429,794 |
14,480,486 |
| 1990 |
11,437,500 |
3,770,971 |
15,208,471 |
| 1991 |
11,829,739 |
4,143,316 |
15,973,055 |
| 1992 |
12,218,200 |
4,540,179 |
16,758,379 |
| 1993 |
12,551,696 |
4,725,476 |
17,277,172 |
| 1994 |
12,863,710 |
4,837,899 |
17,701,609 |
| 1995 |
13,183,469 |
4,953,006 |
18,136,475 |
| 1996 |
13,511,162 |
5,070,860 |
18,582,022 |
| 1997 |
13,846,988 |
5,191,528 |
19,038,516 |
| 1998 |
14,191,149 |
5,315,076 |
19,506,225 |
| 1999 |
14,543,849 |
5,441,575 |
19,985,424 |
| 2000 |
14,905,300 |
5,571,093 |
20,476,393 |
| 2001 |
15,275,721 |
5,703,704 |
20,979,425 |
| 2002 |
15,655,332 |
5,839,481 |
21,494,813 |
| 2003 |
16,044,362 |
5,978,502 |
22,022,864 |
| 2004 |
16,443,987 |
6,119,899 |
22,563,886 |
| 2005 |
16,854,157 |
6,475,427 |
23,329,584 |
| 2006 |
17,270,181 |
6,851,709 |
24,121,890 |
| 2007 |
17,691,336 |
7,249,962 |
24,941,298 |
| 2008 |
18,115,550 |
7,671,475 |
25,787,025 |
| 2009 |
18,543,246 |
8,117,611 |
26,660,857 |
| 2010 |
18,776,510 |
8,459,646 |
27,236,156 |
| 2011 |
19,405,685 |
8,970,670 |
28,376,355 |
| 2012 |
19,838,448 |
9,357,447 |
29,195,895 |
| 2013 |
19,209,753 |
10,170,377 |
29,380,130 |
| 2014 |
19,312,696 |
10,684,405 |
29,997,101 |
| 2015 |
19,692,639 |
11,198,097 |
30,890,736 |
| 2016 |
20,081,582 |
11,705,998 |
31,787,580 |
| 2017 |
20,427,357 |
12,185,284 |
32,612,641 |
| 2018 |
20,768,627 |
12,645,033 |
33,413,660 |
| 2019 |
21,103,198 |
13,114,971 |
34,218,169 |
| 2020 |
21,430,128 |
13,583,286 |
35,013,414 |
| 2021 |
21,690,648 |
12,420,173 |
34,110,821 |
Source: General Authority for Statistics (GaStat)
ANNEXED NOTE
1. Technical Notes and Definitions
Population estimates based on the results of population censuses 1974; 1992; 2004 and 2010;
on Demographic Research Bulletin 2016 (years 2013 – 2017);
and on recent administrative records: vital statistics records (births and deaths records)
and im/emigration records.
https://www.stats.gov.sa/en/43
https://www.stats.gov.sa/ar/43
Reference periods: middle of given years
2. Institution which provides data
General Authority for Statistics (GaStat)
http://www.stats.gov.sa/en
https://www.stats.gov.sa/ar/node
3. Data availability
Results of censuses conducted in 1992, 2004 and 2010 and Demographic Survey 2016 are
available on the website of the General Authority for Statistics (previously CDSI), in
downloadable Excel and PDF formats.
https://www.stats.gov.sa/en/13
https://www.stats.gov.sa/ar/13
https://www.stats.gov.sa/en/4522
GaStat Statistical Yearbooks (https://www.stats.gov.sa/en/46) and yearly estimates
(https://www.stats.gov.sa/en/43) do not offer time series.
In 2019 and 2020, GAStat stopped publishing yearly estimates of population disaggregated by
nationality (Saudis/non-Saudis).
Mid-year estimates of population in Saudi Arabia since 1974 (time series) are available in
the website of the Saudi Central Bank (previously: Saudi Arabia Monetary Agency) (SAMA),
section “yearly statistics” (in “miscellaneous statistics”)
http://www.sama.gov.sa/en-US/EconomicReports/Pages/YearlyStatistics.aspx
Since 2022, data is available in the Saudi Central Bank’s portal for open data:
https://www.sama.gov.sa/en-us/economicreports/pages/database.aspx
Last date of access: September 2022.
|
Qataris |
non-Qataris |
Total |
| Males |
Females |
Total |
Males |
Females |
Total |
Males |
Females |
Total |
| Paid Family Worker |
0 |
0 |
0 |
5 |
45 |
50 |
5 |
45 |
50 |
| Non-paid Family Worker |
8 |
0 |
8 |
157 |
1 |
158 |
165 |
1 |
166 |
| Employee |
65,169 |
45,703 |
110,872 |
1,638,876 |
288,609 |
1,927,485 |
1,704,045 |
334,312 |
2,038,357 |
| Own Account Worker |
54 |
0 |
54 |
905 |
0 |
905 |
959 |
0 |
959 |
| Employer |
2,035 |
521 |
2,556 |
5,691 |
233 |
5,924 |
7,726 |
754 |
8,480 |
| Total |
67,266 |
46,224 |
113,490 |
1,645,634 |
288,888 |
1,934,522 |
1,712,900 |
335,112 |
2,048,012 |
Source: census 2020, PSA
ANNEXED NOTE
1. Technical Notes and Definitions
Qatar conducted population censuses in 1970, 1986, 1997, 2004, 2010, 2015 (a “simplified” census) and in 2020.
Reference period for census 2020: December 2020.
Implementation method: Census 2020 was based on administrative records, supplemented by an online self-enumeration platform,
completed with field enumeration.
Population of reference: All Qatari and non-Qatari individuals residing in the country at the time of the survey.
Classification used: ISCE.
Self-employed individuals are self-employed or with a single partner or a limited number of partners in self-employed jobs,
and no paid workers work with them continuously. It includes self-employed persons outside facilities.
(https://www.psa.gov.qa/en/statistics1/dictionary/Pages/searchresults.aspx?chapter=8).
2. Institution which provides data
Planning and Statistics Authority (PSA)
https://www.psa.gov.qa/en/Pages/default.aspx
https://www.psa.gov.qa/ar/pages/default.aspx
3. Data availability
Census 2020′ website:
https://www.psa.gov.qa/en/statistics1/StatisticsSite/Census/Census2020/Pages/default.aspx;
https://www.psa.gov.qa/ar/statistics1/statisticssite/census/census2020/pages/default.aspx
Detailed results of the Census of Population, Housing and Establishments (December 2020) (Excel and PDF formats)
https://bit.ly/cenfinalx
https://bit.ly/cenfinal
Main results of the General Census of Population, Housing and Establishments 2020
https://www.psa.gov.qa/en/statistics1/StatisticsSite/Census/census2020/res/Documents/Census_2020_Res_Summary_En.pdf
https://www.psa.gov.qa/en/statistics1/StatisticsSite/Census/census2020/res/Documents/Census_2020_Res_Summary_Ar.pdf
Date of access: August 2022.
|
Qataris |
non-Qataris |
Total |
| Males |
Females |
Total |
Males |
Females |
Total |
Males |
Females |
Total |
| Agriculture and fishing |
29 |
3 |
32 |
28,030 |
215 |
28,245 |
28,059 |
218 |
28,277 |
| Mining and quarrying |
4,442 |
1,389 |
5,831 |
25,805 |
1,697 |
27,502 |
30,247 |
3,086 |
33,333 |
| Manufacturing |
2,130 |
450 |
2,580 |
98,116 |
3,512 |
101,628 |
100,246 |
3,962 |
104,208 |
| Electricity, gas, water supply and waste management |
966 |
608 |
1,574 |
9,586 |
431 |
10,017 |
10,552 |
1,039 |
11,591 |
| Construction |
874 |
660 |
1,534 |
651,366 |
9,232 |
660,598 |
652,240 |
9,892 |
662,132 |
| Wholesale and retail trade, repair of motor vehicles |
1,165 |
421 |
1,586 |
219,840 |
22,022 |
241,862 |
221,005 |
22,443 |
243,448 |
| Transportation and storage |
1,499 |
618 |
2,117 |
121,128 |
15,619 |
136,747 |
122,627 |
16,237 |
138,864 |
| Accommodation and food service activities |
1,202 |
944 |
2,146 |
65,917 |
9,772 |
75,689 |
67,119 |
10,716 |
77,835 |
| Information and communication |
1,832 |
1,111 |
2,943 |
17,748 |
2,951 |
20,699 |
19,580 |
4,062 |
23,642 |
| Financial and insurance activities |
1,792 |
2,147 |
3,939 |
12,865 |
3,546 |
16,411 |
14,657 |
5,693 |
20,350 |
| Real estate activities |
330 |
181 |
511 |
16,783 |
1,350 |
18,133 |
17,113 |
1,531 |
18,644 |
| Professional, scientific and technical activities |
653 |
468 |
1,121 |
40,063 |
8,539 |
48,602 |
40,716 |
9,007 |
49,723 |
| Administrative and support service activities |
745 |
2,383 |
3,128 |
155,003 |
30,606 |
185,609 |
155,748 |
32,989 |
188,737 |
| Public administration and defence, compulsory social security |
43,732 |
17,027 |
60,759 |
45,378 |
4,087 |
49,465 |
89,110 |
21,114 |
110,224 |
| Education |
1,986 |
11,992 |
13,978 |
18,779 |
25,033 |
43,812 |
20,765 |
37,025 |
57,790 |
| Human health and social work activities |
2,065 |
4,945 |
7,010 |
29,741 |
36,072 |
65,813 |
31,806 |
41,017 |
72,823 |
| Arts, entertainment and recreation |
1,639 |
768 |
2,407 |
7,708 |
2,980 |
10,688 |
9,347 |
3,748 |
13,095 |
| Other service activities |
92 |
91 |
183 |
12,250 |
6,206 |
18,456 |
12,342 |
6,297 |
18,639 |
| Activities of households as employers |
0 |
0 |
0 |
65,124 |
102,116 |
167,240 |
65,124 |
102,116 |
167,240 |
| Activities of extraterritorial organizations and bodies |
93 |
18 |
111 |
4,404 |
2,902 |
7,306 |
4,497 |
2,920 |
7,417 |
| Total |
67,266 |
46,224 |
113,490 |
1,645,634 |
288,888 |
1,934,522 |
1,712,900 |
335,112 |
2,048,012 |
Source: census 2020, PSA
ANNEXED NOTE
1. Technical Notes and Definitions
Qatar conducted population censuses in 1970, 1986, 1997, 2004, 2010, 2015 (a “simplified” census) and in 2020.
Reference period for census 2020: December 2020.
Implementation method: Census 2020 was based on administrative records, supplemented by an online self-enumeration platform,
completed with field enumeration.
Population of reference: All Qatari and non-Qatari individuals residing in the country at the time of the survey.
Classification used: ISIC- Rev. 4.
2. Institution which provides data
Planning and Statistics Authority (PSA)
https://www.psa.gov.qa/en/Pages/default.aspx
https://www.psa.gov.qa/ar/pages/default.aspx
3. Data availability
Census 2020′ website:
https://www.psa.gov.qa/en/statistics1/StatisticsSite/Census/Census2020/Pages/default.aspx;
https://www.psa.gov.qa/ar/statistics1/statisticssite/census/census2020/pages/default.aspx
Detailed results of the Census of Population, Housing and Establishments (December 2020) (Excel and PDF formats)
https://bit.ly/cenfinalx
https://bit.ly/cenfinal
Main results of the General Census of Population, Housing and Establishments 2020
https://www.psa.gov.qa/en/statistics1/StatisticsSite/Census/census2020/res/Documents/Census_2020_Res_Summary_En.pdf
https://www.psa.gov.qa/en/statistics1/StatisticsSite/Census/census2020/res/Documents/Census_2020_Res_Summary_Ar.pdf
Date of access: August 2022.
|
Qataris |
non-Qataris |
Total |
| Males |
Females |
Total |
Males |
Females |
Total |
Males |
Females |
Total |
| Ministry / Government Department |
49,498 |
32,542 |
82,040 |
65,834 |
16,695 |
82,529 |
115,332 |
49,237 |
164,569 |
| Government Establishment / Company |
7,225 |
6,512 |
13,737 |
34,222 |
17,988 |
52,210 |
41,447 |
24,500 |
65,947 |
| Private |
5,270 |
3,241 |
8,511 |
1,459,967 |
147,420 |
1,607,387 |
1,465,237 |
150,661 |
1,615,898 |
| Mixed |
5,092 |
3,702 |
8,794 |
15,161 |
1,649 |
16,810 |
20,253 |
5,351 |
25,604 |
| Diplomatic / International / Regional |
93 |
18 |
111 |
4,404 |
2,902 |
7,306 |
4,497 |
2,920 |
7,417 |
| Non-Profit |
88 |
209 |
297 |
922 |
118 |
1,040 |
1,010 |
327 |
1,337 |
| Household |
0 |
0 |
0 |
65,124 |
102,116 |
167,240 |
65,124 |
102,116 |
167,240 |
| Total |
67,266 |
46,224 |
113,490 |
1,645,634 |
288,888 |
1,934,522 |
1,712,900 |
335,112 |
2,048,012 |
Source: census 2020, PSA
ANNEXED NOTE
1. Technical Notes and Definitions
Qatar conducted population censuses in 1970, 1986, 1997, 2004, 2010, 2015 (a “simplified” census) and in 2020.
Reference period for census 2020: December 2020.
Implementation method: Census 2020 was based on administrative records, supplemented by an online self-enumeration platform,
completed with field enumeration.
Population of reference: All Qatari and non-Qatari individuals residing in the country at the time of the survey.
Establishments in the mixed sector are owned jointly by the government and other parties, whether legal or natural persons.
2. Institution which provides data
Planning and Statistics Authority (PSA)
https://www.psa.gov.qa/en/Pages/default.aspx
https://www.psa.gov.qa/ar/pages/default.aspx
3. Data availability
Census 2020′ website:
https://www.psa.gov.qa/en/statistics1/StatisticsSite/Census/Census2020/Pages/default.aspx;
https://www.psa.gov.qa/ar/statistics1/statisticssite/census/census2020/pages/default.aspx
Detailed results of the Census of Population, Housing and Establishments (December 2020) (Excel and PDF formats)
https://bit.ly/cenfinalx
https://bit.ly/cenfinal
Main results of the General Census of Population, Housing and Establishments 2020
https://www.psa.gov.qa/en/statistics1/StatisticsSite/Census/census2020/res/Documents/Census_2020_Res_Summary_En.pdf
https://www.psa.gov.qa/en/statistics1/StatisticsSite/Census/census2020/res/Documents/Census_2020_Res_Summary_Ar.pdf
Date of access: August 2022.
|
Qataris |
non-Qataris |
Total |
| Males |
Females |
Total |
Males |
Females |
Total |
Males |
Females |
Total |
| Legislators, Senior Officials and Managers |
9,946 |
3,298 |
13,244 |
40,235 |
5,420 |
45,655 |
50,181 |
8,718 |
58,899 |
| Professionals |
17,586 |
21,500 |
39,086 |
157,112 |
69,535 |
226,647 |
174,698 |
91,035 |
265,733 |
| Technicians and Associate Professionals |
13,899 |
6,495 |
20,394 |
142,715 |
23,872 |
166,587 |
156,614 |
30,367 |
186,981 |
| Clerks |
21,399 |
14,561 |
35,960 |
73,324 |
23,185 |
96,509 |
94,723 |
37,746 |
132,469 |
| Service Workers and Shop and Market Sales Workers |
1,345 |
43 |
1,388 |
122,225 |
43,736 |
165,961 |
123,570 |
43,779 |
167,349 |
| Skilled Agricultural and Fishery Workers |
10 |
1 |
11 |
24,975 |
118 |
25,093 |
24,985 |
119 |
25,104 |
| Craft and Related Trades Workers |
614 |
76 |
690 |
591,863 |
3,894 |
595,757 |
592,477 |
3,970 |
596,447 |
| Plant and Machine Operators and Assemblers |
1,533 |
0 |
1,533 |
219,818 |
919 |
220,737 |
221,351 |
919 |
222,270 |
| Elementary Occupations |
934 |
250 |
1,184 |
273,367 |
118,209 |
391,576 |
274,301 |
118,459 |
392,760 |
| Total |
67,266 |
46,224 |
113,490 |
1,645,634 |
288,888 |
1,934,522 |
1,712,900 |
335,112 |
2,048,012 |
Source: census 2020, PSA
ANNEXED NOTE
1. Technical Notes and Definitions
Qatar conducted population censuses in 1970, 1986, 1997, 2004, 2010, 2015 (a “simplified” census) and in 2020.
Reference period for census 2020: December 2020.
Implementation method: Census 2020 was based on administrative records, supplemented by an online self-enumeration platform,
completed with field enumeration.
Population of reference: All Qatari and non-Qatari individuals residing in the country at the time of the survey.
Classification used: ISCO-88.
2. Institution which provides data
Planning and Statistics Authority (PSA)
https://www.psa.gov.qa/en/Pages/default.aspx
https://www.psa.gov.qa/ar/pages/default.aspx
3. Data availability
Census 2020′ website:
https://www.psa.gov.qa/en/statistics1/StatisticsSite/Census/Census2020/Pages/default.aspx;
https://www.psa.gov.qa/ar/statistics1/statisticssite/census/census2020/pages/default.aspx
Detailed results of the Census of Population, Housing and Establishments (December 2020) (Excel and PDF formats)
https://bit.ly/cenfinalx
https://bit.ly/cenfinal
Main results of the General Census of Population, Housing and Establishments 2020
https://www.psa.gov.qa/en/statistics1/StatisticsSite/Census/census2020/res/Documents/Census_2020_Res_Summary_En.pdf
https://www.psa.gov.qa/en/statistics1/StatisticsSite/Census/census2020/res/Documents/Census_2020_Res_Summary_Ar.pdf
Date of access: August 2022.
|
Households |
Labour camps |
Institutions |
Total |
| males |
females |
total |
males |
females |
total |
males |
females |
total |
males |
females |
total |
| Illiterate |
1,164 |
1,877 |
3,041 |
16,351 |
5 |
16,356 |
0 |
0 |
0 |
17,515 |
1,882 |
19,397 |
| Read and Write \ Night School |
12,547 |
8,532 |
21,079 |
164,029 |
553 |
164,582 |
51 |
0 |
51 |
176,627 |
9,085 |
185,712 |
| Primary |
25,145 |
51,726 |
76,871 |
253,998 |
6,522 |
260,520 |
41 |
2 |
43 |
279,184 |
58,250 |
337,434 |
| Preparatory \ Vocational |
97,523 |
112,539 |
210,062 |
279,183 |
15,078 |
294,261 |
122 |
4 |
126 |
376,828 |
127,621 |
504,449 |
| Secondary \ Post. Secondary |
128,794 |
132,302 |
261,096 |
302,979 |
18,573 |
321,552 |
456 |
26 |
482 |
432,229 |
150,901 |
583,130 |
| University and Above |
281,658 |
213,854 |
495,512 |
239,035 |
29,994 |
269,029 |
2,092 |
49 |
2,141 |
522,785 |
243,897 |
766,682 |
| Total |
546,831 |
520,830 |
1,067,661 |
1,255,575 |
70,725 |
1,326,300 |
2,762 |
81 |
2,843 |
1,805,168 |
591,636 |
2,396,804 |
Source: census 2020, PSA
ANNEXED NOTE
1. Technical Notes and Definitions
Qatar conducted population censuses in 1970, 1986, 1997, 2004, 2010, 2015 (a “simplified” census) and in 2020.
Reference period for census 2020: December 2020.
Implementation method: Census 2020 was based on administrative records, supplemented by an online self-enumeration platform,
completed with field enumeration.
Population of reference: All Qatari and non-Qatari individuals residing in the country at the time of the survey.
Household: a household is defined as an individual or group of individuals who may or may not be relatives. They live together and make common provisions
for food, accommodation and other essentials for living. Anyone who is usually living in the housing unit of the household under enumeration is considered
a member of that household (including the servants).
Labour camps (or Labour gatherings)
Small gatherings: A group of persons of the same gender (male of female) usually staying in the housing unit. They live as a group (collectively) but there is no
relationship between them and they do not form a living household. Their number ranges between 2 and 6 persons
Large gatherings: A group of persons of the same gender usually staying in housing units. They live as a group (collectively) but there is no relationship
between them and they do not form a living household. They are seven or more persons who usually belong to one organization (company, establishment, etc).
Institutions or public housing: It is the collective living quarters (e.g. internal wards in hospitals, dormitories for students, jails, etc.) where individuals reside
for a specific purpose. The inmates do not form a family or census household but they have common circumstances to be in public housing.
See the PSA’s “Manual of Statistical Definitions, Concepts & Terms” pertaining to the censuses:
https://www.psa.gov.qa/en/statistics1/dictionary/Pages/default.aspx.
GLMM’s elaboration, based on census 2020’s data.
2. Institution which provides data
Planning and Statistics Authority (PSA)
(https://www.psa.gov.qa/en/Pages/default.aspx;
https://www.psa.gov.qa/ar/pages/default.aspx).
3. Data availability
Census 2020′ website:
https://www.psa.gov.qa/en/statistics1/StatisticsSite/Census/Census2020/Pages/default.aspx;
https://www.psa.gov.qa/ar/statistics1/statisticssite/census/census2020/pages/default.aspx
Detailed results of the Census of Population, Housing and Establishments (December 2020) (Excel and PDF formats)
https://bit.ly/cenfinalx
https://bit.ly/cenfinal
Main results of the General Census of Population, Housing and Establishments 2020
https://www.psa.gov.qa/en/statistics1/StatisticsSite/Census/census2020/res/Documents/Census_2020_Res_Summary_En.pdf
https://www.psa.gov.qa/en/statistics1/StatisticsSite/Census/census2020/res/Documents/Census_2020_Res_Summary_Ar.pdf
Date of access: August 2022.
|
|
Qataris |
Non-Qataris |
Total |
|
Male |
Female |
Total |
Male |
Female |
Total |
Male |
Female |
Total |
| In the labour force |
Employed |
67,148 |
46,195 |
113,343 |
1,644,955 |
288,408 |
1,933,363 |
1,712,103 |
334,603 |
2,046,706 |
| Unemployed |
Unemployed Worked Before |
280 |
183 |
463 |
475 |
1,302 |
1,777 |
755 |
1,485 |
2,240 |
| Unemployed Never Worked Before |
694 |
990 |
1,684 |
381 |
479 |
860 |
1,075 |
1,469 |
2,544 |
| Paid trainee |
118 |
29 |
147 |
679 |
480 |
1,159 |
797 |
509 |
1,306 |
| Total ILF |
68,240 |
47,397 |
115,637 |
1,646,490 |
290,669 |
1,937,159 |
1,714,730 |
338,066 |
2,052,796 |
| Outside the labour force |
Student |
19,786 |
28,413 |
48,199 |
46,038 |
45,100 |
91,138 |
65,824 |
73,513 |
139,337 |
| Homemaker |
0 |
23,641 |
23,641 |
0 |
141,081 |
141,081 |
0 |
164,722 |
164,722 |
| Retired |
11,188 |
6,915 |
18,103 |
0 |
0 |
0 |
11,188 |
6,915 |
18,103 |
| Unable to work |
481 |
810 |
1,291 |
1,471 |
817 |
2,288 |
1,952 |
1,627 |
3,579 |
| Not seeking work |
617 |
998 |
1,615 |
10,857 |
5,795 |
16,652 |
11,474 |
6,793 |
18,267 |
| Total OLF |
32,072 |
60,777 |
92,849 |
58,366 |
192,793 |
251,159 |
90,438 |
253,570 |
344,008 |
| Total population |
100,312 |
108,174 |
208,486 |
1,704,856 |
483,462 |
2,188,318 |
1,805,168 |
591,636 |
2,396,804 |
Source: census 2020, PSA
ANNEXED NOTE
1. Technical Notes and Definitions
Qatar conducted population censuses in 1970, 1986, 1997, 2004, 2010, 2015 (a “simplified” census) and in 2020.
Reference period for census 2020: December 2020.
Implementation method: Census 2020 was based on administrative records, supplemented by an online self-enumeration platform,
completed with field enumeration.
Population of reference: All Qatari and non-Qatari individuals residing in the country at the time of the survey.
2. Institution which provides data
Planning and Statistics Authority (PSA)
(https://www.psa.gov.qa/en/Pages/default.aspx;
https://www.psa.gov.qa/ar/pages/default.aspx).
3. Data availability
Census 2020′ website:
https://www.psa.gov.qa/en/statistics1/StatisticsSite/Census/Census2020/Pages/default.aspx;
https://www.psa.gov.qa/ar/statistics1/statisticssite/census/census2020/pages/default.aspx
Detailed results of the Census of Population, Housing and Establishments (December 2020) (Excel and PDF formats)
https://bit.ly/cenfinalx
https://bit.ly/cenfinal
Main results of the General Census of Population, Housing and Establishments 2020
https://www.psa.gov.qa/en/statistics1/StatisticsSite/Census/census2020/res/Documents/Census_2020_Res_Summary_En.pdf
https://www.psa.gov.qa/en/statistics1/StatisticsSite/Census/census2020/res/Documents/Census_2020_Res_Summary_Ar.pdf
Date of access: August 2022.
| Age groups |
Qataris |
Non-Qataris |
Total |
| Male |
Female |
Total |
Male |
Female |
Total |
Male |
Female |
Total |
| Illiterate |
425 |
1,566 |
1,991 |
17,096 |
324 |
17,420 |
17,521 |
1,890 |
19,411 |
| Read and Write \ Night School |
10,532 |
11,864 |
22,396 |
184,250 |
14,400 |
198,650 |
194,782 |
26,264 |
221,046 |
| Primary |
16,375 |
15,694 |
32,069 |
310,477 |
88,288 |
398,765 |
326,852 |
103,982 |
430,834 |
| Preparatory \ Vocational |
18,131 |
16,316 |
34,447 |
358,697 |
111,305 |
470,002 |
376,828 |
127,621 |
504,449 |
| Secondary \ Post. Secondary |
30,973 |
40,989 |
71,962 |
401,256 |
109,912 |
511,168 |
432,229 |
150,901 |
583,130 |
| University and Above |
42,976 |
40,415 |
83,391 |
479,809 |
203,482 |
683,291 |
522,785 |
243,897 |
766,682 |
| Total |
119,412 |
126,844 |
246,256 |
1,751,585 |
527,711 |
2,279,296 |
1,870,997 |
654,555 |
2,525,552 |
Source: census 2020, PSA
ANNEXED NOTE
1. Technical Notes and Definitions
Qatar conducted population censuses in 1970, 1986, 1997, 2004, 2010, 2015 (a “simplified” census) and in 2020.
Reference period for census 2020: December 2020.
Implementation method: Census 2020 was based on administrative records, supplemented by an online self-enumeration platform,
completed with field enumeration.
Population of reference: All Qatari and non-Qatari individuals residing in the country at the time of the survey.
2. Institution which provides data
Planning and Statistics Authority (PSA)
(https://www.psa.gov.qa/en/Pages/default.aspx;
https://www.psa.gov.qa/ar/pages/default.aspx).
3. Data availability
Census 2020′ website:
https://www.psa.gov.qa/en/statistics1/StatisticsSite/Census/Census2020/Pages/default.aspx;
https://www.psa.gov.qa/ar/statistics1/statisticssite/census/census2020/pages/default.aspx
Detailed results of the Census of Population, Housing and Establishments (December 2020) (Excel and PDF formats)
https://bit.ly/cenfinalx
https://bit.ly/cenfinal
Main results of the General Census of Population, Housing and Establishments 2020
https://www.psa.gov.qa/en/statistics1/StatisticsSite/Census/census2020/res/Documents/Census_2020_Res_Summary_En.pdf
https://www.psa.gov.qa/en/statistics1/StatisticsSite/Census/census2020/res/Documents/Census_2020_Res_Summary_Ar.pdf
Date of access: August 2022.
| POPULATION AGED 15 AND ABOVE |
TOTAL POPULATION |
| Age groups |
Qataris |
Non-Qataris |
Total |
Total |
Age groups |
| Male |
Female |
Total |
Male |
Female |
Total |
Male |
Female |
Total |
Male |
Female |
Total |
| 0-15 |
NA |
NA |
NA |
NA |
NA |
NA |
NA |
NA |
NA |
15,785 |
15,151 |
30,936 |
Under 1 |
| 67,020 |
64,229 |
131,249 |
1-4 |
| 80,716 |
77,665 |
158,381 |
5-9 |
| 65,829 |
62,919 |
128,748 |
10-14 |
| 15-24 |
30,294 |
29,517 |
59,811 |
177,762 |
63,388 |
241,150 |
208,056 |
92,905 |
300,961 |
50,657 |
46,399 |
97,056 |
15-19 |
| 157,399 |
46,506 |
203,905 |
20-24 |
| 25-34 |
24,793 |
25,599 |
50,392 |
656,091 |
182,900 |
838,991 |
680,884 |
208,499 |
889,383 |
308,692 |
91,359 |
400,051 |
25-29 |
| 372,192 |
117,140 |
489,332 |
30-34 |
| 35-44 |
17,417 |
20,333 |
37,750 |
545,694 |
150,303 |
695,997 |
563,111 |
170,636 |
733,747 |
330,722 |
98,223 |
428,945 |
35-39 |
| 232,389 |
72,413 |
304,802 |
40-44 |
| 45-54 |
12,914 |
14,870 |
27,784 |
236,694 |
60,778 |
297,472 |
249,608 |
75,648 |
325,256 |
152,937 |
45,936 |
198,873 |
45-49 |
| 96,671 |
29,712 |
126,383 |
50-54 |
| 55-64 |
8,915 |
11,005 |
19,920 |
73,399 |
19,412 |
92,811 |
82,314 |
30,417 |
112,731 |
53,734 |
18,655 |
72,389 |
55-59 |
| 28,580 |
11,762 |
40,342 |
60-64 |
| 65 + |
5,979 |
6,850 |
12,829 |
15,216 |
6,681 |
21,897 |
21,195 |
13,531 |
34,726 |
11,821 |
6,281 |
18,102 |
65-69 |
| 4,987 |
3,389 |
8,376 |
70-74 |
| 4,387 |
3,861 |
8,248 |
75+ |
| Total population aged 15 + |
100,312 |
108,174 |
208,486 |
1,704,856 |
483,462 |
2,188,318 |
1,805,168 |
591,636 |
2,396,804 |
|
|
|
|
| Total population |
|
|
|
|
|
|
|
|
|
2,034,518 |
811,600 |
2,846,118 |
Total population |
Source: census 2020, PSA
ANNEXED NOTE
1. Technical Notes and Definitions
Qatar conducted population censuses in 1970, 1986, 1997, 2004, 2010, 2015 (a “simplified” census) and in 2020.
Reference period for census 2020: December 2020.
Implementation method: Census 2020 was based on administrative records, supplemented by an online self-enumeration platform,
completed with field enumeration.
Population of reference: All Qatari and non-Qatari individuals residing in the country at the time of the survey.
2. Institution which provides data
Planning and Statistics Authority (PSA)
(https://www.psa.gov.qa/en/Pages/default.aspx;
https://www.psa.gov.qa/ar/pages/default.aspx).
3. Data availability
Census 2020′ website:
https://www.psa.gov.qa/en/statistics1/StatisticsSite/Census/Census2020/Pages/default.aspx;
https://www.psa.gov.qa/ar/statistics1/statisticssite/census/census2020/pages/default.aspx
Detailed results of the Census of Population, Housing and Establishments (December 2020) (Excel and PDF formats)
https://bit.ly/cenfinalx
https://bit.ly/cenfinal
Main results of the General Census of Population, Housing and Establishments 2020
https://www.psa.gov.qa/en/statistics1/StatisticsSite/Census/census2020/res/Documents/Census_2020_Res_Summary_En.pdf
https://www.psa.gov.qa/en/statistics1/StatisticsSite/Census/census2020/res/Documents/Census_2020_Res_Summary_Ar.pdf
Date of access: August 2022.
| |
Bahrain |
Kuwait |
Oman |
Qatar |
Saudi Arabia |
UAE |
| |
Total pop. employed in private sector |
Non-nationals in private sector |
% non-nationals in private sector |
Total pop. employed in private sector |
Non-nationals in private sector |
% non-nationals in private sector |
Total pop. employed in private sector |
Non-nationals in private sector |
% non-nationals in private sector |
Total labour force in private sector |
Non-nationals in private sector |
% non-nationals in private sector |
Total pop. employed in private sector |
Non-nationals in private sector |
% non-nationals in private sector |
Total pop. employed in private sector |
| 2015 |
546,572 |
445,374 |
81.5 |
1,480,249 |
1,410,010 |
95.3 |
1,583,462 |
1,373,842 |
86.8 |
1,511,627 |
1,499,956 |
99.2 |
10,140,936 |
8,416,681 |
83.0 |
4,734,285 |
| 2016 |
611,229 |
509,062 |
83.3 |
1,580,347 |
1,509,087 |
95.5 |
1,728,019 |
1,504,936 |
87.1 |
1,602,630 |
1,592,577 |
99.4 |
10,168,137 |
8,492,965 |
83.5 |
4,851,582 |
| 2017 |
599,714 |
495,912 |
82.7 |
1,638,020 |
1,566,782 |
95.7 |
1,741,496 |
1,502,808 |
86.3 |
1,606,550 |
1,596,340 |
99.4 |
9,701,960 |
7,928,287 |
81.7 |
5,012,634 |
| 2018 |
608,220 |
503,006 |
82.7 |
1,698,528 |
1,625,589 |
95.7 |
1,687,285 |
1,435,153 |
85.1 |
1,652,818 |
1,642,498 |
99.4 |
8,599,487 |
6,895,514 |
80.2 |
4,980,272 |
| 2019 |
605,824 |
498,999 |
82.4 |
1,714,063 |
1,640,830 |
95.7 |
1,626,288 |
1,363,955 |
83.9 |
1,661,807 |
1,651,951 |
99.4 |
8,138,590 |
6,437,886 |
79.1 |
5,094,407 |
| 2020 |
564,641 |
460,022 |
81.5 |
1,567,114 |
1,494,133 |
95.3 |
1,402,961 |
1,148,207 |
81.8 |
1,710,948 |
1,702,251 |
99.5 |
8,026,901 |
6,280,145 |
78.2 |
4,799,196 |
| 2021 |
557,863 |
448,485 |
80.4 |
1,434,824 |
1,362,602 |
95.0 |
1,398,325 |
1,131,526 |
80.9 |
1,593,673 |
1,584,118 |
99.4 |
8,084,253 |
6,174,178 |
76.4 |
4,903,612 |
Sources: national institutes of statistics
1- Definitions and remarks:
Non-nationals are:
1- persons bearing nationality of a foreign State other than the GCC State of residence, or bearing no proof of nationality from any given state (stateless persons and holders of refugee status and travel document in a third country);
2- Holders of residence permit residing in the given GCC country at date of census, as per definition of residence used in each of the countries.
Employment refers to: all persons of working age (15 and above), who during a reference period worked to produce goods or provide services for pay (cash or kind) or worked for profit from their own (or partially owned) business or worked without pay in the family business or with other individuals. It also includes those who have a temporary absence from a job during the reference period due to vacation or illness or any other reason.
Figures refer to workers employed in the private sector.
Qatar: population of reference: labour force.
UAE: total population employed in private sector. Figures disaggregated by nationality are not available.
2- Sources of data:
Bahrain: Labour Market Regulation Authority (LMRA). Bahrain Labour Market Indicators (BLMI), Q4 2021,
http://blmi.lmra.bh/2021/12/data/lmr/Table_A.xlsx
Kuwait: Central Statistical Bureau. Integrated Database – LMIS, Q4 data, 2015 to 2021. https://lmis.csb.gov.kw/
Oman: Royal Oman Police in National Center for Statistics and Information (NCSI). Monthly Statistical Bulletins (December data)
https://www.ncsi.gov.om/Elibrary/Pages/LibraryContentView.aspx
Qatar: Planning and Statistics Authority. Annual Bulletins of Labour Force Sample Surveys 2015 to 2021
https://www.psa.gov.qa/en/statistics/Statistical%20Releases/Social/LaborForce/2021/Annual_Bulletin_Labour_force_2021_AE.xlsx
Saudi Arabia: General Authority for Statistics (GAStat). Labour Force Surveys 2017 to 2021, Q4 data.
https://www.stats.gov.sa/en/814
2015-2016: Saudi Arabia Central Bank (SAMA). Yearly statistics
https://www.sama.gov.sa/en-US/EconomicReports/Pages/report.aspx?cid=127
UAE: Labour Market Information System, Ministry of Human Resources and Emiratisation (MoHRE).
https://www.mohre.gov.ae/en/data-library/statistical-report.aspx
Last accessed: 4 December 2022.
GLMM and GRC cannot guarantee that the link to access the source will not change; that the information will not be removed from the website it was obtained from; that no geo-blockages will be imposed; or that the information will not be available for any another reason.
|
Employed |
% in employed population |
| Country |
population |
Nationals |
Non-nationals |
| Bahrain (Q4 2020) |
687,700 |
22.2 |
77.8 |
| Kuwait (Q4 2020) |
2,661,784 |
15.3 |
84.7 |
| Oman (end of 2020) |
1,859,657 |
23.2 |
76.8 |
| Qatar (end of 2020) |
2,128,766 |
5.2 |
94.8 |
| Saudi Arabia (Q4 2020) |
13,318,698 |
24.4 |
75.6 |
| UAE |
NA |
NA |
NA |
Sources: national institutes of statistics
1- Definitions and remarks:
Non-nationals are:
1- persons bearing nationality of a foreign State other than the GCC State of residence, or bearing
no proof of nationality from any given state
(stateless persons and holders of refugee status and travel document in a third country);
2- Holders of residence permit residing in the given GCC country at date of census, as per definition
of residence used in each of the countries.
Employment refers to: all persons of working age (15 and above), who during a reference period
worked to produce goods or provide services for pay (cash or kind) or worked for profit from their
own (or partially owned)business or worked without pay in the family business or with other
individuals. It also includes those who have a temporary absence from a job during the reference
period due to vacation or illness or any other reason.
Figures refer to workers employed in all sectors of activity (governmental, private and
domestic services).
Oman: Employment data does not include those employed in the Defense, Armed Forces,
and Police (Military) of the governmental sector.
Omani Employees in government companies and Omanis working in GCC (insure in Civil Service
Pension Fund) has been included in 2019.
Bahrain: Data retrieved from LMRA-BLMI (administrative data) differ from other sources of data
See for instance: GCC Stat. Labour Statistics for Q2 2020,
https://gccstat.org/images/gccstat/docman/publications/labour_statistics2020_1.pdf
UAE: No numbers available.
2- Sources of data:
Bahrain: Labour Market Regulation Authority (LMRA). Bahrain Labour Market Indicators (BLMI),
Q4 2020, http://blmi.lmra.bh/2020/12/mi_dashboard.xml
Kuwait: Central Statistical Bureau. Integrated Database – LMIS, Q4 2019.
https://lmis.csb.gov.kw/
Oman: National Center for Statistics and Information. Data portal, “Manpower” data, 2020.
https://data.gov.om/byvmwhe/labour-market#.
Qatar: Planning and Statistics Authority. Annual Bulletin of Labour Force Sample Survey 2020
https://www.psa.gov.qa/en/statistics/Statistical%20Releases/Social/LaborForce/2020/Annual_Bulletin_Labour_force_2020_AE.xlsx
Saudi Arabia: General Authority for Statistics (GAStat). Labour Force Survey 2020, Q4.
https://www.stats.gov.sa/en/814
Last accessed: June 2022.
|
Employed |
% in employed population |
| Country |
population |
Nationals |
Non-nationals |
| Bahrain ( Q4 2019) |
745,941 |
20.6 |
79.4 |
| Kuwait (Q4 2019) |
2,864,904 |
13.8 |
86.2 |
| Oman (end of 2019) |
2,157,807 |
21.6 |
78.4 |
| Qatar (end of 2019) |
2,107,701 |
5.1 |
94.9 |
| Saudi Arabia (Q4 2019) |
13,390,975 |
23.7 |
76.3 |
| UAE |
NA |
NA |
NA |
Sources: national institutes of statistics
1- Definitions and remarks:
Non-nationals are:
1- persons bearing nationality of a foreign State other than the GCC State of residence, or bearing
no proof of nationality from any given state
(stateless persons and holders of refugee status and travel document in a third country);
2- Holders of residence permit residing in the given GCC country at date of census, as per definition
of residence used in each of the countries.
Employment refers to: all persons of working age (15 and above), who during a reference period
worked to produce goods or provide services for pay (cash or kind) or worked for profit from their
own (or partially owned)business or worked without pay in the family business or with other
individuals. It also includes those who have a temporary absence from a job during the reference
period due to vacation or illness or any other reason.
Figures refer to workers employed in all sectors of activity (governmental, private and
domestic services).
Oman: Employment data does not include those employed in the Defense, Armed Forces,
and Police (Military) of the governmental sector.
Omani Employees in government companies and Omanis working in GCC (insure in Civil Service
Pension Fund) has been included in 2019.
Bahrain: Data retrieved from LMRA-BLMI (administrative data) differ from other sources of data
See for instance: GCC Stat. Labour Statistics for 2019,
https://www.gccstat.org/ar/statistic/publications/labor-statistics.
UAE: No numbers available.
2- Sources of data:
Bahrain: Labour Market Regulation Authority (LMRA). Bahrain Labour Market Indicators (BLMI),
Q4 2019, http://blmi.lmra.bh/2019/12/mi_dashboard.xml
Kuwait: Central Statistical Bureau. Integrated Database – LMIS, Q4 2019.
https://lmis.csb.gov.kw/
Oman: National Center for Statistics and Information. Data portal, “Manpower” data, 2019.
https://data.gov.om/byvmwhe/labour-market#.
Qatar: Planning and Statistics Authority. Annual Bulletin of Labour Force Sample Survey 2019
https://www.psa.gov.qa/en/statistics/Statistical%20Releases/Social/LaborForce/2019/Annual_Bulletin_Labour_force_2019_AE.xls
Saudi Arabia: General Authority for Statistics (GAStat). Labour Force Survey 2019, Q4.
https://www.stats.gov.sa/en/814
Last accessed: June 2022.
| Country of citizenship |
Civil service |
Private sector |
TOTAL |
| Saudi Arabia |
1,207,858 |
1,921,395 |
3,129,253 |
| Algeria |
261 |
1,717 |
1,978 |
| Bahrain |
5 |
4 |
9 |
| Egypt |
12,516 |
721,573 |
734,089 |
| Iraq |
9 |
1,281 |
1,290 |
| Jordan |
1,687 |
64,664 |
66,351 |
| Kuwait |
6 |
9 |
15 |
| Lebanon |
50 |
27,205 |
27,255 |
| Libya |
4 |
19 |
23 |
| Mauritania |
24 |
1,040 |
1,064 |
| Morocco |
83 |
15,034 |
15,117 |
| Oman |
1 |
7 |
8 |
| Palestine |
111 |
10,267 |
10,378 |
| Pal. with Jordanian travel documents |
|
29 |
29 |
| Pal. with Syrian travel documents |
|
969 |
969 |
| Pal. with Iraqi travel documents |
|
5 |
5 |
| Pal. with Lebanese travel documents |
|
1,265 |
1,265 |
| Pal. with Egyptian travel documents |
|
19,478 |
19,478 |
| Qatar |
|
3 |
3 |
| Sudan |
9,050 |
327,195 |
336,245 |
| Syria |
1,795 |
141,044 |
142,839 |
| Tunisia |
1,627 |
10,314 |
11,941 |
| UAE |
1 |
4 |
5 |
| Yemen |
630 |
738,116 |
738,746 |
| Tribes |
|
29 |
29 |
| Arab countries |
27,860 |
2,081,271 |
2,109,131 |
| Afghanistan |
7 |
65,863 |
65,870 |
| Azerbaidjan |
3 |
232 |
235 |
| Bangladesh |
397 |
1,349,451 |
1,349,848 |
| Brunei |
1 |
6 |
7 |
| Cambodia |
|
7 |
7 |
| China |
22 |
13,548 |
13,570 |
| Hong Kong |
|
1 |
1 |
| India |
7,827 |
1,225,852 |
1,233,679 |
| Indonesia |
189 |
60,937 |
61,126 |
| Iran |
|
5 |
5 |
| Japan |
2 |
257 |
259 |
| Kazakhstan |
1 |
243 |
244 |
| Kirgyzstan |
|
76 |
76 |
| Laos |
|
12 |
12 |
| Malaysia |
118 |
938 |
1,056 |
| Maldives |
|
3 |
3 |
| Myanmar |
|
4,090 |
4,090 |
| Myanmar/ holder of a Pakistani passport |
|
5,050 |
5,050 |
| Myanmar/ holder of a Bangladeshi passport |
|
4,494 |
4,494 |
| Myanmar/ resident |
|
15,418 |
15,418 |
| Nepal |
2 |
284,794 |
284,796 |
| Pakistan |
2,937 |
950,795 |
953,732 |
| Philippines |
5,572 |
315,822 |
321,394 |
| Singapore |
2 |
128 |
130 |
| South Korea |
12 |
868 |
880 |
| Sri Lanka |
6 |
40,435 |
40,441 |
| Taiwan |
|
160 |
160 |
| Tajikistan |
|
67 |
67 |
| Thailand |
1 |
798 |
799 |
| Turkey |
33 |
22,850 |
22,883 |
| Turkmenistan |
|
33 |
33 |
| Uzbekistan |
5 |
271 |
276 |
| Vietnam |
|
516 |
516 |
| Asian countries |
17,137 |
4,364,020 |
4,381,157 |
| Angola |
|
2 |
2 |
| Benin |
|
20 |
20 |
| Botswana |
|
4 |
4 |
| Burkina Faso |
|
445 |
445 |
| Burundi |
|
59 |
59 |
| Cabo Verde |
|
2 |
2 |
| Cameroon |
4 |
221 |
225 |
| Central Africa |
|
1 |
1 |
| Chad |
2 |
5,337 |
5,339 |
| Comoros |
2 |
39 |
41 |
| Congo |
|
11 |
11 |
| Djibouti |
3 |
473 |
476 |
| Equatorial Guinea |
|
1 |
1 |
| Eritrea |
1 |
13,343 |
13,344 |
| Ethiopia |
6 |
18,044 |
18,050 |
| Gabon |
|
3 |
3 |
| Gambia |
|
25 |
25 |
| Ghana |
6 |
6,378 |
6,384 |
| Guinea |
1 |
140 |
141 |
| Guinea Bissau |
|
2 |
2 |
| Ivory Coast |
3 |
145 |
148 |
| Kenya |
5 |
20,871 |
20,876 |
| Liberia |
|
8 |
8 |
| Madagascar |
|
5 |
5 |
| Malawi |
|
6 |
6 |
| Mali |
2 |
3,244 |
3,246 |
| Mauritius |
|
18 |
18 |
| Mozambique |
|
43 |
43 |
| Namibia |
|
2 |
2 |
| Niger |
|
2,058 |
2,058 |
| Nigeria |
280 |
7,775 |
8,055 |
| Rwanda |
|
90 |
90 |
| Senegal |
3 |
1,380 |
1,383 |
| Seychelles |
|
2 |
2 |
| Sierra Leone |
3 |
23 |
26 |
| Somalia |
22 |
10,846 |
10,868 |
| South Africa |
24 |
2,431 |
2,455 |
| South-Sudan |
|
15 |
15 |
| Swaziland |
|
1 |
1 |
| Tanzania |
2 |
542 |
544 |
| Togo |
1 |
12 |
13 |
| Uganda |
2 |
26,406 |
26,408 |
| Zambia |
|
139 |
139 |
| Zimbabwe |
|
216 |
216 |
| SS African countries |
372 |
120,828 |
121,200 |
| Albania |
|
58 |
58 |
| Armenia |
|
18 |
18 |
| Austria |
|
97 |
97 |
| Belarus |
|
24 |
24 |
| Belgium |
4 |
161 |
165 |
| Bosnia |
3 |
85 |
88 |
| Bulgaria |
|
32 |
32 |
| Croatia |
|
161 |
161 |
| Cyprus |
|
81 |
81 |
| Czech Republic |
1 |
57 |
58 |
| Denmark |
5 |
65 |
70 |
| Estonia |
|
7 |
7 |
| Finland |
1 |
31 |
32 |
| France |
49 |
1,594 |
1,643 |
| Georgia |
|
43 |
43 |
| Germany |
30 |
614 |
644 |
| Greece |
19 |
500 |
519 |
| Hungary |
1 |
44 |
45 |
| Iceland |
|
1 |
1 |
| Ireland |
13 |
539 |
552 |
| Italy |
6 |
828 |
834 |
| Kosovo |
|
9 |
9 |
| Latvia |
|
9 |
9 |
| Lithuania |
|
19 |
19 |
| Luxembourg |
|
3 |
3 |
| Macedonia |
|
20 |
20 |
| Malta |
|
11 |
11 |
| Moldavia |
|
3 |
3 |
| Netherlands |
4 |
338 |
342 |
| Norway |
3 |
37 |
40 |
| Poland |
1 |
191 |
192 |
| Portugal |
|
286 |
286 |
| Romania |
9 |
337 |
346 |
| Russia |
34 |
304 |
338 |
| Serbia and Montenegro |
|
74 |
74 |
| Slovakia |
|
38 |
38 |
| Slovenia |
|
7 |
7 |
| Spain |
3 |
845 |
848 |
| Sweden |
6 |
148 |
154 |
| Switzerland |
|
89 |
89 |
| UK |
203 |
8,022 |
8,225 |
| Ukraine |
2 |
365 |
367 |
| Europe |
397 |
16,195 |
16,592 |
| Argentina |
3 |
69 |
72 |
| Belize |
|
9 |
9 |
| Bolivia |
|
10 |
10 |
| Brazil |
|
254 |
254 |
| Canada |
202 |
3,450 |
3,652 |
| Chile |
|
32 |
32 |
| Colombia |
1 |
270 |
271 |
| Costa Rica |
|
10 |
10 |
| Cuba |
198 |
6 |
204 |
| Dominica |
|
47 |
47 |
| Dominican Republic |
|
6 |
6 |
| Ecuador |
|
27 |
27 |
| Guatemala |
|
7 |
7 |
| Haiti |
|
1 |
1 |
| Honduras |
|
7 |
7 |
| Jamaica |
|
85 |
85 |
| Mexico |
|
169 |
169 |
| Nicaragua |
|
1 |
1 |
| Panama |
|
18 |
18 |
| Peru |
|
43 |
43 |
| San Salvador |
|
7 |
7 |
| Surinam |
|
3 |
3 |
| Trinidad and Tobago |
|
52 |
52 |
| Uruguay |
|
3 |
3 |
| USA |
171 |
5,956 |
6,127 |
| Venezuela |
1 |
411 |
412 |
| Other |
|
87 |
87 |
| Americas |
576 |
11,040 |
11,616 |
| Australia |
45 |
954 |
999 |
| New Zealand |
7 |
145 |
152 |
| Oceania |
52 |
1,102 |
1,154 |
| Residents |
|
206 |
206 |
| Unspecified |
61 |
15 |
76 |
| Total foreign workers |
46,455 |
6,594,677 |
6,641,132 |
| Total workers |
1,254,313 |
8,516,072 |
9,770,385 |
Source: Ministry of Human Resources and Social Development (MHRSD)
ANNEXED NOTE
- Technical Notes and Definitions
Data do not include employees in the security and military sectors.
No metadata available. The administrative records used as a source of data is unmentioned.
The original dataset’s title (“Manpower in the Public sector during year 2020”), could be misleading
When compared to the results of GAStat Labour Market Statistics for Q4 of 2021, the totals of foreign workers
in the “public” sector (46,455) were closer to the LFS’s figures of foreign workers in the Civil Service (46,317),
than to the figures of foreign workers in the government sector (98,880).
It is thus likely that MHRSD’s figures of workers in the “Public” sector are referring to Civil service workers,
hence the heading of column B.
The foreign workers subscribing to the Social Insurance (GOSI) and working for the public sector are thus
not included in the figure of workers (Saudis and non-Saudis) (respectively, 330,737 Saudi and 116,318 non-Saudi workers
according to LFS Q4 2021).
The category of “resident” presumably refers to de facto refugee populations granted residency permits in Saudi
Arabia, such as some Rohingya refugees from Myanmar
(https://english.alarabiya.net/News/gulf/2017/01/25/Over-190-000-Myanmar-nationals-granted-Saudi-residency).
- Institution which provides data
Saudi Arabia: Ministry of Human Resources and Social Development (MHRSD)
- Data availability
Datasets: “Manpower in the Public sector during year 2021” (individual data)
(https://data.gov.sa/Data/ar/dataset/government-sector-employees-2021)
and “Statistics of establishments and workers in the private sector for the year 2021” .
(https://data.gov.sa/Data/ar/dataset/statistics-of-establishments-and-workers-in-the-private-sector-2021).
Ministry of Human Resources and Social Development (MHRSD), in:
MHRSD “Open data” section (https://data.gov.sa/Data/en/organization/hrsdgov?page=2).
or: Saudi government Open Data Portal – DATA.GOV.SA, Labor data.
Datasets are in Arabic only.
Last date of access: March 2022.
|
Civil service |
Private sector |
Total |
| Saudi Arabia |
1,229,830 |
1,783,462 |
3,013,292 |
| Algeria |
277 |
1,685 |
1,962 |
| Bahrain |
6 |
4 |
10 |
| Egypt |
13,429 |
715,122 |
728,551 |
| Iraq |
9 |
1,260 |
1,269 |
| Jordan |
1,815 |
63,223 |
65,038 |
| Kuwait |
7 |
10 |
17 |
| Lebanon |
50 |
24,455 |
24,505 |
| Libya |
4 |
18 |
22 |
| Mauritania |
24 |
972 |
996 |
| Morocco |
85 |
14,042 |
14,127 |
| Oman |
3 |
7 |
10 |
| Palestine |
122 |
10,164 |
10,286 |
| Pal. with Jordanian travel documents |
|
25 |
25 |
| Pal. with Syrian travel documents |
|
944 |
944 |
| Pal. with Iraqi travel documents |
|
6 |
6 |
| Pal. with Lebanese travel documents |
|
1,247 |
1,247 |
| Pal. with Egyptian travel documents |
|
18,461 |
18,461 |
| Qatar |
|
3 |
3 |
| Sudan |
9,146 |
306,048 |
315,194 |
| Syria |
1,852 |
141,479 |
143,331 |
| Tunisia |
1,622 |
9,368 |
10,990 |
| UAE |
1 |
4 |
5 |
| Yemen |
672 |
682,857 |
683,529 |
| Tribes |
|
28 |
28 |
| Arab countries |
29,124 |
1,991,432 |
2,020,556 |
| Afghanistan |
10 |
66,128 |
66,138 |
| Azerbaidjan |
4 |
145 |
149 |
| Bangladesh |
417 |
1,213,847 |
1,214,264 |
| Brunei |
1 |
4 |
5 |
| Cambodia |
|
7 |
7 |
| China |
27 |
13,443 |
13,470 |
| Hong Kong |
|
2 |
2 |
| India |
8,090 |
1,337,126 |
1,345,216 |
| Indonesia |
194 |
72,628 |
72,822 |
| Iran |
|
5 |
5 |
| Japan |
2 |
300 |
302 |
| Kazakhstan |
1 |
226 |
227 |
| Kirgyzstan |
|
52 |
52 |
| Laos |
|
12 |
12 |
| Malaysia |
139 |
1,008 |
1,147 |
| Maldives |
|
3 |
3 |
| Myanmar |
|
4,187 |
4,187 |
| Myanmar/ holder of a Pakistani passport |
|
5,175 |
5,175 |
| Myanmar/ holder of a Bangladeshi passport |
|
4,611 |
4,611 |
| Myanmar/ resident |
|
15,924 |
15,924 |
| Nepal |
2 |
253,900 |
253,902 |
| Pakistan |
3,055 |
1,005,099 |
1,008,154 |
| Philippines |
5,772 |
329,496 |
335,268 |
| Singapore |
3 |
122 |
125 |
| South Korea |
13 |
799 |
812 |
| Sri Lanka |
9 |
41,735 |
41,744 |
| Taiwan |
|
159 |
159 |
| Tajikistan |
|
55 |
55 |
| Thailand |
1 |
824 |
825 |
| Turkey |
39 |
25,933 |
25,972 |
| Turkmenistan |
|
38 |
38 |
| Uzbekistan |
4 |
156 |
160 |
| Vietnam |
|
619 |
619 |
| Asian countries |
17,783 |
4,393,768 |
4,411,551 |
| Benin |
|
20 |
20 |
| Botswana |
|
3 |
3 |
| Burkina Faso |
|
470 |
470 |
| Burundi |
|
63 |
63 |
| Cabo Verde |
|
5 |
5 |
| Cameroon |
4 |
199 |
203 |
| Chad |
2 |
4,896 |
4,898 |
| Comoros |
3 |
42 |
45 |
| Congo |
|
6 |
6 |
| Djibouti |
6 |
470 |
476 |
| Equatorial Guinea |
|
1 |
1 |
| Eritrea |
1 |
13,191 |
13,192 |
| Ethiopia |
7 |
18,914 |
18,921 |
| Gabon |
|
3 |
3 |
| Gambia |
|
21 |
21 |
| Ghana |
7 |
5,344 |
5,351 |
| Guinea |
1 |
152 |
153 |
| Guinea Bissau |
|
3 |
3 |
| Ivory Coast |
2 |
152 |
154 |
| Kenya |
5 |
7,929 |
7,934 |
| Liberia |
|
11 |
11 |
| Madagascar |
|
6 |
6 |
| Mali |
2 |
3,054 |
3,056 |
| Mauritius |
|
16 |
16 |
| Mozambique |
|
44 |
44 |
| Namibia |
|
2 |
2 |
| Niger |
|
1,887 |
1,887 |
| Nigeria |
266 |
6,087 |
6,353 |
| Rwanda |
|
25 |
25 |
| Senegal |
3 |
1,083 |
1,086 |
| Seychelles |
|
2 |
2 |
| Sierra Leone |
3 |
25 |
28 |
| Somalia |
25 |
10,846 |
10,871 |
| South Africa |
23 |
2,398 |
2,421 |
| South-Sudan |
|
18 |
18 |
| Swaziland |
|
1 |
1 |
| Tanzania |
2 |
512 |
514 |
| Togo |
1 |
9 |
10 |
| Uganda |
2 |
9,970 |
9,972 |
| Zambia |
|
96 |
96 |
| Zimbabwe |
|
189 |
189 |
| SS African countries |
365 |
88,165 |
88,530 |
| Albania |
|
50 |
50 |
| Armenia |
|
10 |
10 |
| Austria |
|
84 |
84 |
| Belarus |
|
19 |
19 |
| Belgium |
4 |
161 |
165 |
| Bosnia |
3 |
72 |
75 |
| Bulgaria |
|
34 |
34 |
| Croatia |
|
167 |
167 |
| Cyprus |
|
86 |
86 |
| Czech Republic |
3 |
59 |
62 |
| Denmark |
5 |
62 |
67 |
| Estonia |
|
2 |
2 |
| Finland |
1 |
28 |
29 |
| France |
51 |
1,517 |
1,568 |
| Georgia |
|
39 |
39 |
| Germany |
32 |
598 |
630 |
| Greece |
19 |
472 |
491 |
| Hungary |
1 |
37 |
38 |
| Iceland |
|
1 |
1 |
| Ireland |
17 |
536 |
553 |
| Italy |
7 |
783 |
790 |
| Kosovo |
|
14 |
14 |
| Latvia |
|
6 |
6 |
| Lithuania |
|
16 |
16 |
| Luxembourg |
|
3 |
3 |
| Macedonia |
|
22 |
22 |
| Malta |
|
12 |
12 |
| Moldavia |
|
3 |
3 |
| Netherlands |
9 |
317 |
326 |
| Norway |
3 |
33 |
36 |
| Poland |
2 |
175 |
177 |
| Portugal |
|
265 |
265 |
| Romania |
9 |
367 |
376 |
| Russia |
38 |
251 |
289 |
| Serbia and Montenegro |
|
59 |
59 |
| Slovakia |
|
46 |
46 |
| Slovenia |
|
7 |
7 |
| Spain |
3 |
796 |
799 |
| Sweden |
9 |
144 |
153 |
| Switzerland |
|
82 |
82 |
| UK |
229 |
7,906 |
8,135 |
| Ukraine |
2 |
222 |
224 |
| Europe |
447 |
15,563 |
16,010 |
| Argentina |
3 |
52 |
55 |
| Belize |
|
10 |
10 |
| Bolivia |
|
10 |
10 |
| Brazil |
1 |
230 |
231 |
| Canada |
212 |
3,497 |
3,709 |
| Chile |
|
25 |
25 |
| Colombia |
1 |
247 |
248 |
| Costa Rica |
|
8 |
8 |
| Cuba |
207 |
3 |
210 |
| Dominica |
|
33 |
33 |
| Dominican Republic |
|
4 |
4 |
| Ecuador |
|
22 |
22 |
| Guatemala |
|
7 |
7 |
| Haiti |
|
1 |
1 |
| Honduras |
|
3 |
3 |
| Jamaica |
|
89 |
89 |
| Mexico |
|
159 |
159 |
| Nicaragua |
|
1 |
1 |
| Panama |
|
|
0 |
| Peru |
|
23 |
23 |
| San Salvador |
|
9 |
9 |
| Surinam |
|
3 |
3 |
| Trinidad and Tobago |
|
54 |
54 |
| Uruguay |
|
4 |
4 |
| USA |
192 |
6,690 |
6,882 |
| Venezuela |
1 |
435 |
436 |
| Other |
|
67 |
67 |
| Americas |
617 |
11,686 |
12,303 |
| Australia |
48 |
960 |
1,008 |
| New Zealand |
8 |
140 |
148 |
| Oceania |
56 |
1,100 |
1,156 |
| Residents |
|
216 |
216 |
| Unspecified |
56 |
25 |
81 |
| Total foreign workers |
48,448 |
6,501,955 |
6,550,403 |
| Total workers |
1,278,278 |
8,285,417 |
9,563,695 |
Source: Ministry of Human Resources and Social Development (MHRSD)
ANNEXED NOTE
- Technical Notes and Definitions
Data do not include employees in the security and military sectors.
No metadata available. The administrative records used as a source of data is unmentioned.
The original dataset’s title (“Manpower in the Public sector during year 2020”), could be misleading.
When compared to the results of GAStat Labour Market Statistics for Q4 of 2020, the totals of foreign workers
in the “public” sector (48,448) were closer to the LFS’s figures of foreign workers in the Civil Service (48,874),
than to the figures of foreign workers in the government sector (122,416).
It is thus likely that MHRSD’s figures of workers in the “Public” sector are referring to Civil service workers,
hence the heading of column B.
The foreign workers subscribing to the Social Insurance (GOSI) and working for the public sector are thus
not included in the figure of workers (Saudis and non-Saudis) (respectively, 280,781 Saudi and 73,542 non-Saudi workers
according to LFS Q4 2020).
The category of “resident” presumably refers to de facto refugee populations granted residency permits in Saudi
Arabia, such as some Rohingya refugees from Myanmar
(https://english.alarabiya.net/News/gulf/2017/01/25/Over-190-000-Myanmar-nationals-granted-Saudi-residency).
- Institution which provides data
Saudi Arabia: Ministry of Human Resources and Social Development (MHRSD)
- Data availability
Datasets: “Manpower in the government sector during year 2020” (individual data)
(https://data.gov.sa/Data/ar/dataset/manpower-in-public-sector-during-year-2020)
and “Statistics of establishments and workers in the private sector for the year 2020” .
(https://data.gov.sa/Data/ar/dataset/statistics-of-establishments-and-workers-in-the-private-sector-for-the-year-2020).
Ministry of Human Resources and Social Development (MHRSD), in:
MHRSD “Open data” section (https://data.gov.sa/Data/en/organization/hrsdgov?page=2).
or: Saudi government Open Data Portal – DATA.GOV.SA, Labor data.
Datasets are in Arabic only.
Last date of access: March 2022.
|
Country (date)
|
Total
population
|
Nationals |
Foreign
nationals
|
%
nationals
|
% non-
nationals
|
| Bahrain (17 March 2020) |
1,501,635 |
712,362 |
789,273 |
47.4 |
52.6 |
| Kuwait (December 2020) |
4,670,713 |
1,459,970 |
3,210,743 |
31.3 |
68.7 |
| Oman (12 December 2020) |
4,471,148 |
2,731,456 |
1,739,692 |
61.1 |
38.9 |
| Qatar (17 March 2020) |
2,846,118 |
328,985* |
2,517,133* |
11.6** |
88.4** |
| Saudi Arabia (mid-2020) |
35,013,414 |
21,430,128 |
13,583,286 |
61.2 |
38.8 |
| UAE (mid-2019) |
9,503,738 |
1,244,638* |
8,259,100* |
13.1** |
86.9** |
| Total*** |
58,006,766 |
27,907,539 |
30,099,227 |
48.1** |
51.9** |
Source: National institutes of statistics and author’s calculations based on data published by National Statistical Institutes (see below)
* Our estimate, based on data published by National Statistical Institutes (see below).
** Ratio is calculated on the basis of population estimates (see below).
*** Total provides the sum and ratio of population numbers at different dates. It is not exactly the total population at any of these dates.
1- Definition:
Non-nationals are:
1. Persons bearing nationality of a foreign State other than the GCC State of residence, or bearing
no proof of nationality from any given state (stateless persons and holders of refugee status and
travel document in a third country);
2. Holders of residence permit residing in the given GCC country at date of census, as per the
definition of residence used in each of the countries.
Figures by nationality for Qatar and the UAE are GLMM estimates.
2- Sources of data:
(1) Information & eGovernment Authority, Bahrain census 2020, Population section, https://www.data.gov.bh/en/ResourceCenter
(2) Statistics Service System, Kuwait Public Authority for Civil Information (PACI). Population, 31 December 2020. https://www.paci.gov.kw/ (inaccessible from outside Kuwait as of 16 November 2021).
(3) Oman National Centre for Statistical Information (NCSI). E-census 2020 portal, Population datasets https://portal.ecensus.gov.om/(Inaccessible as of 28 January 2022). https://www.ncsi.gov.om/Elibrary/Pages/LibraryContentDetails.aspx?ItemID=STjrcjTsBi81Z3Q3b3E%2Brg%3D%3D
(4) Total figures of Qataris and non-Qataris residing in Qatar are not readily available in any published source.
The present figures are GLMM’s estimates, using:
a. Qatar Planning and Statistics Authority, Main Results of the General Census of Population, Housing and Establishments 2020 https://www.psa.gov.qa/en/statistics/Statistical%20Releases/Population/Population/2020 which gave the numbers of Qatari males and females aged 15 and above;
b. 2020’ Woman and Man in the State of Qatar-A Statistical Profile, https://www.psa.gov.qa/en/statistics/Statistical%20Releases/Social/GenrealSocialStatistics/MenWomenProfile/2020/Woman_Man_2020_EN.pdf which gave the percentage distribution of population by sex and broad age group for each nationality (Qataris and non-Qataris) by mid-2019 (last available data on total national and foreign populations’ age structure, as of July 2021).
c. These were used to estimate the number of Qataris aged below 15 years. The figure for the total Qatari population obtained (Qataris aged 15 and above from census 2020+Qataris aged 0 to 14 years estimated from source b.) was then substracted from the total population counted during census 2020, to obtain the figure of foreign residents.
(5) Saudi Arabia Central Bank (SAMA). Annual Statistics 2020 , table 37. Population estimates based on the results of the population censuses (1974, 1992, 2004, 2010), and population estimates based on Demographic Research Bulletin 2016 from year 2013, General Authority for Statistics (GAStat) – https://www.sama.gov.sa/en-US/EconomicReports/pages/yearlystatistics.aspx
(6) Figures of UAE population disaggregated by nationality are unavailable in published sources.
The table’s figures are GLMM’s estimates, using:
a. Figures of total (non-disaggregated) population for mid-years 2010 to 2019, published by FCSC; https://fcsc.gov.ae/en-us/Pages/Statistics/Statistics-by Subject.aspx#/%3Fyear=&folder=Demography%20and%20Social/Population/Population&subject=Demography%20and%20Social. UAE population figures include residents (one year and more, holding a UAE ID card), and seasonal workers, present for less than one year (see methodology in: https://fcsc.gov.ae/_layouts/download.aspx?SourceUrl=%2Fen- us%2FLists%2FD_StatisticsSubjectV2%2FAttachments%2F1390%2FSP-15%20Methodology%20for%20Population%20Statistics.pdf
b. Post-census 2005 disaggregated estimates of Emirati and non-Emirati populations, published for 2006-2009 (end of year) and 2010 (mid-year) (publication no longer available as of December 2021) http://original.fcsa.gov.ae/EnglishHome/ReportDetailsEnglish/tabid/121/Default.aspx?ItemId=1914&PTID=104&MenuId=1
c. Disaggregated figures of births and deaths (end of year figures), for the years 2009 to 2019 (2020 vital statistics not available as of 22 November 2021) – https://fcsa.gov.ae/en-us/Pages/Statistics/Statistics-by-Subject.aspx#/%3Ffolder=Demography%20and%20Social/Vital%20Statistics/Births%20and%20Deaths&subject=Demography%20and%20Social
The size of the Emirati population was then estimated for the period (mid-2010-mid-2019), using Emirati populations’ natural increase only (births-deaths), recalculated for the reference period of the middle of each year. The Emirati population estimates obtained for mid-2011 to mid-2019, therefore, do not take into account Emirati citizens’ net migration, and possible naturalisations. These are assumed to be only a few. Estimates of non-Emirati residents were obtained by substracting estimates of Emirati citizens from figures of total population.
|
Saudis |
Non-Saudis |
Total |
|
Males |
Females |
Total |
Males |
Females |
Total |
Males |
Females |
Total |
| 2017 Q1 |
2,021,865 |
1,017,080 |
3,038,945 |
9,859,039 |
991,153 |
10,850,192 |
11,880,904 |
2,008,233 |
13,889,137 |
| 2017 Q2 |
2,029,786 |
1,022,663 |
3,052,449 |
9,777,916 |
1,010,793 |
10,788,709 |
11,807,702 |
2,033,456 |
13,841,158 |
| 2017 Q3 |
2,035,745 |
1,027,999 |
3,063,744 |
9,674,729 |
1,019,591 |
10,694,320 |
11,710,474 |
2,047,590 |
13,758,064 |
| 2017 Q4 |
2,080,601 |
1,083,245 |
3,163,846 |
9,442,163 |
975,132 |
10,417,295 |
11,522,764 |
2,058,377 |
13,581,141 |
| 2018 Q1 |
2,067,976 |
1,082,433 |
3,150,409 |
9,231,869 |
951,235 |
10,183,104 |
11,299,845 |
2,033,668 |
13,333,513 |
| 2018 Q2 |
2,053,189 |
1,072,154 |
3,125,343 |
8,927,862 |
964,861 |
9,892,723 |
10,981,051 |
2,037,015 |
13,018,066 |
| 2018 Q3 |
2,043,585 |
1,066,402 |
3,109,987 |
8,622,890 |
955,165 |
9,578,055 |
10,666,475 |
2,021,567 |
12,688,042 |
| 2018 Q4 |
2,040,742 |
1,070,457 |
3,111,199 |
8,356,943 |
1,072,476 |
9,429,419 |
10,397,685 |
2,142,933 |
12,540,618 |
| 2019 Q1 |
2,036,142 |
1,075,887 |
3,112,029 |
8,458,199 |
1,195,013 |
9,653,212 |
10,494,341 |
2,270,900 |
12,765,241 |
| 2019 Q2 |
2,027,964 |
1,062,284 |
3,090,248 |
8,529,419 |
1,237,365 |
9,766,784 |
10,557,383 |
2,299,649 |
12,857,032 |
| 2019 Q3 |
2,023,910 |
1,076,902 |
3,100,812 |
8,572,339 |
1,254,757 |
9,827,096 |
10,596,249 |
2,331,659 |
12,927,908 |
| 2019 Q4 |
2,054,858 |
1,115,414 |
3,170,272 |
8,792,516 |
1,428,187 |
10,220,703 |
10,847,374 |
2,543,601 |
13,390,975 |
| 2020 Q1 |
2,066,553 |
1,136,870 |
3,203,423 |
9,092,998 |
1,339,191 |
10,432,189 |
11,159,551 |
2,476,061 |
13,635,612 |
| 2020 Q2 |
2,055,767 |
1,115,655 |
3,171,422 |
9,101,286 |
1,357,746 |
10,459,032 |
11,157,053 |
2,473,401 |
13,630,454 |
| 2020 Q3 |
2,100,702 |
1,152,574 |
3,253,276 |
8,866,940 |
1,334,922 |
10,201,862 |
10,967,642 |
2,487,496 |
13,455,138 |
| 2020 Q4 |
2,079,331 |
1,172,867 |
3,252,198 |
8,753,985 |
1,312,515 |
10,066,500 |
10,833,316 |
2,485,382 |
13,318,698 |
| 2021 Q1 |
2,081,446 |
1,225,152 |
3,306,598 |
8,773,896 |
1,403,319 |
10,177,215 |
10,855,342 |
2,628,471 |
13,483,813 |
| 2021 Q2 |
2,098,831 |
1,181,183 |
3,280,014 |
8,449,536 |
1,170,338 |
9,619,874 |
10,548,367 |
2,351,521 |
12,899,888 |
| 2021 Q3 |
2,127,551 |
1,215,287 |
3,342,838 |
8,244,566 |
1,118,241 |
9,362,807 |
10,372,117 |
2,333,528 |
12,705,645 |
Source: Register-based Labour Market Statistics, General Authority for Statistics (GAStat)
1. Data collection methodology
LFS were first conducted in 2001 and became bi-annual after 2006. Data were collected through
nationally-representative household sample surveys, which sampling was based on most recent
censuses. Since 2016, Labour Force Surveys have been conducted and published on a quarterly basis,
based on a household telephone survey conducted by GAStat. Employment data extracted from
administrative records were also introduced as a complement to the results of Labour Force Surveys
in Labour Market Statistics’ publications, starting on Q1 2017.
The present data is taken from administrative records.
GAStat Labour Market Statistics: administrative records
Estimates of figures and characteristics of employment in Saudi Arabia are taken from administrative
records from the following institutions:
– Ministry of Human Resources and Social Development (MHRSD)
(formerly Ministry of Labour and Social Development):
Supplies data on Government sector’s workers.
– General Organization of Social Insurance (GOSI):
Supplies data on:
1. contributors on the job who are subject to social insurance laws and regulations in the private
and government sector;
2. workers who terminated their contribution to social insurance during the quarter.
– National Information Center (NIC):
Supplies data on domestic workers.
Definitions and categories used by GAStat in Labour Markets Statistics (employment; unemployment;
occupation and activity sectors, etc.) are based on international standards:
For LFS methodology and definitions, see: https://www.stats.gov.sa/en/node/9787.
2. Institution which provides data
General Authority for Statistics (GAStat)
3. Data availability
Since 2021, GAStat has been publishing separately the employment data taken from administrative
records, and unemployment/inactivity data as well as general indicators, calculated from the results
of the field interviews conducted by GAStat (Labour Force Survey).
The present time-series was taken from the Register-based Labour Market Statistics- Q3, 2021
(English and Arabic versions)
https://www.stats.gov.sa/sites/default/files/lm_2021_q3_tables_EN.xlsx
https://www.stats.gov.sa/sites/default/files/lm_2021_q3_tables_AR.xlsx
Date of access: January 2022.
POP 3.3. Saudi Arabia: Labour Force Participation rates by nationality (Saudi /non-Saudi) and sex (%, Q1 2017 – Q3 2021)
|
|
|
|
|
|
|
|
|
|
|
|
Saudis |
Non-Saudis |
Total |
|
Males |
Females |
Total |
Males |
Females |
Total |
Males |
Females |
Total |
| 2017 Q1 |
61.90 |
17.40 |
40.30 |
94.10 |
29.20 |
75.60 |
78.00 |
20.90 |
55.10 |
| 2017 Q2 |
62.10 |
17.40 |
40.30 |
94.00 |
21.60 |
73.40 |
78.20 |
18.70 |
54.20 |
| 2017 Q3 |
62.60 |
17.80 |
40.70 |
93.80 |
24.90 |
74.20 |
78.40 |
19.90 |
54.80 |
| 2017 Q4 |
63.40 |
19.40 |
41.90 |
94.20 |
24.20 |
74.20 |
79.00 |
20.90 |
55.60 |
| 2018 Q1 |
63.50 |
19.50 |
41.90 |
93.60 |
24.50 |
73.90 |
78.80 |
21.00 |
55.50 |
| 2018 Q2 |
63.50 |
19.60 |
42.00 |
93.90 |
29.00 |
75.50 |
79.00 |
22.40 |
56.20 |
| 2018 Q3 |
63.50 |
19.70 |
42.00 |
93.90 |
29.70 |
75.70 |
79.00 |
22.70 |
56.40 |
| 2018 Q4 |
63.00 |
20.20 |
42.00 |
93.80 |
25.90 |
74.50 |
78.70 |
21.90 |
55.90 |
| 2019 Q1 |
63.30 |
20.50 |
42.30 |
94.10 |
27.40 |
75.30 |
79.10 |
22.60 |
56.40 |
| 2019 Q2 |
66.00 |
23.20 |
45.00 |
94.10 |
26.90 |
75.20 |
80.40 |
24.30 |
57.90 |
| 2019 Q3 |
67.00 |
23.20 |
45.50 |
94.50 |
27.60 |
75.60 |
81.10 |
24.50 |
58.40 |
| 2019 Q4 |
66.60 |
26.00 |
46.70 |
93.60 |
28.80 |
75.20 |
80.40 |
26.80 |
58.80 |
| 2020 Q1 |
65.80 |
25.90 |
46.20 |
94.40 |
24.20 |
74.50 |
80.40 |
25.40 |
58.20 |
| 2020 Q2 |
65.60 |
31.40 |
48.80 |
91.80 |
28.70 |
73.90 |
78.90 |
30.60 |
59.40 |
| 2020 Q3 |
66.00 |
31.30 |
49.00 |
92.40 |
26.90 |
73.80 |
79.40 |
30.00 |
59.50 |
| 2020 Q4 |
68.50 |
33.20 |
51.20 |
92.40 |
29.30 |
74.50 |
80.60 |
32.10 |
61.00 |
| 2021 Q1 |
66.20 |
32.30 |
49.50 |
93.00 |
36.90 |
77.10 |
79.70 |
33.60 |
61.10 |
| 2021 Q2 |
65.70 |
32.40 |
49.40 |
92.30 |
37.20 |
76.70 |
79.20 |
33.80 |
60.80 |
| 2021 Q3 |
65.00 |
34.10 |
49.80 |
91.40 |
40.10 |
76.90 |
78.30 |
35.90 |
61.20 |
Source: Labour Force Survey, in: Labour Market Statistics, General Authority for Statistics (GAStat)
|
1. Data collection methodology
LFS were first conducted in 2001 and became bi-annual after 2006. Data were collected through nationally
representative household sample surveys, which sampling was based on most recent censuses.
Since 2016, Labour Force Surveys have been conducted and published on a quarterly basis, based on a
household telephone survey conducted by GAStat. Employment data extracted from administrative
records were also introduced as a complement to the results of Labour Force Surveys in Labour Market
Statistics’ publications, starting on Q1 2017.
The present data is based on estimates drawn from the results of the quarterly Labour Force Survey.
LFS results are published as rates only. Numerical estimates are unavailable.
GAStat Labour Market Statistics: Labour Force Survey (household telephone survey conducted by GAStat)
Sample size: 53,360 households, from all administrative regions of Saudi Arabia.
Population covered: residents in Saudi Arabia, Saudis and non-Saudis. All household members, including
The survey provides estimates of the size of the total and working-age populations (aged 15 years and
above), inside and outside the labour force. It highlights the characteristics of the labour force (employed
and unemployed populations), and supplies the data to calculate key indicators of labour market such as
the unemployment and the labour force participation rates.
Household survey questionnaire: https://www.stats.gov.sa/sites/default/files/2021_Q3_LFS%20Questionnaire_EN%2022-08-2021.pdf.
Definitions: Population in the labour force:
Individuals (15 years and above) who contribute or are ready to contribute to the production of
commodities and services during the reference period of the survey. The labour force includes the
employed and unemployed populations.
Population outside the labour force:
Individuals (15 years and above) who is not classified as part of the labour force because they do not
work, do not seek a job, are unable to work, or are not ready to work during the survey reference period.
For example: Students, housewives, retired persons who do not work, individuals unable or unwilling to
work, or who do not look for a job for other reasons.
Labour force participation rate = (total labour force ÷ total population of working age (aged 15 years and over)) x 100
Definitions and categories used by GAStat in Labour Markets Statistics (employment; unemployment;
occupation and activity sectors, etc.) are based on international standards.
For LFS methodology and definitions, see: https://www.stats.gov.sa/en/node/9787.
2. Institution which provides data
General Authority for Statistics (GAStat)
Since 2021, GAStat has been publishing separately the employment data taken from administrative
records, and unemployment/inactivity data as well as general indicators, calculated from the results of
the field interviews conducted by GAStat (Labour Force Survey).
The present time-series was taken from the Labour Market Statistics- Q3, 2021
(English and Arabic versions)
https://www.stats.gov.sa/sites/default/files/LM%20tables_Q3_2021_EN.xlsx
https://www.stats.gov.sa/sites/default/files/LMS%20Q03%202021E-Final_0.pdf
https://www.stats.gov.sa/sites/default/files/LM%20tables_Q3_2021_AR_0.xlsx
https://www.stats.gov.sa/sites/default/files/LMS%20Q03%202021A-Final_2.pdf
Date of access: January 2022.
|
Saudis |
Non-Saudis |
Total |
| Males |
Females |
Total |
Males |
Females |
Total |
Males |
Females |
Total |
| 2017 Q1 |
7.20 |
33.00 |
12.70 |
0.50 |
2.10 |
0.70 |
3.20 |
20.30 |
5.80 |
| 2017 Q2 |
7.40 |
33.10 |
12.80 |
0.70 |
3.30 |
0.90 |
3.30 |
22.90 |
6.00 |
| 2017 Q3 |
7.40 |
32.70 |
12.80 |
0.40 |
1.60 |
0.50 |
3.20 |
21.10 |
5.80 |
| 2017 Q4 |
7.50 |
31.00 |
12.80 |
0.50 |
2.50 |
0.70 |
3.20 |
21.10 |
6.00 |
| 2018 Q1 |
7.60 |
30.90 |
12.90 |
0.70 |
2.60 |
0.90 |
3.40 |
21.00 |
6.10 |
| 2018 Q2 |
7.60 |
31.10 |
12.90 |
0.50 |
2.50 |
0.70 |
3.30 |
20.00 |
6.00 |
| 2018 Q3 |
7.50 |
30.90 |
12.80 |
0.60 |
3.10 |
0.90 |
3.30 |
19.90 |
6.00 |
| 2018 Q4 |
6.60 |
32.50 |
12.70 |
0.60 |
4.40 |
1.00 |
2.90 |
22.60 |
6.00 |
| 2019 Q1 |
6.60 |
31.70 |
12.50 |
0.40 |
2.50 |
0.60 |
2.80 |
21.00 |
5.70 |
| 2019 Q2 |
6.00 |
31.10 |
12.30 |
0.20 |
0.90 |
0.30 |
2.50 |
21.00 |
5.60 |
| 2019 Q3 |
5.80 |
30.80 |
12.00 |
0.20 |
1.00 |
0.30 |
2.50 |
20.70 |
5.50 |
| 2019 Q4 |
4.90 |
30.80 |
12.00 |
0.30 |
1.30 |
0.40 |
2.20 |
21.30 |
5.70 |
| 2020 Q1 |
5.60 |
28.20 |
11.80 |
0.40 |
2.00 |
0.50 |
2.50 |
20.70 |
5.70 |
| 2020 Q2 |
8.10 |
31.40 |
15.40 |
2.30 |
9.50 |
3.10 |
4.70 |
25.30 |
9.00 |
| 2020 Q3 |
7.90 |
30.20 |
14.90 |
1.90 |
9.10 |
2.70 |
4.40 |
24.60 |
8.50 |
| 2020 Q4 |
7.10 |
24.40 |
12.60 |
1.70 |
9.10 |
2.60 |
4.00 |
20.20 |
7.40 |
| 2021 Q1 |
7.20 |
21.20 |
11.70 |
1.30 |
5.50 |
1.90 |
3.70 |
16.10 |
6.50 |
| 2021 Q2 |
6.10 |
22.30 |
11.30 |
1.80 |
6.30 |
2.40 |
3.50 |
17.10 |
6.60 |
| 2021 Q3 |
5.90 |
21.90 |
11.30 |
1.50 |
7.40 |
2.40 |
3.30 |
17.10 |
6.60 |
Source: Labour Force Survey, in: Labour Market Statistics, General Authority for Statistics (GAStat)
1. Data collection methodology
LFS were first conducted in 2001 and became bi-annual after 2006. Data were collected through
nationally-representative household sample surveys, which sampling was based on most recent
censuses. Since 2016, Labour Force Surveys have been conducted and published on a quarterly basis,
based on a household telephone survey conducted by GAStat. Employment data extracted from
administrative records were also introduced as a complement to the results of Labour Force Surveys
in Labour Market Statistics’ publications, starting on Q1 2017.
The present data is based on estimates drawn from the results of the quarterly Labour Force Survey.
LFS results are published as rates only. Numerical estimates are unavailable.
GAStat Labour Market Statistics: Labour Force Survey (household telephone survey conducted by
GAStat)
Sample size: 53,360 households, from all administrative regions of Saudi Arabia.
Population covered: residents in Saudi Arabia, Saudis and non-Saudis. All household members,
including domestic workers.
The survey provides estimates of the size of the total and working-age populations (aged 15 years
and above), inside and outside the labour force. It highlights the characteristics of the labour force
(employed and unemployed populations), and supplies the data to calculate key indicators of
labour market such as the unemployment and the labour force participation rates.
Household survey questionnaire:
https://www.stats.gov.sa/sites/default/files/2021_Q3_LFS%20Questionnaire_EN%2022-08-2021.pdf.
Definitions:
– Unemployed individuals:
Individuals (15 years and above) who were:
- Without a job in the week preceding the household contact.
- Seriously looking for work during the four weeks prior to contacting the family. This includes those
who did not search for work during the four weeks prior to the survey because they were waiting to
find work, or to establish their own business during the next period, providing they searched for
a job before the reference period.
- People who were able to work and ready to join whenever necessary during the week preceding
the household contact or the following two weeks.
– Unemployed individuals who have been working:
Unemployed individuals (15 years and above) who had been working, then left their jobs for any
reason, and who during the time reference were: unemployed, seriously seeking a job and ready
to start working.
Unemployment rate= (number of unemployed individuals ÷ total labour force) x 100
Definitions and categories used by GAStat in Labour Markets Statistics (employment;
unemployment; occupation and activity sectors, etc.) are based on international standards:
For LFS methodology and definitions, see: https://www.stats.gov.sa/en/node/9787.
2. Institution which provides data
General Authority for Statistics (GAStat)
3. Data availability
Since 2021, GAStat has been publishing separately the employment data taken from
administrative records, and unemployment/inactivity data as well as general indicators,
calculated from the results of the field interviews conducted by GAStat (Labour Force Survey).
The present time-series was taken from the Labour Market Statistics- Q3, 2021
(English and Arabic versions)
https://www.stats.gov.sa/sites/default/files/LM%20tables_Q3_2021_EN.xlsx
https://www.stats.gov.sa/sites/default/files/LMS%20Q03%202021E-Final_0.pdf
https://www.stats.gov.sa/sites/default/files/LM%20tables_Q3_2021_AR_0.xlsx
https://www.stats.gov.sa/sites/default/files/LMS%20Q03%202021A-Final_2.pdf
Date of access: January 2022.
|
|
Net departures |
| 2017 |
Q1 |
66,000 |
| Q2 |
120,000 |
| Q3 |
140,000 |
| Q4 |
275,000 |
| Total |
600,000 |
| 2018 |
Q1 |
221,000 |
| Q2 |
312,000 |
| Q3 |
265,000 |
| Q4 |
200,000 |
| Total |
1,000,000 |
| 2019 |
Q1 |
185,000 |
| Q2 |
132,000 |
| Q3 |
56,000 |
Source: Jadwa Investment Labour Market Reports
1. Definitions
Jadwa Investment is a Saudi Closed Joint Stock Company with headquarters in Riyadh.
Using official data such as GAStat’s data, Ministry of Labour’s employment figures and other sources
(among which General Organisation for Social Insurance (GOSI)), Jadwa Investment has been publishing yearly
analyses of the Saudi labour market, which became quarterly since 2017.
2. Institution which provides data
Jadwa Investment (http://www.jadwa.com/en; http://www.jadwa.com/ar)
3. Data availability
Estimates are quoted in the various issues of the Saudi Labour Market Reports and Updates
published by Jadwa.
http://www.jadwa.com/en/researchsection/research/economic-research/labor-market-reports
Last date of access: December 2019.
| year |
private sector |
government sector |
domestic sector |
Total |
| 2004 |
423,172 |
24,821 |
355,395 |
803,388 |
| 2005 |
352,924 |
32,034 |
339,985 |
724,943 |
| 2006 |
716,347 |
42,149 |
441,247 |
1,199,743 |
| 2007 |
1,141,601 |
51,935 |
445,106 |
1,638,642 |
| 2008 |
1,191,204 |
70,924 |
495,885 |
1,758,013 |
| 2009 |
932,494 |
61,143 |
496,092 |
1,489,729 |
| 2010 |
1,061,717 |
68,297 |
565,537 |
1,695,551 |
| 2011 |
1,181,911 |
110,223 |
647,796 |
1,939,930 |
| 2012 |
1,586,532 |
125,909 |
828,425 |
2,540,866 |
| 2013 |
950,252 |
57,007 |
714,593 |
1,721,852 |
| 2014 |
1,574,504 |
104,466 |
847,927 |
2,526,897 |
| 2015 |
1,973,391 |
78,882 |
995,930 |
3,048,203 |
| 2016 |
1,403,731 |
142,824 |
1,173,500 |
2,720,055 |
| 2017 Q1 |
146,561 |
12,288 |
155,643 |
314,492 |
| 2017 Q2 |
191,584 |
9,739 |
185,499 |
386,822 |
| 2017 Q3 |
203,021 |
113,661 |
192,498 |
509,180 |
| 2017 Q4 |
177,669 |
17,711 |
212,085 |
407,465 |
| 2017 |
718,835 |
153,399 |
745,725 |
1,617,959 |
| 2018 Q1 |
105,987 |
14,352 |
221,128 |
341,467 |
| 2018 Q2 |
199,529 |
14,170 |
180,854 |
394,553 |
| 2018 Q3 |
87,502 |
7,258 |
156,558 |
251,318 |
| 2018 Q4 |
221,081 |
12,021 |
168,179 |
401,281 |
| 2018 |
614,099 |
47,801 |
726,719 |
1,388,619 |
| 2019 Q1 |
143,685 |
17,686 |
229,457 |
390,828 |
| 2019 Q2 |
307,510 |
22,880 |
222,040 |
552,430 |
| 2019 Q3 |
348,883 |
16,769 |
240,788 |
606,440 |
Source: Ministry of Labour and Social Development
1. Definitions
The labour visa allows the worker to enter Saudi Arabia. It is issued by the Ministry of Foreign Affairs.
In order to employ workers from abroad, the sponsoring company must first file a “Block Visa” request with the Ministry of Labor, requesting pre-approval to sponsor foreign employees.
Once the Block Visa request is approved, the sponsoring company in Saudi Arabia should obtain a visa authorization number and an electronic power of attorney
authorized by the Ministry of Foreign Affairs in Saudi Arabia.
Foreign nationals may then apply for work visas through Saudi consular posts in their country of residence. Several documents are required before issuance of work visas, including medical certificate.
Therefore, 1. work visas reflect a given year/quarter’s new entries of workers to Saudi Arabia and 2. work visas issued are more than the workers effectively entering the country a given year/ quarter,
as some eventually do not terminate the procedure, or are rejected at a later stage (entry visa; residency procedures…).
2. Institution which provides data
Ministry of Labour, now Ministry of Labour and Social Development (MLSD) (https://mlsd.gov.sa/en/node)
3. Data availability
Until 2015, the data was published in Ministry of Labour’s Statistical Yearbooks
MoL’s Yearbooks until 2015 are no longer available on MLSD’s website.
MLSD’s Yearbook for 2016 has the figure of work visas issued that year:
https://mlsd.gov.sa/sites/default/files/uploads/v.26%20%D8%A7%D9%84%D8%AA%D9%82%D8%B1%D9%8A%D8%B1%20%D8%A7%D9%84%D8%B3%D9%86%D9%88%D9%8A%202016.pdf
Quarterly figures for 2017, 2018 and 2019 are published in the Labour Force Surveys:
https://www.stats.gov.sa/en/814
Last date of access: December 2019.
|
Agri., Forest, Hunting & Fishing |
Mines, Oil, Gas & Quarries |
Manufacturing industries |
Electricity, Gas & Water |
Construction |
Retails & Hotels |
Transports & Storage |
Finance, Insurance, Real estate services & Businesses |
Collective, Social, & Personal services |
Other activities |
TOTAL |
| 2015 |
163,090 |
3,256 |
127,122 |
1,877 |
1,034,460 |
220,309 |
48,076 |
22,905 |
316,985 |
93,211 |
2,031,291 |
| 2016 |
79,551 |
1,922 |
83,494 |
973 |
759,137 |
159,761 |
36,042 |
7,956 |
274,303 |
574 |
1,403,713 |
| 2017 |
46,530 |
672 |
41,575 |
180 |
323,611 |
46,424 |
6,120 |
1,732 |
221,889 |
30,102 |
718,835 |
| 2018 |
54,877 |
1,847 |
33,368 |
275 |
238,877 |
40,843 |
13,156 |
3,916 |
167,453 |
2,713 |
557,325 |
Source: Ministry of Labour and Social Development/ GAStat
1. Definitions
The labour visa allows the worker to enter Saudi Arabia. It is issued by the Ministry of Foreign Affairs.
In order to employ workers from abroad, the sponsoring company must first file a “Block Visa” request with the Ministry of Labor, requesting pre-approval to sponsor foreign employees.
Once the Block Visa request is approved, the sponsoring company in Saudi Arabia should obtain a visa authorization number and an electronic power of attorney
authorized by the Ministry of Foreign Affairs in Saudi Arabia.
Foreign nationals may then apply for work visas through Saudi consular posts in their country of residence. Several documents are required before issuance of work visas, including medical certificate.
Therefore, 1. work visas reflect a given year/quarter’s new entries of workers to Saudi Arabia and 2. work visas issued are more than the workers effectively entering the country a given year/ quarter,
as some eventually do not terminate the procedure, or are rejected at a later stage (entry visa; residency procedures…).
Totals of visas issued per year may differ slightly between publications, due to variations in the periods of reference taken (Hijri vs Gregorian years).
2. Institution which provides data
Ministry of Labour, now Ministry of Labour and Social Development (MLSD)
3. Data availability
The present data is published in the General Authority for Statistics’ (GAStat) Statistical Yearbook 2018, chapter 11 “Labour and Social Security” https://www.stats.gov.sa/en/258
Last date of access: December 2019.
|
|
|
2013 |
2014 |
2015 |
2016 |
2017 |
| Bahrain |
nationals |
males |
64.0 |
64.1 |
63.4 |
63.2 |
63.2 |
| females |
32.2 |
32.3 |
32.3 |
32.2 |
32.2 |
| non-nationals |
males |
98.1 |
97.6 |
97.9 |
97.8 |
97.8 |
| females |
58.7 |
57.2 |
58.2 |
58.2 |
58.2 |
| Kuwait |
nationals |
males |
56.3 |
54.2 |
52.6 |
47.7 |
47.7 |
| females |
40.3 |
37.6 |
39.3 |
30.8 |
30.8 |
| non-nationals |
males |
84.8 |
94.2 |
95.3 |
95.5 |
95.5 |
| females |
58.6 |
61.3 |
65.8 |
65.5 |
65.5 |
| Oman |
nationals |
males |
n.a. |
n.a. |
n.a. |
n.a. |
n.a. |
| females |
n.a. |
n.a. |
n.a. |
n.a. |
n.a. |
| non-nationals |
males |
n.a. |
n.a. |
n.a. |
n.a. |
n.a. |
| females |
n.a. |
n.a. |
n.a. |
n.a. |
n.a. |
| Qatar |
nationals |
males |
70.0 |
68.9 |
68.6 |
68.5 |
68.2 |
| females |
34.7 |
35.0 |
36.1 |
36.9 |
36.7 |
| non-nationals |
males |
97.9 |
97.8 |
97.8 |
98.0 |
97.6 |
| females |
59.0 |
59.4 |
64.9 |
64.6 |
64.5 |
| Saudi Arabia |
nationals |
males |
64.6 |
64.9 |
63.3 |
64.6 |
63.4 |
| females |
16.4 |
17.6 |
17.4 |
19.0 |
19.4 |
| non-nationals |
males |
94.2 |
93.4 |
93.7 |
93.3 |
94.2 |
| females |
31.2 |
28.7 |
33.1 |
22.8 |
24.2 |
| UAE |
nationals |
males |
n.a. |
n.a. |
n.a. |
64.1 |
62.9 |
| females |
n.a. |
n.a. |
n.a. |
30.9 |
32.4 |
| non-nationals |
males |
n.a. |
n.a. |
n.a. |
95.0 |
94.6 |
| females |
n.a. |
n.a. |
n.a. |
54.3 |
55.9 |
Sources: national institutes of statistics.
1- Definitions and remarks:
Labour Force Participation Rates refer to the percentage of active (employed or unemployed) population aged 15 and above in the category (sex and nationality).
Ex.: 22.8% of foreign women in Saudi Arabia are economically active in 2016 (i.e.: employed or unemployed).
Oman: data not available.
2- Sources of data:
Data is taken from:
GCC Stat. Labour Statistics in GCC Countries 2017, Issue n°5, April 2019.
https://gccstat.org/en/statistic/publications/labor-statistics
Last accessed: December 2019.
|
Qataris |
Non-Qataris |
Total |
|
Males |
Females |
Total |
Males |
Females |
Total |
Males |
Females |
Total |
| Illiterate |
574 |
2,310 |
2,884 |
16,951 |
2,765 |
19,716 |
17,525 |
5,075 |
22,600 |
| Read & Write |
3,599 |
5,588 |
9,187 |
186,608 |
28,085 |
214,693 |
190,207 |
33,673 |
223,880 |
| Primary |
6,358 |
6,822 |
13,180 |
380,832 |
55,731 |
436,563 |
387,190 |
62,553 |
449,743 |
| Preparatory |
16,834 |
17,784 |
34,618 |
559,715 |
77,378 |
637,093 |
576,549 |
95,162 |
671,711 |
| Secondary |
37,860 |
28,511 |
66,371 |
299,605 |
86,728 |
386,333 |
337,465 |
115,239 |
452,704 |
| Pre.U. Diploma |
3,392 |
4,480 |
7,872 |
87,603 |
19,735 |
107,338 |
90,995 |
24,215 |
115,210 |
| University and above |
30,804 |
38,301 |
69,105 |
254,858 |
114,663 |
369,521 |
285,662 |
152,964 |
438,626 |
| Total |
99,421 |
103,796 |
203,217 |
1,786,172 |
385,085 |
2,171,257 |
1,885,593 |
488,881 |
2,374,474 |
Source: Annual Bulletin of Labor Force Sample survey 2018
ANNEXED NOTE
1. Technical Notes and Definitions
The data is taken from 2018 Labour Force Survey (yearly synthesis)
Sampling frame of LFS 2018: Census of Population, Housing, and Establishments 2015.
Sample size: 60,238 persons, in 9,200 households: 1- Qatari households; 2- Non-Qatari regular (non-collective) households;
3- Non-Qatari small collective households or labour gatherings (2 – 6 persons); 4- Non-Qatari large collective households or large labour gatherings (7 persons or more).
Data Collection: data was collected monthly.
Reference period for the labour force data: the week prior to data collection day.
Population of reference: all Qatari and non-Qatari households present in Qatar on the night of survey, living in normal and collective households.
The collective households are a group of persons not related to each other and sharing living conditions in a residential unit, I.e. labour camps, students living in boarding
schools, nurses in hospitals… etc. The survey covered the small collective households (includes less than 7 persons) and large collective households (includes 7 persons or more).
The survey did not cover short periods accommodation, i.e. hotels.
2. Institution which provides data
Planning and Statistics Authority
(https://www.psa.gov.qa/en/Pages/default.aspx)
3. Data availability
The Statistics Authority conducted the first labour Force Sample Survey in 2001. Starting from 2006, the execution of these surveys came to be on annual basis, and on a quarterly basis since 2013.
Labour Force Surveys (yearly and quarterly data) can be downloaded from MDPS’s website, in PDF and Excel format:
https://www.psa.gov.qa/en/statistics1/pages/topicslisting.aspx?parent=Social&child=LaborForce
Labour Force 2018:
https://www.psa.gov.qa/en/statistics/Statistical%20Releases/Social/LaborForce/2018/Annual_Bulletin_Labour_force_2018_AE.xls
Statistical analysis of LFS 2018:
https://www.psa.gov.qa/en/statistics/Statistical%20Releases/Social/LaborForce/2018/statistical_analysis_labor_force_2018_En.pdf
Last date of access: October 2019.
| Nationality |
|
In the labour force |
Outside the labour force |
Grand Total |
|
Employed |
Unemployed |
Total in labour force |
Housewife |
Student |
Disabled |
Retired |
Other |
Total |
|
Seeking work for 1st time |
Unpd. with previous employment |
| Qatari |
Males |
67,610 |
56 |
42 |
67,708 |
0 |
18,824 |
1,080 |
10,773 |
1,036 |
31,713 |
99,421 |
|
Females |
38,428 |
126 |
0 |
38,554 |
29,054 |
25,918 |
1,960 |
6,111 |
2,199 |
65,242 |
103,796 |
|
Total |
106,038 |
182 |
42 |
106,262 |
29,054 |
44,742 |
3,040 |
16,884 |
3,235 |
96,955 |
203,217 |
| Non-Qatari |
Males |
1,742,169 |
716 |
111 |
1,742,996 |
0 |
38,700 |
1,263 |
0 |
3,213 |
43,176 |
1,786,172 |
|
Females |
246,159 |
1,002 |
128 |
247,289 |
100,941 |
30,267 |
1,634 |
0 |
4,954 |
137,796 |
385,085 |
|
Total |
1,988,328 |
1,718 |
239 |
1,990,285 |
100,941 |
68,967 |
2,897 |
0 |
8,167 |
180,972 |
2,171,257 |
| Total |
Males |
1,809,779 |
772 |
153 |
1,810,704 |
0 |
57,524 |
2,343 |
10,773 |
4,249 |
74,889 |
1,885,593 |
|
Females |
284,587 |
1,128 |
128 |
285,843 |
129,995 |
56,185 |
3,594 |
6,111 |
7,153 |
203,038 |
488,881 |
|
Total |
2,094,366 |
1,900 |
281 |
2,096,547 |
129,995 |
113,709 |
5,937 |
16,884 |
11,402 |
277,927 |
2,374,474 |
Source: Annual Bulletin of Labor Force Sample survey 2018
ANNEXED NOTE
1. Technical Notes and Definitions
The data is taken from 2018 Labour Force Survey (yearly synthesis)
Sampling frame of LFS 2018: Census of Population, Housing, and Establishments 2015.
Sample size: 60,238 persons, in 9,200 households: 1- Qatari households; 2- Non-Qatari regular (non-collective) households;
3- Non-Qatari small collective households or labour gatherings (2 – 6 persons); 4- Non-Qatari large collective households or large labour gatherings (7 persons or more).
Data Collection: data was collected monthly.
Reference period for the labour force data: the week prior to data collection day.
Population of reference: all Qatari and non-Qatari households present in Qatar on the night of survey, living in normal and collective households.
The collective households are a group of persons not related to each other and sharing living conditions in a residential unit, I.e. labour camps, students living in boarding
schools, nurses in hospitals… etc. The survey covered the small collective households (includes less than 7 persons) and large collective households (includes 7 persons or more).
The survey did not cover short periods accommodation, i.e. hotels.
Relation to labour force (for persons aged 15 and above)
In the labour force (= economically active).
1) Employed.
All persons aged 15 years and above, who during the week preceding the survey:
a) Perform a work for a wage, salary, profits or household gains, whether it was in cash or in kind.
b) Are temporarily not employed, however, they still have an official relation with their work
2) Unemployed.
All persons aged 15 years and over who were, during the week preceding the survey, without employment, willing to work and looking seriously for a job.
There is a distinction between two kinds of unemployed persons:
a) First time unemployed: They are the persons who never worked previously, and were during the week preceding the survey looking actively for work.
b) Unemployed who previously worked: They are the persons with a work experience, who during the week preceding the survey were actively looking for a job
Outside the labour force (=economically inactive):
Full-time student: The person (15 years or older) enrolled in any educational institution as a full-time persistent student with purpose of attaining an academic degree, irrespective of whether the schooling hours are in the morning or evening. Any trainee enrolled in vocational training institutes is regarded as a full-time student.
Full-time housewife: The female (15 years or older) who is fully engaged in home management and family care, and does not practice any other work
Retired: The person who does not look for a job during the week preceding the survey and gets a fixed pension for work he/she had joined before
Disabled: The person (15 years or older) who is not capable of work due to illness, handicap or old age.
Others: Those able to work but not willing to, not enrolled in education, as well as any other cases encountered by the enumerator other than the above mentioned.
2. Institution which provides data
Planning and Statistics Authority
(https://www.psa.gov.qa/en/Pages/default.aspx)
3. Data availability
The Statistics Authority conducted the first labour Force Sample Survey in 2001. Starting from 2006, the execution of these surveys came to be on annual basis, and on a quarterly basis since 2013.
Labour Force Surveys (yearly and quarterly data) can be downloaded from MDPS’s website, in PDF and Excel format:
https://www.psa.gov.qa/en/statistics1/pages/topicslisting.aspx?parent=Social&child=LaborForce
Labour Force 2018:
https://www.psa.gov.qa/en/statistics/Statistical%20Releases/Social/LaborForce/2018/Annual_Bulletin_Labour_force_2018_AE.xls
Statistical analysis of LFS 2018:
https://www.psa.gov.qa/en/statistics/Statistical%20Releases/Social/LaborForce/2018/statistical_analysis_labor_force_2018_En.pdf
Last date of access: October 2019.
|
Qatari |
Non-Qatari |
Total |
|
Males |
Females |
Total |
Males |
Females |
Total |
Males |
Females |
Total |
| Employer |
2,689 |
798 |
3,487 |
2,398 |
205 |
2,603 |
5,087 |
1,003 |
6,090 |
| Own Account Worker |
266 |
0 |
266 |
2,258 |
82 |
2,340 |
2,524 |
82 |
2,606 |
| Employee |
64,697 |
37,630 |
102,327 |
1,737,624 |
246,000 |
1,983,624 |
1,802,321 |
283,630 |
2,085,951 |
| Total |
67,652 |
38,428 |
106,080 |
1,742,280 |
246,287 |
1,988,567 |
1,809,932 |
284,715 |
2,094,647 |
Source: Annual Bulletin of Labor Force Sample survey 2018
ANNEXED NOTE
1. Technical Notes and Definitions
The data is taken from 2018 Labour Force Survey (yearly synthesis)
Sampling frame of LFS 2018: Census of Population, Housing, and Establishments 2015.
Sample size: 60,238 persons, in 9,200 households: 1- Qatari households; 2- Non-Qatari regular (non-collective) households;
3- Non-Qatari small collective households or labour gatherings (2 – 6 persons); 4- Non-Qatari large collective households or large labour gatherings (7 persons or more).
Data Collection: data was collected monthly.
Reference period for the labour force data: the week prior to data collection day.
Population of reference: all Qatari and non-Qatari households present in Qatar on the night of survey, living in normal and collective households.
The collective households are a group of persons not related to each other and sharing living conditions in a residential unit, I.e. labour camps, students living in boarding
schools, nurses in hospitals… etc. The survey covered the small collective households (includes less than 7 persons) and large collective households (includes 7 persons or more).
The survey did not cover short periods accommodation, i.e. hotels.
Economically active = In the labour force.
1) Employed.
All persons aged 15 years and above, who during the week preceding the survey:
a) Perform a work for a wage, salary, profits or household gains, whether it was in cash or in kind.
b) Are temporarily not employed, however, they still have an official relation with their work
2) Unemployed.
All persons aged 15 years and over who were, during the week preceding the survey, without employment, willing to work and looking seriously for a job.
Current data include unemployed persons who previously worked (having a work experience, and who were actively looking for a job during the week preceding the survey).
Unemployed persons seeking work for the first time are not included.
2. Institution which provides data
Planning and Statistics Authority
https://www.psa.gov.qa/en/Pages/default.aspx.
3. Data availability
The Statistics Authority conducted the first labour Force Sample Survey in 2001. Starting from 2006, the execution of these surveys came to be on annual basis, and on a quarterly basis since 2013.
Labour Force Surveys (yearly and quarterly data) can be downloaded from MDPS’s website, in PDF and Excel format:
https://www.psa.gov.qa/en/statistics1/pages/topicslisting.aspx?parent=Social&child=LaborForce
Labour Force 2018:
https://www.psa.gov.qa/en/statistics/Statistical%20Releases/Social/LaborForce/2018/Annual_Bulletin_Labour_force_2018_AE.xls
Statistical analysis of LFS 2018:
https://www.psa.gov.qa/en/statistics/Statistical%20Releases/Social/LaborForce/2018/statistical_analysis_labor_force_2018_En.pdf
Last date of access: October 2019.
|
Qatari |
Non-Qatari |
Total |
|
Males |
Females |
Total |
Males |
Females |
Total |
Males |
Females |
Total |
| Agriculture, forestry and fishing |
112 |
0 |
112 |
27,795 |
0 |
27,795 |
27,907 |
0 |
27,907 |
| Mining and quarrying |
8,294 |
2,199 |
10,493 |
83,926 |
4,573 |
88,499 |
92,220 |
6,772 |
98,992 |
| Manufacturing |
1,024 |
280 |
1,304 |
148,564 |
2,008 |
150,572 |
149,588 |
2,288 |
151,876 |
| Electricity, gas, steam and air conditioning supply |
1,569 |
1,136 |
2,705 |
13,955 |
752 |
14,707 |
15,524 |
1,888 |
17,412 |
| Water supply; sewerage, waste management and remediation activities |
308 |
351 |
659 |
6,366 |
369 |
6,735 |
6,674 |
720 |
7,394 |
| Construction |
1,470 |
140 |
1,610 |
872,540 |
6,799 |
879,339 |
874,010 |
6,939 |
880,949 |
| Wholesale and retail trade; repair of motor vehicles and motorcycles |
1,092 |
1,022 |
2,114 |
224,948 |
24,851 |
249,799 |
226,040 |
25,873 |
251,913 |
| Transportation and storage |
1,586 |
1,471 |
3,057 |
52,760 |
8,981 |
61,741 |
54,346 |
10,452 |
64,798 |
| Accommodation and food service activities |
252 |
308 |
560 |
55,807 |
18,382 |
74,189 |
56,059 |
18,690 |
74,749 |
| Information and communication |
2,324 |
1,148 |
3,472 |
10,795 |
1,640 |
12,435 |
13,119 |
2,788 |
15,907 |
| Financial and insurance activities |
2,240 |
2,186 |
4,426 |
7,416 |
3,177 |
10,593 |
9,656 |
5,363 |
15,019 |
| Real estate activities |
574 |
280 |
854 |
9,757 |
647 |
10,404 |
10,331 |
927 |
11,258 |
| Professional, scientific and technical activities |
420 |
112 |
532 |
15,631 |
2,152 |
17,783 |
16,051 |
2,264 |
18,315 |
| Administrative and support service activities |
812 |
196 |
1,008 |
80,147 |
9,720 |
89,867 |
80,959 |
9,916 |
90,875 |
| Public administration and defence; compulsory social security |
39,822 |
12,617 |
52,439 |
23,534 |
2,080 |
25,614 |
63,356 |
14,697 |
78,053 |
| Education |
2,296 |
10,415 |
12,711 |
11,059 |
23,946 |
35,005 |
13,355 |
34,361 |
47,716 |
| Human health and social work activities |
1,960 |
3,797 |
5,757 |
15,483 |
17,461 |
32,944 |
17,443 |
21,258 |
38,701 |
| Arts, entertainment and recreation |
923 |
434 |
1,357 |
4,235 |
506 |
4,741 |
5,158 |
940 |
6,098 |
| Other service activities |
350 |
252 |
602 |
9,732 |
7,592 |
17,324 |
10,082 |
7,844 |
17,926 |
| Activities of households as employers; undifferentiated goods- and services-producing activities of households for own use |
0 |
0 |
0 |
64,173 |
109,127 |
173,300 |
64,173 |
109,127 |
173,300 |
| Activities of extraterritorial organizations and bodies |
224 |
84 |
308 |
3,657 |
1,524 |
5,181 |
3,881 |
1,608 |
5,489 |
| Total |
67,652 |
38,428 |
106,080 |
1,742,280 |
246,287 |
1,988,567 |
1,809,932 |
284,715 |
2,094,647 |
Source: Annual Bulletin of Labor Force Sample survey 2018
ANNEXED NOTE
1. Technical Notes and Definitions
The data is taken from 2018 Labour Force Survey (yearly synthesis)
Sampling frame of LFS 2018: Census of Population, Housing, and Establishments 2015.
Sample size: 60,238 persons, in 9,200 households: 1- Qatari households; 2- Non-Qatari regular (non-collective) households;
3- Non-Qatari small collective households or labour gatherings (2 – 6 persons); 4- Non-Qatari large collective households or large labour gatherings (7 persons or more).
Data Collection: data was collected monthly.
Reference period for the labour force data: the week prior to data collection day.
Population of reference: all Qatari and non-Qatari households present in Qatar on the night of survey, living in normal and collective households.
The collective households are a group of persons not related to each other and sharing living conditions in a residential unit, I.e. labour camps, students living in boarding
schools, nurses in hospitals… etc. The survey covered the small collective households (includes less than 7 persons) and large collective households (includes 7 persons or more).
The survey did not cover short periods accommodation, i.e. hotels.
Economically active = In the labour force.
1) Employed.
All persons aged 15 years and above, who during the week preceding the survey:
a) Perform a work for a wage, salary, profits or household gains, whether it was in cash or in kind.
b) Are temporarily not employed, however, they still have an official relation with their work
2) Unemployed.
All persons aged 15 years and over who were, during the week preceding the survey, without employment, willing to work and looking seriously for a job.
Current data include unemployed persons who previously worked (having a work experience, and who were actively looking for a job during the week preceding the survey).
Unemployed persons seeking work for the first time are not included.
2. Institution which provides data
Planning and Statistics Authority
https://www.psa.gov.qa/en/Pages/default.aspx.
3. Data availability
The Statistics Authority conducted the first labour Force Sample Survey in 2001. Starting from 2006, the execution of these surveys came to be on annual basis, and on a quarterly basis since 2013.
Labour Force Surveys (yearly and quarterly data) can be downloaded from MDPS’s website, in PDF and Excel format:
https://www.psa.gov.qa/en/statistics1/pages/topicslisting.aspx?parent=Social&child=LaborForce
Labour Force 2018:
https://www.psa.gov.qa/en/statistics/Statistical%20Releases/Social/LaborForce/2018/Annual_Bulletin_Labour_force_2018_AE.xls
Statistical analysis of LFS 2018:
https://www.psa.gov.qa/en/statistics/Statistical%20Releases/Social/LaborForce/2018/statistical_analysis_labor_force_2018_En.pdf
Last date of access: October 2019.
|
Qataris |
Non-Qataris |
Total |
|
Males |
Females |
Total |
Males |
Females |
Total |
Males |
Females |
Total |
| Government Department |
45,943 |
25,918 |
71,861 |
45,167 |
14,171 |
59,338 |
91,110 |
40,089 |
131,199 |
| Government Company/ Corporation |
8,963 |
5,042 |
14,005 |
46,846 |
8,439 |
55,285 |
55,809 |
13,481 |
69,290 |
| Mixed |
6,207 |
3,015 |
9,222 |
43,168 |
6,498 |
49,666 |
49,375 |
9,513 |
58,888 |
| Private |
6,175 |
4,145 |
10,320 |
1,537,024 |
105,474 |
1,642,498 |
1,543,199 |
109,619 |
1,652,818 |
| Diplomatic/International/Regional |
224 |
84 |
308 |
3,657 |
1,524 |
5,181 |
3,881 |
1,608 |
5,489 |
| Non profit |
140 |
224 |
364 |
2,245 |
1,054 |
3,299 |
2,385 |
1,278 |
3,663 |
| Domestic |
0 |
0 |
0 |
64,173 |
109,127 |
173,300 |
64,173 |
109,127 |
173,300 |
| Total |
67,652 |
38,428 |
106,080 |
1,742,280 |
246,287 |
1,988,567 |
1,809,932 |
284,715 |
2,094,647 |
Source: Annual Bulletin of Labor Force Sample survey 2018
ANNEXED NOTE
1. Technical Notes and Definitions
The data is taken from 2018 Labour Force Survey (yearly synthesis)
Sampling frame of LFS 2018: Census of Population, Housing, and Establishments 2015.
Sample size: 60,238 persons, in 9,200 households: 1- Qatari households; 2- Non-Qatari regular (non-collective) households;
3- Non-Qatari small collective households or labour gatherings (2 – 6 persons); 4- Non-Qatari large collective households or large labour gatherings (7 persons or more).
Data Collection: data was collected monthly.
Reference period for the labour force data: the week prior to data collection day.
Population of reference: all Qatari and non-Qatari households present in Qatar on the night of survey, living in normal and collective households.
The collective households are a group of persons not related to each other and sharing living conditions in a residential unit, I.e. labour camps, students living in boarding
schools, nurses in hospitals… etc. The survey covered the small collective households (includes less than 7 persons) and large collective households (includes 7 persons or more).
The survey did not cover short periods accommodation, i.e. hotels.
Economically active = In the labour force.
1) Employed.
All persons aged 15 years and above, who during the week preceding the survey:
a) Perform a work for a wage, salary, profits or household gains, whether it was in cash or in kind.
b) Are temporarily not employed, however, they still have an official relation with their work
2) Unemployed.
All persons aged 15 years and over who were, during the week preceding the survey, without employment, willing to work and looking seriously for a job.
Current data include unemployed persons who previously worked (having a work experience, and who were actively looking for a job during the week preceding the survey).
Unemployed persons seeking work for the first time are not included.
2. Institution which provides data
Planning and Statistics Authority
https://www.psa.gov.qa/en/Pages/default.aspx.
3. Data availability
The Statistics Authority conducted the first labour Force Sample Survey in 2001. Starting from 2006, the execution of these surveys came to be on annual basis, and on a quarterly basis since 2013.
Labour Force Surveys (yearly and quarterly data) can be downloaded from MDPS’s website, in PDF and Excel format:
https://www.psa.gov.qa/en/statistics1/pages/topicslisting.aspx?parent=Social&child=LaborForce
Labour Force 2018:
https://www.psa.gov.qa/en/statistics/Statistical%20Releases/Social/LaborForce/2018/Annual_Bulletin_Labour_force_2018_AE.xls
Statistical analysis of LFS 2018:
https://www.psa.gov.qa/en/statistics/Statistical%20Releases/Social/LaborForce/2018/statistical_analysis_labor_force_2018_En.pdf
Last date of access: October 2019.
|
Qatari |
Non-Qatari |
Total |
|
Males |
Females |
Total |
Males |
Females |
Total |
Males |
Females |
Total |
| Legislators, Senior Officials and Managers |
9,019 |
2,381 |
11,400 |
29,020 |
3,876 |
32,896 |
38,039 |
6,257 |
44,296 |
| Professionals |
14,806 |
16,942 |
31,748 |
115,713 |
45,226 |
160,939 |
130,519 |
62,168 |
192,687 |
| Technicians and Associate Professionals |
12,402 |
5,687 |
18,089 |
115,607 |
8,532 |
124,139 |
128,009 |
14,219 |
142,228 |
| Clerks |
16,613 |
11,148 |
27,761 |
52,590 |
21,827 |
74,417 |
69,203 |
32,975 |
102,178 |
| Service Workers, Shops and Market Sales Workers |
5,292 |
2,101 |
7,393 |
141,087 |
52,654 |
193,741 |
146,379 |
54,755 |
201,134 |
| Skilled Agricultural and Fishery Workers |
0 |
0 |
0 |
22,175 |
0 |
22,175 |
22,175 |
0 |
22,175 |
| Craft and Related Trades Workers |
4,718 |
0 |
4,718 |
688,423 |
97 |
688,520 |
693,141 |
97 |
693,238 |
| Plant, Machine Operators and Assemblers |
1,134 |
0 |
1,134 |
292,747 |
392 |
293,139 |
293,881 |
392 |
294,273 |
| Elementary Occupations |
3,668 |
169 |
3,837 |
284,918 |
113,683 |
398,601 |
288,586 |
113,852 |
402,438 |
| Total |
67,652 |
38,428 |
106,080 |
1,742,280 |
246,287 |
1,988,567 |
1,809,932 |
284,715 |
2,094,647 |
Source: Annual Bulletin of Labor Force Sample survey 2018
ANNEXED NOTE
1. Technical Notes and Definitions
The data is taken from 2018 Labour Force Survey (yearly synthesis)
Sampling frame of LFS 2018: Census of Population, Housing, and Establishments 2015.
Sample size: 60,238 persons, in 9,200 households: 1- Qatari households; 2- Non-Qatari regular (non-collective) households;
3- Non-Qatari small collective households or labour gatherings (2 – 6 persons); 4- Non-Qatari large collective households or large labour gatherings (7 persons or more).
Data Collection: data was collected monthly.
Reference period for the labour force data: the week prior to data collection day.
Population of reference: all Qatari and non-Qatari households present in Qatar on the night of survey, living in normal and collective households.
The collective households are a group of persons not related to each other and sharing living conditions in a residential unit, I.e. labour camps, students living in boarding
schools, nurses in hospitals… etc. The survey covered the small collective households (includes less than 7 persons) and large collective households (includes 7 persons or more).
The survey did not cover short periods accommodation, i.e. hotels.
Economically active = In the labour force.
1) Employed.
All persons aged 15 years and above, who during the week preceding the survey:
a) Perform a work for a wage, salary, profits or household gains, whether it was in cash or in kind.
b) Are temporarily not employed, however, they still have an official relation with their work
2) Unemployed.
All persons aged 15 years and over who were, during the week preceding the survey, without employment, willing to work and looking seriously for a job.
Current data include unemployed persons who previously worked (having a work experience, and who were actively looking for a job during the week preceding the survey).
Unemployed persons seeking work for the first time are not included.
2. Institution which provides data
Planning and Statistics Authority
https://www.psa.gov.qa/en/Pages/default.aspx.
3. Data availability
The Statistics Authority conducted the first labour Force Sample Survey in 2001. Starting from 2006, the execution of these surveys came to be on annual basis, and on a quarterly basis since 2013.
Labour Force Surveys (yearly and quarterly data) can be downloaded from MDPS’s website, in PDF and Excel format:
https://www.psa.gov.qa/en/statistics1/pages/topicslisting.aspx?parent=Social&child=LaborForce
Labour Force 2018:
https://www.psa.gov.qa/en/statistics/Statistical%20Releases/Social/LaborForce/2018/Annual_Bulletin_Labour_force_2018_AE.xls
Statistical analysis of LFS 2018:
https://www.psa.gov.qa/en/statistics/Statistical%20Releases/Social/LaborForce/2018/statistical_analysis_labor_force_2018_En.pdf
Last date of access: October 2019.
|
QATARI |
NON-QATARI |
Total |
|
Males |
Females |
Total |
Males |
Females |
Total |
Males |
Females |
Total |
| 2006 |
38,684 |
19,447 |
58,131 |
415,235 |
57,767 |
473,002 |
453,919 |
77,214 |
531,133 |
| 2007 |
40,322 |
21,223 |
61,545 |
686,430 |
79,608 |
766,038 |
726,752 |
100,831 |
827,583 |
| 2008 |
42,770 |
24,815 |
67,585 |
1,002,388 |
97,928 |
1,100,316 |
1,045,158 |
122,743 |
1,167,901 |
| 2009 |
45,242 |
25,402 |
70,644 |
1,092,844 |
97,983 |
1,190,827 |
1,138,086 |
123,385 |
1,261,471 |
| 2010* |
46,168 |
24,908 |
71,076 |
1,070,973 |
128,134 |
1,199,107 |
1,117,141 |
153,042 |
1,270,183 |
| 2011 |
49,228 |
25,145 |
74,373 |
1,068,083 |
127,789 |
1,195,872 |
1,117,311 |
152,934 |
1,270,245 |
| 2012 |
55,609 |
26,992 |
82,601 |
1,117,577 |
140,404 |
1,257,981 |
1,173,186 |
167,396 |
1,340,582 |
| 2013 |
60,877 |
30,256 |
91,133 |
1,284,838 |
163,169 |
1,448,007 |
1,345,715 |
193,425 |
1,539,140 |
| 2014 |
62,202 |
31,282 |
93,484 |
1,419,940 |
173,247 |
1,593,187 |
1,482,142 |
204,529 |
1,686,671 |
| 2015 |
64,101 |
34,322 |
98,423 |
1,628,620 |
226,395 |
1,855,015 |
1,692,721 |
260,717 |
1,953,438 |
| 2016 |
65,023 |
36,394 |
101,417 |
1,716,529 |
234,467 |
1,950,996 |
1,781,552 |
270,861 |
2,052,413 |
| 2017 |
66,859 |
37,057 |
103,916 |
1,711,444 |
238,827 |
1,950,271 |
1,778,303 |
275,884 |
2,054,187 |
| 2018 |
67,610 |
38,428 |
106,038 |
1,742,169 |
246,159 |
1,988,328 |
1,809,779 |
284,587 |
2,094,366 |
Source: Labour Force Sample Surveys, 2006 to 2009 and 2011 to 2018; *: census 2010
ANNEXED NOTE
1. Technical Notes and Definitions
Censuses:
Reference period for census 2015: the night of 20 to 21 April 2015.
Reference period for census 2010: the night of 20 to 21 April 2010.
Population of reference: all individuals (nationals and non-nationals) present within the State’s borders during time of reference, including in labour camps.
Labour force Sample Surveys:
The Statistics Authority conducted the first labor Force Sample Survey in 2001. Starting from 2006, the execution of these surveys came to be on annual basis.
In 2013, the Survey was conducted on a quarterly basis.
| Labor Force |
Sampling |
Sample size |
Reference |
| Sample Surveys |
frame |
(households) |
individuals |
period |
| 2006 |
based on independent samples drawn from distinct frames of specially constructed PSUs |
5,492 |
31,439 |
March 2006 |
| 2007 |
nd |
5,492 |
31,439 |
October 2007 |
| 2008 |
nd |
6,104 |
nd |
December 2008 |
| 2009 |
nd |
6,109 |
35,839 |
October 2009 |
| 2011 |
nd |
6,920 |
35,839 |
March 2011 |
| 2012 |
Census 2010 |
6,895 |
37,629 |
April 2012 |
| 2013 |
Census 2010 |
c. 7000 |
n.d. |
Quarterly |
| 2014 |
Census 2010 |
8,351 |
53,363 |
Quarterly |
| 2015 |
Census 2010 |
6,953 |
44,756 |
Quarterly |
| 2016 |
Census 2010 |
9,199 |
60,016 |
Quarterly |
| 2017 |
Census 2015 |
9,200 |
60,278 |
Quarterly |
| 2018 |
Census 2015 |
9,200 |
60,238 |
Quarterly |
Reference period for the labor force data: the week prior to the reference date for data collection.
Population of reference: sample of Qatari and non-Qatari households of the following types: i. Qatari households; ii. Non-Qatari households;
iii. Small labor gatherings; iv. Large labor gatherings, present in Qatar on the night of survey/ periods of reference
The collective households are a group of persons not related to each other and sharing living conditions in a residential unit, I.e. labor camps, students living boarding schools,
nurses in hospitals… etc. The survey covered the small collective households (includes less than 7 persons) and large collective households (includes 7 persons or more).
The survey did not cover short periods accommodation, i.e. hotels.
Employed population:
Persons aged 15 years an above, who during the week preceding the survey:
a) Perform a work for a wage, salary, profits or household gains, whether it was in cash or in kind.
b) Are temporarily not employed, however, they still have an official relation with their work
2. Institution which provides data
Planning and Statistics Authority
https://www.psa.gov.qa/en/Pages/default.aspx.
3. Data availability
Labour Force Surveys (annual and quarterly reports) and earlier labour-related data can be downloaded from PSA’s website, in PDF and Excel formats:
https://www.psa.gov.qa/en/statistics1/pages/topicslisting.aspx?parent=Social&child=LaborForce
Last date of access: October 2019.
|
Emiratis |
Non-Emiratis |
Total |
|
Males |
Females |
Total |
Males |
Females |
Total |
Males |
Females |
Total |
| Less Than Primary |
1.5% |
0.2% |
1.1% |
13.9% |
20.5% |
15.1% |
13.4% |
19.0% |
14.5% |
| Primary |
4.8% |
0.8% |
3.6% |
15.1% |
12.8% |
14.7% |
14.7% |
11.9% |
14.2% |
| Lower Secondary |
14.8% |
5.6% |
12.0% |
20.3% |
10.4% |
18.5% |
20.1% |
10.1% |
18.2% |
| Upper Secondary |
37.9% |
27.5% |
34.7% |
18.1% |
11.8% |
16.9% |
18.8% |
12.9% |
17.7% |
| Post-Secondary Non-Tertiary |
6.9% |
8.6% |
7.4% |
5.9% |
5.2% |
5.8% |
6.0% |
5.4% |
5.9% |
| Bachelor or Equivalent |
27.5% |
49.7% |
34.3% |
20.8% |
31.3% |
22.7% |
21.1% |
32.7% |
23.3% |
| Higher Education |
6.6% |
7.6% |
6.9% |
5.6% |
7.8% |
6.0% |
5.6% |
7.7% |
6.0% |
| Adult Education |
0.0% |
0.0% |
0.0% |
0.2% |
0.2% |
0.2% |
0.2% |
0.1% |
0.2% |
| Not classified |
0.1% |
0.0% |
0.0% |
0.0% |
0.0% |
0.0% |
0.0% |
0.0% |
0.0% |
| Total |
100.0% |
100.0% |
100.0% |
100.0% |
100.0% |
100.0% |
100.0% |
100.0% |
100.0% |
Source: Federal Competitiveness and Statistitics Authority (FCSA)
ANNEXED NOTE
1. Characteristics of data, definitions and population counting operations in the UAE
Since 2016, the UAE Federal Competitiveness and Statistitics Authority (FCSA) (formerly National Bureau of Statistics)
resumed the implementation of Labour Force Surveys. The last one was conducted in 2009.
No metadata and methodological indications for the current Labour Force Survey are available.
No numeric figures are available.
Methodology and questionnaire for LFS 2009: http://methods.fcsa.gov.ae/Forms/SurveyQuestMeth/SurveyQuest.aspx
According to informations received by GLMM, the sampling base of the LFS could be family budget surveys, which in turn are based on the 2005 census,
with minor modifications. Results of LFS conducted at the national level, therefore, may be taken with caution.
2. Institution which provides data
Federal Competitiveness and Statistitics Authority (FCSA)
3. Data availability
The results of 2008, 2009, 2016 and 2017 Labour Force Surveys are available (in Excel format) in FCSA’s website, section “Statistics by Subject”
http://fcsa.gov.ae/en-us/Pages/Statistics/Statistics-by-Subject.aspx#/%3Fyear=&folder=Demography%20and%20Social/Labour%20Force&subject=Demography%20and%20Social
Data is also available in the section “Open data”, in the data portal (“Report builder”)
http://uaenumbers.fcsa.gov.ae/UAEFCSALF2019/labor-force
Last date of access: July 2019.
|
Omanis |
Expatriates |
Total |
| 2000 |
1,777,685 |
623,571 |
2,401,256 |
| 2001 |
1,826,124 |
651,563 |
2,477,687 |
| 2002 |
1,869,580 |
668,162 |
2,537,742 |
| 2003 (1) |
1,781,558 |
559,257 |
2,340,815 |
| 2004 |
1,802,931 |
612,645 |
2,415,576 |
| 2005 |
1,842,684 |
666,153 |
2,508,837 |
| 2006 |
1,883,576 |
693,486 |
2,577,062 |
| 2007 |
1,922,697 |
820,802 |
2,743,499 |
| 2008 |
1,967,180 |
900,248 |
2,867,428 |
| 2009 |
2,017,559 |
1,156,358 |
3,173,917 |
| 2010 (1) |
1,957,336 |
816,143 |
2,773,479 |
| 2011 (2) |
2,013,158 |
1,282,140 |
3,295,298 |
| 2012 (2) |
2,092,560 |
1,530,441 |
3,623,001 |
| 2013 (2) |
2,172,002 |
1,683,204 |
3,855,206 |
| 2014 (2) |
2,260,705 |
1,732,188 |
3,992,893 |
| 2015 (2) |
2,344,646 |
1,814,456 |
4,159,102 |
| 2016 (2) |
2,427,825 |
1,986,226 |
4,414,051 |
| 2017 (2) |
2,505,369 |
2,054,594 |
4,559,963 |
| 2018 (2) |
2,579,236 |
2,022,470 |
4,601,706 |
| 2019 (2) |
2,655,453 |
1,962,815 |
4,618,268 |
Source: National Centre for Statistics and Information
ANNEXED NOTE
1. Technical Notes and Definitions
Period of reference: mid-year, except census years 2003, 2010.
Source of the data: censuses, data on vital statistics (births and deaths) produced by the Ministry of Health (MOH),
and data provided by the Royal Oman Police (ROP) on Omani and non-Omani residents.
1- Censuses held in 1993; 2003 and 2010
Censuses’ reference periods: 1993: n.a.; 2003: 7-8 December; 2010: 12-13 December.
2- National Registration System (2011- )
The civil registration records all Omani and expatriate residents. It is based on the civil status system and is maintained
by the General Directorate of Civil Status, a part of the Royal Oman Police.
Since 2004, registration of all vital events taking place in the Sultanate (births, death, marriages and divorces) in the civil register
is mandatory for Omanis and foreign residents of the Sultanate.
Characteristics of data:
Figures refer to 1. Omanis holding an official valid document registered in the National Registration System, or expired for less than ten years
2. Foreign residents holding valid visas, or visas expired for lesss than two years; dependents holding valid visas, providing that they are in the country.
Residence visa for expatriates includes residence visa for a wife of an Omani, student resident, multiple entry visa, employment visa,
employment contracting visa, official visit visa, investor visa. The dependent visa includes Family Reunion visas and relative/ friend visit visa.
2. Institution which provides data
National Center for Statistics and Information (NCSI)
3. Data availability
Figures for 2000 to 2018 were uploaded from NCSI Oman Data portal:
http://data.gov.om/OMPOP2016/population
Figures for 30 June 2019: NCSI’s homepage, population clock:
https://ncsi.gov.om/Pages/NCSI.aspx
Date of access: September 2019.
|
Emiratis |
Non-Emiratis |
Total |
|
Males |
Females |
Total |
Males |
Females |
Total |
Males |
Females |
Total |
| 15-19 |
1.1% |
0.6% |
0.9% |
0.5% |
0.7% |
0.5% |
0.5% |
0.7% |
0.5% |
| 20-24 |
12.4% |
8.0% |
11.0% |
8.3% |
9.6% |
8.5% |
8.4% |
9.5% |
8.6% |
| 25-29 |
18.9% |
22.2% |
19.9% |
18.1% |
21.6% |
18.7% |
18.2% |
21.6% |
18.8% |
| 30-34 |
19.8% |
23.8% |
21.0% |
21.0% |
22.8% |
21.3% |
21.0% |
22.8% |
21.3% |
| 35-39 |
18.0% |
20.9% |
18.9% |
17.4% |
19.2% |
17.8% |
17.5% |
19.3% |
17.8% |
| 40-44 |
12.9% |
13.7% |
13.2% |
13.5% |
12.8% |
13.4% |
13.5% |
12.9% |
13.4% |
| 45-49 |
7.5% |
7.3% |
7.4% |
9.6% |
7.2% |
9.1% |
9.5% |
7.2% |
9.1% |
| 50-54 |
5.0% |
2.2% |
4.1% |
6.1% |
3.1% |
5.5% |
6.0% |
3.0% |
5.5% |
| 55-59 |
2.6% |
1.1% |
2.1% |
3.6% |
2.1% |
3.4% |
3.6% |
2.0% |
3.3% |
| 60-64 |
1.2% |
0.1% |
0.9% |
1.5% |
0.6% |
1.3% |
1.5% |
0.6% |
1.3% |
| +65 |
0.7% |
0.1% |
0.5% |
0.4% |
0.3% |
0.4% |
0.5% |
0.3% |
0.4% |
| Total |
100.0% |
100.0% |
100.0% |
100.0% |
100.0% |
100.0% |
100.0% |
100.0% |
100.0% |
Source: Federal Competitiveness and Statistitics Authority (FCSA)
ANNEXED NOTE
1. Characteristics of data, definitions and population counting operations in the UAE
Since 2016, the UAE Federal Competitiveness and Statistitics Authority (FCSA) (formerly National Bureau of Statistics)
resumed the implementation of Labour Force Surveys. The last one was conducted in 2009.
No metadata and methodological indications for the current Labour Force Survey are available.
No numeric figures are available.
Methodology and questionnaire for LFS 2009: http://methods.fcsa.gov.ae/Forms/SurveyQuestMeth/SurveyQuest.aspx
According to informations received by GLMM, the sampling base of the LFS could be family budget surveys, which in turn are based on the 2005 census,
with minor modifications. Results of LFS conducted at the national level, therefore, may be taken with caution.
2. Institution which provides data
Federal Competitiveness and Statistitics Authority (FCSA)
3. Data availability
The results of 2008, 2009, 2016 and 2017 Labour Force Surveys are available (in Excel format) in FCSA’s website, section “Statistics by Subject”
http://fcsa.gov.ae/en-us/Pages/Statistics/Statistics-by-Subject.aspx#/%3Fyear=&folder=Demography%20and%20Social/Labour%20Force&subject=Demography%20and%20Social
Data is also available in the section “Open data”, in the data portal (“Report builder”)
http://uaenumbers.fcsa.gov.ae/UAEFCSALF2019/labor-force
Last date of access: July 2019.
|
Omanis |
Expatriates |
Total |
|
Males |
Females |
Total |
Males |
Females |
Total |
Males |
Females |
Total |
| 2000 |
|
|
1,777,685 |
|
|
623,571 |
|
|
2,401,256 |
| 2001 |
928,747 |
897,377 |
1,826,124 |
522,294 |
129,269 |
651,563 |
1,451,041 |
1,026,646 |
2,477,687 |
| 2002 |
950,666 |
918,914 |
1,869,580 |
492,650 |
175,512 |
668,162 |
1,443,316 |
1,094,426 |
2,537,742 |
| 2003 (1) |
900,540 |
881,018 |
1,781,558 |
412,699 |
146,558 |
559,257 |
1,313,239 |
1,027,576 |
2,340,815 |
| 2004 |
911,135 |
891,796 |
1,802,931 |
449,756 |
162,889 |
612,645 |
1,360,891 |
1,054,685 |
2,415,576 |
| 2005 |
931,007 |
911,677 |
1,842,684 |
527,838 |
138,315 |
666,153 |
1,458,845 |
1,049,992 |
2,508,837 |
| 2006 |
951,440 |
932,136 |
1,883,576 |
546,703 |
146,783 |
693,486 |
1,498,143 |
1,078,919 |
2,577,062 |
| 2007 |
970,489 |
952,208 |
1,922,697 |
651,630 |
169,172 |
820,802 |
1,622,119 |
1,121,380 |
2,743,499 |
| 2008 |
994,120 |
973,060 |
1,967,180 |
693,294 |
206,954 |
900,248 |
1,687,414 |
1,180,014 |
2,867,428 |
| 2009 |
1,019,322 |
998,237 |
2,017,559 |
951,793 |
204,565 |
1,156,358 |
1,971,115 |
1,202,802 |
3,173,917 |
| 2010 (1) |
990,590 |
966,746 |
1,957,336 |
621,818 |
194,325 |
816,143 |
1,612,408 |
1,161,071 |
2,773,479 |
| 2011 (2) |
1,024,923 |
988,235 |
2,013,158 |
1,065,960 |
216,180 |
1,530,437 |
2,090,883 |
1,204,415 |
3,295,298 |
| 2012 (2) |
1,062,918 |
1,029,642 |
2,092,560 |
1,269,769 |
260,672 |
1,530,437 |
1,699,894 |
1,290,314 |
3,622,997 |
| 2013 (2) |
1,100,614 |
1,071,388 |
2,172,002 |
1,401,621 |
281,583 |
1,683,204 |
2,502,235 |
1,352,971 |
3,855,206 |
| 2014 (2) |
1,143,579 |
1,117,126 |
2,260,705 |
1,436,232 |
295,956 |
1,732,188 |
2,579,811 |
1,413,082 |
3,992,893 |
| 2015 (2) |
1,184,430 |
1,160,516 |
2,344,646 |
1,500,414 |
313,742 |
1,814,156 |
2,684,844 |
1,474,258 |
4,159,102 |
| 2016 (2) |
1,225,390 |
1,202,435 |
2,427,825 |
1,660,693 |
325,533 |
1,986,226 |
2,886,083 |
1,527,968 |
4,414,051 |
| 2017 (2) |
1,263,764 |
1,241,605 |
2,505,369 |
1,720,640 |
333,954 |
2,054,594 |
2,984,404 |
1,575,559 |
4,559,963 |
| 2018 (2) |
1,299,741 |
1,279,495 |
2,579,236 |
1,690,362 |
332,108 |
2,022,470 |
2,990,103 |
1,611,603 |
4,601,706 |
Source: National Centre for Statistics and Information (NCSI)
ANNEXED NOTE
1. Technical Notes and Definitions
Period of reference: mid-year, except census years 2003, 2010.
Source of the data: censuses, data on vital statistics (births and deaths) produced by the Ministry of Health (MOH),
and data provided by the Royal Oman Police (ROP) on Omani and non-Omani residents.
1- Censuses held in 1993; 2003 and 2010
Censuses’ reference periods: 1993: n.a.; 2003: 7-8 December; 2010: 12-13 December.
2- National Registration System (2011- )
The civil registration records all Omani and expatriate residents. It is based on the civil status system and is maintained
by the General Directorate of Civil Status, a part of the Royal Oman Police.
Since 2004, registration of all vital events taking place in the Sultanate (births, death, marriages and divorces) in the civil register
is mandatory for Omanis and foreign residents of the Sultanate.
Characteristics of data:
Figures refer to 1. Omanis holding an official valid document registered in the National Registration System, or expired for less than ten years
2. Foreign residents holding valid visas, or visas expired for lesss than two years; dependents holding valid visas, providing that they are in the country.
Residence visa for expatriates includes residence visa for a wife of an Omani, student resident, multiple entry visa, employment visa,
employment contracting visa, official visit visa, investor visa. The dependent visa includes Family Reunion visas and relative/ friend visit visa.
2. Institution which provides data
National Center for Statistics and Information (NCSI)
3. Data availability
Figures for 2000 to 2018 were uploaded from NCSI Oman Data portal:
http://data.gov.om/OMPOP2016/population
Figures for 30 June 2019: NCSI’s homepage, population clock:
https://ncsi.gov.om/Pages/NCSI.aspx
Date of access: September 2019.
|
Emiratis |
Non-Emiratis |
Total |
|
Males |
Females |
Total |
Males |
Females |
Total |
Males |
Females |
Total |
| Federal Government |
34.9% |
24.2% |
31.6% |
1.0% |
0.7% |
1.0% |
2.3% |
2.5% |
2.3% |
| Local government |
50.0% |
55.4% |
51.7% |
6.5% |
5.1% |
6.3% |
8.1% |
8.9% |
8.3% |
| Private Sector |
7.4% |
10.1% |
8.2% |
81.8% |
43.9% |
75.0% |
79.0% |
41.4% |
72.0% |
| Shared (Government and Private) |
6.9% |
8.6% |
7.4% |
4.7% |
4.0% |
4.5% |
4.7% |
4.4% |
4.7% |
| Foreign |
0.2% |
1.0% |
0.4% |
0.6% |
1.0% |
0.7% |
0.6% |
1.0% |
0.7% |
| Diplomatic Authority |
0.0% |
0.0% |
0.0% |
0.1% |
0.0% |
0.0% |
0.1% |
0.0% |
0.0% |
| Non-Profit Organizations |
0.1% |
0.3% |
0.2% |
0.0% |
0.0% |
0.0% |
0.0% |
0.0% |
0.0% |
| Without Establishment |
0.4% |
0.2% |
0.3% |
0.1% |
0.4% |
0.1% |
0.1% |
0.3% |
0.1% |
| Private Households |
0.0% |
0.1% |
0.0% |
4.6% |
44.8% |
11.8% |
4.4% |
41.4% |
11.3% |
| Others |
0.1% |
0.0% |
0.0% |
0.0% |
0.0% |
0.0% |
0.0% |
0.0% |
0.0% |
| Unknown |
0.1% |
0.1% |
0.1% |
0.6% |
0.0% |
0.5% |
0.6% |
0.0% |
0.5% |
| Total |
100.0% |
100.0% |
100.0% |
100.0% |
100.0% |
100.0% |
100.0% |
100.0% |
100.0% |
Source: Federal Competitiveness and Statistitics Authority (FCSA)
ANNEXED NOTE
1. Characteristics of data, definitions and population counting operations in the UAE
Since 2016, the UAE Federal Competitiveness and Statistitics Authority (FCSA) (formerly National Bureau of Statistics)
resumed the implementation of Labour Force Surveys. The last one was conducted in 2009.
No metadata and methodological indications for the current Labour Force Survey are available.
No numeric figures are available.
Methodology and questionnaire for LFS 2009: http://methods.fcsa.gov.ae/Forms/SurveyQuestMeth/SurveyQuest.aspx
According to informations received by GLMM, the sampling base of the LFS could be family budget surveys, which in turn are based on the 2005 census,
with minor modifications. Results of LFS conducted at the national level, therefore, may be taken with caution.
2. Institution which provides data
Federal Competitiveness and Statistitics Authority (FCSA)
3. Data availability
The results of 2008, 2009, 2016 and 2017 Labour Force Surveys are available (in Excel format) in FCSA’s website, section “Statistics by Subject”
http://fcsa.gov.ae/en-us/Pages/Statistics/Statistics-by-Subject.aspx#/%3Fyear=&folder=Demography%20and%20Social/Labour%20Force&subject=Demography%20and%20Social
Data is also available in the section “Open data”, in the data portal (“Report builder”)
http://uaenumbers.fcsa.gov.ae/UAEFCSALF2019/labor-force
Last date of access: July 2019.
|
Emiratis |
Non-Emiratis |
Total |
|
Males |
Females |
Total |
Males |
Females |
Total |
Males |
Females |
Total |
| Agriculture, Forestry and Fishing |
0.39% |
0.03% |
0.28% |
1.16% |
0.02% |
0.95% |
1.13% |
0.02% |
0.92% |
| Mining and Quarrying |
6.68% |
3.38% |
5.66% |
1.15% |
0.36% |
1.00% |
1.36% |
0.58% |
1.21% |
| Manufacturing |
2.53% |
1.73% |
2.28% |
10.90% |
1.88% |
9.28% |
10.59% |
1.87% |
8.96% |
| Electricity, gas, Steam and Air Conditioning Supply |
1.76% |
3.03% |
2.15% |
0.54% |
0.20% |
0.48% |
0.58% |
0.41% |
0.55% |
| Water Supply; Sewerage, Waste Management and Remediation Activities |
0.23% |
0.40% |
0.29% |
0.27% |
0.10% |
0.24% |
0.27% |
0.12% |
0.24% |
| Construction |
0.81% |
0.75% |
0.79% |
29.08% |
1.49% |
24.10% |
28.00% |
1.44% |
23.06% |
| Wholesale and Retail Trade; Repair of Motor Vehicles and Motorcycles |
3.57% |
3.77% |
3.63% |
14.41% |
8.74% |
13.39% |
14.00% |
8.37% |
12.95% |
| Transportation and Storage |
4.47% |
4.48% |
4.47% |
7.03% |
2.67% |
6.25% |
6.94% |
2.80% |
6.17% |
| Accommodation and Food Services Activities |
0.33% |
0.33% |
0.33% |
5.70% |
3.05% |
5.22% |
5.49% |
2.85% |
5.00% |
| Information and Communication |
1.38% |
2.21% |
1.64% |
1.82% |
1.09% |
1.69% |
1.80% |
1.18% |
1.68% |
| Financial and Insurance Activities |
1.87% |
7.76% |
3.70% |
2.30% |
2.99% |
2.43% |
2.29% |
3.35% |
2.48% |
| Real Estate Activities |
0.81% |
0.81% |
0.81% |
1.83% |
1.76% |
1.81% |
1.79% |
1.69% |
1.77% |
| Professional, Scientific and Technical Activities |
1.67% |
2.49% |
1.92% |
3.72% |
3.90% |
3.76% |
3.65% |
3.80% |
3.67% |
| Administrative and Support Services Activities |
6.88% |
5.00% |
6.30% |
7.00% |
3.96% |
6.46% |
7.00% |
4.04% |
6.45% |
| Public Administration and Compulsory Social Security |
61.21% |
36.93% |
53.70% |
2.57% |
1.67% |
2.40% |
4.79% |
4.29% |
4.70% |
| Education |
1.58% |
16.01% |
6.04% |
1.40% |
9.95% |
2.95% |
1.41% |
10.40% |
3.09% |
| Human Health and Social Work Activities |
1.26% |
7.34% |
3.14% |
1.59% |
5.87% |
2.36% |
1.57% |
5.98% |
2.39% |
| Arts, Entertainment and Recreation |
0.40% |
1.05% |
0.60% |
0.49% |
1.08% |
0.60% |
0.49% |
1.07% |
0.60% |
| Other Services Activities |
0.88% |
0.84% |
0.87% |
1.61% |
1.72% |
1.63% |
1.58% |
1.65% |
1.60% |
| Activities of Households as Employers; Undifferentiated Goods- and Services-Producing Activities of Households for Own Use |
0.11% |
0.11% |
0.11% |
4.82% |
47.17% |
12.46% |
4.64% |
43.68% |
11.91% |
| Activities of Extraterritorial Organizations and Bodies |
0.07% |
0.02% |
0.05% |
0.08% |
0.00% |
0.07% |
0.08% |
0.00% |
0.07% |
| Unknown |
1.11% |
1.53% |
1.24% |
0.53% |
0.31% |
0.49% |
0.55% |
0.40% |
0.52% |
| Total |
100.00% |
100.00% |
100.00% |
100.00% |
100.00% |
100.00% |
100.00% |
100.00% |
100.00% |
Source: Federal Competitiveness and Statistitics Authority (FCSA)
ANNEXED NOTE
1. Characteristics of data, definitions and population counting operations in the UAE
Since 2016, the UAE Federal Competitiveness and Statistitics Authority (FCSA) (formerly National Bureau of Statistics)
resumed the implementation of Labour Force Surveys. The last one was conducted in 2009.
No metadata and methodological indications for the current Labour Force Survey are available.
No numeric figures are available.
Methodology and questionnaire for LFS 2009: http://methods.fcsa.gov.ae/Forms/SurveyQuestMeth/SurveyQuest.aspx
According to informations received by GLMM, the sampling base of the LFS could be family budget surveys, which in turn are based on the 2005 census,
with minor modifications. Results of LFS conducted at the national level, therefore, may be taken with caution.
2. Institution which provides data
Federal Competitiveness and Statistitics Authority (FCSA)
3. Data availability
The results of 2008, 2009, 2016 and 2017 Labour Force Surveys are available (in Excel format) in FCSA’s website, section “Statistics by Subject”
http://fcsa.gov.ae/en-us/Pages/Statistics/Statistics-by-Subject.aspx#/%3Fyear=&folder=Demography%20and%20Social/Labour%20Force&subject=Demography%20and%20Social
Data is also available in the section “Open data”, in the data portal (“Report builder”)
http://uaenumbers.fcsa.gov.ae/UAEFCSALF2019/labor-force
Last date of access: July 2019.
|
Emiratis |
Non-Emiratis |
Total |
|
Males |
Females |
Total |
Males |
Females |
Total |
Males |
Females |
Total |
| Lawmakers, Senior Officials and Managers |
12.8% |
11.6% |
12.4% |
7.8% |
6.1% |
7.5% |
8.0% |
6.5% |
7.7% |
| Professionals |
25.4% |
47.5% |
32.3% |
13.5% |
21.6% |
15.0% |
14.0% |
23.6% |
15.8% |
| Technicians and Associate Professionals |
25.0% |
18.3% |
22.9% |
11.7% |
8.8% |
11.2% |
12.2% |
9.5% |
11.7% |
| Supportive Office Staff |
8.1% |
16.7% |
10.8% |
3.5% |
7.0% |
4.1% |
3.6% |
7.7% |
4.4% |
| Services and Sales Workers |
23.7% |
4.6% |
17.8% |
14.4% |
10.4% |
13.7% |
14.8% |
10.0% |
13.9% |
| Skilled Agricultural, Forestry and Fishery Workers |
0.3% |
0.0% |
0.2% |
1.0% |
0.0% |
0.9% |
1.0% |
0.0% |
0.8% |
| Craft and Related Trades Workers |
0.6% |
0.2% |
0.5% |
23.6% |
0.3% |
19.4% |
22.8% |
0.3% |
18.6% |
| Factory Operators, Machinery and Assembly Workers |
1.4% |
0.1% |
1.0% |
12.7% |
0.5% |
10.5% |
12.3% |
0.5% |
10.1% |
| Elementary Occupations |
0.4% |
0.2% |
0.3% |
11.4% |
45.2% |
17.5% |
11.0% |
41.8% |
16.7% |
| Unknown |
2.3% |
0.7% |
1.8% |
0.3% |
0.1% |
0.3% |
0.4% |
0.2% |
0.4% |
| Total |
100.0% |
100.0% |
100.0% |
100.0% |
100.0% |
100.0% |
100.0% |
100.0% |
100.0% |
Source: Federal Competitiveness and Statistitics Authority (FCSA)
ANNEXED NOTE
1. Characteristics of data, definitions and population counting operations in the UAE
Since 2016, the UAE Federal Competitiveness and Statistitics Authority (FCSA) (formerly National Bureau of Statistics)
resumed the implementation of Labour Force Surveys. The last one was conducted in 2009.
No metadata and methodological indications for the current Labour Force Survey are available.
No numeric figures are available.
Methodology and questionnaire for LFS 2009: http://methods.fcsa.gov.ae/Forms/SurveyQuestMeth/SurveyQuest.aspx
According to informations received by GLMM, the sampling base of the LFS could be family budget surveys, which in turn are based on the 2005 census,
with minor modifications. Results of LFS conducted at the national level, therefore, may be taken with caution.
2. Institution which provides data
Federal Competitiveness and Statistitics Authority (FCSA)
3. Data availability
The results of 2008, 2009, 2016 and 2017 Labour Force Surveys are available (in Excel format) in FCSA’s website, section “Statistics by Subject”
http://fcsa.gov.ae/en-us/Pages/Statistics/Statistics-by-Subject.aspx#/%3Fyear=&folder=Demography%20and%20Social/Labour%20Force&subject=Demography%20and%20Social
Data is also available in the section “Open data”, in the data portal (“Report builder”)
http://uaenumbers.fcsa.gov.ae/UAEFCSALF2019/labor-force
Last date of access: July 2019.
|
Omanis |
Expatriates |
Total |
|
Males |
Females |
Total |
Males |
Females |
Total |
Males |
Females |
Total |
| Agriculture and Forestry & Fishing |
772 |
350 |
1,122 |
85,130 |
163 |
85,293 |
85,902 |
513 |
86,415 |
| Mining & quarrying |
27,887 |
2,455 |
30,342 |
17,014 |
641 |
17,655 |
44,901 |
3,096 |
47,997 |
| Manufacturing |
23,773 |
6,315 |
30,088 |
205,952 |
911 |
206,863 |
229,725 |
7,226 |
236,951 |
| Electricity, gas, steam and air conditioning supply |
2,192 |
358 |
2,550 |
964 |
9 |
973 |
3,156 |
367 |
3,523 |
| Water supply, sewerage, waste management and remediation activities |
1,062 |
105 |
1,167 |
4,975 |
20 |
4,995 |
6,037 |
125 |
6,162 |
| Construction |
47,814 |
11,683 |
59,497 |
561,187 |
794 |
561,981 |
609,001 |
12,477 |
621,478 |
| Wholesale & Retail Trade; Repair of motor vehicles & motorcycles |
24,341 |
12,671 |
37,012 |
229,836 |
5,252 |
235,088 |
254,177 |
17,923 |
272,100 |
| Transport, Storage |
15,587 |
3,239 |
18,826 |
67,741 |
1,736 |
69,477 |
83,328 |
4,975 |
88,303 |
| Accommodation and food service activities |
6,060 |
2,916 |
8,976 |
115,753 |
3,554 |
119,307 |
121,813 |
6,470 |
128,283 |
| Information and communications |
2,525 |
1,521 |
4,046 |
7,270 |
435 |
7,705 |
9,795 |
1,956 |
11,751 |
| Financial and insurance activities |
8,916 |
7,983 |
16,899 |
3,644 |
389 |
4,033 |
12,560 |
8,372 |
20,932 |
| Real estate activities |
764 |
331 |
1,095 |
6,859 |
130 |
6,989 |
7,623 |
461 |
8,084 |
| Professional, scientific and technical activities |
4,433 |
2,665 |
7,098 |
20,217 |
1,403 |
21,620 |
24,650 |
4,068 |
28,718 |
| Administrative and support services activities |
14,778 |
4,119 |
18,897 |
70,999 |
2,696 |
73,695 |
85,777 |
6,815 |
92,592 |
| Education |
2,465 |
4,650 |
7,115 |
7,645 |
8,874 |
16,519 |
10,110 |
13,524 |
23,634 |
| Human health and social work activities |
2,698 |
2,719 |
5,417 |
8,929 |
6,796 |
15,725 |
11,627 |
9,515 |
21,142 |
| Arts, entertainment and recreation |
395 |
189 |
584 |
3,035 |
763 |
3,798 |
3,430 |
952 |
4,382 |
| Other service activities |
623 |
770 |
1,393 |
56,335 |
6,053 |
62,388 |
56,958 |
6,823 |
63,781 |
| Activities of households as employers; undifferentiated goods- and services-producing activities of households for own use |
0 |
0 |
0 |
57,508 |
157,059 |
214,567 |
57,508 |
157,059 |
214,567 |
| Activities of extraterritorial organizations and bodies |
5 |
3 |
8 |
716 |
326 |
1,042 |
721 |
329 |
1,050 |
| Total |
187,090 |
65,042 |
252,132 |
1,531,709 |
198,004 |
1,729,713 |
1,718,799 |
263,046 |
1,981,845 |
Source: NCSI.
ANNEXED NOTE
1. Technical Notes and Definitions
Period of reference: end of year.
Data refer to:
1. the Omani population employed in the private sector (insured labourers)
Source : Public Authority for Social Insurance (PASI), Petroleum Development Oman (PDO)
2. expatriates employed in the private and domestic sectors (agregated figures).
Source: Royal Oman Police (ROP)
Classification of economic activities: ISIC Rev.4 (2008).
2. Institution which provides data
National Center for Statistics and Information (NCSI)
3. Data availability
The data is available in NCSI’s Monthly Statistical Bulletins (January and February 2019).
Expatriates: January 2019
https://www.ncsi.gov.om/Elibrary/LibraryContentDoc/bar_MSB%20January_9b52b4a8-2163-4060-9000-3f521023556e.pdf
Omanis in private sector: February 2019
https://www.ncsi.gov.om/Elibrary/LibraryContentDoc/bar_February%202019_13d8a353-a123-4661-a4f5-bcb00bc3fca6.pdf
Last date of access: 11 June 2019.
| Country of citizenship |
Male |
Female |
Total |
| India |
612,622 |
48,114 |
660,736 |
| Bangladesh |
629,750 |
28,472 |
658,222 |
| Pakistan |
216,193 |
1,409 |
217,602 |
| Philippines |
13,194 |
34,702 |
47,896 |
| Egypt |
25,455 |
6,270 |
31,725 |
| Uganda |
380 |
30,908 |
31,288 |
| Sri Lanka |
6,398 |
14,527 |
20,925 |
| Nepal |
11,141 |
5,916 |
17,057 |
| Tanzania |
1,513 |
12,305 |
13,818 |
| Other countries |
52,409 |
35,769 |
88,178 |
| Total |
1,569,055 |
218,392 |
1,787,447 |
Source: NCSI.
ANNEXED NOTE
1. Technical Notes and Definitions
Period of reference: December of the given year.
Data refer to the foreign population employed in all sectors (governmental, private and domestic sectors).
Independent, own-account workers are classified in the domestic sector
Original source of the data: Royal Oman Police (ROP).
2. Institution which provides data
National Center for Statistics and Information (NCSI)
3. Data availability
The data is available in NCSI’s Monthly Statistical Bulletin (January 2019).
https://www.ncsi.gov.om/Elibrary/LibraryContentDoc/bar_MSB%20January_9b52b4a8-2163-4060-9000-3f521023556e.pdf
Last date of access: 11 June 2019.
|
Omanis |
Expatriates |
Total |
|
Males |
Females |
Total |
Males |
Females |
Total |
Males |
Females |
Total |
| 0 – 4 |
201,339 |
193,006 |
394,345 |
17,056 |
16,293 |
33,349 |
218,395 |
209,299 |
427,694 |
| 5 – 9 |
165,418 |
159,972 |
325,390 |
15,254 |
14,458 |
29,712 |
180,672 |
174,430 |
355,102 |
| 10 – 14 |
122,946 |
118,769 |
241,715 |
11,748 |
10,944 |
22,692 |
134,694 |
129,713 |
264,407 |
| 15 – 19 |
110,514 |
107,073 |
217,587 |
9,180 |
8,034 |
17,214 |
119,694 |
115,107 |
234,801 |
| 20 – 24 |
117,762 |
113,540 |
231,302 |
107,899 |
25,162 |
133,061 |
225,661 |
138,702 |
364,363 |
| 25 – 29 |
125,905 |
122,600 |
248,505 |
364,552 |
56,083 |
420,635 |
490,457 |
178,683 |
669,140 |
| 30 – 34 |
117,206 |
115,224 |
232,430 |
397,328 |
65,671 |
462,999 |
514,534 |
180,895 |
695,429 |
| 35 – 39 |
94,110 |
93,627 |
187,737 |
288,281 |
49,176 |
337,457 |
382,391 |
142,803 |
525,194 |
| 40 – 44 |
66,645 |
67,005 |
133,650 |
185,632 |
35,649 |
221,281 |
252,277 |
102,654 |
354,931 |
| 45 – 49 |
44,462 |
42,279 |
86,741 |
132,771 |
22,561 |
155,332 |
177,233 |
64,840 |
242,073 |
| 50 – 54 |
32,861 |
34,053 |
66,914 |
81,545 |
13,538 |
95,083 |
114,406 |
47,591 |
161,997 |
| 55 – 59 |
28,491 |
31,290 |
59,781 |
47,076 |
7,799 |
54,875 |
75,567 |
39,089 |
114,656 |
| 60 – 64 |
20,370 |
24,865 |
45,235 |
23,709 |
3,472 |
27,181 |
44,079 |
28,337 |
72,416 |
| 65 – 69 |
15,892 |
18,463 |
34,355 |
5,588 |
1,700 |
7,288 |
21,480 |
20,163 |
41,643 |
| 70 – 74 |
12,307 |
13,517 |
25,824 |
1,631 |
782 |
2,413 |
13,938 |
14,299 |
28,237 |
| 75 – 79 |
10,178 |
11,010 |
21,188 |
647 |
393 |
1,040 |
10,825 |
11,403 |
22,228 |
| 80+ |
13,335 |
13,202 |
26,537 |
465 |
393 |
858 |
13,800 |
13,595 |
27,395 |
| Total |
1,299,741 |
1,279,495 |
2,579,236 |
1,690,362 |
332,108 |
2,022,470 |
2,990,103 |
1,611,603 |
4,601,706 |
Source: NCSI
ANNEXED NOTE
1. Technical Notes and Definitions
Reference period: middle of the year.
Original data source: Royal Oman Police.
2. Institution which provides data
National Center for Statistics and Information (NCSI)
3. Data availability
NCSI. Population Statistics, Issue 8, 2018-2019
https://www.ncsi.gov.om/Elibrary/LibraryContentDoc/bar_population2018_ea9a7a9b-65d1-4b2a-856e-093d4406209d.pdf
Last date of access: 11 June 2019.
|
Population by country of citizenship (selected nationalities) |
|
|
|
Males |
Females |
Total |
| Oman |
1.299.741 |
1.279.495 |
2.579.236 |
| India |
648.167 |
100.294 |
748.461 |
| Bangladesh |
651.744 |
38.663 |
690.407 |
| Pakistan |
235.765 |
21.340 |
257.105 |
| Egypt |
32.831 |
17.600 |
50.431 |
| Philippines |
14.034 |
35.209 |
49.243 |
| Uganda |
352 |
31.634 |
31.986 |
| Sri Lanka |
7.334 |
15.729 |
23.063 |
| Nepal |
11.075 |
6.673 |
17.748 |
| Tanzania |
1.856 |
14.715 |
16.571 |
| Indonesia |
737 |
9.222 |
9.959 |
| Ethiopia |
126 |
8.303 |
8.429 |
| total non-Omanis |
1.690.362 |
332.108 |
2.022.470 |
| Total |
2.990.103 |
1.611.603 |
4.601.706 |
Source: NCSI
ANNEXED NOTE
1. Technical Notes and Definitions
GLMM’s calculations. Estimates based on total figures and percentage distribution
of foreign nationals by sex published in: NCSI. Population Statistics, Issue 8, 2018-2019.
Reference period: middle of the year.
Original data source: Royal Oman Police.
2. Institution which provides data
National Center for Statistics and Information (NCSI)
3. Data availability
NCSI. Population Statistics, Issue 8, 2018-2019
https://www.ncsi.gov.om/Elibrary/LibraryContentDoc/bar_population2018_ea9a7a9b-65d1-4b2a-856e-093d4406209d.pdf
Last date of access: 11 June 2019.
| Country of citizenship |
|
lower est. |
upper est. |
| 1 |
India |
2,266,216 |
3,200,000 |
| 2 |
Pakistan |
1,343,737 |
2,700,000 |
| 3 |
Bangladesh |
1,157,072 |
2,100,000 |
| 4 |
Egypt |
871,621 |
2,900,000 |
| 5 |
Syria |
673,669 |
2,480,000 |
| 6 |
Yemen |
697,296 |
> 700,000 (workers?) |
| 7 |
Philippines |
583,985 |
1,500,000-1,800,000 |
| 8 |
Indonesia |
470,000 |
1,548,032 |
| 9 |
Nepal |
455,905 |
| 10 |
Sudan |
435,810 |
470,000 |
| 11 |
Afghanistan |
300,000 (workers) |
435,810 |
| 12 |
Sri Lanka |
200,000 |
650,000 |
| 13 |
Palestine (holders of |
n.a. |
n.a. |
| travel documents) |
| 14 |
Burma (Myanmar) |
242,510 |
| 15 |
Jordan |
217,904 |
400,000 |
| 16 |
Ethiopia |
148,753 |
>400,000 |
| 17 |
Lebanon |
139,459 |
210,000 |
| Source: Various (see endnote) |
|
1. Data collection methodology;
Estimates have been collected from the UN database, from academic publications,
from Saudi press sources quoting Saudi officials, foreign diplomatic missions, and authorities from sending countries.
The exact origin of the estimate (stocks of expatriates or number of permit holders, or rough guess)
was not disclosed in most sources, nor was it inscribed in a specific time period
(before/ after the crackdowns and the deportations, for instance).
2. Data availability
1-UN/DESA. Migrant Stock By Origin And Destination, 2017 revision; http://www.arabnews.com/node/1192131/saudi-arabia
2-UN/DESA. Migrant Stock By Origin And Destination, 2017 revision; http://saudigazette.com.sa/article/531055; https://arynews.tv/en/2-7-million-pakistanis-living-saudi-arabia/
3-UN/DESA. Migrant Stock By Origin And Destination, 2017 revision; http://www.theindependentbd.com/post/142680; https://www.reuters.com/article/bangladesh-saudi/saudi-arabia-lifts-ban-on-bangladeshi-workers-after-seven-years-ministry-idUSL3N1AS3NP
4-UN/DESA. Migrant Stock By Origin And Destination, 2017 revision; http://www.arabnews.com/news/483296; http://english.ahram.org.eg/NewsContent/3/12/87637/Business/Economy/Thousands-of-Egyptians-facing-visa-troubles-in-Sau.aspx
5-Figures of displaced Syrians residing in Saudi Arabia since 2011 on a visit visa (December 2018) only, in: Osmandzikovic, E. The Saudi Approach to Reception and Accommodation: The Case of Displaced Syrians, “Commentaries”, King Faisal Center for Research and Islamic Studies, 22 April 2019;
https://english.alarabiya.net/en/News/middle-east/2016/12/05/Saudi-sets-pace-globally-in-humanitarian-aid-says-envoy.html
6-UN/DESA. Migrant Stock By Origin And Destination, 2017 revision; https://www.reuters.com/article/us-yemen-security-saudi-migrants/u-n-urges-saudi-arabia-not-to-deport-yemeni-migrants-to-war-zone-idUSKBN1IA1F7
7-UN/DESA. Migrant Stock By Origin And Destination, 2017 revision; http://www.arabnews.com/node/1259591/middle-east
8-https://www.globalmediainsight.com/blog/saudi-arabia-population-statistics-2018/; UN/DESA. Migrant Stock By Origin And Destination, 2017 revision.
9-UN/DESA. Migrant Stock By Origin And Destination, 2017 revision;
10-UN/DESA. Migrant Stock By Origin And Destination, 2017 revision; https://www.globalmediainsight.com/blog/saudi-arabia-population-statistics-2018/
11-https://www.pajhwok.com/en/2017/11/22/passports-being-distributed-afghans-saudi-arabia; UN/DESA. Migrant Stock By Origin And Destination, 2017 revision
12-http://www.arabnews.com/node/1048796/saudi-arabia; https://www.globalmediainsight.com/blog/saudi-arabia-population-statistics-2018/
13-n.a.
14-UN/DESA. Migrant Stock By Origin And Destination, 2017 revision;
15-UN/DESA. Migrant Stock By Origin And Destination, 2017 ; http://www.ammonnews.net/article/237713 (2015 estimate).
16-UN/DESA. Migrant Stock By Origin And Destination, 2017 ; http://www.africanews.com/2017/07/26/ethiopia-confirms-30-day-amnesty-extension-for-illegal-migrants-in-saudi/
17-UN/DESA. Migrant Stock By Origin And Destination, 2017; https://stepfeed.com/10-biggest-lebanese-diaspora-communities-4373
Last date of access: May 2019
| Nationality |
Bahrain |
Kuwait |
Oman |
Qatar |
UAE |
|
(mid-2018) |
(end 2018) |
(mid-2017) |
(c.2016) |
(c. 2015) |
| Afghanistan |
22 |
|
|
3,500 – 4,000 |
150,000 |
| Azerbaijan |
22 |
|
|
120 |
7,000 |
| Bangladesh |
133,375 |
281,131 |
718,856 |
280,000 |
700,000 |
| Bhutan |
74 |
|
|
|
|
| China |
1,011 |
|
|
>10,000 |
200,000 |
| India |
316,784 |
1,012,104 |
766,735 |
650,000 |
2,600,000 |
| Indonesia |
744 |
2,946* |
14,155 |
43,000 |
85,000 |
| Iran, Islamic Rep. of |
243 |
|
|
30,000 |
400– 500,000*** |
| Japan |
140 |
|
|
944 |
2,603 |
| Kazakhstan |
21 |
|
|
200 |
5,000 – 6,000 |
| Korea, Republic of |
147 |
|
|
2,000 |
10,000 |
| Kyrgyzstan |
47 |
|
|
330 |
|
| Malaysia |
211 |
|
|
4,848 |
6,000 – 7,000 |
| Myanmar |
175 |
|
|
|
|
| Nepal |
16,757 |
70,378 |
16,580 |
>350,000 |
300,000 |
| Pakistan |
58,877 |
109,427 |
268,868 |
125,000 |
1,200,000 |
| Philippines |
36,796 |
213,989 |
45,213 |
260,000 |
525,530 |
| Singapore |
40 |
|
|
300 |
>2,000 |
| Sri Lanka |
5,922 |
93,749 |
20,003 |
145,256 |
300,000 |
| Taiwan |
9 |
|
|
|
400 |
| Thailand |
1,698 |
|
|
4,500 |
10,000 |
| Turkey |
1,610 |
|
|
8,000 |
10,000 |
| Uzbekistan |
52 |
|
|
|
|
| Viet Nam |
86 |
|
|
2,000 |
|
| Asia |
|
1,868,208 |
|
|
|
| Algeria |
102 |
|
|
5,000 |
10,000 |
| Egypt |
24,569 |
670,524 |
46,970 |
200,000 |
400,000*** |
| Iraq |
472 |
|
|
8,976 |
52,000 |
| Jordan |
7,791 |
|
|
40,000 |
200,000 |
| Kuwait |
36 |
|
|
|
|
| Lebanon |
987 |
|
|
24,000 |
100,000*** |
| Libyan Arab Jamahiriya |
55 |
|
|
|
|
| Mauritania |
54 |
|
|
|
5,000 |
| Morocco |
1,489 |
|
|
|
|
| Oman |
174 |
|
|
|
|
| Qatar |
19 |
|
|
|
|
| Saudi Arabia |
396 |
127,604 |
|
|
|
| Sudan |
1,113 |
|
|
50,000 |
75,000 |
| Syria |
3,599 |
160,120 |
|
54,000 |
|
| Tunisia |
712 |
|
|
20,000 |
|
| United Arab Emirates |
19 |
|
|
|
|
| West bank and Gaza strip |
277 |
|
|
20,000 |
150,000 |
| Yemen |
5,720 |
|
|
|
90,000 |
| Arab countries |
|
1,261,062 |
|
|
|
| Benin |
4 |
|
|
82 |
|
| Cameroon |
204 |
|
|
|
|
| Central African Rep. |
130 |
|
|
|
|
| Chad |
12 |
|
|
|
200 |
| Eritrea |
35 |
|
|
10,000 |
3,000 |
| Ethiopia |
1,160 |
18,905* |
13,572 |
22,000 |
90,000 |
| Gambia |
106 |
|
|
135 |
|
| Ghana |
771 |
2,231* |
|
5,000 |
500 |
| Ivory Coast |
5 |
3,036* |
|
|
|
| Kenya |
1,618 |
|
|
14,000 |
40,000 |
| Liberia |
|
|
|
40 |
|
| Madagascar |
2 |
3,589* |
|
|
|
| Mali |
12 |
|
|
|
|
| Mauritius |
27 |
|
|
|
|
| Nigeria |
115 |
|
|
7,500 |
|
| Senegal |
22 |
|
|
a few hundreds |
700 – 800 |
| Seychelles |
27 |
|
|
|
|
| Somalia |
58 |
|
|
|
70,000 |
| South Africa |
436 |
|
|
6,000 |
100,000 |
| Tanzania, United Rep. of |
88 |
|
17,077 |
|
|
| Uganda |
756 |
|
20,886 |
3,000 |
|
| Zambia |
4 |
|
|
|
|
| Zimbabwe |
57 |
|
|
|
|
| Africa |
|
47,227 |
|
|
|
| Albania |
63 |
|
|
1,200 |
200 – 300 |
| Austria |
42 |
|
|
500 |
2,500 |
| Belarus |
56 |
|
|
200 |
2,500 |
| Belgium |
61 |
|
|
600 |
3,000 |
| Bosnia and Herzegovina |
16 |
|
|
|
1,000 – 2,000 |
| Bulgaria |
319 |
|
|
500 |
|
| Croatia |
21 |
|
|
500 |
|
| Cyprus |
94 |
|
|
|
1,000 |
| Czech Republic |
24 |
|
|
100 |
1,500 |
| Denmark |
34 |
|
|
900 |
3,000 – 4,000 |
| Finland |
9 |
|
|
200 |
1,180 |
| France |
389 |
|
|
5,000 |
25,000 |
| Germany |
212 |
|
|
2,000 |
12,000 |
| Greece |
141 |
|
|
2,200 |
5,000 |
| Hungary |
35 |
|
|
300 |
2,500 |
| Ireland |
288 |
|
|
2,000 |
7,000 |
| Italy |
200 |
|
|
2,100 |
10,000 |
| Latvia |
3 |
|
|
10 |
300 |
| Macedonia |
|
|
|
1,000 |
|
| Moldova, Rep. of |
12 |
|
|
154 |
|
| Netherlands |
75 |
|
|
1,432 |
5,000 |
| Norway |
12 |
|
|
160 |
1,184 |
| Poland |
82 |
|
|
700 – 800 |
2,348 |
| Portugal |
93 |
|
|
1,500 |
|
| Romania |
136 |
|
|
2,500 |
|
| Russian Federation |
144 |
|
|
2,000 |
|
| Serbia and Montenegro |
9 |
|
|
2,000 |
5,000 |
| Slovakia |
37 |
|
|
100 |
1,000 |
| Slovenia |
4 |
|
|
|
100 – 150 |
| Spain |
107 |
|
|
3,500 |
12,000 |
| Sweden |
102 |
|
|
527 |
4,000 |
| Switzerland |
148 |
|
|
250 |
2,430 |
| Ukraine |
159 |
|
|
1,000 |
5,000 |
| United Kingdom |
4,190 |
|
|
25,000 |
120,000 |
| Europe |
|
18,076 |
|
|
|
| United States |
897 |
|
|
>11,000** |
50,000 |
| Canada |
428 |
|
|
9,000 |
40,000 |
| North America |
|
20,513 |
|
|
|
| Argentina |
7 |
|
|
400 |
|
| Brazil |
91 |
|
|
1,500 |
|
| Chile |
12 |
|
|
|
270 |
| Colombia |
42 |
|
|
200 |
|
| Cuba |
7 |
|
|
600 |
|
| Dominican Republic |
3 |
|
|
44 |
2,000-3,000 |
| Ecuador |
8 |
|
|
100 |
|
| El Salvador |
7 |
|
|
100 |
|
| Mexico |
48 |
|
|
400 |
3,000 – 3,500 |
| Peru |
7 |
|
|
|
300 |
| Venezuela |
43 |
|
|
337 |
1,200 |
| South and Latin America |
|
1,813 |
|
|
|
| Australia |
297 |
|
|
5,500 |
16,000 |
| New Zealand |
134 |
|
|
989 |
444 |
| Australia and Oceania |
|
1,626 |
|
|
|
| Other/Unclassified |
11,429 |
|
105,679 |
21 |
100 |
| Total foreign nationals |
648,873 |
3,218,525 |
2,054,594 |
n.a. |
n.a. |
ANNEXED NOTE
1. Technical Notes and Definitions
* Domestic labourers only.
**Only Military personnel. Data for overall US population in Qatar not available
*** 2013 data.
Blank cell means data was not available.
Estimates for Saudi Arabia were not included here.
See section POP 1.2 in the Saudi Arabia page for some estimates and ranges of foreign residents by country of nationality.
2. Characteristics and sources of data/ estimates:
Bahrain:
Expatriate management system (EMS) of LMRA, quarterly data. Figures were calculated by the author using the following datasets:
http://blmi.lmra.bh/2018/06/data/ems/Table_07a.xls (workers) and http://blmi.lmra.bh/2018/06/data/ems/Table_60.xls (family dependents).
These estimates of foreign residents are inferred from figures of expat visa issuances (GCC workers are not included).
EMS data include domestic workers but exclude work visas for artists and certain other categories of workers in non-civilian organisations
(Armed Forces, for instance).
Kuwait:
Public Authority for Civil Information (PACI) data (administrative records).
https://www.paci.gov.kw/stat/
Oman:
NCSI. Population Statistics, Issue 7, 2018.
Data is taken from administrative records.
Qatar:
Data from foreign embassies and press sources (national or foreign officials), in:
SNOJ, J. Population of Qatar by nationality – 2017 report, Priya DSouza Consultancy, February 2017.
http://priyadsouza.com/population-of-qatar-by-nationality-in-2017/
However, the current figures were found to match official records from the Qatari Interior Ministry (residency documents).
Figures for the total foreign population cannot be included, since the estimates miss certain countries,
and were released for various dates of reference.
UAE:
Data from foreign embassies and press sources (national or foreign officials), in:
Snoj, Jure. “UAE’s population- by nationality”, BQ Magazine, Doha, April 12, 2015.
http://www.bq-magazine.com/economy/socioeconomics/2015/04/uae-population-by-nationality
(link dead). For details on the original publication, see:
https://gulfmigration.grc.net/uae-estimates-of-population-residing-in-the-uae-by-country-of-citizenship-selected-countries-2014/
Figures for the total foreign population cannot be included, since the estimates miss certain countries,
and were released for various dates of reference.
Last date of access: May 2019.
| Nationality |
|
Saudis |
|
|
Non-Saudis |
|
|
TOTAL |
|
| Age Groups |
Males |
Females |
Total |
Males |
Females |
Total |
Males |
Females |
Total |
| 0 – 4 |
1,123,261 |
1,084,529 |
2,207,790 |
298,126 |
283,015 |
581,141 |
1,421,387 |
1,367,544 |
2,788,931 |
| 5 – 9 |
1,097,810 |
1,060,664 |
2,158,474 |
377,142 |
360,021 |
737,163 |
1,474,952 |
1,420,685 |
2,895,637 |
| 10 – 14 |
979,511 |
952,700 |
1,932,211 |
310,548 |
293,553 |
604,101 |
1,290,059 |
1,246,253 |
2,536,312 |
| 15 – 19 |
926,156 |
894,846 |
1,821,002 |
254,562 |
237,191 |
491,753 |
1,180,718 |
1,132,037 |
2,312,755 |
| 20 – 24 |
1,072,129 |
980,185 |
2,052,314 |
300,596 |
223,588 |
524,184 |
1,372,725 |
1,203,773 |
2,576,498 |
| 25 – 29 |
996,017 |
975,252 |
1,971,269 |
764,993 |
453,068 |
1,218,061 |
1,761,010 |
1,428,320 |
3,189,330 |
| 30 – 34 |
896,790 |
881,961 |
1,778,751 |
1,001,237 |
450,453 |
1,451,690 |
1,898,027 |
1,332,414 |
3,230,441 |
| 35 – 39 |
786,779 |
768,617 |
1,555,396 |
1,470,571 |
579,037 |
2,049,608 |
2,257,350 |
1,347,654 |
3,605,004 |
| 40 – 44 |
665,841 |
641,244 |
1,307,085 |
1,388,695 |
528,066 |
1,916,761 |
2,054,536 |
1,169,310 |
3,223,846 |
| 45 – 49 |
559,539 |
529,550 |
1,089,089 |
1,021,389 |
283,517 |
1,304,906 |
1,580,928 |
813,067 |
2,393,995 |
| 50 – 54 |
446,271 |
421,928 |
868,199 |
695,508 |
106,590 |
802,098 |
1,141,779 |
528,518 |
1,670,297 |
| 55 – 59 |
348,081 |
319,715 |
667,796 |
416,427 |
69,675 |
486,102 |
764,508 |
389,390 |
1,153,898 |
| 60 – 64 |
252,157 |
235,932 |
488,089 |
222,927 |
49,848 |
272,775 |
475,084 |
285,780 |
760,864 |
| 65 – 69 |
153,429 |
162,787 |
316,216 |
77,344 |
30,741 |
108,085 |
230,773 |
193,528 |
424,301 |
| 70 – 74 |
111,979 |
114,965 |
226,944 |
35,395 |
19,851 |
55,246 |
147,374 |
134,816 |
282,190 |
| 75 – 79 |
72,990 |
74,509 |
147,499 |
16,526 |
4,882 |
21,408 |
89,516 |
79,391 |
168,907 |
| 80+ |
87,155 |
93,348 |
180,503 |
13,075 |
6,876 |
19,951 |
100,230 |
100,224 |
200,454 |
| Total |
10,575,895 |
10,192,732 |
20,768,627 |
8,665,061 |
3,979,972 |
12,645,033 |
19,240,956 |
14,172,704 |
33,413,660 |
Source: GaStat
ANNEXED NOTE
1. Technical Notes and Definitions
Reference period: mid-2018
The figures are estimated on the basis of the results of the Demographic Survey held in 2016.
Demographic survey 2016 is the fourth demographic survey conducted in Saudi Arabia since 1998.
Dates of survey: April 29, 2016 to June 7, 2016
Sampling framework: census 2010
Size of the sample: 33,350 households nationwide.
Population of reference: The demographic household sample includes the Saudi and non-Saudis households living in the kingdom.
It also covers individuals who takes the lodging houses as their residences and the Saudis who are temporarily living abroad
for medication, study, tourism, etc who are counted as members of the included households as long as they were picked up in the sample.
2. Institution which provides data
General Authority for Statistics (GAStat)
3. Data availability
The results of the Demographic Survey 2016 are available on GaStat website, in English and Arabic, in PDF and Excel formats
https://www.stats.gov.sa/en/4522
Last date of access: July 2017.
|
|
Saudis |
|
|
Non-Saudis |
|
|
Total |
|
| year |
males |
females |
total |
males |
females |
total |
males |
females |
total |
| 1974 |
3,166,013 |
2,997,792 |
6,163,805 |
517,178 |
257,219 |
774,397 |
3,683,191 |
3,255,011 |
6,938,202 |
| 1975 |
3,299,247 |
3,129,932 |
6,429,179 |
574,639 |
283,192 |
857,831 |
3,873,886 |
3,413,124 |
7,287,010 |
| 1976 |
3,436,784 |
3,266,657 |
6,703,441 |
638,241 |
311,670 |
949,911 |
4,075,025 |
3,578,327 |
7,653,352 |
| 1977 |
3,578,634 |
3,408,002 |
6,986,636 |
708,602 |
342,876 |
1,051,478 |
4,287,236 |
3,750,878 |
8,038,114 |
| 1978 |
3,724,791 |
3,553,986 |
7,278,777 |
786,393 |
377,049 |
1,163,442 |
4,511,184 |
3,931,035 |
8,442,219 |
| 1979 |
3,875,233 |
3,704,613 |
7,579,846 |
872,345 |
414,448 |
1,286,793 |
4,747,578 |
4,119,061 |
8,866,639 |
| 1980 |
4,029,922 |
3,859,872 |
7,889,794 |
967,252 |
455,350 |
1,422,602 |
4,997,174 |
4,315,222 |
9,312,396 |
| 1981 |
4,188,801 |
4,019,733 |
8,208,534 |
1,071,977 |
500,051 |
1,572,028 |
5,260,778 |
4,519,784 |
9,780,562 |
| 1982 |
4,351,793 |
4,184,148 |
8,535,941 |
1,187,454 |
548,870 |
1,736,324 |
5,539,247 |
4,733,018 |
10,272,265 |
| 1983 |
4,518,803 |
4,353,048 |
8,871,851 |
1,314,694 |
602,145 |
1,916,839 |
5,833,497 |
4,955,193 |
10,788,690 |
| 1984 |
4,689,709 |
4,526,340 |
9,216,049 |
1,454,788 |
660,237 |
2,115,025 |
6,144,497 |
5,186,577 |
11,331,074 |
| 1985 |
4,864,370 |
4,703,911 |
9,568,281 |
1,608,915 |
723,531 |
2,332,446 |
6,473,285 |
5,427,442 |
11,900,727 |
| 1986 |
5,042,619 |
4,885,623 |
9,928,242 |
1,778,342 |
792,434 |
2,570,776 |
6,820,961 |
5,678,057 |
12,499,018 |
| 1987 |
5,224,266 |
5,071,312 |
10,295,578 |
1,964,432 |
867,378 |
2,831,810 |
7,188,698 |
5,938,690 |
13,127,388 |
| 1988 |
5,409,093 |
5,260,787 |
10,669,880 |
2,168,647 |
948,820 |
3,117,467 |
7,577,740 |
6,209,607 |
13,787,347 |
| 1989 |
5,596,859 |
5,453,833 |
11,050,692 |
2,392,552 |
1,037,242 |
3,429,794 |
7,989,411 |
6,491,075 |
14,480,486 |
| 1990 |
5,787,294 |
5,650,206 |
11,437,500 |
2,637,820 |
1,133,151 |
3,770,971 |
8,425,114 |
6,783,357 |
15,208,471 |
| 1991 |
5,980,104 |
5,849,635 |
11,829,739 |
2,906,237 |
1,237,079 |
4,143,316 |
8,886,341 |
7,086,714 |
15,973,055 |
| 1992 |
6,170,757 |
6,047,443 |
12,218,200 |
3,193,111 |
1,347,068 |
4,540,179 |
9,363,868 |
7,394,511 |
16,758,379 |
| 1993 |
6,334,907 |
6,216,789 |
12,551,696 |
3,322,551 |
1,402,925 |
4,725,476 |
9,657,458 |
7,619,714 |
17,277,172 |
| 1994 |
6,488,628 |
6,375,082 |
12,863,710 |
3,397,772 |
1,440,127 |
4,837,899 |
9,886,400 |
7,815,209 |
17,701,609 |
| 1995 |
6,646,071 |
6,537,398 |
13,183,469 |
3,474,692 |
1,478,314 |
4,953,006 |
10,120,763 |
8,015,712 |
18,136,475 |
| 1996 |
6,807,325 |
6,703,837 |
13,511,162 |
3,553,349 |
1,517,511 |
5,070,860 |
10,360,674 |
8,221,348 |
18,582,022 |
| 1997 |
6,972,483 |
6,874,505 |
13,846,988 |
3,633,782 |
1,557,746 |
5,191,528 |
10,606,265 |
8,432,251 |
19,038,516 |
| 1998 |
7,141,639 |
7,049,510 |
14,191,149 |
3,716,031 |
1,599,045 |
5,315,076 |
10,857,670 |
8,648,555 |
19,506,225 |
| 1999 |
7,314,889 |
7,228,960 |
14,543,849 |
3,800,137 |
1,641,438 |
5,441,575 |
11,115,026 |
8,870,398 |
19,985,424 |
| 2000 |
7,492,332 |
7,412,968 |
14,905,300 |
3,886,141 |
1,684,952 |
5,571,093 |
11,378,473 |
9,097,920 |
20,476,393 |
| 2001 |
7,674,070 |
7,601,651 |
15,275,721 |
3,974,087 |
1,729,617 |
5,703,704 |
11,648,157 |
9,331,268 |
20,979,425 |
| 2002 |
7,860,206 |
7,795,126 |
15,655,332 |
4,064,017 |
1,775,464 |
5,839,481 |
11,924,223 |
9,570,590 |
21,494,813 |
| 2003 |
8,050,847 |
7,993,515 |
16,044,362 |
4,155,978 |
1,822,524 |
5,978,502 |
12,206,825 |
9,816,039 |
22,022,864 |
| 2004 |
8,245,575 |
8,198,412 |
16,443,987 |
4,248,335 |
1,871,564 |
6,119,899 |
12,493,910 |
10,069,976 |
22,563,886 |
| 2005 |
8,453,097 |
8,401,060 |
16,854,157 |
4,506,528 |
1,968,899 |
6,475,427 |
12,959,625 |
10,369,959 |
23,329,584 |
| 2006 |
8,663,597 |
8,606,584 |
17,270,181 |
4,780,413 |
2,071,296 |
6,851,709 |
13,444,010 |
10,677,880 |
24,121,890 |
| 2007 |
8,876,666 |
8,814,670 |
17,691,336 |
5,070,944 |
2,179,018 |
7,249,962 |
13,947,610 |
10,993,688 |
24,941,298 |
| 2008 |
9,091,249 |
9,024,301 |
18,115,550 |
5,379,132 |
2,292,343 |
7,671,475 |
14,470,381 |
11,316,644 |
25,787,025 |
| 2009 |
9,307,550 |
9,235,696 |
18,543,246 |
5,706,050 |
2,411,561 |
8,117,611 |
15,013,600 |
11,647,257 |
26,660,857 |
| 2010 |
9,575,257 |
9,201,253 |
18,776,510 |
5,956,214 |
2,503,432 |
8,459,646 |
15,531,471 |
11,704,685 |
27,236,156 |
| 2011* |
9,743,626 |
9,662,059 |
19,405,685 |
6,297,735 |
2,672,935 |
8,970,670 |
16,041,361 |
12,334,994 |
28,376,355 |
| 2012* |
9,962,431 |
9,876,017 |
19,838,448 |
6,591,296 |
2,766,151 |
9,357,447 |
16,553,727 |
12,642,168 |
29,195,895 |
| 2013** |
9,800,955 |
9,408,798 |
19,209,753 |
7,054,434 |
3,115,943 |
10,170,377 |
16,855,389 |
12,524,741 |
29,380,130 |
| 2014** |
9,844,758 |
9,467,938 |
19,312,696 |
7,373,986 |
3,310,419 |
10,684,405 |
17,218,744 |
12,778,357 |
29,997,101 |
| 2015** |
10,034,561 |
9,658,078 |
19,692,639 |
7,696,791 |
3,501,306 |
11,198,097 |
17,731,352 |
13,159,384 |
30,890,736 |
| 2016 |
10,231,364 |
9,850,218 |
20,081,582 |
8,028,355 |
3,677,643 |
11,705,998 |
18,259,719 |
13,527,861 |
31,787,580 |
| 2017** |
10,404,282 |
10,023,075 |
20,427,357 |
8,341,564 |
3,843,720 |
12,185,284 |
18,745,846 |
13,866,795 |
32,612,641 |
| 2018** |
10,575,895 |
10,192,732 |
20,768,627 |
8,665,061 |
3,979,972 |
12,645,033 |
19,240,956 |
14,172,704 |
33,413,660 |
Source: Population estimates based on the results of population censuses 1974; 1992; 2004 and 2010 and Demographic Survey 2016.
Central Department for Statistics and Information (CDSI)/ General Authority for Statistics (GaStat)
* mid-year estimates based on figures from census 2010
** mid-year estimates based on figures from Demographic Research Bulletin 2016
ANNEXED NOTE
1. Technical Notes and Definitions
Reference periods: middle of given years
2. Institution which provides data
Central Department of Statistics and Information (CDSI), Ministry and Economy and Planning/ General Authority for Statistics (GaStat)
http://www.stats.gov.sa/en
https://www.stats.gov.sa/ar/node
3. Data availability
Results of censuses conducted in 1992, 2004 and 2010 and Demographic Survey 2016 are available on the website of the General
Authority for Statistics (previously CDSI), in downloadable Excel and PDF formats.
https://www.stats.gov.sa/en/13
https://www.stats.gov.sa/ar/13
https://www.stats.gov.sa/en/4522
Mid-year estimates of population in Saudi Arabia since 1974 (time series) are available in Saudi Arabia Monetary Agency (SAMA)
Yearly Statistics: http://www.sama.gov.sa/en-US/EconomicReports/Pages/YearlyStatistics.aspx
GaStat Statistical Yearbooks (https://www.stats.gov.sa/en/46) and yearly estimates (https://www.stats.gov.sa/en/43) do not offer
time series.
Last date of access: April 2019.
| year |
Saudis |
Non-Saudis |
Total |
| 1974 |
6,163,805 |
774,397 |
6,938,202 |
| 1975 |
6,429,179 |
857,831 |
7,287,010 |
| 1976 |
6,703,441 |
949,911 |
7,653,352 |
| 1977 |
6,986,636 |
1,051,478 |
8,038,114 |
| 1978 |
7,278,777 |
1,163,442 |
8,442,219 |
| 1979 |
7,579,846 |
1,286,793 |
8,866,639 |
| 1980 |
7,889,794 |
1,422,602 |
9,312,396 |
| 1981 |
8,208,534 |
1,572,028 |
9,780,562 |
| 1982 |
8,535,941 |
1,736,324 |
10,272,265 |
| 1983 |
8,871,851 |
1,916,839 |
10,788,690 |
| 1984 |
9,216,049 |
2,115,025 |
11,331,074 |
| 1985 |
9,568,281 |
2,332,446 |
11,900,727 |
| 1986 |
9,928,242 |
2,570,776 |
12,499,018 |
| 1987 |
10,295,578 |
2,831,810 |
13,127,388 |
| 1988 |
10,669,880 |
3,117,467 |
13,787,347 |
| 1989 |
11,050,692 |
3,429,794 |
14,480,486 |
| 1990 |
11,437,500 |
3,770,971 |
15,208,471 |
| 1991 |
11,829,739 |
4,143,316 |
15,973,055 |
| 1992 |
12,218,200 |
4,540,179 |
16,758,379 |
| 1993 |
12,551,696 |
4,725,476 |
17,277,172 |
| 1994 |
12,863,710 |
4,837,899 |
17,701,609 |
| 1995 |
13,183,469 |
4,953,006 |
18,136,475 |
| 1996 |
13,511,162 |
5,070,860 |
18,582,022 |
| 1997 |
13,846,988 |
5,191,528 |
19,038,516 |
| 1998 |
14,191,149 |
5,315,076 |
19,506,225 |
| 1999 |
14,543,849 |
5,441,575 |
19,985,424 |
| 2000 |
14,905,300 |
5,571,093 |
20,476,393 |
| 2001 |
15,275,721 |
5,703,704 |
20,979,425 |
| 2002 |
15,655,332 |
5,839,481 |
21,494,813 |
| 2003 |
16,044,362 |
5,978,502 |
22,022,864 |
| 2004 |
16,443,987 |
6,119,899 |
22,563,886 |
| 2005 |
16,854,157 |
6,475,427 |
23,329,584 |
| 2006 |
17,270,181 |
6,851,709 |
24,121,890 |
| 2007 |
17,691,336 |
7,249,962 |
24,941,298 |
| 2008 |
18,115,550 |
7,671,475 |
25,787,025 |
| 2009 |
18,543,246 |
8,117,611 |
26,660,857 |
| 2010 |
18,776,510 |
8,459,646 |
27,236,156 |
| 2011* |
19,405,685 |
8,970,670 |
28,376,355 |
| 2012* |
19,838,448 |
9,357,447 |
29,195,895 |
| 2013** |
19,209,753 |
10,170,377 |
29,380,130 |
| 2014** |
19,312,696 |
10,684,405 |
29,997,101 |
| 2015** |
19,692,639 |
11,198,097 |
30,890,736 |
| 2016 |
20,081,582 |
11,705,998 |
31,787,580 |
| 2017** |
20,427,357 |
12,185,284 |
32,612,641 |
| 2018** |
20,768,627 |
12,645,033 |
33,413,660 |
Source: Population estimates based on the results of population censuses 1974; 1992; 2004 and 2010 and Demographic Survey 2016.
Central Department for Statistics and Information (CDSI)/ General Authority for Statistics (GaStat)
* mid-year estimates based on figures from census 2010
** mid-year estimates based on figures from Demographic Research Bulletin 2016
ANNEXED NOTE
1. Technical Notes and Definitions
Reference periods: middle of given years
2. Institution which provides data
Central Department of Statistics and Information (CDSI), Ministry and Economy and Planning/ General Authority for Statistics (GaStat)
http://www.stats.gov.sa/en
https://www.stats.gov.sa/ar/node
3. Data availability
Results of censuses conducted in 1992, 2004 and 2010 and Demographic Survey 2016 are available on the website of the General
Authority for Statistics (previously CDSI), in downloadable Excel and PDF formats.
https://www.stats.gov.sa/en/13
https://www.stats.gov.sa/ar/13
https://www.stats.gov.sa/en/4522
Mid-year estimates of population in Saudi Arabia since 1974 (time series) are available in Saudi Arabia Monetary Agency (SAMA)
Yearly Statistics: http://www.sama.gov.sa/en-US/EconomicReports/Pages/YearlyStatistics.aspx
GaStat Statistical Yearbooks (https://www.stats.gov.sa/en/46) and yearly estimates (https://www.stats.gov.sa/en/43) do not offer
time series.
Last date of access: April 2019.
| Country |
Reference period |
Number of domestic labourers |
% females |
|
|
Males |
Females |
Non-nationals |
|
| Bahrain |
mid-2018 |
22,478 |
69,374 |
91,852 |
76 |
| Kuwait |
Dec. 2018 |
349,570 |
298,776 |
648,346 |
46 |
| Oman |
Dec. 2017 |
137,355 |
155,526 |
292,881 |
53 |
| Qatar |
2017 |
63,464 |
108,942 |
172,406 |
63 |
| Saudi Arabia |
Sept. 2018 |
1,659,729 |
711,661 |
2,371,390 |
30 |
| UAE |
n.a. |
n.a. |
n.a. |
n.a. |
n.a. |
Sources: GCC National Statistical Organisations
Definition:
Domestic sector’s employees: Live-in labourers who provide a household with services for a salary
(ex.: domestic helpers, drivers, gardeners, nannies and private teachers, nurses, cooks, building guards, ..).
Sources and data characteristics:
Bahrain: Labour Market Regulatory Authority (LMRA), Kingdom of Bahrain, based on data from Bahrain
Labour Market Indicators website:
http://blmi.lmra.bh/2018/06/mi_data.xml.
Kuwait: statistics section of PACI’s website (“Statistical Reports”):
http://stat.paci.gov.kw/englishreports/ (English);
http://stat.paci.gov.kw/arabicreports/ (Arabic).
Oman: National Center for Statistics and Information (NCSI). Statistical Yearbook 2018
(chapter “Employment”):
https://www.ncsi.gov.om/Elibrary/LibraryContentDoc/bar_Statistical%20Year%20Book%202018_a8b32d59-cdc9-4987-ba29-1e7ce78d5cca.pdf
Qatar: Ministry of Development Planning and Statistics (MDPS). Labour Force Survey 2017, Annual Bulletin:
https://www.mdps.gov.qa/en/statistics/Statistical%20Releases/Social/LaborForce/2017/Annual_Bulletin_Labour_force_2017_AE.pdf
https://www.mdps.gov.qa/en/statistics/Statistical%20Releases/Social/LaborForce/2017/Annual_Bulletin_Labour_force_2017_AE.xls
Saudi Arabia: General Authority for Statistics (GAStat). Labour Force Survey 2018 (Q3):
https://www.stats.gov.sa/sites/all/modules/pubdlcnt/pubdlcnt.php?file=https://www.stats.gov.sa/sites/default/files/labour_market_3rd_q_2018_1.xlsx&nid=48417
UAE: no raw numbers and totals available.
Last date of access: 31 March 2019.
| Sector of employment |
Country and reference period |
Bahrain |
Kuwait |
Oman |
Qatar* |
Saudi Arabia |
UAE |
|
|
mid-2018 |
Dec. 2018 |
2017 |
2017 |
mid-2018 |
|
| Government |
Nationals |
53,932 |
335,253 |
195,680 |
84,348 |
1,391,163 |
n.a. |
| Non-nationals |
9,730 |
123,014 |
36383 |
123,064 |
78,011 |
n.a. |
| Private |
Nationals |
104,882 |
63,104 |
238,688 |
10,210 |
1,718,824 |
n.a. |
| Non-nationals |
499,275 |
1,616,312 |
1,502,808 |
1,596,340 |
7,128,654 |
n.a. |
| Mixed |
Nationals |
|
|
|
8,798 |
|
n.a. |
| Non-nationals |
|
|
|
49,865 |
|
n.a. |
| Domestic |
Nationals |
0 |
0 |
0 |
0 |
0 |
n.a. |
| Non-nationals |
91,852 |
648,346 |
292,881 |
172,406 |
2,371,390 |
n.a. |
| Other |
Nationals |
|
|
|
588 |
|
n.a. |
| Non-nationals |
|
|
|
8,883 |
|
n.a. |
| Total |
Nationals |
158,814 |
398,357 |
434,368 |
103,944 |
3,109,987 |
n.a. |
| Non-nationals |
600,857 |
2,387,672 |
1,832,072 |
1,950,558 |
9,578,055 |
n.a. |
Sources: GCC National Statistical Organisations
“Mixed” sector refers to establishments in which the government shares capital with another party,
whether national, regional or foreign.
“Other”: includes the “Diplomatic”,” International”, “Foreign” and “Regional” sectors of employment,
as well as the “NGOs-non-profit” sector.
The two sectors only exist in Qatar and the UAE.
The “Government” sector may not include employees in the security and military sectors.
Administrative records usually do not include self-employed persons.
Characteristics of data, definitions, data sources and availability, please see:
Bahrain: https://gulfmigration.grc.net/bahrain-estimated-total-employed-population-by-nationality-bahraini-non-bahraini-and-sector-public-private-domestic-quarterly-q1-2014-q2-2018/
Kuwait: https://gulfmigration.grc.net/kuwait-employed-population-aged-15-and-above-by-nationality-group-sex-and-activity-sector-2018/
Oman: https://gulfmigration.grc.net/oman-employed-population-by-nationality-omani-expatriate-and-sector-of-employment-public-private-domestic-2005-2017/
Qatar:
*: labour force (employed+unemployed). Persons seeking work for the first time are not included.
“Government” sector refers to Government departments, as well as governmental companies
and corporations.
Source: MDPS. Labour Force Survey 2017, Annual Bulletin.
https://www.mdps.gov.qa/en/statistics/Statistical%20Releases/Social/LaborForce/2017/Annual_Bulletin_Labour_force_2017_AE.pdf
https://www.mdps.gov.qa/en/statistics/Statistical%20Releases/Social/LaborForce/2017/Annual_Bulletin_Labour_force_2017_AE.xls
Saudi Arabia: https://gulfmigration.grc.net/saudi-arabia-total-employed-population-aged-15-and-above-by-nationality-saudi-non-saudi-sex-and-sector-of-employment-governmental-private-domestic-labour-q3-2018/.
UAE: no raw numbers and totals available.
Last date of access: 31 March 2019.
|
Country and reference period |
Bahrain |
Kuwait |
Oman |
Qatar* |
Saudi Arabia |
UAE** |
| Sector of employment |
|
mid-2018 |
Dec. 2018 |
2017 |
2017 |
mid-2018 |
2017 |
| Government |
Nationals |
34.0 |
84.2 |
45.0 |
81.1 |
44.7 |
83.2 |
| Non-nationals |
1.6 |
5.2 |
2.0 |
6.3 |
0.8 |
7.2 |
| Private |
Nationals |
66.0 |
15.8 |
55.0 |
9.8 |
55.3 |
8.2 |
| Non-nationals |
83.1 |
67.7 |
82.0 |
81.8 |
74.4 |
75.0 |
| Mixed |
Nationals |
|
|
|
8.5 |
|
7.4 |
| Non-nationals |
|
|
|
2.6 |
|
4.5 |
| Domestic |
Nationals |
0.0 |
0.0 |
0.0 |
0.0 |
0.0 |
0.0 |
| Non-nationals |
15.3 |
27.2 |
16.0 |
8.8 |
24.8 |
11.8 |
| Other |
Nationals |
|
|
|
0.6 |
|
1.1 |
| Non-nationals |
|
|
|
0.5 |
|
1.5 |
| Total |
Nationals |
100.0 |
100.0 |
100.0 |
100.0 |
100.0 |
100.0 |
| Non-nationals |
100.0 |
100.0 |
100.0 |
100.0 |
100.0 |
100.0 |
Sources: GCC National Statistical Organisations
“Mixed” sector refers to establishments in which the government shares capital with another party,
whether national, regional or foreign.
“Other”: includes the “Diplomatic”,” International”, “Foreign” and “Regional” sectors of employment,
as well as the “NGOs-non-profit” sector.
The two sectors only exist in Qatar and the UAE.
The “Government” sector may not include employees in the security and military sectors.
Administrative records usually do not include self-employed persons.
Except for the UAE, percentages were calculated on the basis of figures of nationals and non-nationals in
each employment sector, from the sources listed below.
Characteristics of data, definitions, data sources and availability, please see:
Bahrain: https://gulfmigration.grc.net/bahrain-estimated-total-employed-population-by-nationality-bahraini-non-bahraini-and-sector-public-private-domestic-quarterly-q1-2014-q2-2018/
Kuwait: https://gulfmigration.grc.net/kuwait-employed-population-aged-15-and-above-by-nationality-group-sex-and-activity-sector-2018/
Oman: https://gulfmigration.grc.net/oman-employed-population-by-nationality-omani-expatriate-and-sector-of-employment-public-private-domestic-2005-2017/
Saudi Arabia: https://gulfmigration.grc.net/saudi-arabia-total-employed-population-aged-15-and-above-by-nationality-saudi-non-saudi-sex-and-sector-of-employment-governmental-private-domestic-labour-q3-2018/.
Qatar:
*: labour force (employed+unemployed). Persons seeking work for the first time are not included.
“Government” sector refers to Government departments, as well as governmental companies
and corporations.
Source: MDPS. Labour Force Survey 2017, Annual Bulletin.
https://www.mdps.gov.qa/en/statistics/Statistical%20Releases/Social/LaborForce/2017/Annual_Bulletin_Labour_force_2017_AE.pdf
https://www.mdps.gov.qa/en/statistics/Statistical%20Releases/Social/LaborForce/2017/Annual_Bulletin_Labour_force_2017_AE.xls
UAE:
**”Government” sector refers to Federal and Local government departments.
Source: FCSA. Labour Force Survey 2017.
http://fcsa.gov.ae/en-us/Pages/Statistics/Statistics-by-Subject.aspx#/%3Fsubject=Population%20and%20social&folder=Population%20and%20social/Labor%20Force
Data is presented as percentage distribution.
Last date of access: 31 March 2019.
| reference number of permit |
purpose of permit |
type of permits |
Males |
Females |
Total |
| 22 |
residence |
Dependent permits |
200,327 |
340,577 |
540,904 |
| 23 |
Study |
632 |
229 |
861 |
| 24 |
Self residence permits |
1,171 |
1,215 |
2,386 |
| 17 |
work |
Governmental sector permits |
69,955 |
40,290 |
110,245 |
| 18 |
Private sector permits |
1,323,096 |
119,512 |
1,442,608 |
| 19 |
Business |
339 |
20 |
359 |
| 20 |
Domestic help |
337,009 |
340,583 |
677,592 |
| TOTAL |
1,932,529 |
842,426 |
2,774,955 |
Source: Ministry of Interior
ANNEXED NOTE
1. Definitions
Ministry of Interior’s (Directorate of Migration’s) records of residency permits granted to foreign residents by type/ purpose
of permit, sex and regional origin of holder, for the years 2010 to 2017.
Data presented in the table are stock data: all the non-national residents holding a residence permit on December 31st, the given year.
The present figures include permits delivered for all purposes of stay in Kuwait:
1- Labour in all sectors: governmental (n°17); private sector (n°18); business (n°19) and domestic (n°20) sectors
2- Residence: as family dependent (permit n°22); studies (n°23) and self-residence (n°24).
Residency procedures do not apply to GCC nationals and to Bidouns (stateless residents of Kuwait).
The table thus excludes the Bidouns, the non-Kuwaiti GCC citizens and those in irregular situation.
Holders of permit n°14 (temporary residents) are not included here.
Dependent permit: spouse, children or elderly dependent relatives can join visa holder (sponsor) in Kuwait,
if the expatriate has obtained a residency and meets the salary requirements.
A working wife cannot sponsor her husband as a dependent. Sons over the age of 21 years cannot be sponsored as dependants,
though adult daughters and parents may be permitted. Dependent family members are not allowed to work on a Dependent Visa.
Every foreign resident including new born babies must hold a residency permit.
Self residence permit: Expatriates may sponsor themselves under article 24 of the regulations and obtain a residence for two
to five years under several conditions, among which: being aged 60 and more, having worked no less than 25 years in Kuwait,
owning a capital of 10,000 KD at least; holding a certificate of good conduct, effectively reside in Kuwait, etc.)
This form of residence can be renewed upon expiry. Self-sponsored expatriates may sponsor their wives and children.
Permits 17, 18, 19 and 20 are only granted after Ministry of Labour issues a work permit.
2. Institution which provides data
Central Statistical Bureau (CSB), Ministry of Planning.
3. Period of data coverage
December 31st, given years.
4. Data availability
The present data is taken from the “Migration Statistics” reports, published annually by the CSB.
The report (in Arabic and English, PDF format with Excel tables) is available on CSB’s website
(Population Statistics, then Migration Statistics)
https://www.csb.gov.kw/Pages/Statistics?ID=56&ParentCatID=+1
https://www.csb.gov.kw/Pages/Statistics_en?ID=56&ParentCatID=+1
Date of access: January 2019.
|
Qataris |
Non-Qataris |
Total |
| Census year |
males |
females |
total |
males |
females |
total |
males |
females |
total |
| 1986 |
49,684 |
50,070 |
99,754 |
200,641 |
72,997 |
273,638 |
250,325 |
123,067 |
373,392 |
| 1997 |
75,881 |
75,792 |
151,673 |
277,905 |
106,896 |
384,801 |
353,786 |
182,688 |
536,474 |
| 2004 |
95,703 |
96,883 |
192,586 |
450,411 |
155,064 |
605,475 |
546,114 |
251,947 |
798,061 |
| 2010 |
120,736 |
122,337 |
243,073 |
1,164,003 |
292,359 |
1,456,362 |
1,284,739 |
414,696 |
1,699,435 |
| Mid-2015 |
152,700 |
154,248 |
306,948 |
1,692,960 |
449,600 |
2,142,560 |
1,845,660 |
603,848 |
2,449,508 |
Source: GLMM calculations on the basis of QSA/ MDPS data
ANNEXED NOTE
1. Technical Notes and Definitions
Reference periods for each census:
1970: unknown; the nights of March 16th, 1986; March 1st, 1997; March 16th, 2004, April 21st, 2010 and April 20th, 2015.
Implementation method: de facto, as well as de jure methods.
Population of reference: all individuals (nationals and non-nationals), present within the country’s
borders during night of reference.
– Populations away from usual residence in Qatar for reasons of duty,
or on a visit abroad for less than two months, as well as individuals with no personal housing within Qatar staying
with a household for more than two months, are counted in their usual/ present residence during census night.
– Populations in transit or visiting Qatar as tourists, as well as residents of public housing or visitors staying in a household
for less than two months after night of reference were excluded.
Prior to census 2010, only a sample of foreign residents was covered in censuses.
2015: No population data disagregated by nationality was published, based on census results.
We estimated the total population of Qatar by nationality and sex, using:
1. 2015 Labour Force Survey (Q2): Figures of population aged 15 and above, by nationality (period of reference: mid-2015)
Sampling frame of LFS 2015: Population Census 2010.
Sample size: 44,756 persons, in 6,953 households: 1- Qatari households; 2- Non-Qatari regular (non-collective) and collective households;
Reference period for the labour force data: the week prior to data collection day.
Population of reference: all Qatari and non-Qatari households present in Qatar on the night of survey,
living in normal and collective households.
2. MDPS. Women and Men in the State of Qatar- A Statistical Profile, Doha: MDPS, 2016.
Figures of population aged 0-14 by nationality (national/ non-national) and sex (period of reference: mid-2015).
The figures were estimated on the basis of the percentage distribution of population by broad age groups,
sex and nationality for mid-2015 (Table 1/3, p. 18).
2. Institution which provides data
Ministry of Development Planning and Statistics (MDPS)
(http://www.mdps.gov.qa/en/pages/default.aspx)
3. Data availability
Released parts of censuses (1986; 1997; 2004; 2010, 2015), as well as some analytical volumes,
are available on the website of the MDPS, in PDF format.
https://www.mdps.gov.qa/en/statistics1/pages/topicslisting.aspx?parent=General&child=Census
https://www.mdps.gov.qa/en/statistics1/StatisticsSite/Census/Pages/default.aspx
Labour Force Survey Q2-2015:
https://www.mdps.gov.qa/en/statistics/Statistical%20Releases/Social/LaborForce/2015/Q2/LF-Q2-2015-AE-MDPS.pdf
MDPS. Women and Men in the State of Qatar- A Statistical Profile, Doha: MDPS, 2016.
https://www.mdps.gov.qa/en/statistics1/pages/topicslisting.aspx?parent=Social&child=GenrealSocialStatistics.
Last date of access: December 2017.
| Census |
Qataris |
Non-Qataris |
Total |
| 1970 |
45,039 |
66,094 |
111,133 |
| 1986 |
99,754 |
273,638 |
373,392 |
| 1997 |
151,673 |
384,801 |
536,474 |
| 2004 |
192,586 |
605,475 |
798,061 |
| 2010 |
243,073 |
1,456,362 |
1,699,435 |
| mid-2015 |
306,948 |
2,142,560 |
2,449,508 |
Source: GLMM calculations on the basis of QSA/ MDPS data
ANNEXED NOTE
1. Technical Notes and Definitions
Reference periods for each census:
1970: unknown; the nights of March 16th, 1986; March 1st, 1997; March 16th, 2004, April 21st, 2010 and April 20th, 2015.
Implementation method: de facto, as well as de jure methods.
Population of reference: all individuals (nationals and non-nationals), present within the country’s
borders during night of reference.
– Populations away from usual residence in Qatar for reasons of duty,
or on a visit abroad for less than two months, as well as individuals with no personal housing within Qatar staying
with a household for more than two months, are counted in their usual/ present residence during census night.
– Populations in transit or visiting Qatar as tourists, as well as residents of public housing or visitors staying in a household
for less than two months after night of reference were excluded.
Prior to census 2010, only a sample of foreign residents was covered in censuses.
2015: No population data disagregated by nationality was published, based on census results.
We estimated the total population of Qatar by nationality and sex, using:
1. 2015 Labour Force Survey (Q2): Figures of population aged 15 and above, by nationality (period of reference: mid-2015)
Sampling frame of LFS 2015: Population Census 2010.
Sample size: 44,756 persons, in 6,953 households: 1- Qatari households; 2- Non-Qatari regular (non-collective) and collective households;
Reference period for the labour force data: the week prior to data collection day.
Population of reference: all Qatari and non-Qatari households present in Qatar on the night of survey,
living in normal and collective households.
2. MDPS. Women and Men in the State of Qatar- A Statistical Profile, Doha: MDPS, 2016.
Figures of population aged 0-14 by nationality (national/ non-national) and sex (period of reference: mid-2015).
The figures were estimated on the basis of the percentage distribution of population by broad age groups,
sex and nationality for mid-2015 (Table 1/3, p. 18).
2. Institution which provides data
Ministry of Development Planning and Statistics (MDPS)
(http://www.mdps.gov.qa/en/pages/default.aspx)
3. Data availability
Released parts of censuses (1986; 1997; 2004; 2010, 2015), as well as some analytical volumes,
are available on the website of the MDPS, in PDF format.
https://www.mdps.gov.qa/en/statistics1/pages/topicslisting.aspx?parent=General&child=Census
https://www.mdps.gov.qa/en/statistics1/StatisticsSite/Census/Pages/default.aspx
Labour Force Survey Q2-2015 :
https://www.mdps.gov.qa/en/statistics/Statistical%20Releases/Social/LaborForce/2015/Q2/LF-Q2-2015-AE-MDPS.pdf
MDPS. Women and Men in the State of Qatar- A Statistical Profile, Doha: MDPS, 2016.
https://www.mdps.gov.qa/en/statistics1/pages/topicslisting.aspx?parent=Social&child=GenrealSocialStatistics.
Last date of access: December 2017.
|
Qataris |
Non-Qataris |
Total |
|
Males |
Females |
Total |
Males |
Females |
Total |
Males |
Females |
Total |
| 2006 |
21,241 |
41,176 |
62,417 |
13,306 |
54,979 |
68,285 |
34,547 |
96,155 |
130,702 |
| 2007 |
22,410 |
42,604 |
65,014 |
16,387 |
63,704 |
80,091 |
38,797 |
106,308 |
145,105 |
| 2008 |
25,450 |
45,108 |
70,558 |
20,669 |
78,005 |
98,674 |
46,119 |
123,113 |
169,232 |
| 2009 |
27,202 |
46,814 |
74,016 |
19,784 |
83,417 |
103,201 |
46,986 |
130,231 |
177,217 |
| 2010* |
24,559 |
47,616 |
72,175 |
22,364 |
96,341 |
118,705 |
46,923 |
143,957 |
190,880 |
| 2011 |
28,675 |
52,857 |
81,532 |
21,332 |
92,446 |
113,778 |
50,007 |
145,303 |
195,310 |
| 2012 |
26,427 |
54,399 |
80,826 |
26,568 |
102,085 |
128,653 |
52,995 |
156,484 |
209,479 |
| 2013 |
26,302 |
58,802 |
85,104 |
27,282 |
114,623 |
141,905 |
53,584 |
173,425 |
227,009 |
| 2014 |
28,234 |
59,068 |
87,302 |
32,577 |
119,351 |
151,928 |
60,811 |
178,419 |
239,230 |
| 2015 |
29,451 |
61,756 |
91,207 |
36,518 |
123,356 |
159,874 |
65,969 |
185,112 |
251,081 |
| 2016 |
29,889 |
62,616 |
92,505 |
35,785 |
123,746 |
159,531 |
65,674 |
186,362 |
252,036 |
| 2017 |
31,247 |
64,409 |
95,656 |
41,253 |
132,273 |
173,526 |
72,500 |
196,682 |
269,182 |
Source: Labour Force Sample Surveys, 2006 to 2009 and 2011 to 2017; *: census 2010
ANNEXED NOTE
1. Technical Notes and Definitions
Census 2010:
Reference period for census 2010: the night of April 21st, 2010.
Population of reference: all individuals (nationals and non-nationals), present within the country’s
borders during night of reference.
– Populations away from usual residence in Qatar for reasons of duty,
or on a visit abroad for less than two months, as well as individuals with no personal housing within Qatar staying
with a household for more than two months, are counted in their usual/ present residence during census night.
– Populations in transit or visiting Qatar as tourists, as well as residents of public housing or visitors staying in a household
for less than two months after night of reference were excluded.
Labour force Sample Surveys:
The Statistics Authority conducted the first labour Force Sample Survey in 2001. After 2006, surveys were conducted on an annual basis.
After 2013, LFS surveys were conducted on a quarterly basis.
| LFS |
Sampling |
Sample size |
Reference period |
|
frame |
(households) |
individuals |
| 2006 |
independent samples |
5,492 |
31,439 |
March 2006 |
| 2007 |
nd |
5,492 |
31,439 |
October 2007 |
| 2008 |
nd |
6,104 |
nd |
December 2008 |
| 2009 |
nd |
6,109 |
35,839 |
October 2009 |
| 2011 |
nd |
6,920 |
35,839 |
March 2011 |
| 2012 |
Census 2010 |
6,895 |
37,629 |
April 2012 |
| 2013 |
Census 2010 |
c. 7000 |
n.d. |
Quarterly |
| 2014 |
Census 2010 |
8,351 |
53,363 |
Quarterly |
| 2015 |
Census 2010 |
6,953 |
44,756 |
Quarterly |
| 2016 |
Census 2015 |
9,199 |
60,016 |
Quarterly |
| 2017 |
Census 2015 |
9,200 |
60,278 |
Quarterly |
Reference period for the labor force data: the week prior to the reference date for data collection.
Population of reference: all Qatari and non-Qatari households present in Qatar on the night of survey/ periods of reference:
i. Qatari households; ii. Non-Qatari households; iii. Small labor gatherings; iv. Large labor gatherings.
The collective households are a group of persons not related to each other and sharing living conditions in a residential unit, I.e. labor camps,
students living boarding schools, nurses in hospitals… etc. The survey covered the small collective households (includes less than 7 persons)
and large collective households (includes 7 persons or more).
The survey did not cover short periods accommodation, i.e. hotels.
Inactive population:
Full-time student: The person (15 years or older) enrolled in any educational institution as a full-time persistent student with purpose of attaining
an academic degree, irrespective of whether the schooling hours are in the morning or evening.
Any trainee enrolled in vocational training institutes is regarded as a full-time student.
Full-time housewife: The female (15 years or older) who is fully engaged in home management and family care, and does not practice any other work
Retired: The person who does not look for a job during the week preceding the survey and gets a fixed pension for work he/she had joined before
Disabled: The person (15 years or older) who is not capable of work due to illness, handicap or old age.
Others: Those able to work but not willing to, not enrolled in education, as well as any other cases encountered by the enumerator other than the above.
2. Institution which provides data
Ministry of Development Planning and Statistics (MDPS)
(http://www.mdps.gov.qa/en/pages/default.aspx)
3. Data availability
Labour Force Surveys and publications related to the labour force are available on MDPS’s website, in PDF format and Excel formats (selected years):
https://www.mdps.gov.qa/en/statistics1/pages/topicslisting.aspx?parent=Social&child=LaborForce
Last date of access: December 2018.
|
Qatari |
Non-Qatari |
Total |
|
Males |
Females |
Total |
Males |
Females |
Total |
Males |
Females |
Total |
| Legislators, Senior Officials And Managers |
40 |
39 |
40 |
46 |
44 |
46 |
43 |
41 |
43 |
| Professionals |
40 |
38 |
39 |
45 |
43 |
44 |
43 |
40 |
42 |
| Technicians And Associate Professionals |
41 |
39 |
40 |
47 |
45 |
47 |
45 |
41 |
44 |
| Clerks |
40 |
38 |
39 |
47 |
47 |
47 |
43 |
42 |
43 |
| Service Workers And Shop And Market Sales Workers |
40 |
39 |
39 |
50 |
53 |
51 |
48 |
52 |
50 |
| Skilled Agricultural And Fishery Workers |
44 |
0 |
44 |
54 |
0 |
54 |
54 |
0 |
54 |
| Craft And Related Trades Workers |
42 |
0 |
42 |
51 |
53 |
51 |
51 |
53 |
51 |
| Plant And Machine Operators And Assemblers |
40 |
0 |
40 |
51 |
56 |
51 |
51 |
56 |
51 |
| Elementary Occupations |
40 |
39 |
40 |
49 |
56 |
53 |
49 |
56 |
53 |
| Total |
40 |
38 |
40 |
50 |
53 |
51 |
48 |
50 |
49 |
Source: Annual Bulletin of Labour Force Sample Survey 2017
ANNEXED NOTE
1. Technical Notes and Definitions
The data is taken from 2017 Labour Force Survey (yearly synthesis)
Sampling frame of LFS 2017: Population Census 2015.
Sample size: 60,278 persons, in 9,200 households: 1- Qatari households; 2- Non-Qatari regular (non-collective) households;
3- Non-Qatari small collective households or labour gatherings (2 – 6 persons); 4- Non-Qatari large collective households or large labour gatherings (7 persons or more).
Data Collection: The sample was divided into equal parts to collect data monthly. Each month 1/3 of the quarterly data were collected during the first two weeks of the month.
Reference period for the labour force data: the week prior to data collection day.
Population of reference: all Qatari and non-Qatari households present in Qatar on the night of survey, living in normal and collective households.
The collective households are a group of persons not related to each other and sharing living conditions in a residential unit, I.e. labour camps, students living boarding
schools, nurses in hospitals… etc. The survey covered the small collective households (includes less than 7 persons) and large collective households (includes 7 persons or more).
The survey did not cover short periods accommodation, i.e. hotels.
Employed persons:
All persons aged 15 years and above, who during the week preceding the survey:
a) Perform a work for a wage, salary, profits or household gains, whether it was in cash or in kind.
b) Are temporarily not employed, however, they still have an official relation with their work
Figures do not include temporarily absent employees.
2. Institution which provides data
Ministry of Development Planning and Statistics
(http://www.mdps.gov.qa/en/pages/default.aspx)
3. Data availability
The Statistics Authority conducted the first labour Force Sample Survey in 2001. After 2006, surveys were conducted on an annual basis.
After 2013, LFS surveys were conducted on a quarterly basis.
Labour Force Surveys (yearly and quarterly data) can be downloaded from MDPS’s website, in PDF and Excel format:
http://www.mdps.gov.qa/en/statistics1/pages/topicslisting.aspx?parent=Social&child=LaborForce
Last date of access: January 2019.
|
Qatari |
Non-Qatari |
Total |
|
Males |
Females |
Total |
Males |
Females |
Total |
Males |
Females |
Total |
| 15 – 19 |
2,844 |
84 |
2,928 |
4,064 |
917 |
4,981 |
6,908 |
1,001 |
7,909 |
| 20 – 24 |
10,745 |
5,408 |
16,153 |
177,155 |
33,124 |
210,279 |
187,900 |
38,532 |
226,432 |
| 25 – 29 |
12,112 |
7,029 |
19,141 |
312,935 |
39,341 |
352,276 |
325,047 |
46,370 |
371,417 |
| 30 – 34 |
9,739 |
9,241 |
18,980 |
371,443 |
59,278 |
430,721 |
381,182 |
68,519 |
449,701 |
| 35 – 39 |
8,012 |
4,257 |
12,269 |
296,271 |
49,527 |
345,798 |
304,283 |
53,784 |
358,067 |
| 40 – 44 |
7,270 |
5,420 |
12,690 |
218,057 |
33,283 |
251,340 |
225,327 |
38,703 |
264,030 |
| 45 – 49 |
5,869 |
2,817 |
8,686 |
153,937 |
11,672 |
165,609 |
159,806 |
14,489 |
174,295 |
| 50 – 54 |
6,655 |
1,862 |
8,517 |
94,734 |
6,277 |
101,011 |
101,389 |
8,139 |
109,528 |
| 55 – 59 |
2,002 |
672 |
2,674 |
53,927 |
3,932 |
57,859 |
55,929 |
4,604 |
60,533 |
| 60 – 64 |
1,233 |
154 |
1,387 |
22,189 |
1,150 |
23,339 |
23,422 |
1,304 |
24,726 |
| 65 + |
406 |
113 |
519 |
6,858 |
487 |
7,345 |
7,264 |
600 |
7,864 |
| Total |
66,887 |
37,057 |
103,944 |
1,711,570 |
238,988 |
1,950,558 |
1,778,457 |
276,045 |
2,054,502 |
Source: Annual Bulletin of Labour Force Sample Survey 2017
ANNEXED NOTE
1. Technical Notes and Definitions
The data is taken from 2017 Labour Force Survey (yearly synthesis)
Sampling frame of LFS 2017: Population Census 2015.
Sample size: 60,278 persons, in 9,200 households: 1- Qatari households; 2- Non-Qatari regular (non-collective) households;
3- Non-Qatari small collective households or labour gatherings (2 – 6 persons); 4- Non-Qatari large collective households or large labour gatherings (7 persons or more).
Data Collection: The sample was divided into equal parts to collect data monthly. Each month 1/3 of the quarterly data were collected during the first two weeks of the month.
Reference period for the labour force data: the week prior to data collection day.
Population of reference: all Qatari and non-Qatari households present in Qatar on the night of survey, living in normal and collective households.
The collective households are a group of persons not related to each other and sharing living conditions in a residential unit, I.e. labour camps, students living boarding
schools, nurses in hospitals… etc. The survey covered the small collective households (includes less than 7 persons) and large collective households (includes 7 persons or more).
The survey did not cover short periods accommodation, i.e. hotels.
The present data includes active population, i.e. employed and unemployed. It does not include persons seeking work for the first time
Relation to labour force (for persons aged 15 and above)
In the labour force (= economically active).
1) Employed.
All persons aged 15 years and above, who during the week preceding the survey:
a) Perform a work for a wage, salary, profits or household gains, whether it was in cash or in kind.
b) Are temporarily not employed, however, they still have an official relation with their work
2) Unemployed.
All persons aged 15 years and over who were, during the week preceding the survey, without employment, willing to work and looking seriously for a job.
There is a distinction between two kinds of unemployed persons:
a) First time unemployed: They are the persons who never worked previously, and were during the week preceding the survey looking actively for work.
b) Unemployed who previously worked: They are the persons with a work experience, who during the week preceding the survey were actively looking for a job
2. Institution which provides data
Ministry of Development Planning and Statistics
(http://www.mdps.gov.qa/en/pages/default.aspx)
3. Data availability
The Statistics Authority conducted the first labour Force Sample Survey in 2001. After 2006, surveys were conducted on an annual basis.
After 2013, LFS surveys were conducted on a quarterly basis.
Labour Force Surveys (yearly and quarterly data) can be downloaded from MDPS’s website, in PDF and Excel format:
http://www.mdps.gov.qa/en/statistics1/pages/topicslisting.aspx?parent=Social&child=LaborForce
Last date of access: January 2019.
|
Qatari |
Non-Qatari |
Total |
|
Males |
Females |
Total |
Males |
Females |
Total |
Males |
Females |
Total |
| Illiterate |
14 |
0 |
14 |
21,775 |
1,940 |
23,715 |
21,789 |
1,940 |
23,729 |
| Read & Write |
560 |
112 |
672 |
202,199 |
23,466 |
225,665 |
202,759 |
23,578 |
226,337 |
| Literacy |
0 |
0 |
0 |
1,398 |
154 |
1,552 |
1,398 |
154 |
1,552 |
| Primary |
3,318 |
336 |
3,654 |
367,648 |
49,736 |
417,384 |
370,966 |
50,072 |
421,038 |
| Preparatory |
9,063 |
2,492 |
11,555 |
490,051 |
43,422 |
533,473 |
499,114 |
45,914 |
545,028 |
| Vocational Training |
0 |
0 |
0 |
30,954 |
106 |
31,060 |
30,954 |
106 |
31,060 |
| Secondary |
26,150 |
11,443 |
37,593 |
281,753 |
37,380 |
319,133 |
307,903 |
48,823 |
356,726 |
| Diploma |
2,550 |
1,190 |
3,740 |
84,581 |
13,883 |
98,464 |
87,131 |
15,073 |
102,204 |
| University |
21,466 |
19,551 |
41,017 |
205,326 |
64,055 |
269,381 |
226,792 |
83,606 |
310,398 |
| Higher Diploma |
1,008 |
798 |
1,806 |
9,045 |
1,044 |
10,089 |
10,053 |
1,842 |
11,895 |
| M.A / M.Sc. |
1,736 |
686 |
2,422 |
11,173 |
2,770 |
13,943 |
12,909 |
3,456 |
16,365 |
| Ph.D. |
1,022 |
449 |
1,471 |
5,667 |
1,032 |
6,699 |
6,689 |
1,481 |
8,170 |
| Total |
66,887 |
37,057 |
103,944 |
1,711,570 |
238,988 |
1,950,558 |
1,778,457 |
276,045 |
2,054,502 |
Source: Annual Bulletin of Labour Force Sample Survey 2017
ANNEXED NOTE
1. Technical Notes and Definitions
The data is taken from 2017 Labour Force Survey (yearly synthesis)
Sampling frame of LFS 2017: Population Census 2015.
Sample size: 60,278 persons, in 9,200 households: 1- Qatari households; 2- Non-Qatari regular (non-collective) households;
3- Non-Qatari small collective households or labour gatherings (2 – 6 persons); 4- Non-Qatari large collective households or large labour gatherings (7 persons or more).
Data Collection: The sample was divided into equal parts to collect data monthly. Each month 1/3 of the quarterly data were collected during the first two weeks of the month.
Reference period for the labour force data: the week prior to data collection day.
Population of reference: all Qatari and non-Qatari households present in Qatar on the night of survey, living in normal and collective households.
The collective households are a group of persons not related to each other and sharing living conditions in a residential unit, I.e. labour camps, students living boarding
schools, nurses in hospitals… etc. The survey covered the small collective households (includes less than 7 persons) and large collective households (includes 7 persons or more).
The survey did not cover short periods accommodation, i.e. hotels.
The present data includes active population, i.e. employed and unemployed. It does not include persons seeking work for the first time
Relation to labour force (for persons aged 15 and above)
In the labour force (= economically active).
1) Employed.
All persons aged 15 years and above, who during the week preceding the survey:
a) Perform a work for a wage, salary, profits or household gains, whether it was in cash or in kind.
b) Are temporarily not employed, however, they still have an official relation with their work
2) Unemployed.
All persons aged 15 years and over who were, during the week preceding the survey, without employment, willing to work and looking seriously for a job.
There is a distinction between two kinds of unemployed persons:
a) First time unemployed: They are the persons who never worked previously, and were during the week preceding the survey looking actively for work.
b) Unemployed who previously worked: They are the persons with a work experience, who during the week preceding the survey were actively looking for a job
2. Institution which provides data
Ministry of Development Planning and Statistics
(http://www.mdps.gov.qa/en/pages/default.aspx)
3. Data availability
The Statistics Authority conducted the first labour Force Sample Survey in 2001. After 2006, surveys were conducted on an annual basis.
After 2013, LFS surveys were conducted on a quarterly basis.
Labour Force Surveys (yearly and quarterly data) can be downloaded from MDPS’s website, in PDF and Excel format:
http://www.mdps.gov.qa/en/statistics1/pages/topicslisting.aspx?parent=Social&child=LaborForce
Last date of access: January 2019.
|
Qatari |
Non-Qatari |
Total |
|
Males |
Females |
Total |
Males |
Females |
Total |
Males |
Females |
Total |
| Employer |
2,549 |
770 |
3,319 |
2,217 |
172 |
2,389 |
4,766 |
942 |
5,708 |
| Own Account Worker |
252 |
0 |
252 |
2,328 |
129 |
2,457 |
2,580 |
129 |
2,709 |
| Employee |
64,086 |
36,287 |
100,373 |
1,707,025 |
238,687 |
1,945,712 |
1,771,111 |
274,974 |
2,046,085 |
| Total |
66,887 |
37,057 |
103,944 |
1,711,570 |
238,988 |
1,950,558 |
1,778,457 |
276,045 |
2,054,502 |
Source: Annual Bulletin of Labour Force Sample Survey 2017
ANNEXED NOTE
1. Technical Notes and Definitions
The data is taken from 2017 Labour Force Survey (yearly synthesis)
Sampling frame of LFS 2017: Population Census 2015.
Sample size: 60,278 persons, in 9,200 households: 1- Qatari households; 2- Non-Qatari regular (non-collective) households;
3- Non-Qatari small collective households or labour gatherings (2 – 6 persons); 4- Non-Qatari large collective households or large labour gatherings (7 persons or more).
Data Collection: The sample was divided into equal parts to collect data monthly. Each month 1/3 of the quarterly data were collected during the first two weeks of the month.
Reference period for the labour force data: the week prior to data collection day.
Population of reference: all Qatari and non-Qatari households present in Qatar on the night of survey, living in normal and collective households.
The collective households are a group of persons not related to each other and sharing living conditions in a residential unit, I.e. labour camps, students living boarding
schools, nurses in hospitals… etc. The survey covered the small collective households (includes less than 7 persons) and large collective households (includes 7 persons or more).
The survey did not cover short periods accommodation, i.e. hotels.
The present data includes active population, i.e. employed and unemployed. It does not include persons seeking work for the first time
Relation to labour force (for persons aged 15 and above)
In the labour force (= economically active).
1) Employed.
All persons aged 15 years and above, who during the week preceding the survey:
a) Perform a work for a wage, salary, profits or household gains, whether it was in cash or in kind.
b) Are temporarily not employed, however, they still have an official relation with their work
2) Unemployed.
All persons aged 15 years and over who were, during the week preceding the survey, without employment, willing to work and looking seriously for a job.
There is a distinction between two kinds of unemployed persons:
a) First time unemployed: They are the persons who never worked previously, and were during the week preceding the survey looking actively for work.
b) Unemployed who previously worked: They are the persons with a work experience, who during the week preceding the survey were actively looking for a job
2. Institution which provides data
Ministry of Development Planning and Statistics
(http://www.mdps.gov.qa/en/pages/default.aspx)
3. Data availability
The Statistics Authority conducted the first labour Force Sample Survey in 2001. After 2006, surveys were conducted on an annual basis.
After 2013, LFS surveys were conducted on a quarterly basis.
Labour Force Surveys (yearly and quarterly data) can be downloaded from MDPS’s website, in PDF and Excel format:
http://www.mdps.gov.qa/en/statistics1/pages/topicslisting.aspx?parent=Social&child=LaborForce
Last date of access: January 2019.
|
Qataris |
Non-Qataris |
Total |
|
Males |
Females |
Total |
Males |
Females |
Total |
Males |
Females |
Total |
| Government Department |
45,703 |
25,176 |
70,879 |
49,866 |
14,782 |
64,648 |
95,569 |
39,958 |
135,527 |
| Government Company/ Corporation |
8,956 |
4,513 |
13,469 |
49,849 |
8,567 |
58,416 |
58,805 |
13,080 |
71,885 |
| Mixed |
6,010 |
2,788 |
8,798 |
44,203 |
5,662 |
49,865 |
50,213 |
8,450 |
58,663 |
| Private |
5,910 |
4,300 |
10,210 |
1,498,130 |
98,210 |
1,596,340 |
1,504,040 |
102,510 |
1,606,550 |
| Diplomatic/International/Regional |
154 |
70 |
224 |
3,371 |
1,449 |
4,820 |
3,525 |
1,519 |
5,044 |
| Non profit |
154 |
210 |
364 |
2,687 |
1,376 |
4,063 |
2,841 |
1,586 |
4,427 |
| Domestic |
0 |
0 |
0 |
63,464 |
108,942 |
172,406 |
63,464 |
108,942 |
172,406 |
| Total |
66,887 |
37,057 |
103,944 |
1,711,570 |
238,988 |
1,950,558 |
1,778,457 |
276,045 |
2,054,502 |
Source: Annual Bulletin of Labour Force Sample Survey 2017
ANNEXED NOTE
1. Technical Notes and Definitions
The data is taken from 2017 Labour Force Survey (yearly synthesis)
Sampling frame of LFS 2017: Population Census 2015.
Sample size: 60,278 persons, in 9,200 households: 1- Qatari households; 2- Non-Qatari regular (non-collective) households;
3- Non-Qatari small collective households or labour gatherings (2 – 6 persons); 4- Non-Qatari large collective households or large labour gatherings (7 persons or more).
Data Collection: The sample was divided into equal parts to collect data monthly. Each month 1/3 of the quarterly data were collected during the first two weeks of the month.
Reference period for the labour force data: the week prior to data collection day.
Population of reference: all Qatari and non-Qatari households present in Qatar on the night of survey, living in normal and collective households.
The collective households are a group of persons not related to each other and sharing living conditions in a residential unit, I.e. labour camps, students living boarding
schools, nurses in hospitals… etc. The survey covered the small collective households (includes less than 7 persons) and large collective households (includes 7 persons or more).
The survey did not cover short periods accommodation, i.e. hotels.
The present data includes active population, i.e. employed and unemployed. It does not include persons seeking work for the first time
Relation to labour force (for persons aged 15 and above)
In the labour force (= economically active).
1) Employed.
All persons aged 15 years and above, who during the week preceding the survey:
a) Perform a work for a wage, salary, profits or household gains, whether it was in cash or in kind.
b) Are temporarily not employed, however, they still have an official relation with their work
2) Unemployed.
All persons aged 15 years and over who were, during the week preceding the survey, without employment, willing to work and looking seriously for a job.
There is a distinction between two kinds of unemployed persons:
a) First time unemployed: They are the persons who never worked previously, and were during the week preceding the survey looking actively for work.
b) Unemployed who previously worked: They are the persons with a work experience, who during the week preceding the survey were actively looking for a job
2. Institution which provides data
Ministry of Development Planning and Statistics
(http://www.mdps.gov.qa/en/pages/default.aspx)
3. Data availability
The Statistics Authority conducted the first labour Force Sample Survey in 2001. After 2006, surveys were conducted on an annual basis.
After 2013, LFS surveys were conducted on a quarterly basis.
Labour Force Surveys (yearly and quarterly data) can be downloaded from MDPS’s website, in PDF and Excel format:
http://www.mdps.gov.qa/en/statistics1/pages/topicslisting.aspx?parent=Social&child=LaborForce
Last date of access: January 2019.
|
Qatari |
Non-Qatari |
Total |
|
Males |
Females |
Total |
Males |
Females |
Total |
Males |
Females |
Total |
| Legislators, Senior Officials and Managers |
8,433 |
2,131 |
10,564 |
30,522 |
4,791 |
35,313 |
38,955 |
6,922 |
45,877 |
| Professionals |
13,970 |
15,333 |
29,303 |
115,297 |
41,294 |
156,591 |
129,267 |
56,627 |
185,894 |
| Technicians and Associate Professionals |
11,739 |
5,449 |
17,188 |
112,150 |
10,125 |
122,275 |
123,889 |
15,574 |
139,463 |
| Clerks |
16,558 |
10,266 |
26,824 |
59,772 |
23,339 |
83,111 |
76,330 |
33,605 |
109,935 |
| Service Workers, Shops and Market Sales Workers |
5,910 |
2,198 |
8,108 |
140,831 |
46,842 |
187,673 |
146,741 |
49,040 |
195,781 |
| Skilled Agricultural and Fishery Workers |
42 |
0 |
42 |
25,180 |
0 |
25,180 |
25,222 |
0 |
25,222 |
| Craft and Related Trades Workers |
4,523 |
0 |
4,523 |
663,594 |
447 |
664,041 |
668,117 |
447 |
668,564 |
| Plant, Machine Operators and Assemblers |
1,414 |
0 |
1,414 |
289,281 |
873 |
290,154 |
290,695 |
873 |
291,568 |
| Elementary Occupations |
3,444 |
434 |
3,878 |
272,732 |
109,779 |
382,511 |
276,176 |
110,213 |
386,389 |
| Total |
66,033 |
35,811 |
101,844 |
1,709,359 |
237,490 |
1,946,849 |
1,775,392 |
273,301 |
2,048,693 |
Source: Annual Bulletin of Labour Force Sample Survey 2017
ANNEXED NOTE
1. Technical Notes and Definitions
The data is taken from 2017 Labour Force Survey (yearly synthesis)
Sampling frame of LFS 2017: Population Census 2015.
Sample size: 60,278 persons, in 9,200 households: 1- Qatari households; 2- Non-Qatari regular (non-collective) households;
3- Non-Qatari small collective households or labour gatherings (2 – 6 persons); 4- Non-Qatari large collective households or large labour gatherings (7 persons or more).
Data Collection: The sample was divided into equal parts to collect data monthly. Each month 1/3 of the quarterly data were collected during the first two weeks of the month.
Reference period for the labour force data: the week prior to data collection day.
Population of reference: all Qatari and non-Qatari households present in Qatar on the night of survey, living in normal and collective households.
The collective households are a group of persons not related to each other and sharing living conditions in a residential unit, I.e. labour camps, students living boarding
schools, nurses in hospitals… etc. The survey covered the small collective households (includes less than 7 persons) and large collective households (includes 7 persons or more).
The survey did not cover short periods accommodation, i.e. hotels.
Employed persons:
All persons aged 15 years and above, who during the week preceding the survey:
a) Perform a work for a wage, salary, profits or household gains, whether it was in cash or in kind.
b) Are temporarily not employed, however, they still have an official relation with their work
Figures do not include temporarily absent employees.
2. Institution which provides data
Ministry of Development Planning and Statistics
(http://www.mdps.gov.qa/en/pages/default.aspx)
3. Data availability
The Statistics Authority conducted the first labour Force Sample Survey in 2001. After 2006, surveys were conducted on an annual basis.
After 2013, LFS surveys were conducted on a quarterly basis.
Labour Force Surveys (yearly and quarterly data) can be downloaded from MDPS’s website, in PDF and Excel format:
http://www.mdps.gov.qa/en/statistics1/pages/topicslisting.aspx?parent=Social&child=LaborForce
Last date of access: January 2019.
|
Omanis |
Expatriates |
Total |
|
Males |
Females |
Total |
Males |
Females |
Total |
Males |
Females |
Total |
| 0 – 4 |
196,000 |
188,308 |
384,308 |
16,036 |
15,447 |
31,483 |
212,036 |
203,755 |
415,791 |
| 5 – 9 |
155,295 |
150,235 |
305,530 |
15,253 |
14,411 |
29,664 |
170,548 |
164,646 |
335,194 |
| 10 – 14 |
117,959 |
114,022 |
231,981 |
12,901 |
11,848 |
24,749 |
130,860 |
125,870 |
256,730 |
| 15 – 19 |
110,175 |
106,572 |
216,747 |
9,600 |
8,532 |
18,132 |
119,775 |
115,104 |
234,879 |
| 20 – 24 |
121,567 |
117,232 |
238,799 |
139,383 |
24,195 |
163,578 |
260,950 |
141,427 |
402,377 |
| 25 – 29 |
124,392 |
121,263 |
245,655 |
415,592 |
65,762 |
481,354 |
539,984 |
187,025 |
727,009 |
| 30 – 34 |
114,302 |
112,489 |
226,791 |
391,060 |
64,656 |
455,716 |
505,362 |
177,145 |
682,507 |
| 35 – 39 |
89,467 |
89,222 |
178,689 |
273,369 |
47,350 |
320,719 |
362,836 |
136,572 |
499,408 |
| 40 – 44 |
61,488 |
60,185 |
121,673 |
175,399 |
33,975 |
209,374 |
236,887 |
94,160 |
331,047 |
| 45 – 49 |
41,613 |
40,090 |
81,703 |
125,624 |
21,411 |
147,035 |
167,237 |
61,501 |
228,738 |
| 50 – 54 |
32,140 |
33,188 |
65,328 |
74,278 |
13,135 |
87,413 |
106,418 |
46,323 |
152,741 |
| 55 – 59 |
27,691 |
30,650 |
58,341 |
45,666 |
7,322 |
52,988 |
73,357 |
37,972 |
111,329 |
| 60 – 64 |
19,361 |
23,606 |
42,967 |
20,343 |
3,106 |
23,449 |
39,704 |
26,712 |
66,416 |
| 65 – 69 |
15,821 |
17,739 |
33,560 |
4,581 |
1,424 |
6,005 |
20,402 |
19,163 |
39,565 |
| 70 – 74 |
12,438 |
13,425 |
25,863 |
1,080 |
686 |
1,766 |
13,518 |
14,111 |
27,629 |
| 75 – 79 |
10,516 |
10,439 |
20,955 |
301 |
355 |
656 |
10,817 |
10,794 |
21,611 |
| 80+ |
13,539 |
12,940 |
26,479 |
174 |
339 |
513 |
13,713 |
13,279 |
26,992 |
| Total |
1,263,764 |
1,241,605 |
2,505,369 |
1,720,640 |
333,954 |
2,054,594 |
2,984,404 |
1,575,559 |
4,559,963 |
Source: NCSI
ANNEXED NOTE
1. Technical Notes and Definitions
Reference period: mid-2017.
Original data source: Royal Oman Police.
2. Institution which provides data
National Center for Statistics and Information (NCSI)
3. Data availability
NCSI. Population Statistics, Issue 7, 2017 (in Arabic).
https://www.ncsi.gov.om/Elibrary/LibraryContentDoc/bar_pouplation%207%202017_bd18dd23-b2e5-4710-be65-52158136ceef.pdf.
Last date of access: December 2018.
|
Omanis |
Expatriates |
Total |
| 2007 |
256,180 |
660,950 |
917,130 |
| 2008 |
278,403 |
817,254 |
1,095,657 |
| 2009 |
294,937 |
897,161 |
1,192,098 |
| 2010 |
318,086 |
979,242 |
1,297,328 |
| 2011 |
358,881 |
1,273,848 |
1,632,729 |
| 2012 |
338,870 |
1,343,704 |
1,682,574 |
| 2013 |
362,597 |
1,501,528 |
1,864,125 |
| 2014 |
394,429 |
1,546,446 |
1,940,875 |
| 2015 |
365,381 |
1,660,663 |
2,026,044 |
| 2016 |
429,806 |
1,825,603 |
2,255,409 |
| 2017 |
434,368 |
1,832,072 |
2,266,440 |
Source: NCSI. Statistical Yearbooks, 2009 to 2018
ANNEXED NOTE
1. Technical Notes and Definitions
Data refer to total employed population, in the public, private and domestic sectors.
Data for the governmental sector exclude Security and Defense personnels.
see: https://cbo.gov.om/sites/assets/Documents/English/Publications/AnnualReports/AnnualReport2017eng.pdf
Omanis in the private sector are registered with the Public Authority for Social Insurance (PASI).
2. Institution which provides data
National Center for Statistics and Information (NCSI)
3. Data availability
The data on employment by sector and nationality is available in NCSI’s Statistical Yearbooks (chapter “Employment”)
https://www.ncsi.gov.om/Elibrary/Pages/LibraryContentView.aspx
SYB 2018:
https://www.ncsi.gov.om/Elibrary/LibraryContentDoc/bar_Statistical%20Year%20Book%202018_a8b32d59-cdc9-4987-ba29-1e7ce78d5cca.pdf
Last date of access: November 2018.
|
Kuwaitis |
non-Kuwaitis |
Total |
|
Males |
Females |
Total |
Males |
Females |
Total |
Males |
Females |
Total |
| In the labour force |
218,234 |
207,090 |
425,324 |
1,920,306 |
477,757 |
2,398,063 |
2,138,540 |
684,847 |
2,823,387 |
| Out of the labour force |
183,615 |
229,730 |
413,345 |
83,027 |
238,692 |
321,719 |
266,642 |
468,422 |
735,064 |
| N.A. |
35,162 |
39,321 |
74,483 |
45,911 |
54,517 |
100,428 |
81,073 |
93,838 |
174,911 |
| Total |
437,011 |
476,141 |
913,152 |
2,049,244 |
770,966 |
2,820,210 |
2,486,255 |
1,247,107 |
3,733,362 |
Source: PACI
ANNEXED NOTE
1. Characteristics of data and definitions
The source of data used here is the Public Authority for Civil Information (PACI), an independant government body in charge of :
1- centralising all population and labour force data in order to manage a fully computerised population register
2- issuing mandatory civil identification cards to every resident of the country, regardless of age and nationality.
(a) Kuwaiti: the Kuwaiti nationality rests upon a document of Kuwaiti nationality or a certificate proving Kuwaiti nationality issued by the Ministry of Interior of Kuwait.
(b) Non-Kuwaiti: his/ her nationality is determined by the name of the State which issued the passport. The foreign national also entered Kuwait legally and has a stamp of residence.
This category includes the Bidoon, a category of stateless persons living in the Emirate.
(c) Nationality group: collected according to the nationality of the head of the household.
Nationalities are grouped according to specific features common to certain population subgroups: language, geographic origin, etc.
or according to internationally recognized categories such as: (Arab / non-Arab Asian countries / non-Arab African countries; European countries … etc.).
(d) Population in the labour force: population aged 15 years and over, either employed in the government, private or domestic sector, working as a street vendor, or unemployed.
(e) Population out of the labour force: population aged 15 years and above, not active on the labour market (includes the students, the housewives or alike, or retired persons having income).
2. Institution which provides data
The Public Authority for Civil Information (PACI)
3. Period of data coverage: 31 December
The database is updated three times a year and the website presents only the most recent data.
4. Data availability
Data can be downloaded from the “statistics” section of PACI’s website (http://www.paci.gov.kw/en/ (English); http://www.paci.gov.kw/ (Arabic))
section “Statistical reports”
Analytical tables and data crosstabulations are available for download in PDF, html, .png and Excel (.csv) formats.
A selection of tables is available in the sections “General Stats” (https://www.paci.gov.kw/stat/GeneralStat.aspx) and “Analytic Statistics” https://www.paci.gov.kw/stat/SubCategory.aspx?ID=7
Date of access: January 2019.
|
Below working age (<15 years) (%) |
Working age (15 and above) |
Total |
| In the labour force (%) |
Out of the labour force (%) |
| Arab countries |
22 |
53 |
25 |
1,261,062 |
| Egypt |
17 |
74 |
10 |
670,524 |
| Syria |
32 |
39 |
29 |
160,120 |
| Saudi Arabia |
32 |
18 |
50 |
127,604 |
| Asia |
6 |
89 |
5 |
1,868,208 |
| India |
7 |
88 |
5 |
1,012,104 |
| Bangladesh |
1 |
97 |
2 |
281,131 |
| Philippines |
3 |
95 |
2 |
213,989 |
| Pakistan |
11 |
77 |
12 |
109,427 |
| Sri Lanka |
3 |
92 |
4 |
93,749 |
| Nepal |
1 |
99 |
1 |
70,378 |
| Africa |
3 |
93 |
4 |
47,227 |
| Other regions |
24 |
54 |
22 |
42,028 |
| Total |
12 |
75 |
13 |
3,218,525 |
Source: PACI
ANNEXED NOTE
1. Characteristics of data and definitions
The source of data used here is the Public Authority for Civil Information (PACI), an independant government body in charge of :
1- centralising all population and labour force data in order to manage a fully computerised population register
2- issuing mandatory civil identification cards to every resident of the country, regardless of age and nationality.
Data published by PACI are, therefore, administrative data.
Nationality group/ citizenship: collected according to the nationality group or citizenship of individuals, or the head of the household.
Nationalities are grouped according to specific features common to certain population subgroups: language, geographic origin, etc.
or according to internationally recognized categories such as: (Arab / non-Arab Asian countries / non-Arab African countries; European countries … etc.).
Population in the labour force: population aged 15 years and over, either employed in the government, private or domestic sector, working as a street vendor, or unemployed.
Population out of the labour force: population aged 15 years and above, not active on the labour market (includes the students, the housewives or alike, or retired persons having income).
Population aged below 15: population below working age.
The table was built out of a selection of data from two distinct datasets:
– PACI statistical database
– PACI “Population and labor market indicators”
Population out of the labour force by nationality group was calculated using available figures of total population and population included in the labour force, by nationality group.
2. Institution which provides data
The Public Authority for Civil Information (PACI)
3. Period of data coverage: 31 December
The database is updated three times a year and the website presents only the most recent data.
4. Data availability
Data by nationality group of expatriates can be downloaded from the “statistics” section of PACI’s website (http://www.paci.gov.kw/en/ (English); http://www.paci.gov.kw/ (Arabic))
section “Statistical reports”
Analytical tables and data crosstabulations are available for download in PDF, html, .png and Excel (.csv) formats.
A selection of tables is available in the sections “General Stats” (https://www.paci.gov.kw/stat/GeneralStat.aspx) and “Analytic Statistics” https://www.paci.gov.kw/stat/SubCategory.aspx?ID=7
Data pertaining to the citizens of selected foreign countries residing in Kuwait can be found in the “Population and labor market indicators” section of PACI’s website:
https://www.paci.gov.kw/stat/StatIndicators.aspx
Date of access: February 2019.
|
Population by country of citizenship (selected nationalities) |
|
Males |
Females |
Total |
| Oman |
1,263,764 |
1,241,605 |
2,505,369 |
| India |
671,660 |
95,075 |
766,735 |
| Bangladesh |
677,881 |
40,975 |
718,856 |
| Pakistan |
247,627 |
21,241 |
268,868 |
| Egypt |
29,826 |
17,144 |
46,970 |
| Philippines |
13,247 |
31,966 |
45,213 |
| Uganda |
209 |
20,677 |
20,886 |
| Sri Lanka |
6,681 |
13,322 |
20,003 |
| Tanzania |
1,656 |
15,421 |
17,077 |
| Nepal |
10,346 |
6,234 |
16,580 |
| Indonesia |
665 |
13,490 |
14,155 |
| Ethiopia |
149 |
13,423 |
13,572 |
| total non-Omanis |
1,720,640 |
333,954 |
2,054,594 |
| Total |
2,984,404 |
1,575,559 |
4,559,963 |
Source: NCSI
ANNEXED NOTE
1. Technical Notes and Definitions
GLMM’s calculations, based on total figures and percentage distribution of foreign nationals
by sex published in: NCSI. Population Statistics, Issue 7, 2017, p. 6.
Reference period: mid-2017.
Original data source: Royal Oman Police.
2. Institution which provides data
National Center for Statistics and Information (NCSI)
3. Data availability
NCSI. Population Statistics, Issue 7, 2017 (in Arabic).
https://www.ncsi.gov.om/Elibrary/LibraryContentDoc/bar_pouplation%207%202017_bd18dd23-b2e5-4710-be65-52158136ceef.pdf.
Last date of access: December 2018.
|
Population by country of citizenship (selected nationalities) |
| Oman |
2,505,369 |
| India |
766,735 |
| Bangladesh |
718,856 |
| Pakistan |
268,868 |
| Egypt |
46,970 |
| Philippines |
45,213 |
| Uganda |
20,886 |
| Sri Lanka |
20,003 |
| Tanzania |
17,077 |
| Nepal |
16,580 |
| Indonesia |
14,155 |
| Ethiopia |
13,572 |
| total non-Omanis |
2,054,594 |
| Total |
4,559,963 |
Source: NCSI
ANNEXED NOTE
1. Technical Notes and Definitions
GLMM’s calculations, based on total figures and percentage distribution of foreign nationals
by sex published in: NCSI. Population Statistics, Issue 7, 2017, p. 6.
Reference period: mid-2017.
Original data source: Royal Oman Police.
2. Institution which provides data
National Center for Statistics and Information (NCSI)
3. Data availability
NCSI. Population Statistics, Issue 7, 2017 (in Arabic).
https://www.ncsi.gov.om/Elibrary/LibraryContentDoc/bar_pouplation%207%202017_bd18dd23-b2e5-4710-be65-52158136ceef.pdf.
Last date of access: December 2018.
|
Omanis |
Expatriates |
Total |
|
Males |
Females |
Total |
Males |
Females |
Total |
Males |
Females |
Total |
| Illiterate |
5,093 |
1,512 |
6,605 |
36,143 |
4,724 |
40,867 |
41,236 |
6,236 |
47,472 |
| Reads and writes |
23,657 |
5,199 |
28,856 |
495,133 |
63,822 |
558,955 |
518,790 |
69,021 |
587,811 |
| Primary |
25,858 |
3,226 |
29,084 |
156,870 |
19,579 |
176,449 |
182,728 |
22,805 |
205,533 |
| Preparatory |
54,699 |
7,264 |
61,963 |
560,010 |
57,773 |
617,783 |
614,709 |
65,037 |
679,746 |
| Secondary |
100,894 |
37,389 |
138,283 |
225,278 |
17,099 |
242,377 |
326,172 |
54,488 |
380,660 |
| Diploma |
22,384 |
21,615 |
43,999 |
42,174 |
11,934 |
54,108 |
64,558 |
33,549 |
98,107 |
| University |
45,952 |
56,834 |
102,786 |
80,295 |
23,165 |
103,460 |
126,247 |
79,999 |
206,246 |
| Higher Diploma |
4,800 |
5,724 |
10,524 |
4,356 |
897 |
5,253 |
9,156 |
6,621 |
15,777 |
| Master’s Degree |
5,761 |
3,464 |
9,225 |
6,548 |
1,940 |
8,488 |
12,309 |
5,404 |
17,713 |
| Ph.D |
1,101 |
342 |
1,443 |
2,873 |
718 |
3,591 |
3,974 |
1,060 |
5,034 |
| Not stated |
1,464 |
136 |
1,600 |
15,063 |
5,678 |
20,741 |
16,527 |
5,814 |
22,341 |
| Total |
291,663 |
142,705 |
434,368 |
1,624,743 |
207,329 |
1,832,072 |
1,916,406 |
350,034 |
2,266,440 |
Source: NCSI. Statistical Yearbooks, 2009 to 2018
ANNEXED NOTE
1. Technical Notes and Definitions
Data refer to total employed population, in the public, private and domestic sectors.
Data for the governmental sector exclude Security and Defense personnels.
see: https://cbo.gov.om/sites/assets/Documents/English/Publications/AnnualReports/AnnualReport2017eng.pdf
Omanis in the private sector are registered with the Public Authority for Social Insurance (PASI).
2. Institution which provides data
National Center for Statistics and Information (NCSI)
3. Data availability
The data on employment by sector and nationality is available in NCSI’s Statistical Yearbooks (chapter “Employment”)
https://www.ncsi.gov.om/Elibrary/Pages/LibraryContentView.aspx
SYB 2018:
https://www.ncsi.gov.om/Elibrary/LibraryContentDoc/bar_Statistical%20Year%20Book%202018_a8b32d59-cdc9-4987-ba29-1e7ce78d5cca.pdf
Last date of access: November 2018.
|
Omanis |
Expatriates |
Total |
|
Males |
Females |
Total |
Males |
Females |
Total |
Males |
Females |
Total |
| lliterate |
7,056 |
1,956 |
9,012 |
33,465 |
3,523 |
36,988 |
40,521 |
5,479 |
46,000 |
| Read and write |
30,491 |
6,268 |
36,759 |
457,689 |
53,585 |
511,274 |
488,180 |
59,853 |
548,033 |
| Primary |
26,708 |
3,522 |
30,230 |
144,943 |
17,652 |
162,595 |
171,651 |
21,174 |
192,825 |
| Preparatory |
54,173 |
7,570 |
61,743 |
588,090 |
61,419 |
649,509 |
642,263 |
68,989 |
711,252 |
| Secondary |
87,332 |
32,744 |
120,076 |
244,018 |
16,318 |
260,336 |
331,350 |
49,062 |
380,412 |
| Diploma |
28,845 |
24,411 |
53,256 |
44,255 |
11,853 |
56,108 |
73,100 |
36,264 |
109,364 |
| University |
47,719 |
56,295 |
104,014 |
83,623 |
23,784 |
107,407 |
131,342 |
80,079 |
211,421 |
| Higher Diploma |
1,197 |
3,425 |
4,622 |
4,464 |
965 |
5,429 |
5,661 |
4,390 |
10,051 |
| Master Degree |
5,430 |
3,219 |
8,649 |
6,530 |
1,952 |
8,482 |
11,960 |
5,171 |
17,131 |
| PH.D |
1,034 |
285 |
1,319 |
2,835 |
782 |
3,617 |
3,869 |
1,067 |
4,936 |
| Not stated |
105 |
21 |
126 |
17,781 |
6,077 |
23,858 |
17,886 |
6,098 |
23,984 |
| Total |
290,090 |
139,716 |
429,806 |
1,627,693 |
197,910 |
1,825,603 |
1,917,783 |
337,626 |
2,255,409 |
Source: NCSI. Statistical Yearbooks, 2009 to 2018
ANNEXED NOTE
1. Technical Notes and Definitions
Data refer to total employed population, in the public, private and domestic sectors.
Data for the governmental sector exclude Security and Defense personnels.
see: https://cbo.gov.om/sites/assets/Documents/English/Publications/AnnualReports/AnnualReport2017eng.pdf
Omanis in the private sector are registered with the Public Authority for Social Insurance (PASI).
2. Institution which provides data
National Center for Statistics and Information (NCSI)
3. Data availability
The data on employment by sector and nationality is available in NCSI’s Statistical Yearbooks (chapter “Employment”)
https://www.ncsi.gov.om/Elibrary/Pages/LibraryContentView.aspx
SYB 2018:
https://www.ncsi.gov.om/Elibrary/LibraryContentDoc/bar_Statistical%20Year%20Book%202018_a8b32d59-cdc9-4987-ba29-1e7ce78d5cca.pdf
Last date of access: November 2018.
|
Omanis |
Expatriates |
Total |
| 15 – 19 |
2,671 |
29 |
2,700 |
| 20 – 24 |
35,500 |
148,659 |
184,159 |
| 25 – 29 |
87,025 |
465,667 |
552,692 |
| 30 – 34 |
106,815 |
429,907 |
536,722 |
| 35 – 39 |
85,206 |
294,275 |
379,481 |
| 40 – 44 |
49,874 |
197,141 |
247,015 |
| 45 – 49 |
28,213 |
135,874 |
164,087 |
| 50 – 54 |
18,825 |
79,821 |
98,646 |
| 55 – 59 |
12,584 |
48,896 |
61,480 |
| 60 – 64 |
2,209 |
20,104 |
22,313 |
| +65 |
884 |
5,230 |
6,114 |
| Total |
429,806 |
1,825,603 |
2,255,409 |
Source: NCSI. Statistical Yearbook 2017
ANNEXED NOTE
1. Technical Notes and Definitions
Data refer to total employed population, in the public, private and domestic sectors.
Data for the governmental sector exclude Security and Defense personnels.
see: https://cbo.gov.om/sites/assets/Documents/English/Publications/AnnualReports/AnnualReport2017eng.pdf
Omanis in the private sector are registered with the Public Authority for Social Insurance (PASI).
2. Institution which provides data
National Center for Statistics and Information (NCSI)
3. Data availability
The data on employment by sector and nationality is available in NCSI’s Statistical Yearbooks (chapter “Employment”)
https://www.ncsi.gov.om/Elibrary/Pages/LibraryContentView.aspx
SYB 2018:
https://www.ncsi.gov.om/Elibrary/LibraryContentDoc/bar_Statistical%20Year%20Book%202018_a8b32d59-cdc9-4987-ba29-1e7ce78d5cca.pdf
The data are also downloadable from NCSI’s data portal:
http://data.gov.om/byvmwhe/labour-market
Last date of access: November 2018.
|
Omanis |
Expatriates |
Total |
| 15 – 19 |
2,807 |
1 |
2,808 |
| 20 – 24 |
35,916 |
95,567 |
131,483 |
| 25 – 29 |
87,915 |
460,431 |
548,346 |
| 30 – 34 |
99,693 |
383,068 |
482,761 |
| 35 – 39 |
76,017 |
298,160 |
374,177 |
| 40 – 44 |
43,424 |
203,768 |
247,192 |
| 45 – 49 |
25,694 |
115,787 |
141,481 |
| 50 – 54 |
17,763 |
68,416 |
86,179 |
| 55 – 59 |
11,410 |
34,501 |
45,911 |
| 60 – 64 |
2,225 |
9,358 |
11,583 |
| +65 |
721 |
2,484 |
3,205 |
| Total |
403,585 |
1,671,541 |
2,075,126 |
Source: NCSI. Statistical Yearbook 2016
ANNEXED NOTE
1. Technical Notes and Definitions
Data refer to total employed population, in the public, private and domestic sectors.
Data for the governmental sector exclude Security and Defense personnels.
see: https://cbo.gov.om/sites/assets/Documents/English/Publications/AnnualReports/AnnualReport2017eng.pdf
Omanis in the private sector are registered with the Public Authority for Social Insurance (PASI).
2. Institution which provides data
National Center for Statistics and Information (NCSI)
3. Data availability
The data on employment by sector and nationality is available in NCSI’s Statistical Yearbooks (chapter “Employment”)
https://www.ncsi.gov.om/Elibrary/Pages/LibraryContentView.aspx
SYB 2018:
https://www.ncsi.gov.om/Elibrary/LibraryContentDoc/bar_Statistical%20Year%20Book%202018_a8b32d59-cdc9-4987-ba29-1e7ce78d5cca.pdf
The data are also downloadable from NCSI’s data portal:
http://data.gov.om/byvmwhe/labour-market
Last date of access: November 2018.
|
Total |
|
Males |
Females |
Total |
| Kuwaitis |
204,189 |
194,168 |
398,357 |
| Arabs |
596,985 |
60,121 |
657,106 |
| Asians |
1,291,152 |
372,910 |
1,664,062 |
| Africans |
8,637 |
35,322 |
43,959 |
| Europeans |
7,209 |
3,318 |
10,527 |
| N. Americans |
7,897 |
2,533 |
10,430 |
| S. Americans |
680 |
198 |
878 |
| Australians/ Oceanians |
557 |
153 |
710 |
| Total non-Kuwaitis |
1,913,117 |
474,555 |
2,387,672 |
| Grand total |
2,117,306 |
668,723 |
2,786,029 |
Source: PACI
ANNEXED NOTE
1. Characteristics of data and definitions
The source of data used here is the Public Authority for Civil Information (PACI), an independant government body in charge of :
1- centralising all population and labour force data in order to manage a fully computerised population register
2- issuing mandatory civil identification cards to every resident of the country, regardless of age and nationality.
(a) Kuwaiti: the Kuwaiti nationality rests upon a document of Kuwaiti nationality or a certificate proving Kuwaiti nationality issued by the Ministry of Interior of Kuwait.
(b) Non-Kuwaiti: his/ her nationality is determined by the name of the State having issued the passport. The foreign national also entered Kuwait legally and has a stamp of residence.
The Biduns, stateless persons living in the Emirate, are counted with the non-nationals.
(c) Employed population in the labour force: population aged 15 years and above, in paid employment in the government or private sector, as itinerant worker, or in the domestic sector.
(d) Government sector: any organization of the government (organizations, authority and departments), included within the state budget
(Ministries and government departments; authorities with attached budgets; authorities with independent budgets).
(e) Non-governmental sector: any part of the private sector (a company or an individual) or any authority of the non-governmental sector.
(f) Domestic services sector: the household/ family sector, where the work is associated with the residence and its inhabitants,
their service and their comfort (including maids, nannies, cooks, drivers, etc.).
Note: figures of expatriates may differ slightly between PACI’s various sources of data (database; tabulated data) and topic covered.
2. Institution which provides data
The Public Authority for Civil Information (PACI)
3. Period of data coverage: December 2018
The database is updated three times a year and the website presents only the most recent data.
4. Data availability
The statistics section of PACI’s website (“Statistical Reports”) (http://stat.paci.gov.kw/englishreports/ (English); http://stat.paci.gov.kw/arabicreports/ (Arabic))
provides population and socio-economic data broken down by nationality (Kuwaiti/ non-Kuwaiti). Some data are displayed by nationality groups.
Analytical tables and data crosstabulations are available for download in PDF, html, .png and Excel (.csv) formats.
Date of access: February 2019.
|
Omanis |
Expatriates |
Total |
|
Males |
Females |
Total |
Males |
Females |
Total |
Males |
Females |
Total |
| 2007 |
190,431 |
65,749 |
256,180 |
586,237 |
74,713 |
660,950 |
776,668 |
140,462 |
917,130 |
| 2008 |
206,019 |
72,384 |
278,403 |
731,269 |
85,985 |
817,254 |
937,288 |
158,369 |
1,095,657 |
| 2009 |
215,429 |
79,508 |
294,937 |
801,946 |
95,215 |
897,161 |
1,017,375 |
174,723 |
1,192,098 |
| 2010 |
231,965 |
86,121 |
318,086 |
878,730 |
100,512 |
979,242 |
1,110,695 |
186,633 |
1,297,328 |
| 2011 |
234,517 |
99,182 |
358,881 |
1,023,301 |
116,471 |
1,273,848 |
1,257,818 |
215,653 |
1,632,729 |
| 2012 |
235,422 |
103,448 |
338,870 |
1,206,174 |
137,530 |
1,343,704 |
1,441,596 |
240,978 |
1,682,574 |
| 2013 |
250,141 |
112,456 |
362,597 |
1,340,562 |
160,966 |
1,501,528 |
1,590,703 |
273,422 |
1,864,125 |
| 2014 |
270,062 |
124,367 |
394,429 |
1,372,427 |
174,019 |
1,546,446 |
1,642,489 |
298,386 |
1,940,875 |
| 2015 |
242,080 |
123,301 |
365,381 |
1,474,909 |
185,754 |
1,660,663 |
1,716,989 |
309,055 |
2,026,044 |
| 2016 |
290,090 |
139,716 |
429,806 |
1,627,693 |
197,910 |
1,825,603 |
1,917,783 |
337,626 |
2,255,409 |
| 2017 |
291,663 |
142,705 |
434,368 |
1,624,743 |
207,329 |
1,832,072 |
1,916,406 |
350,034 |
2,266,440 |
Source: NCSI. Statistical Yearbooks, 2009 to 2018
ANNEXED NOTE
1. Technical Notes and Definitions
Data refer to total employed population, in the public, private and domestic sectors.
Data for the governmental sector exclude Security and Defense personnels.
see: https://cbo.gov.om/sites/assets/Documents/English/Publications/AnnualReports/AnnualReport2017eng.pdf
Omanis in the private sector are registered with the Public Authority for Social Insurance (PASI).
2. Institution which provides data
National Center for Statistics and Information (NCSI)
3. Data availability
The data on employment by sector and nationality is available in NCSI’s Statistical Yearbooks (chapter “Employment”)
https://www.ncsi.gov.om/Elibrary/Pages/LibraryContentView.aspx
SYB 2018:
https://www.ncsi.gov.om/Elibrary/LibraryContentDoc/bar_Statistical%20Year%20Book%202018_a8b32d59-cdc9-4987-ba29-1e7ce78d5cca.pdf
Last date of access: November 2018.
|
Male |
Female |
Total |
| Oman |
113,642 |
82,038 |
195,680 |
| GCC States |
9 |
51 |
60 |
| Egypt |
6,789 |
3,328 |
10,117 |
| Sudan |
1,202 |
824 |
2,026 |
| Jordan |
360 |
176 |
536 |
| Other Arabs |
2,362 |
808 |
3,170 |
| India |
8,440 |
5,060 |
13,500 |
| Pakistan |
1,252 |
227 |
1,479 |
| Other countries |
2,634 |
2,861 |
5,495 |
| Total |
136,69 |
95,373 |
232,063 |
Source: NCSI.
ANNEXED NOTE
1. Technical Notes and Definitions
Data refer to the population employed in the private and domestic sectors only (agregated figures).
Figures do not include independent, own-account workers.
Period of reference: end of year.
2. Institution which provides data
National Center for Statistics and Information (NCSI)
3. Data availability
The data is available in NCSI’s Statistical Yearbooks (chapter “Employment”)
https://www.ncsi.gov.om/Elibrary/Pages/LibraryContentView.aspx
SYB 2018:
https://www.ncsi.gov.om/Elibrary/LibraryContentDoc/bar_Statistical%20Year%20Book%202018_a8b32d59-cdc9-4987-ba29-1e7ce78d5cca.pdf
Last date of access: November 2018.
|
Male |
Female |
Total |
| Oman |
178,021 |
60,667 |
238,688 |
| India |
646,796 |
27,027 |
673,823 |
| Bangladesh |
626,665 |
42,069 |
668,734 |
| Pakistan |
227,37 |
1,241 |
228,611 |
| Indonesia |
12,58 |
29,036 |
41,616 |
| Ethiopia |
21,973 |
5,425 |
27,398 |
| Philipines |
6,563 |
12,56 |
19,122 |
| Egypt |
10,468 |
5,844 |
16,311 |
| Nepal |
640 |
9,973 |
10,613 |
| Sri Lanka |
116 |
9,264 |
9,38 |
| Other countries |
48,524 |
51,556 |
100,08 |
| Total |
1,779,716 |
254,661 |
2,034,377 |
Source: NCSI.
ANNEXED NOTE
1. Technical Notes and Definitions
Data refer to the population employed in the private and domestic sectors only (agregated figures).
Figures do not include independent, own-account workers.
Period of reference: end of year.
2. Institution which provides data
National Center for Statistics and Information (NCSI)
3. Data availability
The data is available in NCSI’s Statistical Yearbooks (chapter “Employment”)
https://www.ncsi.gov.om/Elibrary/Pages/LibraryContentView.aspx
SYB 2018:
https://www.ncsi.gov.om/Elibrary/LibraryContentDoc/bar_Statistical%20Year%20Book%202018_a8b32d59-cdc9-4987-ba29-1e7ce78d5cca.pdf
Last date of access: November 2018.
|
Omanis |
Expatriates |
Total |
|
Males |
Females |
Total |
Males |
Females |
Total |
Males |
Females |
Total |
| Agriculture, forestry & fishing |
764 |
313 |
1,077 |
91,177 |
172 |
91,349 |
91,941 |
485 |
92,426 |
| Mining & quarrying |
26,574 |
2,101 |
28,675 |
17,601 |
701 |
18,302 |
44,175 |
2,802 |
46,977 |
| Manufacturing |
20,653 |
5,615 |
26,268 |
217,198 |
997 |
218,195 |
237,851 |
6,612 |
244,463 |
| Electricity, gas, steam and air conditioning supply |
2,347 |
365 |
2,712 |
1,034 |
9 |
1,043 |
3,381 |
374 |
3,755 |
| Water supply, sewerage, waste management and remediation activities |
991 |
116 |
1,107 |
4,847 |
17 |
4,864 |
5,838 |
133 |
5,971 |
| Construction |
44,731 |
11,282 |
56,013 |
618,821 |
923 |
619,744 |
663,552 |
12,205 |
675,757 |
| Wholesale, retail trade & repair of motor vehicles and motorcycles |
24,168 |
12,179 |
36,347 |
233,471 |
5,966 |
239,437 |
257,639 |
18,145 |
275,784 |
| Transport, storage |
13,785 |
2,745 |
16,530 |
70,741 |
1,607 |
72,348 |
84,526 |
4,352 |
88,878 |
| Accommodation and food service activities |
5,456 |
2,493 |
7,949 |
113,675 |
3,233 |
116,908 |
119,131 |
5,726 |
124,857 |
| Financial and insurance activities |
8,517 |
7,500 |
16,017 |
3,712 |
402 |
4,114 |
12,229 |
7,902 |
20,131 |
| Real estate activities |
686 |
292 |
978 |
5,782 |
116 |
5,898 |
6,468 |
408 |
6,876 |
| Professional, scientific and technical activities |
3,591 |
2,160 |
5,751 |
17,440 |
1,325 |
18,765 |
21,031 |
3,485 |
24,516 |
| Administrative and support services activities |
12,681 |
4,144 |
16,825 |
70,648 |
2,388 |
73,036 |
83,329 |
6,532 |
89,861 |
| Education |
2,526 |
3,978 |
6,504 |
7,507 |
8,530 |
16,037 |
10,033 |
12,508 |
22,541 |
| Human health and social work activities |
2,455 |
2,349 |
4,804 |
8,263 |
6,352 |
14,615 |
10,718 |
8,701 |
19,419 |
| Arts, entertainment and recreation |
364 |
168 |
532 |
2,749 |
647 |
3,396 |
3,113 |
815 |
3,928 |
| Other service activities |
4,863 |
1,359 |
6,222 |
58,045 |
5,749 |
63,794 |
62,908 |
7,108 |
70,016 |
| Activities of households as employers; undifferentiated goods- and services- producing activities of households for own use |
14 |
0 |
14 |
51,549 |
154,080 |
205,629 |
51,563 |
154,080 |
205,643 |
| Activities of extraterritorial organizations and bodies |
6 |
3 |
9 |
711 |
333 |
1,044 |
717 |
336 |
1,053 |
| Total |
178,021 |
60,667 |
238,688 |
1,601,695 |
193,994 |
1,795,689 |
1,779,716 |
254,661 |
2,034,377 |
Source: NCSI.
ANNEXED NOTE
1. Technical Notes and Definitions
Data refer to the population employed in the private and domestic sectors only (agregated figures).
Figures do not include independent, own-account workers.
Period of reference: end of year.
Classification of economic activities: ISIC Rev.4 (2008).
2. Institution which provides data
National Center for Statistics and Information (NCSI)
3. Data availability
The data is available in NCSI’s Statistical Yearbooks (chapter “Employment”)
https://www.ncsi.gov.om/Elibrary/Pages/LibraryContentView.aspx
SYB 2018:
https://www.ncsi.gov.om/Elibrary/LibraryContentDoc/bar_Statistical%20Year%20Book%202018_a8b32d59-cdc9-4987-ba29-1e7ce78d5cca.pdf
Last date of access: November 2018.
|
Omanis |
Expatriates |
Total |
|
Males |
Females |
Total |
Males |
Females |
Total |
Males |
Females |
Total |
| Agriculture, Hunting and Forestry |
850 |
351 |
1,201 |
91,473 |
184 |
91,657 |
92,323 |
535 |
92,858 |
| Fishing |
20 |
18 |
38 |
2,154 |
17 |
2,171 |
2,174 |
35 |
2,209 |
| Mining and Quarrying |
26,190 |
1,873 |
28,063 |
18,392 |
746 |
19,138 |
44,582 |
2,619 |
47,201 |
| Manufacturing |
19,616 |
4,848 |
24,464 |
218,900 |
976 |
219,876 |
238,516 |
5,824 |
244,340 |
| Electricity, Gas and Water Supply |
2,572 |
372 |
2,944 |
1,030 |
13 |
1,043 |
3,602 |
385 |
3,987 |
| Construction |
43,957 |
10,403 |
54,360 |
650,027 |
956 |
650,983 |
693,984 |
11,359 |
705,343 |
| Wholesale, Retail Trade and Repair of Motor Vehicles, Motorcycles and Personal and Household Goods |
24,585 |
11,359 |
35,944 |
240,622 |
5,480 |
246,102 |
265,207 |
16,839 |
282,046 |
| Hotels and Restaurants |
5,156 |
2,305 |
7,461 |
110,444 |
2,913 |
113,357 |
115,600 |
5,218 |
120,818 |
| Transport, Storage and Communication |
14,785 |
3,372 |
18,157 |
70,019 |
2,014 |
72,033 |
84,804 |
5,386 |
90,190 |
| Financial Intermediaries |
8,481 |
6,953 |
15,434 |
3,681 |
432 |
4,113 |
12,162 |
7,385 |
19,547 |
| Real Estate, Renting and Business Activities |
18,652 |
6,589 |
25,241 |
88,228 |
3,768 |
91,996 |
106,880 |
10,357 |
117,237 |
| Education |
2,318 |
3,576 |
5,894 |
7,359 |
8,106 |
15,465 |
9,677 |
11,682 |
21,359 |
| Health and Social Work |
666 |
1,374 |
2,040 |
4,805 |
5,551 |
10,356 |
5,471 |
6,925 |
12,396 |
| Community and Personal Services |
1,147 |
695 |
1,842 |
48,105 |
5,122 |
53,227 |
49,252 |
5,817 |
55,069 |
| Private Household with Employed Persons |
0 |
0 |
0 |
47,905 |
147,583 |
195,488 |
47,905 |
147,583 |
195,488 |
| Extra-Territorial Organizations and Bodies |
0 |
0 |
0 |
635 |
339 |
974 |
635 |
339 |
974 |
| Total |
168,995 |
54,088 |
223,083 |
1,603,779 |
184,200 |
1,787,979 |
1,772,774 |
238,288 |
2,011,062 |
Source: NCSI.
ANNEXED NOTE
1. Technical Notes and Definitions
Data refer to the population employed in the private and domestic sectors only (agregated figures).
Figures do not include independent, own-account workers.
Period of reference: end of year.
Classification of economic activities: ISIC Rev. 3.
2. Institution which provides data
National Center for Statistics and Information (NCSI)
3. Data availability
The data is available in NCSI’s Statistical Yearbooks (chapter “Employment”)
https://www.ncsi.gov.om/Elibrary/Pages/LibraryContentView.aspx
SYB 2018:
https://www.ncsi.gov.om/Elibrary/LibraryContentDoc/bar_Statistical%20Year%20Book%202018_a8b32d59-cdc9-4987-ba29-1e7ce78d5cca.pdf
Data can also be downloaded from NCSI’s data portal:
http://data.gov.om/
http://data.gov.om/byvmwhe/labour-market
Last date of access: November 2018.
| Relation to labour force |
Below working age (<15 years) (%) |
Working age (aged 15 and above) |
Total |
| Males |
Females |
In the labour force (%) |
Out of the labour force (%) |
Males |
Females |
| Country/ region of origin |
Males |
Females |
Males |
Females |
| Arab countries |
17 |
34 |
71 |
15 |
13 |
51 |
855,136 |
405,926 |
| Egypt |
11 |
39 |
87 |
24 |
3 |
37 |
531,422 |
139,102 |
| Syria |
28 |
38 |
59 |
9 |
13 |
53 |
95,695 |
64,425 |
| Saudi Arabia |
31 |
33 |
31 |
5 |
39 |
62 |
66,683 |
60,921 |
| Asia |
4 |
10 |
95 |
74 |
1 |
15 |
1,364,546 |
503,662 |
| India |
5 |
17 |
94 |
60 |
1 |
22 |
811,409 |
200,695 |
| Bangladesh |
0 |
22 |
99 |
51 |
1 |
27 |
271,590 |
9,541 |
| Philippines |
8 |
2 |
91 |
95 |
1 |
3 |
41,868 |
172,121 |
| Pakistan |
7 |
33 |
90 |
9 |
3 |
58 |
91,421 |
18,006 |
| Sri Lanka |
5 |
3 |
93 |
92 |
2 |
5 |
34,888 |
58,861 |
| Nepal |
0 |
1 |
99 |
96 |
0 |
1 |
50,469 |
19,909 |
| Africa |
6 |
2 |
89 |
94 |
5 |
4 |
9,752 |
37,475 |
| Other regions |
22 |
27 |
67 |
36 |
11 |
37 |
24,334 |
17,694 |
| Total |
9 |
20 |
85 |
50 |
6 |
30 |
2,253,768 |
964,757 |
Source: PACI
ANNEXED NOTE
1. Characteristics of data and definitions
The source of data used here is the Public Authority for Civil Information (PACI), an independant government body in charge of :
1- centralising all population and labour force data in order to manage a fully computerised population register
2- issuing mandatory civil identification cards to every resident of the country, regardless of age and nationality.
Data published by PACI are, therefore, administrative data.
Nationality group/ citizenship: collected according to the nationality group or citizenship of individuals, or the head of the household.
Nationalities are grouped according to specific features common to certain population subgroups: language, geographic origin, etc.
or according to internationally recognized categories such as: (Arab / non-Arab Asian countries / non-Arab African countries; European countries … etc.).
Population in the labour force: population aged 15 years and over, either employed in the government, private or domestic sector, working as a street vendor, or unemployed.
Population out of the labour force: population aged 15 years and above, not active on the labour market (includes the students, the housewives or alike, or retired persons having income).
Population aged below 15: population below working age.
The table was built out of a selection of data from two distinct datasets:
– PACI statistical database
– PACI “Population and labor market indicators”.
Population out of the labour force by nationality group was calculated using available figures of total population and population included in the labour force, by nationality group.
2. Institution which provides data
The Public Authority for Civil Information (PACI)
3. Period of data coverage: 31 December
The database is updated three times a year and the website presents only the most recent data.
4. Data availability
Data by nationality group of expatriates can be downloaded from the “statistics” section of PACI’s website (http://www.paci.gov.kw/en/ (English); http://www.paci.gov.kw/ (Arabic))
section “Statistical reports”
Analytical tables and data crosstabulations are available for download in PDF, html, .png and Excel (.csv) formats.
A selection of tables is available in the sections “General Stats” (https://www.paci.gov.kw/stat/GeneralStat.aspx) and “Analytic Statistics” https://www.paci.gov.kw/stat/SubCategory.aspx?ID=7
Data pertaining to the citizens of selected foreign countries residing in Kuwait can be found in the “Population and labor market indicators” section of PACI’s website:
https://www.paci.gov.kw/stat/StatIndicators.aspx
Date of access: February 2019.
|
Males |
Females |
Total |
% females |
| Kuwaitis |
686,475 |
716,638 |
1,403,113 |
51.1 |
| Arabs |
855,136 |
405,926 |
1,261,062 |
32.2 |
| Asians |
1,364,546 |
503,662 |
1,868,208 |
27.0 |
| Africans |
9,752 |
37,475 |
47,227 |
79.4 |
| Europeans |
9,866 |
8,210 |
18,076 |
45.4 |
| N. Americans |
12,487 |
8,026 |
20,513 |
39.1 |
| S. Americans |
1,035 |
778 |
1,813 |
42.9 |
| Australians/ Oceanians |
946 |
680 |
1,626 |
41.8 |
| Total non-Kuwaitis |
2,253,768 |
964,757 |
3,218,525 |
30.0 |
| Total |
2,940,243 |
1,681,395 |
4,621,638 |
36.4 |
Source: PACI
ANNEXED NOTE
1. Characteristics of data and definitions
The source of data used here is the Public Authority for Civil Information (PACI), an independant government body in charge of :
1- centralising all population and labour force data in order to manage a fully computerised population register
2- issuing mandatory civil identification cards to every resident of the country, regardless of age and nationality.
(a) Kuwaiti: the Kuwaiti nationality rests upon a document of Kuwaiti nationality or a certificate proving Kuwaiti nationality issued by the Ministry of Interior of Kuwait.
(b) Non-Kuwaiti: his/ her nationality is determined by the name of the State which issued the passport. The foreign national also entered Kuwait legally and has a stamp of residence.
This category includes the Bidoon, a category of stateless persons living in the Emirate.
(c) Nationality group: collected according to the nationality of the head of the household.
Nationalities are grouped according to specific features common to certain population subgroups: language, geographic origin, etc.
or according to internationally recognized categories such as: (Arab / non-Arab Asian countries / non-Arab African countries; European countries … etc.).
2. Institution which provides data
The Public Authority for Civil Information (PACI)
3. Period of data coverage: 31 December
The database is updated three times a year and the website presents only the most recent data.
4. Data availability
Data can be downloaded from the “statistics” section of PACI’s website (http://www.paci.gov.kw/en/ (English); http://www.paci.gov.kw/ (Arabic))
section “Statistical reports”
Analytical tables and data crosstabulations are available for download in PDF, html, .png and Excel (.csv) formats.
A selection of tables is available in the sections “General Stats” (https://www.paci.gov.kw/stat/GeneralStat.aspx) and “Analytic Statistics” https://www.paci.gov.kw/stat/SubCategory.aspx?ID=7
Date of access: January 2019.
| Country/ region |
Total |
| of citizenship |
| Arab countries |
1,261,062 |
| of which Egypt |
670,524 |
| Syria |
160,120 |
| Saudi Arabia |
127,604 |
| Asia |
1,868,208 |
| of which India |
1,012,104 |
| Bangladesh |
281,131 |
| Philippines |
213,989 |
| Pakistan |
109,427 |
| Sri Lanka |
93,749 |
| Nepal |
70,378 |
| Africa |
47,227 |
| Other regions |
42,028 |
| Total |
3,218,525 |
Source: PACI
ANNEXED NOTE
1. Characteristics of data and definitions
The source of data used here is the Public Authority for Civil Information (PACI), an independant government body in charge of :
1- centralising all population and labour force data in order to manage a fully computerised population register
2- issuing mandatory civil identification cards to every resident of the country, regardless of age and nationality.
Data published by PACI are, therefore, administrative data.
Nationality group/ citizenship: collected according to the nationality group or citizenship of individuals, or the head of the household.
Nationalities are grouped according to specific features common to certain population subgroups: language, geographic origin, etc.
or according to internationally recognized categories such as: (Arab / non-Arab Asian countries / non-Arab African countries; European countries … etc.).
The table was built out of a selection of data from two distinct datasets:
– PACI statistical database
– PACI “Population and labor market indicators”
2. Institution which provides data
The Public Authority for Civil Information (PACI)
3. Period of data coverage: 31 December
The database is updated three times a year and the website presents only the most recent data.
4. Data availability
Data by nationality group of expatriates can be downloaded from the “statistics” section of PACI’s website (http://www.paci.gov.kw/en/ (English); http://www.paci.gov.kw/ (Arabic))
section “Statistical reports”
Analytical tables and data crosstabulations are available for download in PDF, html, .png and Excel (.csv) formats.
A selection of tables is available in the sections “General Stats” (https://www.paci.gov.kw/stat/GeneralStat.aspx) and “Analytic Statistics” https://www.paci.gov.kw/stat/SubCategory.aspx?ID=7
Data pertaining to the citizens of selected foreign countries residing in Kuwait can be found in the “Population and labor market indicators” section of PACI’s website:
https://www.paci.gov.kw/stat/StatIndicators.aspx
Date of access: February 2019.
| Country/ region of citizenship |
Males |
Females |
Total |
| Arab countries |
855,136 |
405,926 |
1,261,062 |
| of which Egypt |
531,422 |
139,102 |
670,524 |
| Syria |
95,695 |
64,425 |
160,120 |
| Saudi Arabia |
66,683 |
60,921 |
127,604 |
| Asia |
1,364,546 |
503,662 |
1,868,208 |
| of which India |
811,409 |
200,695 |
1,012,104 |
| Bangladesh |
271,590 |
9,541 |
281,131 |
| Philippines |
41,868 |
172,121 |
213,989 |
| Pakistan |
91,421 |
18,006 |
109,427 |
| Sri Lanka |
34,888 |
58,861 |
93,749 |
| Nepal |
50,469 |
19,909 |
70,378 |
| Africa |
9,752 |
37,475 |
47,227 |
| Other regions |
24,334 |
17,694 |
42,028 |
| Total |
2,253,768 |
964,757 |
3,218,525 |
Source: PACI
ANNEXED NOTE
1. Characteristics of data and definitions
The source of data used here is the Public Authority for Civil Information (PACI), an independant government body in charge of :
1- centralising all population and labour force data in order to manage a fully computerised population register
2- issuing mandatory civil identification cards to every resident of the country, regardless of age and nationality.
Data published by PACI are, therefore, administrative data.
Nationality group/ citizenship: collected according to the nationality group or citizenship of individuals, or the head of the household.
Nationalities are grouped according to specific features common to certain population subgroups: language, geographic origin, etc.
or according to internationally recognized categories such as: (Arab / non-Arab Asian countries / non-Arab African countries; European countries … etc.).
The table was built out of a selection of data from two distinct datasets:
– PACI statistical database
– PACI “Population and labor market indicators”
2. Institution which provides data
The Public Authority for Civil Information (PACI)
3. Period of data coverage: 31 December
The database is updated three times a year and the website presents only the most recent data.
4. Data availability
Data by nationality group of expatriates can be downloaded from the “statistics” section of PACI’s website (http://www.paci.gov.kw/en/ (English); http://www.paci.gov.kw/ (Arabic))
section “Statistical reports”
Analytical tables and data crosstabulations are available for download in PDF, html, .png and Excel (.csv) formats.
A selection of tables is available in the sections “General Stats” (https://www.paci.gov.kw/stat/GeneralStat.aspx) and “Analytic Statistics” https://www.paci.gov.kw/stat/SubCategory.aspx?ID=7
Data pertaining to the citizens of selected foreign countries residing in Kuwait can be found in the “Population and labor market indicators” section of PACI’s website:
https://www.paci.gov.kw/stat/StatIndicators.aspx
Date of access: February 2019.
|
Total |
| Kuwaitis |
1,403,113 |
| Arabs |
1,261,062 |
| Asians |
1,868,208 |
| Africans |
47,227 |
| Europeans |
18,076 |
| N. Americans |
20,513 |
| S. Americans |
1,813 |
| Australians/ Oceanians |
1,626 |
| Total non-Kuwaitis |
3,218,525 |
| Total |
4,621,638 |
Source: PACI
ANNEXED NOTE
1. Characteristics of data and definitions
The source of data used here is the Public Authority for Civil Information (PACI), an independant government body in charge of :
1- centralising all population and labour force data in order to manage a fully computerised population register
2- issuing mandatory civil identification cards to every resident of the country, regardless of age and nationality.
(a) Kuwaiti: the Kuwaiti nationality rests upon a document of Kuwaiti nationality or a certificate proving Kuwaiti nationality issued by the Ministry of Interior of Kuwait.
(b) Non-Kuwaiti: his/ her nationality is determined by the name of the State which issued the passport. The foreign national also entered Kuwait legally and has a stamp of residence.
This category includes the Bidoon, a category of stateless persons living in the Emirate.
(c) Nationality group: collected according to the nationality of the head of the household.
Nationalities are grouped according to specific features common to certain population subgroups: language, geographic origin, etc.
or according to internationally recognized categories such as: (Arab / non-Arab Asian countries / non-Arab African countries; European countries … etc.).
2. Institution which provides data
The Public Authority for Civil Information (PACI)
3. Period of data coverage: 31 December
The database is updated three times a year and the website presents only the most recent data.
4. Data availability
Data can be downloaded from the “statistics” section of PACI’s website (http://www.paci.gov.kw/en/ (English); http://www.paci.gov.kw/ (Arabic))
section “Statistical reports”
Analytical tables and data crosstabulations are available for download in PDF, html, .png and Excel (.csv) formats.
A selection of tables is available in the sections “General Stats” (https://www.paci.gov.kw/stat/GeneralStat.aspx) and “Analytic Statistics” https://www.paci.gov.kw/stat/SubCategory.aspx?ID=7
Date of access: January 2019.
|
Kuwaitis |
Non-Kuwaitis |
Total labour force |
| Arabs |
Asians |
Africans |
Europeans |
N. Americans |
S. Americans |
Aus.- Oceanians |
Total non-Kuwaitis |
| Agriculture, hunting and forestry |
451 |
16,286 |
42,230 |
620 |
22 |
9 |
2 |
2 |
59,171 |
59,622 |
| Fishing |
2 |
0 |
0 |
0 |
0 |
0 |
0 |
0 |
0 |
2 |
| Mining and quarrying |
334 |
974 |
585 |
17 |
2 |
2 |
0 |
0 |
1,580 |
1,914 |
| Manufacturing |
4,476 |
42,110 |
104,430 |
563 |
277 |
188 |
51 |
16 |
147,635 |
152,111 |
| Electricity, gas and water supply |
5 |
99 |
332 |
2 |
1 |
2 |
0 |
0 |
436 |
441 |
| Construction |
17,573 |
145,598 |
271,965 |
1,153 |
2,086 |
3,594 |
182 |
155 |
424,733 |
442,306 |
| Wholesale and retail trade; repair of motor vehicles, motorcycles and personal and household goods |
14,762 |
171,997 |
229,811 |
1,415 |
2,056 |
1,666 |
188 |
151 |
407,284 |
422,046 |
| Hotels and restaurants |
1,566 |
36,062 |
71,513 |
755 |
485 |
135 |
59 |
8 |
109,017 |
110,583 |
| Transport, storage and communication |
2,686 |
28,595 |
39,563 |
314 |
119 |
92 |
5 |
4 |
68,692 |
71,378 |
| Financial intermediation |
8,209 |
7,432 |
6,172 |
140 |
148 |
173 |
14 |
21 |
14,100 |
22,309 |
| Real estate, renting and business activities |
22,527 |
63,555 |
94,355 |
679 |
837 |
1,679 |
85 |
91 |
161,281 |
183,808 |
Public administration
and defence; compulsory social security |
338,940 |
73,863 |
51,800 |
417 |
1,383 |
967 |
110 |
69 |
128,609 |
467,549 |
| Education |
2,069 |
15,215 |
7,913 |
505 |
1,802 |
1,352 |
84 |
151 |
27,022 |
29,091 |
| Health and social work |
688 |
7,754 |
12,685 |
34 |
463 |
119 |
18 |
12 |
21,085 |
21,773 |
| Other community, social and personal service activities |
2,594 |
24,725 |
75,368 |
1,155 |
481 |
357 |
41 |
24 |
102,151 |
104,745 |
| Private households with employed persons |
84 |
3,789 |
617,287 |
35,897 |
30 |
4 |
7 |
0 |
657,014 |
657,098 |
| Extra-territorial organizations and bodies |
4 |
189 |
189 |
54 |
46 |
1 |
8 |
0 |
487 |
491 |
| Not Stated |
8,354 |
28,333 |
38,615 |
243 |
374 |
139 |
44 |
18 |
67,766 |
76,120 |
| Total |
425,324 |
666,576 |
1,664,813 |
43,963 |
10,612 |
10,479 |
898 |
722 |
2,398,063 |
2,823,387 |
Source: PACI
ANNEXED NOTE
1. Characteristics of data and definitions
The source of data used here is the Public Authority for Civil Information (PACI), an independant government body in charge of :
1- centralising all population and labour force data in order to manage a fully computerised population register
2- issuing mandatory civil identification cards to every resident of the country, regardless of age and nationality.
The Biduns, stateless persons living in the Emirate, are counted with the non-nationals.
Data refer to the population employed and unemployed, registered in the three sectors of employment (public, private, domestic)
Employed population in the labour force: population aged 15 years and above, in paid employment in the government or private sector, as itinerant worker, or in the domestic sector.
Note: figures of expatriates may differ slightly between PACI’s various sources of data (database; tabulated data) and topic covered.
2. Institution which provides data
The Public Authority for Civil Information (PACI)
3. Period of data coverage: December 2018
The database is updated three times a year and the website presents only the most recent data.
4. Data availability
The statistics section of PACI’s website (“Statistical Reports”) (http://stat.paci.gov.kw/englishreports/ (English); http://stat.paci.gov.kw/arabicreports/ (Arabic))
provides population and socio-economic data broken down by nationality (Kuwaiti/ non-Kuwaiti). Some data are displayed by nationality groups.
Analytical tables and data crosstabulations are available for download in PDF, html, .png and Excel (.csv) formats.
Date of access: February 2019.
|
Kuwaitis |
Non-Kuwaitis |
Total labour force |
| Arabs |
Asians |
Africans |
Europeans |
N. Americans |
S. Americans |
Aus.- Oceanians |
Total non-Kuwaitis |
| Legislators, senior officials and managers |
11,502 |
28,358 |
18,520 |
243 |
1,546 |
1,277 |
126 |
137 |
50,207 |
61,709 |
| Professionals |
82,052 |
91,365 |
32,996 |
573 |
3,352 |
2,596 |
245 |
321 |
131,448 |
213,500 |
| Technicians and associate professionals |
120,913 |
30,004 |
66,364 |
246 |
1,075 |
1,832 |
108 |
40 |
99,669 |
220,582 |
| Clerks |
126,647 |
68,889 |
47,231 |
582 |
751 |
463 |
57 |
42 |
118,015 |
244,662 |
| Service workers and shop and market sales workers |
68,715 |
130,953 |
596,813 |
36,604 |
1,382 |
663 |
140 |
38 |
766,593 |
835,308 |
| Skilled agricultural and fishery workers |
149 |
5,507 |
17,660 |
167 |
4 |
0 |
0 |
0 |
23,338 |
23,487 |
| Craft and related trades workers |
9,525 |
81,116 |
189,601 |
458 |
609 |
581 |
66 |
32 |
272,463 |
281,988 |
| Production supervisors and foremen |
4,332 |
93,529 |
372,052 |
2,139 |
671 |
1,719 |
72 |
24 |
470,206 |
474,538 |
| Regular work professionals |
71 |
90,159 |
240,510 |
1,855 |
132 |
522 |
12 |
9 |
333,199 |
333,270 |
| Not Stated |
1,418 |
46,696 |
83,066 |
1,096 |
1,090 |
826 |
72 |
79 |
132,925 |
134,343 |
| Total |
425,324 |
666,576 |
1,664,813 |
43,963 |
10,612 |
10,479 |
898 |
722 |
2,398,063 |
2,823,387 |
Source: PACI
ANNEXED NOTE
1. Characteristics of data and definitions
The source of data used here is the Public Authority for Civil Information (PACI), an independant government body in charge of :
1- centralising all population and labour force data in order to manage a fully computerised population register
2- issuing mandatory civil identification cards to every resident of the country, regardless of age and nationality.
The Biduns, stateless persons living in the Emirate, are counted with the non-nationals.
Data refer to the population employed and unemployed, registered in the three sectors of employment (public, private, domestic)
Employed population in the labour force: population aged 15 years and above, in paid employment in the government or private sector, as itinerant worker, or in the domestic sector.
Note: figures of expatriates may differ slightly between PACI’s various sources of data (database; tabulated data) and topic covered.
2. Institution which provides data
The Public Authority for Civil Information (PACI)
3. Period of data coverage: December 2018
The database is updated three times a year and the website presents only the most recent data.
4. Data availability
The statistics section of PACI’s website (“Statistical Reports”) (http://stat.paci.gov.kw/englishreports/ (English); http://stat.paci.gov.kw/arabicreports/ (Arabic))
provides population and socio-economic data broken down by nationality (Kuwaiti/ non-Kuwaiti). Some data are displayed by nationality groups.
Analytical tables and data crosstabulations are available for download in PDF, html, .png and Excel (.csv) formats.
Date of access: February 2019.
|
Kuwaitis |
Non-Kuwaitis |
Total |
|
Arabs |
Asians |
Africans |
Europeans |
N. Americans |
S. Americans |
Aus.- Oceanians |
Total N-K. |
|
Male |
Female |
Male |
Female |
Male |
Female |
Male |
Female |
Male |
Female |
Male |
Female |
Male |
Female |
Male |
Female |
Male |
Female |
Male |
Female |
| Legislators, senior officials and managers |
7,444 |
4,058 |
25446 |
2,912 |
17,131 |
1,389 |
193 |
50 |
1,284 |
262 |
1,079 |
198 |
110 |
16 |
116 |
21 |
45,359 |
4,848 |
52,803 |
8,906 |
| Professionals |
27,798 |
54,254 |
68430 |
22,935 |
27,212 |
5,784 |
302 |
271 |
2,164 |
1,188 |
1,648 |
948 |
161 |
84 |
254 |
67 |
100,171 |
31,277 |
127,969 |
85,531 |
| Technicians and associate professionals |
58,686 |
62,227 |
23322 |
6,682 |
37,848 |
28,516 |
184 |
62 |
736 |
339 |
1,411 |
421 |
93 |
15 |
28 |
12 |
63,622 |
36,047 |
122,308 |
98,274 |
| Clerks |
48,214 |
78,433 |
57618 |
11,271 |
34,522 |
12,709 |
250 |
332 |
400 |
351 |
271 |
192 |
37 |
20 |
25 |
17 |
93,123 |
24,892 |
141,337 |
103,325 |
| Service workers and shop and market sales workers |
62,749 |
5,966 |
121785 |
9,168 |
291,079 |
305,734 |
2671 |
33,933 |
625 |
757 |
546 |
117 |
101 |
39 |
27 |
11 |
416,834 |
349,759 |
479,583 |
355,725 |
| Skilled agricultural and fishery workers |
145 |
4 |
5505 |
2 |
17,656 |
4 |
167 |
0 |
3 |
1 |
0 |
0 |
0 |
0 |
0 |
0 |
23,331 |
7 |
23,476 |
11 |
| Craft and related trades workers |
8,664 |
861 |
80378 |
738 |
187,276 |
2,325 |
429 |
29 |
580 |
29 |
510 |
71 |
65 |
1 |
30 |
2 |
269,268 |
3,195 |
277,932 |
4,056 |
| Production supervisors and foremen |
4,020 |
312 |
93196 |
333 |
369,986 |
2,066 |
2105 |
34 |
641 |
30 |
1,507 |
212 |
70 |
2 |
23 |
1 |
467,528 |
2,678 |
471,548 |
2,990 |
| Regular work professionals |
41 |
30 |
89710 |
449 |
232,802 |
7,708 |
1645 |
210 |
113 |
19 |
419 |
103 |
12 |
0 |
8 |
1 |
324,709 |
8,490 |
324,750 |
8,520 |
| Not Stated |
473 |
945 |
38873 |
7,823 |
75,480 |
7,586 |
703 |
393 |
693 |
397 |
523 |
303 |
39 |
33 |
50 |
29 |
116,361 |
16,564 |
116,834 |
17,509 |
| Total |
218,234 |
207,090 |
604263 |
62,313 |
1,290,992 |
373,821 |
8649 |
35,314 |
7,239 |
3,373 |
7,914 |
2,565 |
688 |
210 |
561 |
161 |
1,920,306 |
477,757 |
2,138,540 |
684,847 |
Source: PACI
ANNEXED NOTE
1. Characteristics of data and definitions
The source of data used here is the Public Authority for Civil Information (PACI), an independant government body in charge of :
1- centralising all population and labour force data in order to manage a fully computerised population register
2- issuing mandatory civil identification cards to every resident of the country, regardless of age and nationality.
(a) Kuwaiti: the Kuwaiti nationality rests upon a document of Kuwaiti nationality or a certificate proving Kuwaiti nationality issued by the Ministry of Interior of Kuwait.
(b) Non-Kuwaiti: his/ her nationality is determined by the name of the State having issued the passport. The foreign national also entered Kuwait legally and has a stamp of residence.
The Biduns, stateless persons living in the Emirate, are counted with the non-nationals.
Data refer to the population employed and unemployed, registered in the three sectors of employment (public, private, domestic)
(c) Employed population in the labour force: population aged 15 years and above, in paid employment in the government or private sector, as itinerant worker, or in the domestic sector.
Note: figures of expatriates may differ slightly between PACI’s various sources of data (database; tabulated data) and topic covered.
2. Institution which provides data
The Public Authority for Civil Information (PACI)
3. Period of data coverage: December 2018
The database is updated three times a year and the website presents only the most recent data.
4. Data availability
The statistics section of PACI’s website (“Statistical Reports”) (http://stat.paci.gov.kw/englishreports/ (English); http://stat.paci.gov.kw/arabicreports/ (Arabic))
provides population and socio-economic data broken down by nationality (Kuwaiti/ non-Kuwaiti). Some data are displayed by nationality groups.
Analytical tables and data crosstabulations are available for download in PDF, html, .png and Excel (.csv) formats.
Date of access: February 2019.
|
Employed population |
| Kuwaitis |
398,357 |
| Arabs |
657,106 |
| Asians |
1,664,062 |
| Africans |
43,959 |
| Europeans |
10,527 |
| N. Americans |
10,430 |
| S. Americans |
878 |
| Australians/ Oceanians |
710 |
| Total non-Kuwaitis |
2,387,672 |
| Grand total |
2,786,029 |
Source: PACI
ANNEXED NOTE
1. Characteristics of data and definitions
The source of data used here is the Public Authority for Civil Information (PACI), an independant government body in charge of :
1- centralising all population and labour force data in order to manage a fully computerised population register
2- issuing mandatory civil identification cards to every resident of the country, regardless of age and nationality.
(a) Kuwaiti: the Kuwaiti nationality rests upon a document of Kuwaiti nationality or a certificate proving Kuwaiti nationality issued by the Ministry of Interior of Kuwait.
(b) Non-Kuwaiti: his/ her nationality is determined by the name of the State having issued the passport. The foreign national also entered Kuwait legally and has a stamp of residence.
The Biduns, stateless persons living in the Emirate, are counted with the non-nationals.
(c) Employed population in the labour force: population aged 15 years and above, in paid employment in the government or private sector, as itinerant worker, or in the domestic sector.
(d) Government sector: any organization of the government (organizations, authority and departments), included within the state budget
(Ministries and government departments; authorities with attached budgets; authorities with independent budgets).
(e) Non-governmental sector: any part of the private sector (a company or an individual) or any authority of the non-governmental sector.
(f) Domestic services sector: the household/ family sector, where the work is associated with the residence and its inhabitants,
their service and their comfort (including maids, nannies, cooks, drivers, etc.).
Note: figures of expatriates may differ slightly between PACI’s various sources of data (database; tabulated data) and topic covered.
2. Institution which provides data
The Public Authority for Civil Information (PACI)
3. Period of data coverage: December 2018
The database is updated three times a year and the website presents only the most recent data.
4. Data availability
The statistics section of PACI’s website (“Statistical Reports”) (http://stat.paci.gov.kw/englishreports/ (English); http://stat.paci.gov.kw/arabicreports/ (Arabic))
provides population and socio-economic data broken down by nationality (Kuwaiti/ non-Kuwaiti). Some data are displayed by nationality groups.
Analytical tables and data crosstabulations are available for download in PDF, html, .png and Excel (.csv) formats.
Date of access: February 2019.
|
administrative deportations |
legal deportations |
Total deportations |
| year |
All charges |
Residence law violations |
All charges |
Residence law violations |
Deportations, all charges |
Deportations, residency law violations |
| 2008 |
20,457 |
15,467 |
819 |
28 |
21,276 |
15,495 |
| 2009 |
23,024 |
16,141 |
925 |
24 |
23,949 |
16,165 |
| 2010 |
24,138 |
9,750 |
1,011 |
33 |
25,149 |
9,783 |
| 2011 |
14,679 |
4,708 |
1,242 |
54 |
15,921 |
4,762 |
| 2012 |
15,259 |
4,479 |
1,045 |
43 |
16,304 |
4,522 |
| 2013 |
22,356 |
7,304 |
948 |
64 |
23,304 |
7,368 |
| 2014 |
20,766 |
5,015 |
598 |
22 |
21,364 |
5,037 |
| 2015 |
23,979 |
5,490 |
708 |
29 |
24,687 |
5,519 |
| 2016 |
30,391 |
6,211 |
853 |
41 |
31,244 |
6,252 |
| 2017 |
27,175 |
6,089 |
745 |
23 |
27,920 |
6,112 |
Source: Ministry of Interior
ANNEXED NOTE
1. Definitions
all charges’ includes ‘residence law violation’
The Interior Minister can issue an order to deport a foreigner in the following cases:
1. If there is a court ruling ordering the deportation of the foreigner after serving a prison sentence (legal deportation).
2. If his/her presence in the country is judged detrimental to public order and security and 3. If he/she does not have an apparent source of income (administrative deportation).
The foreigner is then turned over to the Deportation Department, upon decision from the Ministry of Interior.
A deported foreigner will have his dependent family deported with him. Once the deported foreigner leaves the country, he/she is not allowed back to Kuwait,
unless the Interior Minister issues amnesty or pardon.
2. Institution which provides data
Central Statistical Bureau (CSB), Ministry of Planning
3. Data availability
Published in the CSB’ Statistical Yearbooks, in Chapter “Social Services and Security” and in the “Annual Bulletins of Social Statistics”.
Statistical Yearbooks are available online at: https://www.csb.gov.kw/Pages/Statistics_en?ID=18&ParentCatID=2 (website in English)
and at https://www.csb.gov.kw/Pages/Statistics?ID=18&ParentCatID=2 (Arabic website).
Volumes are bilingual (English and Arabic). Every Yearbook is published in PDF format since 2000 and in PDF and Excel formats since 2013.
Bulletins of Social Statistics are available in bilingual version, in PDF and Excel formats:
https://www.csb.gov.kw/Pages/Statistics_en?ID=40&ParentCatID=70
Date of access: February 2019.
|
Government |
Private |
Domestic |
Total |
|
Males |
Females |
Total |
Males |
Females |
Total |
Males |
Females |
Total |
Males |
Females |
Total |
| Kuwaitis |
170,481 |
164,772 |
335,253 |
33,708 |
29,396 |
63,104 |
0 |
0 |
0 |
204,189 |
194,168 |
398,357 |
| Arabs |
48,179 |
22,069 |
70,248 |
545,719 |
37,719 |
583,438 |
3,087 |
333 |
3,420 |
596,985 |
60,121 |
657,106 |
| Asians |
30,466 |
19,252 |
49,718 |
917,058 |
87,724 |
1,004,782 |
343,628 |
265,934 |
609,562 |
1,291,152 |
372,910 |
1,664,062 |
| Africans |
379 |
146 |
525 |
5,408 |
2,676 |
8,084 |
2,850 |
32,500 |
35,350 |
8,637 |
35,322 |
43,959 |
| Europeans |
858 |
562 |
1,420 |
6,347 |
2,750 |
9,097 |
4 |
6 |
10 |
7,209 |
3,318 |
10,527 |
| N. Americans |
763 |
174 |
937 |
7,134 |
2,359 |
9,493 |
0 |
0 |
0 |
7,897 |
2,533 |
10,430 |
| S. Americans |
74 |
23 |
97 |
605 |
172 |
777 |
1 |
3 |
4 |
680 |
198 |
878 |
| Australians/ Oceanians |
60 |
9 |
69 |
497 |
144 |
641 |
0 |
0 |
0 |
557 |
153 |
710 |
| Total non-Kuwaitis |
80,779 |
42,235 |
123,014 |
1,482,768 |
133,544 |
1,616,312 |
349,570 |
298,776 |
648,346 |
1,913,117 |
474,555 |
2,387,672 |
| Grand total |
251,260 |
207,007 |
458,267 |
1,516,476 |
162,940 |
1,679,416 |
349,570 |
298,776 |
648,346 |
2,117,306 |
668,723 |
2,786,029 |
Source: PACI
ANNEXED NOTE
1. Characteristics of data and definitions
The source of data used here is the Public Authority for Civil Information (PACI), an independant government body in charge of :
1- centralising all population and labour force data in order to manage a fully computerised population register
2- issuing mandatory civil identification cards to every resident of the country, regardless of age and nationality.
(a) Kuwaiti: the Kuwaiti nationality rests upon a document of Kuwaiti nationality or a certificate proving Kuwaiti nationality issued by the Ministry of Interior of Kuwait.
(b) Non-Kuwaiti: his/ her nationality is determined by the name of the State having issued the passport. The foreign national also entered Kuwait legally and has a stamp of residence.
The Biduns, stateless persons living in the Emirate, are counted with the non-nationals.
(c) Employed population in the labour force: population aged 15 years and above, in paid employment in the government or private sector, as itinerant worker, or in the domestic sector.
(d) Government sector: any organization of the government (organizations, authority and departments), included within the state budget
(Ministries and government departments; authorities with attached budgets; authorities with independent budgets).
(e) Non-governmental sector: any part of the private sector (a company or an individual) or any authority of the non-governmental sector.
(f) Domestic services sector: the household/ family sector, where the work is associated with the residence and its inhabitants,
their service and their comfort (including maids, nannies, cooks, drivers, etc.).
Note: figures of expatriates may differ slightly between PACI’s various sources of data (database; tabulated data) and topic covered.
2. Institution which provides data
The Public Authority for Civil Information (PACI)
3. Period of data coverage: December 2018
The database is updated three times a year and the website presents only the most recent data.
4. Data availability
The statistics section of PACI’s website (“Statistical Reports”) (http://stat.paci.gov.kw/englishreports/ (English); http://stat.paci.gov.kw/arabicreports/ (Arabic))
provides population and socio-economic data broken down by nationality (Kuwaiti/ non-Kuwaiti). Some data are displayed by nationality groups.
Analytical tables and data crosstabulations are available for download in PDF, html, .png and Excel (.csv) formats.
Date of access: February 2019.
|
Arrivals |
|
2010 |
2011 |
2012 |
2013 |
2014 |
2015 |
2016 |
2017 |
| Kuwait |
3,323,671 |
3,481,257 |
3,730,939 |
4,049,002 |
4,372,866 |
4,267,341 |
4,251,259 |
4,203,324 |
| Other GCC Countries |
1,925,718 |
2,281,844 |
2,429,175 |
2,720,250 |
2,875,609 |
3,093,465 |
3,056,177 |
3,210,889 |
| Bahrain |
122,192 |
121,482 |
163,783 |
230,269 |
237,507 |
264,144 |
237,189 |
247,687 |
| Oman |
18,035 |
17,865 |
19,782 |
20,922 |
22,862 |
23,512 |
24,936 |
29,205 |
| Qatar |
30,873 |
33,023 |
35,861 |
39,048 |
49,739 |
58,308 |
67,682 |
87,513 |
| Saudi Arabia |
1,708,661 |
2,063,815 |
2,160,291 |
2,365,262 |
2,485,970 |
2,657,036 |
2,621,805 |
2,741,495 |
| United Arab Emirates |
45,957 |
45,659 |
49,458 |
64,749 |
79,531 |
90,465 |
104,565 |
104,989 |
| Asian Arab Countries |
607,547 |
557,787 |
533,246 |
518,977 |
523,968 |
539,574 |
534,398 |
543,045 |
| Iraq |
69,080 |
70,058 |
76,757 |
77,213 |
77,135 |
76,179 |
71,145 |
68,671 |
| Jordan |
94,480 |
97,267 |
103,020 |
112,618 |
121,434 |
134,986 |
135,003 |
135,243 |
| Lebanon |
117,686 |
104,739 |
108,277 |
111,408 |
116,997 |
123,935 |
127,702 |
132,639 |
| Palestine |
7,622 |
6,640 |
6,775 |
6,831 |
7,280 |
7,832 |
8,103 |
8,333 |
| Syria |
307,949 |
269,013 |
227,429 |
199,456 |
189,377 |
187,310 |
182,846 |
187,437 |
| Yemen |
10,730 |
10,070 |
10,988 |
11,451 |
11,745 |
9,332 |
9,599 |
10,722 |
| Asian Muslim Countries |
477,386 |
450,986 |
425,345 |
446,888 |
475,056 |
487,322 |
501,677 |
514,417 |
| Afghanistan |
12,607 |
12,457 |
12,467 |
13,120 |
13,085 |
13,527 |
12,527 |
13,573 |
| Azerbaijan |
290 |
340 |
410 |
519 |
627 |
638 |
607 |
887 |
| Bangladesh |
102,390 |
107,817 |
105,983 |
108,788 |
116,401 |
127,865 |
156,274 |
171,551 |
| Brunei |
37 |
14 |
21 |
7 |
30 |
19 |
8 |
36 |
| Indonesia |
35,664 |
25,793 |
17,693 |
13,800 |
12,218 |
10,992 |
10,047 |
9,308 |
| Iran |
81,136 |
72,067 |
72,432 |
76,384 |
76,988 |
75,289 |
72,652 |
72,354 |
| Kazakhstan |
238 |
159 |
218 |
320 |
438 |
579 |
701 |
1,105 |
| Kyrgyzstan |
634 |
229 |
649 |
826 |
1,028 |
957 |
1,087 |
1,609 |
| Malaysia |
4,105 |
4,320 |
4,294 |
4,733 |
4,038 |
4,121 |
4,465 |
5,342 |
| Maldives Islands |
14 |
36 |
49 |
90 |
67 |
83 |
32 |
37 |
| Pakistan |
228,028 |
215,194 |
200,037 |
215,742 |
232,191 |
232,150 |
220,598 |
208,960 |
| Tajikstan |
118 |
129 |
208 |
376 |
232 |
289 |
269 |
190 |
| Turkey |
11,478 |
11,273 |
10,254 |
11,641 |
17,140 |
20,063 |
21,667 |
28,361 |
| Turkmenistan |
48 |
12 |
33 |
22 |
58 |
162 |
128 |
203 |
| Uzbekistan |
599 |
556 |
597 |
519 |
515 |
588 |
615 |
901 |
| Others |
|
|
|
1 |
|
|
|
|
| Other Asian Countries |
1,076,821 |
1,127,510 |
1,160,838 |
1,262,823 |
1,379,561 |
1,471,959 |
1,579,285 |
1,669,723 |
| Armenia |
526 |
586 |
643 |
807 |
1,275 |
2,190 |
2,851 |
3,141 |
| Bhutan |
72 |
123 |
77 |
125 |
88 |
261 |
490 |
923 |
| Borneo |
51 |
84 |
88 |
61 |
59 |
114 |
66 |
64 |
| Cambodia |
64 |
70 |
113 |
81 |
161 |
115 |
99 |
123 |
| Cyprus |
286 |
380 |
614 |
573 |
556 |
593 |
629 |
712 |
| East Timur |
8 |
6 |
5 |
4 |
7 |
4 |
3 |
3 |
| Georgia |
1,832 |
1,135 |
551 |
534 |
564 |
690 |
753 |
1,110 |
| Hong Kong |
244 |
211 |
218 |
269 |
258 |
282 |
217 |
312 |
| India |
751,059 |
789,694 |
826,526 |
917,539 |
999,947 |
1,060,175 |
1,138,733 |
1,222,829 |
| Japan |
4,959 |
4,798 |
5,291 |
5,072 |
5,215 |
5,238 |
5,438 |
5,601 |
| Korea |
7,726 |
10,348 |
11,319 |
12,160 |
14,172 |
15,310 |
15,294 |
18,641 |
| Laos |
20 |
14 |
34 |
25 |
13 |
43 |
30 |
36 |
| Macau |
4 |
10 |
4 |
4 |
3 |
6 |
14 |
15 |
| Mongolia |
170 |
399 |
197 |
187 |
202 |
261 |
205 |
179 |
| Myanmar (Burma) |
188 |
376 |
297 |
288 |
294 |
336 |
335 |
258 |
| Nepal |
52,971 |
53,812 |
47,546 |
50,909 |
51,950 |
48,433 |
57,019 |
56,016 |
| North Korea |
0 |
442 |
354 |
273 |
182 |
243 |
182 |
666 |
| Philippines |
135,182 |
139,988 |
154,389 |
156,952 |
185,503 |
214,263 |
239,588 |
232,147 |
| Republic of China |
10,925 |
14,208 |
13,283 |
15,428 |
15,411 |
20,534 |
25,854 |
32,624 |
| Singapore |
1,457 |
1,323 |
1,174 |
1,126 |
1,096 |
1,135 |
1,201 |
1,271 |
| South Korea |
1,385 |
1,329 |
1,412 |
1,673 |
1,428 |
1,222 |
1,636 |
628 |
| Sri Lanka |
99,330 |
100,782 |
90,260 |
92,066 |
94,632 |
92,677 |
80,007 |
77,390 |
| Thailand |
7,631 |
6,670 |
5,544 |
6,132 |
5,801 |
6,832 |
7,744 |
13,771 |
| Timur Islands |
|
|
2 |
0 |
0 |
0 |
0 |
0 |
| Taiwan |
158 |
196 |
110 |
184 |
179 |
249 |
264 |
295 |
| Vietnam |
573 |
526 |
787 |
351 |
565 |
753 |
633 |
968 |
| African Arab Countries |
604,544 |
629,140 |
686,279 |
754,446 |
805,864 |
875,909 |
927,436 |
969,199 |
| Algeria |
3,694 |
3,566 |
4,116 |
4,259 |
4,321 |
4,229 |
4,410 |
4,885 |
| Comoros Islands |
425 |
303 |
411 |
460 |
409 |
538 |
512 |
640 |
| Djibouti |
92 |
82 |
116 |
174 |
194 |
215 |
185 |
216 |
| Egypt |
569,452 |
594,099 |
646,093 |
710,415 |
760,581 |
828,949 |
878,127 |
911,259 |
| Libya |
677 |
455 |
773 |
914 |
658 |
576 |
653 |
1,107 |
| Mauritania |
11,808 |
293 |
387 |
516 |
541 |
495 |
545 |
497 |
| Morocco |
266 |
11,451 |
13,006 |
13,978 |
13,091 |
13,232 |
13,408 |
16,818 |
| Somalia |
2,170 |
1,935 |
1,948 |
1,963 |
1,897 |
1,972 |
2,026 |
2,044 |
| South Sudan |
|
|
|
58 |
8 |
18 |
30 |
46 |
| Sudan |
8,043 |
9,049 |
10,420 |
12,995 |
15,489 |
16,191 |
16,818 |
18,021 |
| Tunisia |
7,917 |
7,907 |
9,009 |
8,714 |
8,675 |
9,494 |
10,722 |
13,666 |
| African Muslim Countries |
4,690 |
4,379 |
4,909 |
8,646 |
7,408 |
9,904 |
8,543 |
12,162 |
| Benin |
203 |
226 |
260 |
281 |
288 |
343 |
770 |
1,160 |
| Burkina Faso |
70 |
101 |
97 |
162 |
145 |
394 |
431 |
422 |
| Cameroon |
108 |
50 |
60 |
126 |
380 |
2,927 |
1,271 |
1,156 |
| Chad |
1,032 |
794 |
571 |
835 |
996 |
1,069 |
864 |
775 |
| Eritrea |
1,044 |
969 |
976 |
1,075 |
1,176 |
1,104 |
749 |
843 |
| Gabon |
5 |
8 |
12 |
87 |
16 |
14 |
21 |
20 |
| Gambia |
54 |
66 |
72 |
123 |
87 |
311 |
175 |
115 |
| Mali |
120 |
143 |
238 |
676 |
1,154 |
502 |
952 |
1,175 |
| Niger |
173 |
189 |
189 |
223 |
223 |
267 |
320 |
360 |
| Nigeria |
1,281 |
1,173 |
1,170 |
1,377 |
1,305 |
1,637 |
1,342 |
1,418 |
| Senegal |
336 |
385 |
443 |
452 |
444 |
554 |
712 |
653 |
| Sierra Leone |
133 |
158 |
247 |
293 |
528 |
122 |
275 |
3,427 |
| Uganda |
131 |
117 |
574 |
2,936 |
666 |
660 |
661 |
638 |
| Other African Countries |
55,975 |
74,349 |
69,109 |
80,115 |
50,993 |
48,063 |
39,910 |
35,171 |
| Angola |
12 |
20 |
34 |
46 |
27 |
23 |
23 |
27 |
| Botswana |
6 |
29 |
37 |
42 |
48 |
42 |
40 |
42 |
| Burundi |
11 |
22 |
15 |
62 |
43 |
22 |
108 |
271 |
| Central African Republic |
32 |
34 |
37 |
31 |
49 |
30 |
24 |
24 |
| Congo (Brazzaville) |
0 |
7 |
5 |
45 |
3 |
10 |
7 |
13 |
| Dem. Republic of Congo |
30 |
36 |
26 |
72 |
40 |
72 |
132 |
129 |
| Ethiopia |
43,611 |
63,866 |
57,541 |
65,180 |
35,602 |
26,977 |
18,414 |
11,835 |
| Ghana |
3,084 |
2,662 |
2,331 |
2,307 |
5,752 |
10,359 |
5,396 |
3,284 |
| Guinea |
97 |
70 |
78 |
129 |
104 |
65 |
67 |
964 |
| Ivory Coast |
58 |
89 |
71 |
102 |
192 |
515 |
1,971 |
3,972 |
| Kenya |
1,622 |
1,416 |
1,396 |
1,481 |
1,448 |
1,638 |
1,502 |
1,751 |
| Lesotho |
62 |
13 |
23 |
73 |
44 |
47 |
69 |
37 |
| Liberia |
288 |
224 |
221 |
229 |
159 |
109 |
90 |
87 |
| Madagascar |
705 |
458 |
1,978 |
3,510 |
1,476 |
1,205 |
3,798 |
5,119 |
| Malawi |
50 |
92 |
102 |
153 |
86 |
176 |
628 |
302 |
| Mauritius |
143 |
86 |
103 |
108 |
111 |
99 |
115 |
148 |
| Mozambique |
17 |
32 |
37 |
30 |
27 |
138 |
308 |
228 |
| Namibia |
15 |
13 |
9 |
30 |
14 |
14 |
14 |
13 |
| Rwanda |
3 |
15 |
18 |
54 |
23 |
32 |
36 |
70 |
| Seychelles Islands |
24 |
34 |
32 |
44 |
26 |
20 |
24 |
26 |
| South Africa |
5,023 |
4,424 |
4,312 |
5,098 |
4,553 |
4,705 |
5,141 |
5,366 |
| Swaziland |
231 |
71 |
113 |
115 |
100 |
91 |
270 |
139 |
| Tanzania |
211 |
212 |
235 |
437 |
249 |
301 |
256 |
277 |
| Togo |
299 |
174 |
111 |
244 |
475 |
1,013 |
813 |
605 |
| Zambia |
75 |
52 |
23 |
58 |
27 |
38 |
27 |
23 |
| Zimbabwe |
241 |
187 |
199 |
377 |
290 |
310 |
564 |
391 |
| Other |
25 |
4 |
22 |
58 |
25 |
12 |
73 |
28 |
| Oceania |
19,198 |
15,479 |
13,948 |
13,146 |
13,007 |
13,010 |
13,092 |
13,538 |
| Australia |
15,306 |
12,543 |
11,180 |
10,495 |
10,538 |
10,489 |
10,696 |
11,099 |
| Fiji Islands |
565 |
147 |
92 |
94 |
75 |
55 |
51 |
41 |
| New Zealand |
3,251 |
2,750 |
2,641 |
2,530 |
2,352 |
2,414 |
2,322 |
2,373 |
| Other |
76 |
39 |
35 |
27 |
41 |
52 |
23 |
25 |
| North America |
221,998 |
217,655 |
179,215 |
169,417 |
156,681 |
161,185 |
159,053 |
172,115 |
| Canada |
41,156 |
39,130 |
39,060 |
39,968 |
39,877 |
43,146 |
44,388 |
46,363 |
| U.S.A |
180,838 |
178,517 |
140,124 |
129,448 |
116,804 |
118,039 |
114,661 |
125,744 |
| Other |
4 |
8 |
31 |
1 |
0 |
0 |
4 |
8 |
| South & Central America |
4,945 |
5,318 |
5,404 |
5,489 |
5,686 |
5,961 |
7,004 |
8,664 |
| Argentina |
441 |
449 |
532 |
485 |
450 |
415 |
403 |
422 |
| Belize |
175 |
124 |
127 |
113 |
58 |
52 |
115 |
161 |
| Bolivia |
99 |
53 |
80 |
88 |
90 |
80 |
61 |
78 |
| Brazil |
1,374 |
945 |
1,209 |
1,286 |
1,322 |
1,275 |
1,389 |
1,623 |
| Chile |
99 |
60 |
91 |
75 |
96 |
68 |
88 |
125 |
| Colombia |
420 |
243 |
469 |
451 |
396 |
515 |
915 |
1,138 |
| Costarica |
21 |
16 |
19 |
22 |
26 |
28 |
35 |
148 |
| Cuba |
18 |
10 |
65 |
36 |
68 |
39 |
47 |
62 |
| Dominican Republic |
165 |
145 |
248 |
287 |
260 |
286 |
312 |
373 |
| El Salvador |
159 |
41 |
39 |
20 |
34 |
29 |
36 |
352 |
| Equador |
166 |
104 |
197 |
105 |
91 |
220 |
431 |
900 |
| Grenada |
30 |
10 |
17 |
40 |
57 |
40 |
66 |
92 |
| Guatemala |
10 |
13 |
36 |
71 |
50 |
39 |
12 |
8 |
| Guyana |
20 |
17 |
23 |
24 |
24 |
19 |
22 |
39 |
| Haiti |
31 |
60 |
84 |
77 |
125 |
122 |
52 |
27 |
| Honduras |
4 |
21 |
10 |
13 |
49 |
43 |
66 |
67 |
| Jamaica |
61 |
88 |
93 |
91 |
77 |
89 |
171 |
172 |
| Mexico |
276 |
249 |
385 |
514 |
648 |
595 |
792 |
792 |
| Nicaragua |
4 |
2 |
4 |
17 |
33 |
27 |
29 |
28 |
| Panama |
26 |
16 |
55 |
66 |
73 |
48 |
65 |
51 |
| Paraguay |
6 |
4 |
7 |
30 |
21 |
7 |
9 |
75 |
| Peru |
42 |
41 |
149 |
111 |
104 |
110 |
105 |
108 |
| Suriname |
9 |
12 |
26 |
32 |
17 |
154 |
130 |
31 |
| Trinidad & Tobago |
123 |
125 |
99 |
132 |
96 |
179 |
129 |
95 |
| Uruguay |
29 |
46 |
48 |
59 |
45 |
46 |
52 |
42 |
| Venezuela |
1,064 |
870 |
1,248 |
1,172 |
1,206 |
1,398 |
1,413 |
1,405 |
| Others |
73 |
51 |
44 |
72 |
170 |
215 |
471 |
767 |
| Europe |
175,406 |
172,922 |
171,050 |
184,700 |
189,683 |
196,323 |
197,130 |
225,895 |
| Albania |
199 |
205 |
224 |
171 |
268 |
262 |
308 |
852 |
| Andorra |
2 |
7 |
8 |
3 |
3 |
0 |
4 |
4 |
| Austria |
1,997 |
1,914 |
1,690 |
1,826 |
1,805 |
1,866 |
1,964 |
2,135 |
| Belarus |
454 |
376 |
287 |
388 |
342 |
473 |
537 |
668 |
| Belgium |
2,755 |
2,407 |
2,035 |
2,100 |
2,090 |
2,331 |
2,405 |
2,291 |
| Bosnia & Herzegovina |
1,124 |
1,327 |
904 |
816 |
737 |
889 |
928 |
1,031 |
| Bulgaria |
3,490 |
3,223 |
3,365 |
3,325 |
3,546 |
3,268 |
2,903 |
3,827 |
| Croatia |
806 |
774 |
658 |
899 |
1,157 |
1,068 |
967 |
1,252 |
| Czech Republic |
1,353 |
779 |
618 |
669 |
955 |
1,055 |
1,094 |
1,431 |
| Denmark |
3,206 |
3,063 |
3,279 |
3,304 |
3,373 |
3,770 |
3,854 |
4,142 |
| Estonia |
38 |
33 |
51 |
65 |
66 |
124 |
105 |
136 |
| Finland |
1,025 |
1,097 |
930 |
930 |
1,043 |
894 |
853 |
927 |
| France |
15,084 |
15,209 |
15,844 |
15,818 |
16,377 |
17,111 |
17,840 |
19,240 |
| Germany |
15,283 |
14,962 |
14,455 |
18,082 |
17,589 |
16,725 |
14,086 |
14,700 |
| Greece |
2,416 |
2,759 |
2,510 |
2,909 |
3,144 |
3,724 |
3,671 |
4,107 |
| Hungary |
1,380 |
1,345 |
1,497 |
1,583 |
1,785 |
1,714 |
1,955 |
2,204 |
| Iceland |
81 |
110 |
105 |
105 |
85 |
114 |
93 |
109 |
| Ireland |
3,000 |
3,174 |
3,424 |
3,441 |
3,954 |
3,678 |
3,651 |
3,829 |
| Italy |
10,925 |
10,021 |
11,002 |
13,598 |
13,108 |
14,121 |
14,662 |
17,125 |
| Kosovo |
198 |
189 |
192 |
116 |
109 |
107 |
153 |
529 |
| Latvia |
85 |
98 |
152 |
142 |
143 |
162 |
129 |
247 |
| Liechtenstein |
13 |
23 |
70 |
13 |
32 |
25 |
16 |
8 |
| Lithuania |
107 |
120 |
209 |
188 |
265 |
395 |
333 |
396 |
| Luxembourg |
97 |
87 |
104 |
95 |
86 |
96 |
82 |
115 |
| Macedonia |
791 |
372 |
386 |
459 |
542 |
532 |
575 |
2,003 |
| Malta |
222 |
169 |
223 |
230 |
246 |
227 |
242 |
363 |
| Moldova |
54 |
52 |
86 |
41 |
44 |
65 |
73 |
66 |
| Monaco |
6 |
0 |
3 |
3 |
1 |
1 |
4 |
3 |
| Montenegro |
11 |
33 |
48 |
38 |
46 |
102 |
64 |
69 |
| Netherlands |
7,101 |
7,869 |
7,243 |
8,919 |
9,707 |
10,978 |
10,323 |
9,825 |
| Norway |
2,659 |
2,433 |
1,962 |
1,545 |
1,392 |
1,327 |
1,368 |
1,798 |
| Poland |
1,955 |
1,806 |
1,781 |
1,960 |
2,423 |
2,933 |
2,796 |
4,272 |
| Portugal |
1,141 |
989 |
1,449 |
2,019 |
2,590 |
3,212 |
3,622 |
4,123 |
| Romania |
5,609 |
3,499 |
3,480 |
3,947 |
4,585 |
5,585 |
5,022 |
6,377 |
| Russian Federation |
2,579 |
3,190 |
3,119 |
3,263 |
3,590 |
3,797 |
4,810 |
6,255 |
| San Marino |
3 |
7 |
8 |
12 |
6 |
2 |
3 |
6 |
| Serbia |
628 |
923 |
942 |
1,150 |
1,306 |
1,771 |
2,141 |
2,592 |
| Slovakia |
2,772 |
915 |
693 |
772 |
769 |
842 |
678 |
879 |
| Slovenia |
286 |
231 |
296 |
386 |
393 |
428 |
320 |
448 |
| Spain |
6,771 |
6,382 |
5,691 |
7,046 |
7,970 |
8,594 |
9,119 |
10,193 |
| Sweden |
6,614 |
6,826 |
6,820 |
5,539 |
4,630 |
4,306 |
4,271 |
4,491 |
| Switzerland |
2,115 |
2,198 |
2,042 |
2,067 |
2,082 |
1,944 |
1,891 |
1,916 |
| Ukraine |
1,050 |
1,051 |
1,141 |
1,424 |
1,483 |
1,818 |
2,446 |
9,395 |
| United Kingdom |
67,362 |
70,297 |
69,702 |
73,000 |
73,539 |
73,430 |
74,194 |
78,851 |
| Vatican |
7 |
18 |
20 |
25 |
31 |
23 |
9 |
25 |
| Yugoslavia |
551 |
360 |
302 |
269 |
246 |
257 |
153 |
123 |
| Others |
1 |
|
|
|
|
|
|
|
| Others |
33,557 |
36,933 |
50,179 |
52,039 |
43,997 |
38,022 |
31,151 |
32,155 |
| U.N |
67 |
143 |
202 |
134 |
171 |
76 |
96 |
75 |
| Unstated Nationality |
281 |
257 |
218 |
184 |
152 |
139 |
98 |
97 |
| Non Kuwaiti |
33,209 |
36,533 |
49,759 |
51,721 |
43,674 |
37,807 |
30,957 |
31,983 |
| Grand Total |
8,531,456 |
9,055,559 |
9,459,636 |
10,265,938 |
10,900,379 |
11,208,038 |
11,306,115 |
11,610,297 |
Source: Annual Statistical Bulletin of Transport and Communication
ANNEXED NOTE
1. Definitions
The “Non-Kuwaitis are the Bidoun populations.
2. Institution which provides data
Central Statistical Bureau (CSB), Ministry of Planning
3. Data availability
The data is taken from the Annual Statistical Bulletin of Transport and Communication (available in PDF; also in Excel format since 2013).
https://www.csb.gov.kw/Pages/Statistics_en?ID=41&ParentCatID=%2070
https://www.csb.gov.kw/Pages/Statistics?ID=41&ParentCatID=+70
Date of access: December 2018.
|
Departures |
|
2010 |
2011 |
2012 |
2013 |
2014 |
2015 |
2016 |
2017 |
| Kuwait |
3,330,064 |
3,484,743 |
3,732,701 |
4,078,973 |
4,376,313 |
4,275,151 |
4,242,837 |
4,225,026 |
| Other GCC Countries |
1,921,482 |
2,274,580 |
2,421,562 |
2,717,363 |
2,864,362 |
3,076,908 |
3,055,650 |
3,203,970 |
| Bahrain |
119,816 |
121,160 |
164,695 |
229,729 |
235,997 |
263,070 |
236,330 |
248,373 |
| Oman |
17,948 |
17,812 |
19,774 |
20,945 |
22,714 |
23,261 |
24,777 |
28,636 |
| Qatar |
30,905 |
32,848 |
35,625 |
38,948 |
49,066 |
57,495 |
67,596 |
86,265 |
| Saudi Arabia |
1,707,076 |
2,058,350 |
2,151,987 |
2,363,647 |
2,480,981 |
2,643,826 |
2,624,808 |
2,737,223 |
| United Arab Emirates |
45,737 |
44,410 |
49,481 |
64,094 |
75,604 |
89,256 |
102,139 |
103,473 |
| Asian Arab Countries |
608,466 |
557,111 |
524,042 |
510,879 |
527,609 |
546,069 |
536,816 |
548,932 |
| Iraq |
69,387 |
70,665 |
77,296 |
77,325 |
77,329 |
76,578 |
71,044 |
68,956 |
| Jordan |
94,208 |
96,156 |
102,053 |
112,075 |
121,460 |
135,309 |
134,972 |
136,203 |
| Lebanon |
119,211 |
105,536 |
108,385 |
111,382 |
117,978 |
126,000 |
129,488 |
134,729 |
| Palestine |
7,696 |
6,731 |
6,849 |
6,933 |
7,352 |
7,946 |
8,223 |
8,384 |
| Syria |
307,316 |
268,346 |
218,241 |
191,830 |
191,649 |
191,034 |
183,700 |
190,078 |
| Yemen |
10,648 |
9,677 |
11,218 |
11,334 |
11,841 |
9,202 |
9,389 |
10,582 |
| Asian Muslim Countries |
518,125 |
493,717 |
441,427 |
457,522 |
482,329 |
479,576 |
473,421 |
479,054 |
| Afghanistan |
13,577 |
13,271 |
12,697 |
13,311 |
13,145 |
13,496 |
12,768 |
13,626 |
| Azerbaijan |
263 |
348 |
414 |
502 |
625 |
627 |
595 |
880 |
| Bangladesh |
114,113 |
122,441 |
110,559 |
112,808 |
117,939 |
115,021 |
124,882 |
134,209 |
| Brunei |
40 |
13 |
21 |
9 |
23 |
19 |
7 |
32 |
| Indonesia |
59,017 |
46,429 |
24,016 |
16,690 |
13,783 |
12,315 |
10,712 |
9,905 |
| Iran |
82,584 |
74,165 |
73,880 |
77,224 |
78,181 |
76,558 |
73,770 |
73,615 |
| Kazakhstan |
236 |
281 |
219 |
323 |
436 |
535 |
689 |
1,098 |
| Kyrgyzstan |
632 |
702 |
646 |
818 |
1,027 |
943 |
1,126 |
1,551 |
| Malaysia |
4,054 |
4,345 |
4,224 |
4,747 |
4,013 |
4,143 |
4,518 |
5,330 |
| Maldives Islands |
14 |
42 |
49 |
86 |
65 |
88 |
31 |
36 |
| Pakistan |
231,508 |
219,817 |
203,610 |
218,563 |
236,180 |
235,790 |
222,490 |
211,423 |
| Tajikstan |
110 |
125 |
203 |
367 |
231 |
281 |
271 |
186 |
| Turkey |
11,337 |
11,183 |
10,271 |
11,561 |
16,101 |
19,049 |
20,844 |
26,138 |
| Turkmenistan |
49 |
12 |
28 |
25 |
56 |
151 |
116 |
197 |
| Uzbekistan |
591 |
543 |
590 |
488 |
524 |
560 |
602 |
828 |
| Others |
|
|
|
|
|
|
|
|
| Other Asian Countries |
1,025,203 |
1,081,859 |
1,090,118 |
1,207,004 |
1,300,454 |
1,394,577 |
1,517,068 |
1,636,078 |
| Armenia |
510 |
578 |
564 |
805 |
1,244 |
2,270 |
2,932 |
3,153 |
| Bhutan |
70 |
110 |
75 |
114 |
76 |
130 |
219 |
620 |
| Borneo |
50 |
84 |
91 |
63 |
55 |
103 |
68 |
64 |
| Cambodia |
56 |
68 |
107 |
78 |
152 |
122 |
97 |
126 |
| Cyprus |
288 |
380 |
601 |
572 |
562 |
579 |
634 |
691 |
| East Timur |
8 |
6 |
5 |
4 |
7 |
7 |
1 |
3 |
| Georgia |
1,816 |
1,160 |
563 |
544 |
577 |
690 |
707 |
1,121 |
| Hong Kong |
250 |
210 |
223 |
273 |
258 |
287 |
222 |
306 |
| India |
727,722 |
768,680 |
782,368 |
872,026 |
942,574 |
1,009,173 |
1,093,385 |
1,197,953 |
| Japan |
4,942 |
4,849 |
5,280 |
5,061 |
5,201 |
5,179 |
5,412 |
5,586 |
| Korea |
7,715 |
9,778 |
11,021 |
11,990 |
13,955 |
15,336 |
15,049 |
18,171 |
| Laos |
17 |
16 |
31 |
26 |
13 |
46 |
28 |
38 |
| Macau |
5 |
11 |
3 |
3 |
3 |
4 |
8 |
15 |
| Mongolia |
162 |
398 |
207 |
193 |
205 |
265 |
214 |
180 |
| Myanmar (Burma) |
196 |
270 |
354 |
282 |
348 |
413 |
336 |
280 |
| Nepal |
44,544 |
47,750 |
43,915 |
46,524 |
51,026 |
49,747 |
52,268 |
47,537 |
| North Korea |
0 |
477 |
384 |
305 |
190 |
190 |
178 |
3,218 |
| Philippines |
121,556 |
125,195 |
131,499 |
151,062 |
168,821 |
186,124 |
217,701 |
230,210 |
| Republic of China |
10,488 |
13,094 |
14,050 |
15,086 |
15,422 |
19,725 |
24,748 |
29,629 |
| Singapore |
1,338 |
1,306 |
1,149 |
1,077 |
1,097 |
1,123 |
1,171 |
1,247 |
| South Korea |
1,167 |
945 |
1,006 |
1,473 |
1,579 |
1,557 |
1,674 |
636 |
| Sri Lanka |
93,427 |
99,645 |
90,090 |
92,395 |
90,407 |
94,139 |
90,285 |
80,076 |
| Thailand |
8,074 |
6,149 |
5,868 |
6,463 |
5,990 |
6,439 |
8,712 |
13,956 |
| Timur Islands |
|
|
1 |
0 |
0 |
0 |
0 |
0 |
| Taiwan |
160 |
193 |
117 |
187 |
175 |
249 |
260 |
296 |
| Vietnam |
642 |
507 |
546 |
398 |
517 |
680 |
759 |
966 |
| African Arab Countries |
599,027 |
610,487 |
658,148 |
731,440 |
788,637 |
853,814 |
914,016 |
958,463 |
| Algeria |
3,679 |
3,571 |
4,039 |
4,290 |
4,340 |
4,306 |
4,458 |
4,855 |
| Comoros Islands |
395 |
297 |
420 |
474 |
402 |
521 |
518 |
623 |
| Djibouti |
96 |
78 |
116 |
159 |
208 |
210 |
181 |
211 |
| Egypt |
564,061 |
576,116 |
619,909 |
689,331 |
744,554 |
807,405 |
865,000 |
900,839 |
| Libya |
684 |
447 |
763 |
917 |
668 |
547 |
647 |
1,066 |
| Mauritania |
11,840 |
290 |
380 |
508 |
13,223 |
13,338 |
13,678 |
503 |
| Morocco |
267 |
11,367 |
12,778 |
13,848 |
547 |
473 |
548 |
16,897 |
| Somalia |
2,238 |
2,019 |
1,992 |
2,016 |
2,003 |
2,129 |
2,079 |
2,210 |
| South Sudan |
7,916 |
8,473 |
9,060 |
62 |
7 |
16 |
24 |
48 |
| Sudan |
11,110 |
17,379 |
| Tunisia |
7,851 |
7,829 |
8,691 |
8,725 |
8,750 |
9,431 |
10,813 |
13,832 |
| African Muslim Countries |
4,747 |
4,434 |
4,395 |
6,460 |
6,964 |
8,757 |
8,253 |
9,234 |
| Benin |
181 |
218 |
248 |
262 |
242 |
294 |
439 |
591 |
| Burkina Faso |
69 |
96 |
97 |
144 |
132 |
232 |
322 |
313 |
| Cameroon |
106 |
55 |
48 |
128 |
117 |
1,347 |
1,475 |
1,346 |
| Chad |
1,029 |
782 |
575 |
817 |
999 |
1,077 |
823 |
730 |
| Eritrea |
1,146 |
1,084 |
1,012 |
1,098 |
1,226 |
1,128 |
790 |
872 |
| Gabon |
5 |
4 |
9 |
88 |
15 |
11 |
20 |
21 |
| Gambia |
50 |
63 |
71 |
122 |
81 |
134 |
176 |
166 |
| Mali |
108 |
126 |
164 |
497 |
752 |
612 |
654 |
778 |
| Niger |
166 |
188 |
199 |
209 |
206 |
236 |
267 |
320 |
| Nigeria |
1,313 |
1,182 |
1,167 |
1,380 |
1,272 |
1,449 |
1,321 |
1,473 |
| Senegal |
321 |
374 |
436 |
462 |
424 |
514 |
675 |
662 |
| Sierra Leone |
132 |
146 |
168 |
232 |
233 |
232 |
373 |
1,263 |
| Uganda |
121 |
116 |
201 |
1,021 |
1,265 |
1,491 |
918 |
699 |
| Other African Countries |
34,731 |
45,431 |
61,684 |
73,827 |
66,198 |
58,888 |
49,615 |
40,443 |
| Angola |
12 |
15 |
34 |
45 |
27 |
25 |
24 |
24 |
| Botswana |
5 |
22 |
35 |
39 |
50 |
43 |
42 |
38 |
| Burundi |
10 |
21 |
17 |
58 |
35 |
26 |
42 |
114 |
| Central African Republic |
20 |
24 |
30 |
31 |
45 |
30 |
25 |
25 |
| Congo (Brazzaville) |
0 |
7 |
4 |
44 |
3 |
5 |
5 |
9 |
| Dem. Republic of Congo |
34 |
36 |
27 |
61 |
39 |
57 |
79 |
97 |
| Ethiopia |
23,069 |
35,509 |
52,235 |
61,790 |
53,898 |
42,027 |
30,263 |
20,520 |
| Ghana |
3,038 |
2,701 |
2,015 |
1,692 |
2,338 |
6,028 |
7,002 |
5,541 |
| Guinea |
99 |
69 |
83 |
112 |
109 |
70 |
67 |
332 |
| Ivory Coast |
58 |
71 |
76 |
84 |
121 |
299 |
844 |
1,480 |
| Kenya |
1,655 |
1,428 |
1,389 |
1,398 |
1,456 |
1,626 |
1,422 |
1,546 |
| Lesotho |
57 |
13 |
27 |
73 |
45 |
45 |
60 |
37 |
| Liberia |
280 |
227 |
225 |
226 |
161 |
115 |
93 |
60 |
| Madagascar |
615 |
268 |
493 |
1,796 |
2,185 |
2,179 |
1,869 |
2,765 |
| Malawi |
41 |
83 |
102 |
150 |
88 |
84 |
302 |
260 |
| Mauritius |
123 |
114 |
87 |
124 |
112 |
101 |
112 |
142 |
| Mozambique |
18 |
33 |
35 |
26 |
26 |
99 |
245 |
329 |
| Namibia |
15 |
14 |
8 |
29 |
14 |
13 |
14 |
13 |
| Rwanda |
2 |
14 |
18 |
55 |
14 |
28 |
27 |
35 |
| Seychelles Islands |
28 |
27 |
31 |
45 |
26 |
23 |
21 |
26 |
| South Africa |
4,539 |
4,079 |
4,080 |
4,804 |
4,502 |
4,674 |
5,144 |
5,368 |
| Swaziland |
226 |
61 |
114 |
121 |
99 |
92 |
266 |
135 |
| Tanzania |
202 |
196 |
241 |
421 |
250 |
299 |
236 |
279 |
| Togo |
291 |
165 |
70 |
149 |
253 |
564 |
800 |
794 |
| Zambia |
48 |
34 |
17 |
51 |
23 |
20 |
22 |
33 |
| Zimbabwe |
222 |
187 |
177 |
351 |
260 |
307 |
517 |
414 |
| Other |
24 |
13 |
14 |
52 |
19 |
9 |
72 |
27 |
| Oceania |
19,154 |
15,540 |
13,963 |
13,165 |
12,978 |
12,980 |
13,072 |
13,403 |
| Australia |
15,335 |
12,596 |
11,213 |
10,558 |
10,472 |
10,488 |
10,680 |
10,938 |
| Fiji Islands |
546 |
163 |
85 |
70 |
87 |
74 |
45 |
64 |
| New Zealand |
3,238 |
2,752 |
2,637 |
2,524 |
2,386 |
2,390 |
2,332 |
2,380 |
| Other |
35 |
29 |
28 |
13 |
32 |
27 |
12 |
21 |
| North America |
198,991 |
190,257 |
161,215 |
154,087 |
141,896 |
145,848 |
145,696 |
160,266 |
| Canada |
41,253 |
38,543 |
38,981 |
39,835 |
39,439 |
42,322 |
44,227 |
45,927 |
| U.S.A |
157,733 |
151,709 |
122,202 |
114,251 |
102,457 |
103,526 |
101,466 |
114,334 |
| Other |
5 |
5 |
32 |
1 |
0 |
0 |
3 |
5 |
| South & Central America |
4,715 |
5,276 |
5,291 |
5,432 |
5,538 |
5,918 |
6,814 |
8,607 |
| Argentina |
441 |
612 |
529 |
501 |
460 |
426 |
391 |
436 |
| Belize |
171 |
153 |
129 |
111 |
58 |
54 |
116 |
167 |
| Bolivia |
90 |
92 |
79 |
85 |
82 |
76 |
66 |
78 |
| Brazil |
1,364 |
1,242 |
1,224 |
1,287 |
1,351 |
1,290 |
1,371 |
1,628 |
| Chile |
90 |
79 |
88 |
74 |
97 |
68 |
96 |
116 |
| Colombia |
413 |
405 |
468 |
444 |
413 |
513 |
895 |
1,134 |
| Costarica |
14 |
23 |
16 |
20 |
29 |
26 |
31 |
147 |
| Cuba |
21 |
32 |
61 |
36 |
66 |
38 |
38 |
70 |
| Dominican Republic |
170 |
198 |
254 |
287 |
255 |
288 |
315 |
374 |
| El Salvador |
160 |
52 |
39 |
19 |
34 |
26 |
35 |
336 |
| Equador |
149 |
154 |
205 |
103 |
90 |
218 |
445 |
908 |
| Grenada |
29 |
13 |
17 |
42 |
56 |
39 |
68 |
97 |
| Guatemala |
8 |
19 |
30 |
74 |
51 |
37 |
12 |
9 |
| Guyana |
20 |
16 |
23 |
24 |
25 |
17 |
19 |
39 |
| Haiti |
4 |
13 |
9 |
19 |
23 |
44 |
21 |
24 |
| Honduras |
5 |
21 |
11 |
11 |
48 |
33 |
64 |
71 |
| Jamaica |
55 |
90 |
89 |
87 |
77 |
84 |
152 |
167 |
| Mexico |
262 |
358 |
378 |
504 |
627 |
581 |
811 |
753 |
| Nicaragua |
4 |
2 |
4 |
10 |
33 |
30 |
32 |
28 |
| Panama |
20 |
19 |
46 |
64 |
68 |
46 |
65 |
47 |
| Paraguay |
8 |
6 |
5 |
27 |
19 |
8 |
9 |
76 |
| Peru |
40 |
49 |
144 |
120 |
102 |
104 |
104 |
102 |
| Suriname |
6 |
2 |
5 |
19 |
5 |
32 |
31 |
36 |
| Trinidad & Tobago |
123 |
131 |
97 |
135 |
97 |
177 |
124 |
98 |
| Uruguay |
29 |
48 |
48 |
58 |
43 |
45 |
53 |
43 |
| Venezuela |
965 |
1,395 |
1,250 |
1,198 |
1,192 |
1,390 |
1,404 |
1,378 |
| Others |
54 |
52 |
43 |
73 |
137 |
228 |
472 |
764 |
| Europe |
173,568 |
171,244 |
168,525 |
179,992 |
185,538 |
190,235 |
193,208 |
223,078 |
| Albania |
194 |
198 |
209 |
166 |
269 |
247 |
304 |
824 |
| Andorra |
1 |
7 |
8 |
4 |
3 |
0 |
4 |
4 |
| Austria |
1,998 |
1,917 |
1,695 |
1,794 |
1,801 |
1,854 |
1,980 |
2,124 |
| Belarus |
331 |
323 |
253 |
373 |
342 |
453 |
526 |
681 |
| Belgium |
2,771 |
2,391 |
2,047 |
2,057 |
2,057 |
2,275 |
2,397 |
2,266 |
| Bosnia & Herzegovina |
1,108 |
1,214 |
1,037 |
801 |
755 |
863 |
937 |
1,040 |
| Bulgaria |
3,499 |
3,281 |
3,299 |
3,349 |
3,644 |
3,310 |
2,966 |
3,900 |
| Croatia |
815 |
756 |
661 |
873 |
1,168 |
1,046 |
976 |
1,234 |
| Czech Republic |
1,354 |
786 |
622 |
666 |
959 |
1,050 |
1,107 |
1,417 |
| Denmark |
3,202 |
3,050 |
3,249 |
3,253 |
3,368 |
3,358 |
3,388 |
3,722 |
| Estonia |
30 |
27 |
48 |
67 |
65 |
119 |
100 |
123 |
| Finland |
1,025 |
1,096 |
923 |
919 |
1,041 |
903 |
852 |
943 |
| France |
15,053 |
15,216 |
15,735 |
15,726 |
16,284 |
17,110 |
17,659 |
19,235 |
| Germany |
14,659 |
14,462 |
13,313 |
16,368 |
16,036 |
15,308 |
13,832 |
14,659 |
| Greece |
2,337 |
2,823 |
2,487 |
2,906 |
3,082 |
3,709 |
3,674 |
4,081 |
| Hungary |
1,393 |
1,318 |
1,501 |
1,571 |
1,816 |
1,737 |
1,960 |
2,205 |
| Iceland |
76 |
97 |
94 |
92 |
86 |
99 |
88 |
109 |
| Ireland |
2,955 |
3,173 |
3,383 |
3,408 |
3,951 |
3,660 |
3,616 |
3,786 |
| Italy |
10,945 |
9,979 |
10,949 |
13,472 |
12,911 |
13,760 |
14,229 |
16,578 |
| Kosovo |
194 |
195 |
196 |
113 |
117 |
93 |
150 |
508 |
| Latvia |
81 |
91 |
155 |
139 |
141 |
162 |
123 |
232 |
| Liechtenstein |
10 |
13 |
68 |
10 |
23 |
17 |
10 |
7 |
| Lithuania |
108 |
116 |
206 |
190 |
264 |
384 |
340 |
372 |
| Luxembourg |
89 |
82 |
101 |
91 |
84 |
87 |
82 |
111 |
| Macedonia |
814 |
369 |
396 |
446 |
544 |
526 |
576 |
1,984 |
| Malta |
213 |
168 |
221 |
234 |
235 |
235 |
236 |
370 |
| Moldova |
52 |
50 |
71 |
50 |
48 |
59 |
77 |
68 |
| Monaco |
6 |
1 |
3 |
3 |
1 |
1 |
3 |
3 |
| Montenegro |
11 |
32 |
40 |
48 |
41 |
101 |
65 |
66 |
| Netherlands |
7,053 |
7,560 |
6,637 |
7,824 |
8,626 |
9,670 |
9,792 |
9,622 |
| Norway |
2,656 |
2,445 |
1,961 |
1,532 |
1,386 |
1,300 |
1,344 |
1,595 |
| Poland |
1,942 |
1,749 |
1,815 |
1,940 |
2,407 |
2,924 |
2,825 |
4,298 |
| Portugal |
1,156 |
970 |
1,461 |
2,015 |
2,670 |
3,233 |
3,644 |
4,118 |
| Romania |
5,569 |
3,535 |
3,412 |
3,904 |
4,595 |
5,543 |
5,103 |
6,396 |
| Russian Federation |
2,395 |
3,116 |
2,999 |
3,211 |
3,536 |
3,765 |
4,783 |
6,279 |
| San Marino |
3 |
6 |
8 |
10 |
6 |
2 |
3 |
6 |
| Serbia |
583 |
912 |
909 |
1,133 |
1,293 |
1,669 |
2,087 |
2,610 |
| Slovakia |
2,755 |
910 |
710 |
756 |
767 |
805 |
664 |
870 |
| Slovenia |
287 |
224 |
295 |
379 |
394 |
422 |
312 |
448 |
| Spain |
6,595 |
6,120 |
5,629 |
6,950 |
8,014 |
8,486 |
9,000 |
9,639 |
| Sweden |
6,453 |
6,789 |
6,842 |
5,461 |
4,658 |
4,305 |
4,222 |
4,491 |
| Switzerland |
2,098 |
2,173 |
2,045 |
2,038 |
2,102 |
1,915 |
1,888 |
1,919 |
| Ukraine |
1,042 |
1,022 |
1,142 |
1,421 |
1,432 |
1,738 |
2,337 |
9,554 |
| United Kingdom |
67,106 |
70,090 |
69,372 |
71,917 |
72,235 |
71,659 |
72,348 |
77,915 |
| Vatican |
8 |
17 |
20 |
25 |
30 |
25 |
8 |
25 |
| Yugoslavia |
543 |
375 |
298 |
287 |
251 |
248 |
165 |
123 |
| Others |
|
|
0 |
0 |
|
|
|
|
| Others |
34,686 |
37,330 |
51,373 |
53,157 |
44,718 |
37,762 |
31,178 |
32,401 |
| U.N |
66 |
140 |
197 |
123 |
134 |
57 |
88 |
74 |
| Unstated Nationality |
278 |
249 |
217 |
182 |
145 |
143 |
94 |
88 |
| Non Kuwaiti |
34,342 |
36,941 |
50,959 |
52,852 |
44,439 |
37,562 |
30,996 |
32,239 |
| Grand Total |
8,472,959 |
8,972,009 |
9,334,444 |
10,189,301 |
10,803,534 |
11,086,483 |
11,187,644 |
11,538,955 |
Source: Annual Statistical Bulletin of Transport and Communication
ANNEXED NOTE
1. Definitions
The “Non-Kuwaitis are the Bidoun populations.
2. Institution which provides data
Central Statistical Bureau (CSB), Ministry of Planning
3. Data availability
The data is taken from the Annual Statistical Bulletin of Transport and Communication (available in PDF; also in Excel format since 2013).
https://www.csb.gov.kw/Pages/Statistics_en?ID=41&ParentCatID=%2070
https://www.csb.gov.kw/Pages/Statistics?ID=41&ParentCatID=+70
Date of access: December 2018.
| Year |
Kuwaitis |
Non-Kuwaitis |
Total |
| 1990 |
578,511 |
1,573,169 |
2,151,680 |
| 1993 |
657,493 |
988,134 |
1,645,627 |
| 1995 |
708,115 |
1,250,679 |
1,958,794 |
| 1996 |
732,403 |
1,361,486 |
2,093,889 |
| 1998 |
786,010 |
1,484,855 |
2,270,865 |
| 1999 |
812,255 |
1,442,699 |
2,254,954 |
| 2000 |
841,790 |
1,375,468 |
2,217,258 |
| 2001 |
870,283 |
1,438,819 |
2,309,102 |
| 2002 |
898,285 |
1,521,643 |
2,419,928 |
| 2003 |
927,686 |
1,618,998 |
2,546,684 |
| 2004 |
956,234 |
1,797,422 |
2,753,656 |
| 2005 |
992,217 |
1,998,972 |
2,991,189 |
| 2006 |
1,023,316 |
2,159,644 |
3,182,960 |
| 2007 |
1,054,598 |
2,345,039 |
3,399,637 |
| 2008 |
1,087,552 |
2,354,261 |
3,441,813 |
| 2009 |
1,118,911 |
2,365,970 |
3,484,881 |
| 2010 |
1,148,363 |
2,433,691 |
3,582,054 |
| 2011 |
1,183,185 |
2,514,107 |
3,697,292 |
| 2012 |
1,212,436 |
2,611,292 |
3,823,728 |
| 2013 |
1,242,499 |
2,722,645 |
3,965,144 |
| 2014 |
1,275,857 |
2,816,136 |
4,091,993 |
| 2015 |
1,307,605 |
2,931,401 |
4,239,006 |
| 2016 |
1,337,693 |
3,073,431 |
4,411,124 |
| 2017 |
1,370,013 |
3,130,463 |
4,500,476 |
| 2018 |
1,403,113 |
3,218,525 |
4,621,638 |
Source: PACI
ANNEXED NOTE
1. Characteristics of data and definitions
The source of data used here is the Public Authority for Civil Information (PACI), an independant government body in charge of :
1- centralising all population and labour force data in order to manage a fully computerised population register
2- issuing mandatory civil identification cards to every resident of the country, regardless of age and nationality.
The other source of demographic and socioeconomic data on Kuwait is the Central Statistical Office (CSO), operating within the Planning Ministry. The CSO has conducted ten population and housing censuses since its inception in 1957.
Since 1995 a marked discrepancy was witnessed between PACI’ and CSO’ population figures. PACI’ database is connected electronically with other administrations and bodies registering demographic events and professional/ residency issues (births and death; departures and arrivals; end of service, residency and ID deliveries, etc.).
PACI’s records of residents’ movements is thus regularly updated, which limits the risk of population overcount. Therefore, it is more likely that residents were undercounted during CSO- Ministry of Planning’s census operations (see: Shah, N. Population of Kuwait. Structure and Dynamics, Kuwait: Kuwait University Academic Publication Council, 2010, chapter 1).
(a) Kuwaiti: the Kuwaiti nationality rests upon a document of Kuwaiti nationality or a certificate proving Kuwaiti nationality issued by the Ministry of Interior of Kuwait.
(b) Non-Kuwaiti: his/ her nationality is determined by the name of the State which issued the passport. The foreign national also entered Kuwait legally and has a stamp of residence.
This category includes the Bidoon, a category of stateless persons living in the Emirate. Kuwait’s Bidoon population originates from three broad categories:
1) those whose ancestors failed to apply for nationality or lacked necessary documentation at the time of Kuwait’s independence in 1961;
2) those recruited to work in Kuwait’s army or police force during the 1960s who permanently settled in Kuwait, along with their families;
3) children of Kuwaiti mothers and stateless or foreign fathers (see Human Rights Watch. Prisoners of the Past. Kuwaiti Bidun and the Burden of Statelessness, June 2011, p. 3).
(The children of Kuwaiti mothers and non-Kuwaiti fathers (with specific nationality) inherit the father’s nationality. They are stateless if the father is stateless).
(c) Nationality group: collected according to the nationality of the head of the household.
Nationalities are grouped according to specific features common to certain population subgroups: language, geographic origin, etc. or according to internationally recognized categories such as: (Arab / non-Arab Asian countries / non-Arab African countries; European countries … etc.).
2. Institution which provides data
The Public Authority for Civil Information (PACI)
3. Period of data coverage: 31 December
The database is updated three times a year and the website presents only the most recent data.
4. Data availability
The statistics section of PACI’s website (http://www.paci.gov.kw/en/ (English); http://www.paci.gov.kw/ (Arabic)) provides population and socio-economic data broken down by nationality (Kuwaiti/ non-Kuwaiti). Some data are displayed by nationality groups.
Analytical tables and data crosstabulations are available for download in PDF, html, .png and Excel (.csv) formats.
Date of access: March 2018
|
Regular labourers |
Investors |
Temporary labourers |
| New Visas |
Renewals |
Total |
New Visas |
Renewals |
Total |
New Visas |
Renewals |
Total |
| 2008 |
Q3 |
9,014 |
5,630 |
14,644 |
31 |
5 |
36 |
455 |
3 |
458 |
| Q4 |
27,238 |
5,640 |
32,878 |
78 |
23 |
101 |
1,793 |
24 |
1,817 |
| 2009 |
Q1 |
34,458 |
8,298 |
42,756 |
93 |
55 |
148 |
2,340 |
86 |
2,426 |
| Q2 |
27,693 |
29,431 |
57,124 |
105 |
128 |
233 |
1,013 |
620 |
1,633 |
| Q3 |
24,234 |
25,948 |
50,182 |
91 |
65 |
156 |
538 |
406 |
944 |
| Q4 |
25,648 |
32,258 |
57,906 |
97 |
69 |
166 |
832 |
582 |
1,414 |
| 2010 |
Q1 |
24,992 |
39,256 |
64,248 |
139 |
86 |
225 |
1,653 |
277 |
1,930 |
| Q2 |
24,229 |
31,852 |
56,081 |
186 |
111 |
297 |
524 |
330 |
854 |
| Q3 |
25,208 |
27,477 |
52,685 |
139 |
115 |
254 |
445 |
476 |
921 |
| Q4 |
25,266 |
27,382 |
52,648 |
141 |
177 |
318 |
632 |
346 |
978 |
| 2011 |
Q1 |
22,929 |
28,220 |
51,149 |
117 |
193 |
310 |
1,300 |
214 |
1,514 |
| Q2 |
22,070 |
27,210 |
49,280 |
153 |
187 |
340 |
561 |
378 |
939 |
| Q3 |
29,075 |
22,966 |
52,041 |
128 |
137 |
265 |
593 |
178 |
771 |
| Q4 |
28,407 |
28,141 |
56,548 |
121 |
143 |
264 |
650 |
358 |
1,008 |
| 2012 |
Q1 |
30,517 |
32,925 |
63,442 |
172 |
238 |
410 |
863 |
377 |
1,240 |
| Q2 |
30,485 |
28,613 |
59,098 |
222 |
244 |
466 |
1,194 |
437 |
1,631 |
| Q3 |
31,083 |
26,381 |
57,464 |
236 |
213 |
449 |
956 |
395 |
1,351 |
| Q4 |
28,814 |
27,357 |
56,171 |
210 |
252 |
462 |
1,547 |
449 |
1,996 |
| 2013 |
Q1 |
32,200 |
28,589 |
60,789 |
264 |
302 |
566 |
1,242 |
364 |
1,606 |
| Q2 |
32,181 |
28,210 |
60,391 |
260 |
278 |
538 |
386 |
210 |
596 |
| Q3 |
28,841 |
27,855 |
56,696 |
214 |
218 |
432 |
420 |
310 |
730 |
| Q4 |
24,649 |
31,480 |
56,129 |
253 |
269 |
522 |
475 |
257 |
732 |
| 2014 |
Q1 |
27,176 |
37,012 |
64,188 |
320 |
348 |
668 |
864 |
238 |
1,102 |
| Q2 |
31,134 |
34,138 |
65,272 |
382 |
378 |
760 |
265 |
132 |
397 |
| Q3 |
34,611 |
31,253 |
65,864 |
291 |
316 |
607 |
443 |
118 |
561 |
| Q4 |
32,233 |
35,040 |
67,273 |
271 |
385 |
656 |
565 |
142 |
707 |
| 2015 |
Q1 |
33,870 |
40,211 |
74,081 |
292 |
475 |
767 |
541 |
243 |
784 |
| Q2 |
38,635 |
42,933 |
81,568 |
259 |
417 |
676 |
379 |
169 |
548 |
| Q3 |
33,325 |
41,495 |
74,820 |
190 |
362 |
552 |
486 |
170 |
656 |
| Q4 |
38,696 |
50,969 |
89,665 |
282 |
427 |
709 |
513 |
195 |
708 |
| 2016 |
Q1 |
50,160 |
60,179 |
110,339 |
509 |
656 |
1,165 |
623 |
134 |
757 |
| Q2 |
49,538 |
61,643 |
111,181 |
444 |
554 |
998 |
246 |
129 |
375 |
| Q3 |
50,466 |
53,606 |
104,072 |
329 |
443 |
772 |
179 |
143 |
322 |
| Q4 |
51,567 |
63,969 |
115,536 |
553 |
523 |
1,076 |
2 |
160 |
162 |
| 2017 |
Q1 |
47,355 |
67,064 |
114,419 |
937 |
595 |
1,532 |
|
52 |
52 |
| Q2 |
36,736 |
64,512 |
101,248 |
1,035 |
498 |
1,533 |
|
5 |
5 |
| Q3 |
42,793 |
62,045 |
104,838 |
980 |
482 |
1,462 |
|
|
0 |
| Q4 |
44,087 |
67,794 |
111,881 |
934 |
585 |
1,519 |
|
|
0 |
| 2018 |
Q1 |
39,302 |
75,225 |
114,527 |
939 |
865 |
1,804 |
|
|
0 |
| Q2 |
39,566 |
73,856 |
113,422 |
1,061 |
861 |
1,922 |
|
|
0 |
Source: Labour Market Regulatory Authority (LMRA), Expatriate Management System (EMS)
ANNEXED NOTE
1. Technical Notes and Definitions
Within the scope of Law No. 19/2006 on regulating the labour market, the LMRA Expatriate Management System (EMS)
issues regular, temporary and investor work visas for foreign workers in the private, governmental and non-commercial, non-government sectors,
as well as records and issues residency visas to their family dependents.
The system tracks visa applications, renewals, mobility of workers between employers and from one occupation to another.
Domestic workers are registered separately and are not included in the present figures.
The system is updated continuously and linked with other labour-related databases of the Kingdom, including CIO, GDNPR, GOSI, PFC, CSB,
Ministry of Labour (MoL), and Ministry of Industry and Commerce (MOIC).
The Expat Management System (EMS) distinguishes four types of visas for operational purposes: regular work visas for workers with 24-month validity;
temporary work visas issued for workers with 6-month validity; investor work visas issued for investors investing up to BD 100,000;
and dependent visas issued for family members of eligible foreign workers.
A Regular worker is engaged to work in an enterprise for a long period of time, i.e. for more than six months and usually two years with possibility of renewal.
An Investor is a person who invests up to 100,000 Bahraini dinars.
A Temporary worker is engaged to work in an enterprise for a short period of time, i.e. for less than two years and usually six months.
Four major categories of workers in terms of their status in employment are employees, employers, own-account workers, and unpaid family workers.
The definitions that the LMRA adopts for its data can be found in the Glossary section: (http://blmi.lmra.bh/mi_glossary.xml)
2. Institution which provides data
Labour Market Regulatory Authority (LMRA).
3. Data availability
The LMRA publishes these data under its Bahrain Labour Market Indicators (http://www.lmra.bh/blmi), data section (http://blmi.lmra.bh/2018/06/mi_data.xml), table 33.
Figures and results are often reported in tables in both PDF and Excel formats.
Date of access: December 2018
|
|
Regular workers |
Investors |
Temporary workers |
| 2008 |
Q3 |
3,914 |
2 |
83 |
| Q4 |
5,370 |
0 |
659 |
| 2009 |
Q1 |
15,255 |
10 |
1,755 |
| Q2 |
15,211 |
4 |
657 |
| Q3 |
14,032 |
6 |
816 |
| Q4 |
14,744 |
9 |
943 |
| 2010 |
Q1 |
16,043 |
12 |
1,016 |
| Q2 |
15,662 |
6 |
549 |
| Q3 |
16,806 |
8 |
420 |
| Q4 |
16,433 |
13 |
377 |
| 2011 |
Q1 |
17,629 |
7 |
716 |
| Q2 |
17,472 |
14 |
698 |
| Q3 |
14,606 |
9 |
311 |
| Q4 |
15,143 |
12 |
310 |
| 2012 |
Q1 |
14,748 |
10 |
226 |
| Q2 |
14,628 |
14 |
328 |
| Q3 |
14,087 |
21 |
582 |
| Q4 |
17,086 |
24 |
1,510 |
| 2013 |
Q1 |
19,998 |
26 |
1,457 |
| Q2 |
20,057 |
31 |
713 |
| Q3 |
22,051 |
24 |
475 |
| Q4 |
23,957 |
32 |
444 |
| 2014 |
Q1 |
22,855 |
30 |
411 |
| Q2 |
23,041 |
44 |
905 |
| Q3 |
20,548 |
42 |
373 |
| Q4 |
21,832 |
57 |
236 |
| 2015 |
Q1 |
23,297 |
69 |
313 |
| Q2 |
24,001 |
50 |
665 |
| Q3 |
22,198 |
39 |
379 |
| Q4 |
26,034 |
46 |
374 |
| 2016 |
Q1 |
22,919 |
57 |
385 |
| Q2 |
24,944 |
82 |
536 |
| Q3 |
23,625 |
60 |
399 |
| Q4 |
28,076 |
64 |
290 |
| 2017 |
Q1 |
27,958 |
58 |
275 |
| Q2 |
26,204 |
74 |
144 |
| Q3 |
25,559 |
61 |
43 |
| Q4 |
26,131 |
90 |
1 |
| 2018 |
Q1 |
26,984 |
136 |
|
| Q2 |
27,384 |
108 |
|
Source: Labour Market Regulatory Authority (LMRA), Expatriate Management System (EMS)
ANNEXED NOTE
1. Technical Notes and Definitions
Within the scope of Law No. 19/2006 on regulating the labour market, the LMRA Expatriate Management System (EMS)
issues regular, temporary and investor work visas for foreign workers in the private, governmental and non-commercial, non-government sectors,
as well as records and issues residency visas to their family dependents.
The system tracks visa applications, renewals, mobility of workers between employers and from one occupation to another.
Domestic workers are registered separately and are not included in the present figures.
The system is updated continuously and linked with other labour-related databases of the Kingdom, including CIO, GDNPR, GOSI, PFC, CSB,
Ministry of Labour (MoL), and Ministry of Industry and Commerce (MOIC).
The Expat Management System (EMS) distinguishes four types of visas for operational purposes: regular work visas for workers with 24-month validity;
temporary work visas issued for workers with 6-month validity; investor work visas issued for investors investing up to BD 100,000;
and dependent visas issued for family members of eligible foreign workers.
A Regular worker is engaged to work in an enterprise for a long period of time, i.e. for more than six months and usually two years with possibility of renewal.
An Investor is a person who invests up to 100,000 Bahraini dinars.
A Temporary worker is engaged to work in an enterprise for a short period of time, i.e. for less than two years and usually six months.
Four major categories of workers in terms of their status in employment are employees, employers, own-account workers, and unpaid family workers.
The definitions that the LMRA adopts for its data can be found in the Glossary section: (http://blmi.lmra.bh/mi_glossary.xml)
2. Institution which provides data
Labour Market Regulatory Authority (LMRA).
3. Data availability
The LMRA publishes these data under its Bahrain Labour Market Indicators (http://www.lmra.bh/blmi), data section (http://blmi.lmra.bh/2018/06/mi_data.xml), table 33.
Figures and results are often reported in tables in both PDF and Excel formats.
Date of access: December 2018
| year |
private sector |
government sector |
domestic sector |
Total |
| 2004 |
423,172 |
24,821 |
355,395 |
803,388 |
| 2005 |
352,924 |
32,034 |
339,985 |
724,943 |
| 2006 |
716,347 |
42,149 |
441,247 |
1,199,743 |
| 2007 |
1,141,601 |
51,935 |
445,106 |
1,638,642 |
| 2008 |
1,191,204 |
70,924 |
495,885 |
1,758,013 |
| 2009 |
932,494 |
61,143 |
496,092 |
1,489,729 |
| 2010 |
1,061,717 |
68,297 |
565,537 |
1,695,551 |
| 2011 |
1,181,911 |
110,223 |
647,796 |
1,939,930 |
| 2012 |
1,586,532 |
125,909 |
828,425 |
2,540,866 |
| 2013 |
950,252 |
57,007 |
714,593 |
1,721,852 |
| 2014 |
1,574,504 |
104,466 |
847,927 |
2,526,897 |
| 2015 |
1,973,391 |
78,882 |
995,930 |
3,048,203 |
| 2016 |
1,403,731 |
142,824 |
1,173,500 |
2,720,055 |
| 2017 Q1 |
146,561 |
12,288 |
155,643 |
314,492 |
| 2017 Q2 |
191,584 |
9,739 |
185,499 |
386,822 |
| 2017 Q3 |
203,021 |
113,661 |
192,498 |
509,180 |
| 2017 Q4 |
177,669 |
17,711 |
212,085 |
407,465 |
| 2017 |
718,835 |
153,399 |
745,725 |
1,617,959 |
| 2018 Q1 |
105,987 |
14,352 |
221,128 |
341,467 |
| 2018 Q2 |
199,529 |
14,170 |
180,854 |
394,553 |
| 2018 Q3 |
87,502 |
7,258 |
156,558 |
251,318 |
1. Definitions
The labour visa allows the worker to enter Saudi Arabia. It is issued by the Ministry of Foreign Affairs.
In order to employ workers from abroad, the sponsoring company must first file a “Block Visa” request with the Ministry of Labor, requesting pre-approval to sponsor foreign employees.
Once the Block Visa request is approved, the sponsoring company in Saudi Arabia should obtain a visa authorization number and an electronic power of attorney authorized by the Ministry of Foreign Affairs in Saudi Arabia.
Foreign nationals may then apply for work visas through Saudi consular posts in their country of residence. Several documents are required before issuance of work visas, including medical certificate.
Therefore, work visas are more than the actual workers present in the country, as some eventually do not terminate the procedure, or are rejected at a later stage (entry visa; residency procedures…).
2. Institution which provides data
Ministry of Labour, now Ministry of Labour and Social Development (MLSD) (https://mlsd.gov.sa/en/node)
3. Data availability
Until 2015, the data was published in Ministry of Labour’s Statistical Yearbooks
MoL’s Yearbooks until 2015 are no longer available on MLSD’s website.
MLSD’s Yearbook for 2016 has the figure of work visas issued that year:
https://mlsd.gov.sa/sites/default/files/uploads/v.26%20%D8%A7%D9%84%D8%AA%D9%82%D8%B1%D9%8A%D8%B1%20%D8%A7%D9%84%D8%B3%D9%86%D9%88%D9%8A%202016.pdf
Figures for 2017 and 2018 are published in the Labour Force Surveys (quarterly):
https://www.stats.gov.sa/en/814
Last date of access: January 2019.
|
|
Saudis |
|
|
Non-Saudis |
|
|
Total |
|
|
Males |
Females |
Total |
Males |
Females |
Total |
Males |
Females |
Total |
| Public sector |
869,820 |
521,343 |
1,391,163 |
46,948 |
31,063 |
78,011 |
916,768 |
552,406 |
1,469,174 |
| Private sector |
1,173,765 |
545,059 |
1,718,824 |
6,916,213 |
212,441 |
7,128,654 |
8,089,978 |
757,500 |
8,847,478 |
| Domestic services sector |
0 |
0 |
0 |
1,659,729 |
711,661 |
2,371,390 |
1,659,729 |
711,661 |
2,371,390 |
| Grand total |
2,043,585 |
1,066,402 |
3,109,987 |
8,622,890 |
955,165 |
9,578,055 |
10,666,475 |
2,021,567 |
12,688,042 |
Source: GOSI, MCS and MLSD records, in Labour Force Survey 2018 (Q3), GAStat.
ANNEXED NOTE
1. Technical Notes and Definitions
Since 2016, Labour Force Surveys are conducted quarterly.
Period of reference: Q3
Since Q3 2016, apart from sample survey results, the Labour Force Surveys’ publications display administrative data:
the records of Saudi and foreign labourers covered by social security schemes (civil service and social insurance),
as well as Ministry of Labour’s records of domestic labourers.
1. The public sector includes those subject to Civil Service regulations and government employees subject to social insurance regulations (GOSI)
2. The Social Insurance Law of the Kingdom of Saudi Arabia has become compulsorily applied to all Saudi workers in the private sector and to citizens
of any other GCC Member State, effective from 01/01/2006.
Saudi and foreign workers in the sector have to be recorded by the General Organization for Social Insurance (GOSI).
3. Since 2017, the Ministry of Labour and Social Development records all labourers in the domestic sector.
The present data do not include employees in the security and military sectors and employed persons non-registered in the records of GOSI and MCS
Therefore, data presented here may differ from the concerned ministries’ records of actual employment, and from the results of Labour Force Surveys,
which incorporate all workers in their samples.
2. Institution which provides data
General Authority for Statistics (GAStat), Saudi Arabia
3. Data availability
CDSI’s, and later GAStat’s Labour Force Surveys are available online on GAStat’s website since 1999:
https://www.stats.gov.sa/en/814
The present data is taken from Labour Force Survey 2018 (Q3) (Excel format).
https://www.stats.gov.sa/sites/all/modules/pubdlcnt/pubdlcnt.php?file=https://www.stats.gov.sa/sites/default/files/labour_market_3rd_q_2018_1.xlsx&nid=48417
Last date of access: January 2019.
|
2010 |
2011 |
2012 |
2013 |
2014 |
2015 |
2016 |
2017 |
| Arab countries |
696,730 |
722,575 |
750,426 |
802,213 |
837,363 |
877,959 |
898,660 |
916,169 |
| Non-Arab Asian countries |
1,307,218 |
1,338,340 |
1,391,040 |
1,458,161 |
1,525,083 |
1,620,129 |
1,714,717 |
1,775,919 |
| Non-Arab African countries |
48,486 |
73,403 |
83,144 |
93,004 |
73,300 |
61,070 |
49,634 |
47,254 |
| Europe |
9,870 |
10,216 |
10,554 |
10,921 |
11,443 |
12,081 |
12,482 |
13,565 |
| North America |
19,296 |
19,191 |
19,311 |
18,244 |
18,297 |
18,403 |
18,860 |
19,079 |
| Central and South America |
1,082 |
1,121 |
1,131 |
1,109 |
1,104 |
1,179 |
1,343 |
1,499 |
| Australia and Oceania |
1,448 |
1,416 |
1,408 |
1,426 |
1,419 |
1,452 |
1,495 |
1,467 |
| Other |
14 |
13 |
13 |
11 |
9 |
3 |
4 |
3 |
| Total |
2,084,144 |
2,166,275 |
2,257,027 |
2,385,089 |
2,468,018 |
2,592,276 |
2,697,195 |
2,774,955 |
Source: Ministry of Interior
ANNEXED NOTE
1. Definitions
Ministry of Interior’s (Directorate of Migration’s) records of residency permits granted to foreign residents by type/ purpose of permit,
sex and regional origin of holder, for the years 2010 to 2017.
Data presented in the table are stock data: all the non-national residents holding a residence permit on December 31st, the given year.
The present figures include permits delivered for all purposes of stay in Kuwait:
1- Labour in all sectors: governmental (n°17); private sector (n°18); business (n°19) and domestic (n°20) sectors
2- Residence: as family dependent (permit n°22); studies (n°23) and self-residence (n°24).
Residency procedures do not apply to GCC nationals and to Bidouns (stateless residents of Kuwait).
The table thus excludes the Bidouns, the non-Kuwaiti GCC citizens and those in irregular situation.
The present figures do not include the holders of permit n°14 (temporary residents).
2. Institution which provides data
Central Statistical Bureau (CSB), Ministry of Planning.
3. Period of data coverage
December 31st, given years.
4. Data availability
The present data is taken from the “Migration Statistics” reports, published annually by the CSB.
The report (in Arabic and English, PDF format with Excel tables) is available on CSB’s website (Population Statistics, then Migration Statistics)
https://www.csb.gov.kw/Pages/Statistics?ID=56&ParentCatID=+1
https://www.csb.gov.kw/Pages/Statistics_en?ID=56&ParentCatID=+1
Date of access: January 2019.
|
Terminations of dependent visas |
| 2008 |
Q3 |
1,023 |
| Q4 |
894 |
| 2009 |
Q1 |
1,929 |
| Q2 |
2,214 |
| Q3 |
1,845 |
| Q4 |
1,708 |
| 2010 |
Q1 |
1,828 |
| Q2 |
2,433 |
| Q3 |
2,041 |
| Q4 |
1,736 |
| 2011 |
Q1 |
2,067 |
| Q2 |
2,759 |
| Q3 |
2,062 |
| Q4 |
2,052 |
| 2012 |
Q1 |
2,469 |
| Q2 |
2,661 |
| Q3 |
2,082 |
| Q4 |
2,463 |
| 2013 |
Q1 |
3,390 |
| Q2 |
4,124 |
| Q3 |
3,569 |
| Q4 |
3,579 |
| 2014 |
Q1 |
4,002 |
| Q2 |
3,961 |
| Q3 |
3,567 |
| Q4 |
3,379 |
| 2015 |
Q1 |
3,900 |
| Q2 |
4,259 |
| Q3 |
3,781 |
| Q4 |
3,962 |
| 2016 |
Q1 |
4,213 |
| Q2 |
4,754 |
| Q3 |
3,907 |
| Q4 |
4,271 |
| 2017 |
Q1 |
4,574 |
| Q2 |
4,709 |
| Q3 |
4,327 |
| Q4 |
4,398 |
| 2018 |
Q1 |
5,150 |
| Q2 |
5,129 |
Source: Labour Market Regulatory Authority (LMRA), Expatriate Management System (EMS)
ANNEXED NOTE
1. Technical Notes and Definitions
Within the scope of Law No. 19/2006 on regulating the labour market, the LMRA Expatriate Management System (EMS)
issues regular, temporary and investor work visas for foreign workers in the private, governmental and non-commercial, non-government sectors,
as well as records and issues residency visas to their family dependents.
The system tracks visa applications, renewals, mobility of workers between employers and from one occupation to another.
Domestic workers are registered separately.
The system is updated continuously and linked with other labour-related databases of the Kingdom, including CIO, GDNPR, GOSI, PFC, CSB,
Ministry of Labour (MoL), and Ministry of Industry and Commerce (MOIC).
The Expat Management System (EMS) distinguishes four types of visas for operational purposes: regular work visas for workers with 24-month validity;
temporary work visas issued for workers with 6-month validity; investor work visas issued for investors investing up to BD 100,000;
and dependent visas issued for family members of eligible foreign workers.
A Regular worker is engaged to work in an enterprise for a long period of time, i.e. for more than six months and usually two years with possibility of renewal.
An Investor is a person who invests up to 100,000 Bahraini dinars.
A Temporary worker is engaged to work in an enterprise for a short period of time, i.e. for less than two years and usually six months.
Four major categories of workers in terms of their status in employment are employees, employers, own-account workers, and unpaid family workers.
The definitions that the LMRA adopts for its data can be found in the Glossary section: (http://blmi.lmra.bh/mi_glossary.xml)
2. Institution which provides data
Labour Market Regulatory Authority (LMRA).
3. Data availability
The LMRA publishes these data under its Bahrain Labour Market Indicators (http://www.lmra.bh/blmi), data section (http://blmi.lmra.bh/2018/06/mi_data.xml), table 33.
Figures and results are often reported in tables in both PDF and Excel formats.
Date of access: December 2018
|
Family dependents |
| New Visas |
Renewals |
Total |
| 2008 |
Q3 |
3,080 |
3,073 |
6,153 |
| Q4 |
6,128 |
4,451 |
10,579 |
| 2009 |
Q1 |
7,123 |
6,439 |
13,562 |
| Q2 |
7,581 |
8,326 |
15,907 |
| Q3 |
5,904 |
5,152 |
11,056 |
| Q4 |
5,119 |
6,974 |
12,093 |
| 2010 |
Q1 |
6,241 |
11,539 |
17,780 |
| Q2 |
6,021 |
10,897 |
16,918 |
| Q3 |
5,795 |
6,670 |
12,465 |
| Q4 |
4,890 |
7,244 |
12,134 |
| 2011 |
Q1 |
5,024 |
9,538 |
14,562 |
| Q2 |
6,135 |
9,199 |
15,334 |
| Q3 |
5,450 |
5,910 |
11,360 |
| Q4 |
5,067 |
7,319 |
12,386 |
| 2012 |
Q1 |
6,553 |
9,953 |
16,506 |
| Q2 |
7,031 |
9,923 |
16,954 |
| Q3 |
6,763 |
7,057 |
13,820 |
| Q4 |
4,936 |
7,970 |
12,906 |
| 2013 |
Q1 |
7,636 |
10,150 |
17,786 |
| Q2 |
7,814 |
11,056 |
18,870 |
| Q3 |
6,248 |
7,375 |
13,623 |
| Q4 |
5,492 |
8,746 |
14,238 |
| 2014 |
Q1 |
6,955 |
11,595 |
18,550 |
| Q2 |
8,172 |
11,913 |
20,085 |
| Q3 |
6,949 |
8,186 |
15,135 |
| Q4 |
6,030 |
9,505 |
15,535 |
| 2015 |
Q1 |
7,740 |
11,760 |
19,500 |
| Q2 |
8,202 |
12,921 |
21,123 |
| Q3 |
6,926 |
8,412 |
15,338 |
| Q4 |
5,485 |
10,757 |
16,242 |
| 2016 |
Q1 |
8,488 |
14,243 |
22,731 |
| Q2 |
8,277 |
13,971 |
22,248 |
| Q3 |
6,325 |
8,626 |
14,951 |
| Q4 |
6,583 |
10,689 |
17,272 |
| 2017 |
Q1 |
8,724 |
13,461 |
22,185 |
| Q2 |
8,753 |
12,895 |
21,648 |
| Q3 |
7,888 |
8,681 |
16,569 |
| Q4 |
7,033 |
10,521 |
17,554 |
| 2018 |
Q1 |
7,104 |
13,856 |
20,960 |
| Q2 |
7,310 |
15,034 |
22,344 |
Source: Labour Market Regulatory Authority (LMRA), Expatriate Management System (EMS)
ANNEXED NOTE
1. Technical Notes and Definitions
Within the scope of Law No. 19/2006 on regulating the labour market, the LMRA Expatriate Management System (EMS)
issues regular, temporary and investor work visas for foreign workers in the private, governmental and non-commercial, non-government sectors,
as well as records and issues residency visas to their family dependents.
The system tracks visa applications, renewals, mobility of workers between employers and from one occupation to another.
Domestic workers are registered separately.
The system is updated continuously and linked with other labour-related databases of the Kingdom, including CIO, GDNPR, GOSI, PFC, CSB,
Ministry of Labour (MoL), and Ministry of Industry and Commerce (MOIC).
The Expat Management System (EMS) distinguishes four types of visas for operational purposes: regular work visas for workers with 24-month validity;
temporary work visas issued for workers with 6-month validity; investor work visas issued for investors investing up to BD 100,000;
and dependent visas issued for family members of eligible foreign workers.
A Regular worker is engaged to work in an enterprise for a long period of time, i.e. for more than six months and usually two years with possibility of renewal.
An Investor is a person who invests up to 100,000 Bahraini dinars.
A Temporary worker is engaged to work in an enterprise for a short period of time, i.e. for less than two years and usually six months.
Four major categories of workers in terms of their status in employment are employees, employers, own-account workers, and unpaid family workers.
The definitions that the LMRA adopts for its data can be found in the Glossary section: (http://blmi.lmra.bh/mi_glossary.xml)
2. Institution which provides data
Labour Market Regulatory Authority (LMRA).
3. Data availability
The LMRA publishes these data under its Bahrain Labour Market Indicators (http://www.lmra.bh/blmi), data section (http://blmi.lmra.bh/2018/06/mi_data.xml), table 33.
Figures and results are often reported in tables in both PDF and Excel formats.
Date of access: December 2018
|
Domestic workers |
|
New visas |
Renewal |
| 2002 |
21,459 |
9,624 |
| 2003 |
25,607 |
10,188 |
| 2004 |
29,731 |
10,390 |
| 2005 |
30,562 |
11,904 |
| 2006 |
31,876 |
13,029 |
| 2007 |
33,393 |
14,324 |
| 2008 |
36,319 |
15,060 |
| 2009 |
35,683 |
16,222 |
| 2010 |
26,821 |
13,949 |
| 2011 |
33,205 |
18,712 |
| 2012 |
39,803 |
17,919 |
| 2013 |
39,235 |
17,537 |
| 2014 |
37,173 |
19,882 |
| 2015 |
38,618 |
19,835 |
| 2016 |
39,070 |
20,259 |
| 2017 |
38,130 |
20,538 |
Source: Ministry of Labour (MOL) and LMRA Domestic Workers System (DMS).
ANNEXED NOTE
1. Technical Notes and Definitions
Until September 2014, visas were issued by the Ministry of Labour.
Figures refer to active domestic workers holding a labour permit, for which a residency permit has been issued.
A Domestic worker is an employee who works, and often also lives, within the employer’s household.
2. Institution which provides data
Ministry of Labour (MOL).
Labour Market Regulatory Authority (LMRA).
3. Data availability
The LMRA publishes these data under its Bahrain Labour Market Indicators (http://www.lmra.bh/blmi), dashboard section (http://blmi.lmra.bh/2018/06/mi_dashboard.xml).
Tables are in PDF format.
http://blmi.lmra.bh/2018/06/data/ems/Table_80.pdf
Date of access: December 2018
|
Family dependents |
Labourers |
Total visas |
|
Regular worker |
Investor |
Temporary worker |
Domestic worker |
| 2009 |
52,618 |
217,236 |
722 |
6,719 |
51,905 |
329,200 |
| 2010 |
59,297 |
225,662 |
1,094 |
4,683 |
40,770 |
331,506 |
| 2011 |
53,642 |
209,017 |
1,179 |
4,232 |
51,917 |
319,987 |
| 2012 |
60,186 |
236,175 |
1,787 |
6,218 |
57,722 |
362,088 |
| 2013 |
64,517 |
234,005 |
2,058 |
3,664 |
56,772 |
361,016 |
| 2014 |
69,305 |
262,597 |
2,691 |
2,767 |
57,055 |
394,415 |
| 2015 |
72,203 |
320,134 |
2,704 |
2,696 |
58,453 |
456,190 |
| 2016 |
77,202 |
441,128 |
4,011 |
1,616 |
59,329 |
583,286 |
| 2017 |
77,956 |
432,386 |
6,046 |
57 |
58,668 |
575,113 |
Source: LMRA-EMS and DWS; Ministry of Labour
ANNEXED NOTE
1. Technical Notes and Definitions
GLMM compilation of data submitted quarterly to LMRA from the Expatriates Management System (EMS), Domestic Workers System (DWS) (from 2014) and from MoL:
until September 2014,domestic labourers’ visas were issued by the Ministry of Labour.
The data refer to inflows (new and renewed permits). They are not net flows, since yearly figures of permits’ terminations are not substracted from these numbers.
2. Institution which provides data
Ministry of Labour (MOL).
Labour Market Regulatory Authority (LMRA).
3. Data availability
The LMRA publishes these data under its Bahrain Labour Market Indicators (http://www.lmra.bh/blmi), data section (http://blmi.lmra.bh/2018/06/mi_data.xml), table 33
and dashboard section (http://blmi.lmra.bh/2018/06/mi_dashboard.xml), table 80 (http://blmi.lmra.bh/2018/06/data/ems/Table_80.pdf).
Date of access: December 2018
|
Population by country of citizenship (selected nationalities) |
|
Males |
Females |
Total |
| Oman |
1,263,764 |
1,241,605 |
2,505,369 |
| India |
671,660 |
95,075 |
766,735 |
| Bangladesh |
677,881 |
40,975 |
718,856 |
| Pakistan |
247,627 |
21,241 |
268,868 |
| Egypt |
29,826 |
17,144 |
46,970 |
| Philippines |
13,247 |
31,966 |
45,213 |
| Uganda |
209 |
20,677 |
20,886 |
| Sri Lanka |
6,681 |
13,322 |
20,003 |
| Tanzania |
1,656 |
15,421 |
17,077 |
| Nepal |
10,346 |
6,234 |
16,580 |
| Indonesia |
665 |
13,490 |
14,155 |
| Ethiopia |
149 |
13,423 |
13,572 |
| total non-Omanis |
1,720,640 |
333,954 |
2,054,594 |
| Total |
2,984,404 |
1,575,559 |
4,559,963 |
Source: NCSI
ANNEXED NOTE
1. Technical Notes and Definitions
GLMM’s calculations, based on total figures and percentage distribution of foreign nationals
by sex published in: NCSI. Population Statistics, Issue 7, 2017
Reference period: mid-2017.
Original data source: Royal Oman Police.
2. Institution which provides data
National Center for Statistics and Information (NCSI)
3. Data availability
NCSI. Population Statistics, Issue 7, 2017
https://www.ncsi.gov.om/Elibrary/LibraryContentDoc/bar_pouplation%207%202017_bd18dd23-b2e5-4710-be65-52158136ceef.pdf.
Last date of access: December 2018.
|
Omanis |
Expatriates |
total workforce |
|
public sector |
private sector |
Total employed Omanis |
public sector |
private sector |
domestic sector |
Total employed expatriates |
| 2005 |
109,424 |
98,537 |
207,961 |
22,990 |
424,788 |
n.a. |
447,778 |
655,739 |
| 2006 |
116,054 |
114,311 |
230,365 |
22,752 |
510,713 |
n.a. |
533,465 |
763,830 |
| 2007 |
124,405 |
131,775 |
256,180 |
22,503 |
638,447 |
n.a. |
660,950 |
917,130 |
| 2008 |
131,209 |
147,194 |
278,403 |
22,319 |
698,489 |
96,446 |
817,254 |
1,095,657 |
| 2009 |
136,622 |
158,315 |
294,937 |
22,916 |
779,653 |
94,592 |
897,161 |
1,192,098 |
| 2010 |
140,370 |
177,716 |
318,086 |
23,612 |
862,209 |
93,421 |
979,242 |
1,297,328 |
| 2011 |
159,258 |
174,441 |
333,699 |
25,182 |
1,006,928 |
107,662 |
1,139,772 |
1,473,471 |
| 2012 |
166,804 |
172,066 |
338,870 |
27,522 |
1,190,300 |
125,882 |
1,343,704 |
1,682,574 |
| 2013 |
180,737 |
181,860 |
362,597 |
30,392 |
1,332,431 |
138,705 |
1,501,528 |
1,864,125 |
| 2014 |
196,919 |
197,510 |
394,429 |
36,053 |
1,270,213 |
240,180 |
1,546,446 |
1,940,875 |
| 2015 |
193,965 |
209,620 |
403,585 |
35,502 |
1,373,842 |
262,196 |
1,671,540 |
2,075,125 |
| 2016 |
195,937 |
233,869 |
429,806 |
37,624 |
1,504,936 |
283,043 |
1,825,603 |
2,255,409 |
| 2017 |
195,680 |
238,688 |
434,368 |
36,383 |
1,502,808 |
292,881 |
1,832,072 |
2,266,440 |
Source: NCSI. Statistical Yearbooks, 2009 to 2018
ANNEXED NOTE
1. Technical Notes and Definitions
Data for the governmental sector exclude Security and Defense personnels.
see: https://cbo.gov.om/sites/assets/Documents/English/Publications/AnnualReports/AnnualReport2017eng.pdf
Omanis in the private sector are registered with the Public Authority for Social Insurance (PASI).
2. Institution which provides data
National Center for Statistics and Information (NCSI)
3. Data availability
The data on employment by sector and nationality is available in NCSI’s Statistical Yearbooks (chapter “Employment”)
https://www.ncsi.gov.om/Elibrary/Pages/LibraryContentView.aspx
SYB 2018:
https://www.ncsi.gov.om/Elibrary/LibraryContentDoc/bar_Statistical%20Year%20Book%202018_a8b32d59-cdc9-4987-ba29-1e7ce78d5cca.pdf
Last date of access: November 2018.
|
Workers |
Dependents |
|
Males |
Females |
Total |
Males |
Females |
Total |
| India |
229,998 |
11,217 |
241,215 |
20,434 |
48,456 |
68,890 |
| Bangladesh |
123,360 |
170 |
123,530 |
1,428 |
3,432 |
4,860 |
| Pakistan |
46,477 |
781 |
47,258 |
3,397 |
7,407 |
10,804 |
| Philippines |
13,844 |
17,926 |
31,770 |
1,303 |
2,523 |
3,826 |
| Sri Lanka |
3,595 |
505 |
4,100 |
422 |
1,212 |
1,634 |
| Egypt |
9,308 |
1,593 |
10,901 |
4,929 |
8,203 |
13,132 |
| Jordan |
2,752 |
467 |
3,219 |
1,744 |
2,810 |
4,554 |
| Yemen |
2,624 |
52 |
2,676 |
1,401 |
2,236 |
3,637 |
| Syria |
1,379 |
104 |
1,483 |
848 |
1,386 |
2,234 |
| United Kingdom |
1,831 |
606 |
2,437 |
587 |
1,126 |
1,713 |
| Other nationalities |
30,915 |
8,987 |
39,902 |
3,568 |
7,562 |
11,130 |
| Total |
466,083 |
42,408 |
508,491 |
40,061 |
86,353 |
126,414 |
Source: Labour Market Regulatory Authority (LMRA), Expatriate Management System (EMS)
ANNEXED NOTE
1. Technical Notes and Definitions
The data displays the stocks, at a given date, of expats visa holders, registered as workers or as family dependants (LMRA Law 19/2006) in EMS.
Non-Bahraini workers (for male, female and both sexes) are Expat visa applications (GCC workers are not included).
The scope of the system covers regular, temporary and investor work visas for foreign workers, their dependents, in the commercial sector,
the government sector and the non-commercial, non-government sector.
It presently excludes domestic workers, and work visas for artists and certain other categories of workers in non-civilian organizations.
It distinguishes four types of visas for operational purposes: regular work visas for workers with 24-month validity; temporary work visas
issued for workers with 6-month validity; investor work visas issued for investors investing up to BD 100,000; and dependent visas issued
for dependent members of eligible foreign workers.
The system tracks visa applications, renewals, mobility of workers between employers and from one occupation to another as well as
notification of termination and runaway workers, and in general all operations of LMRA including inspection and offence management.
The system is updated continuously and linked with other labour-related databases of the Kingdom, including CIO, GDNPR, GOSI, PFC, CSB,
Ministry of Labour (MoL), and Ministry of Industry and Commerce (MOIC).
Work Visa is a legal certificate to allow a foreign worker to enter the country for working purposes for a period of two years with the possibility of renewal.
Worker is a generic term that refers to an employed person in general, or to an employee, a self-employed, or a particular category of worker,
such as full-time or part-time worker, depending on the context in which the term is used. Four major categories of workers in terms of their
status in employment are employees, employers, own-account workers, and unpaid family workers.
2. Institution which provides data
Labour Market Regulatory Authority (LMRA).
3. Data availability
Source: Labour Market Regulatory Authority (LMRA), Kingdom of Bahrain, based on data from Bahrain Labour Market Indicators website http://blmi.lmra.bh/2018/06/mi_data.xml.
The data can be retrieved from the data section of LMRA website. Tables are updated on a quarterly basis and are available in PDF and in Excel formats.
Last date of access: October 2018.
|
|
Public Sector |
Private Sector |
Domestic Workers |
Total workers (all sectors) |
| Year |
Quarter |
Bahrainis |
Non-Bahrainis |
Total |
Bahrainis |
Non-Bahrainis |
Total |
Bahrainis |
Non-Bahrainis |
Total |
Bahrainis |
Non-Bahrainis |
Total |
| 2014 |
Q1 |
56,988 |
10,010 |
66,998 |
96,537 |
392,789 |
489,326 |
0 |
105,203 |
105,203 |
153,525 |
508,002 |
661,527 |
| Q2 |
56,817 |
9,818 |
66,635 |
97,794 |
396,578 |
494,372 |
0 |
106,105 |
106,105 |
154,611 |
512,501 |
667,112 |
| Q3 |
56,831 |
10,196 |
67,027 |
98,358 |
404,463 |
502,821 |
0 |
106,997 |
106,997 |
155,189 |
521,656 |
676,845 |
| Q4 |
57,119 |
10,241 |
67,360 |
99,219 |
412,857 |
512,076 |
0 |
107,711 |
107,711 |
156,338 |
530,809 |
687,147 |
| 2015 |
Q1 |
57,061 |
10,181 |
67,242 |
99,368 |
419,553 |
518,921 |
0 |
108,746 |
108,746 |
156,429 |
538,480 |
694,909 |
| Q2 |
57,237 |
9,953 |
67,190 |
101,200 |
431,541 |
532,741 |
0 |
110,365 |
110,365 |
158,437 |
551,859 |
710,296 |
| Q3 |
57,171 |
10,245 |
67,416 |
101,011 |
437,789 |
538,800 |
0 |
111,002 |
111,002 |
158,182 |
559,036 |
717,218 |
| Q4 |
57,130 |
10,409 |
67,539 |
101,198 |
445,374 |
546,572 |
0 |
111,002 |
111,002 |
158,328 |
566,785 |
725,113 |
| 2016 |
Q1 |
56,432 |
10,266 |
66,698 |
104,451 |
461,139 |
565,590 |
0 |
111,002 |
111,002 |
160,883 |
582,407 |
743,290 |
| Q2 |
56,174 |
10,031 |
66,205 |
103,537 |
474,118 |
577,655 |
0 |
111,002 |
111,002 |
159,711 |
595,151 |
754,863 |
| Q3 |
55,473 |
9,968 |
65,441 |
101,953 |
491,482 |
593,435 |
0 |
111,002 |
111,002 |
157,426 |
612,452 |
769,878 |
| Q4 |
54,952 |
10,007 |
64,959 |
102,167 |
509,062 |
611,229 |
0 |
111,002 |
111,002 |
157,119 |
630,071 |
787,190 |
| 2017 |
Q1 |
54,719 |
10,000 |
64,719 |
102,063 |
501,093 |
603,156 |
0 |
99,417 |
99,417 |
156,782 |
610,510 |
767,292 |
| Q2 |
54,800 |
9,883 |
64,683 |
102,461 |
496,416 |
598,877 |
0 |
100,058 |
100,058 |
157,261 |
606,357 |
763,618 |
| Q3 |
54,536 |
9,853 |
64,389 |
103,103 |
495,444 |
598,547 |
0 |
98,376 |
98,376 |
157,639 |
603,673 |
761,312 |
| Q4 |
54,613 |
9,880 |
64,493 |
103,802 |
495,912 |
599,714 |
0 |
98,905 |
98,905 |
158,415 |
604,697 |
763,112 |
|
Q1 |
53,977 |
9,865 |
63,842 |
104,399 |
498,340 |
602,739 |
0 |
103,527 |
103,527 |
158,376 |
611,732 |
770,108 |
| 2018 |
Q2 |
53,932 |
9,730 |
63,662 |
104,882 |
499,275 |
604,157 |
0 |
91,852 |
91,852 |
158,814 |
600,857 |
759,671 |
Source: Labour Market Regulatory Authority (LMRA) – Bahrain
ANNEXED NOT
1. Technical Notes and Definitions
Data are extracted from the files submitted by Expatriate Management System (LMRA-EMS), General Organisation for Social Insurance (GOSI), Pension Fund Commission (PFC),
and Civil Service Bureau (CSB) monthly data files to LMRA.
LMRA data, along with GOSI and PFC, do not include non-civilian employees (engaged in military, defense and other relevant entities and ranked as so).
1. From 2008 Q2 onward, “Public sector” for Non-Bahraini workers refers to workers in the “Government sector” of the Expatriate Management System (EMS) of LMRA.
2. “Private Sector” for Non-Bahraini workers refers to the sum of “Commercial” and “Non-Commercial, Non-Government” (NCNG) sectors of LMRA’s EMS system.
Employee is defined as who works in a paid employment job, i.e., a job where the explicit or implicit contract of employment gives the incumbent a basic remuneration
that is independent of the revenue of the unit for which he or she works (the unit can be a corporation, a non-profit institution, a government or a household).
A Bahraini citizen is defined here as a legal national of the Kingdom of Bahrain. This category excludes nationals of the GCC.
A Non-Bahraini citizen is defined here as any foreigner or expatriate of a nationality other than Bahraini.
Public Sector is defined here as the one where employees are registered at the Public Fund Commission (PFC)
Private Sector is defined here as the one where employees are registered at the General Organisation for Social Insurance (GOSI)
Domestic Worker is defined here as an employee who works, and often lives within the employer’s household.
Employment as defined by the LMRA is in line with the ILO resolution concerning statistics of the economically active population, employment, unemployment and underemployment.
It includes all persons above a specific age during a specific period either in paid employment or in self-employment and includes the following:
(a) paid employment
(a1) at work: persons who during the reference period performed some work for wage or salary, in cash or in kind, even for one hour
(a2) with a job but not at work: persons who, having already worked in their present job, were temporarily not at work during the reference period and had a formal attachment to their job
(e.g., absence because of illness or injury, holiday or vacation, strike or lockout, educational or training leave, maternity or parental leave, reduction in economic activity, etc.)
(b) self employment
(b1) at work: persons who during the reference period performed some work for profit or family gain, in cash or in kind
(b2) with an enterprise but not at work: persons with an enterprise, which may be a business enterprise, a farm or a service undertaking,
who were temporarily not at work during the reference period for any specific reason.
2. Institution which provides data
Labour Market Regulatory Authority (LMRA)
3. Data availability
Labour Market Regulatory Authority (LMRA), Kingdom of Bahrain, based on data from Bahrain Labour Market Indicators (http://blmi.lmra.bh/2018/06/data/lmr/Table_A.xls).
Data are tabulated in PDF and Excel formats.
The definitions that the LMRA adopts for its data can be found in the Glossary section: (http://blmi.lmra.bh/mi_glossary.xml)
Date of access: November 2018.
| Occupation group of labour permit’ holder |
year |
| 2005 |
2006 |
2007 |
2008 |
2009 |
2010 |
2011 |
2012 |
2013 |
2014 |
2015 |
2016 |
| Managers and Business Managers |
2,734 |
2,696 |
3,074 |
2,805 |
2,195 |
2,571 |
2,917 |
5,783 |
17,759 |
43,168 |
62,128 |
65,925 |
| Specialists in Scientific, Technical and Humanities Fields |
126,026 |
141,212 |
165,374 |
202,815 |
193,168 |
220,620 |
246,072 |
346,015 |
574,031 |
670,622 |
731,283 |
706,920 |
| Technicians in Scientific, Technical and Humanities Fields |
128,777 |
149,232 |
181,873 |
215,444 |
210,863 |
227,939 |
274,137 |
355,758 |
541,819 |
679,036 |
758,143 |
720,876 |
| Clerical Workers |
3,015 |
2,839 |
3,035 |
3,516 |
2,782 |
2,787 |
2,824 |
4,655 |
21,724 |
53,177 |
61,239 |
60,311 |
| Sales Persons |
87,332 |
86,441 |
84,097 |
89,070 |
64,240 |
60,404 |
76,451 |
96,774 |
224,624 |
397,408 |
484,391 |
509,897 |
| Service Persons |
976,412 |
1,052,607 |
1,107,318 |
1,227,295 |
1,097,139 |
1,097,820 |
1,321,468 |
1,476,851 |
2,093,041 |
2,206,953 |
2,600,583 |
2,681,555 |
| Agriculture, Animal Husbandry and Fishing |
173,927 |
117,042 |
182,101 |
320,285 |
89,161 |
85,516 |
101,872 |
104,082 |
122,665 |
89,735 |
96,268 |
95,342 |
| Industrial, Chemical and Food Industries |
98,731 |
107,942 |
122,535 |
136,856 |
128,052 |
121,719 |
146,705 |
157,049 |
213,935 |
210,646 |
228,416 |
218,854 |
| Engineering Support |
762,347 |
881,072 |
1,113,632 |
1,400,231 |
1,435,208 |
1,526,254 |
1,915,647 |
2,263,432 |
3,063,833 |
3,169,703 |
3,497,091 |
3,190,830 |
| Autres |
|
|
|
|
|
|
|
|
|
|
|
4,405 |
| TOTAL |
2,359,301 |
2,541,083 |
2,963,039 |
3,598,317 |
3,222,808 |
3,345,630 |
4,088,093 |
4,811,095 |
6,874,799 |
7,520,448 |
8,519,542 |
8,254,915 |
Source: Ministry of Labour
1. Data collection methodology
The issuance of the residency and work permits begins with filing an application with the Ministry of Labor.
After its approval, the Ministry of Labour forwards the application to the Ministry of Interior for the issuance of the residency permit.
Classification used for occupations is adapted from ISCO 1988.
2. Institution which provides data
Ministry of Labour, now Ministry of Labour and Social Development (MLSD) (https://mlsd.gov.sa/en/node)
3. Data availability
Published in Ministry of Labour’s Statistical Yearbooks
MoL’s Yearbooks until 2015 are no longer available on MLSD’s website.
The “open data” section of the Ministry’s website (Arabic only) has the figure of work permits issued in 2016, by occupation category:
https://mlsd.gov.sa/ar/open-data
Last date of access: 4 November 2018.
|
Number of |
|
labour permits |
| 2000 |
2,439,672 |
| 2001 |
2,369,611 |
| 2002 |
2,663,666 |
| 2003 |
2,563,800 |
| 2004 |
2,716,573 |
| 2005 |
2,359,301 |
| 2006 |
2,541,083 |
| 2007 |
2,963,039 |
| 2008 |
3,598,317 |
| 2009 |
3,222,809 |
| 2010 |
3,345,630 |
| 2011 |
4,088,093 |
| 2012 |
4,811,095 |
| 2013 |
6,874,799 |
| 2014 |
7,524,326 |
| 2015 |
8,524,762 |
| 2016 |
8,254,915 |
Sources: Ministry of Labour
1. Data collection methodology
The issuance of the residency and work permits begins with filing an application with the Ministry of Labor.
After its approval, the Ministry of Labour forwards the application to the Ministry of Interior for the issuance of the residency permit.
2. Institution which provides data
Ministry of Labour, currently Ministry of Labour and Social Development (MLSD) (https://mlsd.gov.sa/en/node)
3. Data availability
Published in Ministry of Labour’s Statistical Yearbooks
MoL’s Yearbooks until 2015 are no longer available on MLSD’s website.
MLSD’s Yearbook for 2016 has the figure of work permits delivered that year, as well as the “open data” section of the Ministry’s website (Arabic only):
https://mlsd.gov.sa/sites/default/files/uploads/v.26%20%D8%A7%D9%84%D8%AA%D9%82%D8%B1%D9%8A%D8%B1%20%D8%A7%D9%84%D8%B3%D9%86%D9%88%D9%8A%202016.pdf
https://mlsd.gov.sa/ar/open-data
Last date of access: 4 November 2018.
|
Number of residency permits issued |
| 1984 |
802,859 |
| 1985 |
563,747 |
| 1986 |
591,261 |
| 1987 |
641,169 |
| 1988 |
615,552 |
| 1989 |
705,679 |
| 1990 |
750,412 |
| 1991 |
919,879 |
| 1992 |
1,062,305 |
| 1993 |
1,095,450 |
| 1994 |
767,243 |
| 1995 |
619,178 |
| 1996 |
962,235 |
| 1997 |
962,235 |
| 1998 |
876,276 |
| 1999 |
661,527 |
| 2000 |
765,903 |
| 2001 |
810,920 |
| 2002 |
1,016,151 |
| 2003 |
1,029,573 |
| 2004 |
879,261 |
| 2005 |
650,764 |
| 2006 |
1,084,646 |
| 2007 |
1,423,861 |
| 2008 |
1,641,096 |
| 2009 |
n.a. |
| 2010 |
1,639,591 |
| 2011 |
1,411,688 |
| 2012 |
1,922,012 |
| 2013 |
1,839,861 |
| 2014 |
1,962,443 |
| 2015 |
2,212,635 |
| 2016 |
1,823,332 |
| 2017 |
1,842,824 |
Sources: General Directorate of Passports, Ministry of Interior.
1. Data collection methodology
The Ministry of Interior issues the residency permit, for workers and for family dependents.
2. Institution which provides data
CDSI/ General Authority for Statistics (GAStat)
3. Data availability
(a) Published in the CDSI/GAStat Statistical Yearbooks, in Chapter “Social services” until 2016 and in section “Population and Demography” in 2017
Statistical Yearbooks are available online at:
https://www.stats.gov.sa/en/930
Date of access: October 2018.
|
ARRIVALS |
|
|
|
| Nationality |
2012 |
2013 |
| ARAB COUNTRIES |
|
|
| Iraq |
327,398 |
317,340 |
| Syria |
1,047,421 |
766,571 |
| Lebanon |
299,605 |
315,819 |
| Jordan |
1,274,151 |
1,321,988 |
| Kuwait |
2,048,280 |
2,236,217 |
| Yemen |
975,918 |
1,161,271 |
| Bahrain |
2,200,313 |
2,333,263 |
| Qatar |
848,677 |
887,337 |
| UAE |
358,426 |
412,757 |
| Oman |
224,011 |
223,656 |
| Palestine |
132,810 |
123,811 |
| Algeria |
258,395 |
225,494 |
| Mauritania |
6,345 |
5,690 |
| Egypt |
2,913,193 |
2,929,835 |
| Morocco |
156,122 |
142,065 |
| Sudan |
520,938 |
546,087 |
| Tunisia |
87,963 |
71,386 |
| Libya |
124,544 |
148,438 |
| Somalia |
9,615 |
8,893 |
| Djibouti |
1,586 |
1,324 |
| Displaced Arab Tribes |
|
|
| Comore Islands |
5,256 |
5,765 |
| Kuwait (No-Nationality) |
|
|
| Other Arab Nationalities |
57,932 |
63,743 |
| Total |
13,878,899 |
14,248,750 |
|
|
|
| ASIA |
|
|
| Afghanistan |
63,591 |
70,773 |
| Turkey |
528,283 |
541,045 |
| Iran |
736,908 |
516,888 |
| Malaysia |
194,431 |
233,380 |
| Japan |
24,916 |
25,853 |
| Indonesia |
565,070 |
685,238 |
| Philippines |
605,264 |
664,154 |
| Pakistan |
2,128,457 |
2,148,051 |
| India |
2,838,593 |
3,060,859 |
| China |
3,935 |
4,676 |
| South Korea |
51,722 |
61,688 |
| Singapore |
14,119 |
14,106 |
| Bangladesh |
537,203 |
508,099 |
| Hong Kong |
70 |
56 |
| Thailand |
13,541 |
11,596 |
| Sri Lanka |
215,143 |
196,169 |
| Other Asian Nationalities |
300,375 |
309,696 |
| Total |
8,821,621 |
9,052,327 |
| EUROPE |
|
|
| Britain |
337,891 |
338,208 |
| France |
72,053 |
70,398 |
| Holland |
28,001 |
27,613 |
| Belgium |
13,405 |
14,199 |
| Italy |
38,360 |
42,089 |
| Sweden |
9,191 |
8,151 |
| Norway |
4,369 |
4,066 |
| Switzerland |
7,056 |
6,987 |
| Austria |
8,459 |
8,607 |
| Germany |
63,707 |
64,057 |
| Spain |
19,829 |
24,868 |
| Denmark |
6,594 |
6,169 |
| Greece |
9,468 |
11,154 |
| Cyprus |
2,650 |
2,998 |
| Finland |
3,997 |
3,539 |
| Other European Nationalities |
74,127 |
89,775 |
| Total |
699,157 |
722,878 |
| AFRICA |
|
|
| Ethiopia |
284,135 |
287,581 |
| Mali |
4,596 |
4,625 |
| Nigeria |
79,547 |
53,323 |
| South Africa |
63,232 |
59,879 |
| Chad |
6,894 |
5,151 |
| Other African Nationalities |
93,713 |
73,130 |
| Total |
532,117 |
483,689 |
| AMERICA AND OCEANIA |
|
|
| U.S.A |
272,670 |
287,182 |
| Canada |
98,597 |
104,953 |
| Australia |
35,052 |
34,585 |
| Other American and Oceanian Nationalities |
36,412 |
35,037 |
| Total |
442,731 |
461,757 |
| Unknown Nationalities |
6,394 |
670 |
| TOTAL ARRIVALS |
24,380,919 |
24,970,071 |
| Arrivals sans Soudan |
23,859,981 |
24,423,984 |
|
|
|
|
|
|
|
DEPARTURES |
|
|
|
| Nationality |
2012 |
2013 |
| ARAB COUNTRIES |
|
|
| Iraq |
326,154 |
317,096 |
| Syria |
965,288 |
744,351 |
| Lebanon |
297,040 |
317,273 |
| Jordan |
1,268,860 |
1,328,446 |
| Kuwait |
1,986,919 |
2,198,227 |
| Yemen |
932,616 |
1,106,502 |
| Bahrain |
2,202,027 |
2,328,778 |
| Qatar |
834,866 |
881,299 |
| UAE |
332,099 |
399,397 |
| Oman |
175,575 |
205,219 |
| Palestine |
131,859 |
123,959 |
| Algeria |
256,639 |
226,049 |
| Mauritania |
6,175 |
5,851 |
| Egypt |
2,836,158 |
3,006,934 |
| Morocco |
149,333 |
140,472 |
| Sudan |
457,736 |
517,593 |
| Tunisia |
85,773 |
71,685 |
| Libya |
124,092 |
148,443 |
| Somalia |
9,941 |
9,943 |
| Djibouti |
1,501 |
1,357 |
| Displaced Arab Tribes |
|
|
| Comore Islands |
4,744 |
5,762 |
| Kuwait (No-Nationality) |
|
|
| Other Arab Nationalities |
57,693 |
63,661 |
| Total |
13,443,088 |
14,148,297 |
|
|
|
| ASIA |
|
|
| Afghanistan |
64,740 |
72,969 |
| Turkey |
522,929 |
546,151 |
| Iran |
736,076 |
516,498 |
| Malaysia |
192,823 |
233,467 |
| Japan |
24,199 |
25,996 |
| Indonesia |
714,352 |
805,812 |
| Philippines |
575,309 |
613,577 |
| Pakistan |
1,854,276 |
1,985,447 |
| India |
2,619,544 |
3,016,048 |
| China |
3,666 |
4,708 |
| South Korea |
48,936 |
60,871 |
| Singapore |
13,726 |
14,141 |
| Bangladesh |
562,860 |
532,259 |
| Hong Kong |
72 |
54 |
| Thailand |
13,293 |
12,215 |
| Sri Lanka |
187,503 |
192,242 |
| Other Asian Nationalities |
269,041 |
305,773 |
| Total |
8,403,345 |
8,938,228 |
| EUROPE |
|
|
| Britain |
334,926 |
338,560 |
| France |
70,550 |
70,917 |
| Holland |
27,161 |
27,515 |
| Belgium |
12,825 |
14,235 |
| Italy |
37,249 |
42,221 |
| Sweden |
8,864 |
8,234 |
| Norway |
4,176 |
4,079 |
| Switzerland |
6,695 |
6,992 |
| Austria |
8,216 |
8,628 |
| Germany |
62,411 |
64,314 |
| Spain |
18,765 |
24,473 |
| Denmark |
6,466 |
6,200 |
| Greece |
8,750 |
11,172 |
| Cyprus |
2,364 |
3,030 |
| Finland |
3,812 |
3,577 |
| Other European Nationalities |
67,876 |
89,363 |
| Total |
681,106 |
723,510 |
| AFRICA |
|
|
| Ethiopia |
85,064 |
129,864 |
| Mali |
4,180 |
4,724 |
| Nigeria |
78,319 |
53,416 |
| South Africa |
61,927 |
59,995 |
| Chad |
7,205 |
5,440 |
| Other African Nationalities |
74,439 |
75,140 |
| Total |
311,134 |
328,579 |
| AMERICA AND OCEANIA |
|
|
| U.S.A |
267,703 |
287,770 |
| Canada |
97,041 |
105,775 |
| Australia |
34,113 |
34,844 |
| Other American and Oceanian Nationalities |
34,065 |
35,227 |
| Total |
432,922 |
463,616 |
| Unknown Nationalities |
919 |
684 |
| GRAND TOTAL |
23,272,514 |
24,602,914 |
Source: Ministry of Interior, General Directorate of Passports
1. Institution which provides data
General Authority for Statistics (GAStat)
2. Data availability
Published in Gastat’s Statistical Yearbooks, in Chapter “Social services”, until 2013 only.
After 2013, data pertaining to border crossings are not disagregated by nationality of the traveller.
All Statistical Yearbooks are available online at:
https://www.stats.gov.sa/en/46
Last date of access: October 2018.
| Country (date) |
Total population |
Nationals |
Foreign nationals |
% nationals |
% non-nationals |
| Bahrain (mid-2017) |
1,501,116 |
677,506 |
823,610 |
45.1 |
54.9 |
| Kuwait (November 2018) |
4,640,415 |
1,398,952 |
3,241,463 |
30.1 |
69.8 |
| Oman (November 2018) |
4,656,133 |
2,606,585 |
2,049,548 |
56.0 |
44.0 |
| Qatar (end October 2018) |
2,743,932 |
348,479** |
2,395,453** |
12.7* |
87.3* |
| Saudi Arabia (mid-2018) |
33,413,660 |
20,768,627 |
12,645,033 |
62.2 |
37.8 |
| UAE (end 2016) |
9,121,176 |
1,153,576** |
7,967,600** |
12.6*** |
87.4*** |
| Total**** |
56,076,432 |
26,953,725 |
29,122,707 |
48.1 |
51.9 |
Source: National institutes of statistics and author’s calculations based on NIS’ data (see below)
* Ratio is calculated on the basis of data available for 2015 (see below)
** Our estimate
*** Ratio is calculated on the basis of Emirati population’s estimates (see below)
**** Total provides the sum and ratio of population numbers at different dates. It is not exactly the total population at any
of these dates.
1- Definition:
Non-nationals are:
1- persons bearing nationality of a foreign State other than the GCC State of residence, or bearing no proof of nationality from any given state
(stateless persons and holders of refugee status and travel document in a third country);
2- Holders of residence permit residing in the given GCC country at date of census, as per definition of residence used in each of the countries.
Figures by nationality for Qatar and the UAE are estimates.
2- Sources of data:
(1) Bahrain Central Informatics Organisation (CIO), CIO’s website, “Statistics” and “Population” sections http://www.data.gov.bh/en/ResourceCenter
(2) Kuwait Public Authority for Civil Information (PACI), homepage as of 12 November 2018 https://www.paci.gov.kw/Default.aspx
(3) National Centre for Statistical Information (NCSI), homepage as of 10 November 2018, https://www.ncsi.gov.om/Pages/NCSI.aspx
(4) Qatar Ministry of Development Planning and Statistics, homepage as of 11 Nov. 2018, data for end of October 2018. https://www.mdps.gov.qa/en/statistics1/Pages/default.aspx.
The percentage distribution of population by broad age group for mid-2015, by sex and nationality was available in 2016’ Woman and Man in the State of Qatar-A Statistical Profile.
https://www.mdps.gov.qa/en/statistics/Statistical%20Releases/Social/GenrealSocialStatistics/MenWomenProfile/2016/Woman_Man_2016_En.pdf
The Labour Force Survey for the first quarter of 2015 gave the numbers of Qataris and foreigners aged 15 and above for March 2015,
which were used to estimate the number of residents aged below 15 years, by nationality.
https://www.mdps.gov.qa/en/statistics/Statistical%20Releases/Social/LaborForce/2015/Q1/LF_Q1_2015.xls
The total population figure obtained is 2,402,774 (306,187 Qataris + 2,096,587 non-Qataris), which is very close to census 2015’s total population figure: 2,404,775.
The difference comes from the rounded-up percentages used for the calculation.
(5) Saudi Arabia General Authority for Statistics, population estimates based on the results of Demographic Survey 2016, https://www.stats.gov.sa/en/43.
(6) UAE Federal Competitiveness and Statistics Authority (FCSA), estimates of intercensal population (end of 2006-mid-2010)
http://original.fcsa.gov.ae/EnglishHome/ReportDetailsEnglish/tabid/121/Default.aspx?ItemId=1914&PTID=104&MenuId=1
Emirati population’s average annual growth rate was calculated for the period (2006-2009); the Emirati population was then estimated for 2016 (end of the year), on that basis.
The respective shares of Emirati and non-Emirati populations were then calculated, using FCSA’s figure of the total resident population for the end of 2016.
http://fcsa.gov.ae/_layouts/download.aspx?SourceUrl=%2Fen-us%2FLists%2FD_StatisticsSubjectV2%2FAttachments%2F757%2Fpopulation%202016.xlsx
| Main groups of household occupations |
Male |
Female |
Total |
| Housekeeper |
1,525 |
947 |
2,472 |
| Drivers |
1,357,228 |
0 |
1,357,228 |
| Servants and house cleaners |
250,350 |
698,798 |
949,148 |
| Cookers and food provider |
16,130 |
2,653 |
18,783 |
| Houses, buildings and restrooms guards |
34,137 |
0 |
34,137 |
| Farmers houses |
2,634 |
0 |
2,634 |
| Home Tailors |
740 |
1,253 |
1,993 |
| Nurses and health professionals in homes |
615 |
1,888 |
2,503 |
| Private teachers and Nannies at homes |
542 |
4,693 |
5,235 |
| Not specified |
32,688 |
14,282 |
46,970 |
| Total |
1,696,589 |
724,514 |
2,421,103 |
Source: Ministry of Labour and Social Development (MLSD)
ANNEXED NOTE
1. Technical Notes and Definitions
Since Q3 2016, instead of survey results, the Labour Force Surveys’ publications display administrative data: the records of Saudi and foreign labourers covered by social security schemes
(private and governmental sectors), and Ministry of Labour’s records of domestic labourers.
1. Labourers in the governmental sector are recorded by the Ministry of Civil Service.
2. The Social Insurance Law of the Kingdom of Saudi Arabia has become compulsorily applied to all Saudi workers in the private sector
of any other GCC Member State effective from 01/01/2006. Saudi and foreign workers in the sector have to be recorded by the General Organization for Social Insurance (GOSI).
3. Since 2017, the Ministry of Labour and Social Development records all labourers in the domestic sector.
Therefore, the present data do not include employed persons non-registered in the records of MLSD
2. Institution which provides data
General Authority for Statistics (GAStat) https://www.stats.gov.sa/en
3. Data availability
Data on foreign labourers employed in the domestic sector have been published quarterly since Q2, 2016 in GAStat’s Labour Force Surveys.
https://www.stats.gov.sa/en/813
The present data is taken from Labour Force Survey 2018 (Q2) (Excel format).
Last date of access: October 2018.
|
Saudis |
Non-Saudis |
Total |
|
Males |
Females |
Total |
Males |
Females |
Total |
Males |
Females |
Total |
| 1999_Half1 |
2,247,720 |
347,370 |
2,595,090 |
2,552,901 |
444,863 |
2,997,764 |
4,800,621 |
792,233 |
5,592,854 |
| 2000_Half1 |
2,352,092 |
351,279 |
2,703,371 |
2,591,426 |
418,548 |
3,009,974 |
4,943,518 |
769,827 |
5,713,345 |
| 2001_Half1 |
2,413,780 |
363,193 |
2,776,973 |
2,613,943 |
417,699 |
3,031,642 |
5,027,723 |
780,892 |
5,808,615 |
| 2002_Half1 |
2,480,225 |
364,366 |
2,844,591 |
2,635,599 |
432,817 |
3,068,416 |
5,115,824 |
797,183 |
5,913,007 |
| 2003 |
2,594,493 |
396,844 |
2,991,337 |
2,857,748 |
466,417 |
3,324,165 |
5,452,240 |
863,262 |
6,315,502 |
| 2004 |
2,708,760 |
429,323 |
3,138,083 |
3,079,897 |
500,018 |
3,579,914 |
5,788,657 |
929,340 |
6,717,997 |
| 2005 |
2,823,028 |
461,801 |
3,284,828 |
3,302,045 |
533,618 |
3,835,663 |
6,125,073 |
995,419 |
7,120,491 |
| 2006_Half1 |
2,937,295 |
494,279 |
3,431,574 |
3,524,194 |
567,218 |
4,091,412 |
6,461,489 |
1,061,497 |
7,522,986 |
| 2007_Half1 |
3,082,301 |
502,456 |
3,584,757 |
3,581,716 |
599,868 |
4,181,584 |
6,664,017 |
1,102,324 |
7,766,341 |
| 2007_Half2 |
3,096,972 |
503,879 |
3,600,851 |
3,598,598 |
545,002 |
4,143,600 |
6,695,570 |
1,048,881 |
7,744,451 |
| 2008_Half1 |
3,185,417 |
493,183 |
3,678,600 |
3,651,823 |
626,409 |
4,278,232 |
6,837,240 |
1,119,592 |
7,956,832 |
| 2008_Half2 |
3,274,356 |
482,313 |
3,756,669 |
3,677,482 |
583,149 |
4,260,631 |
6,951,838 |
1,065,462 |
8,017,300 |
| 2009_Half2 |
3,332,628 |
505,340 |
3,837,968 |
3,736,810 |
573,214 |
4,310,024 |
7,069,438 |
1,078,554 |
8,147,992 |
| 2010 |
3,411,801 |
543,406 |
3,955,207 |
4,258,619 |
621,046 |
4,879,665 |
7,670,420 |
1,164,452 |
8,834,872 |
| 2011_Half2 |
3,538,669 |
604,402 |
4,143,071 |
5,094,771 |
697,692 |
5,792,463 |
8,633,440 |
1,302,094 |
9,935,534 |
| 2012_Half1 |
3,632,143 |
619,580 |
4,251,723 |
5,186,605 |
698,065 |
5,884,670 |
8,818,748 |
1,317,645 |
10,136,393 |
| 2012_Half2 |
3,750,781 |
646,590 |
4,397,371 |
5,310,039 |
682,914 |
5,992,953 |
9,060,820 |
1,329,504 |
10,390,324 |
| 2013_Half1 |
3,951,255 |
679,862 |
4,631,117 |
5,362,127 |
641,489 |
6,003,616 |
9,313,382 |
1,321,351 |
10,634,733 |
| 2013_Half2 |
3,989,632 |
727,495 |
4,717,127 |
5,342,675 |
669,321 |
6,011,996 |
9,332,307 |
1,396,816 |
10,729,123 |
| 2014_Half1 |
4,092,494 |
796,220 |
4,888,714 |
5,383,884 |
627,791 |
6,011,675 |
9,476,378 |
1,424,011 |
10,900,389 |
| 2014_Half2 |
4,120,467 |
805,717 |
4,926,184 |
5,496,822 |
644,667 |
6,141,489 |
9,617,289 |
1,450,384 |
11,067,673 |
| 2015_Half1 |
4,133,251 |
811,458 |
4,944,709 |
5,622,863 |
662,293 |
6,285,156 |
9,756,114 |
1,473,751 |
11,229,865 |
| 2015_Half2 |
4,159,744 |
816,361 |
4,976,105 |
5,735,735 |
772,816 |
6,508,551 |
9,895,479 |
1,589,177 |
11,484,656 |
| 2016_Q2 |
4,172,988 |
830,630 |
5,003,618 |
5,865,521 |
816,976 |
6,682,497 |
10,038,509 |
1,647,606 |
11,686,115 |
| 2016_Q3 |
4,185,853 |
835,726 |
5,021,579 |
6,708,562 |
646,558 |
7,355,120 |
10,894,415 |
1,482,284 |
12,376,699 |
source: Labour Force Surveys (1999 to 2002; 2006 to 2009; 2011 to 2016 (Q3); population censuses 2004 and 2010
ANNEXED NOTE
1. Technical Notes and Definitions
|
sampling |
sample size |
|
|
frame |
(households) |
reference period |
| 1999 |
Population |
15,000 |
April 16th-May 16th, 1999 |
| 2000 |
Census |
15,000 |
April 2000 |
| 2001 |
1992 |
15,000 |
March 2001 |
| 2002 |
|
15,000 |
April 2002 |
| 2006 |
Population Census 2004 |
23,000 |
May 2006 |
| 2007 R1 |
23,000 |
February 19th-March 20th, 2007 |
| 2007 R2 |
23,000 |
August 15th-September 13th, 2007 |
| 2008 R1 |
23,000 |
February 2008 |
| 2008 R2 |
23,000 |
August 2008 |
| 2009 |
23,000 |
July 24th-August 22nd, 2009 |
| 2011 |
Population Census 2010 |
29,000 |
October 2011 |
| 2012 R1 |
29,000 |
January 25th-February 17th, 2012 |
| 2012 R2 |
|
|
| 2013 R1 |
33,500 |
January 13th-February 5th, 2013 |
|
|
|
| 2014 R1 |
33,500 |
January 2014 |
| 2014 R2 |
33,500 |
August 2014 |
| 2015 R1 |
33,500 |
May 2015 |
| 2015 R2 |
33,500 |
November 2015 |
| 2016 Q2 |
33,325 |
May 2016 |
| 2016 Q3 |
33,325 |
August 2016 |
Population of reference: all individuals (nationals and non-nationals) residing in the Kingdom during the period of reference.
The ultimate sampling unit is the household.
(a) Household and household members: A person or group of persons, related or not related, who share housing and food.
Servants, drivers and similar categories are considered to be part of the household if they live in the same housing unit.
(b) Employed person: A person aged 15 years and above who worked during the reference week for at least one hour for pay or profit, or who had a job but were temporarily absent from work.
Employment refers to people who during the reference period:
– worked for one hour or more for wage or salary, in cash or in kind
– worked for one hour or more for profit or family gain, in cash or in kind
– worked for at least 15 hours without pay on a family business or farm
– did volunteer work
Reference period for employment: The seven days preceding the interview date.
Data collected during Labor Force Surveys include all employed persons, including those employed in the security and military sector .
Since Q3 2016, instead of survey results, the Labour Force Surveys’ publications display administrative data: the records of Saudi and foreign labourers covered by social security schemes
(GOSI and MCS, respectively for the private and the governmental sectors), and Ministry of Labour’s records of domestic labourers.
Administrative data used to describe the labour market after Q3 2016 differ significantly from survey data, since administrative records publications do not incorporate employees
. in the security and military sectors and employed persons non-registered in the records of GOSI and MCS
This is the reason why the time series is interrupted in 2016.
2. Institution which provides data
General Authority for Statistics (GAStat).
3. Data availability
Surveys conducted since 1999 are available on the website of GAStat, in Excel and PDF formats:
https://www.stats.gov.sa/en/814
Date of access: October 2018.
|
Omanis |
Non-Omanis |
Total |
|
Males |
Females |
Total |
Males |
Females |
Total |
Males |
Females |
Total |
| 2000 |
|
|
1,777,685 |
|
|
623,571 |
|
|
2,401,256 |
| 2001 |
897,377 |
928,747 |
1,826,124 |
129,269 |
522,294 |
651,563 |
1,026,646 |
1,451,041 |
2,477,687 |
| 2002 |
918,914 |
950,666 |
1,869,580 |
175,512 |
492,650 |
668,162 |
1,094,426 |
1,443,316 |
2,537,742 |
| 2003 |
881,018 |
900,540 |
1,781,558 |
146,558 |
412,699 |
559,257 |
1,027,576 |
1,313,239 |
2,340,815 |
| 2004 |
891,796 |
911,135 |
1,802,931 |
162,889 |
449,756 |
612,645 |
1,054,685 |
1,360,891 |
2,415,576 |
| 2005 |
911,677 |
931,007 |
1,842,684 |
138,315 |
527,838 |
666,153 |
1,049,992 |
1,458,845 |
2,508,837 |
| 2006 |
932,136 |
951,440 |
1,883,576 |
146,783 |
546,703 |
693,486 |
1,078,919 |
1,498,143 |
2,577,062 |
| 2007 |
952,208 |
970,489 |
1,922,697 |
169,172 |
651,630 |
820,802 |
1,121,380 |
1,622,119 |
2,743,499 |
| 2008 |
973,060 |
994,120 |
1,967,180 |
206,954 |
693,294 |
900,248 |
1,180,014 |
1,687,414 |
2,867,428 |
| 2009 |
998,237 |
1,019,322 |
2,017,559 |
204,565 |
951,793 |
1,156,358 |
1,202,802 |
1,971,115 |
3,173,917 |
| 2010 |
966,746 |
990,590 |
1,957,336 |
194,325 |
621,818 |
816,143 |
1,161,071 |
1,612,408 |
2,773,479 |
| 2011 |
988,235 |
1,024,923 |
2,013,158 |
216,180 |
1,065,960 |
1,282,140 |
1,204,415 |
2,090,883 |
3,295,298 |
| 2012 |
1,029,642 |
1,062,918 |
2,092,560 |
260,672 |
636,976 |
1,530,441 |
1,290,314 |
1,699,894 |
3,623,001 |
| 2013 |
1,071,388 |
1,100,614 |
2,172,002 |
281,583 |
1,401,621 |
1,683,204 |
1,352,971 |
2,502,235 |
3,855,206 |
| 2014 |
1,117,126 |
1,143,579 |
2,260,705 |
295,956 |
1,436,232 |
1,732,188 |
1,413,082 |
2,579,811 |
3,992,893 |
| 2015 |
1,160,516 |
1,184,430 |
2,344,646 |
313,742 |
1,500,414 |
1,814,456 |
1,474,258 |
2,684,844 |
4,159,102 |
| 2016 |
1,202,435 |
1,225,390 |
2,427,825 |
325,533 |
1,660,693 |
1,986,226 |
1,527,968 |
2,886,083 |
4,414,051 |
| 2017 |
1,241,605 |
1,263,764 |
2,505,369 |
333,954 |
1,720,640 |
2,054,594 |
1,575,559 |
2,984,404 |
4,559,963 |
Source: National Centre for Statistics and Information
ANNEXED NOTE
1. Technical Notes and Definitions
The table refers to the population estimated or registered in the Sultanate as of the mid of each given year.
1- Population recorded at each census date in 1993; 2003 and 2010
2- Population registered in the National Registration System, a civil register recording all Omani and expatriate residents
The civil registration is based on the civil status system and is maintained by the General Directorate of Civil Status, a part of the Royal Oman Police.
Since 2004, registration of all vital events taking place in the Sultanate (births, death, marriages and divorces) in the civil register is mandatory for Omanis and residents of the Sultanate.
DGCS also issues and keeps records of identity cards for Omanis and residence cards to foreign residents.
3- Population estimated by projection based on partial statistical operations and on population censuses (1993 and 2003).
Projections were prepared by the use of the” Component Method” which takes into consideration all the components of demographic growth (births, deaths, migrants’ entries and exits)
2. Institution which provides data
National Center for Statistics and Information (NCSI)
3. Data availability
Uploaded from NCSI Oman Data portal
http://data.gov.om/OMPOP2016/population
Date of access: October 2018.
| year |
private sector |
government sector |
domestic sector |
Total |
| 2004 |
423,172 |
24,821 |
355,395 |
803,388 |
| 2005 |
352,924 |
32,034 |
339,985 |
724,943 |
| 2006 |
716,347 |
42,149 |
441,247 |
1,199,743 |
| 2007 |
1,141,601 |
51,935 |
445,106 |
1,638,642 |
| 2008 |
1,191,204 |
70,924 |
495,885 |
1,758,013 |
| 2009 |
932,494 |
61,143 |
496,092 |
1,489,729 |
| 2010 |
1,061,717 |
68,297 |
565,537 |
1,695,551 |
| 2011 |
1,181,911 |
110,223 |
647,796 |
1,939,930 |
| 2012 |
1,586,532 |
125,909 |
828,425 |
2,540,866 |
| 2013 |
950,252 |
57,007 |
714,593 |
1,721,852 |
| 2014 |
1,574,504 |
104,466 |
847,927 |
2,526,897 |
| 2015 |
1,973,391 |
78,882 |
995,930 |
3,048,203 |
| 2016 |
1,403,731 |
142,824 |
1,173,500 |
2,720,055 |
| 2017 Q1 |
146,561 |
12,288 |
155,643 |
314,492 |
| 2017 Q2 |
191,584 |
9,739 |
185,499 |
386,822 |
| 2017 Q3 |
203,021 |
113,661 |
192,498 |
509,180 |
| 2017 Q4 |
177,669 |
17,711 |
212,085 |
407,465 |
| 2017 |
718,835 |
153,399 |
745,725 |
1,617,959 |
| 2018 Q1 |
105,987 |
14,352 |
221,128 |
341,467 |
| 2018 Q2 |
199,529 |
14,170 |
180,854 |
394,553 |
1. Definitions
The labour visa allows the worker to enter Saudi Arabia. It is issued by the Ministry of Foreign Affairs.
In order to employ workers from abroad, the sponsoring company must first file a “Block Visa” request with the Ministry of Labor, requesting pre-approval to sponsor foreign employees.
Once the Block Visa request is approved, the sponsoring company in Saudi Arabia should obtain a visa authorization number and an electronic power of attorney authorized by the Ministry of Foreign Affairs in Saudi Arabia.
Foreign nationals may then apply for work visas through Saudi consular posts in their country of residence. Several documents are required before issuance of work visas, including medical certificate.
Therefore, work visas are more than the actual workers present in the country, as some eventually do not terminate the procedure, or are rejected at a later stage (entry visa; residency procedures…).
2. Institution which provides data
Ministry of Labour, now Ministry of Labour and Social Development (MLSD) (https://mlsd.gov.sa/en/node)
3. Data availability
Until 2015, the data was published in Ministry of Labour’s Statistical Yearbooks
MoL’s Yearbooks until 2015 are no longer available on MLSD’s website.
MLSD’s Yearbook for 2016 has the figure of work visas issued that year:
https://mlsd.gov.sa/sites/default/files/uploads/v.26%20%D8%A7%D9%84%D8%AA%D9%82%D8%B1%D9%8A%D8%B1%20%D8%A7%D9%84%D8%B3%D9%86%D9%88%D9%8A%202016.pdf
Figures for 2017 and 2018 are published in the Labour Force Surveys (quarterly):
https://www.stats.gov.sa/en/814
Last date of access: 4 November 2018.
|
|
Employed nationals |
Employed non-nationals |
Total employed population |
| Country |
sex |
numbers |
men per 100 women |
numbers |
men per 100 women |
numbers |
men per 100 women |
| Bahrain |
males |
143,007 |
220 |
503,755 |
502 |
646,762 |
391 |
|
females |
65,139 |
100,356 |
165,495 |
| Kuwait |
males |
198,143 |
132 |
1,567,243 |
309 |
1,765,386 |
269 |
|
females |
150,237 |
506,436 |
656,673 |
| Oman |
males |
290,090 |
208 |
1,627,693 |
822 |
1,917,783 |
568 |
|
females |
139,716 |
197,910 |
337,626 |
| Qatar |
males |
65,051 |
179 |
1,716,659 |
732 |
1,781,710 |
658 |
|
females |
36,394 |
234,583 |
270,977 |
| Saudi Arabia |
males |
4,185,853 |
501 |
6,708,562 |
1038 |
10,894,415 |
735 |
|
females |
835,726 |
646,558 |
1,482,284 |
| United Arab Emirates |
males |
NA |
NA |
NA |
NA |
NA |
NA |
|
females |
NA |
NA |
NA |
Sources: national institutes of statistics.
1- Definitions and remarks:
Non-nationals are:
1- persons bearing nationality of a foreign State other than the GCC State of residence, or bearing no proof of nationality from any given state
(stateless persons and holders of refugee status and travel document in a third country) ;
2- Holders of residence permit residing in the given GCC country at date of census, as per definition of residence used in each of the countries.
Employment refers to: all persons of working age (15 and above), who during a reference period worked to produce goods or provide services for pay (cash or kind)
or worked for profit from their own (or partially owned) business or worked without pay in the family business or with other individuals.
It also includes those who have a temporary absence from a job during the reference period due to vacation or illness or any other reason.
Kuwait: 2015 data.
Oman: Employment data does not include those employed in the Defense, Armed Forces, and Police (Military) in the governmental sector.
UAE: No data available.
2- Sources of data:
Data is taken from:
GCC Stat. Labour Statistics in GCC Countries 2016, Issue n°4, March 2018.
https://gccstat.org/images/gccstat/docman/indicators/vital_employed_analysis_2016.xlsx
Last accessed: October 2018.
|
Males |
Females |
Total employed population |
|
nationals |
non-nationals |
nationals |
non-nationals |
nationals |
non-nationals |
| Bahrain |
63.2 |
97.8 |
32.2 |
58.2 |
47.8 |
87.9 |
| Kuwait |
52.9 |
95.3 |
39.3 |
65.8 |
46.0 |
85.7 |
| Oman |
n.a. |
n.a. |
n.a. |
n.a. |
n.a. |
n.a. |
| Qatar |
68.5 |
98.0 |
36.9 |
65.6 |
52.4 |
92.5 |
| Saudi Arabia |
64.6 |
93.3 |
19.0 |
22.8 |
42.0 |
73.1 |
| United Arab Emirates |
64.1 |
95.0 |
30.9 |
54.3 |
47.5 |
83.5 |
Sources: national institutes of statistics.
1- Definitions and remarks:
Labour Force Participation Rates refer to the percentage of active (employed or unemployed) population aged 15 and above in the category (sex and nationality).
Ex.: 22.8% of foreign women in Saudi Arabia are economically active (i.e.: employed or unemployed).
Kuwait: 2015 data.
Oman: data not available.
2- Sources of data:
Data is taken from:
GCC Stat. Labour Statistics in GCC Countries 2016, Issue n°4, March 2018.
https://gccstat.org/images/gccstat/docman/indicators/vital_employed_analysis_2016.xlsx
Last accessed: October 2018.
|
Employed |
% in employed population |
| Country |
population |
Nationals |
Non-nationals |
| Bahrain |
812,257 |
25.6 |
74.4 |
| Kuwait |
2,422,059 |
14.4 |
85.6 |
| Oman |
2,255,409 |
19.1 |
80.9 |
| Qatar |
2,052,687 |
4.9 |
95.1 |
| Saudi Arabia |
12,376,699 |
40.6 |
59.4 |
| UAE |
NA |
NA |
NA |
Sources: national institutes of statistics
1- Definitions and remarks:
Non-nationals are:
1- persons bearing nationality of a foreign State other than the GCC State of residence, or bearing no proof of nationality from any given state
(stateless persons and holders of refugee status and travel document in a third country) ;
2- Holders of residence permit residing in the given GCC country at date of census, as per definition of residence used in each of the countries.
Employment refers to: all persons of working age (15 and above), who during a reference period worked to produce goods or provide services for pay (cash or kind)
or worked for profit from their own (or partially owned) business or worked without pay in the family business or with other individuals.
It also includes those who have a temporary absence from a job during the reference period due to vacation or illness or any other reason.
Kuwait: Data for 2015.
Oman: Employment data does not include those employed in the Defense, Armed Forces, and Police (Military) of the governmental sector.
UAE: No data available.
2- Sources of data:
Data is taken from:
GCC Stat. Labour Statistics in GCC Countries 2016, Issue n°4, March 2018.
https://gccstat.org/images/gccstat/docman/indicators/vital_employed_analysis_2016.xlsx
Last accessed: October 2018.
|
Monthly figures |
Cumulated figures |
| 3/2011 |
33,323 |
33,323 |
| 4/2011 |
34,311 |
67,634 |
| 5/2011 |
30,504 |
98,138 |
| 6/2011 |
38,703 |
136,841 |
| 7/2011 |
29,724 |
166,565 |
| 8/2011 |
30,751 |
197,316 |
| 9/2011 |
43,704 |
241,020 |
| 10/2011 |
36,087 |
277,107 |
| 11/2011 |
53,014 |
330,121 |
| 12/2011 |
54,384 |
384,505 |
| Total 3 to 12/ 2011 |
384,505 |
|
| 1/2012 |
47,473 |
431,978 |
| 2/2012 |
48,826 |
480,804 |
| 3/2012 |
46,413 |
527,217 |
| 4/2012 |
49,296 |
576,513 |
| 5/2012 |
50,734 |
627,247 |
| 6/2012 |
53,851 |
681,098 |
| 7/2012 |
44,693 |
725,791 |
| 8/2012 |
60,972 |
786,763 |
| 9/2012 |
51,963 |
838,726 |
| 10/2012 |
41,944 |
880,670 |
| 11/2012 |
51,049 |
931,719 |
| 12/2012 |
47,288 |
979,007 |
| Total 2012 |
594,502 |
|
| 1/2013 |
46,579 |
1,025,586 |
| 2/2013 |
51,009 |
1,076,595 |
| 3/2013 |
52,322 |
1,128,917 |
| 4/2013 |
53,713 |
1,182,630 |
| 5/2013 |
61,203 |
1,243,833 |
| 6/2013 |
50,157 |
1,293,990 |
| 7/2013 |
30,585 |
1,324,575 |
| 8/2013 |
29,395 |
1,353,970 |
| 9/2013 |
34,266 |
1,388,236 |
| 10/2013 |
32,300 |
1,420,536 |
| 11/2013 |
123,470 |
1,544,006 |
| 12/2013 |
100,961 |
1,644,967 |
| Total 2013 |
665,960 |
|
| 01/2014 |
55,069 |
1,700,036 |
| 02/2014 |
52,283 |
1,752,319 |
| 03/2014 |
50,960 |
1,803,279 |
| 04/2014 |
42,295 |
1,845,574 |
| 05/2014 |
49,437 |
1,895,011 |
| 06/2014 |
50,543 |
1,945,554 |
| 07/2014 |
44,119 |
1,989,673 |
| 08/2014 |
43,650 |
2,033,323 |
| 09/2014 |
55,186 |
2,088,509 |
| 10/2014 |
44,781 |
2,133,290 |
| 11/2014 |
55,410 |
2,188,700 |
| 12/2014 |
61,687 |
2,250,387 |
| Total 2014 |
605,420 |
|
| 01/2015 |
55,930 |
2,306,317 |
| 02/2015 |
58,230 |
2,364,547 |
| 03/2015 |
63,134 |
2,427,681 |
| 04/2015 |
63,785 |
2,491,466 |
| 05/2015 |
47,405 |
2,538,871 |
| 06/2015 |
31,403 |
2,570,274 |
| 07/2015 |
21,355 |
2,591,629 |
| 08/2015 |
21,676 |
2,613,305 |
| 09/2015 |
24,214 |
2,637,519 |
| 10/2015 |
18,257 |
2,655,776 |
| 11/2015 |
34,107 |
2,689,883 |
| 12/2015 |
28,379 |
2,718,262 |
| Total 2015 |
467,875 |
|
| 01/2016 |
29,050 |
2,747,312 |
| 02/2016 |
30,403 |
2,777,715 |
| 03/2016 |
27,106 |
2,804,821 |
| 04/2016 |
30,431 |
2,835,252 |
| 05/2016 |
30,918 |
2,866,170 |
| 06/2016 |
28,519 |
2,894,689 |
| 07/2016 |
25,238 |
2,919,927 |
| 08/2016 |
27,443 |
2,947,370 |
| 09/2016 |
23,640 |
2,971,010 |
| 10/2016 |
30,447 |
3,001,457 |
| 11/2016 |
42,486 |
3,043,943 |
| 12/2016 |
41,142 |
3,085,085 |
| Total 2016 |
366,823 |
|
| 01/2017 |
35,578 |
3,120,663 |
| 02/2017 |
33,417 |
3,154,080 |
| 03/2017 |
33,234 |
3,187,314 |
| 04/2017 |
37,330 |
3,224,644 |
| 05/2017 |
40,166 |
3,264,810 |
| 06/2017 |
31,541 |
3,296,351 |
| 07/2017 |
81,686 |
3,378,037 |
| 08/2017 |
52,131 |
3,430,168 |
| 09/2017 |
36,488 |
3,466,656 |
| 10/2017 |
18,549 |
3,485,205 |
| 11/2017 |
30,907 |
3,516,112 |
| 12/2017 |
30,447 |
3,546,559 |
| Total 2017 |
461,474 |
|
| 01/2018 |
44,382 |
3,590,941 |
| 02/2018 |
47,406 |
3,638,347 |
| 03/2018 |
45,162 |
3,683,509 |
| 04/2018 |
46,282 |
3,729,791 |
| 05/2018 |
46,566 |
3,776,357 |
| 06/2018 |
42,443 |
3,818,800 |
| 07/2018 |
40,610 |
3,859,410 |
| 08/2018 |
33,838 |
3,893,248 |
| 09/2018 |
|
|
Source: Ministry of Interior.
1. Definition
Saudi Arabia for years has been routinely performing deportations of illegal workers, during amnesty periods and rounding up operations of various scales.
2. Institution which provides data
Ministry of Interior
3. Data availability
Monthly figures for irregulars’ arrests and deportations are available online on the Ministry of Interior’s website,
Path: Section “Sectors”, “National center for security operations”, “Statistics”, “monthly statistics”. Data available in the Arabic section only.
Figures are computed by Hijri months.
Last date of access: Septembre 2018
| Month/ Year |
Arrests at Saudi borders |
| 11/2012 |
25,553 |
| 12/2012 |
21,378 |
| 1/2013 |
28,816 |
| 2/2013 |
33,005 |
| 3/2013 |
26,213 |
| 4/2013 |
24,344 |
| 5/2013 |
22,276 |
| 6/2013 |
77,552 |
| 7/2013 |
17,837 |
| 8/2013 |
20,305 |
| 9/2013 |
14,698 |
| 10/2013 |
31,436 |
| 11/2013 |
35,116 |
| 12/2013 |
27,328 |
| 01/2014 |
25,534 |
| 02/2014 |
20,260 |
| 03/2014 |
17,541 |
| 04/2014 |
23,080 |
| 05/2014 |
20,474 |
| 06/2014 |
18,939 |
| 07/2014 |
27,050 |
| 08/2014 |
15,905 |
| 09/2014 |
18,500 |
| 10/2014 |
16,817 |
| 11/2014 |
18,242 |
| 12/2014 |
20,515 |
| 1/2015 |
19,347 |
| 2/2015 |
18,605 |
| 3/2015 |
6,884 |
| 4/2015 |
4,485 |
| 5/2015 |
5,065 |
| 6/2015 |
6,327 |
| 7/2015 |
4,078 |
| 8/2015 |
726 |
| 9/2015 |
1,713 |
| 10/2015 |
1,907 |
| 11/2015 |
2,493 |
| 12/2015 |
1,760 |
| 01/2016 |
2,014 |
| 02/2016 |
2,255 |
| 03/2016 |
2,336 |
| 04/2016 |
1,916 |
| 05/2016 |
1,476 |
| 06/2016 |
3,247 |
| 07/2016 |
1,987 |
| 08/2016 |
1,791 |
| 09/2016 |
1,794 |
| 10/2016 |
1,658 |
| 11/2016 |
1,476 |
| 12/2016 |
1,550 |
| 01/2017 |
3,322 |
| 02/2017 |
3,860 |
| 03/2017 |
3,508 |
| 04/2017 |
1,900 |
| 05/2017 |
1,798 |
| 06/2017 |
1,459 |
| 07/2017 |
1,658 |
| 08/2017 |
2,665 |
| 09/2017 |
2,378 |
| 10/2017 |
7,347 |
| 11/2017 |
3,230 |
| 12/2017 |
2,349 |
| 01/2018 |
3,371 |
| 02/2018 |
3,017 |
| 03/2018 |
2,073 |
| 04/2018 |
3,016 |
| 05/2018 |
2,215 |
| 06/2018 |
3,059 |
| 07/2018 |
3,348 |
Source: Ministry of Interior, Border Police
1. Definition
Infiltrators are persons who entered illegally into Saudi Arabia’s territory.
These arrests are made by border guards (Interior Ministry) at the country’s external borders.
2. Institution which provides data
Ministry of interior
3. Data availability
Figures of arrests at Saudi borders are available on the website of the Ministry of Interior
Path: Section “Sectors”, “National center for security operations”, “Statistics”, “monthly statistics”. Data available in the Arabic section only.
Figures are disagregated by administrative region where the arrest took place.
Figures are computed by Hijri months.
Last date of access: Septembre 2018
|
|
Saudis |
|
|
Non-Saudis |
|
|
Total |
|
|
Males |
Females |
Total |
Males |
Females |
Total |
Males |
Females |
Total |
| 2005 |
590,000 |
30,000 |
620,000 |
4,660,000 |
80,000 |
4,740,000 |
5,300,000 |
100,000 |
5,400,000 |
| 2006 |
673,830 |
39,921 |
713,751 |
4,782,034 |
84,955 |
4,866,989 |
5,455,864 |
124,876 |
5,580,740 |
| 2007 |
714,565 |
51,056 |
765,621 |
4,964,241 |
96,994 |
5,061,235 |
5,678,806 |
148,050 |
5,826,856 |
| 2008 |
777,606 |
51,451 |
829,057 |
5,301,290 |
91,600 |
5,392,890 |
6,078,896 |
143,051 |
6,221,947 |
| 2009* |
633,075 |
48,406 |
681,481 |
6,125,028 |
89,039 |
6,214,067 |
6,758,103 |
137,445 |
6,895,548 |
| 2010 |
669,037 |
55,618 |
724,655 |
6,178,130 |
88,415 |
6,266,545 |
6,847,167 |
144,033 |
6,991,200 |
| 2011 |
744,990 |
99,486 |
844,476 |
6,823,554 |
113,466 |
6,937,020 |
7,568,544 |
212,952 |
7,781,496 |
| 2012 |
918,793 |
215,840 |
1,134,633 |
7,244,206 |
108,694 |
7,352,900 |
8,162,999 |
324,534 |
8,487,533 |
| 2013 |
1,068,315 |
398,538 |
1,466,853 |
8,051,394 |
161,388 |
8,212,782 |
9,119,709 |
559,926 |
9,679,635 |
| 2014 |
1,136,897 |
413,071 |
1,549,968 |
8,300,627 |
169,512 |
8,470,139 |
9,437,524 |
582,583 |
10,020,107 |
| 2015 |
1,239,463 |
499,611 |
1,739,074 |
8,698,869 |
179,247 |
8,878,116 |
9,938,332 |
678,858 |
10,617,190 |
| 2016 |
1,261,538 |
547,777 |
1,809,315 |
8,826,453 |
208,817 |
9,035,270 |
10,087,991 |
756,594 |
10,844,585 |
| 2017 |
1,293,072 |
605,855 |
1,898,927 |
8,091,976 |
220,298 |
8,312,274 |
9,385,048 |
826,153 |
10,211,201 |
Source: Ministry of Labour and Social Development, Data section
ANNEXED NOTE
1. Technical Notes and Definitions
* Workers double-counted and with incomplete or incorrect information were excluded.
2. Institution which provides data
Ministry of Labour and Social Development (MLSD).
https://mlsd.gov.sa/en/
https://mlsd.gov.sa/
3. Data availability
Ministry of Labour’s records of employees and job-seekers in the private sector are published in chapter “Labour and Social Security” of GAStat’s Annual Yearbooks (in Arabic and English, Excel format):
https://www.stats.gov.sa/en/940
The present time-series data is taken from the Saudi Arabial Monetary Authority (SAMA) Annual Statistics (“miscellaneous statistics” section) (Excel format)
http://www.sama.gov.sa/en-US/EconomicReports/Pages/YearlyStatistics.aspx
Last date of access: July 2018.
|
|
Saudis |
|
|
Non-Saudis |
|
|
Total |
|
|
Males |
Females |
Total |
Males |
Females |
Total |
Males |
Females |
Total |
| 1970 |
— |
— |
97,002 |
— |
— |
20,276 |
— |
— |
117,278 |
| 1971 |
— |
— |
110,453 |
— |
— |
23,629 |
— |
— |
134,082 |
| 1972 |
— |
— |
120,765 |
— |
— |
28,288 |
— |
— |
149,053 |
| 1973 |
— |
— |
127,658 |
— |
— |
31,106 |
— |
— |
158,764 |
| 1974 |
— |
— |
131,667 |
— |
— |
34,748 |
— |
— |
166,415 |
| 1975 |
— |
— |
142,341 |
— |
— |
42,400 |
— |
— |
184,741 |
| 1976 |
— |
— |
140,807 |
— |
— |
47,055 |
— |
— |
187,862 |
| 1977 |
— |
— |
148,062 |
— |
— |
50,976 |
— |
— |
199,038 |
| 1978 |
— |
— |
154,789 |
— |
— |
57,252 |
— |
— |
212,041 |
| 1979 |
— |
— |
165,056 |
— |
— |
64,182 |
— |
— |
229,238 |
| 1980 |
— |
— |
183,501 |
— |
— |
69,397 |
— |
— |
252,898 |
| 1981 |
— |
— |
195,604 |
— |
— |
72,867 |
— |
— |
268,471 |
| 1982 |
— |
— |
247,978 |
— |
— |
86,243 |
— |
— |
334,221 |
| 1983 |
— |
— |
258,124 |
— |
— |
106,124 |
— |
— |
364,248 |
| 1984 |
— |
— |
274,459 |
— |
— |
121,331 |
— |
— |
395,790 |
| 1985 |
— |
— |
299,738 |
— |
— |
129,281 |
— |
— |
429,019 |
| 1986 |
— |
— |
316,629 |
— |
— |
140,494 |
— |
— |
457,123 |
| 1987 |
— |
— |
336,456 |
— |
— |
144,523 |
— |
— |
480,979 |
| 1988 |
— |
— |
356,307 |
— |
— |
147,552 |
— |
— |
503,859 |
| 1989 |
— |
— |
369,093 |
— |
— |
150,116 |
— |
— |
519,209 |
| 1990 |
— |
— |
386,760 |
— |
— |
147,938 |
— |
— |
534,698 |
| 1991 |
— |
— |
396,891 |
— |
— |
151,658 |
— |
— |
548,549 |
| 1992 |
— |
— |
420,653 |
— |
— |
159,612 |
— |
— |
580,265 |
| 1993 |
— |
— |
444,364 |
— |
— |
144,934 |
— |
— |
589,298 |
| 1994 |
— |
— |
460,845 |
— |
— |
133,014 |
— |
— |
593,859 |
| 1995 |
— |
— |
480,313 |
— |
— |
128,698 |
— |
— |
609,011 |
| 1996 |
— |
— |
506,577 |
— |
— |
109,714 |
— |
— |
616,291 |
| 1997 |
379,025 |
181,653 |
560,678 |
51,827 |
44,151 |
95,978 |
430,852 |
225,804 |
656,656 |
| 1998 |
383,996 |
195,419 |
579,415 |
49,736 |
39,272 |
89,008 |
433,732 |
234,691 |
668,423 |
| 1999 |
387,779 |
203,879 |
591,658 |
46,956 |
35,940 |
82,896 |
434,735 |
239,819 |
674,554 |
| 2000 |
408,640 |
204,682 |
613,322 |
45,776 |
35,672 |
81,448 |
454,416 |
240,354 |
694,770 |
| 2001 |
416,803 |
214,221 |
631,024 |
45,644 |
34,191 |
79,835 |
462,447 |
248,412 |
710,859 |
| 2002 |
438,023 |
214,912 |
652,935 |
43,400 |
31,653 |
75,053 |
481,423 |
246,565 |
727,988 |
| 2003 |
452,555 |
224,965 |
677,520 |
41,698 |
27,748 |
69,446 |
494,253 |
252,713 |
746,966 |
| 2004 |
463,487 |
231,007 |
694,494 |
41,342 |
27,429 |
68,771 |
504,829 |
258,436 |
763,265 |
| 2005 |
472,727 |
240,108 |
712,835 |
41,436 |
29,005 |
70,441 |
514,163 |
269,113 |
783,276 |
| 2006 |
490,109 |
243,757 |
733,866 |
39,779 |
30,018 |
69,797 |
529,888 |
273,775 |
803,663 |
| 2007 |
508,006 |
252,989 |
760,995 |
36,851 |
32,139 |
68,990 |
544,857 |
285,128 |
829,985 |
| 2008 |
552,718 |
275,128 |
827,846 |
35,807 |
36,058 |
71,865 |
588,525 |
311,186 |
899,711 |
| 2009 |
583,989 |
282,785 |
866,774 |
36,202 |
38,924 |
75,126 |
620,191 |
321,709 |
941,900 |
| 2010 |
589,627 |
295,088 |
884,715 |
33,677 |
41,441 |
75,118 |
623,304 |
336,529 |
959,833 |
| 2011 |
616,748 |
302,360 |
919,108 |
37,128 |
41,902 |
79,030 |
653,876 |
344,262 |
998,138 |
| 2012 |
643,212 |
369,840 |
1,013,052 |
36,663 |
39,786 |
76,449 |
679,875 |
409,626 |
1,089,501 |
| 2013 |
718,383 |
432,445 |
1,150,828 |
36,203 |
37,790 |
73,993 |
754,586 |
470,235 |
1,224,821 |
| 2014 |
717,629 |
450,957 |
1,168,586 |
36,125 |
36,037 |
72,162 |
753,754 |
486,994 |
1,240,748 |
| 2015 |
709,256 |
468,777 |
1,178,033 |
35,064 |
34,961 |
70,025 |
744,320 |
503,738 |
1,248,058 |
| 2016 |
703,671 |
474,153 |
1,177,824 |
33,895 |
33,092 |
66,987 |
737,566 |
507,245 |
1,244,811 |
| 2017 |
697,123 |
476,347 |
1,173,470 |
29,618 |
30,768 |
60,386 |
726,741 |
507,115 |
1,233,856 |
source: Ministry of Civil Service
ANNEXED NOTE
1. Technical Notes and Definitions
The statistics include men and women working under the following salary scales:
Scales of general public employment, health professions, education and teaching, lecturers and teaching assistants, judges,
investigation staff and public prosecutors, and other wage-earners.
Data do not include employees in the security and military sectors.
2. Institution which provides data
Ministry of Civil Service.
3. Data availability
The Ministry of Civil Service publishes Annual Yearbooks, available online since 2010 (in Arabic, PDF format):
https://www.mcs.gov.sa/Ministry/Statistics/Pages/books.aspx
The present data is taken from the Saudi Arabial Monetary Authority (SAMA) Annual Statistics (“miscellaneous statistics” section) (Excel format)
http://www.sama.gov.sa/en-US/EconomicReports/Pages/YearlyStatistics.aspx
Last date of access: July 2018.
|
|
Saudis |
|
|
Non-Saudis |
|
|
Total |
|
|
Males |
Females |
Total |
Males |
Females |
Total |
Males |
Females |
Total |
| 1. Civil Service (public sector) |
704,183 |
477,508 |
1,181,691 |
26,964 |
24,040 |
51,004 |
731,147 |
501,548 |
1,232,695 |
| 2. Social Insurance (private sector) |
1,376,418 |
605,737 |
1,982,155 |
7,741,863 |
211,755 |
7,953,618 |
9,118,281 |
817,492 |
9,935,773 |
| Total |
2,080,601 |
1,083,245 |
3,163,846 |
7,768,827 |
235,795 |
8,004,622 |
9,849,428 |
1,319,040 |
11,168,468 |
| 3. Domestic labour |
0 |
0 |
0 |
1,673,336 |
739,337 |
2,412,673 |
1,673,336 |
739,337 |
2,412,673 |
| Grand total |
2,080,601 |
1,083,245 |
3,163,846 |
9,442,163 |
975,132 |
10,417,295 |
11,522,764 |
2,058,377 |
13,581,141 |
Source: GOSI, MCS and MLSD records, in Labour Force Survey 2017 (Q4), GAStat.
ANNEXED NOTE
1. Technical Notes and Definitions
Since 2016, Labour Force Surveys are conducted quarterly.
Sampling frame: Population Census 2010.
Sample size: 33,500 households
Population of reference: All the members of the households selected in the sample, including domestic helpers and the like who live in one house; Saudi and non-Saudi population, living in the Kingdom at the time of the survey.
Period of reference: Q4, 2017
Since Q3 2016, instead of survey results, the Labour Force Surveys’ publications display administrative data: the records of Saudi and foreign labourers covered by social security schemes
(private and governmental sectors), and Ministry of Labour’s records of domestic labourers.
1. Labourers in the governmental sector are recorded by the Ministry of Civil Service.
2. The Social Insurance Law of the Kingdom of Saudi Arabia has become compulsorily applied to all Saudi workers in the private sector
of any other GCC Member State effective from 01/01/2006. Saudi and foreign workers in the sector have to be recorded by the General Organization for Social Insurance (GOSI).
3. Since 2017, the Ministry of Labour and Social Development records all labourers in the domestic sector.
Therefore, data presented here may differ from the concerned ministries’ records of actual employment.
.Moreover, the present data do not include employees in the security and military sectors and employed persons non-registered in the records of GOSI and MCS
2. Institution which provides data
General Authority for Statistics (GAStat), Saudi Arabia
3. Data availability
CDSI’s, and later GAStat’s Labour Force Surveys are available online on GAStat’s website since 1999:
https://www.stats.gov.sa/en/814
The present data is taken from Labour Force Survey 2017 (Q4) (PDF and Excel formats).
Last date of access: July 2018.
|
|
Saudis |
|
|
Non-Saudis |
|
|
Total |
|
|
Males |
Females |
Total |
Males |
Females |
Total |
Males |
Females |
Total |
| Directors and managers |
111,553 |
47,992 |
159,545 |
68,676 |
955 |
69,631 |
180,229 |
48,947 |
229,176 |
| Specialists in professional, technical and humanitarian fields |
85,324 |
43,616 |
128,940 |
635,610 |
27,962 |
663,572 |
720,934 |
71,578 |
792,512 |
| Technicians in professional, technical and humanitarian fields |
109,312 |
71,596 |
180,908 |
602,430 |
56,142 |
658,572 |
711,742 |
127,738 |
839,480 |
| Clerical occupations |
297,834 |
239,842 |
537,676 |
55,366 |
2,356 |
57,722 |
353,200 |
242,198 |
595,398 |
| Sales occupations |
137,330 |
128,209 |
265,539 |
503,214 |
1,968 |
505,182 |
640,544 |
130,177 |
770,721 |
| Service occupations |
292,194 |
44,484 |
336,678 |
2,640,641 |
117,213 |
2,757,854 |
2,932,835 |
161,697 |
3,094,532 |
| Agriculture, animal husbandry, fishing |
2,949 |
633 |
3,582 |
501,986 |
104 |
502,090 |
504,935 |
737 |
505,672 |
| Supporting basic engineering occupations |
202,381 |
20,485 |
222,866 |
2,888,491 |
551 |
2,889,042 |
3,090,872 |
21,036 |
3,111,908 |
| Industrial and chemical processes and food industries occupations |
24,159 |
8,110 |
32,269 |
190,713 |
12,654 |
203,367 |
214,872 |
20,764 |
235,636 |
| Other occupations |
30,036 |
888 |
30,924 |
4,849 |
393 |
5,242 |
34,885 |
1,281 |
36,166 |
| Total |
1,293,072 |
605,855 |
1,898,927 |
8,091,976 |
220,298 |
8,312,274 |
9,385,048 |
826,153 |
10,211,201 |
Source: Ministry of Labour and Social Development, Data section
ANNEXED NOTE
1. Technical Notes and Definitions
Ministry of Labour’s records of employed labourers.
Classification used for occupations is adapted from ISCO 1988.
2. Institution which provides data
Ministry of Labour and Social Development (MLSD).
https://mlsd.gov.sa/en/
https://mlsd.gov.sa/
3. Data availability
Ministry of Labour’s records of employees and job-seekers in the private sector are published in chapter “Labour and Social Security” of GAStat’s Annual Yearbooks (in Arabic and English, Excel format):
https://www.stats.gov.sa/en/940
The data is also published in the Saudi Arabian Monetary Authority (SAMA) Annual Statistics (“miscellaneous statistics” section) (Excel format)
http://www.sama.gov.sa/en-US/EconomicReports/Pages/YearlyStatistics.aspx
Last date of access: July 2018.
|
Labour force |
|
males |
females |
Total |
| 2011 |
3,630,821 |
275,773 |
3,906,594 |
| 2012 |
3,733,727 |
310,637 |
4,044,364 |
| 2013 |
3,713,771 |
337,462 |
4,051,233 |
| 2014 |
4,052,256 |
392,244 |
4,444,500 |
| 2015 |
4,315,030 |
429,594 |
4,744,624 |
| 2016 |
4,434,000 |
456,000 |
4,890,000 |
| 2017 |
4,565,000 |
474,000 |
5,039,000 |
Source: Labour Market Information System, Ministry of Human Resources and Emiratisation (MoHRE)
ANNEXED NOTE
1. Characteristics of data
The figures pertain to the number of workers registered in the UAE’s private sector, with the MoHRE.
The “labour force” includes all economically active individuals in the community, whether they are already working or looking for work (see: https://www.mohre.gov.ae/en/media-center/definitions.aspx)
Employed persons: Individuals who are already engaged in productive work: it includes individual who are employed, even if they do not work because of illness or injury,
holiday or for irregular work at the facilities in which they work for temporary or incidental reasons. This category also includes full-time and part-time workers.
Unemployed: Individuals who are able to work and wishing to do so, were still searching jobs during the survey. This category includes the unemployed who never entered the labour market,
and who have previously worked and had to leave their jobs for any reason as a result of labour market conditions.
It is unclear whether or not figures include nationals.
Domestic workers are not included.
2. Institution which provides data
Ministry of Human Resources and Emiratisation (MOHRE): http://www.mohre.gov.ae/en/home.aspx
3. Data availability
The data is taken from the “open data” section of MoHRE website:
http://www.mohre.gov.ae/en/data-library.aspx
Data is available in PDF and Excel formats.
Last date of access: June 2018.
|
Abu Dhabi |
Dubai |
Sharjah |
Ajman |
Umm Al Quwain |
Ras Al Khaima |
Fujairah |
TOTAL UAE |
| 2011 |
1,330,735 |
1,684,199 |
509,960 |
172,183 |
29,354 |
106,358 |
73,218 |
3,906,594 |
| 2012 |
1,358,758 |
1,769,297 |
518,857 |
183,271 |
29,435 |
108,788 |
75,958 |
4,044,364 |
| 2013 |
1,313,073 |
1,847,557 |
502,087 |
180,267 |
28,765 |
105,864 |
73,620 |
4,051,233 |
| 2014 |
1,375,743 |
2,109,399 |
535,555 |
198,836 |
32,467 |
113,413 |
79,087 |
4,444,500 |
| 2015 |
1,434,557 |
2,311,277 |
546,632 |
213,122 |
35,842 |
118,411 |
84,783 |
4,744,624 |
| 2016 |
1,447,500 |
2,395,853 |
565,606 |
228,264 |
40,323 |
123,697 |
88,610 |
4,889,853 |
| 2017 |
1,429,000 |
2,530,000 |
578,000 |
241,000 |
45,000 |
127,000 |
90,000 |
5,040,000 |
Source: Labour Market Information System, Ministry of Human Resources and Emiratisation (MoHRE)
ANNEXED NOTE
1. Characteristics of data
The figures pertain to the number of workers registered in the UAE’s private sector, with the MoHRE.
The “labour force” includes all economically active individuals in the community, whether they are already working or looking for work (see: https://www.mohre.gov.ae/en/media-center/definitions.aspx)
Employed persons: Individuals who are already engaged in productive work: it includes individual who are employed, even if they do not work because of illness or injury,
holiday or for irregular work at the facilities in which they work for temporary or incidental reasons. This category also includes full-time and part-time workers.
Unemployed: Individuals who are able to work and wishing to do so, were still searching jobs during the survey. This category includes the unemployed who never entered the labour market,
and who have previously worked and had to leave their jobs for any reason as a result of labour market conditions.
It is unclear whether or not figures include nationals.
Domestic workers are not included.
2. Institution which provides data
Ministry of Human Resources and Emiratisation (MOHRE): http://www.mohre.gov.ae/en/home.aspx
3. Data availability
The data is taken from the “open data” section of MoHRE website:
http://www.mohre.gov.ae/en/data-library.aspx
Data is available in PDF and Excel formats.
Last date of access: June 2018.
| Economic sector |
2017 |
| Construction |
1,712,000 |
| Wholesale Trade and Repair Services |
1,122,000 |
| Manufacturing |
474,000 |
| Real Estate, Rental and Business Services |
594,000 |
| Transportation, Storage and Communication |
368,000 |
| Hotels and Restaurants |
236,000 |
| Community, Personal and Other Services |
154,000 |
| Educational Services and Studies |
88,000 |
| Financial Intermediation |
71,000 |
| Others |
220,000 |
| Total |
5,039,000 |
Source: Labour Market Information System, Ministry of Human Resources and Emiratisation (MoHRE)
ANNEXED NOTE
1. Characteristics of data
The figures pertain to the number of workers registered in the UAE’s private sector, with the MoHRE.
The “labour force” includes all economically active individuals in the community, whether they are already working or looking for work (see: https://www.mohre.gov.ae/en/media-center/definitions.aspx)
Employed persons: Individuals who are already engaged in productive work: it includes individual who are employed, even if they do not work because of illness or injury,
holiday or for irregular work at the facilities in which they work for temporary or incidental reasons. This category also includes full-time and part-time workers.
Unemployed: Individuals who are able to work and wishing to do so, were still searching jobs during the survey. This category includes the unemployed who never entered the labour market,
and who have previously worked and had to leave their jobs for any reason as a result of labour market conditions.
It is unclear whether or not figures include nationals.
Domestic workers are not included.
2. Institution which provides data
Ministry of Human Resources and Emiratisation (MOHRE): http://www.mohre.gov.ae/en/home.aspx
3. Data availability
The data is taken from the “open data” section of MoHRE website:
http://www.mohre.gov.ae/en/data-library.aspx
Data is available in PDF and Excel formats.
Last date of access: June 2018.
| Economic sector |
2016 |
| Construction |
1,607,396 |
| Wholesale Trade and Repair Services |
1,131,704 |
| Manufacturing |
454,671 |
| Real Estate, Rental and Business Services |
577,037 |
| Transportation, Storage and Communication |
369,629 |
| Hotels and Restaurants |
223,179 |
| Community, Personal and Other Services |
186,349 |
| Educational Services and Studies |
89,488 |
| Financial Intermediation |
63,697 |
| Others |
186,703 |
| Total |
4,889,853 |
Source: Labour Market Information System, Ministry of Human Resources and Emiratisation (MoHRE)
ANNEXED NOTE
1. Characteristics of data
The figures pertain to the number of workers registered in the UAE’s private sector, with the MoHRE.
The “labour force” includes all economically active individuals in the community, whether they are already working or looking for work (see: https://www.mohre.gov.ae/en/media-center/definitions.aspx)
Employed persons: Individuals who are already engaged in productive work: it includes individual who are employed, even if they do not work because of illness or injury,
holiday or for irregular work at the facilities in which they work for temporary or incidental reasons. This category also includes full-time and part-time workers.
Unemployed: Individuals who are able to work and wishing to do so, were still searching jobs during the survey. This category includes the unemployed who never entered the labour market,
and who have previously worked and had to leave their jobs for any reason as a result of labour market conditions.
It is unclear whether or not figures include nationals.
Domestic workers are not included.
2. Institution which provides data
Ministry of Human Resources and Emiratisation (MOHRE): http://www.mohre.gov.ae/en/home.aspx
3. Data availability
The data is taken from the “open data” section of MoHRE website:
http://www.mohre.gov.ae/en/data-library.aspx
Data is available in PDF and Excel formats.
Last date of access: June 2018.
| Economic sector |
2004 |
2005 |
2006 |
2007 |
2008 |
2009 |
2010 |
2011 |
2012 |
2013 |
2014 |
2015 |
2016 |
2017 |
| Construction |
780,439 |
916,309 |
1,090,513 |
1,374,566 |
1,938,735 |
1,760,975 |
1,553,733 |
1,534,447 |
1,506,667 |
1,382,059 |
1,481,146 |
1,550,459 |
1,607,396 |
1,712,000 |
| Wholesale Trade and Repair Services |
484,457 |
516,061 |
563,659 |
654,071 |
777,214 |
846,606 |
868,012 |
866,662 |
922,974 |
964,730 |
1,045,541 |
1,122,943 |
1,131,704 |
1,122,000 |
| Manufacturing |
271,541 |
288,855 |
326,196 |
376,721 |
454,460 |
419,383 |
407,369 |
432,053 |
443,209 |
441,070 |
471,624 |
455,097 |
454,671 |
474,000 |
| Real Estate, Rental and Business Services |
109,295 |
127,055 |
154,994 |
214,324 |
297,320 |
324,002 |
339,137 |
345,367 |
389,458 |
423,253 |
502,163 |
543,321 |
577,037 |
594,000 |
| Transportation, Storage and Communication |
142,959 |
154,727 |
170,280 |
196,311 |
250,538 |
270,665 |
258,114 |
270,329 |
284,572 |
308,705 |
346,818 |
358,041 |
369,629 |
368,000 |
| Hotels and Restaurants |
87,584 |
89,776 |
93,591 |
105,558 |
126,487 |
124,068 |
133,011 |
152,267 |
169,339 |
191,289 |
214,966 |
211,535 |
223,179 |
236,000 |
| Community, Personal and Other Services |
41,917 |
46,771 |
54,489 |
57,361 |
67,519 |
93,781 |
118,148 |
82,359 |
87,669 |
93,920 |
104,753 |
179,078 |
186,349 |
154,000 |
| Educational Services and Studies |
27,054 |
29,762 |
33,343 |
40,391 |
47,172 |
58,735 |
57,142 |
58,481 |
64,072 |
66,315 |
74,174 |
81,834 |
89,488 |
88,000 |
| Financial Intermediation |
19,714 |
22,932 |
26,839 |
31,202 |
38,641 |
39,395 |
39,843 |
48,185 |
49,875 |
52,446 |
58,145 |
60,385 |
63,697 |
71,000 |
| Others |
48,563 |
50,128 |
53,445 |
62,517 |
81,367 |
132,696 |
105,985 |
116,444 |
126,529 |
127,446 |
145,170 |
181,931 |
186,703 |
220,000 |
| Total |
2,013,523 |
2,242,376 |
2,567,349 |
3,113,022 |
4,079,453 |
4,072,315 |
3,880,494 |
3,906,594 |
4,044,364 |
4,051,233 |
4,444,500 |
4,744,624 |
4,889,853 |
5,039,000 |
Source: Labour Market Information System, Ministry of Human Resources and Emiratisation (MoHRE)
ANNEXED NOTE
1. Characteristics of data
The figures pertain to the number of workers registered in the UAE’s private sector, with the MoHRE.
The “labour force” includes all economically active individuals in the community, whether they are already working or looking for work (see: https://www.mohre.gov.ae/en/media-center/definitions.aspx)
Employed persons: Individuals who are already engaged in productive work: it includes individual who are employed, even if they do not work because of illness or injury,
holiday or for irregular work at the facilities in which they work for temporary or incidental reasons. This category also includes full-time and part-time workers.
Unemployed: Individuals who are able to work and wishing to do so, were still searching jobs during the survey. This category includes the unemployed who never entered the labour market,
and who have previously worked and had to leave their jobs for any reason as a result of labour market conditions.
It is unclear whether or not figures include nationals.
Domestic workers are not included.
2. Institution which provides data
Ministry of Human Resources and Emiratisation (MOHRE): http://www.mohre.gov.ae/en/home.aspx
3. Data availability
The data is taken from the “open data” section of MoHRE website:
http://www.mohre.gov.ae/en/data-library.aspx
Data is available in PDF and Excel formats.
Last date of access: June 2018.
|
2016 |
| Managers |
166,506 |
| Professionals |
406,061 |
| Technicians and associate professionals |
294,040 |
| Clerical support workers |
428,194 |
| Service and sales workers |
697,308 |
| Skilled agricultural, forestry and fishery workers |
10,340 |
| Craft and related trades workers |
1,552,566 |
| Plant and machine operators, and assemblers |
488,780 |
| Elementary occupations |
845,389 |
| Not Classified |
669 |
| Total |
4,889,853 |
Source: Labour Market Information System, Ministry of Human Resources and Emiratisation (MoHRE)
ANNEXED NOTE
1. Characteristics of data
The figures pertain to the number of workers registered in the UAE’s private sector, with the MoHRE.
The “labour force” includes all economically active individuals in the community, whether they are already working or looking for work (see: https://www.mohre.gov.ae/en/media-center/definitions.aspx)
Employed persons: Individuals who are already engaged in productive work: it includes individual who are employed, even if they do not work because of illness or injury,
holiday or for irregular work at the facilities in which they work for temporary or incidental reasons. This category also includes full-time and part-time workers.
Unemployed: Individuals who are able to work and wishing to do so, were still searching jobs during the survey. This category includes the unemployed who never entered the labour market,
and who have previously worked and had to leave their jobs for any reason as a result of labour market conditions.
It is unclear whether or not figures include nationals.
Domestic workers are not included.
2. Institution which provides data
Ministry of Human Resources and Emiratisation (MOHRE): http://www.mohre.gov.ae/en/home.aspx
3. Data availability
The data is taken from the “open data” section of MoHRE website:
http://www.mohre.gov.ae/en/data-library.aspx
Data is available in PDF and Excel formats.
Last date of access: June 2018.
|
Labour force |
| 2004 |
2,013,523 |
| 2005 |
2,242,376 |
| 2006 |
2,567,349 |
| 2007 |
3,113,022 |
| 2008 |
4,079,453 |
| 2009 |
4,072,315 |
| 2010 |
3,880,494 |
| 2011 |
3,906,594 |
| 2012 |
4,044,364 |
| 2013 |
4,051,233 |
| 2014 |
4,444,500 |
| 2015 |
4,744,624 |
| 2016 |
4,889,853 |
| 2017 |
5,039,000 |
Source: Labour Market Information System, Ministry of Human Resources and Emiratisation (MoHRE)
ANNEXED NOTE
1. Characteristics of data
The figures pertain to the number of workers registered in the UAE’s private sector, with the MoHRE.
The “labour force” includes all economically active individuals in the community, whether they are already working or looking for work (see: https://www.mohre.gov.ae/en/media-center/definitions.aspx)
Employed persons: Individuals who are already engaged in productive work: it includes individual who are employed, even if they do not work because of illness or injury,
holiday or for irregular work at the facilities in which they work for temporary or incidental reasons. This category also includes full-time and part-time workers.
Unemployed: Individuals who are able to work and wishing to do so, were still searching jobs during the survey. This category includes the unemployed who never entered the labour market,
and who have previously worked and had to leave their jobs for any reason as a result of labour market conditions.
It is unclear whether or not figures include nationals.
Domestic workers are not included.
2. Institution which provides data
Ministry of Human Resources and Emiratisation (MOHRE): http://www.mohre.gov.ae/en/home.aspx
3. Data availability
The data is taken from the “open data” section of MoHRE website:
http://www.mohre.gov.ae/en/data-library.aspx
Data is available in PDF and Excel formats.
Last date of access: June 2018.
|
|
Labour Force (Economically Active) |
Outside Labour Force (Non-Economically Active) |
|
|
Employed |
Unemployed |
Total |
% |
Homemaker |
Full Time Student |
Other |
Total |
% |
|
Males |
97.4 |
2.6 |
100 |
65.4 |
0 |
47.6 |
52.4 |
100 |
34.6 |
| Emirati |
Females |
95.1 |
4.9 |
100 |
37.4 |
44.5 |
29.3 |
26.2 |
100 |
62.6 |
|
Total |
96.6 |
3.4 |
100 |
51.1 |
29.1 |
35.6 |
35.3 |
100 |
48.9 |
|
Males |
99.8 |
0.2 |
100 |
95.9 |
0 |
65.2 |
34.8 |
100 |
4.1 |
| Non Emirati |
Females |
98.8 |
1.2 |
100 |
55.7 |
76.3 |
13 |
10.7 |
100 |
44.3 |
|
Total |
99.6 |
0.4 |
100 |
85.3 |
60.6 |
23.7 |
15.7 |
100 |
14.7 |
|
Males |
99.7 |
0.3 |
100 |
94.6 |
0 |
60.3 |
39.7 |
100 |
5.4 |
| Total |
Females |
98.5 |
1.5 |
100 |
53.6 |
71.2 |
15.6 |
13.2 |
100 |
46.4 |
|
Total |
99.5 |
0.5 |
100 |
83.1 |
54.7 |
26 |
19.3 |
100 |
16.9 |
Source : Dubai Statistics Center – Labour Force Survey 2017
ANNEXED NOTE
1. Characteristics of data, definitions
DSC has been conducting Labour Force Surveys on Dubai Emirate in 2008, 2009, 2011 and yearly since 2012.
Sample of LFS 2017: 3,000 households (1,500 Emirati households and 1,500 non-Emirati households) and 1,000 workers from labour gatherings.
Date of reference: ? 2017.
The time reference of the survey is:
Visit day is the time reference for the family personal data.
The week ended on the visit day is the time reference for the employment status (employed / unemployed).
Month ended on the visit day is the time reference for job search.
The two years ended on the visit day represent the time reference for training of people who are unemployed and seeking a job.
2. Institution which provides data
Dubai Statistics Centre (DSC).
3. Data availability
Some tabulations of the results of Dubai Labour Force Surveys are available (in English and in Arabic, PDF and Word formats) at:
https://www.dsc.gov.ae/en-us/Themes/Pages/Labour.aspx?Theme=41&year=2017#DSC_Tab1
A summary volume of tables and analysis from 2017 and earlier Labour Force Surveys appear in publications (PDF format, in Arabic only):
https://www.dsc.gov.ae/en-us/Themes/Pages/Labour.aspx?Theme=41&year=2017#DSC_Tab2
Some tables (in PDF format), definition of concepts and partial methodological indications are available in the LFS’ project page on DSC’s website:
https://www.dsc.gov.ae/en-us/Programs-Statistical-Surveys/Pages/Statistical-Project-details.aspx?ProjectId=21
Last date of access: June 2018
|
|
Weekly working hours |
|
|
15 – 29 |
30 – 34 |
35 – 39 |
40 – 48 |
49+ |
Total |
|
Males |
0.5 |
2.7 |
46 |
49 |
1.8 |
100 |
| Emiratis |
Females |
0.5 |
2.2 |
53 |
43.2 |
1.1 |
100 |
|
Total |
0.5 |
2.5 |
48.6 |
46.9 |
1.5 |
100 |
|
Males |
0.1 |
0.5 |
2.2 |
61.4 |
35.8 |
100 |
| Non-Emiratis |
Females |
0.4 |
3.1 |
7.4 |
61.4 |
27.7 |
100 |
|
Total |
0.1 |
0.9 |
3.1 |
61.5 |
34.4 |
100 |
|
Males |
0.1 |
0.5 |
3.5 |
61.1 |
34.8 |
100 |
| Total |
Females |
0.4 |
3 |
11 |
60 |
25.6 |
100 |
|
Total |
0.2 |
1 |
4.8 |
60.8 |
33.2 |
100 |
Source : Dubai Statistics Center – Labour Force Survey 2017
ANNEXED NOTE
1. Characteristics of data, definitions
DSC has been conducting Labour Force Surveys on Dubai Emirate in 2008, 2009, 2011 and yearly since 2012.
Sample of LFS 2017: 3,000 households (1,500 Emirati households and 1,500 non-Emirati households) and 1,000 workers from labour gatherings.
Date of reference: ? 2017.
The time reference of the survey is:
Visit day is the time reference for the family personal data.
The week ended on the visit day is the time reference for the employment status (employed / unemployed).
Month ended on the visit day is the time reference for job search.
The two years ended on the visit day represent the time reference for training of people who are unemployed and seeking a job.
As of mid-June 2018: 1,000 AED=272 US$ and 236 Euros.
2. Institution which provides data
Dubai Statistics Centre (DSC).
3. Data availability
Some tabulations of the results of Dubai Labour Force Surveys are available (in English and in Arabic, PDF and Word formats) at:
https://www.dsc.gov.ae/en-us/Themes/Pages/Labour.aspx?Theme=41&year=2017#DSC_Tab1
A summary volume of tables and analysis from 2017 and earlier Labour Force Surveys appear in publications (PDF format, in Arabic only):
https://www.dsc.gov.ae/en-us/Themes/Pages/Labour.aspx?Theme=41&year=2017#DSC_Tab2
Some tables (in PDF format), definition of concepts and partial methodological indications are available in the LFS’ project page on DSC’s website:
https://www.dsc.gov.ae/en-us/Programs-Statistical-Surveys/Pages/Statistical-Project-details.aspx?ProjectId=21
Last date of access: June 2018
|
Monthly wage group (UAE Dirhams-AED) |
|
1-2,499 |
2,500-4,999 |
5,000-9,999 |
10,000-19,999 |
20,000-34,999 |
35,000 and above |
Refused to answer |
Total |
|
|
Males |
0 |
0.7 |
3.2 |
28.8 |
37.1 |
16.6 |
13.6 |
100 |
| Emiratis |
Females |
0 |
1 |
8.2 |
42.8 |
28.8 |
7 |
12.2 |
100 |
|
Total |
0 |
0.8 |
5.1 |
34 |
34 |
13.1 |
13 |
100 |
|
Males |
52.5 |
18.6 |
10.1 |
8.1 |
4.4 |
2.4 |
3.9 |
100 |
| Non-Emiratis |
Females |
31.1 |
20.6 |
20.9 |
14.2 |
5.3 |
1.2 |
6.7 |
100 |
|
Total |
48.8 |
18.9 |
12 |
9.2 |
4.6 |
2.2 |
4.3 |
100 |
|
Males |
50.9 |
18.1 |
9.9 |
8.7 |
5.4 |
2.8 |
4.2 |
100 |
| Total |
Females |
28.6 |
19 |
19.9 |
16.5 |
7.1 |
1.7 |
7.2 |
100 |
|
Total |
46.9 |
18.2 |
11.7 |
10.1 |
5.7 |
2.6 |
4.8 |
100 |
Source : Dubai Statistics Center – Labour Force Survey 2017
ANNEXED NOTE
1. Characteristics of data, definitions
DSC has been conducting Labour Force Surveys on Dubai Emirate in 2008, 2009, 2011 and yearly since 2012.
Sample of LFS 2017: 3,000 households (1,500 Emirati households and 1,500 non-Emirati households) and 1,000 workers from labour gatherings.
Date of reference: ? 2017.
The time reference of the survey is:
Visit day is the time reference for the family personal data.
The week ended on the visit day is the time reference for the employment status (employed / unemployed).
Month ended on the visit day is the time reference for job search.
The two years ended on the visit day represent the time reference for training of people who are unemployed and seeking a job.
As of mid-June 2018: 1,000 AED=272 US$ and 236 Euros.
2. Institution which provides data
Dubai Statistics Centre (DSC).
3. Data availability
Some tabulations of the results of Dubai Labour Force Surveys are available (in English and in Arabic, PDF and Word formats) at:
https://www.dsc.gov.ae/en-us/Themes/Pages/Labour.aspx?Theme=41&year=2017#DSC_Tab1
A summary volume of tables and analysis from 2017 and earlier Labour Force Surveys appear in publications (PDF format, in Arabic only):
https://www.dsc.gov.ae/en-us/Themes/Pages/Labour.aspx?Theme=41&year=2017#DSC_Tab2
Some tables (in PDF format), definition of concepts and partial methodological indications are available in the LFS’ project page on DSC’s website:
https://www.dsc.gov.ae/en-us/Programs-Statistical-Surveys/Pages/Statistical-Project-details.aspx?ProjectId=21
Last date of access: June 2018
|
|
Illiterate |
Reads and writes |
Primary |
Preparatory |
Secondary |
Post-secondary |
Short-cycle tertiary |
University or Equivalent |
Higher Diploma |
Master or Equivalent |
Doctorate or Equivalent |
Total |
|
|
|
Males |
0.2 |
1.2 |
4.2 |
11.6 |
39.7 |
1.5 |
5.8 |
29.1 |
0.7 |
5.3 |
0.7 |
100 |
| Emiratis |
Females |
0.1 |
0.1 |
0.8 |
3.4 |
35.5 |
1.6 |
5.7 |
44 |
1.8 |
6 |
1 |
100 |
|
Total |
0.2 |
0.8 |
2.9 |
8.6 |
38.1 |
1.5 |
5.7 |
34.7 |
1.1 |
5.6 |
0.8 |
100 |
|
Males |
2.9 |
9.8 |
11 |
17.3 |
24.5 |
1.9 |
3.8 |
22.2 |
0.7 |
5.7 |
0.2 |
100 |
| Non-Emiratis |
Females |
1.1 |
6.2 |
6.5 |
7.2 |
15.3 |
1 |
4.5 |
46.1 |
0.8 |
10.8 |
0.5 |
100 |
|
Total |
2.6 |
9.2 |
10.2 |
15.6 |
22.9 |
1.8 |
3.9 |
26.1 |
0.8 |
6.6 |
0.3 |
100 |
|
Males |
2.8 |
9.6 |
10.8 |
17.1 |
25 |
1.9 |
3.9 |
22.3 |
0.7 |
5.7 |
0.2 |
100 |
| Total |
Females |
1.1 |
5.7 |
6 |
6.9 |
16.9 |
1 |
4.6 |
45.9 |
0.9 |
10.4 |
0.6 |
100 |
|
Total |
2.5 |
8.9 |
10 |
15.3 |
23.5 |
1.7 |
4 |
26.5 |
0.8 |
6.5 |
0.3 |
100 |
Source : Dubai Statistics Center – Labour Force Survey 2017
ANNEXED NOTE
1. Characteristics of data, definitions
DSC has been conducting Labour Force Surveys on Dubai Emirate in 2008, 2009, 2011 and yearly since 2012.
Sample of LFS 2017: 3,000 households (1,500 Emirati households and 1,500 non-Emirati households) and 1,000 workers from labour gatherings.
Date of reference: ? 2017.
The time reference of the survey is:
Visit day is the time reference for the family personal data.
The week ended on the visit day is the time reference for the employment status (employed / unemployed).
Month ended on the visit day is the time reference for job search.
The two years ended on the visit day represent the time reference for training of people who are unemployed and seeking a job.
Classification used: International Standard Classification of Education Fields of Education and Training (ISCED-F 2013).
2. Institution which provides data
Dubai Statistics Centre (DSC).
3. Data availability
Some tabulations of the results of Dubai Labour Force Surveys are available (in English and in Arabic, PDF and Word formats) at:
https://www.dsc.gov.ae/en-us/Themes/Pages/Labour.aspx?Theme=41&year=2017#DSC_Tab1
A summary volume of tables and analysis from 2017 and earlier Labour Force Surveys appear in publications (PDF format, in Arabic only):
https://www.dsc.gov.ae/en-us/Themes/Pages/Labour.aspx?Theme=41&year=2017#DSC_Tab2
Some tables (in PDF format), definition of concepts and partial methodological indications are available in the LFS’ project page on DSC’s website:
https://www.dsc.gov.ae/en-us/Programs-Statistical-Surveys/Pages/Statistical-Project-details.aspx?ProjectId=21
Last date of access: June 2018
|
|
Age groups |
|
|
15-19 |
20-24 |
25-29 |
30-34 |
35-39 |
40-44 |
45-49 |
50-54 |
55-59 |
60-64 |
65 and + |
Total |
|
Males |
1.1 |
12.1 |
17.3 |
17 |
17.5 |
12.7 |
9.1 |
6.2 |
3.4 |
1.9 |
1.7 |
100 |
| Emiratis |
Females |
1.2 |
10.5 |
27 |
22 |
15.5 |
12.1 |
7.2 |
2.1 |
1.7 |
0.6 |
0.1 |
100 |
|
Total |
1.1 |
11.5 |
20.9 |
18.9 |
16.7 |
12.5 |
8.4 |
4.7 |
2.8 |
1.4 |
1.1 |
100 |
|
Males |
0.5 |
8.6 |
19.5 |
21.6 |
17.1 |
13.1 |
9.2 |
5.6 |
3.2 |
1.1 |
0.5 |
100 |
| Non-Emiratis |
Females |
0.4 |
8.5 |
18.9 |
22.3 |
20.5 |
14.1 |
8 |
3 |
3.1 |
0.7 |
0.5 |
100 |
|
Total |
0.4 |
8.6 |
19.4 |
21.7 |
17.7 |
13.3 |
9 |
5.1 |
3.2 |
1.1 |
0.5 |
100 |
|
Males |
0.5 |
8.7 |
19.4 |
21.5 |
17.1 |
13.1 |
9.2 |
5.6 |
3.2 |
1.2 |
0.5 |
100 |
| Total |
Females |
0.5 |
8.7 |
19.6 |
22.1 |
20.1 |
14 |
7.9 |
2.9 |
3 |
0.7 |
0.5 |
100 |
|
Total |
0.5 |
8.7 |
19.4 |
21.6 |
17.7 |
13.2 |
9 |
5.1 |
3.2 |
1.1 |
0.5 |
100 |
Source : Dubai Statistics Center – Labour Force Survey 2017
ANNEXED NOTE
1. Characteristics of data, definitions
DSC has been conducting Labour Force Surveys on Dubai Emirate in 2008, 2009, 2011 and yearly since 2012.
Sample of LFS 2017: 3,000 households (1,500 Emirati households and 1,500 non-Emirati households) and 1,000 workers from labour gatherings.
Date of reference: ? 2017.
The time reference of the survey is:
Visit day is the time reference for the family personal data.
The week ended on the visit day is the time reference for the employment status (employed / unemployed).
Month ended on the visit day is the time reference for job search.
The two years ended on the visit day represent the time reference for training of people who are unemployed and seeking a job.
2. Institution which provides data
Dubai Statistics Centre (DSC).
3. Data availability
Some tabulations of the results of Dubai Labour Force Surveys are available (in English and in Arabic, PDF and Word formats) at:
https://www.dsc.gov.ae/en-us/Themes/Pages/Labour.aspx?Theme=41&year=2017#DSC_Tab1
A summary volume of tables and analysis from 2017 and earlier Labour Force Surveys appear in publications (PDF format, in Arabic only):
https://www.dsc.gov.ae/en-us/Themes/Pages/Labour.aspx?Theme=41&year=2017#DSC_Tab2
Some tables (in PDF format), definition of concepts and partial methodological indications are available in the LFS’ project page on DSC’s website:
https://www.dsc.gov.ae/en-us/Programs-Statistical-Surveys/Pages/Statistical-Project-details.aspx?ProjectId=21
Last date of access: June 2018
|
|
Employer |
Self Employed |
Salaried |
Work for family with pay |
Total |
|
|
|
Males |
5.3 |
1.3 |
93.4 |
0 |
100 |
| Emiratis |
Females |
1.4 |
0.3 |
98.3 |
0 |
100 |
|
Total |
3.8 |
0.9 |
95.3 |
0 |
100 |
|
Males |
3.5 |
0.6 |
95.9 |
0 |
100 |
| Non-Emiratis |
Females |
2.8 |
1.3 |
95.9 |
0 |
100 |
|
Total |
3.4 |
0.7 |
95.9 |
0 |
100 |
|
Males |
3.6 |
0.6 |
95.8 |
0 |
100 |
| Total |
Females |
2.7 |
1.2 |
96.1 |
0 |
100 |
|
Total |
3.4 |
0.7 |
95.9 |
0 |
100 |
Source : Dubai Statistics Center – Labour Force Survey 2017
ANNEXED NOTE
1. Characteristics of data, definitions
DSC has been conducting Labour Force Surveys on Dubai Emirate in 2008, 2009, 2011 and yearly since 2012.
Sample of LFS 2017: 3,000 households (1,500 Emirati households and 1,500 non-Emirati households) and 1,000 workers from labour gatherings.
Date of reference: ? 2017.
The time reference of the survey is:
Visit day is the time reference for the family personal data.
The week ended on the visit day is the time reference for the employment status (employed / unemployed).
Month ended on the visit day is the time reference for job search.
The two years ended on the visit day represent the time reference for training of people who are unemployed and seeking a job.
2. Institution which provides data
Dubai Statistics Centre (DSC).
3. Data availability
Some tabulations of the results of Dubai Labour Force Surveys are available (in English and in Arabic, PDF and Word formats) at:
https://www.dsc.gov.ae/en-us/Themes/Pages/Labour.aspx?Theme=41&year=2017#DSC_Tab1
A summary volume of tables and analysis from 2017 and earlier Labour Force Surveys appear in publications (PDF format, in Arabic only):
https://www.dsc.gov.ae/en-us/Themes/Pages/Labour.aspx?Theme=41&year=2017#DSC_Tab2
Some tables (in PDF format), definition of concepts and partial methodological indications are available in the LFS’ project page on DSC’s website:
https://www.dsc.gov.ae/en-us/Programs-Statistical-Surveys/Pages/Statistical-Project-details.aspx?ProjectId=21
Last date of access: June 2018
|
Emiratis |
Non-Emiratis |
Total |
|
Males |
Females |
Total |
Males |
Females |
Total |
Males |
Females |
Total |
| Agriculture, forestry and fishing |
0.1 |
0 |
0.1 |
0 |
0 |
0 |
0 |
0 |
0 |
| Mining and quarrying |
0.3 |
0.2 |
0.3 |
0.1 |
0.4 |
0.1 |
0.1 |
0.4 |
0.1 |
| Manufacturing |
2.1 |
1.4 |
1.8 |
9.4 |
2.8 |
8.3 |
9.2 |
2.7 |
8 |
| Electricity, gas, steam and air conditioning supply |
3.5 |
4.7 |
3.9 |
0.2 |
0.2 |
0.2 |
0.3 |
0.6 |
0.4 |
| Water supply; sewerage, waste management and remediation activities |
0 |
0 |
0 |
0.1 |
0.1 |
0.1 |
0.1 |
0.1 |
0.1 |
| Construction |
0.7 |
0.5 |
0.6 |
34.1 |
1.9 |
28.7 |
33.2 |
1.8 |
27.6 |
| Wholesale and retail trade; repair of motor vehicles and motorcycles |
8.2 |
5.9 |
7.4 |
18.9 |
14.7 |
18.3 |
18.7 |
14.1 |
17.9 |
| Transportation and storage |
9 |
5.7 |
7.8 |
7.6 |
4.4 |
7 |
7.6 |
4.5 |
7.1 |
| Accommodation and food service activities |
0.9 |
0.9 |
0.9 |
5.1 |
5.8 |
5.2 |
4.9 |
5.4 |
5 |
| Information and communication |
1.7 |
1.2 |
1.5 |
2.3 |
1.8 |
2.2 |
2.3 |
1.7 |
2.2 |
| Financial and insurance activities |
3.7 |
13.8 |
7.4 |
2 |
5.1 |
2.5 |
2 |
5.8 |
2.7 |
| Real estate activities |
2.7 |
1.8 |
2.3 |
2.5 |
3.2 |
2.6 |
2.5 |
3.1 |
2.6 |
| Professional, scientific and technical activities |
1.7 |
1.4 |
1.6 |
3.8 |
5.1 |
4 |
3.7 |
4.8 |
3.9 |
| Administrative and support service activities |
1.8 |
4.8 |
2.9 |
8.3 |
7 |
8.1 |
8.1 |
6.8 |
7.9 |
| Public administration and defence; compulsory social security |
61.5 |
42.6 |
54.7 |
1.9 |
1.6 |
1.8 |
3.6 |
4.9 |
3.8 |
| Education |
0.4 |
7.9 |
3.1 |
0.7 |
9.8 |
2.3 |
0.7 |
9.7 |
2.3 |
| Human health and social work activities |
0.8 |
4.9 |
2.3 |
1 |
6.7 |
2 |
1 |
6.5 |
2 |
| Arts, entertainment and recreation |
0.7 |
2 |
1.2 |
0.4 |
1.2 |
0.5 |
0.4 |
1.2 |
0.5 |
| Other service activities |
0.2 |
0.3 |
0.2 |
0.8 |
2.2 |
1 |
0.8 |
2 |
1 |
| Activities of households as employers |
0 |
0 |
0 |
0.8 |
26 |
5.1 |
0.8 |
23.9 |
4.9 |
| Activities of extraterritorial organizations and bodies |
0 |
0 |
0 |
0 |
0 |
0 |
0 |
0 |
0 |
| Total |
100 |
100 |
100 |
100 |
100 |
100 |
100 |
100 |
100 |
Source : Dubai Statistics Center – Labour Force Survey 2017
ANNEXED NOTE
1. Characteristics of data, definitions
DSC has been conducting Labour Force Surveys on Dubai Emirate in 2008, 2009, 2011 and yearly since 2012.
Sample of LFS 2017: 3,000 households (1,500 Emirati households and 1,500 non-Emirati households) and 1,000 workers from labour gatherings.
Date of reference: ? 2017.
The time reference of the survey is:
Visit day is the time reference for the family personal data.
The week ended on the visit day is the time reference for the employment status (employed / unemployed).
Month ended on the visit day is the time reference for job search.
The two years ended on the visit day represent the time reference for training of people who are unemployed and seeking a job.
Classification of activities: International Standard Industrial Classification of All Economic Activities, Rev. 4
(ISIC 4.0).
2. Institution which provides data
Dubai Statistics Centre (DSC).
3. Data availability
Some tabulations of the results of Dubai Labour Force Surveys are available (in English and in Arabic, PDF and Word formats) at:
https://www.dsc.gov.ae/en-us/Themes/Pages/Labour.aspx?Theme=41&year=2017#DSC_Tab1
A summary volume of tables and analysis from 2017 and earlier Labour Force Surveys appear in publications (PDF format, in Arabic only):
https://www.dsc.gov.ae/en-us/Themes/Pages/Labour.aspx?Theme=41&year=2017#DSC_Tab2
Some tables (in PDF format), definition of concepts and partial methodological indications are available in the LFS’ project page on DSC’s website:
https://www.dsc.gov.ae/en-us/Programs-Statistical-Surveys/Pages/Statistical-Project-details.aspx?ProjectId=21
Last date of access: June 2018
|
|
Occupation category |
|
|
Managers |
Professionals |
Technicians and associate professionals |
Clerical support workers |
Service and sales workers |
Skilled agricultural, forestry and fishery workers |
Craft and related trades workers |
Plant and machine operators, and assemblers |
Elementary occupations |
Total |
|
Males |
15.2 |
17 |
28.7 |
12.2 |
24.7 |
0.2 |
0.2 |
1.8 |
0 |
100 |
| Emiratis |
Females |
12.9 |
33.3 |
20.3 |
27.4 |
6 |
0 |
0.1 |
0 |
0 |
100 |
|
Total |
14.3 |
23 |
25.7 |
17.8 |
17.8 |
0.1 |
0.1 |
1.2 |
0 |
100 |
|
Males |
8.9 |
10.3 |
10 |
4 |
15 |
0.1 |
29 |
10.9 |
11.8 |
100 |
| Non-Emiratis |
Females |
9.6 |
25.9 |
14.2 |
11.3 |
13.3 |
0 |
0.4 |
0.2 |
25.1 |
100 |
|
Total |
9 |
12.9 |
10.7 |
5.2 |
14.8 |
0.1 |
24.1 |
9.1 |
14.1 |
100 |
|
Males |
9.1 |
10.5 |
10.5 |
4.2 |
15.4 |
0.1 |
28.1 |
10.7 |
11.4 |
100 |
| Total |
Females |
9.8 |
26.5 |
14.7 |
12.6 |
12.7 |
0 |
0.4 |
0.2 |
23.1 |
100 |
|
Total |
9.3 |
13.3 |
11.3 |
5.7 |
14.9 |
0.1 |
23.1 |
8.8 |
13.5 |
100 |
Source : Dubai Statistics Center – Labour Force Survey 2017
ANNEXED NOTE
1. Characteristics of data, definitions
DSC has been conducting Labour Force Surveys on Dubai Emirate in 2008, 2009, 2011 and yearly since 2012.
Sample of LFS 2017: 3,000 households (1,500 Emirati households and 1,500 non-Emirati households) and 1,000 workers from labour gatherings.
Date of reference: ? 2017.
The time reference of the survey is:
Visit day is the time reference for the family personal data.
The week ended on the visit day is the time reference for the employment status (employed / unemployed).
Month ended on the visit day is the time reference for job search.
The two years ended on the visit day represent the time reference for training of people who are unemployed and seeking a job.
Classification of occupations: International Standard Classification of Occupations (ISCO 08).
2. Institution which provides data
Dubai Statistics Centre (DSC).
3. Data availability
Some tabulations of the results of Dubai Labour Force Surveys are available (in English and in Arabic, PDF and Word formats) at:
https://www.dsc.gov.ae/en-us/Themes/Pages/Labour.aspx?Theme=41&year=2017#DSC_Tab1
A summary volume of tables and analysis from 2017 and earlier Labour Force Surveys appear in publications (PDF format, in Arabic only):
https://www.dsc.gov.ae/en-us/Themes/Pages/Labour.aspx?Theme=41&year=2017#DSC_Tab2
Some tables (in PDF format), definition of concepts and partial methodological indications are available in the LFS’ project page on DSC’s website:
https://www.dsc.gov.ae/en-us/Programs-Statistical-Surveys/Pages/Statistical-Project-details.aspx?ProjectId=21
Last date of access: June 2018
| Nationality groups |
Males |
Females |
Total |
| U.A.E |
3.0 |
8.0 |
3.9 |
| AGCC countries |
0.0 |
0.2 |
0.1 |
| Other Arab countries |
6.6 |
9.1 |
7.1 |
| Non Arab Asian countries |
86.1 |
66.1 |
82.5 |
| Non Arab African countries |
1.8 |
10.0 |
3.3 |
| European countries |
1.5 |
5.2 |
2.1 |
| North American countries |
0.6 |
0.4 |
0.5 |
| Caribbean & Central American countries |
0.1 |
0.5 |
0.2 |
| South American countries |
0.1 |
0.1 |
0.1 |
| Oceania (Australia, New Zealand, etc.) |
0.2 |
0.4 |
0.2 |
| Total non-Emiratis |
97.0 |
92.0 |
96.1 |
| Grand total |
100.0 |
100.0 |
100.0 |
Source : Dubai Statistics Center – Labour Force Survey 2017
ANNEXED NOTE
1. Characteristics of data, definitions
DSC has been conducting Labour Force Surveys on Dubai Emirate in 2008, 2009, 2011 and yearly since 2012.
Sample of LFS 2017: 3,000 households (1,500 Emirati households and 1,500 non-Emirati households) and 1,000 workers from labour gatherings.
Date of reference: ? 2017.
The time reference of the survey is:
Visit day is the time reference for the family personal data.
The week ended on the visit day is the time reference for the employment status (employed / unemployed).
Month ended on the visit day is the time reference for job search.
The two years ended on the visit day represent the time reference for training of people who are unemployed and seeking a job.
2. Institution which provides data
Dubai Statistics Centre (DSC).
3. Data availability
Some tabulations of the results of Dubai Labour Force Surveys are available (in English and in Arabic, PDF and Word formats) at:
https://www.dsc.gov.ae/en-us/Themes/Pages/Labour.aspx?Theme=41&year=2017#DSC_Tab1
A summary volume of tables and analysis from 2017 and earlier Labour Force Surveys appear in publications (PDF format, in Arabic only):
https://www.dsc.gov.ae/en-us/Themes/Pages/Labour.aspx?Theme=41&year=2017#DSC_Tab2
Some tables (in PDF format), definition of concepts and partial methodological indications are available in the LFS’ project page on DSC’s website:
https://www.dsc.gov.ae/en-us/Programs-Statistical-Surveys/Pages/Statistical-Project-details.aspx?ProjectId=21
Last date of access: June 2018
| Nationality |
|
In the labour force |
Outside the labour force |
Grand Total |
|
Employed |
Unemployed |
Total in labour force |
Housewife |
Student |
Disabled |
Retired |
Other |
Total |
|
Seeking work for 1st time |
Unpd. with previous employment |
| Qatari |
Males |
65,023 |
84 |
28 |
65,135 |
0 |
17,532 |
1,008 |
10,492 |
857 |
29,889 |
95,024 |
|
Females |
36,394 |
252 |
0 |
36,646 |
28,500 |
24,201 |
1,933 |
5,937 |
2,045 |
62,616 |
99,262 |
|
Total |
101,417 |
336 |
28 |
101,781 |
28,500 |
41,733 |
2,941 |
16,429 |
2,902 |
92,505 |
194,286 |
| Non-Qatari |
Males |
1,716,529 |
808 |
130 |
1,717,467 |
0 |
30,664 |
1,796 |
0 |
3,325 |
35,785 |
1,753,252 |
|
Females |
234,467 |
1,528 |
116 |
236,111 |
91,445 |
26,801 |
1,472 |
0 |
4,028 |
123,746 |
359,857 |
|
Total |
1,950,996 |
2,336 |
246 |
1,953,578 |
91,445 |
57,465 |
3,268 |
0 |
7,353 |
159,531 |
2,113,109 |
| Total |
Males |
1,781,552 |
892 |
158 |
1,782,602 |
0 |
48,196 |
2,804 |
10,492 |
4,182 |
65,674 |
1,848,276 |
|
Females |
270,861 |
1,780 |
116 |
272,757 |
119,945 |
51,002 |
3,405 |
5,937 |
6,073 |
186,362 |
459,119 |
|
Total |
2,052,413 |
2,672 |
274 |
2,055,359 |
119,945 |
99,198 |
6,209 |
16,429 |
10,255 |
252,036 |
2,307,395 |
Source: Annual Bulletin of Labor Force Sample survey 2016
ANNEXED NOTE
1. Technical Notes and Definitions
The data is taken from 2016 Labour Force Survey (yearly synthesis)
Sampling frame of LFS 2016: Population Census 2010.
Sample size: 60,016 persons, in 9,199 households: 1- Qatari households; 2- Non-Qatari regular (non-collective) households;
3- Non-Qatari small collective households or labour gatherings (2 – 6 persons); 4- Non-Qatari large collective households or large labour gatherings (7 persons or more).
Data Collection: The sample was divided into equal parts to collect data monthly. Each month 1/3 of the quarterly data were collected during the first two weeks of the month.
Reference period for the labour force data: the week prior to data collection day.
Population of reference: all Qatari and non-Qatari households present in Qatar on the night of survey, living in normal and collective households.
The collective households are a group of persons not related to each other and sharing living conditions in a residential unit, I.e. labour camps, students living boarding
schools, nurses in hospitals… etc. The survey covered the small collective households (includes less than 7 persons) and large collective households (includes 7 persons or more).
The survey did not cover short periods accommodation, i.e. hotels.
Relation to labour force (for persons aged 15 and above)
In the labour force (= economically active).
1) Employed.
All persons aged 15 years and above, who during the week preceding the survey:
a) Perform a work for a wage, salary, profits or household gains, whether it was in cash or in kind.
b) Are temporarily not employed, however, they still have an official relation with their work
2) Unemployed.
All persons aged 15 years and over who were, during the week preceding the survey, without employment, willing to work and looking seriously for a job.
There is a distinction between two kinds of unemployed persons:
a) First time unemployed: They are the persons who never worked previously, and were during the week preceding the survey looking actively for work.
b) Unemployed who previously worked: They are the persons with a work experience, who during the week preceding the survey were actively looking for a job
Outside the labour force (=economically inactive):
Full-time student: The person (15 years or older) enrolled in any educational institution as a full-time persistent student with purpose of attaining an academic degree, irrespective of whether the schooling hours are in the morning or evening. Any trainee enrolled in vocational training institutes is regarded as a full-time student.
Full-time housewife: The female (15 years or older) who is fully engaged in home management and family care, and does not practice any other work
Retired: The person who does not look for a job during the week preceding the survey and gets a fixed pension for work he/she had joined before
Disabled: The person (15 years or older) who is not capable of work due to illness, handicap or old age.
Others: Those able to work but not willing to, not enrolled in education, as well as any other cases encountered by the enumerator other than the above mentioned.
2. Institution which provides data
Ministry of Development Planning and Statistics
(http://www.mdps.gov.qa/en/pages/default.aspx)
3. Data availability
The Statistics Authority conducted the first labour Force Sample Survey in 2001. Starting from 2006, the execution of these surveys came to be on annual basis, and on a quarterly basis since 2013.
Labour Force Surveys (yearly and quarterly data) can be downloaded from MDPS’s website, in PDF and Excel format:
http://www.mdps.gov.qa/en/statistics1/pages/topicslisting.aspx?parent=Social&child=LaborForce
Last date of access: May 2018.
|
Qataris |
Non-Qataris |
Total |
|
Males |
Females |
Total |
Males |
Females |
Total |
Males |
Females |
Total |
|
Paid employment workers |
Average Work Hours |
Paid employment workers |
Average Work Hours |
Paid employment workers |
Average Work Hours |
Paid employment workers |
Average Work Hours |
Paid employment workers |
Average Work Hours |
Paid employment workers |
Average Work Hours |
Paid employment workers |
Average Work Hours |
Paid employment workers |
Average Work Hours |
Paid employment workers |
Average Work Hours |
| Legislators, Senior Officials and Managers |
8,025 |
41 |
2,002 |
39 |
10,027 |
41 |
28,269 |
47 |
4,359 |
42 |
32,628 |
46 |
36,294 |
44 |
6,361 |
40 |
42,655 |
43 |
| Professionals |
13,870 |
40 |
15,775 |
38 |
29,645 |
39 |
116,463 |
45 |
39,516 |
42 |
155,979 |
44 |
130,333 |
44 |
55,291 |
40 |
185,624 |
42 |
| Technicians and Associate Professionals |
11,250 |
41 |
5,326 |
38 |
16,576 |
40 |
111,123 |
47 |
10,119 |
44 |
121,242 |
47 |
122,373 |
45 |
15,445 |
40 |
137,818 |
44 |
| Clerks |
15,113 |
40 |
10,043 |
38 |
25,156 |
39 |
60,588 |
47 |
23,183 |
47 |
83,771 |
47 |
75,701 |
44 |
33,226 |
42 |
108,927 |
43 |
| Service Workers and Shop and Market Sales Workers |
5,813 |
40 |
2,086 |
38 |
7,899 |
40 |
139,720 |
51 |
46,679 |
53 |
186,399 |
52 |
145,533 |
49 |
48,765 |
52 |
194,298 |
51 |
| Skilled Agricultural And Fishery Workers |
0 |
0 |
0 |
0 |
0 |
0 |
25,250 |
53 |
0 |
0 |
25,250 |
53 |
25,250 |
53 |
0 |
0 |
25,250 |
53 |
| Craft and Related Trades Workers |
5,490 |
41 |
0 |
0 |
5,490 |
41 |
665,828 |
51 |
463 |
49 |
666,291 |
51 |
671,318 |
50 |
463 |
49 |
671,781 |
50 |
| Plant and Machine Operators and Assemblers |
1,443 |
41 |
0 |
0 |
1,443 |
41 |
291,601 |
54 |
721 |
55 |
292,322 |
54 |
293,044 |
54 |
721 |
55 |
293,765 |
54 |
| Elementary Occupations |
3,487 |
40 |
616 |
38 |
4,103 |
40 |
276,530 |
50 |
108,523 |
58 |
385,053 |
55 |
280,017 |
50 |
109,139 |
57 |
389,156 |
54 |
| Total |
64,491 |
40 |
35,848 |
38 |
100,339 |
40 |
1,715,372 |
51 |
233,563 |
54 |
1,948,935 |
52 |
1,779,863 |
49 |
269,411 |
51 |
2,049,274 |
50 |
Source: Annual Bulletin of Labor Force Sample survey 2016
ANNEXED NOTE
1. Technical Notes and Definitions
The data is taken from 2016 Labour Force Survey (yearly synthesis)
Sampling frame of LFS 2016: Population Census 2010.
Sample size: 60,016 persons, in 9,199 households: 1- Qatari households; 2- Non-Qatari regular (non-collective) households;
3- Non-Qatari small collective households or labour gatherings (2 – 6 persons); 4- Non-Qatari large collective households or large labour gatherings (7 persons or more).
Data Collection: The sample was divided into equal parts to collect data monthly. Each month 1/3 of the quarterly data were collected during the first two weeks of the month.
Reference period for the labour force data: the week prior to data collection day.
Population of reference: all Qatari and non-Qatari households present in Qatar on the night of survey, living in normal and collective households.
The collective households are a group of persons not related to each other and sharing living conditions in a residential unit, I.e. labour camps, students living boarding
schools, nurses in hospitals… etc. The survey covered the small collective households (includes less than 7 persons) and large collective households (includes 7 persons or more).
The survey did not cover short periods accommodation, i.e. hotels.
The present data concerns employed population in paid employment:
The persons who had work, whether they were working or temporarily not working, and performing their work in exchange for wage and salary, whether in cash or in kind.
2. Institution which provides data
Ministry of Development Planning and Statistics
(http://www.mdps.gov.qa/en/pages/default.aspx)
3. Data availability
The Statistics Authority conducted the first labour Force Sample Survey in 2001. Starting from 2006, the execution of these surveys came to be on annual basis, and on a quarterly basis since 2013.
Labour Force Surveys (yearly and quarterly data) can be downloaded from MDPS’s website, in PDF and Excel format:
http://www.mdps.gov.qa/en/statistics1/pages/topicslisting.aspx?parent=Social&child=LaborForce
Last date of access: May 2018.
|
Average weekly work hours |
Average monthly wage (Q.R.) |
Total |
| Qatari males |
40 |
35,173 |
64,491 |
| Qatari females |
38 |
27,137 |
35,848 |
| Non-Qatari males |
51 |
6,950 |
1,715,372 |
| Non-Qatari females |
54 |
5,033 |
233,563 |
| Total males |
49 |
11,166 |
1,779,863 |
| Total females |
51 |
9,845 |
269,411 |
| Total |
50 |
10,793 |
2,049,274 |
Source: Annual Bulletin of Labor Force Sample survey 2016
ANNEXED NOTE
1. Technical Notes and Definitions
The data is taken from 2016 Labour Force Survey (yearly synthesis)
Sampling frame of LFS 2016: Population Census 2010.
Sample size: 60,016 persons, in 9,199 households: 1- Qatari households; 2- Non-Qatari regular (non-collective) households;
3- Non-Qatari small collective households or labour gatherings (2 – 6 persons); 4- Non-Qatari large collective households or large labour gatherings (7 persons or more).
Data Collection: The sample was divided into equal parts to collect data monthly. Each month 1/3 of the quarterly data were collected during the first two weeks of the month.
Reference period for the labour force data: the week prior to data collection day.
Population of reference: all Qatari and non-Qatari households present in Qatar on the night of survey, living in normal and collective households.
The collective households are a group of persons not related to each other and sharing living conditions in a residential unit, I.e. labour camps, students living boarding
schools, nurses in hospitals… etc. The survey covered the small collective households (includes less than 7 persons) and large collective households (includes 7 persons or more).
The survey did not cover short periods accommodation, i.e. hotels.
The present data concerns employed population in paid employment:
The persons who have work, whether they were working or temporarily not working, and performing their work in exchange for wage and salary, whether in cash or in kind.
It is worth noting that the wage amount comprises all cash payments due to the employees, before deducting their contribution to social security schemes,
including taxes and the like, payable at regular weekly, monthly or others intervals, including piecework payments, special allowances for working away from home
or in hazardous circumstances. Also included here allowances payable regularly such as housing, travel allowances as well as salaries payable to employees away from work for short period
e.g. on holiday or as a result of a temporary halt to production. Commissions, gratuities and tips received by the employees are also included
(See Bulletin of Employment, Wages & Working Hours 2005: https://www.mdps.gov.qa/en/statistics/Statistical%20Releases/Social/EmploymentWagesAndWorkingHours/2005/Employment_Wages_Working_Hours_QSA_Bu_AE_2005.pdf)
1 Qatari Riyal = 0.27465 U.S.$ (May 2018).
2. Institution which provides data
Ministry of Development Planning and Statistics
(http://www.mdps.gov.qa/en/pages/default.aspx)
3. Data availability
The Statistics Authority conducted the first labour Force Sample Survey in 2001. Starting from 2006, the execution of these surveys came to be on annual basis, and on a quarterly basis since 2013.
Labour Force Surveys (yearly and quarterly data) can be downloaded from MDPS’s website, in PDF and Excel format:
http://www.mdps.gov.qa/en/statistics1/pages/topicslisting.aspx?parent=Social&child=LaborForce
Figures of wages disagregated by nationality are only available in the Statistical Analysis of Labor Force Sample Survey 2016, p. 18.
https://www.mdps.gov.qa/en/statistics/Statistical%20Releases/Social/LaborForce/2016/labor_force_statistical_analysis_2016_En.pdf
Last date of access: May 2018.
|
Qatari |
Non-Qatari |
Total |
|
Males |
Females |
Total |
Males |
Females |
Total |
Males |
Females |
Total |
| Agriculture, forestry and fishing |
28 |
0 |
28 |
24,888 |
0 |
24,888 |
24,916 |
0 |
24,916 |
| Mining and quarrying |
8,140 |
1,989 |
10,129 |
85,761 |
4,650 |
90,411 |
93,901 |
6,639 |
100,540 |
| Manufacturing |
882 |
350 |
1,232 |
140,968 |
1,843 |
142,811 |
141,850 |
2,193 |
144,043 |
| Electricity, gas, steam and air conditioning supply |
1,555 |
980 |
2,535 |
14,289 |
545 |
14,834 |
15,844 |
1,525 |
17,369 |
| Water supply; sewerage, waste management and remediation activities |
308 |
350 |
658 |
8,270 |
254 |
8,524 |
8,578 |
604 |
9,182 |
| Construction |
1,359 |
126 |
1,485 |
839,461 |
6,306 |
845,767 |
840,820 |
6,432 |
847,252 |
| Wholesale and retail trade; repair of motor vehicles and motorcycles |
1,148 |
1,204 |
2,352 |
226,232 |
26,348 |
252,580 |
227,380 |
27,552 |
254,932 |
| Transportation and storage |
1,080 |
759 |
1,839 |
47,547 |
9,733 |
57,280 |
48,627 |
10,492 |
59,119 |
| Accommodation and food service activities |
336 |
504 |
840 |
55,072 |
16,770 |
71,842 |
55,408 |
17,274 |
72,682 |
| Information and communication |
2,143 |
812 |
2,955 |
11,010 |
1,648 |
12,658 |
13,153 |
2,460 |
15,613 |
| Financial and insurance activities |
1,976 |
2,212 |
4,188 |
7,910 |
3,640 |
11,550 |
9,886 |
5,852 |
15,738 |
| Real estate activities |
476 |
168 |
644 |
10,929 |
604 |
11,533 |
11,405 |
772 |
12,177 |
| Professional, scientific and technical activities |
210 |
140 |
350 |
25,248 |
3,221 |
28,469 |
25,458 |
3,361 |
28,819 |
| Administrative and support service activities |
616 |
448 |
1,064 |
78,433 |
5,352 |
83,785 |
79,049 |
5,800 |
84,849 |
| Public administration and defence; compulsory social security |
39,455 |
12,064 |
51,519 |
32,401 |
3,361 |
35,762 |
71,856 |
15,425 |
87,281 |
| Education |
2,186 |
10,059 |
12,245 |
11,285 |
23,523 |
34,808 |
13,471 |
33,582 |
47,053 |
| Human health and social work activities |
1,834 |
3,403 |
5,237 |
11,899 |
12,823 |
24,722 |
13,733 |
16,226 |
29,959 |
| Arts, entertainment and recreation |
812 |
504 |
1,316 |
4,584 |
380 |
4,964 |
5,396 |
884 |
6,280 |
| Other service activities |
379 |
266 |
645 |
11,045 |
4,502 |
15,547 |
11,424 |
4,768 |
16,192 |
| Activities of households as employers; undifferentiated goods- and services-producing activities of households for own use |
0 |
0 |
0 |
66,121 |
107,621 |
173,742 |
66,121 |
107,621 |
173,742 |
| Activities of extraterritorial organizations and bodies |
128 |
56 |
184 |
3,306 |
1,459 |
4,765 |
3,434 |
1,515 |
4,949 |
| Total |
65,051 |
36,394 |
101,445 |
1,716,659 |
234,583 |
1,951,242 |
1,781,710 |
270,977 |
2,052,687 |
Source: Annual Bulletin of Labor Force Sample survey 2016
ANNEXED NOTE
1. Technical Notes and Definitions
The data is taken from 2016 Labour Force Survey (yearly synthesis)
Sampling frame of LFS 2016: Population Census 2010.
Sample size: 60,016 persons, in 9,199 households: 1- Qatari households; 2- Non-Qatari regular (non-collective) households;
3- Non-Qatari small collective households or labour gatherings (2 – 6 persons); 4- Non-Qatari large collective households or large labour gatherings (7 persons or more).
Data Collection: The sample was divided into equal parts to collect data monthly. Each month 1/3 of the quarterly data were collected during the first two weeks of the month.
Reference period for the labour force data: the week prior to data collection day.
Population of reference: all Qatari and non-Qatari households present in Qatar on the night of survey, living in normal and collective households.
The collective households are a group of persons not related to each other and sharing living conditions in a residential unit, I.e. labour camps, students living boarding
schools, nurses in hospitals… etc. The survey covered the small collective households (includes less than 7 persons) and large collective households (includes 7 persons or more).
The survey did not cover short periods accommodation, i.e. hotels.
The present data includes active population, i.e. employed and unemployed. It does not include persons seeking work for the first time
Relation to labour force (for persons aged 15 and above)
In the labour force (= economically active).
1) Employed.
All persons aged 15 years and above, who during the week preceding the survey:
a) Perform a work for a wage, salary, profits or household gains, whether it was in cash or in kind.
b) Are temporarily not employed, however, they still have an official relation with their work
2) Unemployed.
All persons aged 15 years and over who were, during the week preceding the survey, without employment, willing to work and looking seriously for a job.
There is a distinction between two kinds of unemployed persons:
a) First time unemployed: They are the persons who never worked previously, and were during the week preceding the survey looking actively for work.
b) Unemployed who previously worked: They are the persons with a work experience, who during the week preceding the survey were actively looking for a job
Classification of economic activities: ISIC Rev. 4.
2. Institution which provides data
Ministry of Development Planning and Statistics
(http://www.mdps.gov.qa/en/pages/default.aspx)
3. Data availability
The Statistics Authority conducted the first labour Force Sample Survey in 2001. Starting from 2006, the execution of these surveys came to be on annual basis, and on a quarterly basis since 2013.
Labour Force Surveys (yearly and quarterly data) can be downloaded from MDPS’s website, in PDF and Excel format:
http://www.mdps.gov.qa/en/statistics1/pages/topicslisting.aspx?parent=Social&child=LaborForce
Last date of access: May 2018.
|
Qataris |
Non-Qataris |
Total |
|
Males |
Females |
Total |
Males |
Females |
Total |
Males |
Females |
Total |
| Government Department |
44,497 |
24,574 |
69,071 |
53,807 |
14,722 |
68,529 |
98,304 |
39,296 |
137,600 |
| Government Company/ Corporation |
8,815 |
4,358 |
13,173 |
49,754 |
8,456 |
58,210 |
58,569 |
12,814 |
71,383 |
| Mixed |
5,743 |
2,828 |
8,571 |
43,617 |
5,370 |
48,987 |
49,360 |
8,198 |
57,558 |
| Private |
5,685 |
4,368 |
10,053 |
1,497,088 |
95,489 |
1,592,577 |
1,502,773 |
99,857 |
1,602,630 |
| Diplomatic/International/Regi-onal |
128 |
56 |
184 |
3,306 |
1,459 |
4,765 |
3,434 |
1,515 |
4,949 |
| Non profit |
183 |
210 |
393 |
2,966 |
1,466 |
4,432 |
3,149 |
1,676 |
4,825 |
| Domestic |
0 |
0 |
0 |
66,121 |
107,621 |
173,742 |
66,121 |
107,621 |
173,742 |
| Total |
65,051 |
36,394 |
101,445 |
1,716,659 |
234,583 |
1,951,242 |
1,781,710 |
270,977 |
2,052,687 |
Source: Annual Bulletin of Labor Force Sample survey 2016
ANNEXED NOTE
1. Technical Notes and Definitions
The data is taken from 2016 Labour Force Survey (yearly synthesis)
Sampling frame of LFS 2016: Population Census 2010.
Sample size: 60,016 persons, in 9,199 households: 1- Qatari households; 2- Non-Qatari regular (non-collective) households;
3- Non-Qatari small collective households or labour gatherings (2 – 6 persons); 4- Non-Qatari large collective households or large labour gatherings (7 persons or more).
Data Collection: The sample was divided into equal parts to collect data monthly. Each month 1/3 of the quarterly data were collected during the first two weeks of the month.
Reference period for the labour force data: the week prior to data collection day.
Population of reference: all Qatari and non-Qatari households present in Qatar on the night of survey, living in normal and collective households.
The collective households are a group of persons not related to each other and sharing living conditions in a residential unit, I.e. labour camps, students living boarding
schools, nurses in hospitals… etc. The survey covered the small collective households (includes less than 7 persons) and large collective households (includes 7 persons or more).
The survey did not cover short periods accommodation, i.e. hotels.
The present data includes active population, i.e. employed and unemployed. It does not include persons seeking work for the first time
Relation to labour force (for persons aged 15 and above)
In the labour force (= economically active).
1) Employed.
All persons aged 15 years and above, who during the week preceding the survey:
a) Perform a work for a wage, salary, profits or household gains, whether it was in cash or in kind.
b) Are temporarily not employed, however, they still have an official relation with their work
2) Unemployed.
All persons aged 15 years and over who were, during the week preceding the survey, without employment, willing to work and looking seriously for a job.
There is a distinction between two kinds of unemployed persons:
a) First time unemployed: They are the persons who never worked previously, and were during the week preceding the survey looking actively for work.
b) Unemployed who previously worked: They are the persons with a work experience, who during the week preceding the survey were actively looking for a job
2. Institution which provides data
Ministry of Development Planning and Statistics
(http://www.mdps.gov.qa/en/pages/default.aspx)
3. Data availability
The Statistics Authority conducted the first labour Force Sample Survey in 2001. Starting from 2006, the execution of these surveys came to be on annual basis, and on a quarterly basis since 2013.
Labour Force Surveys (yearly and quarterly data) can be downloaded from MDPS’s website, in PDF and Excel format:
http://www.mdps.gov.qa/en/statistics1/pages/topicslisting.aspx?parent=Social&child=LaborForce
Last date of access: May 2018.
|
Qatari |
Non-Qatari |
Total |
|
Males |
Females |
Total |
Males |
Females |
Total |
Males |
Females |
Total |
| Legislators, Senior Officials And Managers |
8,081 |
2,030 |
10,111 |
28,269 |
4,373 |
32,642 |
36,350 |
6,403 |
42,753 |
| Professionals |
13,968 |
16,055 |
30,023 |
116,873 |
40,220 |
157,093 |
130,841 |
56,275 |
187,116 |
| Technicians And Associate Professionals |
11,404 |
5,340 |
16,744 |
111,169 |
10,193 |
121,362 |
122,573 |
15,533 |
138,106 |
| Clerks |
15,211 |
10,211 |
25,422 |
60,648 |
23,243 |
83,891 |
75,859 |
33,454 |
109,313 |
| Service Workers And Shop And Market Sales Workers |
5,869 |
2,142 |
8,011 |
139,776 |
46,693 |
186,469 |
145,645 |
48,835 |
194,480 |
| Skilled Agricultural And Fishery Workers |
0 |
0 |
0 |
25,250 |
0 |
25,250 |
25,250 |
0 |
25,250 |
| Craft And Related Trades Workers |
5,546 |
0 |
5,546 |
666,320 |
463 |
666,783 |
671,866 |
463 |
672,329 |
| Plant And Machine Operators And Assemblers |
1,457 |
0 |
1,457 |
291,727 |
721 |
292,448 |
293,184 |
721 |
293,905 |
| Elementary Occupations |
3,515 |
616 |
4,131 |
276,627 |
108,677 |
385,304 |
280,142 |
109,293 |
389,435 |
| Total |
65,051 |
36,394 |
101,445 |
1,716,659 |
234,583 |
1,951,242 |
1,781,710 |
270,977 |
2,052,687 |
Source: Annual Bulletin of Labor Force Sample survey 2016
ANNEXED NOTE
1. Technical Notes and Definitions
The data is taken from 2016 Labour Force Survey (yearly synthesis)
Sampling frame of LFS 2016: Population Census 2010.
Sample size: 60,016 persons, in 9,199 households: 1- Qatari households; 2- Non-Qatari regular (non-collective) households;
3- Non-Qatari small collective households or labour gatherings (2 – 6 persons); 4- Non-Qatari large collective households or large labour gatherings (7 persons or more).
Data Collection: The sample was divided into equal parts to collect data monthly. Each month 1/3 of the quarterly data were collected during the first two weeks of the month.
Reference period for the labour force data: the week prior to data collection day.
Population of reference: all Qatari and non-Qatari households present in Qatar on the night of survey, living in normal and collective households.
The collective households are a group of persons not related to each other and sharing living conditions in a residential unit, I.e. labour camps, students living boarding
schools, nurses in hospitals… etc. The survey covered the small collective households (includes less than 7 persons) and large collective households (includes 7 persons or more).
The survey did not cover short periods accommodation, i.e. hotels.
The present data includes active population, i.e. employed and unemployed. It does not include persons seeking work for the first time
Relation to labour force (for persons aged 15 and above)
In the labour force (= economically active).
1) Employed.
All persons aged 15 years and above, who during the week preceding the survey:
a) Perform a work for a wage, salary, profits or household gains, whether it was in cash or in kind.
b) Are temporarily not employed, however, they still have an official relation with their work
2) Unemployed.
All persons aged 15 years and over who were, during the week preceding the survey, without employment, willing to work and looking seriously for a job.
There is a distinction between two kinds of unemployed persons:
a) First time unemployed: They are the persons who never worked previously, and were during the week preceding the survey looking actively for work.
b) Unemployed who previously worked: They are the persons with a work experience, who during the week preceding the survey were actively looking for a job
2. Institution which provides data
Ministry of Development Planning and Statistics
(http://www.mdps.gov.qa/en/pages/default.aspx)
3. Data availability
The Statistics Authority conducted the first labour Force Sample Survey in 2001. Starting from 2006, the execution of these surveys came to be on annual basis, and on a quarterly basis since 2013.
Labour Force Surveys (yearly and quarterly data) can be downloaded from MDPS’s website, in PDF and Excel format:
http://www.mdps.gov.qa/en/statistics1/pages/topicslisting.aspx?parent=Social&child=LaborForce
Last date of access: May 2018.
|
occupation/ profession |
| Legislators, Senior Officials and Managers |
Professionals |
Technicians and Associate Professionals |
Clerks |
Service Workers and Shop and Market Sales Workers |
Skilled Agricultural and Fishery Workers |
Craft and Related Trades Workers |
Plant and Machine Operators And Assemblers |
Elementary Occupations |
Total |
| Agriculture, forestry and fishing |
68 |
292 |
295 |
39 |
603 |
17,485 |
2,607 |
1,703 |
1,824 |
24,916 |
| Mining and quarrying |
3,801 |
13,101 |
9,735 |
4,129 |
5,812 |
0 |
42,724 |
8,852 |
12,386 |
100,540 |
| Manufacturing |
2,470 |
11,118 |
15,159 |
4,872 |
6,082 |
0 |
59,543 |
32,231 |
12,568 |
144,043 |
| Electricity, gas, steam and air conditioning supply |
598 |
3,114 |
1,820 |
1,463 |
2,507 |
0 |
5,255 |
1,538 |
1,074 |
17,369 |
| Water supply; sewerage, waste management and remediation activities |
176 |
1,127 |
556 |
602 |
381 |
0 |
3,545 |
620 |
2,175 |
9,182 |
| Construction |
7,998 |
36,923 |
46,086 |
17,554 |
8,841 |
629 |
461,554 |
114,787 |
152,880 |
847,252 |
| Wholesale and retail trade; repair of motor vehicles and motorcycles |
8,499 |
18,635 |
15,290 |
20,149 |
68,667 |
1,813 |
63,777 |
29,388 |
28,714 |
254,932 |
| Transportation and storage |
1,158 |
4,411 |
4,683 |
7,329 |
7,103 |
0 |
6,598 |
22,524 |
5,313 |
59,119 |
| Accommodation and food service activities |
1,295 |
2,525 |
1,838 |
6,144 |
36,710 |
0 |
2,221 |
4,915 |
17,034 |
72,682 |
| Information and communication |
1,408 |
6,563 |
4,092 |
1,687 |
176 |
0 |
88 |
131 |
1,468 |
15,613 |
| Financial and insurance activities |
2,653 |
5,435 |
1,870 |
2,886 |
126 |
0 |
0 |
676 |
2,092 |
15,738 |
| Real estate activities |
980 |
2,252 |
1,998 |
1,137 |
2,229 |
0 |
1,247 |
1,073 |
1,261 |
12,177 |
| Professional, scientific and technical activities |
1,895 |
6,742 |
2,127 |
3,777 |
804 |
0 |
2,349 |
2,617 |
8,508 |
28,819 |
| Administrative and support service activities |
1,176 |
4,414 |
5,720 |
3,486 |
10,973 |
2,318 |
12,238 |
8,514 |
36,010 |
84,849 |
| Public administration and defence; compulsory social security |
4,489 |
17,855 |
10,335 |
22,299 |
8,213 |
2,936 |
7,875 |
5,020 |
8,259 |
87,281 |
| Education |
2,193 |
28,855 |
3,163 |
3,767 |
5,232 |
0 |
46 |
965 |
2,832 |
47,053 |
| Human health and social work activities |
822 |
16,007 |
7,115 |
3,245 |
1,098 |
0 |
59 |
831 |
782 |
29,959 |
| Arts, entertainment and recreation |
281 |
1,469 |
1,974 |
833 |
342 |
0 |
156 |
470 |
755 |
6,280 |
| Other service activities |
471 |
2,883 |
2,389 |
2,561 |
4,726 |
0 |
433 |
160 |
2,569 |
16,192 |
| Activities of households as employers; undifferentiated goods- and services-producing activities of households for own use |
0 |
1,410 |
545 |
448 |
23,855 |
69 |
14 |
56,735 |
90,666 |
173,742 |
| Activities of extraterritorial organizations and bodies |
322 |
1,985 |
1,316 |
906 |
0 |
0 |
0 |
155 |
265 |
4,949 |
| Total |
42,753 |
187,116 |
138,106 |
109,313 |
194,480 |
25,250 |
672,329 |
293,905 |
389,435 |
2,052,687 |
Source: Annual Bulletin of Labor Force Sample survey 2016
ANNEXED NOTE
1. Technical Notes and Definitions
The data is taken from 2016 Labour Force Survey (yearly synthesis)
Sampling frame of LFS 2016: Population Census 2010.
Sample size: 60,016 persons, in 9,199 households: 1- Qatari households; 2- Non-Qatari regular (non-collective) households;
3- Non-Qatari small collective households or labour gatherings (2 – 6 persons); 4- Non-Qatari large collective households or large labour gatherings (7 persons or more).
Data Collection: The sample was divided into equal parts to collect data monthly. Each month 1/3 of the quarterly data were collected during the first two weeks of the month.
Reference period for the labour force data: the week prior to data collection day.
Population of reference: all Qatari and non-Qatari households present in Qatar on the night of survey, living in normal and collective households.
The collective households are a group of persons not related to each other and sharing living conditions in a residential unit, I.e. labour camps, students living boarding
schools, nurses in hospitals… etc. The survey covered the small collective households (includes less than 7 persons) and large collective households (includes 7 persons or more).
The survey did not cover short periods accommodation, i.e. hotels.
The present data includes active population, i.e. employed and unemployed. It does not include persons seeking work for the first time
Relation to labour force (for persons aged 15 and above)
In the labour force (= economically active).
1) Employed.
All persons aged 15 years and above, who during the week preceding the survey:
a) Perform a work for a wage, salary, profits or household gains, whether it was in cash or in kind.
b) Are temporarily not employed, however, they still have an official relation with their work
2) Unemployed.
All persons aged 15 years and over who were, during the week preceding the survey, without employment, willing to work and looking seriously for a job.
There is a distinction between two kinds of unemployed persons:
a) First time unemployed: They are the persons who never worked previously, and were during the week preceding the survey looking actively for work.
b) Unemployed who previously worked: They are the persons with a work experience, who during the week preceding the survey were actively looking for a job
2. Institution which provides data
Ministry of Development Planning and Statistics
(http://www.mdps.gov.qa/en/pages/default.aspx)
3. Data availability
The Statistics Authority conducted the first labour Force Sample Survey in 2001. Starting from 2006, the execution of these surveys came to be on annual basis, and on a quarterly basis since 2013.
Labour Force Surveys (yearly and quarterly data) can be downloaded from MDPS’s website, in PDF and Excel format:
http://www.mdps.gov.qa/en/statistics1/pages/topicslisting.aspx?parent=Social&child=LaborForce
Last date of access: May 2018.
|
QATARI |
NON-QATARI |
Total |
|
Males |
Females |
Total |
Males |
Females |
Total |
Males |
Females |
Total |
| 2006 |
38,684 |
19,447 |
58,131 |
415,235 |
57,767 |
473,002 |
453,919 |
77,214 |
531,133 |
| 2007 |
40,322 |
21,223 |
61,545 |
686,430 |
79,608 |
766,038 |
726,752 |
100,831 |
827,583 |
| 2008 |
42,770 |
24,815 |
67,585 |
1,002,388 |
97,928 |
1,100,316 |
1,045,158 |
122,743 |
1,167,901 |
| 2009 |
45,242 |
25,402 |
70,644 |
1,092,844 |
97,983 |
1,190,827 |
1,138,086 |
123,385 |
1,261,471 |
| 2010* |
46,168 |
24,908 |
71,076 |
1,070,973 |
128,134 |
1,199,107 |
1,117,141 |
153,042 |
1,270,183 |
| 2011 |
49,228 |
25,145 |
74,373 |
1,068,083 |
127,789 |
1,195,872 |
1,117,311 |
152,934 |
1,270,245 |
| 2012 |
55,609 |
26,992 |
82,601 |
1,117,577 |
140,404 |
1,257,981 |
1,173,186 |
167,396 |
1,340,582 |
| 2013 |
60,877 |
30,256 |
91,133 |
1,284,838 |
163,169 |
1,448,007 |
1,345,715 |
193,425 |
1,539,140 |
| 2014 |
62,202 |
31,282 |
93,484 |
1,419,940 |
173,247 |
1,593,187 |
1,482,142 |
204,529 |
1,686,671 |
| 2015 |
64,101 |
34,322 |
98,423 |
1,628,620 |
226,395 |
1,855,015 |
1,692,721 |
260,717 |
1,953,438 |
| 2016 |
65,023 |
36,394 |
101,417 |
1,716,529 |
234,467 |
1,950,996 |
1,781,552 |
270,861 |
2,052,413 |
Source: Labour Force Sample Surveys, 2006 to 2009 and 2011 to 2016; *: census 2010
ANNEXED NOTE
1. Technical Notes and Definitions
Census 2010:
Reference period for census 2010: the night of April 21st, 2010.
Implementation method: census is based on de jure method; i.e. registering people according to their usual place of residence at time of census.
Populations in transit or visiting Qatar as tourists, as well as residents of public housing or visitors staying in a household for less than two months after night of reference were excluded.
Populations away from usual residence in Qatar for reasons of duty, or on a visit abroad for less than two months, as well as individuals with no personal housing within Qatar staying
with a household for more than two months, are counted in their usual/ present residence during census night.
Population of reference: all individuals (nationals and non-nationals) present within the State’s borders during time of reference, including in labour camps.
Labour force Sample Surveys:
The Statistics Authority conducted the first labor Force Sample Survey in 2001. Starting from 2006, the execution of these surveys came to be on annual basis.
In 2013, the Survey was conducted on a quarterly basis.
| Labor Force |
Sampling |
Sample size |
Reference |
| Sample Surveys |
frame |
(households) |
individuals |
period |
| 2006 |
based on independent samples drawn from distinct frames of specially constructed PSUs |
5,492 |
31,439 |
March 2006 |
| 2007 |
nd |
5,492 |
31,439 |
October 2007 |
| 2008 |
nd |
6,104 |
nd |
December 2008 |
| 2009 |
nd |
6,109 |
35,839 |
October 2009 |
| 2011 |
nd |
6,920 |
35,839 |
March 2011 |
| 2012 |
Census 2010 |
6,895 |
37,629 |
April 2012 |
| 2013 |
Census 2010 |
c. 7000 |
n.d. |
Quarterly |
| 2014 |
Census 2010 |
8,351 |
53,363 |
Quarterly |
| 2015 |
Census 2010 |
6,953 |
44,756 |
Quarterly |
| 2016 |
Census 2010 |
9,199 |
60,016 |
Quarterly |
Reference period for the labor force data: the week prior to the reference date for data collection.
Population of reference: all Qatari and non-Qatari households of the following types: i. Qatari households; ii. Non-Qatari households;
iii. Small labor gatherings; iv. Large labor gatherings, present in Qatar on the night of survey/ periods of reference
The collective households are a group of persons not related to each other and sharing living conditions in a residential unit, I.e. labor camps, students living boarding schools,
nurses in hospitals… etc. The survey covered the small collective households (includes less than 7 persons) and large collective households (includes 7 persons or more).
The survey did not cover short periods accommodation, i.e. hotels.
Employed population:
Persons aged 15 years an above, who during the week preceding the survey:
a) Perform a work for a wage, salary, profits or household gains, whether it was in cash or in kind.
b) Are temporarily not employed, however, they still have an official relation with their work
2. Institution which provides data
Ministry of Development Planning and Statistics
(http://www.mdps.gov.qa/en/pages/default.aspx)
3. Data availability
The Statistics Authority conducted the first labour Force Sample Survey in 2001. Starting from 2006, the execution of these surveys came to be on annual basis.
Quarterly publications of Labour Force Surveys’ data are also available since 2012.
2015′ and earlier Labour Force Surveys can be downloaded from MDPS’s website, in PDF and Excel format:
http://www.mdps.gov.qa/en/statistics1/pages/topicslisting.aspx?parent=Social&child=LaborForce
Last date of access: May 2018.
|
Emiratis |
Foreign nationals |
Total |
Number of |
Number of households |
|
Males |
Females |
Total |
Males |
Females |
Total |
Males |
Females |
Total |
households |
dwellings |
| Fujairah City |
9,045 |
8,691 |
17,736 |
40,052 |
14,504 |
54,556 |
49,097 |
23,195 |
72,292 |
11,352 |
10,739 |
| Fujairah Suburbs |
12,088 |
12,216 |
24,304 |
20,652 |
4,396 |
25,048 |
32,740 |
16,612 |
49,352 |
6,358 |
5,488 |
| Dibba City |
5,120 |
5,050 |
10,170 |
9,565 |
3,238 |
12,803 |
14,685 |
8,288 |
22,973 |
3,357 |
3,357 |
| Dibba Suburbs |
6,526 |
6,555 |
13,081 |
7,522 |
2,179 |
9,701 |
14,048 |
8,734 |
22,782 |
3,246 |
2,675 |
| Total |
32,779 |
32,512 |
65,291 |
77,791 |
24,317 |
102,108 |
110,570 |
56,829 |
167,399 |
24,313 |
22,259 |
Source: Fujairah Statistics Center
ANNEXED NOTE
1. Characteristics of data
Fujairah Statistics Center conducted the project of updating data regarding population, housing and establishments for the Emirate of Fujairah.
The project started on 1st of January 2011 and ended on 1st of June 2011.
It is unclear if a comprehensive census was conducted or a sample survey, if data were collected through fieldwork or from administrative records.
2. Institution which provides data
Fujairah Statistics Centre, Fujairah (http://www.fscfuj.gov.ae/indexE.html).
3. Data availability
Project Data Updating for Population, Residences and Establishments 2011
http://www.fscfuj.gov.ae/projectsE.html
http://www.fscfuj.gov.ae/reports/census2011.pdf
Date of access: January 2018.
| Years |
Male |
Female |
Total |
| 1953 |
… |
… |
50,000 |
| 1968 |
… |
… |
59,000 |
| 1975 |
128,821 |
54,366 |
183,187 |
| 1980 |
187,714 |
88,587 |
276,301 |
| 1985 |
247,179 |
123,609 |
370,788 |
| 1993 |
406,128 |
204,798 |
610,926 |
| 1995 |
478,209 |
211,211 |
689,420 |
| 2000 |
611,799 |
250,588 |
862,387 |
| 2005 |
989,305 |
332,148 |
1,321,453 |
| 2006* |
1,073,485 |
348,327 |
1,421,812 |
| 2007* |
1,164,576 |
365,216 |
1,529,792 |
| 2008* |
1,263,130 |
382,843 |
1,645,973 |
| 2009* |
1,369,740 |
401,238 |
1,770,978 |
| 2010* |
1,485,046 |
420,430 |
1,905,476 |
| 2011* |
1,536,380 |
466,790 |
2,003,170 |
| 2012* |
1,602,925 |
502,950 |
2,105,875 |
| 2013* |
1,677,330 |
536,515 |
2,213,845 |
| 2014* |
1,613,175 |
714,175 |
2,327,350 |
| 2015* |
1,703,355 |
743,320 |
2,446,675 |
| 2016* |
1,888,520 |
810,080 |
2,698,600 |
Sources: Dubai Statistics Center (Censuses of 1993, 2000, 2005 and estimates 2006-2016)
Ministry of Economy (previously Planning) (Censuses of 1968, 1975, 1980, 1985, 1995)
Kuwait Mission Knowledge Report 1953.
ANNEXED NOTE
1. Characteristics of data, definitions and population counting operations in the UAE
* Figures since 2006 are estimates for the end of the given year.
Figures presented concern the total population (Emiratis and foreign nationals) residing in the Emirate of Dubai at the given date.
The first population census was conducted in 1968 by the Council of Developing Trucial States.
After Independence in 1971, a population census of the Emirate of Abu Dhabi was conducted that same year.
The first general population and establishments census in the UAE was conducted in 1975.
The other federal censuses were conducted in 1980, 1985, 1995 and 2005.
Reference days for UAE censuses: 30/12/1975; 15/12/1980, 16/12/1985, 16/12/1995; 29/10/2001; 06/12/2005.
Implementation method: the census was carried out according to de jure methodology, i.e. counting persons using their usual place of residence
Population of reference: Emirati nationals usually residing in the country+
all foreign residents holding a valid residence permit+resident GCC nationals (nationals of other GCC states don’t need a permit to stay in the UAE)
2. Institution which provides data
Dubai Statistics Centre (DSC).
3. Data availability
The data is retrieved from Dubai Statistical Yearbooks, chapter “Population and Vital Statistics” in section “Publications”.
https://www.dsc.gov.ae/en-us/Themes/Pages/Population-and-Vital-Statistics.aspx?Theme=42&year=2015#DSC_Tab2
Data is also available in the “Reports” section, “Population by gender”
https://www.dsc.gov.ae/Report/Copy%20of%20DSC_SYB_2016_01%20_%2001.pdf
Data is presented in PDF and Excel formats.
Last date of access: February 3, 2018.
| Years |
Emiratis |
Non-Emiratis |
Total |
% non-nationals |
| 1975 |
50,816 |
132,371 |
183,187 |
72.3 |
| 1980 |
62,516 |
213,785 |
276,301 |
77.4 |
| 1985 |
76,692 |
294,096 |
370,788 |
79.3 |
| 1995 |
107,741 |
581,679 |
689,420 |
84.4 |
| 2005 |
137,573 |
1,183,880 |
1,321,453 |
89.6 |
| 2010 |
168,029 |
1,737,447 |
1,905,476 |
91.2 |
| 2014* |
212,000 |
2,115,350 |
2,327,350 |
90.9 |
| 2015* |
222,875 |
2,223,800 |
2,446,675 |
90.9 |
| 2016* |
233,430 |
2,465,170 |
2,698,600 |
91.3 |
Source: Dubai Statistics Center
ANNEXED NOTE
1. Characteristics of data, definitions and population counting operations in the UAE
* Figures since 2014 are estimates for the end of the given year.
The first population census was conducted in 1968 by the Council of Developing Trucial States.
After Independence in 1971, a population census of the Emirate of Abu Dhabi was conducted that same year.
The first general population and establishments census in the UAE was conducted in 1975.
The other federal censuses were conducted in 1980, 1985, 1995 and 2005.
Reference days for UAE censuses: 30/12/1975; 15/12/1980, 16/12/1985, 16/12/1995; 29/10/2001; 06/12/2005.
Implementation method: the census was carried out according to de jure methodology, i.e. counting persons using their usual place of residence
Population of reference: Emirati nationals usually residing in the country+
all foreign residents holding a valid residence permit+resident GCC nationals (nationals of other GCC states don’t need a permit to stay in the UAE)
2. Institution which provides data
Dubai Statistics Centre (DSC).
3. Data availability
2014-2016: data is available in the “Reports” section, “Estimated Population Number by Nationality”
Data is presented in PDF and Excel formats.
https://www.dsc.gov.ae/en-us/Themes/Pages/Population-and-Vital-Statistics.aspx?Theme=42&year=2016#DSC_Tab1
Population at census dates: Dubai Statistical Yearbooks, DSC.
Last date of access: February 3, 2018.
| Age Group |
Nationals |
Non-nationals |
TOTAL |
| Males |
Females |
Total |
Males |
Females |
Total |
Males |
Females |
Total |
| 0-4 |
39,554 |
37,681 |
77,235 |
53,901 |
49,139 |
103,040 |
93,455 |
86,820 |
180,275 |
| 5-9 |
35,661 |
33,562 |
69,223 |
42,410 |
40,273 |
82,683 |
78,071 |
73,835 |
151,906 |
| 10-14 |
31,479 |
28,974 |
60,453 |
36,709 |
34,817 |
71,526 |
68,188 |
63,791 |
131,979 |
| 15-19 |
27,509 |
26,000 |
53,509 |
42,200 |
45,983 |
88,183 |
69,709 |
71,983 |
141,692 |
| 20-24 |
26,084 |
26,424 |
52,508 |
174,915 |
85,802 |
260,717 |
200,999 |
112,226 |
313,225 |
| 25-29 |
25,443 |
24,174 |
49,617 |
342,892 |
115,416 |
458,308 |
368,335 |
139,590 |
507,925 |
| 30-34 |
25,023 |
22,475 |
47,498 |
301,696 |
106,462 |
408,158 |
326,719 |
128,937 |
455,656 |
| 35-39 |
19,737 |
18,181 |
37,918 |
219,579 |
76,891 |
296,470 |
239,316 |
95,072 |
334,388 |
| 40-44 |
13,128 |
12,583 |
25,711 |
159,444 |
53,739 |
213,183 |
172,572 |
66,322 |
238,894 |
| 45-49 |
9,540 |
9,070 |
18,610 |
85,870 |
35,465 |
121,335 |
95,410 |
44,535 |
139,945 |
| 50-54 |
7,016 |
7,250 |
14,266 |
50,076 |
21,460 |
71,536 |
57,092 |
28,710 |
85,802 |
| 55-59 |
5,342 |
5,242 |
10,584 |
27,443 |
13,425 |
40,868 |
32,785 |
18,667 |
51,452 |
| 60-64 |
4,161 |
3,423 |
7,584 |
10,544 |
6,619 |
17,163 |
14,705 |
10,042 |
24,747 |
| 65-69 |
2,622 |
2,238 |
4,860 |
4,436 |
3,005 |
7,441 |
7,058 |
5,243 |
12,301 |
| 70-74 |
1,631 |
1,789 |
3,420 |
2,049 |
1,752 |
3,801 |
3,680 |
3,541 |
7,221 |
| 75-79 |
1,011 |
853 |
1,864 |
885 |
796 |
1,681 |
1,896 |
1,649 |
3,545 |
| 80+ |
1,009 |
872 |
1,881 |
742 |
914 |
1,656 |
1,751 |
1,786 |
3,537 |
| Total |
275,950 |
260,791 |
536,741 |
1,555,791 |
691,958 |
2,247,749 |
1,831,741 |
952,749 |
2,784,490 |
Source: Statistics Centre – Abu Dhabi
ANNEXED NOTE
1. Characteristics of data, definitions
Since 2011, Islands were merged with Abu Dhabi Region and Al Gharbia
All numbers are rounded to the nearest 1000 persons, therefore, numbers may not add to totals.
The population data in the Statistical Yearbook includes Census data up to
2005 and mid-year estimates of the usual resident population from 2006.
The population estimates include people who are usual residents, temporary
absents and Emirati citizens away from the Emirate, who are legally entitled
to live in UAE. The mid-year 2015 population estimate is preliminary and
subject to revision.
2. Institution which provides data
Statistics Centre of Abu Dhabi (SCAD), Abu Dhabi
3. Data availability
SCAD statistics on population:
https://www.scad.ae/en/pages/statistics.aspx?topicid=24
Abu Dhabi Statistical Yearbooks, chapter “Population and Demography”:
https://www.scad.ae/en/pages/GeneralPublications.aspx?pubid=79&themeid=7
Date of access: January 2018.
|
|
Emiratis |
non-Emiratis |
Total |
% non-nationals |
|
Year |
Males |
Females |
Total |
Males |
Females |
Total |
Males |
Females |
Total |
| Abu Dhabi |
2016 |
282,632 |
268,903 |
551,535 |
1,574,986 |
781,652 |
2,356,638 |
1,857,618 |
1,050,555 |
2,908,173 |
81 |
| Dubai |
2016 |
n.a. |
n.a. |
233,430 |
n.a. |
n.a. |
2,465,170 |
n.a. |
n.a. |
2,698,600 |
91 |
| Al Sharjah |
2015 |
86,325 |
89,098 |
175,423 |
834,542 |
395,875 |
1,230,417 |
920,867 |
484,973 |
1,405,840 |
88 |
| Ras Al Khaima |
2012 |
49,860 |
49,662 |
99,522 |
215,140 |
107,338 |
322,478 |
265,000 |
157,000 |
422,000 |
76 |
| Ajman |
2017 |
n.a. |
n.a. |
n.a. |
n.a. |
n.a. |
n.a. |
n.a. |
n.a. |
504,847 |
n.a. |
| Al Fujairah |
2016 |
43,991 |
43,823 |
87,814 |
104,821 |
32,725 |
137,546 |
148,812 |
76,548 |
225,360 |
61 |
| Umm Al – Quwain |
n.a. |
n.a. |
n.a. |
n.a. |
n.a. |
n.a. |
n.a. |
n.a. |
n.a. |
n.a. |
n.a. |
| |
|
|
|
|
|
|
|
|
|
|
|
| Total UAE population 2016 (est. FCSA) |
|
|
|
|
|
|
|
|
|
9,121,167 |
|
Sources: various (see below)
ANNEXED NOTE
1. Characteristics of data, definitions
|
Statistical institute |
source of data |
period of reference |
| Abu Dhabi |
Statistics Center Abu Dhabi |
administrative records |
mid-year |
|
| Dubai |
Dubai Statistics Center |
administrative records |
end of year |
| Al Sharjah |
Department of Statistics and Community Development in Sharjah (DSCD) |
population census |
October 2015 |
| Ras Al Khaima |
Government of RAK, Department of Economic Development |
National Bureau of Statistics |
? |
|
| Ajman |
Statistics and Research Department, General Secretariat of the Executive Council |
population census |
February-March 2017 |
| Al Fujairah |
Fujairah Statistics Center |
administrative records? |
? |
|
| UAE Total |
Federal Competitiveness and Statistics Authority |
administrative records |
end of year |
2. Data availability
SCAD Abu Dhabi SYB 2017, https://www.scad.ae/en/pages/GeneralPublications.aspx?pubid=79&themeid=7
DSC statistics, “Reports” section, “Population by gender”, https://www.dsc.gov.ae/Report/Copy%20of%20DSC_SYB_2016_01%20_%2001.pdf
census 2015
Government of RAK, Department of Economic Development, SYB 2013 http://www.ded.rak.ae/ar/Pages/yearbook.aspx
census 2017
Fujeirah Statistics Center, SYB 2016, http://www.fscfuj.gov.ae/books/book2016.pdf.
FCSA, Statistics, UAE Population 2016, http://fcsa.gov.ae/en-us/Pages/Statistics/UAE-Population-2016.aspx
Date of access: January 2018.
| Age Group |
Nationals |
Non-nationals |
TOTAL |
| Males |
Females |
Total |
Males |
Females |
Total |
Males |
Females |
Total |
| 0-4 |
39,554 |
37,681 |
77,235 |
53,901 |
49,139 |
103,040 |
93,455 |
86,820 |
180,275 |
| 5-9 |
35,661 |
33,562 |
69,223 |
42,410 |
40,273 |
82,683 |
78,071 |
73,835 |
151,906 |
| 10-14 |
31,479 |
28,974 |
60,453 |
36,709 |
34,817 |
71,526 |
68,188 |
63,791 |
131,979 |
| 15-19 |
27,509 |
26,000 |
53,509 |
42,200 |
45,983 |
88,183 |
69,709 |
71,983 |
141,692 |
| 20-24 |
26,084 |
26,424 |
52,508 |
174,915 |
85,802 |
260,717 |
200,999 |
112,226 |
313,225 |
| 25-29 |
25,443 |
24,174 |
49,617 |
342,892 |
115,416 |
458,308 |
368,335 |
139,590 |
507,925 |
| 30-34 |
25,023 |
22,475 |
47,498 |
301,696 |
106,462 |
408,158 |
326,719 |
128,937 |
455,656 |
| 35-39 |
19,737 |
18,181 |
37,918 |
219,579 |
76,891 |
296,470 |
239,316 |
95,072 |
334,388 |
| 40-44 |
13,128 |
12,583 |
25,711 |
159,444 |
53,739 |
213,183 |
172,572 |
66,322 |
238,894 |
| 45-49 |
9,540 |
9,070 |
18,610 |
85,870 |
35,465 |
121,335 |
95,410 |
44,535 |
139,945 |
| 50-54 |
7,016 |
7,250 |
14,266 |
50,076 |
21,460 |
71,536 |
57,092 |
28,710 |
85,802 |
| 55-59 |
5,342 |
5,242 |
10,584 |
27,443 |
13,425 |
40,868 |
32,785 |
18,667 |
51,452 |
| 60-64 |
4,161 |
3,423 |
7,584 |
10,544 |
6,619 |
17,163 |
14,705 |
10,042 |
24,747 |
| 65-69 |
2,622 |
2,238 |
4,860 |
4,436 |
3,005 |
7,441 |
7,058 |
5,243 |
12,301 |
| 70-74 |
1,631 |
1,789 |
3,420 |
2,049 |
1,752 |
3,801 |
3,680 |
3,541 |
7,221 |
| 75-79 |
1,011 |
853 |
1,864 |
885 |
796 |
1,681 |
1,896 |
1,649 |
3,545 |
| 80+ |
1,009 |
872 |
1,881 |
742 |
914 |
1,656 |
1,751 |
1,786 |
3,537 |
| Total |
275,950 |
260,791 |
536,741 |
1,555,791 |
691,958 |
2,247,749 |
1,831,741 |
952,749 |
2,784,490 |
Source: Statistics Centre – Abu Dhabi
ANNEXED NOTE
1. Characteristics of data, definitions
Since 2011, Islands were merged with Abu Dhabi Region and Al Gharbia
All numbers are rounded to the nearest 1000 persons, therefore, numbers may not add to totals.
The population data in the Statistical Yearbook includes Census data up to
2005 and mid-year estimates of the usual resident population from 2006.
The population estimates include people who are usual residents, temporary
absents and Emirati citizens away from the Emirate, who are legally entitled
to live in UAE. The mid-year 2015 population estimate is preliminary and
subject to revision.
2. Institution which provides data
Statistics Centre of Abu Dhabi (SCAD), Abu Dhabi
3. Data availability
SCAD statistics on population:
https://www.scad.ae/en/pages/statistics.aspx?topicid=24
Abu Dhabi Statistical Yearbooks, chapter “Population and Demography”:
https://www.scad.ae/en/pages/GeneralPublications.aspx?pubid=79&themeid=7
Date of access: January 2018.
| |
|
Nationals |
|
|
Non-nationals |
TOTAL |
| Year |
Males |
Females |
Total |
Males |
Females |
Total |
Males |
Females |
Total |
| 1960 |
6,211 |
4,853 |
11,064 |
8,635 |
209 |
8,844 |
14,846 |
5,062 |
19,908 |
| 1961 |
7,041 |
5,543 |
12,584 |
11,031 |
476 |
11,507 |
18,072 |
6,019 |
24,091 |
| 1962 |
7,871 |
6,233 |
14,104 |
13,427 |
743 |
14,170 |
21,298 |
6,976 |
28,274 |
| 1963 |
8,327 |
6,594 |
14,921 |
14,633 |
896 |
15,529 |
22,960 |
7,490 |
30,450 |
| 1964 |
8,810 |
6,976 |
15,786 |
15,947 |
1,080 |
17,027 |
24,757 |
8,056 |
32,813 |
| 1965 |
9,321 |
7,380 |
16,701 |
17,379 |
1,302 |
18,681 |
26,700 |
8,682 |
35,382 |
| 1966 |
9,861 |
7,808 |
17,669 |
18,940 |
1,570 |
20,510 |
28,801 |
9,378 |
38,179 |
| 1967 |
10,433 |
8,261 |
18,694 |
20,641 |
1,893 |
22,534 |
31,074 |
10,154 |
41,228 |
| 1968 |
11,038 |
8,740 |
19,778 |
22,493 |
2,281 |
24,774 |
33,531 |
11,021 |
44,552 |
| 1969 |
12,592 |
10,115 |
22,707 |
28,439 |
3,269 |
31,708 |
41,031 |
13,384 |
54,415 |
| 1970 |
14,364 |
11,707 |
26,071 |
35,957 |
4,685 |
40,642 |
50,321 |
16,392 |
66,713 |
| 1971 |
16,386 |
13,549 |
29,935 |
45,462 |
6,714 |
52,176 |
61,848 |
20,263 |
82,111 |
| 1972 |
18,692 |
15,681 |
34,373 |
57,480 |
9,621 |
67,101 |
76,172 |
25,302 |
101,474 |
| 1973 |
21,323 |
18,148 |
39,471 |
72,675 |
13,787 |
86,462 |
93,998 |
31,935 |
125,933 |
| 1974 |
24,324 |
21,003 |
45,327 |
91,887 |
19,757 |
111,644 |
116,211 |
40,760 |
156,971 |
| 1975 |
27,746 |
24,308 |
52,054 |
116,176 |
28,309 |
144,485 |
143,922 |
52,617 |
196,539 |
| 1976 |
30,688 |
26,971 |
57,659 |
136,742 |
34,044 |
170,786 |
167,430 |
61,015 |
228,445 |
| 1977 |
33,942 |
29,926 |
63,868 |
160,949 |
40,941 |
201,890 |
194,891 |
70,867 |
265,758 |
| 1978 |
37,541 |
33,204 |
70,745 |
189,441 |
49,236 |
238,677 |
226,982 |
82,440 |
309,422 |
| 1979 |
41,521 |
36,841 |
78,362 |
222,976 |
59,211 |
282,187 |
264,497 |
96,052 |
360,549 |
| 1980 |
45,922 |
40,877 |
86,799 |
262,447 |
71,209 |
333,656 |
308,369 |
112,086 |
420,455 |
| 1981 |
49,564 |
44,595 |
94,159 |
271,003 |
78,390 |
349,393 |
320,567 |
122,985 |
443,552 |
| 1982 |
53,495 |
48,651 |
102,146 |
279,838 |
86,295 |
366,133 |
333,333 |
134,946 |
468,279 |
| 1983 |
57,738 |
53,076 |
110,814 |
288,961 |
94,997 |
383,958 |
346,699 |
148,073 |
494,772 |
| 1984 |
62,318 |
57,904 |
120,222 |
298,382 |
104,577 |
402,959 |
360,700 |
162,481 |
523,181 |
| 1985 |
67,262 |
63,171 |
130,433 |
308,111 |
115,124 |
423,235 |
375,373 |
178,295 |
553,668 |
| 1986 |
70,713 |
66,578 |
137,291 |
324,884 |
120,320 |
445,204 |
395,597 |
186,898 |
582,495 |
| 1987 |
74,341 |
70,169 |
144,510 |
342,570 |
125,751 |
468,321 |
416,911 |
195,920 |
612,831 |
| 1988 |
78,155 |
73,953 |
152,108 |
361,219 |
131,427 |
492,646 |
439,374 |
205,380 |
644,754 |
| 1989 |
82,165 |
77,941 |
160,106 |
380,883 |
137,359 |
518,242 |
463,048 |
215,300 |
678,348 |
| 1990 |
86,381 |
82,144 |
168,525 |
401,618 |
143,559 |
545,177 |
487,999 |
225,703 |
713,702 |
| 1991 |
90,813 |
86,574 |
177,387 |
423,482 |
150,039 |
573,521 |
514,295 |
236,613 |
750,908 |
| 1992 |
95,472 |
91,243 |
186,715 |
446,536 |
156,811 |
603,347 |
542,008 |
248,054 |
790,062 |
| 1993 |
100,370 |
96,164 |
196,534 |
470,845 |
163,889 |
634,734 |
571,215 |
260,053 |
831,268 |
| 1994 |
105,520 |
101,350 |
206,870 |
496,477 |
171,286 |
667,763 |
601,997 |
272,636 |
874,633 |
| 1995 |
110,933 |
106,815 |
217,748 |
523,507 |
179,016 |
702,523 |
634,440 |
285,831 |
920,271 |
| 1996 |
116,223 |
112,360 |
228,583 |
540,556 |
186,657 |
727,213 |
656,779 |
299,017 |
955,796 |
| 1997 |
121,765 |
118,193 |
239,958 |
558,161 |
194,624 |
752,785 |
679,926 |
312,817 |
992,743 |
| 1998 |
127,572 |
124,329 |
251,901 |
576,339 |
202,931 |
779,270 |
703,911 |
327,260 |
1,031,171 |
| 1999 |
133,656 |
130,783 |
264,439 |
595,109 |
211,593 |
806,702 |
728,765 |
342,376 |
1,071,141 |
| 2000 |
140,030 |
137,572 |
277,602 |
614,490 |
220,624 |
835,114 |
754,520 |
358,196 |
1,112,716 |
| 2001 |
146,707 |
144,714 |
291,421 |
634,502 |
230,040 |
864,542 |
781,209 |
374,754 |
1,155,963 |
| 2002 |
153,047 |
150,745 |
303,792 |
658,813 |
244,080 |
902,893 |
811,860 |
394,825 |
1,206,685 |
| 2003 |
159,661 |
157,027 |
316,688 |
684,055 |
258,977 |
943,032 |
843,716 |
416,004 |
1,259,720 |
| 2004 |
166,561 |
163,571 |
330,132 |
710,264 |
274,783 |
985,047 |
876,825 |
438,354 |
1,315,179 |
| 2005 |
173,861 |
170,489 |
344,350 |
738,003 |
291,816 |
1,029,819 |
911,864 |
462,305 |
1,374,169 |
| 2006 |
181,793 |
178,385 |
360,177 |
793,371 |
307,930 |
1,101,301 |
975,164 |
486,315 |
1,461,478 |
| 2007 |
190,369 |
187,277 |
377,646 |
873,504 |
323,131 |
1,196,635 |
1,063,873 |
510,408 |
1,574,281 |
| 2008 |
199,232 |
196,497 |
395,729 |
961,173 |
338,886 |
1,300,059 |
1,160,405 |
535,383 |
1,695,788 |
| 2009 |
208,387 |
206,054 |
414,441 |
1,057,029 |
355,203 |
1,412,232 |
1,265,416 |
561,257 |
1,826,674 |
| 2010 |
224,498 |
212,985 |
437,483 |
1,236,296 |
420,701 |
1,656,997 |
1,460,794 |
633,686 |
2,094,480 |
| 2011 |
234,414 |
220,651 |
455,065 |
1,289,871 |
416,683 |
1,706,554 |
1,524,285 |
637,334 |
2,161,619 |
| 2012 |
246,390 |
230,340 |
476,730 |
1,415,660 |
442,180 |
1,857,840 |
1,662,050 |
672,520 |
2,334,570 |
| 2013 |
255,250 |
240,120 |
495,370 |
1,492,580 |
465,150 |
1,957,730 |
1,747,830 |
705,270 |
2,453,100 |
| 2014 |
261,200 |
246,279 |
507,479 |
1,504,940 |
644,029 |
2,148,969 |
1,766,140 |
890,308 |
2,656,448 |
| 2015 |
275,950 |
260,791 |
536,741 |
1,555,791 |
691,958 |
2,247,749 |
1,831,741 |
952,749 |
2,784,490 |
| 2016 |
282,632 |
268,903 |
551,535 |
1,574,986 |
781,652 |
2,356,638 |
1,857,618 |
1,050,555 |
2,908,173 |
Source: SCAD, Abu Dhabi
ANNEXED NOTE
1. Characteristics of data, definitions and population counting operations in the UAE
Population estimates are drawn using interpolation techniques. They are mid-year estimates.
The first population census was conducted in 1968 by the Council of Developing Trucial States.
After Independence in 1971, a population census of the Emirate of Abu Dhabi was conducted that same year.
The first general population and establishments census in the UAE was conducted in 1975. It was the first census in the region following scientific standards and international recommendations. The other federal censuses were conducted in 1980, 1985, 1995 and 2005.
Reference days for UAE censuses: 30/12/1975; 15/12/1980, 16/12/1985, 16/12/1995; 29/10/2001; 06/12/2005.
Implementation method: the census was carried out according to de jure methodology, i.e. counting persons using their usual place of residence
Population of reference: Emirati nationals usually residing in the country+all foreign residents holding a valid residence permit+resident GCC nationals (nationals of other GCC states don’t need a permit to stay in the UAE)
In October 2011, SCAD conducted its first census of population and households.
2. Institution which provides data
Statistics centre of Abu Dhabi (SCAD), Abu Dhabi
3. Data availability
The data only concerns the Abu Dhabi resident population (nationals and foreign residents).
SCAD statistics on population:
https://www.scad.ae/en/pages/statistics.aspx?topicid=24
Abu Dhabi Statistical Yearbooks, chapter “Population and Demography”:
https://www.scad.ae/en/pages/GeneralPublications.aspx?pubid=79&themeid=7
Date of access: January 2018.
|
Kuwaitis |
Non-Kuwaitis |
Total |
|
Males |
Female |
Males |
Females |
Males |
Females |
Total |
| Never Married |
166,918 |
149,041 |
847,722 |
229,602 |
1,014,640 |
378,643 |
1,393,283 |
| Married |
234,006 |
242,697 |
1,082,412 |
502,823 |
1,316,418 |
745,520 |
2,061,938 |
| Divorced |
19,704 |
39,693 |
12,021 |
14,774 |
31,725 |
54,467 |
86,192 |
| Widowed |
3,007 |
28,598 |
1,622 |
8,730 |
4,629 |
37,328 |
41,957 |
| Not Stated |
697 |
491 |
17826 |
11,787 |
18,523 |
12,278 |
30,801 |
| Total |
424,332 |
460,520 |
1,961,603 |
767,716 |
2,385,935 |
1,228,236 |
3,614,171 |
Source: PACI
ANNEXED NOTE
1. Characteristics of data and definitions
The source of data used here is the Public Authority for Civil Information (PACI), an independant government body in charge of :
1- centralising all population and labour force data in order to manage a fully computerised population register
2- issuing mandatory civil identification cards to every resident of the country, regardless of age and nationality.
The other source of demographic and socioeconomic data on Kuwait is the Central Statistical Office (CSO), operating within the Planning Ministry. The CSO has conducted ten population and housing censuses since its inception in 1957.
Since 1995 a marked discrepancy was witnessed between PACI’ and CSO’ population figures. PACI’ database is connected electronically with other administrations and bodies registering demographic events and professional/ residency issues (births and death; departures and arrivals; end of service, residency and ID deliveries, etc.).
PACI’s records of residents’ movements is thus regularly updated, which limits the risk of population overcount. Therefore, it is more likely that residents were undercounted during CSO- Ministry of Planning’s census operations (see: Shah, N. Population of Kuwait. Structure and Dynamics, Kuwait: Kuwait University Academic Publication Council, 2010, chapter 1).
(a) Kuwaiti: the Kuwaiti nationality rests upon a document of Kuwaiti nationality or a certificate proving Kuwaiti nationality issued by the Ministry of Interior of Kuwait.
(b) Non-Kuwaiti: his/ her nationality is determined by the name of the State which issued the passport. The foreign national also entered Kuwait legally and has a stamp of residence.
This category includes the Bidoon, a category of stateless persons living in the Emirate. Kuwait’s Bidoon population originates from three broad categories:
1) those whose ancestors failed to apply for nationality or lacked necessary documentation at the time of Kuwait’s independence in 1961;
2) those recruited to work in Kuwait’s army or police force during the 1960s who permanently settled in Kuwait, along with their families;
3) children of Kuwaiti mothers and stateless or foreign fathers (see Human Rights Watch. Prisoners of the Past. Kuwaiti Bidun and the Burden of Statelessness, June 2011, p. 3).
(The children of Kuwaiti mothers and non-Kuwaiti fathers (with specific nationality) inherit the father’s nationality. They are stateless if the father is stateless).
(c) Nationality group: collected according to the nationality of the head of the household.
Nationalities are grouped according to specific features common to certain population subgroups: language, geographic origin, etc. or according to internationally recognized categories such as: (Arab / non-Arab Asian countries / non-Arab African countries; European countries … etc.).
2. Institution which provides data
The Public Authority for Civil Information (PACI)
3. Period of data coverage: 31 December 2017
The database is updated three times a year and the website presents only the most recent data.
4. Data availability
The statistics section of PACI’s website (http://www.paci.gov.kw/en/ (English); http://www.paci.gov.kw/ (Arabic)) provides population and socio-economic data broken down by nationality (Kuwaiti/ non-Kuwaiti). Some data are displayed by nationality groups.
Analytical tables and data crosstabulations are available for download in PDF, html, .png and Excel (.csv) formats.
Date of access: March 2018
|
Kuwaitis |
| Never Married |
Married |
Divorced |
Widowed |
Not Stated |
Total |
| Males |
Females |
Males |
Females |
Males |
Females |
Males |
Females |
Males |
Females |
Males |
Females |
| 15-19 |
67,660 |
62,207 |
232 |
2,884 |
13 |
181 |
|
2 |
130 |
130 |
68,035 |
65,404 |
| 20-24 |
56,088 |
42,241 |
9,285 |
19,608 |
744 |
2,236 |
2 |
37 |
34 |
25 |
66,153 |
64,147 |
| 25-29 |
24,367 |
17,374 |
28,730 |
33,473 |
2,826 |
5,072 |
13 |
120 |
47 |
30 |
55,983 |
56,069 |
| 30-34 |
9,132 |
9,098 |
35,993 |
37,208 |
3,583 |
5,979 |
21 |
256 |
80 |
30 |
48,809 |
52,571 |
| 35-39 |
3,684 |
5,214 |
33,420 |
33,410 |
3,048 |
5,385 |
58 |
523 |
105 |
23 |
40,315 |
44,555 |
| 40-44 |
2,183 |
3,961 |
29,946 |
29,644 |
2,478 |
5,076 |
99 |
997 |
87 |
34 |
34,793 |
39,712 |
| 45-49 |
1,400 |
2,983 |
26,038 |
25,274 |
2,150 |
4,693 |
141 |
1,451 |
64 |
29 |
29,793 |
34,430 |
| 50-54 |
965 |
2,249 |
22,159 |
20,982 |
1,719 |
4,020 |
234 |
2,229 |
58 |
41 |
25,135 |
29,521 |
| 55-59 |
601 |
1,542 |
16,660 |
15,802 |
1,279 |
2,911 |
252 |
3,115 |
31 |
50 |
18,823 |
23,420 |
| 60-64 |
335 |
1,022 |
12,368 |
11,591 |
788 |
1,877 |
356 |
4,410 |
19 |
32 |
13,866 |
18,932 |
| >64 |
391 |
1,041 |
19,207 |
12,859 |
1,077 |
2,270 |
1,831 |
15,461 |
41 |
67 |
22,547 |
31,698 |
| |
166,806 |
148,932 |
234,038 |
242,735 |
19,705 |
39,700 |
3,007 |
28,601 |
696 |
491 |
424,252 |
460,459 |
|
Non-Kuwaitis |
| Never Married |
Married |
Divorced |
Widowed |
Not Stated |
Total |
| Males |
Females |
Males |
Females |
Males |
Females |
Males |
Females |
Males |
Females |
Males |
Females |
| 15-19 |
38,739 |
34,477 |
371 |
2,039 |
3 |
82 |
|
2 |
4845 |
4645 |
43,958 |
41,245 |
| 20-24 |
81,733 |
28,735 |
43,903 |
17,435 |
152 |
638 |
24 |
25 |
5319 |
4035 |
131,131 |
50,868 |
| 25-29 |
171,099 |
45,457 |
154,261 |
75,729 |
717 |
1,851 |
58 |
125 |
4614 |
2565 |
330,749 |
125,727 |
| 30-34 |
158,527 |
38,811 |
191,593 |
102,692 |
1,482 |
2,512 |
83 |
226 |
80 |
50 |
351,765 |
144,291 |
| 35-39 |
148,868 |
30,176 |
194,023 |
95,049 |
1,831 |
2,555 |
77 |
324 |
1018 |
100 |
345,817 |
128,204 |
| 40-44 |
104,259 |
22,992 |
158,088 |
77,228 |
1,756 |
2,095 |
132 |
500 |
991 |
134 |
265,226 |
102,949 |
| 45-49 |
76,565 |
15,821 |
125,551 |
56,158 |
1,770 |
1,776 |
117 |
670 |
530 |
125 |
204,533 |
74,550 |
| 50-54 |
42333 |
7,749 |
90,657 |
35,501 |
1,658 |
1,330 |
124 |
840 |
256 |
60 |
135,028 |
45,480 |
| 55-59 |
18355 |
3,249 |
61,032 |
20,642 |
1,175 |
920 |
147 |
1,007 |
94 |
31 |
80,803 |
25,849 |
| 60-64 |
5456 |
1,160 |
36,525 |
10,895 |
740 |
479 |
155 |
1,125 |
50 |
9 |
42,926 |
13,668 |
| >64 |
1402 |
696 |
26,509 |
9,505 |
737 |
539 |
705 |
3,887 |
14 |
16 |
29,367 |
14,643 |
|
847,336 |
229,323 |
1,082,513 |
502,873 |
12,021 |
14,777 |
1,622 |
8,731 |
17,811 |
11,770 |
1,961,303 |
767,474 |
Source: PACI
ANNEXED NOTE
1. Characteristics of data and definitions
The source of data used here is the Public Authority for Civil Information (PACI), an independant government body in charge of :
1- centralising all population and labour force data in order to manage a fully computerised population register
2- issuing mandatory civil identification cards to every resident of the country, regardless of age and nationality.
The other source of demographic and socioeconomic data on Kuwait is the Central Statistical Office (CSO), operating within the Planning Ministry. The CSO has conducted ten population and housing censuses since its inception in 1957.
Since 1995 a marked discrepancy was witnessed between PACI’ and CSO’ population figures. PACI’ database is connected electronically with other administrations and bodies registering demographic events and professional/ residency issues (births and death; departures and arrivals; end of service, residency and ID deliveries, etc.).
PACI’s records of residents’ movements is thus regularly updated, which limits the risk of population overcount. Therefore, it is more likely that residents were undercounted during CSO- Ministry of Planning’s census operations (see: Shah, N. Population of Kuwait. Structure and Dynamics, Kuwait: Kuwait University Academic Publication Council, 2010, chapter 1).
(a) Kuwaiti: the Kuwaiti nationality rests upon a document of Kuwaiti nationality or a certificate proving Kuwaiti nationality issued by the Ministry of Interior of Kuwait.
(b) Non-Kuwaiti: his/ her nationality is determined by the name of the State which issued the passport. The foreign national also entered Kuwait legally and has a stamp of residence.
This category includes the Bidoon, a category of stateless persons living in the Emirate. Kuwait’s Bidoon population originates from three broad categories:
1) those whose ancestors failed to apply for nationality or lacked necessary documentation at the time of Kuwait’s independence in 1961;
2) those recruited to work in Kuwait’s army or police force during the 1960s who permanently settled in Kuwait, along with their families;
3) children of Kuwaiti mothers and stateless or foreign fathers (see Human Rights Watch. Prisoners of the Past. Kuwaiti Bidun and the Burden of Statelessness, June 2011, p. 3).
(The children of Kuwaiti mothers and non-Kuwaiti fathers (with specific nationality) inherit the father’s nationality. They are stateless if the father is stateless).
(c) Nationality group: collected according to the nationality of the head of the household.
Nationalities are grouped according to specific features common to certain population subgroups: language, geographic origin, etc. or according to internationally recognized categories such as: (Arab / non-Arab Asian countries / non-Arab African countries; European countries … etc.).
2. Institution which provides data
The Public Authority for Civil Information (PACI)
3. Period of data coverage: 31 December 2017
The database is updated three times a year and the website presents only the most recent data.
4. Data availability
The statistics section of PACI’s website (http://www.paci.gov.kw/en/ (English); http://www.paci.gov.kw/ (Arabic)) provides population and socio-economic data broken down by nationality (Kuwaiti/ non-Kuwaiti). Some data are displayed by nationality groups.
Analytical tables and data crosstabulations are available for download in PDF, html, .png and Excel (.csv) formats.
Date of access: March 2018
|
Kuwaiti |
Non Kuwaiti |
Total |
|
males |
females |
total |
males |
females |
total |
males |
females |
total |
| 0-4 |
84,257 |
80,976 |
165,233 |
75,071 |
71,033 |
146,104 |
159,328 |
152,009 |
311,337 |
| 5-9 |
84,427 |
81,799 |
166,226 |
73,221 |
70,180 |
143,401 |
157,648 |
151,979 |
309,627 |
| 10-14 |
78,076 |
75,767 |
153,843 |
57,814 |
54,367 |
112,181 |
135,890 |
130,134 |
266,024 |
| 15-19 |
68,035 |
65,404 |
133,439 |
43,958 |
41,245 |
85,203 |
111,993 |
106,649 |
218,642 |
| 20-24 |
66,153 |
64,147 |
130,300 |
131,131 |
50,868 |
181,999 |
197,284 |
115,015 |
312,299 |
| 25-29 |
55,983 |
56,069 |
112,052 |
330,749 |
125,727 |
456,476 |
386,732 |
181,796 |
568,528 |
| 30-34 |
48,809 |
52,571 |
101,380 |
351,765 |
144,291 |
496,056 |
400,574 |
196,862 |
597,436 |
| 35-39 |
40,315 |
44,555 |
84,870 |
345,817 |
128,204 |
474,021 |
386,132 |
172,759 |
558,891 |
| 40-44 |
34,793 |
39,712 |
74,505 |
265,226 |
102,949 |
368,175 |
300,019 |
142,661 |
442,680 |
| 45-49 |
29,793 |
34,430 |
64,223 |
204,533 |
74,550 |
279,083 |
234,326 |
108,980 |
343,306 |
| 50-54 |
25,135 |
29,521 |
54,656 |
135,028 |
45,480 |
180,508 |
160,163 |
75,001 |
235,164 |
| 55-59 |
18,823 |
23,420 |
42,243 |
80,803 |
25,849 |
106,652 |
99,626 |
49,269 |
148,895 |
| 60-64 |
13,866 |
18,932 |
32,798 |
42,926 |
13,668 |
56,594 |
56,792 |
32,600 |
89,392 |
| >64 |
22,547 |
31,698 |
54,245 |
29,367 |
14,643 |
44,010 |
51,914 |
46,341 |
98,255 |
| Total |
671,012 |
699,001 |
1,370,013 |
2,167,409 |
963,054 |
3,130,463 |
2,838,421 |
1,662,055 |
4,500,476 |
Source: PACI
ANNEXED NOTE
1. Characteristics of data and definitions
The source of data used here is the Public Authority for Civil Information (PACI), an independant government body in charge of :
1- centralising all population and labour force data in order to manage a fully computerised population register
2- issuing mandatory civil identification cards to every resident of the country, regardless of age and nationality.
The other source of demographic and socioeconomic data on Kuwait is the Central Statistical Office (CSO), operating within the Planning Ministry. The CSO has conducted ten population and housing censuses since its inception in 1957.
Since 1995 a marked discrepancy was witnessed between PACI’ and CSO’ population figures. PACI’ database is connected electronically with other administrations and bodies registering demographic events and professional/ residency issues (births and death; departures and arrivals; end of service, residency and ID deliveries, etc.).
PACI’s records of residents’ movements is thus regularly updated, which limits the risk of population overcount. Therefore, it is more likely that residents were undercounted during CSO- Ministry of Planning’s census operations (see: Shah, N. Population of Kuwait. Structure and Dynamics, Kuwait: Kuwait University Academic Publication Council, 2010, chapter 1).
(a) Kuwaiti: the Kuwaiti nationality rests upon a document of Kuwaiti nationality or a certificate proving Kuwaiti nationality issued by the Ministry of Interior of Kuwait.
(b) Non-Kuwaiti: his/ her nationality is determined by the name of the State which issued the passport. The foreign national also entered Kuwait legally and has a stamp of residence.
This category includes the Bidoon, a category of stateless persons living in the Emirate. Kuwait’s Bidoon population originates from three broad categories:
1) those whose ancestors failed to apply for nationality or lacked necessary documentation at the time of Kuwait’s independence in 1961;
2) those recruited to work in Kuwait’s army or police force during the 1960s who permanently settled in Kuwait, along with their families;
3) children of Kuwaiti mothers and stateless or foreign fathers (see Human Rights Watch. Prisoners of the Past. Kuwaiti Bidun and the Burden of Statelessness, June 2011, p. 3).
(The children of Kuwaiti mothers and non-Kuwaiti fathers (with specific nationality) inherit the father’s nationality. They are stateless if the father is stateless).
(c) Nationality group: collected according to the nationality of the head of the household.
Nationalities are grouped according to specific features common to certain population subgroups: language, geographic origin, etc. or according to internationally recognized categories such as: (Arab / non-Arab Asian countries / non-Arab African countries; European countries … etc.).
2. Institution which provides data
The Public Authority for Civil Information (PACI)
3. Period of data coverage: 31 December 2017
The database is updated three times a year and the website presents only the most recent data.
4. Data availability
The statistics section of PACI’s website (http://www.paci.gov.kw/en/ (English); http://www.paci.gov.kw/ (Arabic)) provides population and socio-economic data broken down by nationality (Kuwaiti/ non-Kuwaiti). Some data are displayed by nationality groups.
Analytical tables and data crosstabulations are available for download in PDF, html, .png and Excel (.csv) formats.
Date of access: March 2018
| |
Kuwaitis |
Non-Kuwaitis |
|
GRAND |
|
| |
|
Arabs |
|
|
Asians |
|
|
Africans |
|
|
Europeans |
|
|
North Americans |
|
|
South Americans |
|
|
Australians- Oceanians |
|
|
TOTAL non-Kuwaitis |
|
|
TOTAL |
|
| Age group |
males |
females |
total |
males |
females |
total |
males |
females |
total |
males |
females |
total |
males |
females |
total |
males |
females |
total |
males |
females |
total |
males |
females |
total |
males |
females |
total |
males |
females |
total |
| 0-4 |
84,257 |
80,976 |
165,233 |
51,271 |
48,754 |
100,025 |
21,537 |
20,309 |
41,846 |
298 |
281 |
579 |
598 |
610 |
1,208 |
1,228 |
946 |
2,174 |
61 |
62 |
123 |
78 |
71 |
149 |
75,071 |
71,033 |
146,104 |
159,328 |
152,009 |
311,337 |
| 5-9 |
84,427 |
81,799 |
166,226 |
52,206 |
49,943 |
102,149 |
18,983 |
18,349 |
37,332 |
173 |
176 |
349 |
691 |
659 |
1,350 |
993 |
882 |
1,875 |
70 |
86 |
156 |
105 |
85 |
190 |
73,221 |
70,180 |
143,401 |
157,648 |
151,979 |
309,627 |
| 10-14 |
78,076 |
75,767 |
153,843 |
42,209 |
39,516 |
81,725 |
13,911 |
13,300 |
27,211 |
131 |
129 |
260 |
566 |
506 |
1,072 |
843 |
791 |
1,634 |
78 |
57 |
135 |
76 |
68 |
144 |
57,814 |
54,367 |
112,181 |
135,890 |
130,134 |
266,024 |
| 15-19 |
68,035 |
65,404 |
133,439 |
33,703 |
31,586 |
65,289 |
8,886 |
8,405 |
17,291 |
159 |
131 |
290 |
339 |
339 |
678 |
759 |
689 |
1,448 |
47 |
49 |
96 |
65 |
46 |
111 |
43,958 |
41,245 |
85,203 |
111,993 |
106,649 |
218,642 |
| 20-24 |
66,153 |
64,147 |
130,300 |
47,506 |
30,437 |
77,943 |
82,083 |
15,319 |
97,402 |
706 |
4,002 |
4,708 |
289 |
469 |
758 |
432 |
525 |
957 |
73 |
58 |
131 |
42 |
58 |
100 |
131,131 |
50,868 |
181,999 |
197,284 |
115,015 |
312,299 |
| 25-29 |
55,983 |
56,069 |
112,052 |
124,078 |
40,695 |
164,773 |
203,135 |
70,389 |
273,524 |
2,045 |
12,921 |
14,966 |
622 |
861 |
1,483 |
739 |
699 |
1,438 |
80 |
105 |
185 |
50 |
57 |
107 |
330,749 |
125,727 |
456,476 |
386,732 |
181,796 |
568,528 |
| 30-34 |
48,809 |
52,571 |
101,380 |
124,699 |
44,828 |
169,527 |
222,544 |
85,779 |
308,323 |
2,525 |
11,887 |
14,412 |
873 |
983 |
1,856 |
941 |
674 |
1,615 |
124 |
91 |
215 |
59 |
49 |
108 |
351,765 |
144,291 |
496,056 |
400,574 |
196,862 |
597,436 |
| 35-39 |
40,315 |
44,555 |
84,870 |
104,741 |
35,716 |
140,457 |
237,503 |
86,507 |
324,010 |
1,377 |
4,357 |
5,734 |
968 |
900 |
1,868 |
1,035 |
566 |
1,601 |
104 |
94 |
198 |
89 |
64 |
153 |
345,817 |
128,204 |
474,021 |
386,132 |
172,759 |
558,891 |
| 40-44 |
34,793 |
39,712 |
74,505 |
76,173 |
25,203 |
101,376 |
186,306 |
74,827 |
261,133 |
686 |
1,567 |
2,253 |
1,007 |
753 |
1,760 |
894 |
497 |
1,391 |
88 |
53 |
141 |
72 |
49 |
121 |
265,226 |
102,949 |
368,175 |
300,019 |
142,661 |
442,680 |
| 45-49 |
29,793 |
34,430 |
64,223 |
57,155 |
18,765 |
75,920 |
144,680 |
54,146 |
198,826 |
431 |
475 |
906 |
1,052 |
611 |
1,663 |
1,052 |
466 |
1,518 |
89 |
38 |
127 |
74 |
49 |
123 |
204,533 |
74,550 |
279,083 |
234,326 |
108,980 |
343,306 |
| 50-54 |
25,135 |
29,521 |
54,656 |
45,457 |
14,504 |
59,961 |
86,907 |
29,780 |
116,687 |
282 |
145 |
427 |
978 |
508 |
1,486 |
1,206 |
448 |
1,654 |
93 |
44 |
137 |
105 |
51 |
156 |
135,028 |
45,480 |
180,508 |
160,163 |
75,001 |
235,164 |
| 55-59 |
18,823 |
23,420 |
42,243 |
29,352 |
10,301 |
39,653 |
49,109 |
14,644 |
63,753 |
175 |
97 |
272 |
844 |
376 |
1,220 |
1,159 |
376 |
1,535 |
68 |
25 |
93 |
96 |
30 |
126 |
80,803 |
25,849 |
106,652 |
99,626 |
49,269 |
148,895 |
| 60-64 |
13,866 |
18,932 |
32,798 |
17,647 |
6,850 |
24,497 |
23,888 |
6,231 |
30,119 |
96 |
62 |
158 |
526 |
248 |
774 |
681 |
247 |
928 |
43 |
17 |
60 |
45 |
13 |
58 |
42,926 |
13,668 |
56,594 |
56,792 |
32,600 |
89,392 |
| >64 |
22,547 |
31,698 |
54,245 |
16,973 |
10,481 |
27,454 |
11,366 |
3,635 |
15,001 |
50 |
36 |
86 |
385 |
235 |
620 |
537 |
227 |
764 |
25 |
9 |
34 |
31 |
20 |
51 |
29,367 |
14,643 |
44,010 |
51,914 |
46,341 |
98,255 |
| Total |
671,012 |
699,001 |
1,370,013 |
823,170 |
407,579 |
1,230,749 |
1,310,838 |
501,620 |
1,812,458 |
9,134 |
36,266 |
45,400 |
9,738 |
8,058 |
17,796 |
12,499 |
8,033 |
20,532 |
1,043 |
788 |
1,831 |
987 |
710 |
1,697 |
2,167,409 |
963,054 |
3,130,463 |
2,838,421 |
1,662,055 |
4,500,476 |
Source: PACI
ANNEXED NOTE
1. Characteristics of data and definitions
The source of data used here is the Public Authority for Civil Information (PACI), an independant government body in charge of :
1- centralising all population and labour force data in order to manage a fully computerised population register
2- issuing mandatory civil identification cards to every resident of the country, regardless of age and nationality.
The other source of demographic and socioeconomic data on Kuwait is the Central Statistical Office (CSO), operating within the Planning Ministry. The CSO has conducted ten population and housing censuses since its inception in 1957.
Since 1995 a marked discrepancy was witnessed between PACI’ and CSO’ population figures. PACI’ database is connected electronically with other administrations and bodies registering demographic events and professional/ residency issues (births and death; departures and arrivals; end of service, residency and ID deliveries, etc.).
PACI’s records of residents’ movements is thus regularly updated, which limits the risk of population overcount. Therefore, it is more likely that residents were undercounted during CSO- Ministry of Planning’s census operations (see: Shah, N. Population of Kuwait. Structure and Dynamics, Kuwait: Kuwait University Academic Publication Council, 2010, chapter 1).
(a) Kuwaiti: the Kuwaiti nationality rests upon a document of Kuwaiti nationality or a certificate proving Kuwaiti nationality issued by the Ministry of Interior of Kuwait.
(b) Non-Kuwaiti: his/ her nationality is determined by the name of the State which issued the passport. The foreign national also entered Kuwait legally and has a stamp of residence.
This category includes the Bidoon, a category of stateless persons living in the Emirate. Kuwait’s Bidoon population originates from three broad categories:
1) those whose ancestors failed to apply for nationality or lacked necessary documentation at the time of Kuwait’s independence in 1961;
2) those recruited to work in Kuwait’s army or police force during the 1960s who permanently settled in Kuwait, along with their families;
3) children of Kuwaiti mothers and stateless or foreign fathers (see Human Rights Watch. Prisoners of the Past. Kuwaiti Bidun and the Burden of Statelessness, June 2011, p. 3).
(The children of Kuwaiti mothers and non-Kuwaiti fathers (with specific nationality) inherit the father’s nationality. They are stateless if the father is stateless).
(c) Nationality group: collected according to the nationality of the head of the household.
Nationalities are grouped according to specific features common to certain population subgroups: language, geographic origin, etc. or according to internationally recognized categories such as: (Arab / non-Arab Asian countries / non-Arab African countries; European countries … etc.).
2. Institution which provides data
The Public Authority for Civil Information (PACI)
3. Period of data coverage: 31 December 2017
The database is updated three times a year and the website presents only the most recent data.
4. Data availability
The statistics section of PACI’s website (http://www.paci.gov.kw/en/ (English); http://www.paci.gov.kw/ (Arabic)) provides population and socio-economic data broken down by nationality (Kuwaiti/ non-Kuwaiti). Some data are displayed by nationality groups.
Analytical tables and data crosstabulations are available for download in PDF, html, .png and Excel (.csv) formats.
Date of access: March 2018
| |
Kuwaitis |
Non-Kuwaitis |
Total |
| 0-4 |
165,233 |
146,104 |
311,337 |
| 5-9 |
166,226 |
143,401 |
309,627 |
| 10-14 |
153,843 |
112,181 |
266,024 |
| 15-19 |
133,439 |
85,203 |
218,642 |
| 20-24 |
130,300 |
181,999 |
312,299 |
| 25-29 |
112,052 |
456,476 |
568,528 |
| 30-34 |
101,380 |
496,056 |
597,436 |
| 35-39 |
84,870 |
474,021 |
558,891 |
| 40-44 |
74,505 |
368,175 |
442,680 |
| 45-49 |
64,223 |
279,083 |
343,306 |
| 50-54 |
54,656 |
180,508 |
235,164 |
| 55-59 |
42,243 |
106,652 |
148,895 |
| 60-64 |
32,798 |
56,594 |
89,392 |
| >64 |
54,245 |
44,010 |
98,255 |
| Total |
1,370,013 |
3,130,463 |
4,500,476 |
Source: PACI
ANNEXED NOTE
1. Characteristics of data and definitions
The source of data used here is the Public Authority for Civil Information (PACI), an independant government body in charge of :
1- centralising all population and labour force data in order to manage a fully computerised population register
2- issuing mandatory civil identification cards to every resident of the country, regardless of age and nationality.
The other source of demographic and socioeconomic data on Kuwait is the Central Statistical Office (CSO), operating within the Planning Ministry. The CSO has conducted ten population and housing censuses since its inception in 1957.
Since 1995 a marked discrepancy was witnessed between PACI’ and CSO’ population figures. PACI’ database is connected electronically with other administrations and bodies registering demographic events and professional/ residency issues (births and death; departures and arrivals; end of service, residency and ID deliveries, etc.).
PACI’s records of residents’ movements is thus regularly updated, which limits the risk of population overcount. Therefore, it is more likely that residents were undercounted during CSO- Ministry of Planning’s census operations (see: Shah, N. Population of Kuwait. Structure and Dynamics, Kuwait: Kuwait University Academic Publication Council, 2010, chapter 1).
(a) Kuwaiti: the Kuwaiti nationality rests upon a document of Kuwaiti nationality or a certificate proving Kuwaiti nationality issued by the Ministry of Interior of Kuwait.
(b) Non-Kuwaiti: his/ her nationality is determined by the name of the State which issued the passport. The foreign national also entered Kuwait legally and has a stamp of residence.
This category includes the Bidoon, a category of stateless persons living in the Emirate. Kuwait’s Bidoon population originates from three broad categories:
1) those whose ancestors failed to apply for nationality or lacked necessary documentation at the time of Kuwait’s independence in 1961;
2) those recruited to work in Kuwait’s army or police force during the 1960s who permanently settled in Kuwait, along with their families;
3) children of Kuwaiti mothers and stateless or foreign fathers (see Human Rights Watch. Prisoners of the Past. Kuwaiti Bidun and the Burden of Statelessness, June 2011, p. 3).
(The children of Kuwaiti mothers and non-Kuwaiti fathers (with specific nationality) inherit the father’s nationality. They are stateless if the father is stateless).
(c) Nationality group: collected according to the nationality of the head of the household.
Nationalities are grouped according to specific features common to certain population subgroups: language, geographic origin, etc. or according to internationally recognized categories such as: (Arab / non-Arab Asian countries / non-Arab African countries; European countries … etc.).
2. Institution which provides data
The Public Authority for Civil Information (PACI)
3. Period of data coverage: 31 December 2017
The database is updated three times a year and the website presents only the most recent data.
4. Data availability
The statistics section of PACI’s website (http://www.paci.gov.kw/en/ (English); http://www.paci.gov.kw/ (Arabic)) provides population and socio-economic data broken down by nationality (Kuwaiti/ non-Kuwaiti). Some data are displayed by nationality groups.
Analytical tables and data crosstabulations are available for download in PDF, html, .png and Excel (.csv) formats.
Date of access: March 2018
| |
Kuwaitis |
Non-Kuwaitis |
|
TOTAL |
|
| Age group |
males |
females |
total |
males |
females |
total |
males |
females |
total |
| 0-4 |
84,418 |
80,956 |
165,374 |
78,804 |
74,997 |
153,801 |
163,222 |
155,953 |
319,175 |
| 5-9 |
83,857 |
81,410 |
165,267 |
74,338 |
70,946 |
145,284 |
158,195 |
152,356 |
310,551 |
| 10-14 |
75,786 |
73,667 |
149,453 |
56,262 |
52,703 |
108,965 |
132,048 |
126,370 |
258,418 |
| 15-19 |
67,323 |
64,547 |
131,870 |
43,747 |
41,227 |
84,974 |
111,070 |
105,774 |
216,844 |
| 20-24 |
65,100 |
63,019 |
128,119 |
128,936 |
53,354 |
182,290 |
194,036 |
116,373 |
310,409 |
| 25-29 |
54,078 |
53,986 |
108,064 |
312,241 |
138,383 |
450,624 |
366,319 |
192,369 |
558,688 |
| 30-34 |
47,291 |
50,382 |
97,673 |
338,530 |
148,917 |
487,447 |
385,821 |
199,299 |
585,120 |
| 35-39 |
38,944 |
43,136 |
82,080 |
330,559 |
130,634 |
461,193 |
369,503 |
173,770 |
543,273 |
| 40-44 |
33,856 |
38,442 |
72,298 |
254,143 |
103,270 |
357,413 |
287,999 |
141,712 |
429,711 |
| 45-49 |
29,037 |
33,579 |
62,616 |
197,467 |
73,941 |
271,408 |
226,504 |
107,520 |
334,024 |
| 50-54 |
24,304 |
28,519 |
52,823 |
128,167 |
44,425 |
172,592 |
152,471 |
72,944 |
225,415 |
| 55-59 |
17,545 |
22,422 |
39,967 |
77,925 |
24,576 |
102,501 |
95,470 |
46,998 |
142,468 |
| 60-64 |
13,038 |
17,774 |
30,812 |
40,662 |
12,977 |
53,639 |
53,700 |
30,751 |
84,451 |
| >64 |
21,507 |
29,770 |
51,277 |
27,521 |
13,779 |
41,300 |
49,028 |
43,549 |
92,577 |
| Total |
656,084 |
681,609 |
1,337,693 |
2,089,302 |
984,129 |
3,073,431 |
2,745,386 |
1,664,415 |
4,411,124 |
Source: PACI
ANNEXED NOTE
1. Characteristics of data and definitions
The source of data used here is the Public Authority for Civil Information (PACI), an independant government body in charge of :
1- centralising all population and labour force data in order to manage a fully computerised population register
2- issuing mandatory civil identification cards to every resident of the country, regardless of age and nationality.
The other source of demographic and socioeconomic data on Kuwait is the Central Statistical Office (CSO), operating within the Planning Ministry. The CSO has conducted ten population and housing censuses since its inception in 1957.
Since 1995 a marked discrepancy was witnessed between PACI’ and CSO’ population figures. PACI’ database is connected electronically with other administrations and bodies registering demographic events and professional/ residency issues (births and death; departures and arrivals; end of service, residency and ID deliveries, etc.).
PACI’s records of residents’ movements is thus regularly updated, which limits the risk of population overcount. Therefore, it is more likely that residents were undercounted during CSO- Ministry of Planning’s census operations (see: Shah, N. Population of Kuwait. Structure and Dynamics, Kuwait: Kuwait University Academic Publication Council, 2010, chapter 1).
(a) Kuwaiti: the Kuwaiti nationality rests upon a document of Kuwaiti nationality or a certificate proving Kuwaiti nationality issued by the Ministry of Interior of Kuwait.
(b) Non-Kuwaiti: his/ her nationality is determined by the name of the State which issued the passport. The foreign national also entered Kuwait legally and has a stamp of residence.
This category includes the Bidoon, a category of stateless persons living in the Emirate. Kuwait’s Bidoon population originates from three broad categories:
1) those whose ancestors failed to apply for nationality or lacked necessary documentation at the time of Kuwait’s independence in 1961;
2) those recruited to work in Kuwait’s army or police force during the 1960s who permanently settled in Kuwait, along with their families;
3) children of Kuwaiti mothers and stateless or foreign fathers (see Human Rights Watch. Prisoners of the Past. Kuwaiti Bidun and the Burden of Statelessness, June 2011, p. 3).
(The children of Kuwaiti mothers and non-Kuwaiti fathers (with specific nationality) inherit the father’s nationality. They are stateless if the father is stateless).
(c) Nationality group: collected according to the nationality of the head of the household.
Nationalities are grouped according to specific features common to certain population subgroups: language, geographic origin, etc. or according to internationally recognized categories such as: (Arab / non-Arab Asian countries / non-Arab African countries; European countries … etc.).
2. Institution which provides data
The Public Authority for Civil Information (PACI)
3. Period of data coverage: 31 December 2016
The database is updated three times a year and the website presents only the most recent data.
4. Data availability
The statistics section of PACI’s website (http://www.paci.gov.kw/en/ (English); http://www.paci.gov.kw/ (Arabic)) provides population and socio-economic data broken down by nationality (Kuwaiti/ non-Kuwaiti). Some data are displayed by nationality groups.
Analytical tables and data crosstabulations are available for download in PDF, html, .png and Excel (.csv) formats.
Date of access: March 2017
|
Males |
Females |
Total |
| Kuwaitis |
671,012 |
699,001 |
1,370,013 |
| Arabs |
823,170 |
407,579 |
1,230,749 |
| Asians |
1,310,838 |
501,620 |
1,812,458 |
| Africans |
9,134 |
36,266 |
45,400 |
| Europeans |
9,738 |
8,058 |
17,796 |
| North Americans |
12,499 |
8,033 |
20,532 |
| South Americans |
1,043 |
788 |
1,831 |
| Australians- Oceanians |
987 |
710 |
1,697 |
| TOTAL non-Kuwaitis |
2,167,409 |
963,054 |
3,130,463 |
| TOTAL |
2,838,421 |
1,662,055 |
4,500,476 |
Source: PACI
ANNEXED NOTE
1. Characteristics of data and definitions
The source of data used here is the Public Authority for Civil Information (PACI), an independant government body in charge of :
1- centralising all population and labour force data in order to manage a fully computerised population register
2- issuing mandatory civil identification cards to every resident of the country, regardless of age and nationality.
The other source of demographic and socioeconomic data on Kuwait is the Central Statistical Office (CSO), operating within the Planning Ministry. The CSO has conducted ten population and housing censuses since its inception in 1957.
Since 1995 a marked discrepancy was witnessed between PACI’ and CSO’ population figures. PACI’ database is connected electronically with other administrations and bodies registering demographic events and professional/ residency issues (births and death; departures and arrivals; end of service, residency and ID deliveries, etc.).
PACI’s records of residents’ movements is thus regularly updated, which limits the risk of population overcount. Therefore, it is more likely that residents were undercounted during CSO- Ministry of Planning’s census operations (see: Shah, N. Population of Kuwait. Structure and Dynamics, Kuwait: Kuwait University Academic Publication Council, 2010, chapter 1).
(a) Kuwaiti: the Kuwaiti nationality rests upon a document of Kuwaiti nationality or a certificate proving Kuwaiti nationality issued by the Ministry of Interior of Kuwait.
(b) Non-Kuwaiti: his/ her nationality is determined by the name of the State which issued the passport. The foreign national also entered Kuwait legally and has a stamp of residence.
This category includes the Bidoon, a category of stateless persons living in the Emirate. Kuwait’s Bidoon population originates from three broad categories:
1) those whose ancestors failed to apply for nationality or lacked necessary documentation at the time of Kuwait’s independence in 1961;
2) those recruited to work in Kuwait’s army or police force during the 1960s who permanently settled in Kuwait, along with their families;
3) children of Kuwaiti mothers and stateless or foreign fathers (see Human Rights Watch. Prisoners of the Past. Kuwaiti Bidun and the Burden of Statelessness, June 2011, p. 3).
(The children of Kuwaiti mothers and non-Kuwaiti fathers (with specific nationality) inherit the father’s nationality. They are stateless if the father is stateless).
(c) Nationality group: collected according to the nationality of the head of the household.
Nationalities are grouped according to specific features common to certain population subgroups: language, geographic origin, etc. or according to internationally recognized categories such as: (Arab / non-Arab Asian countries / non-Arab African countries; European countries … etc.).
2. Institution which provides data
The Public Authority for Civil Information (PACI)
3. Period of data coverage: 31 December 2017
The database is updated three times a year and the website presents only the most recent data.
4. Data availability
The statistics section of PACI’s website (http://www.paci.gov.kw/en/ (English); http://www.paci.gov.kw/ (Arabic)) provides population and socio-economic data broken down by nationality (Kuwaiti/ non-Kuwaiti). Some data are displayed by nationality groups.
Analytical tables and data crosstabulations are available for download in PDF, html, .png and Excel (.csv) formats.
Date of access: March 2018
|
Males |
Females |
Total |
| Kuwaitis |
656,084 |
681,609 |
1,337,693 |
| Arabs |
806,768 |
407,567 |
1,214,335 |
| Asians |
1,250,226 |
518,803 |
1,769,029 |
| Africans |
8,446 |
40,411 |
48,857 |
| Europeans |
9,061 |
6,364 |
15,425 |
| North Americans |
12,856 |
8,178 |
21,034 |
| South Americans |
967 |
774 |
1,741 |
| Australians- Oceanians |
978 |
709 |
1,687 |
| TOTAL non-Kuwaitis |
2,089,302 |
984,129 |
3,073,431 |
| TOTAL |
2,745,386 |
1,664,415 |
4,411,124 |
Source: PACI
ANNEXED NOTE
1. Characteristics of data and definitions
The source of data used here is the Public Authority for Civil Information (PACI), an independant government body in charge of :
1- centralising all population and labour force data in order to manage a fully computerised population register
2- issuing mandatory civil identification cards to every resident of the country, regardless of age and nationality.
The other source of demographic and socioeconomic data on Kuwait is the Central Statistical Office (CSO), operating within the Planning Ministry. The CSO has conducted ten population and housing censuses since its inception in 1957.
Since 1995 a marked discrepancy was witnessed between PACI’ and CSO’ population figures. PACI’ database is connected electronically with other administrations and bodies registering demographic events and professional/ residency issues (births and death; departures and arrivals; end of service, residency and ID deliveries, etc.).
PACI’s records of residents’ movements is thus regularly updated, which limits the risk of population overcount. Therefore, it is more likely that residents were undercounted during CSO- Ministry of Planning’s census operations (see: Shah, N. Population of Kuwait. Structure and Dynamics, Kuwait: Kuwait University Academic Publication Council, 2010, chapter 1).
(a) Kuwaiti: the Kuwaiti nationality rests upon a document of Kuwaiti nationality or a certificate proving Kuwaiti nationality issued by the Ministry of Interior of Kuwait.
(b) Non-Kuwaiti: his/ her nationality is determined by the name of the State which issued the passport. The foreign national also entered Kuwait legally and has a stamp of residence.
This category includes the Bidoon, a category of stateless persons living in the Emirate. Kuwait’s Bidoon population originates from three broad categories:
1) those whose ancestors failed to apply for nationality or lacked necessary documentation at the time of Kuwait’s independence in 1961;
2) those recruited to work in Kuwait’s army or police force during the 1960s who permanently settled in Kuwait, along with their families;
3) children of Kuwaiti mothers and stateless or foreign fathers (see Human Rights Watch. Prisoners of the Past. Kuwaiti Bidun and the Burden of Statelessness, June 2011, p. 3).
(The children of Kuwaiti mothers and non-Kuwaiti fathers (with specific nationality) inherit the father’s nationality. They are stateless if the father is stateless).
(c) Nationality group: collected according to the nationality of the head of the household.
Nationalities are grouped according to specific features common to certain population subgroups: language, geographic origin, etc. or according to internationally recognized categories such as: (Arab / non-Arab Asian countries / non-Arab African countries; European countries … etc.).
2. Institution which provides data
The Public Authority for Civil Information (PACI)
3. Period of data coverage: 31 December 2016
The database is updated three times a year and the website presents only the most recent data.
4. Data availability
The statistics section of PACI’s website (http://www.paci.gov.kw/en/ (English); http://www.paci.gov.kw/ (Arabic)) provides population and socio-economic data broken down by nationality (Kuwaiti/ non-Kuwaiti). Some data are displayed by nationality groups.
Analytical tables and data crosstabulations are available for download in PDF, html, .png and Excel (.csv) formats.
Date of access: March 2017
| |
Born in Kuwait |
Born out of Kuwait |
Total |
| Male |
Female |
Total |
Male |
Female |
Total |
Male |
Female |
Total |
| 0-4 |
60,055 |
56,895 |
116,950 |
15,016 |
14,138 |
29,154 |
75,071 |
71,033 |
146,104 |
| 5-9 |
50,029 |
48,088 |
98,117 |
23,192 |
22,092 |
45,284 |
73,221 |
70,180 |
143,401 |
| 10-14 |
34,773 |
33,168 |
67,941 |
23,041 |
21,199 |
44,240 |
57,814 |
54,367 |
112,181 |
| 15-19 |
24,706 |
24,184 |
48,890 |
19,252 |
17,061 |
36,313 |
43,958 |
41,245 |
85,203 |
| 20-24 |
21,492 |
21,288 |
42,780 |
109,639 |
29,580 |
139,219 |
131,131 |
50,868 |
181,999 |
| 25-29 |
18,419 |
16,651 |
35,070 |
312,330 |
109,076 |
421,406 |
330,749 |
125,727 |
456,476 |
| 30-34 |
20,767 |
17,841 |
38,608 |
330,998 |
126,450 |
457,448 |
351,765 |
144,291 |
496,056 |
| 35-39 |
17,652 |
13,237 |
30,889 |
328,165 |
114,967 |
443,132 |
345,817 |
128,204 |
474,021 |
| 40-44 |
12,535 |
8,625 |
21,160 |
252,691 |
94,324 |
347,015 |
265,226 |
102,949 |
368,175 |
| 45-49 |
9,123 |
6,430 |
15,553 |
195,410 |
68,120 |
263,530 |
204,533 |
74,550 |
279,083 |
| 50-54 |
6,210 |
4,016 |
10,226 |
128,818 |
41,464 |
170,282 |
135,028 |
45,480 |
180,508 |
| 55-59 |
3,163 |
1,596 |
4,759 |
77,640 |
24,253 |
101,893 |
80,803 |
25,849 |
106,652 |
| 60-64 |
1,359 |
578 |
1,937 |
41,567 |
13,090 |
54,657 |
42,926 |
13,668 |
56,594 |
| 65+ |
2,088 |
399 |
2,487 |
27,279 |
14,244 |
41,523 |
29,367 |
14,643 |
44,010 |
| Total |
282,371 |
252,996 |
535,367 |
1,885,038 |
710,058 |
2,595,096 |
2,167,409 |
963,054 |
3,130,463 |
Source: PACI
ANNEXED NOTE
- Characteristics of data and definitions
The source of data used here is the Public Authority for Civil Information (PACI), an independent government body in charge of :
1- centralising all population and labour force data in order to manage a fully computerised population register
2- issuing mandatory civil identification cards to every resident of the country, regardless of age and nationality.
Another source of demographic and socioeconomic data on Kuwait is the Central Statistical Office (CSO), operating within the Planning Ministry. The CSO has conducted ten population and housing censuses since its inception in 1957.
Since 1995 a marked discrepancy was witnessed between PACI’s and CSO’s population figures. PACI’s database is connected electronically with other administrations and bodies registering demographic events and professional/ residency issues (births and death; departures and arrivals; end of service, residency and ID deliveries, etc.).
PACI’s records of residents’ movements is thus regularly updated, which limits the risk of population overcount. Therefore, it is more likely that residents were undercounted during CSO- Ministry of Planning’s census operations (see: Shah, N. Population of Kuwait. Structure and Dynamics, Kuwait: Kuwait University Academic Publication Council, 2010, chapter 1).
(a) Kuwaiti: the Kuwaiti nationality rests upon a document of Kuwaiti nationality or a certificate proving Kuwaiti nationality issued by the Ministry of Interior of Kuwait.
(b) Non-Kuwaiti: his/ her nationality is determined by the name of the State which issued the passport. The foreign national also entered Kuwait legally and has a stamp of residence.
This category includes the Bidoon, a category of stateless persons living in the Emirate. Kuwait’s Bidoon population originates from three broad categories:
1) those whose ancestors failed to apply for nationality or lacked necessary documentation at the time of Kuwait’s independence in 1961;
2) those recruited to work in Kuwait’s army or police force during the 1960s who permanently settled in Kuwait, along with their families;
3) children of Kuwaiti mothers and stateless or foreign fathers (see Human Rights Watch. Prisoners of the Past. Kuwaiti Bidun and the Burden of Statelessness, June 2011, p. 3).
(The children of Kuwaiti mothers and non-Kuwaiti fathers (with specific nationality) inherit the father’s nationality. They are stateless if the father is stateless).
- Institution which provides data
The Public Authority for Civil Information (PACI)
- Period of data coverage: 31 December
The database is updated twice a year and the website presents only the most recent data.
- Data availability
The statistics section of PACI’s website (http://www.paci.gov.kw/en/ (English); http://www.paci.gov.kw/ (Arabic)) provides population and socio-economic data broken down by nationality (Kuwaiti/ non-Kuwaiti). Some data are displayed by nationality groups.
Analytical tables and data crosstabulations are available for download in PDF, html, .png and Excel (.csv) formats.
PACI website has been inaccessible from outside Kuwait since 2019.
Last date of access: September 2022.
GLMM and GRC cannot guarantee that the link to access the source will not change; that the information will not be removed from the website it was obtained from; that no geo-blockages will be imposed; or that the information will not be available for any another reason.
|
|
Kuwaitis |
|
|
Non-Kuwaitis |
|
|
Total |
|
| Year |
Male |
Female |
Total |
Male |
Female |
Total |
Male |
Female |
Total |
| 1990 |
286,299 |
292,212 |
578,511 |
944,585 |
628,584 |
1,573,169 |
1,230,884 |
920,796 |
2,151,680 |
| 1993 |
325,892 |
331,601 |
657,493 |
682,161 |
305,973 |
988,134 |
1,008,053 |
637,574 |
1,645,627 |
| 1995 |
351,314 |
356,801 |
708,115 |
841,320 |
409,359 |
1,250,679 |
1,192,634 |
766,160 |
1,958,794 |
| 1996 |
363,476 |
368,927 |
732,403 |
914,327 |
447,159 |
1,361,486 |
1,277,803 |
816,086 |
2,093,889 |
| 1997 |
n.a. |
n.a. |
n.a. |
n.a. |
n.a. |
n.a. |
n.a. |
n.a. |
n.a. |
| 1998 |
388,687 |
397,323 |
786,010 |
1,002,718 |
482,137 |
1,484,855 |
1,391,405 |
879,460 |
2,270,865 |
| 1999 |
401,433 |
410,822 |
812,255 |
970,865 |
471,834 |
1,442,699 |
1,372,298 |
882,656 |
2,254,954 |
| 2000 |
415,613 |
426,177 |
841,790 |
927,023 |
448,445 |
1,375,468 |
1,342,636 |
874,622 |
2,217,258 |
| 2001 |
429,209 |
441,074 |
870,283 |
960,390 |
478,429 |
1,438,819 |
1,389,599 |
919,503 |
2,309,102 |
| 2002 |
442,310 |
455,975 |
898,285 |
1,020,913 |
500,730 |
1,521,643 |
1,463,223 |
956,705 |
2,419,928 |
| 2003 |
456,226 |
471,460 |
927,686 |
1,098,878 |
520,120 |
1,618,998 |
1,555,104 |
991,580 |
2,546,684 |
| 2004 |
469,327 |
486,907 |
956,234 |
1,240,267 |
557,155 |
1,797,422 |
1,709,594 |
1,044,062 |
2,753,656 |
| 2005 |
486,089 |
506,128 |
992,217 |
1,391,322 |
607,650 |
1,998,972 |
1,877,411 |
1,113,778 |
2,991,189 |
| 2006 |
501,148 |
522,168 |
1,023,316 |
1,510,818 |
648,826 |
2,159,644 |
2,011,966 |
1,170,994 |
3,182,960 |
| 2007 |
516,631 |
537,966 |
1,054,597 |
1,615,273 |
729,767 |
2,345,040 |
2,131,904 |
1,267,733 |
3,399,637 |
| 2008 |
532,566 |
554,985 |
1,087,551 |
1,618,766 |
735,496 |
2,354,262 |
2,151,332 |
1,290,481 |
3,441,813 |
| 2009 |
548,290 |
570,620 |
1,118,910 |
1,591,935 |
774,036 |
2,365,971 |
2,140,225 |
1,344,656 |
3,484,881 |
| 2010 |
563,631 |
584,712 |
1,148,343 |
1,586,716 |
846,995 |
2,433,711 |
2,150,347 |
1,431,707 |
3,582,054 |
| 2011 |
580,558 |
602,616 |
1,183,174 |
1,641,135 |
872,983 |
2,514,118 |
2,221,693 |
1,475,599 |
3,697,292 |
| 2012 |
595,365 |
617,071 |
1,212,436 |
1,705,468 |
905,824 |
2,611,292 |
2,300,833 |
1,522,895 |
3,823,728 |
| 2013 |
610,545 |
631,954 |
1,242,499 |
1,772,413 |
950,232 |
2,722,645 |
2,382,958 |
1,582,186 |
3,965,144 |
| 2014 |
626,256 |
649,601 |
1,275,857 |
1,855,279 |
960,857 |
2,816,136 |
2,481,535 |
1,610,458 |
4,091,993 |
| 2015 |
641,282 |
666,323 |
1,307,605 |
1,964,264 |
967,137 |
2,931,401 |
2,605,546 |
1,633,460 |
4,239,006 |
| 2016 |
656,084 |
681,609 |
1,337,693 |
2,089,302 |
984,129 |
3,073,431 |
2,745,386 |
1,665,738 |
4,411,124 |
| 2017 |
671,012 |
699,001 |
1,370,013 |
2,167,409 |
963,054 |
3,130,463 |
2,838,421 |
1,662,055 |
4,500,476 |
Source: PACI
ANNEXED NOTE
1. Characteristics of data and definitions
The source of data used here is the Public Authority for Civil Information (PACI), an independant government body in charge of :
1- centralising all population and labour force data in order to manage a fully computerised population register
2- issuing mandatory civil identification cards to every resident of the country, regardless of age and nationality.
The other source of demographic and socioeconomic data on Kuwait is the Central Statistical Office (CSO), operating within the Planning Ministry. The CSO has conducted ten population and housing censuses since its inception in 1957.
Since 1995 a marked discrepancy was witnessed between PACI’ and CSO’ population figures. PACI’ database is connected electronically with other administrations and bodies registering demographic events and professional/ residency issues (births and death; departures and arrivals; end of service, residency and ID deliveries, etc.).
PACI’s records of residents’ movements is thus regularly updated, which limits the risk of population overcount. Therefore, it is more likely that residents were undercounted during CSO- Ministry of Planning’s census operations (see: Shah, N. Population of Kuwait. Structure and Dynamics, Kuwait: Kuwait University Academic Publication Council, 2010, chapter 1).
(a) Kuwaiti: the Kuwaiti nationality rests upon a document of Kuwaiti nationality or a certificate proving Kuwaiti nationality issued by the Ministry of Interior of Kuwait.
(b) Non-Kuwaiti: his/ her nationality is determined by the name of the State which issued the passport. The foreign national also entered Kuwait legally and has a stamp of residence.
This category includes the Bidoon, a category of stateless persons living in the Emirate. Kuwait’s Bidoon population originates from three broad categories:
1) those whose ancestors failed to apply for nationality or lacked necessary documentation at the time of Kuwait’s independence in 1961;
2) those recruited to work in Kuwait’s army or police force during the 1960s who permanently settled in Kuwait, along with their families;
3) children of Kuwaiti mothers and stateless or foreign fathers (see Human Rights Watch. Prisoners of the Past. Kuwaiti Bidun and the Burden of Statelessness, June 2011, p. 3).
(The children of Kuwaiti mothers and non-Kuwaiti fathers (with specific nationality) inherit the father’s nationality. They are stateless if the father is stateless).
(c) Nationality group: collected according to the nationality of the head of the household.
Nationalities are grouped according to specific features common to certain population subgroups: language, geographic origin, etc. or according to internationally recognized categories such as: (Arab / non-Arab Asian countries / non-Arab African countries; European countries … etc.).
2. Institution which provides data
The Public Authority for Civil Information (PACI)
3. Period of data coverage: 31 December 2017
The database is updated three times a year and the website presents only the most recent data.
4. Data availability
The statistics section of PACI’s website (http://www.paci.gov.kw/en/ (English); http://www.paci.gov.kw/ (Arabic)) provides population and socio-economic data broken down by nationality (Kuwaiti/ non-Kuwaiti). Some data are displayed by nationality groups.
Analytical tables and data crosstabulations are available for download in PDF, html, .png and Excel (.csv) formats.
Date of access: March 2018
| Year |
Kuwaitis |
Non-Kuwaitis |
Total |
| 1990 |
578,511 |
1,573,169 |
2,151,680 |
| 1993 |
657,493 |
988,134 |
1,645,627 |
| 1995 |
708,115 |
1,250,679 |
1,958,794 |
| 1996 |
732,403 |
1,361,486 |
2,093,889 |
| 1998 |
786,010 |
1,484,855 |
2,270,865 |
| 1999 |
812,255 |
1,442,699 |
2,254,954 |
| 2000 |
841,790 |
1,375,468 |
2,217,258 |
| 2001 |
870,283 |
1,438,819 |
2,309,102 |
| 2002 |
898,285 |
1,521,643 |
2,419,928 |
| 2003 |
927,686 |
1,618,998 |
2,546,684 |
| 2004 |
956,234 |
1,797,422 |
2,753,656 |
| 2005 |
992,217 |
1,998,972 |
2,991,189 |
| 2006 |
1,023,316 |
2,159,644 |
3,182,960 |
| 2007 |
1,054,598 |
2,345,039 |
3,399,637 |
| 2008 |
1,087,552 |
2,354,261 |
3,441,813 |
| 2009 |
1,118,911 |
2,365,970 |
3,484,881 |
| 2010 |
1,148,363 |
2,433,691 |
3,582,054 |
| 2011 |
1,183,185 |
2,514,107 |
3,697,292 |
| 2012 |
1,212,436 |
2,611,292 |
3,823,728 |
| 2013 |
1,242,499 |
2,722,645 |
3,965,144 |
| 2014 |
1,275,857 |
2,816,136 |
4,091,993 |
| 2015 |
1,307,605 |
2,931,401 |
4,239,006 |
| 2016 |
1,337,693 |
3,073,431 |
4,411,124 |
| 2017 |
1,370,013 |
3,130,463 |
4,500,476 |
Source: PACI
ANNEXED NOTE
1. Characteristics of data and definitions
The source of data used here is the Public Authority for Civil Information (PACI), an independant government body in charge of :
1- centralising all population and labour force data in order to manage a fully computerised population register
2- issuing mandatory civil identification cards to every resident of the country, regardless of age and nationality.
The other source of demographic and socioeconomic data on Kuwait is the Central Statistical Office (CSO), operating within the Planning Ministry. The CSO has conducted ten population and housing censuses since its inception in 1957.
Since 1995 a marked discrepancy was witnessed between PACI’ and CSO’ population figures. PACI’ database is connected electronically with other administrations and bodies registering demographic events and professional/ residency issues (births and death; departures and arrivals; end of service, residency and ID deliveries, etc.).
PACI’s records of residents’ movements is thus regularly updated, which limits the risk of population overcount. Therefore, it is more likely that residents were undercounted during CSO- Ministry of Planning’s census operations (see: Shah, N. Population of Kuwait. Structure and Dynamics, Kuwait: Kuwait University Academic Publication Council, 2010, chapter 1).
(a) Kuwaiti: the Kuwaiti nationality rests upon a document of Kuwaiti nationality or a certificate proving Kuwaiti nationality issued by the Ministry of Interior of Kuwait.
(b) Non-Kuwaiti: his/ her nationality is determined by the name of the State which issued the passport. The foreign national also entered Kuwait legally and has a stamp of residence.
This category includes the Bidoon, a category of stateless persons living in the Emirate. Kuwait’s Bidoon population originates from three broad categories:
1) those whose ancestors failed to apply for nationality or lacked necessary documentation at the time of Kuwait’s independence in 1961;
2) those recruited to work in Kuwait’s army or police force during the 1960s who permanently settled in Kuwait, along with their families;
3) children of Kuwaiti mothers and stateless or foreign fathers (see Human Rights Watch. Prisoners of the Past. Kuwaiti Bidun and the Burden of Statelessness, June 2011, p. 3).
(The children of Kuwaiti mothers and non-Kuwaiti fathers (with specific nationality) inherit the father’s nationality. They are stateless if the father is stateless).
(c) Nationality group: collected according to the nationality of the head of the household.
Nationalities are grouped according to specific features common to certain population subgroups: language, geographic origin, etc. or according to internationally recognized categories such as: (Arab / non-Arab Asian countries / non-Arab African countries; European countries … etc.).
2. Institution which provides data
The Public Authority for Civil Information (PACI)
3. Period of data coverage: 31 December 2017
The database is updated three times a year and the website presents only the most recent data.
4. Data availability
The statistics section of PACI’s website (http://www.paci.gov.kw/en/ (English); http://www.paci.gov.kw/ (Arabic)) provides population and socio-economic data broken down by nationality (Kuwaiti/ non-Kuwaiti). Some data are displayed by nationality groups.
Analytical tables and data crosstabulations are available for download in PDF, html, .png and Excel (.csv) formats.
Date of access: March 2018
| |
Mother’s nationality/ nationality group |
| Father’s Nationality |
Kuwaiti |
Arab |
Asian |
African |
European |
N.American |
S.American |
Australian-Oceanian |
Total |
| Kuwaiti |
28,850 |
3,961 |
258 |
18 |
76 |
49 |
13 |
6 |
33,231 |
| Arab |
1,512 |
14,272 |
240 |
33 |
46 |
32 |
4 |
7 |
16,146 |
| Asian |
60 |
46 |
7,629 |
8 |
10 |
2 |
|
|
7,755 |
| African |
1 |
7 |
3 |
115 |
1 |
|
|
|
127 |
| European |
8 |
35 |
12 |
2 |
72 |
8 |
1 |
|
138 |
| N.American |
13 |
60 |
37 |
24 |
4 |
48 |
|
|
186 |
| S.American |
1 |
4 |
3 |
|
2 |
1 |
6 |
1 |
18 |
| Australian-Oceanian |
2 |
4 |
3 |
|
|
1 |
|
4 |
14 |
| Total |
30,447 |
18,389 |
8,185 |
200 |
211 |
141 |
24 |
18 |
57,615 |
Source: PACI
ANNEXED NOTE
1. Characteristics of data and definitions
The source of data used here is the Public Authority for Civil Information (PACI), an independant government body in charge of :
1- centralising all population and labour force data in order to manage a fully computerised population register
2- issuing mandatory civil identification cards to every resident of the country, regardless of age and nationality.
The other source of demographic and socioeconomic data on Kuwait is the Central Statistical Office (CSO), operating within the Planning Ministry. The CSO has conducted ten population and housing censuses since its inception in 1957.
Since 1995 a marked discrepancy was witnessed between PACI’ and CSO’ population figures. PACI’ database is connected electronically with other administrations and bodies registering demographic events and professional/ residency issues (births and death; departures and arrivals; end of service, residency and ID deliveries, etc.).
PACI’s records of residents’ movements is thus regularly updated, which limits the risk of population overcount. Therefore, it is more likely that residents were undercounted during CSO- Ministry of Planning’s census operations (see: Shah, N. Population of Kuwait. Structure and Dynamics, Kuwait: Kuwait University Academic Publication Council, 2010, chapter 1).
(a) Kuwaiti: the Kuwaiti nationality rests upon a document of Kuwaiti nationality or a certificate proving Kuwaiti nationality issued by the Ministry of Interior of Kuwait.
(b) Non-Kuwaiti: his/ her nationality is determined by the name of the State which issued the passport. The foreign national also entered Kuwait legally and has a stamp of residence.
This category includes the Bidoon, a category of stateless persons living in the Emirate. Kuwait’s Bidoon population originates from three broad categories:
1) those whose ancestors failed to apply for nationality or lacked necessary documentation at the time of Kuwait’s independence in 1961;
2) those recruited to work in Kuwait’s army or police force during the 1960s who permanently settled in Kuwait, along with their families;
3) children of Kuwaiti mothers and stateless or foreign fathers (see Human Rights Watch. Prisoners of the Past. Kuwaiti Bidun and the Burden of Statelessness, June 2011, p. 3).
(The children of Kuwaiti mothers and non-Kuwaiti fathers (with specific nationality) inherit the father’s nationality. They are stateless if the father is stateless).
(c) Nationality group: collected according to the nationality of the head of the household.
Nationalities are grouped according to specific features common to certain population subgroups: language, geographic origin, etc. or according to internationally recognized categories such as: (Arab / non-Arab Asian countries / non-Arab African countries; European countries … etc.).
2. Institution which provides data
The Public Authority for Civil Information (PACI)
3. Period of data coverage: 31 December 2017
The database is updated three times a year and the website presents only the most recent data.
4. Data availability
The statistics section of PACI’s website (http://www.paci.gov.kw/en/ (English); http://www.paci.gov.kw/ (Arabic)) provides population and socio-economic data broken down by nationality (Kuwaiti/ non-Kuwaiti). Some data are displayed by nationality groups.
Analytical tables and data crosstabulations are available for download in PDF, html, .png and Excel (.csv) formats.
Date of access: March 2018
| |
|
Employed nationals |
Employed non-nationals |
Total employed population |
| Country |
sex |
numbers |
men per 100 women |
numbers |
men per 100 women |
numbers |
men per 100 women |
| Bahrain |
males |
139,925 |
218 |
468,223 |
481 |
608,148 |
377 |
| |
females |
64,187 |
97,284 |
161,471 |
| Kuwait |
males |
198,143 |
132 |
1,567,243 |
309 |
1,765,386 |
269 |
| |
females |
150,237 |
506,436 |
656,673 |
| Oman |
males |
273,508 |
210 |
1,502,686 |
771 |
1,776,194 |
546 |
| |
females |
130,077 |
194,985 |
325,062 |
| Qatar |
males |
64,101 |
187 |
1,628,620 |
719 |
1,692,721 |
649 |
| |
females |
34,322 |
226,395 |
260,717 |
| Saudi Arabia |
males |
4,159,744 |
510 |
5,735,735 |
742 |
9,895,479 |
623 |
| |
females |
816,361 |
772,816 |
1,589,177 |
| United Arab Emirates |
males |
NA |
NA |
NA |
NA |
NA |
NA |
| |
females |
NA |
NA |
NA |
Sources: national institutes of statistics, in GCC Stat. Labour Statistics in GCC Countries 2015, Issue n°3, March 2017.
1- Definitions and remarks:
Non-nationals are:
1- persons bearing nationality of a foreign State other than the GCC State of residence, or bearing no proof of nationality from any given state
(stateless persons and holders of refugee status and travel document in a third country) ;
2- Holders of residence permit residing in the given GCC country at date of census, as per definition of residence used in each of the countries.
Employment refers to: all persons of working age (15 and above), who during a reference period worked to produce goods or provide services for pay (cash or kind)
or worked for profit from their own (or partially owned) business or worked without pay in the family business or with other individuals.
It also includes those who have a temporary absence from a job during the reference period due to vacation or illness or any other reason.
Bahrain: Employment data had been estimated based on 2010 Census.
Oman: Employment data only includes civil sector, and does not include those employed in the Defense, Armed Forces, and Police (Military).
UAE: No data available.
2- Sources of data:
Data is taken from:
GCC Stat. Labour Statistics in GCC Countries 2015, Issue n°3, March 2017.
https://gccstat.org/images/gccstat/docman/publications/171-labour-statistics-bulletin-2015_3.pdf
| |
Employed |
% in employed population |
| Country |
population |
Nationals |
Non-nationals |
| Bahrain |
769,619 |
26.5 |
73.5 |
| Kuwait |
2,422,059 |
14.4 |
85.6 |
| Oman |
2,101,256 |
19.2 |
80.8 |
| Qatar |
1,953,438 |
5.0 |
95.0 |
| Saudi Arabia |
11,484,656 |
43.3 |
56.7 |
| UAE |
NA |
NA |
NA |
Sources: national institutes of statistics, in GCC Stat. Labour Statistics in GCC Countries 2015,
Issue n°3, March 2017.
1- Definitions and remarks:
Non-nationals are:
1- persons bearing nationality of a foreign State other than the GCC State of residence, or bearing no proof of nationality from any given state
(stateless persons and holders of refugee status and travel document in a third country) ;
2- Holders of residence permit residing in the given GCC country at date of census, as per definition of residence used in each of the countries.
Employment refers to: all persons of working age (15 and above), who during a reference period worked to produce goods or provide services for pay (cash or kind)
or worked for profit from their own (or partially owned) business or worked without pay in the family business or with other individuals.
It also includes those who have a temporary absence from a job during the reference period due to vacation or illness or any other reason.
Bahrain: Employment data had been estimated based on 2010 Census.
Oman: Employment data only includes civil sector, and does not include those employed in the Defense, Armed Forces, and Police (Military).
UAE: No data available.
2- Sources of data:
Data is taken from:
GCC Stat. Labour Statistics in GCC Countries 2015, Issue n°3, March 2017.
https://gccstat.org/images/gccstat/docman/publications/171-labour-statistics-bulletin-2015_3.pdf
|
Bahrainis |
Non-Bahrainis |
Total |
| Age group |
males |
females |
total |
males |
females |
total |
males |
females |
total |
| 0-4 |
38,957 |
37,158 |
76,115 |
16,697 |
16,280 |
32,977 |
55,654 |
53,438 |
109,092 |
| 5-9 |
36,742 |
35,283 |
72,025 |
14,159 |
13,458 |
27,617 |
50,901 |
48,741 |
99,642 |
| 10-14 |
33,962 |
32,646 |
66,608 |
10,827 |
10,492 |
21,319 |
44,789 |
43,138 |
87,927 |
| 15-19 |
31,565 |
29,769 |
61,334 |
8,517 |
7,141 |
15,658 |
40,082 |
36,910 |
76,992 |
| 20-24 |
30,399 |
28,826 |
59,225 |
35,238 |
14,716 |
49,954 |
65,637 |
43,542 |
109,179 |
| 25-29 |
29,106 |
27,857 |
56,963 |
119,162 |
33,364 |
152,526 |
148,268 |
61,221 |
209,489 |
| 30-34 |
25,621 |
25,034 |
50,655 |
130,834 |
34,507 |
165,341 |
156,455 |
59,541 |
215,996 |
| 35-39 |
22,852 |
22,494 |
45,346 |
95,906 |
28,364 |
124,270 |
118,758 |
50,858 |
169,616 |
| 40-44 |
19,223 |
19,177 |
38,400 |
67,630 |
21,870 |
89,500 |
86,853 |
41,047 |
127,900 |
| 45-49 |
16,353 |
17,048 |
33,401 |
49,489 |
15,062 |
64,551 |
65,842 |
32,110 |
97,952 |
| 50-54 |
16,638 |
17,659 |
34,297 |
29,389 |
9,883 |
39,272 |
46,027 |
27,542 |
73,569 |
| 55-59 |
14,516 |
15,165 |
29,681 |
18,673 |
5,764 |
24,437 |
33,189 |
20,929 |
54,118 |
| 60-64 |
11,340 |
10,268 |
21,608 |
7,264 |
2,617 |
9,881 |
18,604 |
12,885 |
31,489 |
| 65-69 |
7,403 |
6,082 |
13,485 |
2,347 |
1,045 |
3,392 |
9,750 |
7,127 |
16,877 |
| 70-74 |
3,759 |
3,835 |
7,594 |
874 |
453 |
1,327 |
4,633 |
4,288 |
8,921 |
| 75-79 |
2,648 |
2,979 |
5,627 |
416 |
265 |
681 |
3,064 |
3,244 |
6,308 |
| 80-84 |
1,256 |
1,574 |
2,830 |
268 |
199 |
467 |
1,524 |
1,773 |
3,297 |
| 75 + |
1,000 |
1,312 |
2,312 |
282 |
158 |
440 |
1,282 |
1,470 |
2,752 |
| Total |
343,340 |
334,166 |
677,506 |
607,972 |
215,638 |
823,610 |
951,312 |
549,804 |
1,501,116 |
Source: Information & E-Government Authority, Bahrain
ANNEXED NOTE
1. Technical Notes and Definitions
Mid-year estimates of Bahrain’s total resident population (nationals and non-nationals), on the basis of census 2010 and administrative records.
2. Institution which provides data
Central Informatics Organization, merged with the E-Government Authority since 2015.
3. Data availability
Population-related data for the years 2010 and later is available on Bahrain Open Data Porta, under the Information and E-Government Authority (http://www.data.gov.bh/)
Population estimates for 2010 and following years are published in Bahrain’s Statistical Yearbooks (2010 and ff. only), available in the “documents” section of Bahrain Data Portal,
by thematic chapters (Excel files): http://www.data.gov.bh/en/ResourceCenter
Data of access: January 2018
| |
Bahrainis |
Non-Bahrainis |
Total |
| Age group |
males |
females |
total |
males |
females |
total |
males |
females |
total |
| 0-4 |
38,208 |
36,606 |
74,814 |
15,890 |
15,366 |
31,256 |
54,098 |
51,972 |
106,070 |
| 5-9 |
35,479 |
33,963 |
69,442 |
13,112 |
12,779 |
25,891 |
48,591 |
46,742 |
95,333 |
| 10-14 |
32,787 |
31,127 |
63,914 |
10,224 |
9,716 |
19,940 |
43,011 |
40,843 |
83,854 |
| 15-19 |
31,136 |
29,447 |
60,583 |
7,694 |
6,801 |
14,495 |
38,830 |
36,248 |
75,078 |
| 20-24 |
29,919 |
28,742 |
58,661 |
31,867 |
12,458 |
44,325 |
61,786 |
41,200 |
102,986 |
| 25-29 |
27,795 |
26,675 |
54,470 |
94,597 |
30,348 |
124,945 |
122,392 |
57,023 |
179,415 |
| 30-34 |
24,541 |
23,814 |
48,355 |
105,721 |
33,341 |
139,062 |
130,262 |
57,155 |
187,417 |
| 35-39 |
21,733 |
21,112 |
42,845 |
78,698 |
28,422 |
107,120 |
100,431 |
49,534 |
149,965 |
| 40-44 |
17,424 |
17,382 |
34,806 |
60,461 |
21,089 |
81,550 |
77,885 |
38,471 |
116,356 |
| 45-49 |
16,606 |
17,250 |
33,856 |
43,921 |
14,849 |
58,770 |
60,527 |
32,099 |
92,626 |
| 50-54 |
16,026 |
16,811 |
32,837 |
26,838 |
9,688 |
36,526 |
42,864 |
26,499 |
69,363 |
| 55-59 |
13,513 |
13,620 |
27,133 |
17,975 |
5,482 |
23,457 |
31,488 |
19,102 |
50,590 |
| 60-64 |
10,026 |
8,298 |
18,324 |
6,970 |
2,389 |
9,359 |
16,996 |
10,687 |
27,683 |
| 65-69 |
5,768 |
5,006 |
10,774 |
1,903 |
926 |
2,829 |
7,671 |
5,932 |
13,603 |
| 70-74 |
3,462 |
3,631 |
7,093 |
699 |
459 |
1,158 |
4,161 |
4,090 |
8,251 |
| 75-79 |
2,363 |
2,805 |
5,168 |
356 |
309 |
665 |
2,719 |
3,114 |
5,833 |
| 80-84 |
1,204 |
1,418 |
2,622 |
237 |
211 |
448 |
1,441 |
1,629 |
3,070 |
| 75 + |
897 |
1,241 |
2,138 |
315 |
376 |
691 |
1,212 |
1,617 |
2,829 |
| Total |
328,887 |
318,948 |
647,835 |
517,478 |
205,009 |
722,487 |
846,365 |
523,957 |
1,370,322 |
Source: Information & E-Government Authority, Bahrain
ANNEXED NOTE
1. Technical Notes and Definitions
Mid-year estimates of Bahrain’s total resident population (nationals and non-nationals), on the basis of census 2010 and administrative records.
2. Institution which provides data
Central Informatics Organization, merged with the E-Government Authority since 2015.
3. Data availability
Population-related data for the years 2010 and later is available on Bahrain Open Data Porta, under the Information and E-Government Authority (http://www.data.gov.bh/)
Population estimates for 2010 and following years are published in Bahrain’s Statistical Yearbooks (2010 and ff. only), available in the “documents” section of Bahrain Data Portal,
by thematic chapters (Excel files): http://www.data.gov.bh/en/ResourceCenter
Data of access: January 2018
|
Bahrainis |
Non-Bahrainis |
Total |
|
males |
females |
total |
males |
females |
total |
males |
females |
total |
| 1981 |
121,357 |
118,683 |
240,040 |
80,511 |
33,116 |
113,627 |
201,868 |
151,799 |
353,667 |
| 1990 |
157,128 |
153,666 |
310,794 |
122,730 |
50,482 |
173,212 |
279,858 |
204,148 |
484,006 |
| 1991 |
163,451 |
159,852 |
323,303 |
130,893 |
53,839 |
184,732 |
294,344 |
213,691 |
508,035 |
| 1992 |
165,932 |
162,294 |
328,226 |
132,967 |
55,265 |
188,232 |
298,899 |
217,559 |
516,458 |
| 1993 |
169,973 |
166,278 |
336,251 |
136,615 |
57,359 |
193,974 |
306,588 |
223,637 |
530,225 |
| 1994 |
174,108 |
170,371 |
344,479 |
140,366 |
59,521 |
199,887 |
314,474 |
229,892 |
544,366 |
| 1995 |
178,328 |
174,572 |
352,900 |
144,227 |
61,752 |
205,979 |
322,555 |
236,324 |
558,879 |
| 1996 |
182,648 |
178,882 |
361,530 |
148,207 |
64,055 |
212,262 |
330,855 |
242,937 |
573,792 |
| 1997 |
187,065 |
183,312 |
370,377 |
152,307 |
66,431 |
218,738 |
339,372 |
249,743 |
589,115 |
| 1998 |
191,577 |
187,858 |
379,435 |
156,523 |
68,884 |
225,407 |
348,100 |
256,742 |
604,842 |
| 1999 |
196,190 |
192,524 |
388,714 |
160,866 |
71,409 |
232,275 |
357,056 |
263,933 |
620,989 |
| 2000 |
200,903 |
197,318 |
398,221 |
165,344 |
74,017 |
239,361 |
366,247 |
271,335 |
637,582 |
| 2001 |
206,911 |
202,712 |
409,623 |
179,806 |
71,896 |
251,702 |
386,717 |
274,608 |
661,325 |
| 2002 |
215,813 |
211,432 |
427,245 |
202,385 |
80,923 |
283,308 |
418,198 |
292,355 |
710,553 |
| 2003 |
225,099 |
220,532 |
445,631 |
227,797 |
91,088 |
318,885 |
452,896 |
311,620 |
764,516 |
| 2004 |
234,786 |
230,021 |
464,807 |
256,409 |
102,526 |
358,935 |
491,195 |
332,547 |
823,742 |
| 2005 |
244,889 |
239,922 |
484,811 |
288,614 |
115,404 |
404,018 |
533,503 |
355,326 |
888,829 |
| 2006 |
255,428 |
250,243 |
505,671 |
324,856 |
129,895 |
454,751 |
580,284 |
380,138 |
960,422 |
| 2007 |
266,421 |
261,013 |
527,434 |
365,656 |
146,210 |
511,866 |
632,077 |
407,223 |
1,039,300 |
| 2008 |
273,612 |
267,975 |
541,587 |
402,978 |
158,931 |
561,909 |
676,590 |
426,906 |
1,103,496 |
| 2009 |
282,011 |
276,000 |
558,011 |
449,986 |
170,418 |
620,404 |
731,997 |
446,418 |
1,178,415 |
| 2010 |
288,452 |
282,235 |
570,687 |
475,905 |
181,951 |
657,856 |
764,357 |
464,186 |
1,228,543 |
| 2011 |
295,878 |
288,810 |
584,688 |
445,605 |
164,727 |
610,332 |
741,483 |
453,537 |
1,195,020 |
| 2012 |
305,354 |
294,275 |
599,629 |
455,095 |
154,240 |
609,335 |
760,449 |
448,515 |
1,208,964 |
| 2013 |
312,945 |
301,885 |
614,830 |
475,436 |
162,925 |
638,361 |
788,381 |
464,810 |
1,253,191 |
| 2014 |
320,839 |
309,905 |
630,744 |
485,648 |
198,170 |
683,818 |
806,487 |
508,075 |
1,314,562 |
| 2015 |
328,887 |
318,948 |
647,835 |
517,478 |
205,009 |
722,487 |
846,365 |
523,957 |
1,370,322 |
| 2015 |
336,834 |
327,873 |
664,707 |
551,555 |
207,464 |
759,019 |
888,389 |
535,337 |
1,423,726 |
| 2017 |
343,340 |
334,166 |
677,506 |
607,972 |
215,638 |
823,610 |
951,312 |
549,804 |
1,501,116 |
Source: Central Informatics Organization (CIO) and Information & E-Government Authority, Bahrain
ANNEXED NOTE
1. Technical Notes and Definitions
The table provides mid-year intercensal estimates of Bahrain’s total resident population (nationals and non-nationals)
Censuses reference periods: 1991: unknown; April 7th 2001, April 27th 2010.
Implementation method: the Censuses are carried out according to de jure methodology, i.e. counting persons using their usual place of residence irrespective of where are they at census times
Population of reference: all individuals (nationals and non-nationals) present within the State’s borders during time of reference.
Nationality of the person is defined by the passport used to enter the country. A Non-Bahrainis is considered as such depending on the passport used to enter the country (or obtain the visa)
It has to be noticed that the mid-year estimate for 2010 gives a figure lower than that of the census (April 27, 2010)
2. Institution which provides data
Central Informatics Organization, merged with the E-Government Authority since 2015.
3. Data availability
Population-related data for the years 2010 and later is available on Bahrain Open Data Porta, under the Information and E-Government Authority (http://www.data.gov.bh/)
Population estimates for 2010 and following years are published in Bahrain’s Statistical Yearbooks (2010 and ff. only), available in the “documents” section of Bahrain Data Portal,
by thematic chapters (Excel files): http://www.data.gov.bh/en/ResourceCenter
For 1992-2011 estimates: (http://www.cio.gov.bh/cio_ara/English/Publications/Statistical%20Abstract/ABS2011/CH2/1.pdf)
For 1991-2010 estimates: (http://www.cio.gov.bh/cio_ara/English/Publications/Statistical%20Abstract/ABS2010/CH2/1.pdf)
For 1990-1991 estimates: (http://www.cio.gov.bh/cio_ara/English/Publications/Statistical%20Abstract/ABS2009/Ch2/36.pdf)
For 1981 estimates: (http://www.cio.gov.bh/cio_ara/English/Publications/Statistical%20Abstract/ABS2008/Ch2/2A.pdf)
Data of access: January 2018
| |
Bahrainis |
Non-Bahrainis |
Total |
| 1981 |
240,040 |
113,627 |
353,667 |
| 1990 |
310,794 |
173,212 |
484,006 |
| 1991 |
323,303 |
184,732 |
508,035 |
| 1992 |
328,226 |
188,232 |
516,458 |
| 1993 |
336,251 |
193,974 |
530,225 |
| 1994 |
344,479 |
199,887 |
544,366 |
| 1995 |
352,900 |
205,979 |
558,879 |
| 1996 |
361,530 |
212,262 |
573,792 |
| 1997 |
370,377 |
218,738 |
589,115 |
| 1998 |
379,435 |
225,407 |
604,842 |
| 1999 |
388,714 |
232,275 |
620,989 |
| 2000 |
398,221 |
239,361 |
637,582 |
| 2001 |
409,623 |
251,702 |
661,325 |
| 2002 |
427,245 |
283,308 |
710,553 |
| 2003 |
445,631 |
318,885 |
764,516 |
| 2004 |
464,807 |
358,935 |
823,742 |
| 2005 |
484,811 |
404,018 |
888,829 |
| 2006 |
505,671 |
454,751 |
960,422 |
| 2007 |
527,434 |
511,866 |
1,039,300 |
| 2008 |
541,587 |
561,909 |
1,103,496 |
| 2009 |
558,011 |
620,404 |
1,178,415 |
| 2010 |
570,687 |
657,856 |
1,228,543 |
| 2011 |
584,688 |
610,332 |
1,195,020 |
| 2012 |
599,629 |
609,335 |
1,208,964 |
| 2013 |
614,830 |
638,361 |
1,253,191 |
| 2014 |
630,744 |
683,818 |
1,314,562 |
| 2015 |
647,835 |
722,487 |
1,370,322 |
| 2016 |
664,707 |
759,019 |
1,423,726 |
| 2016 |
677,506 |
823,610 |
1,501,116 |
Source: Central Informatics Organization (CIO) and Information & E-Government Authority, Bahrain
ANNEXED NOTE
1. Technical Notes and Definitions
The table provides mid-year intercensal estimates of Bahrain’s total resident population (nationals and non-nationals)
Censuses reference periods: 1991: unknown; April 7th 2001, April 27th 2010.
Implementation method: the Censuses are carried out according to de jure methodology, i.e. counting persons using their usual place of residence irrespective of where are they at census times
Population of reference: all individuals (nationals and non-nationals) present within the State’s borders during time of reference.
Nationality of the person is defined by the passport used to enter the country. A Non-Bahrainis is considered as such depending on the passport used to enter the country (or obtain the visa)
It has to be noticed that the mid-year estimate for 2010 gives a figure lower than that of the census (April 27, 2010)
2. Institution which provides data
Central Informatics Organization, merged with the E-Government Authority since 2015.
3. Data availability
Population-related data for the years 2010 and later is available on Bahrain Open Data Porta, under the Information and E-Government Authority (http://www.data.gov.bh/)
Population estimates for 2010 and following years are published in Bahrain’s Statistical Yearbooks (2010 and ff. only), available in the “documents” section of Bahrain Data Portal,
by thematic chapters (Excel files): http://www.data.gov.bh/en/ResourceCenter
For 1992-2011 estimates: (http://www.cio.gov.bh/cio_ara/English/Publications/Statistical%20Abstract/ABS2011/CH2/1.pdf)
For 1991-2010 estimates: (http://www.cio.gov.bh/cio_ara/English/Publications/Statistical%20Abstract/ABS2010/CH2/1.pdf)
For 1990-1991 estimates: (http://www.cio.gov.bh/cio_ara/English/Publications/Statistical%20Abstract/ABS2009/Ch2/36.pdf)
For 1981 estimates: (http://www.cio.gov.bh/cio_ara/English/Publications/Statistical%20Abstract/ABS2008/Ch2/2A.pdf)
Data of access: January 2018
|
Qataris |
Non-Qataris |
|
Males |
Females |
Males |
Females |
| 0-14 |
59,972 |
56,253 |
125,392 |
115,257 |
| 15-19 |
13,464 |
14,939 |
28,912 |
20,752 |
| 20-24 |
14,955 |
14,084 |
172,930 |
45,506 |
| 25 – 29 |
12,296 |
13,598 |
273,422 |
61,134 |
| 30 – 34 |
10,079 |
10,077 |
329,256 |
72,755 |
| 35 – 39 |
8,512 |
8,165 |
283,151 |
51,417 |
| 40 – 44 |
7,052 |
8,117 |
205,649 |
43,338 |
| 45 – 49 |
6,699 |
7,082 |
165,278 |
27,818 |
| 50 – 54 |
7,064 |
5,216 |
89,301 |
15,778 |
| 55 – 59 |
5,023 |
6,094 |
74,229 |
7,484 |
| 60 – 64 |
3,233 |
3,304 |
26,481 |
2,713 |
| 65 – 69 |
1,953 |
3,711 |
14,174 |
1,793 |
| 70 – 74 |
1,485 |
870 |
2,168 |
639 |
| 75 + |
1,988 |
1,351 |
976 |
243 |
| Total |
153,775 |
152,861 |
1,791,319 |
466,627 |
Source: Annual Bulletin of Labor Force Sample survey 2015
and Women and Men in the State of Qatar 2016
ANNEXED NOTE
1. Technical Notes and Definitions
* Figures of population aged 15 and above are taken from 2015 Labour Force Survey (yearly synthesis)
Sampling frame of LFS 2015: Population Census 2010.
Sample size: 44,756 persons, in 6,953 households: 1- Qatari households; 2- Non-Qatari regular (non-collective) households;
Data Collection: The sample was divided into equal parts to collect data monthly. Each month 1/3 of the quarterly data were collected during the first two weeks of the month.
Reference period for the labour force data: the week prior to data collection day.
Population of reference: all Qatari and non-Qatari households present in Qatar on the night of survey, living in normal and collective households.
The collective households are a group of persons not related to each other and sharing living conditions in a residential unit, I.e. labour camps, students living boarding schools, nurses in hospitals… etc.
The survey covered the small collective households (includes less than 7 persons) and large collective households (includes 7 persons or more). The survey did not cover short periods accommodation, i.e. hotels.
* Figures of population aged 0-14 by nationality (national/ non-national) and sex: GLMM author’s estimate, based on the percentage distribution of population by broad age groups,
sex and nationality for 2015, available in 2016 issue of report Women and Men in the State of Qatar- A Statistical Profile, published by the MDPS (tab. 1/3, p. 18).
https://www.mdps.gov.qa/en/statistics1/pages/topicslisting.aspx?parent=Social&child=GenrealSocialStatistics
2. Institution which provides data
Ministry of Development Planning and Statistics
(http://www.mdps.gov.qa/en/pages/default.aspx)
3. Data availability
The Statistics Authority conducted the first labour Force Sample Survey in 2001. Starting from 2006, the execution of these surveys came to be on annual basis.
Quarterly publications of Labour Force Surveys’ data are also available since 2012.
2015′ and earlier Labour Force Surveys can be downloaded from MDPS’s website, in PDF and Excel format:
https://www.mdps.gov.qa/en/statistics1/pages/topicslisting.aspx?parent=Social&child=LaborForce
Last date of access: December 2017.
|
Qataris |
Non-Qataris |
Total |
| 0-14 |
116,225 |
240,649 |
356,874 |
| 15-19 |
28,403 |
49,664 |
78,67 |
| 19-24 |
29,039 |
218,436 |
247,475 |
| 25 – 29 |
25,894 |
334,556 |
360,450 |
| 30 – 34 |
20,156 |
402,011 |
422,167 |
| 35 – 39 |
16,677 |
334,568 |
351,245 |
| 40 – 44 |
15,169 |
248,987 |
264,156 |
| 45 – 49 |
13,781 |
193,096 |
206,877 |
| 50 – 54 |
12,280 |
105,079 |
117,359 |
| 55 – 59 |
11,117 |
81,713 |
92,830 |
| 60 – 64 |
6,537 |
29,194 |
35,731 |
| 65 – 69 |
5,664 |
15,967 |
21,631 |
| 70 – 74 |
2,355 |
2,807 |
5,162 |
| 75 + |
3,339 |
1,219 |
4,558 |
| Total |
306,636 |
2,257,946 |
2,564,582 |
Source: Annual Bulletin of Labor Force Sample survey 2015
and Women and Men in the State of Qatar 2016
ANNEXED NOTE
1. Technical Notes and Definitions
* Figures of population aged 15 and above are taken from 2015 Labour Force Survey (yearly synthesis)
Sampling frame of LFS 2015: Population Census 2010.
Sample size: 44,756 persons, in 6,953 households: 1- Qatari households; 2- Non-Qatari regular (non-collective) households;
Data Collection: The sample was divided into equal parts to collect data monthly. Each month 1/3 of the quarterly data were collected during the first two weeks of the month.
Reference period for the labour force data: the week prior to data collection day.
Population of reference: all Qatari and non-Qatari households present in Qatar on the night of survey, living in normal and collective households.
The collective households are a group of persons not related to each other and sharing living conditions in a residential unit, I.e. labour camps, students living boarding schools, nurses in hospitals… etc.
The survey covered the small collective households (includes less than 7 persons) and large collective households (includes 7 persons or more). The survey did not cover short periods accommodation, i.e. hotels.
* Figures of population aged 0-14 by nationality (national/ non-national) : GLMM author’s estimate, based on the percentage distribution of population by broad age groups,
sex and nationality for 2015, available in 2016 issue of report Women and Men in the State of Qatar- A Statistical Profile, published by the MDPS (tab. 1/3, p. 18).
https://www.mdps.gov.qa/en/statistics1/pages/topicslisting.aspx?parent=Social&child=GenrealSocialStatistics
2. Institution which provides data
Ministry of Development Planning and Statistics
(http://www.mdps.gov.qa/en/pages/default.aspx)
3. Data availability
The Statistics Authority conducted the first labour Force Sample Survey in 2001. Starting from 2006, the execution of these surveys came to be on annual basis.
Quarterly publications of Labour Force Surveys’ data are also available since 2012.
2015′ and earlier Labour Force Surveys can be downloaded from MDPS’s website, in PDF and Excel format:
https://www.mdps.gov.qa/en/statistics1/pages/topicslisting.aspx?parent=Social&child=LaborForce
Last date of access: December 2017.
|
Bahrain |
Saudi Arabia |
Oman |
Kuwait |
Qatar |
| Nationals |
Non-nationals |
Nationals |
Non-nationals |
Nationals |
Non-nationals |
Nationals |
Non-nationals |
Nationals |
Non-nationals |
| Males |
Females |
Males |
Females |
Males |
Females |
Males |
Females |
Males |
Females |
Males |
Females |
Males |
Females |
Males |
Females |
Males |
Females |
Males |
Females |
| 0-4 |
38,208 |
36,606 |
15,890 |
15,366 |
1,067,374 |
1,028,417 |
264,819 |
248,980 |
177,581 |
170,838 |
16,890 |
16,348 |
86,131 |
82,075 |
95,018 |
69,163 |
59,972 |
56,253 |
125,392 |
115,257 |
| 5-9 |
35,479 |
33,963 |
13,112 |
12,779 |
1,042,723 |
1,005,738 |
335,006 |
316,724 |
138,659 |
133,650 |
16,222 |
15,538 |
72,359 |
69,559 |
80,317 |
58,457 |
| 10-14 |
32,787 |
31,127 |
10,224 |
9,716 |
930,037 |
903,082 |
275,854 |
258,250 |
110,210 |
106,717 |
13,582 |
12,379 |
66,257 |
63,914 |
62,955 |
46,509 |
| 15-19 |
31,136 |
29,447 |
7,694 |
6,801 |
878,919 |
848,000 |
226,111 |
208,662 |
111,304 |
106,727 |
9,584 |
8,528 |
65,143 |
61,817 |
56,282 |
39,760 |
13,464 |
14,939 |
28,912 |
20,752 |
| 20-24 |
29,919 |
28,742 |
31,867 |
12,458 |
1,017,379 |
930,803 |
267,001 |
196,695 |
126,416 |
122,550 |
105,530 |
20,598 |
58,517 |
56,653 |
50,625 |
35,575 |
14,955 |
14,084 |
172,930 |
45,506 |
| 25-29 |
27,795 |
26,675 |
94,597 |
30,348 |
944,760 |
923,325 |
679,504 |
398,576 |
122,755 |
119,615 |
390,340 |
69,306 |
50,880 |
49,566 |
140,144 |
103,131 |
12,296 |
13,598 |
273,422 |
61,134 |
| 30-34 |
24,541 |
23,814 |
105,721 |
33,341 |
850,829 |
835,207 |
889,349 |
396,276 |
105,329 |
103,401 |
330,794 |
56,706 |
41,393 |
41,668 |
271,069 |
144,949 |
10,079 |
10,077 |
329,256 |
72,755 |
| 35-39 |
21,733 |
21,112 |
78,698 |
28,422 |
746,022 |
727,309 |
1,306,238 |
509,394 |
79,084 |
79,049 |
220,825 |
44,304 |
35,149 |
37,063 |
301,145 |
137,341 |
8,512 |
8,165 |
283,151 |
51,417 |
| 40-44 |
17,424 |
17,382 |
60,461 |
21,089 |
631,572 |
607,541 |
1,233,510 |
464,552 |
52,717 |
49,738 |
155,138 |
29,724 |
33,723 |
35,727 |
278,856 |
124,634 |
7,052 |
8,117 |
205,649 |
43,338 |
| 45-49 |
16,606 |
17,250 |
43,921 |
14,849 |
530,706 |
501,715 |
907,250 |
249,416 |
36,091 |
36,147 |
109,977 |
17,536 |
27,634 |
30,451 |
187,407 |
79,460 |
6,699 |
7,082 |
165,278 |
27,818 |
| 50-54 |
16,026 |
16,811 |
26,838 |
9,688 |
423,277 |
399,755 |
617,784 |
93,768 |
30,919 |
31,886 |
65,094 |
11,236 |
22,973 |
25,253 |
124,148 |
50,200 |
7,064 |
5,216 |
89,301 |
15,778 |
| 55-59 |
13,513 |
13,620 |
17,975 |
5,482 |
329,857 |
302,879 |
369,889 |
61,293 |
24,938 |
28,611 |
46,370 |
6,285 |
16,521 |
20,419 |
82,060 |
25,994 |
5,023 |
6,094 |
74,229 |
7,484 |
| 60-64 |
10,026 |
8,298 |
6,970 |
2,389 |
239,008 |
223,513 |
198,011 |
43,850 |
18,067 |
21,086 |
15,154 |
2,692 |
12,009 |
15,022 |
44,153 |
13,467 |
3,233 |
3,304 |
26,481 |
2,713 |
| 65-69 |
5,768 |
5,006 |
1,903 |
926 |
145,459 |
153,749 |
68,709 |
27,047 |
15,301 |
16,392 |
3,646 |
1,254 |
7,662 |
10,518 |
18,616 |
6,596 |
1,953 |
3,711 |
14,174 |
1,793 |
| 70-74 |
3,462 |
3,631 |
699 |
459 |
106,129 |
108,700 |
31,447 |
17,467 |
12,912 |
13,125 |
824 |
605 |
5,597 |
6,814 |
7,160 |
3,240 |
1,485 |
870 |
2,168 |
639 |
| 75-79 |
2,363 |
2,805 |
356 |
309 |
68,255 |
70,179 |
14,688 |
4,298 |
10,106 |
9,288 |
270 |
369 |
3,857 |
4,077 |
3,504 |
1,748 |
1,988 |
1,351 |
976 |
243 |
| 80+ |
2,101 |
2,659 |
552 |
587 |
82,255 |
88,166 |
11,621 |
6,058 |
12,041 |
11,696 |
174 |
334 |
3,013 |
3,423 |
2,836 |
1,675 |
| |
328,887 |
318,948 |
517,478 |
205,009 |
10,034,561 |
9,658,078 |
7,696,791 |
3,501,306 |
1,184,430 |
1,160,516 |
1,500,414 |
313,742 |
608,818 |
614,019 |
1,806,295 |
941,899 |
153,775 |
152,861 |
1,791,319 |
466,627 |
Sources: national statistics institutes.
ANNEXED NOTE
Sources:
Bahrain, Kuwait, Oman and Saudi Arabia: mid-year population estimates, national statistics and administrative records, retrieved from GCC Stat center (http://dp.gccstat.org/en/DataAnalysis).
Qatar: Population aged 15 and above, by five-year age-group: 2015 Labour Force Survey (yearly synthesis: end of year population) https://www.mdps.gov.qa/en/statistics/Statistical%20Releases/Social/LaborForce/2015/LaborForce2015.xls
Population aged 0-14 by nationality (national/ non-national) and sex: GLMM author’s estimate, based on the percentage distribution of population by broad age groups,
sex and nationality for 2015, available in 2016 issue of report Women and Men in the State of Qatar- A Statistical Profile, published by the MDPS (tab. 1/3, p. 18).
https://www.mdps.gov.qa/en/statistics1/pages/topicslisting.aspx?parent=Social&child=GenrealSocialStatistics
UAE: No data available since 2010.
Last date of access: 20 December 2017.
|
Bahrain |
Saudi Arabia |
Oman |
Kuwait |
Qatar |
|
Nationals |
Non-nationals |
Total |
Nationals |
Non-nationals |
Total |
Nationals |
Non-nationals |
Total |
Nationals |
Non-nationals |
Total |
Nationals |
Non-nationals |
Total |
| 0-4 |
74,814 |
31,256 |
106,070 |
2,095,791 |
513,799 |
2,609,590 |
348,419 |
33,238 |
381,657 |
168,206 |
164,181 |
332,387 |
116,225 |
240,649 |
356,874 |
| 5-9 |
69,442 |
25,891 |
95,333 |
2,048,461 |
651,730 |
2,700,191 |
272,309 |
31,760 |
304,069 |
141,918 |
138,774 |
280,692 |
| 10-14 |
63,914 |
19,940 |
83,854 |
1,833,119 |
534,104 |
2,367,223 |
216,927 |
25,961 |
242,888 |
130,171 |
109,464 |
239,635 |
| 15-19 |
60,583 |
14,495 |
75,078 |
1,726,919 |
434,773 |
2,161,692 |
218,031 |
18,112 |
236,143 |
126,960 |
96,042 |
223,002 |
28,403 |
49,664 |
78,067 |
| 20-24 |
58,661 |
44,325 |
102,986 |
1,948,182 |
463,696 |
2,411,878 |
248,966 |
126,128 |
375,094 |
115,170 |
86,200 |
201,370 |
29,039 |
218,436 |
247,475 |
| 25-29 |
54,470 |
124,945 |
179,415 |
1,868,085 |
1,078,080 |
2,946,165 |
242,370 |
459,646 |
702,016 |
100,446 |
243,275 |
343,721 |
25,894 |
334,556 |
360,450 |
| 30-34 |
48,355 |
139,062 |
187,417 |
1,686,036 |
1,285,625 |
2,971,661 |
208,730 |
387,500 |
596,230 |
83,061 |
416,018 |
499,079 |
20,156 |
402,011 |
422,167 |
| 35-39 |
42,845 |
107,120 |
149,965 |
1,473,331 |
1,815,632 |
3,288,963 |
158,133 |
265,129 |
423,262 |
72,212 |
438,486 |
510,698 |
16,677 |
334,568 |
351,245 |
| 40-44 |
34,806 |
81,550 |
116,356 |
1,239,113 |
1,698,062 |
2,937,175 |
102,455 |
184,862 |
287,317 |
69,450 |
403,490 |
472,940 |
15,169 |
248,987 |
264,156 |
| 45-49 |
33,856 |
58,770 |
92,626 |
1,032,421 |
1,156,666 |
2,189,087 |
72,238 |
127,513 |
199,751 |
58,085 |
266,867 |
324,952 |
13,781 |
193,096 |
206,877 |
| 50-54 |
32,837 |
36,526 |
69,363 |
823,032 |
711,552 |
1,534,584 |
62,805 |
76,330 |
139,135 |
48,226 |
174,348 |
222,574 |
12,280 |
105,079 |
117,359 |
| 55-59 |
27,133 |
23,457 |
50,590 |
632,736 |
431,182 |
1,063,918 |
53,549 |
52,655 |
106,204 |
36,940 |
108,054 |
144,994 |
11,117 |
81,713 |
92,830 |
| 60-64 |
18,324 |
9,359 |
27,683 |
462,521 |
241,861 |
704,382 |
39,153 |
17,846 |
56,999 |
27,031 |
57,620 |
84,651 |
6,537 |
29,194 |
35,731 |
| 65-69 |
10,774 |
2,829 |
13,603 |
299,208 |
95,756 |
394,964 |
31,693 |
4,900 |
36,593 |
18,180 |
25,212 |
43,392 |
5,664 |
15,967 |
21,631 |
| 70-74 |
7,093 |
1,158 |
8,251 |
214,829 |
48,914 |
263,743 |
26,037 |
1,429 |
27,466 |
12,411 |
10,400 |
22,811 |
2,355 |
2,807 |
5,162 |
| 75-79 |
5,168 |
665 |
5,833 |
138,434 |
18,986 |
157,420 |
19,394 |
639 |
20,033 |
7,934 |
5,252 |
13,186 |
3,339 |
1,219 |
4,558 |
| 80+ |
4,760 |
1,139 |
5,899 |
170,421 |
17,679 |
188,100 |
23,737 |
508 |
24,245 |
6,436 |
4,511 |
10,947 |
| |
647,835 |
722,487 |
1,370,322 |
19,692,639 |
11,198,097 |
30,890,736 |
2,344,946 |
1,814,156 |
4,159,102 |
1,222,837 |
2,748,194 |
3,971,031 |
306,636 |
2,257,946 |
2,564,582 |
Sources: national statistics institutes.
ANNEXED NOTE
Sources:
Bahrain, Kuwait, Oman and Saudi Arabia: mid-year population estimates, national statistics and administrative records, retrieved from GCC Stat center (http://dp.gccstat.org/en/DataAnalysis).
Qatar: Population aged 15 and above, by five-year age-group: 2015 Labour Force Survey (yearly synthesis: end of year population) https://www.mdps.gov.qa/en/statistics/Statistical%20Releases/Social/LaborForce/2015/LaborForce2015.xls
Population aged 0-14 by nationality (national/ non-national) and sex: GLMM author’s estimate, based on the percentage distribution of population by broad age groups,
sex and nationality for 2015, available in 2016 issue of report Women and Men in the State of Qatar- A Statistical Profile, published by the MDPS (tab. 1/3, p. 18).
https://www.mdps.gov.qa/en/statistics1/pages/topicslisting.aspx?parent=Social&child=GenrealSocialStatistics
UAE: No data available since 2010.
Last date of access: 20 December 2017.
|
Nationals |
| Bahrain |
Kuwait* |
Oman |
Qatar |
Saudi Arabia |
UAE |
| Illiterate |
N.A. |
24,040 |
N.A. |
3,616 |
451,716 |
N.A. |
| Reads and writes |
11,105 |
10,067 |
870,872 |
| Primary |
176,615 |
13,640 |
1,269,598 |
| Preparatory/ Intermediate/vocational |
248,150 |
33,933 |
2,560,385 |
| Secondary |
197,542 |
61,219 |
5,304,191 |
| Post-Secondary/ Pre-Univ. Diploma |
95,682 |
7,105 |
629,793 |
| University |
130,362 |
64,706 |
2,404,970 |
| Master degree/ Higher Diploma |
5,135 |
91,207 |
| Ph.D |
23,263 |
| Not Stated/other |
118,421 |
|
|
| Total |
1,007,052 |
194,286 |
13,605,995 |
|
Foreign nationals |
| Bahrain |
Kuwait* |
Oman |
Qatar |
Saudi Arabia |
UAE |
| Illiterate |
N.A. |
107,821 |
N.A. |
30,450 |
133,225 |
N.A. |
| Reads and writes |
983,323 |
238,113 |
1,114,442 |
| Primary |
197,222 |
428,590 |
1,644,326 |
| Preparatory/ Intermediate/vocational |
687,913 |
593,995 |
2,787,129 |
| Secondary |
279,728 |
374,768 |
2,352,747 |
| Post-Secondary/ Pre-Univ. Diploma |
59,305 |
104,841 |
489,189 |
| University |
136,499 |
342,352 |
1,473,042 |
| Master degree/ Higher Diploma |
6,468 |
97,641 |
| Ph.D |
54,379 |
| Not Stated/other |
316,067 |
|
|
| Total |
2,774,346 |
2,113,109 |
10,146,120 |
Sources: see below.
ANNEXED NOTE
Sources:
Saudi Arabia: GLMM calculations, based on the published results of Labour Force Survey 2016 (Q3, Aug. 2016), General Authority for Statistics (GAStat).
https://www.stats.gov.sa/en/814
Qatar: Annual Bulletin of Labor Force Sample survey 2016 (yearly synthesis), Ministry of Development Planning and Statistics
http://www.mdps.gov.qa/en/statistics/Statistical%20Releases/Social/LaborForce/2016/Labour_force_2016_AE.pdf.
Kuwait: Public Authority for Civil Information (PACI) records (December 2016).
(http://www.paci.gov.kw/en/ (English); http://www.paci.gov.kw/ (Arabic))
Oman, Bahrain, UAE: no data available for the year 2016.
Definitions:
Levels of educational attainment are adapted from ISCED classification.
The educational attainment level of an individual is the highest ISCED level successfully completed.
Categories’ labels were standardised. Each country’s data were redistributed under the new labels.
* Kuwait: population aged 10 and above.
Table as of 11 November 2017.
|
Nationals |
|
Bahrain |
Kuwait* |
Oman |
Qatar |
Saudi Arabia |
UAE |
|
males |
females |
males |
females |
males |
females |
males |
females |
males |
females |
males |
females |
| Illiterate |
N.A. |
N.A. |
2,267 |
21,773 |
N.A. |
N.A. |
79 |
2,831 |
98,846 |
352,870 |
N.A. |
N.A. |
| Reads and writes |
4,099 |
7,006 |
4,537 |
5,530 |
233,657 |
637,215 |
| Primary |
97,375 |
79,240 |
7,072 |
6,568 |
582,248 |
687,350 |
| Preparatory/ Intermediate/vocational |
136,435 |
111,715 |
16,572 |
17,361 |
1,302,119 |
1,258,266 |
| Secondary |
97,141 |
100,401 |
34,873 |
26,346 |
2,982,586 |
2,321,605 |
| Post-Secondary/ Pre-Univ. Diploma |
41,834 |
53,848 |
3,139 |
3,966 |
434,094 |
195,699 |
| University/ BA |
46,719 |
83,643 |
28,046 |
36,660 |
1,157,165 |
1,247,805 |
| Master degree/ Higher Diploma |
3,552 |
1,583 |
67,079 |
24,128 |
| Ph.D |
19,166 |
4,097 |
| Not Stated/other |
58,387 |
60,034 |
|
|
|
|
| Total |
487,809 |
519,243 |
94,318 |
99,262 |
6,876,960 |
6,729,035 |
|
Foreign nationals |
|
Bahrain |
Kuwait* |
Oman |
Qatar |
Saudi Arabia |
UAE |
|
males |
females |
males |
females |
males |
females |
males |
females |
males |
females |
males |
females |
| Illiterate |
N.A. |
N.A. |
68,536 |
39,285 |
N.A. |
N.A. |
26,395 |
4,055 |
85,087 |
48,138 |
N.A. |
N.A. |
| Reads and writes |
696,514 |
286,809 |
204,228 |
33,885 |
745,172 |
369,270 |
| Primary |
125,193 |
72,029 |
370,766 |
57,824 |
1,238,525 |
405,801 |
| Preparatory/ Intermediate/vocational |
501,764 |
186,149 |
533,614 |
60,381 |
2,064,411 |
722,718 |
| Secondary |
183,033 |
96,695 |
298,791 |
75,977 |
1,574,424 |
778,323 |
| Post-Secondary/ Pre-Univ. Diploma |
40,576 |
18,729 |
84,720 |
20,121 |
387,645 |
101,544 |
| University |
85,073 |
51,426 |
234,738 |
107,614 |
1,025,418 |
447,624 |
| Master degree/ Higher Diploma |
4,721 |
1,747 |
71,693 |
25,948 |
| Ph.D |
38,283 |
16,096 |
| Not Stated/other |
230,750 |
85,317 |
|
|
|
|
| Total |
1,936,160 |
838,186 |
1,753,252 |
359,857 |
7,230,658 |
2,915,462 |
Sources: see below.
ANNEXED NOTE
Sources:
Saudi Arabia: GLMM calculations, based on the published results of Labour Force Survey 2016 (Q3, Aug. 2016), General Authority for Statistics (GAStat).
https://www.stats.gov.sa/en/814
Qatar: Annual Bulletin of Labor Force Sample survey 2016 (yearly synthesis), Ministry of Development Planning and Statistics
http://www.mdps.gov.qa/en/statistics/Statistical%20Releases/Social/LaborForce/2016/Labour_force_2016_AE.pdf.
Kuwait: Public Authority for Civil Information (PACI) records (December 2016).
(http://www.paci.gov.kw/en/ (English); http://www.paci.gov.kw/ (Arabic))
Oman, Bahrain, UAE: no data available for the year 2016.
Definitions:
Levels of educational attainment are adapted from ISCED classification.
The educational attainment level of an individual is the highest ISCED level successfully completed.
Categories’ labels were standardised. Each country’s data were redistributed under the new labels.
* Kuwait: population aged 10 and above.
Table as of 11 November 2017.
|
Nationals |
|
Bahrain |
Kuwait |
Oman |
Qatar |
Saudi Arabia |
UAE |
|
males |
females |
males |
females |
males |
females |
males |
females |
males |
females |
males |
females |
| Illiterate |
6,259 |
17,993 |
N.A. |
N.A. |
57,509 |
122,365 |
1,810 |
5,773 |
391,890 |
1,145,244 |
N.A. |
N.A. |
| Reads and writes |
18,954 |
21,924 |
55,922 |
53,351 |
11,033 |
12,254 |
852,543 |
1,098,691 |
| Primary |
24,392 |
15,862 |
176,607 |
159,677 |
15,341 |
13,156 |
1,403,833 |
1,334,833 |
| Preparatory/ Intermediate/vocational |
43,903 |
35,723 |
127,247 |
99,576 |
17491 |
13368 |
1,603,136 |
1,310,071 |
| Secondary |
73,086 |
68,333 |
239,394 |
211,139 |
22,567 |
22,051 |
2,216,895 |
1,604,481 |
| Post-Secondary/ Pre-Univ. Diploma |
13,725 |
15,173 |
37,719 |
36,318 |
2,325 |
1,703 |
393,247 |
176,165 |
| University |
11,607 |
15,678 |
44,878 |
47,378 |
15,227 |
20,126 |
842,661 |
838,127 |
| Master degree/ Higher Diploma |
2,259 |
1,929 |
6,688 |
2,366 |
49,330 |
14,128 |
| Ph.D |
421 |
129 |
1,337 |
454 |
21,619 |
5,644 |
| Not Stated/other |
37 |
78 |
11 |
10 |
25 |
29 |
|
|
| Total |
194,643 |
192,822 |
747,312 |
732,634 |
85,819 |
88,460 |
7,775,154 |
7,527,384 |
|
Foreign nationals |
|
Bahrain |
Kuwait |
Oman |
Qatar |
Saudi Arabia |
UAE |
|
males |
females |
males |
females |
males |
females |
males |
females |
males |
females |
males |
females |
| Illiterate |
18,508 |
10,952 |
N.A. |
N.A. |
61,962 |
20,796 |
38,883 |
8,112 |
631,245 |
215,988 |
N.A. |
N.A. |
| Reads and writes |
134,855 |
55,674 |
159,004 |
43,887 |
290,325 |
53,473 |
1,135,408 |
441,670 |
| Primary |
78,996 |
12,272 |
112,102 |
18,475 |
282,452 |
37,759 |
949,686 |
308,116 |
| Preparatory/ Intermediate/vocational |
68,481 |
23,315 |
79,164 |
15,912 |
146,593 |
28,991 |
1,075,907 |
342,256 |
| Secondary |
70,490 |
20,329 |
87,770 |
24,231 |
203,202 |
46,235 |
756,067 |
313,262 |
| Post-Secondary/ Pre-Univ. Diploma |
39,658 |
16,046 |
31,361 |
11,290 |
29,449 |
9,986 |
227,873 |
88,460 |
| University |
24,739 |
9,748 |
45,915 |
23,481 |
122,130 |
59,903 |
497,409 |
252,638 |
| Master degree/ Higher Diploma |
10,423 |
3,763 |
11,247 |
6,346 |
48,524 |
18,166 |
| Ph.D |
915 |
257 |
2,470 |
907 |
23,649 |
9,158 |
| Not Stated/other |
13 |
69 |
68 |
5 |
41 |
29 |
|
|
| Total |
447,078 |
152,425 |
591,063 |
165,330 |
1,113,075 |
244,488 |
5,345,768 |
1,989,714 |
Sources: national censuses, 2010 round.
ANNEXED NOTE
Sources:
Saudi Arabia, Qatar and Bahrain: national censuses, 2010 round. Publications from each country’s statistical offices, as tabulated in GLMM database for each country.
Oman: GCC Stat center’s compilation of 2010 census round’s data for educational attainment (downloaded in June 2015,
but not yet available on GCC stats center’s website as of November 2017) .
Data for Kuwait (PACI) are unavailable for 2010; no data is available for the UAE for 2010 (no census), or for any of the Emirates.
Definitions:
Levels of educational attainment are adapted from ISCED classification.
The educational attainment level of an individual is the highest ISCED level successfully completed.
Categories’ labels were standardised. Each country’s data were redistributed under the new labels.
Table as of 11 November 2017.
|
Qataris |
|
15 – 19 |
20 – 24 |
25 – 29 |
30 – 34 |
35 – 39 |
40 – 44 |
45 – 49 |
50 – 54 |
55 – 59 |
60 – 64 |
65 – 69 |
70 – 74 |
75 + |
Total |
|
Male |
Female |
Male |
Female |
Male |
Female |
Male |
Female |
Male |
Female |
Male |
Female |
Male |
Female |
Male |
Female |
Male |
Female |
Male |
Female |
Male |
Female |
Male |
Female |
Male |
Female |
Male |
Female |
| Illiterate |
0 |
14 |
14 |
0 |
0 |
42 |
14 |
28 |
28 |
28 |
28 |
28 |
14 |
42 |
42 |
182 |
14 |
322 |
85 |
308 |
42 |
604 |
112 |
617 |
392 |
616 |
785 |
2,831 |
| Read & Write |
294 |
42 |
42 |
84 |
70 |
126 |
56 |
28 |
112 |
182 |
140 |
238 |
238 |
462 |
406 |
518 |
476 |
854 |
476 |
938 |
630 |
1,064 |
616 |
602 |
981 |
392 |
4,537 |
5,530 |
| Primary |
1,568 |
1,275 |
462 |
56 |
770 |
225 |
518 |
294 |
392 |
322 |
392 |
476 |
434 |
714 |
702 |
672 |
574 |
924 |
420 |
546 |
308 |
742 |
280 |
168 |
252 |
154 |
7,072 |
6,568 |
| Preparatory |
7,368 |
9,003 |
1,373 |
994 |
1,933 |
910 |
1,150 |
798 |
1,401 |
1,064 |
883 |
1,274 |
1,022 |
1,078 |
812 |
812 |
252 |
812 |
182 |
322 |
70 |
266 |
70 |
14 |
56 |
14 |
16,572 |
17,361 |
| Secondary |
5,027 |
4,525 |
10,589 |
10,277 |
5,726 |
5,365 |
3,067 |
2,801 |
3,250 |
1,306 |
2,045 |
952 |
2,157 |
546 |
1,373 |
294 |
672 |
112 |
463 |
42 |
210 |
126 |
140 |
0 |
154 |
0 |
34,873 |
26,346 |
| Pre.U.Diploma |
28 |
0 |
224 |
462 |
602 |
756 |
294 |
560 |
252 |
448 |
294 |
476 |
294 |
309 |
350 |
211 |
322 |
407 |
225 |
196 |
169 |
113 |
57 |
14 |
28 |
14 |
3,139 |
3,966 |
| University and above |
0 |
0 |
1,162 |
2,760 |
5,308 |
6,470 |
3,462 |
6,404 |
3,866 |
4,932 |
2,859 |
5,238 |
3,334 |
4,217 |
3,490 |
3,038 |
2,002 |
2,634 |
1,443 |
617 |
672 |
336 |
308 |
14 |
140 |
0 |
28,046 |
36,660 |
| Total |
14,285 |
14,859 |
13,866 |
14,633 |
14,409 |
13,894 |
8,561 |
10,913 |
9,301 |
8,282 |
6,641 |
8,682 |
7,493 |
7,368 |
7,175 |
5,727 |
4,312 |
6,065 |
3,294 |
2,969 |
2,101 |
3,251 |
1,583 |
1,429 |
2,003 |
1,190 |
95,024 |
99,262 |
|
Non-Qataris |
|
15 – 19 |
20 – 24 |
25 – 29 |
30 – 34 |
35 – 39 |
40 – 44 |
45 – 49 |
50 – 54 |
55 – 59 |
60 – 64 |
65 – 69 |
70 – 74 |
75 + |
Total |
|
Male |
Female |
Male |
Female |
Male |
Female |
Male |
Female |
Male |
Female |
Male |
Female |
Male |
Female |
Male |
Female |
Male |
Female |
Male |
Female |
Male |
Female |
Male |
Female |
Male |
Female |
Male |
Female |
| Illiterate |
14 |
92 |
3,269 |
497 |
4,653 |
526 |
4,656 |
224 |
6,822 |
196 |
3,212 |
353 |
1,558 |
324 |
595 |
453 |
694 |
236 |
549 |
614 |
327 |
166 |
46 |
74 |
0 |
300 |
26,395 |
4,055 |
| Read & Write |
1,779 |
1,389 |
17,045 |
2,228 |
31,220 |
3,557 |
34,089 |
6,444 |
33,857 |
6,588 |
28,994 |
4,337 |
24,065 |
2,518 |
15,903 |
3,151 |
11,360 |
1,605 |
2,724 |
710 |
2,358 |
831 |
376 |
420 |
458 |
107 |
204,228 |
33,885 |
| Primary |
3,988 |
2,049 |
43,119 |
5,188 |
75,219 |
10,785 |
84,521 |
13,696 |
65,140 |
11,741 |
36,799 |
5,716 |
27,493 |
3,923 |
17,420 |
2,025 |
12,649 |
1,999 |
2,424 |
628 |
1,483 |
60 |
373 |
14 |
138 |
0 |
370,766 |
57,824 |
| Preparatory |
13,041 |
8,050 |
61,316 |
5,340 |
99,147 |
8,932 |
113,928 |
12,293 |
101,590 |
12,971 |
57,634 |
6,211 |
43,896 |
3,137 |
20,389 |
2,353 |
16,812 |
842 |
3,329 |
133 |
2,288 |
119 |
152 |
0 |
92 |
0 |
533,614 |
60,381 |
| Secondary |
6,489 |
6,617 |
43,092 |
12,766 |
53,264 |
11,614 |
53,996 |
12,414 |
52,701 |
13,219 |
35,213 |
8,364 |
22,446 |
6,112 |
14,625 |
2,622 |
13,122 |
1,748 |
3,019 |
270 |
581 |
171 |
243 |
46 |
0 |
14 |
298,791 |
75,977 |
| Pre.U. Diploma |
261 |
212 |
8,712 |
2,964 |
16,331 |
2,301 |
18,678 |
6,668 |
15,345 |
2,851 |
10,274 |
1,957 |
6,066 |
1,551 |
3,445 |
690 |
3,866 |
586 |
1,256 |
152 |
486 |
189 |
0 |
0 |
0 |
0 |
84,720 |
20,121 |
| University and above |
0 |
0 |
17,680 |
13,601 |
38,256 |
17,460 |
49,716 |
24,916 |
40,953 |
21,830 |
31,358 |
15,186 |
22,312 |
7,630 |
15,092 |
4,378 |
12,107 |
1,725 |
3,922 |
736 |
2,729 |
106 |
378 |
46 |
235 |
0 |
234,738 |
107,614 |
| Total |
25,572 |
18,409 |
194,233 |
42,584 |
318,090 |
55,175 |
359,584 |
76,655 |
316,408 |
69,396 |
203,484 |
42,124 |
147,836 |
25,195 |
87,469 |
15,672 |
70,610 |
8,741 |
17,223 |
3,243 |
10,252 |
1,642 |
1,568 |
600 |
923 |
421 |
1,753,252 |
359,857 |
|
Total |
|
15 – 19 |
20 – 24 |
25 – 29 |
30 – 34 |
35 – 39 |
40 – 44 |
45 – 49 |
50 – 54 |
55 – 59 |
60 – 64 |
65 – 69 |
70 – 74 |
75 + |
Total |
|
Male |
Female |
Male |
Female |
Male |
Female |
Male |
Female |
Male |
Female |
Male |
Female |
Male |
Female |
Male |
Female |
Male |
Female |
Male |
Female |
Male |
Female |
Male |
Female |
Male |
Female |
Male |
Female |
| Illiterate |
14 |
106 |
3,283 |
497 |
4,653 |
568 |
4,670 |
252 |
6,850 |
224 |
3,240 |
381 |
1,572 |
366 |
637 |
635 |
708 |
558 |
634 |
922 |
369 |
770 |
158 |
691 |
392 |
916 |
27,180 |
6,886 |
| Read & Write |
2,073 |
1,431 |
17,087 |
2,312 |
31,290 |
3,683 |
34,145 |
6,472 |
33,969 |
6,770 |
29,134 |
4,575 |
24,303 |
2,980 |
16,309 |
3,669 |
11,836 |
2,459 |
3,200 |
1,648 |
2,988 |
1,895 |
992 |
1,022 |
1,439 |
499 |
208,765 |
39,415 |
| Primary |
5,556 |
3,324 |
43,581 |
5,244 |
75,989 |
11,010 |
85,039 |
13,990 |
65,532 |
12,063 |
37,191 |
6,192 |
27,927 |
4,637 |
18,122 |
2,697 |
13,223 |
2,923 |
2,844 |
1,174 |
1,791 |
802 |
653 |
182 |
390 |
154 |
377,838 |
64,392 |
| Preparatory |
20,409 |
17,053 |
62,689 |
6,334 |
101,080 |
9,842 |
115,078 |
13,091 |
102,991 |
14,035 |
58,517 |
7,485 |
44,918 |
4,215 |
21,201 |
3,165 |
17,064 |
1,654 |
3,511 |
455 |
2,358 |
385 |
222 |
14 |
148 |
14 |
550,186 |
77,742 |
| Secondary |
11,516 |
11,142 |
53,681 |
23,043 |
58,990 |
16,979 |
57,063 |
15,215 |
55,951 |
14,525 |
37,258 |
9,316 |
24,603 |
6,658 |
15,998 |
2,916 |
13,794 |
1,860 |
3,482 |
312 |
791 |
297 |
383 |
46 |
154 |
14 |
333,664 |
102,323 |
| Pre.U. Diploma |
289 |
212 |
8,936 |
3,426 |
16,933 |
3,057 |
18,972 |
7,228 |
15,597 |
3,299 |
10,568 |
2,433 |
6,360 |
1,860 |
3,795 |
901 |
4,188 |
993 |
1,481 |
348 |
655 |
302 |
57 |
14 |
28 |
14 |
87,859 |
24,087 |
| University and above |
0 |
0 |
18,842 |
16,361 |
43,564 |
23,930 |
53,178 |
31,320 |
44,819 |
26,762 |
34,217 |
20,424 |
25,646 |
11,847 |
18,582 |
7,416 |
14,109 |
4,359 |
5,365 |
1,353 |
3,401 |
442 |
686 |
60 |
375 |
0 |
262,784 |
144,274 |
| Total |
39,857 |
33,268 |
208,099 |
57,217 |
332,499 |
69,069 |
368,145 |
87,568 |
325,709 |
77,678 |
210,125 |
50,806 |
155,329 |
32,563 |
94,644 |
21,399 |
74,922 |
14,806 |
20,517 |
6,212 |
12,353 |
4,893 |
3,151 |
2,029 |
2,926 |
1,611 |
1,848,276 |
459,119 |
Source: Annual Bulletin of Labor Force Sample survey 2016
ANNEXED NOTE
1. Technical Notes and Definitions
The data is taken from 2016 Labour Force Survey (yearly synthesis)
Sampling frame of LFS 2016: Population Census 2010.
Sample size: 60,016 persons, in 9,199 households: 1- Qatari households; 2- Non-Qatari regular (non-collective) households;
Data Collection: The sample was divided into equal parts to collect data monthly. Each month 1/3 of the quarterly data were collected during the first two weeks of the month.
Reference period for the labour force data: the week prior to data collection day.
Population of reference: all Qatari and non-Qatari households present in Qatar on the night of survey, living in normal and collective households.
The collective households are a group of persons not related to each other and sharing living conditions in a residential unit, I.e. labour camps, students living boarding schools, nurses in hospitals… etc. The survey covered the small collective households (includes less than 7 persons) and large collective households (includes 7 persons or more).
The survey did not cover short periods accommodation, i.e. hotels.
2. Institution which provides data
Ministry of Development Planning and Statistics
(http://www.mdps.gov.qa/en/pages/default.aspx)
3. Data availability
Available at (PDF format):
http://www.mdps.gov.qa/en/statistics/Statistical%20Releases/Social/LaborForce/2016/Labour_force_2016_AE.pdf
The Statistics Authority conducted the first labour Force Sample Survey in 2001. Starting from 2006, the execution of these surveys came to be on annual basis. Quarterly publications of Labour Force Surveys’ data are also available since 2012.
2016′ and earlier Labour Force Surveys can be downloaded from MDPS’s website, in PDF and Excel format:
http://www.mdps.gov.qa/en/statistics1/pages/topicslisting.aspx?parent=Social&child=LaborForce
See also Qatar Information Exchange for earlier Labour Force Surveys. QIX has also an interactive data base compiling data on the labour force taken from available surveys:
http://www.qix.gov.qa/portal/page/portal/qix/subject_area/Statistics?subject_area=183
Last date of access: October 2017.
|
Qataris |
|
15 – 19 |
20 – 24 |
25 – 29 |
30 – 34 |
35 – 39 |
40 – 44 |
45 – 49 |
50 – 54 |
55 – 59 |
60 – 64 |
65 – 69 |
70 – 74 |
75 + |
Total |
| Illiterate |
14 |
14 |
42 |
42 |
56 |
56 |
56 |
224 |
336 |
393 |
646 |
729 |
1,008 |
3,616 |
| Read & Write |
336 |
126 |
196 |
84 |
294 |
378 |
700 |
924 |
1,330 |
1,414 |
1,694 |
1,218 |
1,373 |
10,067 |
| Primary |
2,843 |
518 |
995 |
812 |
714 |
868 |
1,148 |
1,374 |
1,498 |
966 |
1,050 |
448 |
406 |
13,640 |
| Preparatory |
16,371 |
2,367 |
2,843 |
1,948 |
2,465 |
2,157 |
2,100 |
1,624 |
1,064 |
504 |
336 |
84 |
70 |
33,933 |
| Secondary |
9,552 |
20,866 |
11,091 |
5,868 |
4,556 |
2,997 |
2,703 |
1,667 |
784 |
505 |
336 |
140 |
154 |
61,219 |
| Pre.U. Diploma |
28 |
686 |
1,358 |
854 |
700 |
770 |
603 |
561 |
729 |
421 |
282 |
71 |
42 |
7,105 |
| University and above |
0 |
3,922 |
11,778 |
9,866 |
8,798 |
8,097 |
7,551 |
6,528 |
4,636 |
2,060 |
1,008 |
322 |
140 |
64,706 |
| Total |
29,144 |
28,499 |
28,303 |
19,474 |
17,583 |
15,323 |
14,861 |
12,902 |
10,377 |
6,263 |
5,352 |
3,012 |
3,193 |
194,286 |
|
Non-Qataris |
|
15 – 19 |
20 – 24 |
25 – 29 |
30 – 34 |
35 – 39 |
40 – 44 |
45 – 49 |
50 – 54 |
55 – 59 |
60 – 64 |
65 – 69 |
70 – 74 |
75 + |
Total |
| Illiterate |
106 |
3,766 |
5,179 |
4,880 |
7,018 |
3,565 |
1,882 |
1,048 |
930 |
1,163 |
493 |
120 |
300 |
30,450 |
| Read & Write |
3,168 |
19,273 |
34,777 |
40,533 |
40,445 |
33,331 |
26,583 |
19,054 |
12,965 |
3,434 |
3,189 |
796 |
565 |
238,113 |
| Primary |
6,037 |
48,307 |
86,004 |
98,217 |
76,881 |
42,515 |
31,416 |
19,445 |
14,648 |
3,052 |
1,543 |
387 |
138 |
428,590 |
| Preparatory |
21,091 |
66,656 |
108,079 |
126,221 |
114,561 |
63,845 |
47,033 |
22,742 |
17,654 |
3,462 |
2,407 |
152 |
92 |
593,995 |
| Secondary |
13,106 |
55,858 |
64,878 |
66,410 |
65,920 |
43,577 |
28,558 |
17,247 |
14,870 |
3,289 |
752 |
289 |
14 |
374,768 |
| Pre.U. Diploma |
473 |
11,676 |
18,632 |
25,346 |
18,196 |
12,231 |
7,617 |
4,135 |
4,452 |
1,408 |
675 |
0 |
0 |
104,841 |
| University and above |
0 |
31,281 |
55,716 |
74,632 |
62,783 |
46,544 |
29,942 |
19,470 |
13,832 |
4,658 |
2,835 |
424 |
235 |
342,352 |
| Total |
43,981 |
236,817 |
373,265 |
436,239 |
385,804 |
245,608 |
173,031 |
103,141 |
79,351 |
20,466 |
11,894 |
2,168 |
1,344 |
2,113,109 |
|
Total population |
|
15 – 19 |
20 – 24 |
25 – 29 |
30 – 34 |
35 – 39 |
40 – 44 |
45 – 49 |
50 – 54 |
55 – 59 |
60 – 64 |
65 – 69 |
70 – 74 |
75 + |
Total |
| Illiterate |
120 |
3,780 |
5,221 |
4,922 |
7,074 |
3,621 |
1,938 |
1,272 |
1,266 |
1,556 |
1,139 |
849 |
1,308 |
34,066 |
| Read & Write |
3,504 |
19,399 |
34,973 |
40,617 |
40,739 |
33,709 |
27,283 |
19,978 |
14,295 |
4,848 |
4,883 |
2,014 |
1,938 |
248,180 |
| Primary |
8,880 |
48,825 |
86,999 |
99,029 |
77,595 |
43,383 |
32,564 |
20,819 |
16,146 |
4,018 |
2,593 |
835 |
544 |
442,230 |
| Preparatory |
37,462 |
69,023 |
110,922 |
128,169 |
117,026 |
66,002 |
49,133 |
24,366 |
18,718 |
3,966 |
2,743 |
236 |
162 |
627,928 |
| Secondary |
22,658 |
76,724 |
75,969 |
72,278 |
70,476 |
46,574 |
31,261 |
18,914 |
15,654 |
3,794 |
1,088 |
429 |
168 |
435,987 |
| Pre.U. Diploma |
501 |
12,362 |
19,990 |
26,200 |
18,896 |
13,001 |
8,220 |
4,696 |
5,181 |
1,829 |
957 |
71 |
42 |
111,946 |
| University and above |
0 |
35,203 |
67,494 |
84,498 |
71,581 |
54,641 |
37,493 |
25,998 |
18,468 |
6,718 |
3,843 |
746 |
375 |
407,058 |
| Total |
73,125 |
265,316 |
401,568 |
455,713 |
403,387 |
260,931 |
187,892 |
116,043 |
89,728 |
26,729 |
17,246 |
5,180 |
4,537 |
2,307,395 |
Source: Annual Bulletin of Labor Force Sample survey 2016
ANNEXED NOTE
1. Technical Notes and Definitions
The data is taken from 2016 Labour Force Survey (yearly synthesis)
Sampling frame of LFS 2016: Population Census 2010.
Sample size: 60,016 persons, in 9,199 households: 1- Qatari households; 2- Non-Qatari regular (non-collective) households;
Data Collection: The sample was divided into equal parts to collect data monthly. Each month 1/3 of the quarterly data were collected during the first two weeks of the month.
Reference period for the labour force data: the week prior to data collection day.
Population of reference: all Qatari and non-Qatari households present in Qatar on the night of survey, living in normal and collective households.
The collective households are a group of persons not related to each other and sharing living conditions in a residential unit, I.e. labour camps, students living boarding schools, nurses in hospitals… etc. The survey covered the small collective households (includes less than 7 persons) and large collective households (includes 7 persons or more).
The survey did not cover short periods accommodation, i.e. hotels.
2. Institution which provides data
Ministry of Development Planning and Statistics
(http://www.mdps.gov.qa/en/pages/default.aspx)
3. Data availability
Available at (PDF format):
http://www.mdps.gov.qa/en/statistics/Statistical%20Releases/Social/LaborForce/2016/Labour_force_2016_AE.pdf
The Statistics Authority conducted the first labour Force Sample Survey in 2001. Starting from 2006, the execution of these surveys came to be on annual basis. Quarterly publications of Labour Force Surveys’ data are also available since 2012.
2016′ and earlier Labour Force Surveys can be downloaded from MDPS’s website, in PDF and Excel format:
http://www.mdps.gov.qa/en/statistics1/pages/topicslisting.aspx?parent=Social&child=LaborForce
See also Qatar Information Exchange for earlier Labour Force Surveys. QIX has also an interactive data base compiling data on the labour force taken from available surveys:
http://www.qix.gov.qa/portal/page/portal/qix/subject_area/Statistics?subject_area=183
Last date of access: October 2017.
|
Kuwaitis |
|
10-14 |
15-19 |
20-24 |
25-29 |
30-34 |
35-39 |
40-44 |
45-49 |
50-54 |
55-59 |
60-64 |
>64 |
Total |
|
Male |
Female |
Male |
Female |
Male |
Female |
Male |
Female |
Male |
Female |
Male |
Female |
Male |
Female |
Male |
Female |
Male |
Female |
Male |
Female |
Male |
Female |
Male |
Female |
Male |
Female |
| Illiterate |
0 |
1 |
3 |
1 |
5 |
13 |
6 |
12 |
1 |
28 |
0 |
21 |
1 |
16 |
3 |
39 |
2 |
60 |
112 |
2,740 |
111 |
4,025 |
2,023 |
14,817 |
2,267 |
21,773 |
| Read &Write |
23 |
13 |
6 |
18 |
2 |
20 |
6 |
143 |
14 |
230 |
10 |
143 |
48 |
67 |
10 |
24 |
7 |
31 |
256 |
1,128 |
360 |
1,366 |
3,357 |
3,823 |
4,099 |
7,006 |
| Primary |
39,175 |
40,229 |
17,200 |
13,267 |
11,365 |
4,300 |
7,385 |
3,732 |
3,633 |
1,959 |
3,554 |
2,214 |
4,884 |
2,531 |
2,722 |
2,339 |
1,535 |
2,310 |
1,304 |
1,925 |
1,260 |
1,758 |
3,358 |
2,676 |
97,375 |
79,240 |
| Intermediate |
0 |
0 |
37,955 |
36,667 |
25,297 |
20,340 |
12,880 |
5,723 |
12,695 |
6,866 |
10,384 |
6,785 |
9,408 |
8,659 |
9,847 |
9,098 |
6,663 |
6,638 |
4,307 |
4,459 |
3,191 |
3,349 |
3,808 |
3,131 |
136,435 |
111,715 |
| Secondary |
0 |
0 |
5,542 |
9,880 |
22,416 |
31,325 |
17,387 |
18,261 |
13,945 |
10,717 |
11,250 |
8,844 |
7,298 |
5,836 |
6,189 |
5,432 |
5,899 |
4,513 |
3,241 |
2,784 |
2,019 |
1,632 |
1,955 |
1,177 |
97,141 |
100,401 |
| Diploma |
0 |
0 |
0 |
0 |
1,616 |
1,511 |
6,266 |
8,970 |
7,700 |
12,782 |
5,810 |
8,079 |
4,794 |
5,559 |
4,201 |
4,204 |
3,804 |
4,247 |
3,194 |
3,980 |
2,295 |
2,764 |
2,154 |
1,752 |
41,834 |
53,848 |
| University |
0 |
0 |
0 |
0 |
1,531 |
3,375 |
7,626 |
14,530 |
7,365 |
15,215 |
6,187 |
14,540 |
5,524 |
12,524 |
4,328 |
8,759 |
4,771 |
6,632 |
4,013 |
4,364 |
2,651 |
2,305 |
2,723 |
1,399 |
46,719 |
83,643 |
| Post Graduate |
0 |
0 |
0 |
0 |
0 |
1 |
52 |
50 |
180 |
209 |
249 |
226 |
256 |
150 |
327 |
161 |
348 |
128 |
607 |
193 |
634 |
215 |
899 |
250 |
3,552 |
1,583 |
| Not Stated |
36,588 |
33,424 |
6,617 |
4,714 |
2,868 |
2,134 |
2,470 |
2,565 |
1,758 |
2,376 |
1,500 |
2,284 |
1,643 |
3,100 |
1,410 |
3,523 |
1,275 |
3,960 |
511 |
849 |
517 |
360 |
1,230 |
745 |
58,387 |
60,034 |
| Total |
75,786 |
73,667 |
67,323 |
64,547 |
65,100 |
63,019 |
54,078 |
53,986 |
47,291 |
50,382 |
38,944 |
43,136 |
33,856 |
38,442 |
29,037 |
33,579 |
24,304 |
28,519 |
17,545 |
22,422 |
13,038 |
17,774 |
21,507 |
29,770 |
487,809 |
519,243 |
|
Non-Kuwaitis |
|
10-14 |
15-19 |
20-24 |
25-29 |
30-34 |
35-39 |
40-44 |
45-49 |
50-54 |
55-59 |
60-64 |
>64 |
Total |
|
Male |
Female |
Male |
Female |
Male |
Female |
Male |
Female |
Male |
Female |
Male |
Female |
Male |
Female |
Male |
Female |
Male |
Female |
Male |
Female |
Male |
Female |
Male |
Female |
Male |
Female |
| Illiterate |
180 |
172 |
153 |
156 |
2,581 |
932 |
6,514 |
4,279 |
8,293 |
4,568 |
7,943 |
4,266 |
8,264 |
4,623 |
10,352 |
5,026 |
10,318 |
4,505 |
6,694 |
3,503 |
3,657 |
2,357 |
3,587 |
4,898 |
68,536 |
39,285 |
| Read &Write |
3,519 |
3,059 |
5,101 |
4,714 |
53,520 |
13,725 |
146,128 |
60,570 |
142,863 |
61,957 |
119,409 |
52,868 |
88,695 |
39,640 |
65,239 |
26,415 |
37,549 |
13,268 |
20,236 |
5,836 |
9,034 |
2,516 |
5,221 |
2,241 |
696,514 |
286,809 |
| Primary |
18,542 |
17,770 |
10,569 |
9,437 |
13,247 |
9,571 |
11,793 |
7,310 |
11,748 |
7,050 |
12,285 |
6,650 |
11,236 |
5,446 |
11,112 |
3,582 |
10,021 |
2,209 |
7,462 |
1,354 |
4,170 |
806 |
3,008 |
844 |
125,193 |
72,029 |
| Intermediate |
0 |
0 |
16,953 |
16,011 |
41,262 |
15,317 |
99,130 |
35,538 |
100,709 |
34,456 |
83,045 |
29,684 |
61,950 |
24,098 |
46,649 |
16,178 |
26,171 |
7,936 |
15,375 |
3,676 |
6,893 |
1,764 |
3,627 |
1,491 |
501,764 |
186,149 |
| Secondary |
0 |
0 |
1,593 |
2,543 |
10,515 |
8,846 |
25,014 |
15,964 |
32,576 |
18,863 |
28,162 |
15,465 |
24,041 |
11,240 |
22,950 |
9,086 |
16,803 |
6,750 |
11,261 |
4,161 |
6,563 |
2,159 |
3,555 |
1,618 |
183,033 |
96,695 |
| Diploma |
0 |
0 |
0 |
0 |
1,265 |
528 |
5,364 |
2,573 |
7,081 |
3,783 |
6,499 |
2,840 |
5,737 |
2,507 |
5,277 |
2,076 |
3,915 |
1,662 |
2,514 |
1,225 |
1,759 |
903 |
1,165 |
632 |
40,576 |
18,729 |
| University |
0 |
0 |
0 |
0 |
799 |
1,176 |
10,269 |
8,908 |
14,905 |
12,509 |
13,463 |
9,095 |
10,821 |
6,691 |
8,961 |
4,308 |
8,872 |
3,522 |
7,101 |
2,554 |
5,197 |
1,628 |
4,685 |
1,035 |
85,073 |
51,426 |
| Post Graduate |
0 |
0 |
0 |
0 |
14 |
15 |
124 |
129 |
540 |
350 |
815 |
380 |
650 |
257 |
451 |
156 |
460 |
130 |
466 |
124 |
460 |
98 |
741 |
108 |
4,721 |
1,747 |
| Not Stated |
34,021 |
31,702 |
9,378 |
8,366 |
5,733 |
3,244 |
7,905 |
3,112 |
19,815 |
5,381 |
58,938 |
9,386 |
42,749 |
8,768 |
26,476 |
7,114 |
14,058 |
4,443 |
6,816 |
2,143 |
2,929 |
746 |
1,932 |
912 |
230,750 |
85,317 |
| Total |
56,262 |
52,703 |
43,747 |
41,227 |
128,936 |
53,354 |
312,241 |
138,383 |
338,530 |
148,917 |
330,559 |
130,634 |
254,143 |
103,270 |
197,467 |
73,941 |
128,167 |
44,425 |
77,925 |
24,576 |
40,662 |
12,977 |
27,521 |
13,779 |
1,936,160 |
838,186 |
|
Total population aged 10+ |
|
10-14 |
15-19 |
20-24 |
25-29 |
30-34 |
35-39 |
40-44 |
45-49 |
50-54 |
55-59 |
60-64 |
>64 |
Total |
|
Male |
Female |
Male |
Female |
Male |
Female |
Male |
Female |
Male |
Female |
Male |
Female |
Male |
Female |
Male |
Female |
Male |
Female |
Male |
Female |
Male |
Female |
Male |
Female |
Male |
Female |
| Illiterate |
180 |
173 |
156 |
157 |
2,586 |
945 |
6,520 |
4,291 |
8,294 |
4,596 |
7,943 |
4,287 |
8,265 |
4,639 |
10,355 |
5,065 |
10,320 |
4,565 |
6,806 |
6,243 |
3,768 |
6,382 |
5,610 |
19,715 |
70,803 |
61,058 |
| Read &Write |
3,542 |
3,072 |
5,107 |
4,732 |
53,522 |
13,745 |
146,134 |
60,713 |
142,877 |
62,187 |
119,419 |
53,011 |
88,743 |
39,707 |
65,249 |
26,439 |
37,556 |
13,299 |
20,492 |
6,964 |
9,394 |
3,882 |
8,578 |
6,064 |
700,613 |
293,815 |
| Primary |
57,717 |
57,999 |
27,769 |
22,704 |
24,612 |
13,871 |
19,178 |
11,042 |
15,381 |
9,009 |
15,839 |
8,864 |
16,120 |
7,977 |
13,834 |
5,921 |
11,556 |
4,519 |
8,766 |
3,279 |
5,430 |
2,564 |
6,366 |
3,520 |
222,568 |
151,269 |
| Intermediate |
0 |
0 |
54,908 |
52,678 |
66,559 |
35,657 |
112,010 |
41,261 |
113,404 |
41,322 |
93,429 |
36,469 |
71,358 |
32,757 |
56,496 |
25,276 |
32,834 |
14,574 |
19,682 |
8,135 |
10,084 |
5,113 |
7,435 |
4,622 |
638,199 |
297,864 |
| Secondary |
0 |
0 |
7,135 |
12,423 |
32,931 |
40,171 |
42,401 |
34,225 |
46,521 |
29,580 |
39,412 |
24,309 |
31,339 |
17,076 |
29,139 |
14,518 |
22,702 |
11,263 |
14,502 |
6,945 |
8,582 |
3,791 |
5,510 |
2,795 |
280,174 |
197,096 |
| Diploma |
0 |
0 |
0 |
0 |
2,881 |
2,039 |
11,630 |
11,543 |
14,781 |
16,565 |
12,309 |
10,919 |
10,531 |
8,066 |
9,478 |
6,280 |
7,719 |
5,909 |
5,708 |
5,205 |
4,054 |
3,667 |
3,319 |
2,384 |
82,410 |
72,577 |
| University |
0 |
0 |
0 |
0 |
2,330 |
4,551 |
17,895 |
23,438 |
22,270 |
27,724 |
19,650 |
23,635 |
16,345 |
19,215 |
13,289 |
13,067 |
13,643 |
10,154 |
11,114 |
6,918 |
7,848 |
3,933 |
7,408 |
2,434 |
131,792 |
135,069 |
| Post Graduate |
0 |
0 |
0 |
0 |
14 |
16 |
176 |
179 |
720 |
559 |
1,064 |
606 |
906 |
407 |
778 |
317 |
808 |
258 |
1,073 |
317 |
1,094 |
313 |
1,640 |
358 |
8,273 |
3,330 |
| Not Stated |
70,609 |
65,126 |
15,995 |
13,080 |
8,601 |
5,378 |
10,375 |
5,677 |
21,573 |
7,757 |
60,438 |
11,670 |
44,392 |
11,868 |
27,886 |
10,637 |
15,333 |
8,403 |
7,327 |
2,992 |
3,446 |
1,106 |
3,162 |
1,657 |
289,137 |
145,351 |
| Total |
132,048 |
126,370 |
111,070 |
105,774 |
194,036 |
116,373 |
366,319 |
192,369 |
385,821 |
199,299 |
369,503 |
173,770 |
287,999 |
141,712 |
226,504 |
107,520 |
152,471 |
72,944 |
95,470 |
46,998 |
53,700 |
30,751 |
49,028 |
43,549 |
2,423,969 |
1,357,429 |
Source: PACI
ANNEXED NOTE
1. Characteristics of data and definitions
The source of data used here is the Public Authority for Civil Information (PACI), an independant government body in charge of :
1- centralising all population and labour force data in order to manage a fully computerised population register
2- issuing mandatory civil identification cards to every resident of the country, regardless of age and nationality.
The other source of demographic and socioeconomic data on Kuwait is the Central Statistical Office (CSO), operating within the Planning Ministry. The CSO has conducted ten population and housing censuses since its inception in 1957.
(a) Kuwaiti: the Kuwaiti nationality rests upon a document of Kuwaiti nationality or a certificate proving Kuwaiti nationality issued by the Ministry of Interior of Kuwait.
(b) Non-Kuwaiti: his/ her nationality is determined by the name of the State which issued the passport. The foreign national also entered Kuwait legally and has a stamp of residence.
This category includes the Bidoon, a category of stateless persons living in the Emirate. Kuwait’s Bidoon population originates from three broad categories:
1) those whose ancestors failed to apply for nationality or lacked necessary documentation at the time of Kuwait’s independence in 1961;
2) those recruited to work in Kuwait’s army or police force during the 1960s who permanently settled in Kuwait, along with their families;
3) children of Kuwaiti mothers and stateless or foreign fathers (see Human Rights Watch. Prisoners of the Past. Kuwaiti Bidun and the Burden of Statelessness, June 2011, p. 3).
(The children of Kuwaiti mothers and non-Kuwaiti fathers (with specific nationality) inherit the father’s nationality. They are stateless if the father is stateless).
(c) NA/ Not stated: education level is unclear or not reported.
Classification used for education levels: ISCED.
2. Institution which provides data
The Public Authority for Civil Information (PACI)
3. Period of data coverage: December 2016
The database is updated twice a year and the website presents only the most recent data.
4. Data availability
Analytical tables and data crosstabulations are available for download in PDF, html, .png and Excel (.csv) formats.
Date of access: June 2017.
|
Kuwaitis |
|
10-14 |
15-19 |
20-24 |
25-29 |
30-34 |
35-39 |
40-44 |
45-49 |
50-54 |
55-59 |
60-64 |
>64 |
Total |
| Illiterate |
1 |
4 |
18 |
18 |
29 |
21 |
17 |
42 |
62 |
2,852 |
4,136 |
16,840 |
24,040 |
| Read &Write |
36 |
24 |
22 |
149 |
244 |
153 |
115 |
34 |
38 |
1,384 |
1,726 |
7,180 |
11,105 |
| Primary |
79,404 |
30,467 |
15,665 |
11,117 |
5,592 |
5,768 |
7,415 |
5,061 |
3,845 |
3,229 |
3,018 |
6,034 |
176,615 |
| Intermediate |
0 |
74,622 |
45,637 |
18,603 |
19,561 |
17,169 |
18,067 |
18,945 |
13,301 |
8,766 |
6,540 |
6,939 |
248,150 |
| Secondary |
0 |
15,422 |
53,741 |
35,648 |
24,662 |
20,094 |
13,134 |
11,621 |
10,412 |
6,025 |
3,651 |
3,132 |
197,542 |
| Diploma |
0 |
0 |
3,127 |
15,236 |
20,482 |
13,889 |
10,353 |
8,405 |
8,051 |
7,174 |
5,059 |
3,906 |
95,682 |
| University |
0 |
0 |
4,906 |
22,156 |
22,580 |
20,727 |
18,048 |
13,087 |
11,403 |
8,377 |
4,956 |
4,122 |
130,362 |
| Post Graduate |
0 |
0 |
1 |
102 |
389 |
475 |
406 |
488 |
476 |
800 |
849 |
1,149 |
5,135 |
| Not Stated |
70,012 |
11,331 |
5,002 |
5,035 |
4,134 |
3,784 |
4,743 |
4,933 |
5,235 |
1,360 |
877 |
1,975 |
118,421 |
| Total |
149,453 |
131,870 |
128,119 |
108,064 |
97,673 |
82,080 |
72,298 |
62,616 |
52,823 |
39,967 |
30,812 |
51,277 |
1,007,052 |
|
Non-Kuwaitis |
|
10-14 |
15-19 |
20-24 |
25-29 |
30-34 |
35-39 |
40-44 |
45-49 |
50-54 |
55-59 |
60-64 |
>64 |
Total |
| Illiterate |
352 |
309 |
3,513 |
10,793 |
12,861 |
12,209 |
12,887 |
15,378 |
14,823 |
10,197 |
6,014 |
8,485 |
107,821 |
| Read &Write |
6,578 |
9,815 |
67,245 |
206,698 |
204,820 |
172,277 |
128,335 |
91,654 |
50,817 |
26,072 |
11,550 |
7,462 |
983,323 |
| Primary |
36,312 |
20,006 |
22,818 |
19,103 |
18,798 |
18,935 |
16,682 |
14,694 |
12,230 |
8,816 |
4,976 |
3,852 |
197,222 |
| Intermediate |
0 |
32,964 |
56,579 |
134,668 |
135,165 |
112,729 |
86,048 |
62,827 |
34,107 |
19,051 |
8,657 |
5,118 |
687,913 |
| Secondary |
0 |
4,136 |
19,361 |
40,978 |
51,439 |
43,627 |
35,281 |
32,036 |
23,553 |
15,422 |
8,722 |
5,173 |
279,728 |
| Diploma |
0 |
0 |
1,793 |
7,937 |
10,864 |
9,339 |
8,244 |
7,353 |
5,577 |
3,739 |
2,662 |
1,797 |
59,305 |
| University |
0 |
0 |
1,975 |
19,177 |
27,414 |
22,558 |
17,512 |
13,269 |
12,394 |
9,655 |
6,825 |
5,720 |
136,499 |
| Post Graduate |
0 |
0 |
29 |
253 |
890 |
1,195 |
907 |
607 |
590 |
590 |
558 |
849 |
6,468 |
| Not Stated |
65,723 |
17,744 |
8,977 |
11,017 |
25,196 |
68,324 |
51,517 |
33,590 |
18,501 |
8,959 |
3,675 |
2,844 |
316,067 |
| Total |
108,965 |
84,974 |
182,290 |
450,624 |
487,447 |
461,193 |
357,413 |
271,408 |
172,592 |
102,501 |
53,639 |
41,300 |
2,774,346 |
|
Total population aged 10+ |
|
10-14 |
15-19 |
20-24 |
25-29 |
30-34 |
35-39 |
40-44 |
45-49 |
50-54 |
55-59 |
60-64 |
>64 |
Total |
| Illiterate |
353 |
313 |
3,531 |
10,811 |
12,890 |
12,230 |
12,904 |
15,420 |
14,885 |
13,049 |
10,150 |
25,325 |
131,861 |
| Read &Write |
6,614 |
9,839 |
67,267 |
206,847 |
205,064 |
172,430 |
128,450 |
91,688 |
50,855 |
27,456 |
13,276 |
14,642 |
994,428 |
| Primary |
115,716 |
50,473 |
38,483 |
30,220 |
24,390 |
24,703 |
24,097 |
19,755 |
16,075 |
12,045 |
7,994 |
9,886 |
373,837 |
| Intermediate |
0 |
107,586 |
102,216 |
153,271 |
154,726 |
129,898 |
104,115 |
81,772 |
47,408 |
27,817 |
15,197 |
12,057 |
936,063 |
| Secondary |
0 |
19,558 |
73,102 |
76,626 |
76,101 |
63,721 |
48,415 |
43,657 |
33,965 |
21,447 |
12,373 |
8,305 |
477,270 |
| Diploma |
0 |
0 |
4,920 |
23,173 |
31,346 |
23,228 |
18,597 |
15,758 |
13,628 |
10,913 |
7,721 |
5,703 |
154,987 |
| University |
0 |
0 |
6,881 |
41,333 |
49,994 |
43,285 |
35,560 |
26,356 |
23,797 |
18,032 |
11,781 |
9,842 |
266,861 |
| Post Graduate |
0 |
0 |
30 |
355 |
1,279 |
1,670 |
1,313 |
1,095 |
1,066 |
1,390 |
1,407 |
1,998 |
11,603 |
| Not Stated |
135,735 |
29,075 |
13,979 |
16,052 |
29,330 |
72,108 |
56,260 |
38,523 |
23,736 |
10,319 |
4,552 |
4,819 |
434,488 |
| Total |
258,418 |
216,844 |
310,409 |
558,688 |
585,120 |
543,273 |
429,711 |
334,024 |
225,415 |
142,468 |
84,451 |
92,577 |
3,781,398 |
Source: PACI
ANNEXED NOTE
1. Characteristics of data and definitions
The source of data used here is the Public Authority for Civil Information (PACI), an independant government body in charge of :
1- centralising all population and labour force data in order to manage a fully computerised population register
2- issuing mandatory civil identification cards to every resident of the country, regardless of age and nationality.
The other source of demographic and socioeconomic data on Kuwait is the Central Statistical Office (CSO), operating within the Planning Ministry. The CSO has conducted ten population and housing censuses since its inception in 1957.
(a) Kuwaiti: the Kuwaiti nationality rests upon a document of Kuwaiti nationality or a certificate proving Kuwaiti nationality issued by the Ministry of Interior of Kuwait.
(b) Non-Kuwaiti: his/ her nationality is determined by the name of the State which issued the passport. The foreign national also entered Kuwait legally and has a stamp of residence.
This category includes the Bidoon, a category of stateless persons living in the Emirate. Kuwait’s Bidoon population originates from three broad categories:
1) those whose ancestors failed to apply for nationality or lacked necessary documentation at the time of Kuwait’s independence in 1961;
2) those recruited to work in Kuwait’s army or police force during the 1960s who permanently settled in Kuwait, along with their families;
3) children of Kuwaiti mothers and stateless or foreign fathers (see Human Rights Watch. Prisoners of the Past. Kuwaiti Bidun and the Burden of Statelessness, June 2011, p. 3).
(The children of Kuwaiti mothers and non-Kuwaiti fathers (with specific nationality) inherit the father’s nationality. They are stateless if the father is stateless).
(c) NA/ Not stated: education level is unclear or not reported.
Classification used for education levels: ISCED.
2. Institution which provides data
The Public Authority for Civil Information (PACI)
3. Period of data coverage: December 2016
The database is updated twice a year and the website presents only the most recent data.
4. Data availability
Analytical tables and data crosstabulations are available for download in PDF, html, .png and Excel (.csv) formats.
Date of access: June 2017.
|
Qataris |
Non-Qataris |
Total |
|
Males |
Females |
Total |
Males |
Females |
Total |
Males |
Females |
Total |
| Illiterate |
785 |
2,831 |
3,616 |
26,395 |
4,055 |
30,450 |
27,180 |
6,886 |
34,066 |
| Read & Write |
4,537 |
5,530 |
10,067 |
204,228 |
33,885 |
238,113 |
208,765 |
39,415 |
248,180 |
| Primary |
7,072 |
6,568 |
13,640 |
370,766 |
57,824 |
428,590 |
377,838 |
64,392 |
442,230 |
| Preparatory |
16,572 |
17,361 |
33,933 |
533,614 |
60,381 |
593,995 |
550,186 |
77,742 |
627,928 |
| Secondary |
34,873 |
26,346 |
61,219 |
298,791 |
75,977 |
374,768 |
333,664 |
102,323 |
435,987 |
| Pre.U. Diploma |
3,139 |
3,966 |
7,105 |
84,720 |
20,121 |
104,841 |
87,859 |
24,087 |
111,946 |
| University and above |
28,046 |
36,660 |
64,706 |
234,738 |
107,614 |
342,352 |
262,784 |
144,274 |
407,058 |
| Total |
95,024 |
99,262 |
194,286 |
1,753,252 |
359,857 |
2,113,109 |
1,848,276 |
459,119 |
2,307,395 |
Source: Annual Bulletin of Labor Force Sample survey 2016
ANNEXED NOTE
1. Technical Notes and Definitions
The data is taken from 2016 Labour Force Survey (yearly synthesis)
Sampling frame of LFS 2016: Population Census 2010.
Sample size: 60,016 persons, in 9,199 households: 1- Qatari households; 2- Non-Qatari regular (non-collective) households;
Data Collection: The sample was divided into equal parts to collect data monthly. Each month 1/3 of the quarterly data were collected during the first two weeks of the month.
Reference period for the labour force data: the week prior to data collection day.
Population of reference: all Qatari and non-Qatari households present in Qatar on the night of survey, living in normal and collective households.
The collective households are a group of persons not related to each other and sharing living conditions in a residential unit, I.e. labour camps, students living boarding schools, nurses in hospitals… etc. The survey covered the small collective households (includes less than 7 persons) and large collective households (includes 7 persons or more).
The survey did not cover short periods accommodation, i.e. hotels.
2. Institution which provides data
Ministry of Development Planning and Statistics
(http://www.mdps.gov.qa/en/pages/default.aspx)
3. Data availability
Available at (PDF format):
http://www.mdps.gov.qa/en/statistics/Statistical%20Releases/Social/LaborForce/2016/Labour_force_2016_AE.pdf
The Statistics Authority conducted the first labour Force Sample Survey in 2001. Starting from 2006, the execution of these surveys came to be on annual basis. Quarterly publications of Labour Force Surveys’ data are also available since 2012.
2016′ and earlier Labour Force Surveys can be downloaded from MDPS’s website, in PDF and Excel format:
http://www.mdps.gov.qa/en/statistics1/pages/topicslisting.aspx?parent=Social&child=LaborForce
See also Qatar Information Exchange for earlier Labour Force Surveys. QIX has also an interactive data base compiling data on the labour force taken from available surveys:
http://www.qix.gov.qa/portal/page/portal/qix/subject_area/Statistics?subject_area=183
Last date of access: October 2017.
|
Kuwaitis |
Non-Kuwaitis |
Total |
|
males |
females |
Total |
males |
females |
Total |
males |
females |
Total |
| Illiterate |
2,267 |
21,773 |
24,040 |
68,536 |
39,285 |
107,821 |
70,803 |
61,058 |
131,861 |
| Reads and writes |
4,099 |
7,006 |
11,105 |
696,514 |
286,809 |
983,323 |
700,613 |
293,815 |
994,428 |
| Elementary |
97,375 |
79,240 |
176,615 |
125,193 |
72,029 |
197,222 |
222,568 |
151,269 |
373,837 |
| Intermediate |
136,435 |
111,715 |
248,150 |
501,764 |
186,149 |
687,913 |
638,199 |
297,864 |
936,063 |
| Secondary |
97,141 |
100,401 |
197,542 |
183,033 |
96,695 |
279,728 |
280,174 |
197,096 |
477,270 |
| Diploma |
41,834 |
53,848 |
95,682 |
40,576 |
18,729 |
59,305 |
82,410 |
72,577 |
154,987 |
| University degree |
46,719 |
83,643 |
130,362 |
85,073 |
51,426 |
136,499 |
131,792 |
135,069 |
266,861 |
| Postgraduate |
3,552 |
1,583 |
5,135 |
4,721 |
1,747 |
6,468 |
8,273 |
3,330 |
11,603 |
| NA |
58,387 |
60,034 |
118,421 |
230,750 |
85,317 |
316,067 |
289,137 |
145,351 |
434,488 |
| Total |
487,809 |
519,243 |
1,007,052 |
1,936,160 |
838,186 |
2,774,346 |
2,423,969 |
1,357,429 |
3,781,398 |
Source: PACI
ANNEXED NOTE
1. Characteristics of data and definitions
The source of data used here is the Public Authority for Civil Information (PACI), an independant government body in charge of :
1- centralising all population and labour force data in order to manage a fully computerised population register
2- issuing mandatory civil identification cards to every resident of the country, regardless of age and nationality.
The other source of demographic and socioeconomic data on Kuwait is the Central Statistical Office (CSO), operating within the Planning Ministry. The CSO has conducted ten population and housing censuses since its inception in 1957.
(a) Kuwaiti: the Kuwaiti nationality rests upon a document of Kuwaiti nationality or a certificate proving Kuwaiti nationality issued by the Ministry of Interior of Kuwait.
(b) Non-Kuwaiti: his/ her nationality is determined by the name of the State which issued the passport. The foreign national also entered Kuwait legally and has a stamp of residence.
This category includes the Bidoon, a category of stateless persons living in the Emirate. Kuwait’s Bidoon population originates from three broad categories:
1) those whose ancestors failed to apply for nationality or lacked necessary documentation at the time of Kuwait’s independence in 1961;
2) those recruited to work in Kuwait’s army or police force during the 1960s who permanently settled in Kuwait, along with their families;
3) children of Kuwaiti mothers and stateless or foreign fathers (see Human Rights Watch. Prisoners of the Past. Kuwaiti Bidun and the Burden of Statelessness, June 2011, p. 3).
(The children of Kuwaiti mothers and non-Kuwaiti fathers (with specific nationality) inherit the father’s nationality. They are stateless if the father is stateless).
(c) NA: education level is unclear or not reported.
Classification used for education levels: ISCED.
2. Institution which provides data
The Public Authority for Civil Information (PACI)
3. Period of data coverage: December 2016
The database is updated twice a year and the website presents only the most recent data.
4. Data availability
Analytical tables and data crosstabulations are available for download in PDF, html, .png and Excel (.csv) formats.
Date of access: June 2017.
|
|
2011 |
|
|
Male |
Female |
Total |
| Riyadh |
1,405,488 |
297,484 |
1,702,972 |
| Makkah |
132,162 |
74,635 |
206,797 |
| Madinah |
31,202 |
13,889 |
45,091 |
| Al-Qasseem |
33,751 |
9,754 |
43,505 |
| Eastern |
113,026 |
45,047 |
158,073 |
| Assir |
28,817 |
10,483 |
39,300 |
| Tabouk |
10,931 |
5,507 |
16,438 |
| Hail |
13,680 |
4,867 |
18,547 |
| Northern Border |
8,435 |
3,432 |
11,867 |
| Jazan |
9,015 |
3,622 |
12,637 |
| Najran |
22,613 |
3,337 |
25,950 |
| Al-Baha |
6,207 |
2,154 |
8,361 |
| Al-Jouf |
8,005 |
4,182 |
12,187 |
| Total |
1,823,332 |
478,393 |
2,301,725 |
Source: General Directorate of Passports, Ministry of Interior
1. Institution which provides data
General Authority for Statistics (GaStat)
2. Data availability
Published in GaStat Statistical Yearbooks, in Chapter “Social services”
Most recent and past Statistical Yearbooks are available online at: https://www.stats.gov.sa/en/169
Date of access: September 2017.
| |
|
Saudis |
|
|
Non-Saudis |
|
|
Total |
|
| year |
males |
females |
total |
males |
females |
total |
males |
females |
total |
| 1974 |
3,166,013 |
2,997,792 |
6,163,805 |
517,178 |
257,219 |
774,397 |
3,683,191 |
3,255,011 |
6,938,202 |
| 1975 |
3,299,247 |
3,129,932 |
6,429,179 |
574,639 |
283,192 |
857,831 |
3,873,886 |
3,413,124 |
7,287,010 |
| 1976 |
3,436,784 |
3,266,657 |
6,703,441 |
638,241 |
311,670 |
949,911 |
4,075,025 |
3,578,327 |
7,653,352 |
| 1977 |
3,578,634 |
3,408,002 |
6,986,636 |
708,602 |
342,876 |
1,051,478 |
4,287,236 |
3,750,878 |
8,038,114 |
| 1978 |
3,724,791 |
3,553,986 |
7,278,777 |
786,393 |
377,049 |
1,163,442 |
4,511,184 |
3,931,035 |
8,442,219 |
| 1979 |
3,875,233 |
3,704,613 |
7,579,846 |
872,345 |
414,448 |
1,286,793 |
4,747,578 |
4,119,061 |
8,866,639 |
| 1980 |
4,029,922 |
3,859,872 |
7,889,794 |
967,252 |
455,350 |
1,422,602 |
4,997,174 |
4,315,222 |
9,312,396 |
| 1981 |
4,188,801 |
4,019,733 |
8,208,534 |
1,071,977 |
500,051 |
1,572,028 |
5,260,778 |
4,519,784 |
9,780,562 |
| 1982 |
4,351,793 |
4,184,148 |
8,535,941 |
1,187,454 |
548,870 |
1,736,324 |
5,539,247 |
4,733,018 |
10,272,265 |
| 1983 |
4,518,803 |
4,353,048 |
8,871,851 |
1,314,694 |
602,145 |
1,916,839 |
5,833,497 |
4,955,193 |
10,788,690 |
| 1984 |
4,689,709 |
4,526,340 |
9,216,049 |
1,454,788 |
660,237 |
2,115,025 |
6,144,497 |
5,186,577 |
11,331,074 |
| 1985 |
4,864,370 |
4,703,911 |
9,568,281 |
1,608,915 |
723,531 |
2,332,446 |
6,473,285 |
5,427,442 |
11,900,727 |
| 1986 |
5,042,619 |
4,885,623 |
9,928,242 |
1,778,342 |
792,434 |
2,570,776 |
6,820,961 |
5,678,057 |
12,499,018 |
| 1987 |
5,224,266 |
5,071,312 |
10,295,578 |
1,964,432 |
867,378 |
2,831,810 |
7,188,698 |
5,938,690 |
13,127,388 |
| 1988 |
5,409,093 |
5,260,787 |
10,669,880 |
2,168,647 |
948,820 |
3,117,467 |
7,577,740 |
6,209,607 |
13,787,347 |
| 1989 |
5,596,859 |
5,453,833 |
11,050,692 |
2,392,552 |
1,037,242 |
3,429,794 |
7,989,411 |
6,491,075 |
14,480,486 |
| 1990 |
5,787,294 |
5,650,206 |
11,437,500 |
2,637,820 |
1,133,151 |
3,770,971 |
8,425,114 |
6,783,357 |
15,208,471 |
| 1991 |
5,980,104 |
5,849,635 |
11,829,739 |
2,906,237 |
1,237,079 |
4,143,316 |
8,886,341 |
7,086,714 |
15,973,055 |
| 1992 |
6,170,757 |
6,047,443 |
12,218,200 |
3,193,111 |
1,347,068 |
4,540,179 |
9,363,868 |
7,394,511 |
16,758,379 |
| 1993 |
6,334,907 |
6,216,789 |
12,551,696 |
3,322,551 |
1,402,925 |
4,725,476 |
9,657,458 |
7,619,714 |
17,277,172 |
| 1994 |
6,488,628 |
6,375,082 |
12,863,710 |
3,397,772 |
1,440,127 |
4,837,899 |
9,886,400 |
7,815,209 |
17,701,609 |
| 1995 |
6,646,071 |
6,537,398 |
13,183,469 |
3,474,692 |
1,478,314 |
4,953,006 |
10,120,763 |
8,015,712 |
18,136,475 |
| 1996 |
6,807,325 |
6,703,837 |
13,511,162 |
3,553,349 |
1,517,511 |
5,070,860 |
10,360,674 |
8,221,348 |
18,582,022 |
| 1997 |
6,972,483 |
6,874,505 |
13,846,988 |
3,633,782 |
1,557,746 |
5,191,528 |
10,606,265 |
8,432,251 |
19,038,516 |
| 1998 |
7,141,639 |
7,049,510 |
14,191,149 |
3,716,031 |
1,599,045 |
5,315,076 |
10,857,670 |
8,648,555 |
19,506,225 |
| 1999 |
7,314,889 |
7,228,960 |
14,543,849 |
3,800,137 |
1,641,438 |
5,441,575 |
11,115,026 |
8,870,398 |
19,985,424 |
| 2000 |
7,492,332 |
7,412,968 |
14,905,300 |
3,886,141 |
1,684,952 |
5,571,093 |
11,378,473 |
9,097,920 |
20,476,393 |
| 2001 |
7,674,070 |
7,601,651 |
15,275,721 |
3,974,087 |
1,729,617 |
5,703,704 |
11,648,157 |
9,331,268 |
20,979,425 |
| 2002 |
7,860,206 |
7,795,126 |
15,655,332 |
4,064,017 |
1,775,464 |
5,839,481 |
11,924,223 |
9,570,590 |
21,494,813 |
| 2003 |
8,050,847 |
7,993,515 |
16,044,362 |
4,155,978 |
1,822,524 |
5,978,502 |
12,206,825 |
9,816,039 |
22,022,864 |
| 2004 |
8,245,575 |
8,198,412 |
16,443,987 |
4,248,335 |
1,871,564 |
6,119,899 |
12,493,910 |
10,069,976 |
22,563,886 |
| 2005 |
8,453,097 |
8,401,060 |
16,854,157 |
4,506,528 |
1,968,899 |
6,475,427 |
12,959,625 |
10,369,959 |
23,329,584 |
| 2006 |
8,663,597 |
8,606,584 |
17,270,181 |
4,780,413 |
2,071,296 |
6,851,709 |
13,444,010 |
10,677,880 |
24,121,890 |
| 2007 |
8,876,666 |
8,814,670 |
17,691,336 |
5,070,944 |
2,179,018 |
7,249,962 |
13,947,610 |
10,993,688 |
24,941,298 |
| 2008 |
9,091,249 |
9,024,301 |
18,115,550 |
5,379,132 |
2,292,343 |
7,671,475 |
14,470,381 |
11,316,644 |
25,787,025 |
| 2009 |
9,307,550 |
9,235,696 |
18,543,246 |
5,706,050 |
2,411,561 |
8,117,611 |
15,013,600 |
11,647,257 |
26,660,857 |
| 2010 |
9,575,257 |
9,201,253 |
18,776,510 |
5,956,214 |
2,503,432 |
8,459,646 |
15,531,471 |
11,704,685 |
27,236,156 |
| 2011* |
9,743,626 |
9,662,059 |
19,405,685 |
6,297,735 |
2,672,935 |
8,970,670 |
16,041,361 |
12,334,994 |
28,376,355 |
| 2012* |
9,962,431 |
9,876,017 |
19,838,448 |
6,591,296 |
2,766,151 |
9,357,447 |
16,553,727 |
12,642,168 |
29,195,895 |
| 2013** |
9,800,955 |
9,408,798 |
19,209,753 |
7,054,434 |
3,115,943 |
10,170,377 |
16,855,389 |
12,524,741 |
29,380,130 |
| 2014** |
9,844,758 |
9,467,938 |
19,312,696 |
7,373,986 |
3,310,419 |
10,684,405 |
17,218,744 |
12,778,357 |
29,997,101 |
| 2015** |
10,034,561 |
9,658,078 |
19,692,639 |
7,696,791 |
3,501,306 |
11,198,097 |
17,731,352 |
13,159,384 |
30,890,736 |
| 2016 |
10,231,364 |
9,850,218 |
20,081,582 |
8,028,355 |
3,677,643 |
11,705,998 |
18,259,719 |
13,527,861 |
31,787,580 |
| 2017** |
10,404,282 |
10,023,075 |
20,427,357 |
8,341,564 |
3,843,720 |
12,185,284 |
18,745,846 |
13,866,795 |
32,612,641 |
Source: Population estimates based on the results of population censuses 1974; 1992; 2004 and 2010 and Demographic Survey 2016.
Central Department for Statistics and Information (CDSI)/ General Authority for Statistics (GaStat)
* mid-year estimates based on figures from census 2010
** mid-year estimates based on figures from Demographic Research Bulletin 2016
ANNEXED NOTE
1. Technical Notes and Definitions
Reference periods: middle of given years
2. Institution which provides data
Central Department of Statistics and Information (CDSI), Ministry and Economy and Planning/ General Authority for Statistics (GaStat)
http://www.stats.gov.sa/en
https://www.stats.gov.sa/ar/node
3. Data availability
Results of censuses conducted in 1992, 2004 and 2010 and Demographic Survey 2016 are available on the website of the General Authority for Statistics
previously CDSI, in downloadable Excel and PDF formats.
https://www.stats.gov.sa/en/13
https://www.stats.gov.sa/en/4522
Mid-year estimates of population in Saudi Arabia since 1974 (time series) are available in Saudi Arabia Monetary Agency (SAMA) Yearly Statistics:
http://www.sama.gov.sa/en-US/EconomicReports/Pages/YearlyStatistics.aspx
GaStat Statistical Yearbooks and yearly estimates do not offer time series
https://www.stats.gov.sa/en/46
https://www.stats.gov.sa/en/43
Last date of access: September 2017.
| year |
Saudis |
Non-Saudis |
Total |
| 1974 |
6,163,805 |
774,397 |
6,938,202 |
| 1975 |
6,429,179 |
857,831 |
7,287,010 |
| 1976 |
6,703,441 |
949,911 |
7,653,352 |
| 1977 |
6,986,636 |
1,051,478 |
8,038,114 |
| 1978 |
7,278,777 |
1,163,442 |
8,442,219 |
| 1979 |
7,579,846 |
1,286,793 |
8,866,639 |
| 1980 |
7,889,794 |
1,422,602 |
9,312,396 |
| 1981 |
8,208,534 |
1,572,028 |
9,780,562 |
| 1982 |
8,535,941 |
1,736,324 |
10,272,265 |
| 1983 |
8,871,851 |
1,916,839 |
10,788,690 |
| 1984 |
9,216,049 |
2,115,025 |
11,331,074 |
| 1985 |
9,568,281 |
2,332,446 |
11,900,727 |
| 1986 |
9,928,242 |
2,570,776 |
12,499,018 |
| 1987 |
10,295,578 |
2,831,810 |
13,127,388 |
| 1988 |
10,669,880 |
3,117,467 |
13,787,347 |
| 1989 |
11,050,692 |
3,429,794 |
14,480,486 |
| 1990 |
11,437,500 |
3,770,971 |
15,208,471 |
| 1991 |
11,829,739 |
4,143,316 |
15,973,055 |
| 1992 |
12,218,200 |
4,540,179 |
16,758,379 |
| 1993 |
12,551,696 |
4,725,476 |
17,277,172 |
| 1994 |
12,863,710 |
4,837,899 |
17,701,609 |
| 1995 |
13,183,469 |
4,953,006 |
18,136,475 |
| 1996 |
13,511,162 |
5,070,860 |
18,582,022 |
| 1997 |
13,846,988 |
5,191,528 |
19,038,516 |
| 1998 |
14,191,149 |
5,315,076 |
19,506,225 |
| 1999 |
14,543,849 |
5,441,575 |
19,985,424 |
| 2000 |
14,905,300 |
5,571,093 |
20,476,393 |
| 2001 |
15,275,721 |
5,703,704 |
20,979,425 |
| 2002 |
15,655,332 |
5,839,481 |
21,494,813 |
| 2003 |
16,044,362 |
5,978,502 |
22,022,864 |
| 2004 |
16,443,987 |
6,119,899 |
22,563,886 |
| 2005 |
16,854,157 |
6,475,427 |
23,329,584 |
| 2006 |
17,270,181 |
6,851,709 |
24,121,890 |
| 2007 |
17,691,336 |
7,249,962 |
24,941,298 |
| 2008 |
18,115,550 |
7,671,475 |
25,787,025 |
| 2009 |
18,543,246 |
8,117,611 |
26,660,857 |
| 2010 |
18,776,510 |
8,459,646 |
27,236,156 |
| 2011* |
19,405,685 |
8,970,670 |
28,376,355 |
| 2012* |
19,838,448 |
9,357,447 |
29,195,895 |
| 2013** |
19,209,753 |
10,170,377 |
29,380,130 |
| 2014** |
19,312,696 |
10,684,405 |
29,997,101 |
| 2015** |
19,692,639 |
11,198,097 |
30,890,736 |
| 2016 |
20,081,582 |
11,705,998 |
31,787,580 |
| 2017** |
20,427,357 |
12,185,284 |
32,612,641 |
Source: Population estimates based on the results of population censuses 1974; 1992; 2004 and 2010 and Demographic Survey 2016.
Central Department for Statistics and Information (CDSI)/ General Authority for Statistics (GaStat)
* mid-year estimates based on figures from census 2010
** mid-year estimates based on figures from Demographic Research Bulletin 2016
ANNEXED NOTE
1. Technical Notes and Definitions
Reference periods: middle of given years
2. Institution which provides data
Central Department of Statistics and Information (CDSI), Ministry and Economy and Planning/ General Authority for Statistics (GaStat)
http://www.stats.gov.sa/en
https://www.stats.gov.sa/ar/node
3. Data availability
Results of censuses conducted in 1992, 2004 and 2010 and Demographic Survey 2016 are available on the website of the General Authority for Statistics
previously CDSI, in downloadable Excel and PDF formats.
https://www.stats.gov.sa/en/13
https://www.stats.gov.sa/en/4522
Mid-year estimates of population in Saudi Arabia since 1974 (time series) are available in Saudi Arabia Monetary Agency (SAMA) Yearly Statistics:
http://www.sama.gov.sa/en-US/EconomicReports/Pages/YearlyStatistics.aspx
GaStat Statistical Yearbooks (https://www.stats.gov.sa/en/46) and yearly estimates (https://www.stats.gov.sa/en/43) do not offer time series
Last date of access: September 2017.
| |
|
In the labour force |
Out of the labour force |
Total |
| |
|
Employed |
Unemployed |
Total |
In school or training |
Housekeeping |
Retired or Over age |
Disability or handicap or health reasons |
Unwillingness to work |
Others |
Total |
| |
Male |
4,185,853 |
254,108 |
4,439,961 |
1,609,037 |
0 |
607,064 |
103,686 |
28,287 |
88,925 |
2,436,999 |
6,876,960 |
| Saudis |
Female |
835,726 |
439,676 |
1,275,402 |
1,581,326 |
3,565,931 |
97,580 |
76,273 |
26,523 |
106,000 |
5,453,633 |
6,729,035 |
| |
Total |
5,021,579 |
693,784 |
5,715,363 |
3,190,363 |
3,565,931 |
704,644 |
179,959 |
54,810 |
194,925 |
7,890,632 |
13,605,995 |
| |
Male |
6,708,562 |
38,858 |
6,747,420 |
369,575 |
0 |
34,574 |
31,688 |
3,346 |
44,055 |
483,238 |
7,230,658 |
| Non-Saudis |
Female |
646,558 |
19,169 |
665,727 |
240,991 |
1,923,158 |
16,125 |
15,331 |
26,816 |
27,314 |
2,249,735 |
2,915,462 |
| |
Total |
7,355,120 |
58,027 |
7,413,147 |
610,566 |
1,923,158 |
50,699 |
47,019 |
30,162 |
71,369 |
2,732,973 |
10,146,120 |
| |
Male |
10,894,415 |
292,966 |
11,187,381 |
1,978,612 |
0 |
641,638 |
135,374 |
31,633 |
132,980 |
2,920,237 |
14,107,618 |
| Total |
Female |
1,482,284 |
458,845 |
1,941,129 |
1,822,317 |
5,489,089 |
113,705 |
91,604 |
53,339 |
133,314 |
7,703,368 |
9,644,497 |
| |
Total |
12,376,699 |
751,811 |
13,128,510 |
3,800,929 |
5,489,089 |
755,343 |
226,978 |
84,972 |
266,294 |
10,623,605 |
23,752,115 |
source: GLMM calculations, based on the published results of Labour Force Survey 2016 (Q3).
ANNEXED NOTE
1. Technical Notes and Definitions
Sampling frame of LFS 2016 Q3: Population Census 2010.
Sample size: 33,325 households
Reference period: August 2016
Population of reference: All the members of the households selected in the sample, including domestic helpers and the like who
live in one house; Saudi and non-Saudi population,
living in the Kingdom at the time of the survey.
Employed population: People (15+ years old) who did one of the following jobs during the reference period:
1. People who have been working for at least one hour for a salary or a wage (in cash or in kind)
2. People who provided unpaid assistance for others for at least one hour in any type of business or farm owned by one member of the household;
3. People who have been working for at least one hour for others without a wage or a profit (in cash or in kind) as volunteers;
4. People who were temporarily absent from work throughout the week on leave for illness or for any other reason but they were scheduled to resume work.
Workers include the students, job seekers, retirees, housewives, etc., who worked during the week preceding the visit for at least one hour, provided that this does not include household work.
Reference period for employment: The seven days preceding the interview date.
Unemployed population:
They are the individuals (15 years and over) who, during the reference period:
1. Were workless during the week preceding the household visit;
2. Were seriously looking for work during the four weeks preceding the household visit (followed at least one method to find a job).
Included under this category are those who did not search for work during the four weeks preceding the household visit because of waiting to get work
or set up their own business during the coming period, given that they already have searched for work before the fixed time.
3. People who were able to work and ready to join it when available (i.e., available for work) during the week preceding the household visit.
Economically inactive Population (Outside Labor Force):
People (15+ years old) who are not classified under the labor force (unemployed) because they do not work, do not seek a job, unable to work, or are not ready to work during the survey reference period.
For example: Students, housewives, pensioners who do not work, individuals who are unable to work, individuals who do not want to work and those who do not seek any job for other reasons.
2. Institution which provides data
General Authority for Statistics (GAStat)
3. Data availability
Labour Force Surveys conducted since 1999 are available on the website of GAStat, in Excel and PDF formats.
https://www.stats.gov.sa/en/814
Last date of access: July 2017.
|
Saudis |
Non-Saudis |
Total |
|
Male |
Female |
Total |
Male |
Female |
Total |
Male |
Female |
Total |
| Illiterate |
98,846 |
352,870 |
451,716 |
85,087 |
48,138 |
133,225 |
183,933 |
401,008 |
584,941 |
| Read & Write |
233,657 |
637,215 |
870,872 |
745,172 |
369,270 |
1,114,442 |
978,829 |
1,006,485 |
1,985,314 |
| Primary |
582,248 |
687,350 |
1,269,598 |
1,238,525 |
405,801 |
1,644,326 |
1,820,773 |
1,093,151 |
2,913,924 |
| Intermediate |
1,302,119 |
1,258,266 |
2,560,385 |
2,064,411 |
722,718 |
2,787,129 |
3,366,530 |
1,980,984 |
5,347,514 |
| Secondary or Equivalent |
2,982,586 |
2,321,605 |
5,304,191 |
1,574,424 |
778,323 |
2,352,747 |
4,557,010 |
3,099,928 |
7,656,938 |
| Diploma |
434,094 |
195,699 |
629,793 |
387,645 |
101,544 |
489,189 |
821,739 |
297,243 |
1,118,982 |
| Bachelor Degree |
1,157,165 |
1,247,805 |
2,404,970 |
1,025,418 |
447,624 |
1,473,042 |
2,182,583 |
1,695,429 |
3,878,012 |
| Higher Diploma / Master Degree |
67,079 |
24,128 |
91,207 |
71,693 |
25,948 |
97,641 |
138,772 |
50,076 |
188,848 |
| Doctorate |
19,166 |
4,097 |
23,263 |
38,283 |
16,096 |
54,379 |
57,449 |
20,193 |
77,642 |
| Total |
6,876,960 |
6,729,035 |
13,605,995 |
7,230,658 |
2,915,462 |
10,146,120 |
14,107,618 |
9,644,497 |
23,752,115 |
source: GLMM calculations, based on the published results of Labour Force Survey 2016 (Q3).
ANNEXED NOTE
1. Technical Notes and Definitions
Sampling frame of LFS 2016 Q3: Population Census 2010.
Sample size: 33,325 households
Reference period: August 2016
Population of reference: All the members of the households selected in the sample, including domestic helpers and the like who
live in one house; Saudi and non-Saudi population,
living in the Kingdom at the time of the survey.
Classification used for education level: ISCED.
2. Institution which provides data
General Authority for Statistics (GAStat)
3. Data availability
Labour Force Surveys conducted since 1999 are available on the website of GAStat, in Excel and PDF formats.
https://www.stats.gov.sa/en/814
Last date of access: July 2017.
| Nationality |
|
Saudis |
|
|
Non-Saudis |
|
|
TOTAL |
|
| Age Groups |
Males |
Females |
Total |
Males |
Females |
Total |
Males |
Females |
Total |
| 0 – 4 |
1,087,700 |
1,047,717 |
2,135,417 |
275,537 |
260,907 |
536,444 |
1,363,237 |
1,308,624 |
2,671,861 |
| 5 – 9 |
1,062,579 |
1,024,611 |
2,087,190 |
348,565 |
331,896 |
680,461 |
1,411,144 |
1,356,507 |
2,767,651 |
| 10 – 14 |
947,747 |
920,029 |
1,867,776 |
287,019 |
270,621 |
557,640 |
1,234,766 |
1,190,650 |
2,425,416 |
| 15 – 19 |
895,657 |
863,913 |
1,759,570 |
235,263 |
218,657 |
453,920 |
1,130,920 |
1,082,570 |
2,213,490 |
| 20 – 24 |
1,036,753 |
948,271 |
1,985,024 |
277,808 |
206,117 |
483,925 |
1,314,561 |
1,154,388 |
2,468,949 |
| 25 – 29 |
962,751 |
940,652 |
1,903,403 |
707,007 |
417,668 |
1,124,675 |
1,669,758 |
1,358,320 |
3,028,078 |
| 30 – 34 |
867,032 |
850,881 |
1,717,913 |
925,345 |
415,258 |
1,340,603 |
1,792,377 |
1,266,139 |
3,058,516 |
| 35 – 39 |
760,228 |
740,957 |
1,501,185 |
1,359,107 |
533,795 |
1,892,902 |
2,119,335 |
1,274,752 |
3,394,087 |
| 40 – 44 |
643,599 |
618,942 |
1,262,541 |
1,283,436 |
486,805 |
1,770,241 |
1,927,035 |
1,105,747 |
3,032,782 |
| 45 – 49 |
540,812 |
511,130 |
1,051,942 |
943,970 |
261,363 |
1,205,333 |
1,484,782 |
772,493 |
2,257,275 |
| 50 – 54 |
431,338 |
407,257 |
838,595 |
642,788 |
98,260 |
741,048 |
1,074,126 |
505,517 |
1,579,643 |
| 55 – 59 |
336,138 |
308,563 |
644,701 |
384,860 |
64,229 |
449,089 |
720,998 |
372,792 |
1,093,790 |
| 60 – 64 |
243,560 |
227,708 |
471,268 |
206,025 |
45,951 |
251,976 |
449,585 |
273,659 |
723,244 |
| 65 – 69 |
148,229 |
167,622 |
315,851 |
71,490 |
28,343 |
99,833 |
219,719 |
195,965 |
415,684 |
| 70 – 74 |
108,150 |
103,747 |
211,897 |
32,720 |
18,304 |
51,024 |
140,870 |
122,051 |
262,921 |
| 75 – 79 |
69,555 |
67,500 |
137,055 |
15,282 |
4,504 |
19,786 |
84,837 |
72,004 |
156,841 |
| 80+ |
83,822 |
89,820 |
173,642 |
12,092 |
6,346 |
18,438 |
95,914 |
96,166 |
192,080 |
| Total |
10,225,650 |
9,839,320 |
20,064,970 |
8,008,314 |
3,669,024 |
11,677,338 |
18,233,964 |
13,508,344 |
31,742,308 |
Source: GaStat, Demographic Survey 2016
ANNEXED NOTE
1. Technical Notes and Definitions
Demographic survey 2016 is the fourth demographic survey conducted in Saudi Arabia since 1998.
Dates of survey: April 29, 2016 to June 7, 2016
Sampling framework: census 2010
Size of the sample: 33,350 households nationwide.
Population of reference: The demographic household sample includes the Saudi and non-Saudis households living in the kingdom.
It also covers individuals who takes the lodging houses as their residences and the Saudis who are temporarily living abroad
for medication, study, tourism, etc who are counted as members of the included households as long as they were picked up in the sample.
2. Institution which provides data
General Authority for Statistics (GAStat)
3. Data availability
The results of the Demographic Survey 2016 are available on GaStat website, in English and Arabic, in PDF and Excel formats
https://www.stats.gov.sa/en/4522
Last date of access: July 2017.
|
|
Saudis |
|
|
Non-Saudis |
|
|
Total |
|
|
Males |
Females |
Total |
Males |
Females |
Total |
Males |
Females |
Total |
| Agriculture, forestry and fishing |
251,145 |
3,050 |
254,195 |
305,440 |
384 |
305,824 |
556,585 |
3,434 |
560,019 |
| Mining and quarrying |
132,896 |
2,242 |
135,138 |
36,341 |
0 |
36,341 |
169,237 |
2,242 |
171,479 |
| Manufacturing |
175,299 |
16,804 |
192,103 |
859,285 |
10,338 |
869,623 |
1,034,584 |
27,142 |
1,061,726 |
| Electricity, gas, steam and air conditioning supply |
54,538 |
401 |
54,939 |
27,026 |
273 |
27,299 |
81,564 |
674 |
82,238 |
| Water supply; sewerage, waste management and remediation activities |
25,554 |
475 |
26,029 |
23,232 |
0 |
23,232 |
48,786 |
475 |
49,261 |
| Construction |
123,247 |
6,212 |
129,459 |
1,881,745 |
841 |
1,882,586 |
2,004,992 |
7,053 |
2,012,045 |
| Wholesale and retail trade; repair of motor vehicles and motorcycles |
235,581 |
31,290 |
266,871 |
1,506,501 |
7,168 |
1,513,669 |
1,742,082 |
38,458 |
1,780,540 |
| Transportation and storage |
158,548 |
2,605 |
161,153 |
273,454 |
740 |
274,194 |
432,002 |
3,345 |
435,347 |
| Accommodation and food service activities |
31,612 |
3,340 |
34,952 |
345,977 |
1,416 |
347,393 |
377,589 |
4,756 |
382,345 |
| Information and communication |
49,233 |
1,266 |
50,499 |
83,102 |
1,392 |
84,494 |
132,335 |
2,658 |
134,993 |
| Financial and insurance activities |
81,536 |
7,228 |
88,764 |
54,141 |
369 |
54,510 |
135,677 |
7,597 |
143,274 |
| Real estate activities |
67,085 |
2,018 |
69,103 |
38,548 |
0 |
38,548 |
105,633 |
2,018 |
107,651 |
| Professional, scientific and technical activities |
34,089 |
4,762 |
38,851 |
159,377 |
886 |
160,263 |
193,466 |
5,648 |
199,114 |
| Administrative and support service activities |
100,104 |
6,958 |
107,062 |
216,983 |
1,153 |
218,136 |
317,087 |
8,111 |
325,198 |
| Public administration and defence; compulsory social security |
1,776,133 |
41,924 |
1,818,057 |
55,424 |
308 |
55,732 |
1,831,557 |
42,232 |
1,873,789 |
| Education |
595,908 |
583,952 |
1,179,860 |
70,935 |
21,453 |
92,388 |
666,843 |
605,405 |
1,272,248 |
| Human health and social work activities |
234,661 |
111,554 |
346,215 |
128,699 |
77,889 |
206,588 |
363,360 |
189,443 |
552,803 |
| Arts, entertainment and recreation |
3,558 |
1,159 |
4,717 |
21,367 |
453 |
21,820 |
24,925 |
1,612 |
26,537 |
| Other service activities |
52,369 |
5,104 |
57,473 |
152,200 |
13,427 |
165,627 |
204,569 |
18,531 |
223,100 |
| Activities of households as employers; undifferentiated goods- and services-producing activities of households for own use |
1,443 |
2,971 |
4,414 |
462,112 |
507,747 |
969,859 |
463,555 |
510,718 |
974,273 |
| Activities of extraterritorial organizations and bodies |
1,314 |
411 |
1,725 |
6,673 |
321 |
6,994 |
7,987 |
732 |
8,719 |
| Total |
4,185,853 |
835,726 |
5,021,579 |
6,708,562 |
646,558 |
7,355,120 |
10,894,415 |
1,482,284 |
12,376,699 |
source: GLMM calculations, based on the published results of Labour Force Survey 2016 (Q3).
ANNEXED NOTE
1. Technical Notes and Definitions
Sampling frame of LFS 2016 Q3: Population Census 2010.
Sample size: 33,325 households
Reference period: August 2016
Population of reference: All the members of the households selected in the sample, including domestic helpers and the like who
live in one house; Saudi and non-Saudi population,living in the Kingdom at the time of the survey.
Employed population: People (15+ years old) who did one of the following jobs during the reference period:
1. People who have been working for at least one hour for a salary or a wage (in cash or in kind)
2. People who provided unpaid assistance for others for at least one hour in any type of business or farm owned by one member of the household;
3. People who have been working for at least one hour for others without a wage or a profit (in cash or in kind) as volunteers;
4. People who were temporarily absent from work throughout the week on leave for illness or for any other reason but they were scheduled to resume work.
Workers include the students, job seekers, retirees, housewives, etc., who worked during the week preceding the visit for at least one hour, provided that this does not include household work.
Reference period for employment: The seven days preceding the interview date.
Classification used for occupations is adapted from ISIC Rev. 4.
2. Institution which provides data
General Authority for Statistics (GAStat)
3. Data availability
Labour Force Surveys conducted since 1999 are available on the website of GAStat, in Excel and PDF formats.
https://www.stats.gov.sa/en/814
Last date of access: July 2017.
|
|
Saudis |
|
|
Non-Saudis |
|
|
Total |
|
|
Males |
Females |
Total |
Males |
Females |
Total |
Males |
Females |
Total |
| Lawmakers, Directors and Business Managers |
206,898 |
21,717 |
228,615 |
83,939 |
1,896 |
85,835 |
290,837 |
23,613 |
314,450 |
| Specialists in Professional, Technical and Humanitarian Fields |
374,560 |
160,068 |
534,628 |
725,504 |
45,043 |
770,547 |
1,100,064 |
205,111 |
1,305,175 |
| Technicians in Professional, Technical and Humanitarian Fields |
528,397 |
377,107 |
905,504 |
333,320 |
47,088 |
380,408 |
861,717 |
424,195 |
1,285,912 |
| Clerical occupations |
701,615 |
182,680 |
884,295 |
164,117 |
9,152 |
173,269 |
865,732 |
191,832 |
1,057,564 |
| Sales |
279,258 |
32,320 |
311,578 |
1,021,566 |
6,261 |
1,027,827 |
1,300,824 |
38,581 |
1,339,405 |
| Services |
1,619,708 |
51,611 |
1,671,319 |
1,337,377 |
527,691 |
1,865,068 |
2,957,085 |
579,302 |
3,536,387 |
| Agriculture, Animal Husbandry & Fishing |
216,761 |
2,820 |
219,581 |
259,498 |
0 |
259,498 |
476,259 |
2,820 |
479,079 |
| Industrial , Chemical Operations and Food Industries |
68,809 |
7,403 |
76,212 |
252,739 |
7,732 |
260,471 |
321,548 |
15,135 |
336,683 |
| Supporting Basic Engineering |
189,847 |
0 |
189,847 |
2,530,502 |
1,695 |
2,532,197 |
2,720,349 |
1,695 |
2,722,044 |
| Total |
4,185,853 |
835,726 |
5,021,579 |
6,708,562 |
646,558 |
7,355,120 |
10,894,415 |
1,482,284 |
12,376,699 |
source: GLMM calculations, based on the published results of Labour Force Survey 2016 (Q3).
ANNEXED NOTE
1. Technical Notes and Definitions
Sampling frame of LFS 2016 Q3: Population Census 2010.
Sample size: 33,325 households
Reference period: August 2016
Population of reference: All the members of the households selected in the sample, including domestic helpers and the like who
live in one house; Saudi and non-Saudi population,”
living in the Kingdom at the time of the survey.
Employed population: People (15+ years old) who did one of the following jobs during the reference period:
1. People who have been working for at least one hour for a salary or a wage (in cash or in kind)
2. People who provided unpaid assistance for others for at least one hour in any type of business or farm owned by one member of the household;
3. People who have been working for at least one hour for others without a wage or a profit (in cash or in kind) as volunteers;
4. People who were temporarily absent from work throughout the week on leave for illness or for any other reason but they were scheduled to resume work.
Workers include the students, job seekers, retirees, housewives, etc., who worked during the week preceding the visit for at least one hour, provided that this does not include household work.
Reference period for employment: The seven days preceding the interview date.
Classification used for occupations is adapted from ISCO 1988.
2. Institution which provides data
General Authority for Statistics (GAStat)
3. Data availability
Surveys conducted since 1999 are available on the website of GAStat, in Excel and PDF formats.
https://www.stats.gov.sa/en/814
Last date of access: July 2017.
| Country of citizenship |
Estimates (total population) |
Date of reference |
| India |
650,000 |
Dec 2016 |
| Nepal |
>350,000 |
Jan 2017 |
| Bangladesh |
280,000 |
May 2016 |
| Philippines |
260,000 |
Jan 2017 |
| Egypt |
200,000 |
Feb 2015 |
| Sri Lanka |
145,256 |
Dec 2016 |
| Pakistan |
125,000 |
Oct 2016 |
| Syria |
54,000 |
Nov 2015 |
| Sudan |
50,000 |
Apr 2015 |
| Indonesia |
43,000 |
Sep 2016 |
| Jordan |
40,000 |
Dec 2014 |
| Iran |
30,000 |
Dec 2013 |
| UK |
25,000 |
Apr 2015 |
| Lebanon |
24,000 |
Jan 2017 |
| Ethiopia |
22,000 |
Jun 2015 |
| Tunisia |
20,000 |
Jan 2016 |
| Palestine |
20,000 |
May 2016 |
| Kenya |
14,000 |
Aug 2016 |
| USA* |
>11,000 |
Mar 2015 |
| China |
>10,000 |
Jan 2016 |
| Eritrea |
10,000 |
Aug 2016 |
| Canada |
9,000 |
Feb 2017 |
| Iraq |
8,976 |
Dec 2014 |
| Turkey |
8,000 |
Oct 2016 |
| Nigeria |
7,500 |
Oct 2016 |
| South Africa |
6,000 |
May 2016 |
| Australia |
5,500 |
Nov. 2016 |
| Algeria |
5,000 |
March 2016 |
| France |
5,000 |
Apr 2016 |
| Ghana |
5,000 |
Jan 2015 |
| Malaysia |
4,848 |
Feb 2016 |
| Thailand |
4,500 |
Mar 2016 |
| Afghanistan |
3,500 – 4,000 |
Nov 2012 |
| Spain |
3,500 |
Jan 2017 |
| Uganda |
3,000 |
Nov 2016 |
| Romania |
2,500 |
Apr 2015 |
| Greece |
2,200 |
May 2016 |
| Italy |
2,100 |
Nov 2016 |
| Germany |
2,000 |
Jan 2017 |
| Ireland |
2,000 |
May 2015 |
| Russia |
2,000 |
Mar 2016 |
| South Korea |
2,000 |
Dec 2015 |
| Vietnam |
2,000 |
Feb 2016 |
| Serbia |
2,000 |
Feb 2017 |
| Portugal |
1,500 |
Mar 2016 |
| Brazil |
1,500 |
Jul 2016 |
| Netherlands |
1,432 |
Mar 2016 |
| Albania |
1,200 |
Jan 2017 |
| Macedonia |
1,000 |
Dec 2013 |
| Ukraine |
1,000 |
Nov 2016 |
| New Zealand |
989 |
Feb 2017 |
| Japan |
944 |
Jan 2017 |
| Denmark |
900 |
Feb 2017 |
| Poland |
700 – 800 |
Feb 2017 |
| Belgium |
600 |
Jan 2017 |
| Cuba |
600 |
May 2016 |
| Sweden |
527 |
Feb 2017 |
| Bulgaria |
500 |
Jan 2017 |
| Croatia |
500 |
Nov 2016 |
| Austria |
500 |
Nov 2016 |
| Argentina |
400 |
Jan 2017 |
| Mexico |
400 |
Oct 2015 |
| Venezuela |
337 |
Dec 2014 |
| Kyrgyzstan |
330 |
Feb 2017 |
| Hungary |
300 |
Jan 2017 |
| Singapore |
300 |
Dec 2014 |
| Switzerland |
250 |
Dec 2014 |
| Senegal |
a few hundreds |
Mar 2016 |
| Belarus |
200 |
Jan 2017 |
| Finland |
200 |
Jan 2017 |
| Kazakhstan |
200 |
Aug 2015 |
| Colombia |
200 |
Feb 2017 |
| Norway |
160 |
2015 |
| Moldova |
154 |
Jan 2017 |
| Gambia |
135 |
Dec 2013 |
| Azerbaijan |
120 |
Dec 2014 |
| Ecuador |
100 |
Dec 2014 |
| El Salvador |
100 |
Dec 2014 |
| Slovakia |
100 |
Jan. 2017 |
| Czech Republic |
100 |
Feb 2017 |
| Benin |
82 |
Dec. 2014 |
| Dominican Republic |
44 |
Dec 2014 |
| Liberia |
40 |
Dec 2013 |
| Brunei |
20 |
Dec 2013 |
| Latvia |
10 |
Jan 2017 |
| Liechentstein |
1 |
Jan 2015 |
Source: SNOJ, J. Population of Qatar by nationality – 2017 report, Priya DSouza Consultancy, February 2017.
http://priyadsouza.com/population-of-qatar-by-nationality-in-2017/
*Military personnel only. Data for overall US population in Qatar not available.
ANNEXED NOTE
1. Technical Notes and Definitions
The nationality breakdown of Qatar’s population (Qataris/ non-Qataris), and the breakdown of the foreign population by country of citizenship
is concealed by the Ministry of Development Planning and Statistics (MDPS), in charge of gathering and disseminating statistical data on the country.
However, since 2013-2014, Doha-based journalist and consultant Jure Snoj has been collecting and compiling figures of foreign residents in Qatar
from several sources (embassies, press quotes of Qatari officials’ interviews, etc.).
The first publication of these data in BQ magazine (http://www.bq-magazine.com/economy/2013/12/population-qatar-nationality) was consistent
with a 2013 publication of governmental figures on selected nationalities:
(English: http://www.arabianbusiness.com/qatar-s-population-exceeds-2m-521314.html;
Arabic: Al-Raya newspaper http://www.raya.com/news/locals, October 1, 2013, p. 20).
Latest release of data (2017 Report), under the umbrella of Priya DSouza Consultancy firm displays figures for 87 nationalities.
The author states the origin of data as follows in the 2017 report:
“The majority of figures shown in the table below have been sourced from foreign embassies in Qatar. While they are mostly estimates, in many cases
the embassies have been clear the data was given to them by Qatar’s Ministry of Foreign Affairs, meaning that data was exact at the day of issuing
the report. In several additional cases the Government of Qatar has made data for specific nationalities publicly available.
These occasions happened when a high-ranking official was interviewed by the media, as well as a few instances of the figures appearing on official
Qatari Governmental websites.”
(http://priyadsouza.com/population-of-qatar-by-nationality-in-2017/).
2. Institution which provides data
Priya DSouza Consultancy
3. Data availability
The data is taken from:
SNOJ, J. Population of Qatar by nationality – 2017 report, Priya DSouza Consultancy, February 2017.
http://priyadsouza.com/population-of-qatar-by-nationality-in-2017/
Last date of access: June 2017.
| |
Qataris |
Arabs |
Asians |
Europeans |
Others |
Others |
Total births |
% of Qatari births in total |
| GCC Arabs |
Non-GCC Arabs |
Total |
| 1981 |
3,002 |
348 |
1,820 |
2,168 |
1,992 |
28 |
2 |
30 |
7,192 |
41.7 |
| 1982 |
3,457 |
403 |
2,103 |
2,506 |
2,034 |
31 |
3 |
34 |
8,031 |
43.0 |
| 1983 |
3,416 |
426 |
2,304 |
2,730 |
2,072 |
33 |
10 |
43 |
8,261 |
41.4 |
| 1984 |
3,812 |
457 |
2,331 |
2,788 |
1,976 |
27 |
10 |
37 |
8,613 |
44.3 |
| 1985 |
3,857 |
594 |
2,538 |
3,132 |
2,176 |
33 |
27 |
60 |
9,225 |
41.8 |
| 1986 |
4,034 |
638 |
2,942 |
3,580 |
2,284 |
30 |
14 |
44 |
9,942 |
40.6 |
| 1987 |
3,991 |
674 |
3,055 |
3,729 |
2,150 |
29 |
20 |
49 |
9,919 |
40.2 |
| 1988 |
4,472 |
744 |
3,376 |
4,120 |
2,207 |
22 |
21 |
43 |
10,842 |
41.2 |
| 1989 |
4,513 |
726 |
3,518 |
4,244 |
2,099 |
34 |
18 |
52 |
10,908 |
41.4 |
| 1990 |
4,724 |
800 |
3,421 |
4,221 |
2,027 |
28 |
22 |
50 |
11,022 |
42.9 |
| 1991 |
4,691 |
700 |
2,685 |
3,385 |
1,632 |
25 |
23 |
48 |
9,756 |
48.1 |
| 1992 |
5,016 |
620 |
2,731 |
3,351 |
2,033 |
24 |
35 |
59 |
10,459 |
48.0 |
| 1993 |
5,389 |
580 |
2,816 |
3,396 |
1,982 |
26 |
29 |
55 |
10,822 |
49.8 |
| 1994 |
5,373 |
558 |
2,619 |
3,177 |
1,953 |
27 |
31 |
58 |
10,561 |
50.9 |
| 1995 |
5,344 |
519 |
2,563 |
3,082 |
1,872 |
36 |
37 |
73 |
10,371 |
51.5 |
| 1996 |
5,306 |
491 |
2,623 |
3,114 |
1,813 |
42 |
42 |
84 |
10,317 |
51.4 |
| 1997 |
5,312 |
460 |
2,691 |
3,151 |
1,866 |
59 |
59 |
118 |
10,447 |
50.8 |
| 1998 |
5,446 |
439 |
2,678 |
3,117 |
2,091 |
44 |
83 |
127 |
10,781 |
50.5 |
| 1999 |
5,574 |
398 |
2,669 |
3,067 |
2,082 |
40 |
83 |
123 |
10,846 |
51.4 |
| 2000 |
5,612 |
406 |
2,800 |
3,206 |
2,323 |
40 |
69 |
109 |
11,250 |
49.9 |
| 2001 |
5,855 |
399 |
3,185 |
3,584 |
2,559 |
37 |
83 |
120 |
12,118 |
48.3 |
| 2002 |
5,924 |
355 |
3,270 |
3,625 |
2,493 |
63 |
95 |
158 |
12,200 |
48.6 |
| 2003 |
6,193 |
394 |
3,481 |
3,875 |
2,622 |
45 |
121 |
166 |
12,856 |
48.2 |
| 2004 |
6,488 |
383 |
3,482 |
3,865 |
2,581 |
101 |
155 |
256 |
13,190 |
49.2 |
| 2005 |
6,260 |
345 |
3,539 |
3,884 |
2,722 |
117 |
418 |
535 |
13,401 |
46.7 |
| 2006 |
6,563 |
393 |
3,844 |
4,237 |
2,996 |
127 |
197 |
324 |
14,120 |
46.5 |
| 2007 |
7,178 |
435 |
4,188 |
4,623 |
3,407 |
198 |
275 |
473 |
15,681 |
45.8 |
| 2008 |
7,355 |
498 |
4,840 |
5,338 |
3,912 |
253 |
352 |
605 |
17,210 |
42.7 |
| 2009 |
7,664 |
544 |
5,235 |
5,779 |
4,484 |
319 |
405 |
724 |
18,651 |
41.1 |
| 2010 |
7,733 |
593 |
5,573 |
6,166 |
4,838 |
359 |
408 |
767 |
19,504 |
39.6 |
| 2011 |
7,592 |
591 |
6,244 |
6,835 |
5,333 |
382 |
481 |
863 |
20,623 |
36.8 |
| 2012 |
6,953 |
629 |
7,048 |
|
5,829 |
421 |
540 |
961 |
21,423 |
32.5 |
| 2013 |
7,807 |
666 |
7,851 |
8,517 |
6,325 |
460 |
599 |
1,059 |
23,708 |
32.9 |
| 2014 |
7,954 |
694 |
8,728 |
9,422 |
6,762 |
610 |
695 |
1,305 |
25,443 |
31.3 |
| 2015 |
8,244 |
678 |
9315 |
9,993 |
7116 |
551 |
718 |
1,269 |
26,622 |
31.0 |
Source: Vital Statistics- Annual Bulletin of Births and Deaths, MDPS.
ANNEXED NOTE
1. Characteristics of data and definitions
The data covers the Qatari births in Qatar and abroad, as well as foreign births in Qatar.
According to Law No. 5, 1982 on the Vital Registration System, vital registration data are transmitted by the Ministry of Health
to the Ministry of Development Planning & Statistics for tabulations and processing.
Late registered births are recorded on the year of registration.
The nationality group which the newborn belongs to is collected according to the nationality of the father/ head of the household.
2. Institution which provides data
Ministry of Development Planning and Statistics (MDPS).
3. Period of data coverage:
January 1st-December 31st, given years.
4. Data availability
Vital Statistics Annual Bulletins of Births and Death are available in PDF and Excel formats on MDPS website, for the years 1984 to 2015.
http://www.mdps.gov.qa/en/statistics1/pages/topicslisting.aspx?parent=Population&child=BirthsDeaths
A selection of data is also published as part of the Annual Statistical Abstracts, in PDF and Excel formats.
http://www.mdps.gov.qa/en/statistics/Statistical%20Releases/Population/BirthsDeaths/2015/3_Vital_Statistics_2015.xlsx
Last date of access: June 2017.
|
Qataris |
Non-Qataris |
Total |
|
Males |
Females |
Total |
Males |
Females |
Total |
Males |
Females |
Total |
| Never Married |
35,722 |
35,183 |
70,905 |
290,291 |
86,568 |
376,859 |
326,013 |
121,751 |
447,764 |
| Married |
56,253 |
51,772 |
108,025 |
1,372,010 |
259,093 |
1,631,103 |
1,428,263 |
310,865 |
1,739,128 |
| Divorced |
1,304 |
4,069 |
5,373 |
2,467 |
2,659 |
5,126 |
3,771 |
6,728 |
10,499 |
| Widowed |
524 |
5,584 |
6,108 |
1,159 |
3,050 |
4,209 |
1,683 |
8,634 |
10,317 |
| Total |
93,803 |
96,608 |
190,411 |
1,665,927 |
351,370 |
2,017,297 |
1,759,730 |
447,978 |
2,207,708 |
Source: Annual Bulletin of Labor Force Sample survey 2015
ANNEXED NOTE
1. Technical Notes and Definitions
The data is taken from 2015 Labour Force Survey (yearly synthesis)
Sampling frame of LFS 2015: Population Census 2010.
Sample size: 44,756 persons, in 6,953 households: 1- Qatari households; 2- Non-Qatari regular (non-collective) households;
Data Collection: The sample was divided into equal parts to collect data monthly. Each month 1/3 of the quarterly data were collected during the first two weeks of the month.
Reference period for the labour force data: the week prior to data collection day.
Population of reference: all Qatari and non-Qatari households present in Qatar on the night of survey, living in normal and collective households.
The collective households are a group of persons not related to each other and sharing living conditions in a residential unit, I.e. labour camps, students living boarding schools, nurses in hospitals… etc. The survey covered the small collective households (includes less than 7 persons) and large collective households (includes 7 persons or more).
The survey did not cover short periods accommodation, i.e. hotels.
2. Institution which provides data
Ministry of Development Planning and Statistics
(http://www.mdps.gov.qa/en/pages/default.aspx)
3. Data availability
The Statistics Authority conducted the first labour Force Sample Survey in 2001. Starting from 2006, the execution of these surveys came to be on annual basis. Quarterly publications of Labour Force Surveys’ data are also available since 2012.
2015′ and earlier Labour Force Surveys can be downloaded from MDPS’s website, in PDF and Excel format:
http://www.mdps.gov.qa/en/statistics1/pages/topicslisting.aspx?parent=Social&child=LaborForce
See also Qatar Information Exchange for earlier Labour Force Surveys. QIX has also an interactive data base compiling data on the labour force taken from available surveys:
http://www.qix.gov.qa/portal/page/portal/qix/subject_area/Statistics?subject_area=183
Last date of access: April 2017.
|
Qataris |
Non-Qataris |
Total |
|
Males |
Females |
Total |
Males |
Females |
Total |
Males |
Females |
Total |
| Never Married |
16,554 |
22,561 |
39,115 |
31,685 |
29,904 |
61,589 |
48,239 |
52,465 |
100,704 |
| Married |
12,332 |
32,403 |
44,735 |
4,497 |
91,460 |
95,957 |
16,829 |
123,863 |
140,692 |
| Divorced |
104 |
1,772 |
1,876 |
42 |
179 |
221 |
146 |
1,951 |
2,097 |
| Widowed |
461 |
5,020 |
5,481 |
294 |
1,813 |
2,107 |
755 |
6,833 |
7,588 |
| Total |
29,451 |
61,756 |
91,207 |
36,518 |
123,356 |
159,874 |
65,969 |
185,112 |
251,081 |
Source: Annual Bulletin of Labor Force Sample survey 2015
ANNEXED NOTE
1. Technical Notes and Definitions
The data is taken from 2015 Labour Force Survey (yearly synthesis)
Sampling frame of LFS 2015: Population Census 2010.
Sample size: 44,756 persons, in 6,953 households: 1- Qatari households; 2- Non-Qatari regular (non-collective) households;
Data Collection: The sample was divided into equal parts to collect data monthly. Each month 1/3 of the quarterly data were collected during the first two weeks of the month.
Reference period for the labour force data: the week prior to data collection day.
Population of reference: all Qatari and non-Qatari households present in Qatar on the night of survey, living in normal and collective households.
The collective households are a group of persons not related to each other and sharing living conditions in a residential unit, I.e. labour camps, students living boarding schools, nurses in hospitals… etc. The survey covered the small collective households (includes less than 7 persons) and large collective households (includes 7 persons or more).
The survey did not cover short periods accommodation, i.e. hotels.
Relation to labour force (for persons aged 15 and above)
In the labour force (= economically active).
1) Employed.
All persons aged 15 years an above, who during the week preceding the survey:
a) Perform a work for a wage, salary, profits or household gains, whether it was in cash or in kind.
b) Are temporarily not employed, however, they still have an official relation with their work
2) Unemployed.
All persons aged 15 years and over who were, during the week preceding the survey, without employment, willing to work and looking seriously for a job.
There is a distinction between two kinds of unemployed persons:
a) First time unemployed: They are the persons who never worked previously, and were during the week preceding the survey looking actively for work.
b) Unemployed who previously worked: They are the persons with a work experience, who during the week preceding the survey were actively looking for a job
Outside the labour force (=economically inactive):
Full-time student: The person (15 years or older) enrolled in any educational institution as a full-time persistent student with purpose of attaining an academic degree, irrespective of whether the schooling hours are in the morning or evening. Any trainee enrolled in vocational training institutes is regarded as a full-time student.
Full-time housewife: The female (15 years or older) who is fully engaged in home management and family care, and does not practice any other work
Retired: The person who does not look for a job during the week preceding the survey and gets a fixed pension for work he/she had joined before
Disabled: The person (15 years or older) who is not capable of work due to illness, handicap or old age.
Others: Those able to work but not willing to, not enrolled in education, as well as any other cases encountered by the enumerator other than the above mentioned.
2. Institution which provides data
Ministry of Development Planning and Statistics
(http://www.mdps.gov.qa/en/pages/default.aspx)
3. Data availability
The Statistics Authority conducted the first labour Force Sample Survey in 2001. Starting from 2006, the execution of these surveys came to be on annual basis. Quarterly publications of Labour Force Surveys’ data are also available since 2012.
2015′ and earlier Labour Force Surveys can be downloaded from MDPS’s website, in PDF and Excel format:
http://www.mdps.gov.qa/en/statistics1/pages/topicslisting.aspx?parent=Social&child=LaborForce
See also Qatar Information Exchange for earlier Labour Force Surveys. QIX has also an interactive data base compiling data on the labour force taken from available surveys:
http://www.qix.gov.qa/portal/page/portal/qix/subject_area/Statistics?subject_area=183
Last date of access: June 2017.
|
Qataris |
Non-Qataris |
Total |
|
Males |
Females |
Total |
Males |
Females |
Total |
Males |
Females |
Total |
| Illiterate |
879 |
3,594 |
4,473 |
127 |
2,129 |
2,256 |
1,006 |
5,723 |
6,729 |
| Read & Write |
4,709 |
5,909 |
10,618 |
241 |
11,036 |
11,277 |
4,950 |
16,945 |
21,895 |
| Primary |
3,197 |
6,718 |
9,915 |
3,850 |
8,347 |
12,197 |
7,047 |
15,065 |
22,112 |
| Preparatory |
6,939 |
13,763 |
20,702 |
12,647 |
17,109 |
29,756 |
19,586 |
30,872 |
50,458 |
| Secondary |
9,383 |
14,417 |
23,800 |
14,140 |
38,455 |
52,595 |
23,523 |
52,872 |
76,395 |
| Diploma |
643 |
2,862 |
3,505 |
309 |
6,507 |
6,816 |
952 |
9,369 |
10,321 |
| University and above |
3,701 |
14,493 |
18,194 |
5,204 |
39,773 |
44,977 |
8,905 |
54,266 |
63,171 |
| Total |
29,451 |
61,756 |
91,207 |
36,518 |
123,356 |
159,874 |
65,969 |
185,112 |
251,081 |
Source: Annual Bulletin of Labor Force Sample survey 2015
ANNEXED NOTE
1. Technical Notes and Definitions
The data is taken from 2015 Labour Force Survey (yearly synthesis)
Sampling frame of LFS 2015: Population Census 2010.
Sample size: 44,756 persons, in 6,953 households: 1- Qatari households; 2- Non-Qatari regular (non-collective) households;
Data Collection: The sample was divided into equal parts to collect data monthly. Each month 1/3 of the quarterly data were collected during the first two weeks of the month.
Reference period for the labour force data: the week prior to data collection day.
Population of reference: all Qatari and non-Qatari households present in Qatar on the night of survey, living in normal and collective households.
The collective households are a group of persons not related to each other and sharing living conditions in a residential unit, I.e. labour camps, students living boarding schools, nurses in hospitals… etc. The survey covered the small collective households (includes less than 7 persons) and large collective households (includes 7 persons or more).
The survey did not cover short periods accommodation, i.e. hotels.
Relation to labour force (for persons aged 15 and above)
In the labour force (= economically active).
1) Employed.
All persons aged 15 years an above, who during the week preceding the survey:
a) Perform a work for a wage, salary, profits or household gains, whether it was in cash or in kind.
b) Are temporarily not employed, however, they still have an official relation with their work
2) Unemployed.
All persons aged 15 years and over who were, during the week preceding the survey, without employment, willing to work and looking seriously for a job.
There is a distinction between two kinds of unemployed persons:
a) First time unemployed: They are the persons who never worked previously, and were during the week preceding the survey looking actively for work.
b) Unemployed who previously worked: They are the persons with a work experience, who during the week preceding the survey were actively looking for a job
Outside the labour force (=economically inactive):
Full-time student: The person (15 years or older) enrolled in any educational institution as a full-time persistent student with purpose of attaining an academic degree, irrespective of whether the schooling hours are in the morning or evening. Any trainee enrolled in vocational training institutes is regarded as a full-time student.
Full-time housewife: The female (15 years or older) who is fully engaged in home management and family care, and does not practice any other work
Retired: The person who does not look for a job during the week preceding the survey and gets a fixed pension for work he/she had joined before
Disabled: The person (15 years or older) who is not capable of work due to illness, handicap or old age.
Others: Those able to work but not willing to, not enrolled in education, as well as any other cases encountered by the enumerator other than the above mentioned.
2. Institution which provides data
Ministry of Development Planning and Statistics
(http://www.mdps.gov.qa/en/pages/default.aspx)
3. Data availability
The Statistics Authority conducted the first labour Force Sample Survey in 2001. Starting from 2006, the execution of these surveys came to be on annual basis. Quarterly publications of Labour Force Surveys’ data are also available since 2012.
2015′ and earlier Labour Force Surveys can be downloaded from MDPS’s website, in PDF and Excel format:
http://www.mdps.gov.qa/en/statistics1/pages/topicslisting.aspx?parent=Social&child=LaborForce
See also Qatar Information Exchange for earlier Labour Force Surveys. QIX has also an interactive data base compiling data on the labour force taken from available surveys:
http://www.qix.gov.qa/portal/page/portal/qix/subject_area/Statistics?subject_area=183
Last date of access: June 2017.
| |
Qataris |
Non-Qataris |
Total |
| |
Males |
Females |
Total |
Males |
Females |
Total |
Males |
Females |
Total |
| 15 – 19 |
12,607 |
14,667 |
27,274 |
22,636 |
17,966 |
40,602 |
35,243 |
32,633 |
67,876 |
| 20 – 24 |
4,131 |
9,352 |
13,483 |
6,789 |
11,681 |
18,470 |
10,920 |
21,033 |
31,953 |
| 25 – 29 |
456 |
5,555 |
6,011 |
1,737 |
16,087 |
17,824 |
2,193 |
21,642 |
23,835 |
| 30 – 34 |
260 |
2,874 |
3,134 |
377 |
17,894 |
18,271 |
637 |
20,768 |
21,405 |
| 35 – 39 |
237 |
3,586 |
3,823 |
275 |
16,130 |
16,405 |
512 |
19,716 |
20,228 |
| 40 – 44 |
238 |
3,744 |
3,982 |
437 |
15,509 |
15,946 |
675 |
19,253 |
19,928 |
| 45 – 49 |
598 |
4,571 |
5,169 |
249 |
11,164 |
11,413 |
847 |
15,735 |
16,582 |
| 50 – 54 |
1,107 |
3,654 |
4,761 |
331 |
8,364 |
8,695 |
1,438 |
12,018 |
13,456 |
| 55 – 59 |
2,543 |
5,333 |
7,876 |
786 |
4,542 |
5,328 |
3,329 |
9,875 |
13,204 |
| 60 – 64 |
2,217 |
2,749 |
4,966 |
506 |
2,063 |
2,569 |
2,723 |
4,812 |
7,535 |
| 65 + |
5,057 |
5,671 |
10,728 |
2,395 |
1,956 |
4,351 |
7,452 |
7,627 |
15,079 |
| Total |
29,451 |
61,756 |
91,207 |
36,518 |
123,356 |
159,874 |
65,969 |
185,112 |
251,081 |
Source: Annual Bulletin of Labor Force Sample survey 2015
ANNEXED NOTE
1. Technical Notes and Definitions
The data is taken from 2015 Labour Force Survey (yearly synthesis)
Sampling frame of LFS 2015: Population Census 2010.
Sample size: 44,756 persons, in 6,953 households: 1- Qatari households; 2- Non-Qatari regular (non-collective) households;
Data Collection: The sample was divided into equal parts to collect data monthly. Each month 1/3 of the quarterly data were collected during the first two weeks of the month.
Reference period for the labour force data: the week prior to data collection day.
Population of reference: all Qatari and non-Qatari households present in Qatar on the night of survey, living in normal and collective households.
The collective households are a group of persons not related to each other and sharing living conditions in a residential unit, I.e. labour camps, students living boarding schools, nurses in hospitals… etc. The survey covered the small collective households (includes less than 7 persons) and large collective households (includes 7 persons or more).
The survey did not cover short periods accommodation, i.e. hotels.
Relation to labour force (for persons aged 15 and above)
In the labour force (= economically active).
1) Employed.
All persons aged 15 years an above, who during the week preceding the survey:
a) Perform a work for a wage, salary, profits or household gains, whether it was in cash or in kind.
b) Are temporarily not employed, however, they still have an official relation with their work
2) Unemployed.
All persons aged 15 years and over who were, during the week preceding the survey, without employment, willing to work and looking seriously for a job.
There is a distinction between two kinds of unemployed persons:
a) First time unemployed: They are the persons who never worked previously, and were during the week preceding the survey looking actively for work.
b) Unemployed who previously worked: They are the persons with a work experience, who during the week preceding the survey were actively looking for a job
Outside the labour force (=economically inactive):
Full-time student: The person (15 years or older) enrolled in any educational institution as a full-time persistent student with purpose of attaining an academic degree, irrespective of whether the schooling hours are in the morning or evening. Any trainee enrolled in vocational training institutes is regarded as a full-time student.
Full-time housewife: The female (15 years or older) who is fully engaged in home management and family care, and does not practice any other work
Retired: The person who does not look for a job during the week preceding the survey and gets a fixed pension for work he/she had joined before
Disabled: The person (15 years or older) who is not capable of work due to illness, handicap or old age.
Others: Those able to work but not willing to, not enrolled in education, as well as any other cases encountered by the enumerator other than the above mentioned.
2. Institution which provides data
Ministry of Development Planning and Statistics
(http://www.mdps.gov.qa/en/pages/default.aspx)
3. Data availability
The Statistics Authority conducted the first labour Force Sample Survey in 2001. Starting from 2006, the execution of these surveys came to be on annual basis. Quarterly publications of Labour Force Surveys’ data are also available since 2012.
2015′ and earlier Labour Force Surveys can be downloaded from MDPS’s website, in PDF and Excel format:
http://www.mdps.gov.qa/en/statistics1/pages/topicslisting.aspx?parent=Social&child=LaborForce
See also Qatar Information Exchange for earlier Labour Force Surveys. QIX has also an interactive data base compiling data on the labour force taken from available surveys:
http://www.qix.gov.qa/portal/page/portal/qix/subject_area/Statistics?subject_area=183
Last date of access: June 2017.
|
Qataris |
Non-Qataris |
Total |
|
Males |
Females |
Total |
Males |
Females |
Total |
Males |
Females |
Total |
| Housewife |
0 |
28,710 |
28,710 |
0 |
91,097 |
91,097 |
0 |
119,807 |
119,807 |
| Student |
17,064 |
23,230 |
40,294 |
29,914 |
25,964 |
55,878 |
46,978 |
49,194 |
96,172 |
| Disabled |
986 |
2,009 |
2,995 |
2,010 |
1,424 |
3,434 |
2,996 |
3,433 |
6,429 |
| Retired |
10,505 |
5,836 |
16,341 |
0 |
0 |
0 |
10,505 |
5,836 |
16,341 |
| Other |
896 |
1,971 |
2,867 |
4,594 |
4,871 |
9,465 |
5,490 |
6,842 |
12,332 |
| Total |
29,451 |
61,756 |
91,207 |
36,518 |
123,356 |
159,874 |
65,969 |
185,112 |
251,081 |
Source: Annual Bulletin of Labor Force Sample survey 2015
ANNEXED NOTE
1. Technical Notes and Definitions
The data is taken from 2015 Labour Force Survey (yearly synthesis)
Sampling frame of LFS 2015: Population Census 2010.
Sample size: 44,756 persons, in 6,953 households: 1- Qatari households; 2- Non-Qatari regular (non-collective) households;
Data Collection: The sample was divided into equal parts to collect data monthly. Each month 1/3 of the quarterly data were collected during the first two weeks of the month.
Reference period for the labour force data: the week prior to data collection day.
Population of reference: all Qatari and non-Qatari households present in Qatar on the night of survey, living in normal and collective households.
The collective households are a group of persons not related to each other and sharing living conditions in a residential unit, I.e. labour camps, students living boarding schools, nurses in hospitals… etc. The survey covered the small collective households (includes less than 7 persons) and large collective households (includes 7 persons or more).
The survey did not cover short periods accommodation, i.e. hotels.
Relation to labour force (for persons aged 15 and above)
In the labour force (= economically active).
1) Employed.
All persons aged 15 years an above, who during the week preceding the survey:
a) Perform a work for a wage, salary, profits or household gains, whether it was in cash or in kind.
b) Are temporarily not employed, however, they still have an official relation with their work
2) Unemployed.
All persons aged 15 years and over who were, during the week preceding the survey, without employment, willing to work and looking seriously for a job.
There is a distinction between two kinds of unemployed persons:
a) First time unemployed: They are the persons who never worked previously, and were during the week preceding the survey looking actively for work.
b) Unemployed who previously worked: They are the persons with a work experience, who during the week preceding the survey were actively looking for a job
Outside the labour force (=economically inactive):
Full-time student: The person (15 years or older) enrolled in any educational institution as a full-time persistent student with purpose of attaining an academic degree, irrespective of whether the schooling hours are in the morning or evening. Any trainee enrolled in vocational training institutes is regarded as a full-time student.
Full-time housewife: The female (15 years or older) who is fully engaged in home management and family care, and does not practice any other work
Retired: The person who does not look for a job during the week preceding the survey and gets a fixed pension for work he/she had joined before
Disabled: The person (15 years or older) who is not capable of work due to illness, handicap or old age.
Others: Those able to work but not willing to, not enrolled in education, as well as any other cases encountered by the enumerator other than the above mentioned.
2. Institution which provides data
Ministry of Development Planning and Statistics
(http://www.mdps.gov.qa/en/pages/default.aspx)
3. Data availability
The Statistics Authority conducted the first labour Force Sample Survey in 2001. Starting from 2006, the execution of these surveys came to be on annual basis. Quarterly publications of Labour Force Surveys’ data are also available since 2012.
2015′ and earlier Labour Force Surveys can be downloaded from MDPS’s website, in PDF and Excel format:
http://www.mdps.gov.qa/en/statistics1/pages/topicslisting.aspx?parent=Social&child=LaborForce
See also Qatar Information Exchange for earlier Labour Force Surveys. QIX has also an interactive data base compiling data on the labour force taken from available surveys:
http://www.qix.gov.qa/portal/page/portal/qix/subject_area/Statistics?subject_area=183
Last date of access: June 2017.
|
Qataris |
Non-Qataris |
Total |
|
Males |
Females |
Total |
Males |
Females |
Total |
Males |
Females |
Total |
| Government Department |
42.829 |
23.157 |
65.986 |
58.526 |
16,53 |
75.056 |
101.355 |
39.687 |
141.042 |
| Government Company/ Corporation |
7.872 |
4.650 |
12.522 |
53.286 |
9.031 |
62.317 |
61.158 |
13.681 |
74.839 |
| Mixed |
5.710 |
2.254 |
7.964 |
43.522 |
6.322 |
49.844 |
49.232 |
8.576 |
57.808 |
| Private |
7.517 |
4.154 |
11.671 |
1.412.777 |
87.179 |
1.499.956 |
1.420.294 |
91.333 |
1.511.627 |
| Diplomatic/International/Regi-onal |
95 |
7 |
102 |
3.141 |
1.209 |
4.350 |
3.236 |
1.216 |
4.452 |
| Non profit |
118 |
100 |
218 |
267 |
999 |
1.266 |
385 |
1.099 |
1.484 |
| Domestic |
0 |
0 |
0 |
57.199 |
105.177 |
162.376 |
57.199 |
105.177 |
162.376 |
| Total |
64.141 |
34.322 |
98.463 |
1.628.718 |
226.447 |
1.855.165 |
1.692.859 |
260.769 |
1.953.628 |
Source: Annual Bulletin of Labor Force Sample survey 2015
ANNEXED NOTE
1. Technical Notes and Definitions
The data is taken from 2015 Labour Force Survey (yearly synthesis)
Sampling frame of LFS 2015: Population Census 2010.
Sample size: 44,756 persons, in 6,953 households: 1- Qatari households; 2- Non-Qatari regular (non-collective) households;
3- Non-Qatari small collective households or labour gatherings (2 – 6 persons); 4- Non-Qatari large collective households or large labour gatherings (7 persons or more).
Data Collection: The sample was divided into equal parts to collect data monthly. Each month 1/3 of the quarterly data were collected during the first two weeks of the month.
Reference period for the labour force data: the week prior to data collection day.
Population of reference: all Qatari and non-Qatari households present in Qatar on the night of survey, living in normal and collective households.
The collective households are a group of persons not related to each other and sharing living conditions in a residential unit, I.e. labour camps, students living boarding
schools, nurses in hospitals… etc. The survey covered the small collective households (includes less than 7 persons) and large collective households (includes 7 persons or more).
The survey did not cover short periods accommodation, i.e. hotels.
The present data includes active population, i.e. employed and unemployed. It does not include persons seeking work for the first time
Relation to labour force (for persons aged 15 and above)
In the labour force (= economically active).
1) Employed.
All persons aged 15 years an above, who during the week preceding the survey:
a) Perform a work for a wage, salary, profits or household gains, whether it was in cash or in kind.
b) Are temporarily not employed, however, they still have an official relation with their work
2) Unemployed.
All persons aged 15 years and over who were, during the week preceding the survey, without employment, willing to work and looking seriously for a job.
There is a distinction between two kinds of unemployed persons:
a) First time unemployed: They are the persons who never worked previously, and were during the week preceding the survey looking actively for work.
b) Unemployed who previously worked: They are the persons with a work experience, who during the week preceding the survey were actively looking for a job
2. Institution which provides data
Ministry of Development Planning and Statistics
(http://www.mdps.gov.qa/en/pages/default.aspx)
3. Data availability
The Statistics Authority conducted the first labour Force Sample Survey in 2001. Starting from 2006, the execution of these surveys came to be on annual basis.
Quarterly publications of Labour Force Surveys’ data are also available since 2012.
2015′ and earlier Labour Force Surveys can be downloaded from MDPS’s website, in PDF and Excel format:
http://www.mdps.gov.qa/en/statistics1/pages/topicslisting.aspx?parent=Social&child=LaborForce
See also Qatar Information Exchange for earlier Labour Force Surveys. QIX has also an interactive data base compiling data on the labour force taken from available surveys:
http://www.qix.gov.qa/portal/page/portal/qix/subject_area/Statistics?subject_area=183
Last date of access: June 2017.
|
|
Households |
|
|
Labour camps |
|
|
Public Housing |
|
|
TOTAL |
|
|
males |
females |
total |
males |
females |
total |
males |
females |
total |
males |
females |
total |
| Doha |
190,192 |
185,420 |
375,612 |
514,879 |
64,470 |
579,349 |
1,359 |
137 |
1,496 |
706,430 |
250,027 |
956,457 |
| Al Rayyan |
170,136 |
188,283 |
358,419 |
233,489 |
10,646 |
244,135 |
3,158 |
0 |
3,158 |
406,783 |
198,929 |
605,712 |
| Al Wakrah |
38,587 |
40,499 |
79,086 |
208,487 |
10,435 |
218,922 |
1,029 |
0 |
1,029 |
248,103 |
50,934 |
299,037 |
| Umm Slal |
21,958 |
28,511 |
50,469 |
38,393 |
1,629 |
40,022 |
344 |
0 |
344 |
60,695 |
30,140 |
90,835 |
| Al Khor |
16,382 |
17,525 |
33,907 |
164,520 |
3,506 |
168,026 |
98 |
0 |
98 |
181,000 |
21,031 |
202,031 |
| Al Shamal |
1,889 |
2,214 |
4,103 |
4,634 |
57 |
4,691 |
0 |
0 |
0 |
6,523 |
2,271 |
8,794 |
| Al Da’ayen |
12,455 |
17,608 |
30,063 |
23,590 |
686 |
24,276 |
0 |
0 |
0 |
36,045 |
18,294 |
54,339 |
| Al Shahniaa |
12,362 |
11,748 |
24,110 |
159,040 |
4,421 |
163,461 |
0 |
0 |
0 |
171,402 |
16,169 |
187,571 |
| Total |
463,961 |
491,808 |
955,769 |
1,347,032 |
95,850 |
1,442,882 |
5,988 |
137 |
6,125 |
1,816,981 |
587,795 |
2,404,776 |
Source: census 2015, MDPS
1. Technical Notes and Definitions
Reference period for census 2015: the night of 20 to 21 April 2015.
Implementation method: census is based on de jure method; i.e. registering people according to their usual place of residence at time of census.
Populations in transit or visiting Qatar as tourists, as well as residents of public housing or visitors staying in a household for less than two months after night of reference were excluded.
Populations away from usual residence in Qatar for reasons of duty, or on a visit abroad for less than two months, as well as individuals with no personal housing within Qatar staying with a household for more than two months, are counted in their usual/ present residence during census night.
Population of reference: all individuals (nationals and non-nationals) present within the State’s borders during time of reference.
Public Housing: It is the collective living quarters (e.g. internal wards in hospitals, dormitories for students, jails, etc.) where individuals reside for some reason. The inmates do not form a family or census household but they have common circumstances to be in public housing. They do not have a usual place of residence in Qatar or they may stay in the collective living quarters away from their usual place of residence.
Continuity may be the prevailing characteristic of accommodation in some types of public housing such as the hospital or the jail. The accommodation may not take more than one night or a few nights. Then, they depart after that, e.g. hotel or guest house
Living Household: For census purposes, a living household is defined as an individual or group of individuals who may or may not be relatives. They live together and make common provisions for food, accommodation and other essentials for living. Anyone who is usually living in the housing unit of the household under enumeration is considered a member of that household (including the servants).
For census purposes, the following are considered as members of the household:
1) The person who spent the enumeration night with the household in the housing unit. This person is referred to as “present”.
2) The person who did not spend the census night in the housing unit for one of the following reasons (This person is referred to as “temporary absent”):
The person on shift in his work e.g. a physician in a hospital.
The person on permanent night shifts e.g. night watchman.
The person on fishing trips in the territorial waters.
Armed forces personnel stationed within the political boundaries of the State.
The person who is absent for any other reason from the housing units for a period not exceeding two months preceding the enumeration night.
3) A visitor: He/she is the person who happened to be present at the housing unit on the census night. No data should be taken about him/her if he/she has a usual place of residence inside Qatar and not being absent for a period exceeding two months from that place. But, if he/she has not got a place of usual residence inside Qatar, then information about him should be taken together with the household in that housing unit being enumerated. He/she shall be referred to as a “Visitor”.
4) Qatari household members residing outside the country for any reason and for any time period shall be counted among the household members and to be referred to as “Outside the country”.
Labour camps (or Labour gatherings)
Small Clusters (Gatherings) A group of persons of the same gender (male of female) usually staying in the housing unit. They live as a group (collectively) but there is no relationship between them and they do not form a living household. Their number ranges between 2 and 6 persons
Big Clusters (Gatherings) A group of persons of the same gender usually staying in housing units. They live as a group (collectively) but there is no relationship between them and they do not form a living household. They are seven or more persons who usually belong to one organization (company, establishment, etc).
(Definitions taken from Census 2010′ metadata: https://www.mdps.gov.qa/en/statistics/Statistical%20Releases/General/Census/Population_Households_Establishment_QSA_Census_AE_2010_1.pdf)
2. Institution which provides data
Ministry of Development Planning and Statistics
http://www.mdps.gov.qa/en/pages/default.aspx
http://www.mdps.gov.qa/ar/pages/default.aspx
3. Data availability
The present table was published in the “Population” section of 2016 Annual Statistical Abstract.
http://www.mdps.gov.qa/en/statistics/Statistical%20Releases/Population/Population/2016/Population_social_1_2016_AE.xls
http://www.mdps.gov.qa/en/statistics/Statistical%20Releases/Population/Population/2016/Population_social_1_2016_AE.pdf
Final results of 2015′ census (PDF format only)
http://www.mdps.gov.qa/en/statistics/Statistical%20Releases/General/Census/Population_Households_Establishment_QSA_Census_AE_2015.pdf
Last date of access: May 2017.
| |
Qataris |
Non-Qataris |
Total |
| |
Males |
Females |
Total |
Males |
Females |
Total |
Males |
Females |
Total |
| Illiterate |
964 |
3,639 |
4,603 |
26,924 |
3,997 |
30,921 |
27,888 |
7,636 |
35,524 |
| Read & Write |
5,339 |
6,106 |
11,445 |
198,851 |
39,203 |
238,054 |
204,190 |
45,309 |
249,499 |
| Primary |
7,387 |
7,470 |
14,857 |
362,264 |
60,965 |
423,229 |
369,651 |
68,435 |
438,086 |
| Preparatory |
15,937 |
16,309 |
32,246 |
494,820 |
60,358 |
555,178 |
510,757 |
76,667 |
587,424 |
| Secondary |
33,803 |
23,563 |
57,366 |
302,633 |
71,406 |
374,039 |
336,436 |
94,969 |
431,405 |
| Pre.U. Diploma |
2,974 |
3,582 |
6,556 |
63,989 |
16,668 |
80,657 |
66,963 |
20,250 |
87,213 |
| University and above |
27,399 |
35,939 |
63,338 |
216,446 |
98,773 |
315,219 |
243,845 |
134,712 |
378,557 |
| Total |
93,803 |
96,608 |
190,411 |
1,665,927 |
351,370 |
2,017,297 |
1,759,730 |
447,978 |
2,207,708 |
Source: Annual Bulletin of Labor Force Sample survey 2015
ANNEXED NOTE
1. Technical Notes and Definitions
The data is taken from 2015 Labour Force Survey (yearly synthesis)
Sampling frame of LFS 2015: Population Census 2010.
Sample size: 44,756 persons, in 6,953 households: 1- Qatari households; 2- Non-Qatari regular (non-collective) households;
Data Collection: The sample was divided into equal parts to collect data monthly. Each month 1/3 of the quarterly data were collected during the first two weeks of the month.
Reference period for the labour force data: the week prior to data collection day.
Population of reference: all Qatari and non-Qatari households present in Qatar on the night of survey, living in normal and collective households.
The collective households are a group of persons not related to each other and sharing living conditions in a residential unit, I.e. labour camps, students living boarding schools, nurses in hospitals… etc. The survey covered the small collective households (includes less than 7 persons) and large collective households (includes 7 persons or more).
The survey did not cover short periods accommodation, i.e. hotels.
2. Institution which provides data
Ministry of Development Planning and Statistics
(http://www.mdps.gov.qa/en/pages/default.aspx)
3. Data availability
The Statistics Authority conducted the first labour Force Sample Survey in 2001. Starting from 2006, the execution of these surveys came to be on annual basis. Quarterly publications of Labour Force Surveys’ data are also available since 2012.
2015′ and earlier Labour Force Surveys can be downloaded from MDPS’s website, in PDF and Excel format:
http://www.mdps.gov.qa/en/statistics1/pages/topicslisting.aspx?parent=Social&child=LaborForce
See also Qatar Information Exchange for earlier Labour Force Surveys. QIX has also an interactive data base compiling data on the labour force taken from available surveys:
http://www.qix.gov.qa/portal/page/portal/qix/subject_area/Statistics?subject_area=183
Last date of access: April 2017.
|
Qataris |
Non-Qataris |
Total |
|
Males |
Females |
Total |
Males |
Females |
Total |
Males |
Females |
Total |
| 15 – 19 |
13,464 |
14,939 |
28,403 |
28,912 |
20,752 |
49,664 |
42,376 |
35,691 |
78,067 |
| 20 – 24 |
14,955 |
14,084 |
29,039 |
172,930 |
45,506 |
218,436 |
187,885 |
59,590 |
247,475 |
| 25 – 29 |
12,296 |
13,598 |
25,894 |
273,422 |
61,134 |
334,556 |
285,718 |
74,732 |
360,450 |
| 30 – 34 |
10,079 |
10,077 |
20,156 |
329,256 |
72,755 |
402,011 |
339,335 |
82,832 |
422,167 |
| 35 – 39 |
8,512 |
8,165 |
16,677 |
283,151 |
51,417 |
334,568 |
291,663 |
59,582 |
351,245 |
| 40 – 44 |
7,052 |
8,117 |
15,169 |
205,649 |
43,338 |
248,987 |
212,701 |
51,455 |
264,156 |
| 45 – 49 |
6,699 |
7,082 |
13,781 |
165,278 |
27,818 |
193,096 |
171,977 |
34,900 |
206,877 |
| 50 – 54 |
7,064 |
5,216 |
12,280 |
89,301 |
15,778 |
105,079 |
96,365 |
20,994 |
117,359 |
| 55 – 59 |
5,023 |
6,094 |
11,117 |
74,229 |
7,484 |
81,713 |
79,252 |
13,578 |
92,830 |
| 60 – 64 |
3,233 |
3,304 |
6,537 |
26,481 |
2,713 |
29,194 |
29,714 |
6,017 |
35,731 |
| 65 – 69 |
1,953 |
3,711 |
5,664 |
14,174 |
1,793 |
15,967 |
16,127 |
5,504 |
21,631 |
| 70 – 74 |
1,485 |
870 |
2,355 |
2,168 |
639 |
2,807 |
3,653 |
1,509 |
5,162 |
| 75 + |
1,988 |
1,351 |
3,339 |
976 |
243 |
1,219 |
2,964 |
1,594 |
4,558 |
| Total |
93,803 |
96,608 |
190,411 |
1,665,927 |
351,370 |
2,017,297 |
1,759,730 |
447,978 |
2,207,708 |
Source: Annual Bulletin of Labor Force Sample survey 2015
ANNEXED NOTE
1. Technical Notes and Definitions
The data is taken from 2015 Labour Force Survey (yearly synthesis)
Sampling frame of LFS 2015: Population Census 2010.
Sample size: 44,756 persons, in 6,953 households: 1- Qatari households; 2- Non-Qatari regular (non-collective) households;
Data Collection: The sample was divided into equal parts to collect data monthly. Each month 1/3 of the quarterly data were collected during the first two weeks of the month.
Reference period for the labour force data: the week prior to data collection day.
Population of reference: all Qatari and non-Qatari households present in Qatar on the night of survey, living in normal and collective households.
The collective households are a group of persons not related to each other and sharing living conditions in a residential unit, I.e. labour camps, students living boarding schools, nurses in hospitals… etc. The survey covered the small collective households (includes less than 7 persons) and large collective households (includes 7 persons or more).
The survey did not cover short periods accommodation, i.e. hotels.
2. Institution which provides data
Ministry of Development Planning and Statistics
(http://www.mdps.gov.qa/en/pages/default.aspx)
3. Data availability
The Statistics Authority conducted the first labour Force Sample Survey in 2001. Starting from 2006, the execution of these surveys came to be on annual basis. Quarterly publications of Labour Force Surveys’ data are also available since 2012.
2015′ and earlier Labour Force Surveys can be downloaded from MDPS’s website, in PDF and Excel format:
http://www.mdps.gov.qa/en/statistics1/pages/topicslisting.aspx?parent=Social&child=LaborForce
See also Qatar Information Exchange for earlier Labour Force Surveys. QIX has also an interactive data base compiling data on the labour force taken from available surveys:
http://www.qix.gov.qa/portal/page/portal/qix/subject_area/Statistics?subject_area=183
Last date of access: April 2017.
|
Population |
Growth rates |
|
males |
females |
total |
males |
females |
total |
| 1986 |
250,328 |
123,067 |
373,395 |
|
|
|
| 1987 |
256,844 |
127,006 |
383,850 |
2.6 |
3.2 |
2.8 |
| 1988 |
263,958 |
131,251 |
395,209 |
2.7 |
3.3 |
2.9 |
| 1989 |
271,685 |
135,886 |
407,571 |
2.9 |
3.5 |
3.1 |
| 1990 |
279,800 |
140,979 |
420,779 |
2.9 |
3.7 |
3.2 |
| 1991 |
288,600 |
145,772 |
434,372 |
3.1 |
3.3 |
3.2 |
| 1992 |
297,992 |
150,579 |
448,571 |
3.2 |
3.2 |
3.2 |
| 1993 |
308,458 |
155,509 |
463,967 |
3.5 |
3.2 |
3.4 |
| 1994 |
319,379 |
160,951 |
480,330 |
3.5 |
3.4 |
3.5 |
| 1995 |
331,111 |
166,440 |
497,551 |
3.6 |
3.4 |
3.5 |
| 1996 |
343,472 |
172,104 |
515,576 |
3.7 |
3.3 |
3.6 |
| 1997 |
353,787 |
182,687 |
536,474 |
3.0 |
6.0 |
4.0 |
| 1998 |
370,742 |
190,248 |
560,990 |
4.7 |
4.1 |
4.5 |
| 1999 |
388,602 |
198,168 |
586,770 |
4.7 |
4.1 |
4.5 |
| 2000 |
407,148 |
206,821 |
613,969 |
4.7 |
4.3 |
4.5 |
| 2001 |
427,316 |
216,048 |
643,364 |
4.8 |
4.4 |
4.7 |
| 2002 |
450,351 |
226,147 |
676,498 |
5.3 |
4.6 |
5.0 |
| 2003 |
476,513 |
237,346 |
713,859 |
5.6 |
4.8 |
5.4 |
| 2004 |
546,116 |
251,943 |
798,059 |
13.6 |
6.0 |
11.1 |
| 2005 |
637,070 |
269,053 |
906,123 |
15.4 |
6.6 |
12.7 |
| 2006 |
754,298 |
288,649 |
1,042,947 |
16.9 |
7.0 |
14.1 |
| 2007 |
905,747 |
312,503 |
1,218,250 |
18.3 |
7.9 |
15.5 |
| 2008 |
1,111,176 |
337,303 |
1,448,479 |
20.4 |
7.6 |
17.3 |
| 2009 |
1,265,146 |
373,480 |
1,638,626 |
13.0 |
10.2 |
12.3 |
| 2010 |
1,296,110 |
414,988 |
1,715,098 |
2.4 |
10.5 |
4.6 |
| 2011 |
1,288,590 |
444,127 |
1,732,717 |
-0.6 |
6.8 |
1.0 |
| 2012 |
1,355,199 |
477,704 |
1,832,903 |
5.0 |
7.3 |
5.6 |
| 2013 |
1,477,632 |
526,068 |
2,003,700 |
8.6 |
9.6 |
8.9 |
| 2014 |
1,652,037 |
564,143 |
2,216,180 |
11.2 |
7.0 |
10.1 |
| 2015 |
1,840,643 |
597,147 |
2,437,790 |
10.8 |
5.7 |
9.5 |
| 2016 |
1,975,536 |
642,098 |
2,617,634 |
7.1 |
7.3 |
7.1 |
Source: Ministry of Development Planning and Statistics
ANNEXED NOTE
1. Characteristics of data and definitions
The table provides intercensal estimates of Qatar’s total resident population (nationals and non-nationals) based on census results (1986; 1997; 2004; 2010 and 2015),
civil registration of births and deaths, and registration of entries and exits
2. Institution which provides data
Ministry of Development Planning and Statistics
3. Period of data coverage:
mid-year estimates, given years.
4. Data availability
The data is available in Statistical Yearbooks (Annual Abstracts), available online by thematic chapters, in Excel and PDF formats.
The present data is published in the Annual Abstract 2016, Population chapter:
http://www.mdps.gov.qa/en/statistics/Statistical%20Releases/General/StatisticalAbstract/2016/population-chapters/Population_social_1_2016_AE.xls
http://www.mdps.gov.qa/en/statistics/Statistical%20Releases/General/StatisticalAbstract/2016/population-chapters/Population_social_1_2016_AE.pdf
Date of access: May 2017.
|
Kuwaitis |
Non-Kuwaitis |
|
GRAND |
|
|
|
Arabs |
|
|
Asians |
|
|
Africans |
|
|
Europeans |
|
|
North Americans |
|
|
South Americans |
|
|
Australians- Oceanians |
|
|
TOTAL non-Kuwaitis |
|
|
TOTAL |
|
| Age group |
males |
females |
total |
males |
females |
total |
males |
females |
total |
males |
females |
total |
males |
females |
total |
males |
females |
total |
males |
females |
total |
males |
females |
total |
males |
females |
total |
males |
females |
total |
| 0-4 |
84,418 |
80,956 |
165,374 |
53,658 |
51,428 |
105,086 |
22,846 |
21,598 |
44,444 |
270 |
270 |
540 |
637 |
604 |
1,241 |
1,256 |
966 |
2,222 |
58 |
53 |
111 |
79 |
78 |
157 |
78,804 |
74,997 |
153,801 |
163,222 |
155,953 |
319,175 |
| 5-9 |
83,857 |
81,410 |
165,267 |
52,249 |
49,708 |
101,957 |
19,972 |
19,299 |
39,271 |
165 |
154 |
319 |
691 |
658 |
1,349 |
1,073 |
964 |
2,037 |
76 |
84 |
160 |
112 |
79 |
191 |
74,338 |
70,946 |
145,284 |
158,195 |
152,356 |
310,551 |
| 10-14 |
75,786 |
73,667 |
149,453 |
40,844 |
38,106 |
78,950 |
13,764 |
13,106 |
26,870 |
111 |
125 |
236 |
537 |
468 |
1,005 |
859 |
781 |
1,640 |
70 |
60 |
130 |
77 |
57 |
134 |
56,262 |
52,703 |
108,965 |
132,048 |
126,370 |
258,418 |
| 15-19 |
67,323 |
64,547 |
131,870 |
33,555 |
31,543 |
65,098 |
8,818 |
8,390 |
17,208 |
153 |
117 |
270 |
319 |
347 |
666 |
771 |
715 |
1,486 |
64 |
59 |
123 |
67 |
56 |
123 |
43,747 |
41,227 |
84,974 |
111,070 |
105,774 |
216,844 |
| 20-24 |
65,100 |
63,019 |
128,119 |
51,519 |
31,066 |
82,585 |
75,978 |
17,596 |
93,574 |
703 |
3,705 |
4,408 |
257 |
366 |
623 |
390 |
500 |
890 |
51 |
71 |
122 |
38 |
50 |
88 |
128,936 |
53,354 |
182,290 |
194,036 |
116,373 |
310,409 |
| 25-29 |
54,078 |
53,986 |
108,064 |
121,683 |
43,513 |
165,196 |
187,175 |
76,239 |
263,414 |
2,012 |
17,002 |
19,014 |
506 |
775 |
1,281 |
727 |
699 |
1,426 |
94 |
95 |
189 |
44 |
60 |
104 |
312,241 |
138,383 |
450,624 |
366,319 |
192,369 |
558,688 |
| 30-34 |
47,291 |
50,382 |
97,673 |
119,832 |
44,950 |
164,782 |
214,464 |
89,627 |
304,091 |
2,285 |
12,544 |
14,829 |
761 |
938 |
1,699 |
1,017 |
707 |
1,724 |
105 |
92 |
197 |
66 |
59 |
125 |
338,530 |
148,917 |
487,447 |
385,821 |
199,299 |
585,120 |
| 35-39 |
38,944 |
43,136 |
82,080 |
99,974 |
34,358 |
134,332 |
227,424 |
90,406 |
317,830 |
1,117 |
4,267 |
5,384 |
864 |
900 |
1,764 |
1,020 |
571 |
1,591 |
81 |
74 |
155 |
79 |
58 |
137 |
330,559 |
130,634 |
461,193 |
369,503 |
173,770 |
543,273 |
| 40-44 |
33,856 |
38,442 |
72,298 |
71,803 |
24,060 |
95,863 |
179,695 |
76,454 |
256,149 |
653 |
1,444 |
2,097 |
914 |
714 |
1,628 |
935 |
496 |
1,431 |
79 |
54 |
133 |
64 |
48 |
112 |
254,143 |
103,270 |
357,413 |
287,999 |
141,712 |
429,711 |
| 45-49 |
29,037 |
33,579 |
62,616 |
56,498 |
18,421 |
74,919 |
138,303 |
53,919 |
192,222 |
413 |
439 |
852 |
950 |
595 |
1,545 |
1,147 |
470 |
1,617 |
76 |
43 |
119 |
80 |
54 |
134 |
197,467 |
73,941 |
271,408 |
226,504 |
107,520 |
334,024 |
| 50-54 |
24,304 |
28,519 |
52,823 |
43,787 |
14,086 |
57,873 |
81,711 |
29,164 |
110,875 |
258 |
149 |
407 |
924 |
484 |
1,408 |
1,297 |
453 |
1,750 |
89 |
40 |
129 |
101 |
49 |
150 |
128,167 |
44,425 |
172,592 |
152,471 |
72,944 |
225,415 |
| 55-59 |
17,545 |
22,422 |
39,967 |
28,233 |
9,831 |
38,064 |
47,419 |
13,827 |
61,246 |
172 |
102 |
274 |
806 |
373 |
1,179 |
1,140 |
389 |
1,529 |
65 |
25 |
90 |
90 |
29 |
119 |
77,925 |
24,576 |
102,501 |
95,470 |
46,998 |
142,468 |
| 60-64 |
13,038 |
17,774 |
30,812 |
17,151 |
6,510 |
23,661 |
22,154 |
5,909 |
28,063 |
87 |
60 |
147 |
498 |
224 |
722 |
685 |
243 |
928 |
34 |
16 |
50 |
53 |
15 |
68 |
40,662 |
12,977 |
53,639 |
53,700 |
30,751 |
84,451 |
| >64 |
21,507 |
29,770 |
51,277 |
15,982 |
9,987 |
25,969 |
10,503 |
3,269 |
13,772 |
47 |
33 |
80 |
397 |
241 |
638 |
539 |
224 |
763 |
25 |
8 |
33 |
28 |
17 |
45 |
27,521 |
13,779 |
41,300 |
49,028 |
43,549 |
92,577 |
| Total |
656,084 |
681,609 |
1,337,693 |
806,768 |
407,567 |
1,214,335 |
1,250,226 |
518,803 |
1,769,029 |
8,446 |
40,411 |
48,857 |
9,061 |
6,364 |
15,425 |
12,856 |
8,178 |
21,034 |
967 |
774 |
1,741 |
978 |
709 |
1,687 |
2,089,302 |
984,129 |
3,073,431 |
2,745,386 |
1,664,415 |
4,411,124 |
Source: PACI
ANNEXED NOTE
1. Characteristics of data and definitions
The source of data used here is the Public Authority for Civil Information (PACI), an independant government body in charge of :
1- centralising all population and labour force data in order to manage a fully computerised population register
2- issuing mandatory civil identification cards to every resident of the country, regardless of age and nationality.
The other source of demographic and socioeconomic data on Kuwait is the Central Statistical Office (CSO), operating within the Planning Ministry. The CSO has conducted ten population and housing censuses since its inception in 1957.
Since 1995 a marked discrepancy was witnessed between PACI’ and CSO’ population figures. PACI’ database is connected electronically with other administrations and bodies registering demographic events and professional/ residency issues (births and death; departures and arrivals; end of service, residency and ID deliveries, etc.).
PACI’s records of residents’ movements is thus regularly updated, which limits the risk of population overcount. Therefore, it is more likely that residents were undercounted during CSO- Ministry of Planning’s census operations (see: Shah, N. Population of Kuwait. Structure and Dynamics, Kuwait: Kuwait University Academic Publication Council, 2010, chapter 1).
(a) Kuwaiti: the Kuwaiti nationality rests upon a document of Kuwaiti nationality or a certificate proving Kuwaiti nationality issued by the Ministry of Interior of Kuwait.
(b) Non-Kuwaiti: his/ her nationality is determined by the name of the State which issued the passport. The foreign national also entered Kuwait legally and has a stamp of residence.
This category includes the Bidoon, a category of stateless persons living in the Emirate. Kuwait’s Bidoon population originates from three broad categories:
1) those whose ancestors failed to apply for nationality or lacked necessary documentation at the time of Kuwait’s independence in 1961;
2) those recruited to work in Kuwait’s army or police force during the 1960s who permanently settled in Kuwait, along with their families;
3) children of Kuwaiti mothers and stateless or foreign fathers (see Human Rights Watch. Prisoners of the Past. Kuwaiti Bidun and the Burden of Statelessness, June 2011, p. 3).
(The children of Kuwaiti mothers and non-Kuwaiti fathers (with specific nationality) inherit the father’s nationality. They are stateless if the father is stateless).
(c) Nationality group: collected according to the nationality of the head of the household.
Nationalities are grouped according to specific features common to certain population subgroups: language, geographic origin, etc. or according to internationally recognized categories such as: (Arab / non-Arab Asian countries / non-Arab African countries; European countries … etc.).
2. Institution which provides data
The Public Authority for Civil Information (PACI)
3. Period of data coverage: 31 December 2016
The database is updated three times a year and the website presents only the most recent data.
4. Data availability
The statistics section of PACI’s website (http://www.paci.gov.kw/en/ (English); http://www.paci.gov.kw/ (Arabic)) provides population and socio-economic data broken down by nationality (Kuwaiti/ non-Kuwaiti). Some data are displayed by nationality groups.
Analytical tables and data crosstabulations are available for download in PDF, html, .png and Excel (.csv) formats.
Date of access: March 2017
|
Population by country of citizenship |
| Oman |
2,427,825 |
| India |
776,829 |
| Bangladesh |
666,856 |
| Pakistan |
84,658 |
| Egypt |
51,796 |
| Philippines |
40,276 |
| Indonesia |
21,143 |
| Sri Lanka |
19,787 |
| Ethiopia |
16,529 |
| Nepal |
14,343 |
| Tanzania |
14,260 |
| Ouganda |
9,667 |
| total non-Omanis |
1,986,226 |
| Total |
4,414,051 |
Source: NCSI
ANNEXED NOTE
1. Technical Notes and Definitions
Reference period: mid-2016.
Original data source: Royal Oman Police.
2. Institution which provides data
National Center for Statistics and Information (NCSI)
3. Data availability
NCSI. Population Statistics, Issue 6, 2016 https://www.ncsi.gov.om/Elibrary/LibraryContentDoc/bar_pouplation%206%202016_99aebc6b-6eb3-4272-ae1f-9a8a9d3f5dd8.pdf
Last date of access: May 2017.
|
Country of residence and year of reference |
|
Bahrain |
Kuwait |
Oman |
Qatar |
Saudi Arabia |
UAE |
|
2014 |
end 2012 |
mid-2016 |
2013-2014 |
2013 |
2013-2014 |
| Egypt |
20,000 |
482,692 |
51,796 |
180,000 |
1,300,000 |
400,000 |
| Jordan |
7,000 |
55,081 |
n,d, |
40,000 |
250,000 |
200,000 |
| Lebanon |
2,300 |
42,586 |
n,d, |
25,000 |
160,000 |
100,000 |
| Morocco |
800 |
3,495 |
n,d, |
9,000 |
20,000 |
14,000 |
| Palestine |
5,000 |
8,072 |
n,d, |
20,500 |
500,000 |
150,000 |
| Syria |
3,000 |
135,554 |
n,d, |
60,000 |
1,000,000 |
242,000 |
| Sudan |
14,000 |
4,551 |
n,d, |
42,000 |
500,000 |
75,000 |
| Tunisia |
500 |
2,863 |
n,d, |
15,000 |
12,000 |
4,500 |
| Yemen |
4,700 |
10,762 |
n,d, |
40,000 |
800,000 |
90,000 |
| Ethiopia |
1,129 |
77,279 |
16,529 |
21,374 |
150,000 |
90,000 |
| Ghana |
n,d, |
791 |
n,d, |
n,d, |
n,d, |
500 |
| Kenya |
n,d, |
261 |
n,d, |
9,300 |
n,d, |
40,000 |
| Bangladesh |
98,221 |
190,171 |
666,856 |
150,000 |
1,500,000 |
700,000 |
| India |
257,663 |
692,525 |
776,829 |
545,000 |
2,000,000 |
2,600,000 |
| Indonesia |
29,553 |
14,036 |
21,143 |
39,000 |
1,500,000 |
85,000 |
| Nepal |
722 |
55,486 |
14,383 |
400,000 |
500,000 |
300,000 |
| Pakistan |
48,991 |
120,040 |
251,829 |
90,000 |
1,500,000 |
1,200,000 |
| Philippines |
29,722 |
161,742 |
40,276 |
200,000 |
670,000 |
525,530 |
| Sri Lanka |
7,627 |
109,860 |
19,787 |
100,000 |
550,000 |
300,000 |
| Total non nationals |
683,818 |
2,299,691 |
1,986,226 |
1,986,174 |
?* |
7,800,000 |
Sources: see below
ANNEXED NOTE
Sources and Definitions
*official figure for the non-nationals mid-2013: 9,723,214. UN/DESA: 9,060,433
Figures of migrants in the GCC may be overestimated due to its comprising a large share of Gulf-born (second- and third- generation) non-nationals.
Palestinians are holders of travel documents.
Sources: unless stated otherwise, receiving countries’ estimates in relevant tables in the POP section of the GLMM database.
1. UN/ DESA 2013 revision total migrants’ stocks by origin and destination countries
2. Snoj, Jure. “Population of Qatar by nationality”, BQ Magazine, Doha, December 2014.
http://www.bqdoha.com/2013/12/population-qatar
http://gulfmigration.eu/qatar-estimates-of-foreign-nationals-residing-in-qatar-by-country-of-citizenship-selected-countries-2014/
and Snoj, Jure. “UAE’s population- by nationality”, BQ Magazine, Doha, April 12, 2015.
http://www.bq-magazine.com/economy/socioeconomics/2015/04/uae-population-by-nationality
3. Latest figures available as of October 2015, in: De Bel-Air, F. “A Note on Syrian Refugees in the Gulf: Attempting to Assess Data and Policies,” GLMM Explanatory Note, GLMM – EN – No. 11/2015 http://gulfmigration.eu/media/pubs/exno/GLMM_EN_2015_11.pdf
Table as of May 15, 2017.
| |
|
age |
Nationals |
Non-nationals |
Total population |
% non-nationals |
| Country |
date/ period |
group |
numbers |
% |
numbers |
% |
numbers |
% |
in each age group |
| Bahrain (1) |
Mid-2016 |
0-14 |
211,874 |
32 |
71,813 |
9 |
283,687 |
20 |
25 |
| |
|
15-64 |
422,994 |
64 |
680,427 |
90 |
1,103,421 |
78 |
62 |
| |
|
65+ |
29,839 |
4 |
6,779 |
1 |
36,618 |
3 |
19 |
| Kuwait (2) |
December 2016 |
0-14 |
480,094 |
36 |
408,050 |
13 |
888,144 |
20 |
46 |
| |
|
15-64 |
806,322 |
60 |
2,624,081 |
85 |
3,430,403 |
78 |
76 |
| |
|
65+ |
51,277 |
4 |
41,300 |
1 |
92,577 |
2 |
45 |
| Oman(3) |
Mid-2016 |
0-14 |
877,433 |
36 |
89,451 |
5 |
966,884 |
22 |
9 |
| |
|
15-64 |
1,446,377 |
60 |
1,888,594 |
95 |
3,334,971 |
76 |
57 |
| |
|
65+ |
104,015 |
4 |
8,181 |
0 |
112,196 |
3 |
7 |
| Qatar (4) |
April 2010 |
0-14 |
96,811 |
40 |
135,773 |
9 |
232,584 |
14 |
58 |
| |
|
15-64 |
138,915 |
57 |
1,314,119 |
90 |
1,453,034 |
86 |
90 |
| |
|
65+ |
7,347 |
3 |
6,471 |
0 |
13,818 |
1 |
47 |
| Saudi Arabia (5) |
May 2016 |
0-14 |
6,090,383 |
30 |
1,774,545 |
15 |
7,864,928 |
25 |
23 |
| |
|
15-64 |
13,136,142 |
65 |
9,713,712 |
83 |
22,849,854 |
72 |
43 |
| |
|
65+ |
838,445 |
4 |
189,081 |
2 |
1,027,526 |
3 |
18 |
| United Arab Emirates (6) |
December 2005 |
0-14 |
313,872 |
38 |
486,699 |
15 |
800,571 |
20 |
61 |
| |
|
15-64 |
488,592 |
59 |
2,780,314 |
85 |
3,268,906 |
80 |
85 |
| |
|
65+ |
21,708 |
3 |
13,919 |
0 |
35,627 |
1 |
39 |
| GCC Total* |
|
0-14 |
8,070,467 |
32 |
2,966,331 |
13 |
11,036,798 |
23 |
27 |
|
|
15-64 |
16,439,342 |
64 |
19,001,247 |
85 |
35,440,589 |
74 |
54 |
|
|
65+ |
1,052,631 |
4 |
265,731 |
1 |
1,318,362 |
3 |
20 |
Sources: national institutes of statistics, latest year or period available as of 20 April 2017.
* Total provides the sum of population numbers at different dates. It is not exactly the total population at any of these dates.
1- Definition:
Non-nationals are:
1- persons bearing nationality of a foreign State other than the GCC State of residence, or bearing no proof of nationality from any given state (stateless persons and holders of refugee status and travel document in a third country) ;
2- Holders of residence permit residing in the given GCC country at date of census, as per definition of residence used in each of the countries.
2- Sources of data:
(1) Bahrain Central Informatics Organisation (CIO), Open data portal, Statistical Abstracts, “Population 2016” section http://www.data.gov.bh/en/ResourceCenter
(2) Kuwait Public Authority for Civil Information (PACI), “Population” Bulletin 2016, 31 December 2016
(3) National Centre for Statistical Information (NCSI), Bulletin of Population Statistics n°5, 2015
(4) Qatar Statistics Authority (QSA), Census 2010; http://gulfmigration.eu/population-aged-15-years-and-above-by-sex-10-years-age-groups-and-nationality-qatari-non-qatari-and-total-population-by-sex-and-5-years-age-groups-2010/
(5) Saudi Arabia General Authority for Statistics (GAStats), Demographic Survey 2016
(6) UAE National Bureau of Statistics (NBS), Census 2005.
| |
|
|
Nationals |
Non-nationals |
Total population |
| Country |
date/ period |
sex |
numbers |
men per 100 women |
numbers |
men per 100 women |
numbers |
men per 100 women |
| Bahrain (1) |
Mid-2016 |
males |
228,627 |
102 |
514,908 |
299 |
743,535 |
188 |
| |
|
females |
224,206 |
172,298 |
396,504 |
| Kuwait (2) |
December 2016 |
males |
412,023 |
92 |
1,879,898 |
239 |
2,291,921 |
186 |
| |
|
females |
445,576 |
785,483 |
1,231,059 |
| Oman(3) |
Mid-2016 |
males |
778,657 |
101 |
1,614,358 |
572 |
2,393,015 |
227 |
| |
|
females |
771,735 |
282,417 |
1,054,152 |
| Qatar (4) |
September 2016 |
males |
95,160 |
95 |
1,766,321 |
479 |
1,861,481 |
397 |
| |
|
females |
99,844 |
369,046 |
468,890 |
| Saudi Arabia (5) |
May 2016 |
males |
7,127,624 |
104 |
7,097,193 |
253 |
14,224,817 |
147 |
| |
|
females |
6,846,963 |
2,805,600 |
9,652,563 |
| United Arab Emirates* (6) |
mid-2010 |
males |
293,981 |
100 |
5,076,366 |
420 |
5,370,347 |
357 |
| |
|
females |
293,571 |
1,209,178 |
1,502,749 |
| GCC Total** |
|
males |
8,936,072 |
103 |
17,949,044 |
319 |
26,885,116 |
188 |
|
|
females |
8,681,895 |
5,624,022 |
14,305,917 |
Sources: national institutes of statistics, latest year or period available as of 20 April 2017.
* Our estimates of non-nationals aged 15 and above for 2010.
** Total provides the sum of population numbers at different dates. It is not exactly the total population at any of these dates.
1- Definition:
Non-nationals are:
1- persons bearing nationality of a foreign State other than the GCC State of residence, or bearing no proof of nationality from any given state (stateless persons and holders of refugee status and travel document in a third country) ;
2- Holders of residence permit residing in the given GCC country at date of census, as per definition of residence used in each of the countries.
Figures for Bahrain and the UAE are estimates.
2- Sources of data:
(1) Bahrain Central Informatics Organisation (CIO), Open data portal, Statistical Abstracts, “Population 2016” section http://www.data.gov.bh/en/ResourceCenter
(2) Kuwait Public Authority for Civil Information (PACI), “Population” Bulletin 2016, 31 December 2016
(3) National Centre for Statistical Information (NCSI), Bulletin of Population Statistics n°6, 2016
(4) Ministry of Development Planning and Statistics (MDPS), Labor Force Survey 2016, Third Quarter (July-September 2016).
(5) Saudi Arabia General Authority for Statistics (GAStats), Demographic Survey 2016
(6) UAE National Bureau of Statistics (NBS), our estimates from: http://www.uaestatistics.gov.ae/EnglishHome/ReportDetailsEnglish/tabid/121/Default.aspx?ItemId=1914&PTID=104&MenuId=1
|
Labour force |
|
males |
females |
Total |
| 2011 |
3,630,821 |
275,773 |
3,906,594 |
| 2012 |
3,733,727 |
310,637 |
4,044,364 |
| 2013 |
3,713,771 |
337,462 |
4,051,233 |
| 2014 |
4,052,256 |
392,244 |
4,444,500 |
| 2015 |
4,315,030 |
429,594 |
4,744,624 |
Source: Ministry of Human Resources and Emiratisation (MoHRE)
ANNEXED NOTE
1. Characteristics of data
The figures pertain to the number of workers registered in the UAE’s private sector, with the MoHRE.
No metadata is available. It is unclear whether or not figures include nationals, and unemployed persons.
Domestic workers are not included.
2. Institution which provides data
Ministry of Human Resources and Emiratisation (MOHRE): http://www.mohre.gov.ae/en/home.aspx
3. Data availability
The data is taken from the “open data” section of MoHRE website:
http://www.mohre.gov.ae/en/data-library.aspx
Data is available in PDF and Excel formats.
Date of access: March 2017.
|
date/ period |
Total population |
date/ period |
Nationals |
Non-nationals |
% in total population |
| Country |
Nationals |
Non-nationals |
| Bahrain (1) |
mid-2016 |
1,423,726 |
mid-2016 |
664,707 |
759,019 |
46.7 |
53.3 |
| Kuwait (2) |
31 December 2016 |
4,411,124 |
31 December 2016 |
1,337,693 |
3,073,431 |
30.3 |
69.7 |
| Oman (3) |
7 April 2017 |
4,599,051 |
7 April 2017 |
2,488,755 |
2,110,296 |
54.1 |
45.9 |
| Qatar (4) |
February 2017 |
2,673,022 |
April 2010 |
243,073 |
1,456,362 |
14.3 |
85,7 |
| Saudi Arabia (5) |
May 2016 |
31,742,308 |
May 2016 |
20,064,970 |
11,677,338 |
63.2 |
36.8 |
| United Arab Emirates (6) |
mid-2010 |
8,264,070 |
mid-2010 |
947,997 |
7,316,073 |
11.5 |
88.5 |
| Total* |
|
53,113,301 |
|
25,747,195 |
26,392,519 |
49.4 |
50.6 |
Sources: national institutes of statistics, latest year or period available as of 7 April 2017.
* Total provides the sum of population numbers at different dates. It is not exactly the total population at any of these dates.
1- Definition:
Non-nationals are:
1- persons bearing nationality of a foreign State other than the GCC State of residence, or bearing no proof of nationality from any given state (stateless persons and holders of refugee status and travel document in a third country) ;
2- Holders of residence permit residing in the given GCC country at date of census, as per definition of residence used in each of the countries.
Figures for Bahrain, Saudi Arabia and the UAE are estimates.
2- Sources of data:
(1) Bahrain Central Informatics Organisation (CIO), CIO’s website, “Statistics” and “Population” sections http://www.data.gov.bh/en/ResourceCenter
(2) Kuwait Public Authority for Civil Information (PACI), Statistical Reports, http://www.paci.gov.kw/en/
(3) National Centre for Statistical Information (NCSI), homepage as of 6 April 2017, https://www.ncsi.gov.om/Pages/NCSI.aspx
(4) Qatar Ministry of Development Planning and Statistics, homepage as of 6 April 2017, http://www.mdps.gov.qa/en/Pages/default.aspx; Qatar Statistics Authority (QSA), Census 2010, http://gulfmigration.eu/population-by-nationality-qatari-non-qatari-census-1970-2010/;
(5) Saudi Arabia General Authority for Statistics, Demographic Survey 2016, https://www.stats.gov.sa/sites/default/files/en-demographic-research-2016_4.pdf
(6) UAE National Bureau of Statistics (NBS)-now: Federal Competitiveness and Statistics Authority (FCSA), estimates. http://original.fcsa.gov.ae/EnglishHome/ReportDetailsEnglish/tabid/121/Default.aspx?ItemId=1914&PTID=104&MenuId=1
| Economic sector |
2015 |
| Construction |
1,550,459 |
| Trade and Repair Services |
1,122,943 |
| Manufacturing |
455,097 |
| Real Estate and Rental and Business Services |
543,321 |
| Transportation Storage and Communication |
358,041 |
| Hotels and Restaurants |
211,535 |
| Community and Personal Services and Other |
179,078 |
| Educational Services and Studies |
81,834 |
| Financial Intermediation |
60,385 |
| Others |
173,855 |
| Undefined |
8,076 |
| Total |
4,744,624 |
Source: Ministry of Human Resources and Emiratisation (MoHRE), 2015
ANNEXED NOTE
1. Characteristics of data
The figures pertain to the number of workers registered in the UAE’s private sector, with the MoHRE.
No definition of covered population or other metadata is available. It is unclear whether or not figures include nationals.
Domestic workers are not included.
2. Institution which provides data
Ministry of Human Resources and Emiratisation (MOHRE): http://www.mohre.gov.ae/en/home.aspx
3. Data availability
The data is taken from the “open data” section of MoHRE website:
http://www.mohre.gov.ae/en/data-library.aspx
Data is available in PDF and Excel formats.
Date of access: January 2017.
|
Labour force |
| 2004 |
2,013,523 |
| 2005 |
2,242,376 |
| 2006 |
2,567,349 |
| 2007 |
3,113,022 |
| 2008 |
4,079,453 |
| 2009 |
4,072,315 |
| 2010 |
3,880,494 |
| 2011 |
3,906,594 |
| 2012 |
4,044,364 |
| 2013 |
4,051,233 |
| 2014 |
4,444,500 |
| 2015 |
4,744,624 |
Source: Ministry of Human Resources and Emiratisation (MoHRE)
ANNEXED NOTE
1. Characteristics of data
The figures pertain to the number of workers registered in the UAE’s private sector, with the MoHRE.
No metadata is available. It is unclear whether or not figures include nationals, and unemployed persons.
Domestic workers are not included.
2. Institution which provides data
Ministry of Human Resources and Emiratisation (MOHRE): http://www.mohre.gov.ae/en/home.aspx
3. Data availability
The data is taken from the “open data” section of MoHRE website:
http://www.mohre.gov.ae/en/data-library.aspx
Data is available in PDF and Excel formats.
Date of access: March 2017.
| Economic Activity |
Males |
Females |
Total |
| Agriculture, forestry & fishing |
7.1 |
0.0 |
5.8 |
| Mining and quarrying |
3.7 |
0.4 |
3.0 |
| Manufacturing |
9.8 |
1.9 |
8.3 |
| Electricity, gas, steam & air conditioning supply |
0.8 |
0.1 |
0.6 |
| Water supply; sewerage, waste management & remediation activities |
0.6 |
0.0 |
0.5 |
| Construction |
25.7 |
1.6 |
21.0 |
| Wholesale & retail trade repair of motor vehicles and motorcycles |
7.2 |
2.3 |
6.2 |
| Transportation & storage |
5.6 |
0.8 |
4.7 |
| Accommodation & food service activities |
8.1 |
1.0 |
6.7 |
| Information & communication |
0.8 |
0.7 |
0.8 |
| Financial & insurance activities |
2.2 |
2.1 |
2.2 |
| Real estate activities |
0.7 |
0.4 |
0.6 |
| Professional, scientific & technical activities |
2.0 |
1.4 |
1.9 |
| Administrative & support service activities |
7.6 |
5.2 |
7.1 |
| Public administration & defence; compulsory social security |
3.0 |
1.2 |
2.6 |
| Education |
1.4 |
7.0 |
2.5 |
| Human health & social work activities |
1.8 |
6.7 |
2.7 |
| Arts, entertainment & recreation |
1.0 |
0.0 |
0.8 |
| Other service activities |
0.9 |
2.2 |
1.1 |
| Activities of households as employers; undifferentiated goods & services |
9.9 |
64.8 |
20.6 |
| Activities of extraterritorial organizations and bodies |
0.1 |
0.2 |
0.1 |
| Not Stated |
0.2 |
0.0 |
0.1 |
| Total |
100.0 |
100.0 |
100.0 |
Source: SCAD, Abu Dhabi
ANNEXED NOTE
1. Characteristics of data, definitions and population counting operations in the UAE
These are “estimates based on the labour force survey covering the fourth quarter of 2015”.
(Introduction to the Employment section of Abu Dhabi Statistical Yearbook 2016).
No numeric figures are available.
No metadata and methodological indications for the current Labour Force Survey are available.
Methodology for LFS 2013: https://www.scad.ae/MethodologyDocumentLib/Labour%20Force%20Survey%202013%20-%20Metho%20-%20En.pdf
2. Institution which provides data
Statistics centre of Abu Dhabi (SCAD), Abu Dhabi
3. Data availability
The data is taken from the Statistical Yearbook of Abu Dhabi for 2016 – Employment section
See https://www.scad.ae/en/pages/themesreleases.aspx?themeid=6#release-4 ;
Data is available under various formats (PDF, Excel, html).
Date of access: January 2017.
|
In the labour force |
Outside the labour force |
Grand Total |
|
Employed |
Unemployed |
Total in labour force |
Housewife |
Student |
Disabled |
Retired |
Other |
Total |
|
Seeking work for 1st time |
Unpd, with previous employment |
| Males |
64,101 |
211 |
40 |
64,352 |
0 |
17,064 |
986 |
10,505 |
896 |
29,451 |
93,803 |
| Females |
34,322 |
530 |
0 |
34,852 |
28,710 |
23,230 |
2,009 |
5,836 |
1,971 |
61,756 |
96,608 |
| Total |
98,423 |
741 |
40 |
99,204 |
28,710 |
40,294 |
2,995 |
16,341 |
2,867 |
91,207 |
190,411 |
| Males |
1,628,620 |
691 |
98 |
1,629,409 |
0 |
29,914 |
2,010 |
0 |
4,594 |
36,518 |
1,665,927 |
| Females |
226,395 |
1,567 |
52 |
228,014 |
91,097 |
25,964 |
1,424 |
0 |
4,871 |
123,356 |
351,370 |
| Total |
1,855,015 |
2,258 |
150 |
1,857,423 |
91,097 |
55,878 |
3,434 |
0 |
9,465 |
159,874 |
2,017,297 |
| Males |
1,692,721 |
902 |
138 |
1,693,761 |
0 |
46,978 |
2,996 |
10,505 |
5,490 |
65,969 |
1,759,730 |
| Females |
260,717 |
2,097 |
52 |
262,866 |
119,807 |
49,194 |
3,433 |
5,836 |
6,842 |
185,112 |
447,978 |
| Total |
1,953,438 |
2,999 |
190 |
1,956,627 |
119,807 |
96,172 |
6,429 |
16,341 |
12,332 |
251,081 |
2,207,708 |
Source: Annual Bulletin of Labor Force Sample survey 2015
ANNEXED NOTE
1. Technical Notes and Definitions
The data is taken from 2015 Labour Force Survey (yearly synthesis)
Sampling frame of LFS 2015: Population Census 2010.
Sample size: 44,756 persons, in 6,953 households: 1- Qatari households; 2- Non-Qatari regular (non-collective) households;
Data Collection: The sample was divided into equal parts to collect data monthly. Each month 1/3 of the quarterly data were collected during the first two weeks of the month.
Reference period for the labour force data: the week prior to data collection day.
Population of reference: all Qatari and non-Qatari households present in Qatar on the night of survey, living in normal and collective households.
The collective households are a group of persons not related to each other and sharing living conditions in a residential unit, I.e. labour camps, students living boarding schools, nurses in hospitals… etc. The survey covered the small collective households (includes less than 7 persons) and large collective households (includes 7 persons or more).
The survey did not cover short periods accommodation, i.e. hotels.
Relation to labour force (for persons aged 15 and above)
In the labour force (= economically active).
1) Employed.
All persons aged 15 years an above, who during the week preceding the survey:
a) Perform a work for a wage, salary, profits or household gains, whether it was in cash or in kind.
b) Are temporarily not employed, however, they still have an official relation with their work
2) Unemployed.
All persons aged 15 years and over who were, during the week preceding the survey, without employment, willing to work and looking seriously for a job.
There is a distinction between two kinds of unemployed persons:
a) First time unemployed: They are the persons who never worked previously, and were during the week preceding the survey looking actively for work.
b) Unemployed who previously worked: They are the persons with a work experience, who during the week preceding the survey were actively looking for a job
Outside the labour force (=economically inactive):
Full-time student: The person (15 years or older) enrolled in any educational institution as a full-time persistent student with purpose of attaining an academic degree, irrespective of whether the schooling hours are in the morning or evening. Any trainee enrolled in vocational training institutes is regarded as a full-time student.
Full-time housewife: The female (15 years or older) who is fully engaged in home management and family care, and does not practice any other work
Retired: The person who does not look for a job during the week preceding the survey and gets a fixed pension for work he/she had joined before
Disabled: The person (15 years or older) who is not capable of work due to illness, handicap or old age.
Others: Those able to work but not willing to, not enrolled in education, as well as any other cases encountered by the enumerator other than the above mentioned.
2. Institution which provides data
Ministry of Development Planning and Statistics
(http://www.mdps.gov.qa/en/pages/default.aspx)
3. Data availability
The Statistics Authority conducted the first labour Force Sample Survey in 2001. Starting from 2006, the execution of these surveys came to be on annual basis. Quarterly publications of Labour Force Surveys’ data are also available since 2012.
2015′ and earlier Labour Force Surveys can be downloaded from MDPS’s website, in PDF and Excel format:
http://www.mdps.gov.qa/en/statistics1/pages/topicslisting.aspx?parent=Social&child=LaborForce
See also Qatar Information Exchange for earlier Labour Force Surveys. QIX has also an interactive data base compiling data on the labour force taken from available surveys:
http://www.qix.gov.qa/portal/page/portal/qix/subject_area/Statistics?subject_area=183
Last date of access: February 2017.
|
Qatari |
Non-Qatari |
Total |
|
Males |
Females |
Total |
Males |
Females |
Total |
Males |
Females |
Total |
| Legislators, Senior Officials And Managers |
7,925 |
1,941 |
9,866 |
29,651 |
4,546 |
34,197 |
37,576 |
6,487 |
44,063 |
| Professionals |
13,505 |
15,709 |
29,214 |
103,542 |
36,625 |
140,167 |
117,047 |
52,334 |
169,381 |
| Technicians And Associate Professionals |
10,659 |
4,444 |
15,103 |
74,695 |
12,719 |
87,414 |
85,354 |
17,163 |
102,517 |
| Clerks |
14,798 |
9,488 |
24,286 |
55,979 |
16,017 |
71,996 |
70,777 |
25,505 |
96,282 |
| Service Workers And Shop And Market Sales Workers |
4,760 |
2,204 |
6,964 |
136,736 |
39,732 |
176,468 |
141,496 |
41,936 |
183,432 |
| Skilled Agricultural And Fishery Workers |
0 |
0 |
0 |
24,334 |
0 |
24,334 |
24,334 |
0 |
24,334 |
| Craft And Related Trades Workers |
5,826 |
0 |
5,826 |
662,478 |
701 |
663,179 |
668,304 |
701 |
669,005 |
| Plant And Machine Operators And Assemblers |
1,482 |
0 |
1,482 |
292,167 |
1,496 |
293,663 |
293,649 |
1,496 |
295,145 |
| Elementary Occupations |
5,186 |
536 |
5,722 |
249,136 |
114,611 |
363,747 |
254,322 |
115,147 |
369,469 |
| Total |
64,141 |
34,322 |
98,463 |
1,628,718 |
226,447 |
1,855,165 |
1,692,859 |
260,769 |
1,953,628 |
Source: Annual Bulletin of Labor Force Sample survey 2015
ANNEXED NOTE
1. Technical Notes and Definitions
The data is taken from 2015 Labour Force Survey (yearly synthesis)
Sampling frame of LFS 2015: Population Census 2010.
Sample size: 44,756 persons, in 6,953 households: 1- Qatari households; 2- Non-Qatari regular (non-collective) households;
Data Collection: The sample was divided into equal parts to collect data monthly. Each month 1/3 of the quarterly data were collected during the first two weeks of the month.
Reference period for the labour force data: the week prior to data collection day.
Population of reference: all Qatari and non-Qatari households present in Qatar on the night of survey, living in normal and collective households.
The collective households are a group of persons not related to each other and sharing living conditions in a residential unit, I.e. labour camps, students living boarding schools, nurses in hospitals… etc. The survey covered the small collective households (includes less than 7 persons) and large collective households (includes 7 persons or more).
The survey did not cover short periods accommodation, i.e. hotels.
Relation to labour force (for persons aged 15 and above)
In the labour force (= economically active).
1) Employed.
All persons aged 15 years an above, who during the week preceding the survey:
a) Perform a work for a wage, salary, profits or household gains, whether it was in cash or in kind.
b) Are temporarily not employed, however, they still have an official relation with their work
2) Unemployed.
All persons aged 15 years and over who were, during the week preceding the survey, without employment, willing to work and looking seriously for a job.
There is a distinction between two kinds of unemployed persons:
a) First time unemployed: They are the persons who never worked previously, and were during the week preceding the survey looking actively for work.
b) Unemployed who previously worked: They are the persons with a work experience, who during the week preceding the survey were actively looking for a job
Outside the labour force (=economically inactive):
Full-time student: The person (15 years or older) enrolled in any educational institution as a full-time persistent student with purpose of attaining an academic degree, irrespective of whether the schooling hours are in the morning or evening. Any trainee enrolled in vocational training institutes is regarded as a full-time student.
Full-time housewife: The female (15 years or older) who is fully engaged in home management and family care, and does not practice any other work
Retired: The person who does not look for a job during the week preceding the survey and gets a fixed pension for work he/she had joined before
Disabled: The person (15 years or older) who is not capable of work due to illness, handicap or old age.
Others: Those able to work but not willing to, not enrolled in education, as well as any other cases encountered by the enumerator other than the above mentioned.
Figures do not include persons seeking work for the first time
2. Institution which provides data
Ministry of Development Planning and Statistics
(http://www.mdps.gov.qa/en/pages/default.aspx)
3. Data availability
The Statistics Authority conducted the first labour Force Sample Survey in 2001. Starting from 2006, the execution of these surveys came to be on annual basis. Quarterly publications of Labour Force Surveys’ data are also available since 2012.
2015′ and earlier Labour Force Surveys can be downloaded from MDPS’s website, in PDF and Excel format:
http://www.mdps.gov.qa/en/statistics1/pages/topicslisting.aspx?parent=Social&child=LaborForce
See also Qatar Information Exchange for earlier Labour Force Surveys. QIX has also an interactive data base compiling data on the labour force taken from available surveys:
http://www.qix.gov.qa/portal/page/portal/qix/subject_area/Statistics?subject_area=183
Last date of access: February 2017.
|
Qatari |
Non-Qatari |
Total |
|
Males |
Females |
Total |
Males |
Females |
Total |
Males |
Females |
Total |
| Agriculture, forestry and fishing |
48 |
0 |
48 |
23,958 |
0 |
23,958 |
24,006 |
0 |
24,006 |
| Mining and quarrying |
7,737 |
1,790 |
9,527 |
87,123 |
5,234 |
92,357 |
94,860 |
7,024 |
101,884 |
| Manufacturing |
1,393 |
437 |
1,830 |
131,757 |
1,860 |
133,617 |
133,150 |
2,297 |
135,447 |
| Electricity, gas, steam and air conditioning supply |
1,261 |
710 |
1,971 |
17,572 |
229 |
17,801 |
18,833 |
939 |
19,772 |
| Water supply; sewerage, waste management and remediation activities |
222 |
229 |
451 |
12,124 |
561 |
12,685 |
12,346 |
790 |
13,136 |
| Construction |
1,495 |
139 |
1,634 |
779,033 |
4,408 |
783,441 |
780,528 |
4,547 |
785,075 |
| Wholesale and retail trade; repair of motor vehicles and motorcycles |
1,302 |
1,077 |
2,379 |
226,250 |
24,657 |
250,907 |
227,552 |
25,734 |
253,286 |
| Transportation and storage |
1,485 |
432 |
1,917 |
54,189 |
10,351 |
64,540 |
55,674 |
10,783 |
66,457 |
| Accommodation and food service activities |
482 |
469 |
951 |
37,366 |
12,711 |
50,077 |
37,848 |
13,180 |
51,028 |
| Information and communication |
2,224 |
803 |
3,027 |
8,096 |
2,415 |
10,511 |
10,320 |
3,218 |
13,538 |
| Financial and insurance activities |
1,577 |
1,681 |
3,258 |
7,739 |
4,546 |
12,285 |
9,316 |
6,227 |
15,543 |
| Real estate activities |
763 |
193 |
956 |
10,601 |
782 |
11,383 |
11,364 |
975 |
12,339 |
| Professional, scientific and technical activities |
222 |
230 |
452 |
26,747 |
1,647 |
28,394 |
26,969 |
1,877 |
28,846 |
| Administrative and support service activities |
513 |
687 |
1,200 |
51,107 |
3,490 |
54,597 |
51,620 |
4,177 |
55,797 |
| Public administration and defence; compulsory social security |
38,925 |
11,626 |
50,551 |
44,783 |
5,572 |
50,355 |
83,708 |
17,198 |
100,906 |
| Education |
2,116 |
9,660 |
11,776 |
13,891 |
25,292 |
39,183 |
16,007 |
34,952 |
50,959 |
| Human health and social work activities |
1,506 |
3,633 |
5,139 |
12,842 |
12,206 |
25,048 |
14,348 |
15,839 |
30,187 |
| Arts, entertainment and recreation |
547 |
419 |
966 |
12,514 |
1,079 |
13,593 |
13,061 |
1,498 |
14,559 |
| Other service activities |
228 |
100 |
328 |
10,686 |
3,021 |
13,707 |
10,914 |
3,121 |
14,035 |
| Activities of households as employers; undifferentiated goods- and services-producing activities of households for own use |
0 |
0 |
0 |
57,199 |
105,177 |
162,376 |
57,199 |
105,177 |
162,376 |
| Activities of extraterritorial organizations and bodies |
95 |
7 |
102 |
3,141 |
1,209 |
4,350 |
3,236 |
1,216 |
4,452 |
| Total |
64,141 |
34,322 |
98,463 |
1,628,718 |
226,447 |
1,855,165 |
1,692,859 |
260,769 |
1,953,628 |
Source: Annual Bulletin of Labor Force Sample survey 2015
ANNEXED NOTE
1. Technical Notes and Definitions
The data is taken from 2015 Labour Force Survey (yearly synthesis)
Sampling frame of LFS 2015: Population Census 2010.
Sample size: 44,756 persons, in 6,953 households: 1- Qatari households; 2- Non-Qatari regular (non-collective) households;
3- Non-Qatari small collective households or labour gatherings (2 – 6 persons); 4- Non-Qatari large collective households or large labour gatherings (7 persons or more).
Data Collection: The sample was divided into equal parts to collect data monthly. Each month 1/3 of the quarterly data were collected during the first two weeks of the month.
Reference period for the labour force data: the week prior to data collection day.
Population of reference: all Qatari and non-Qatari households present in Qatar on the night of survey, living in normal and collective households.
The collective households are a group of persons not related to each other and sharing living conditions in a residential unit, I.e. labour camps, students living boarding
schools, nurses in hospitals… etc. The survey covered the small collective households (includes less than 7 persons) and large collective households (includes 7 persons or more).
The survey did not cover short periods accommodation, i.e. hotels.
The present data includes active population, i.e. employed and unemployed. It does not include persons seeking work for the first time
Relation to labour force (for persons aged 15 and above)
In the labour force (= economically active).
1) Employed.
All persons aged 15 years an above, who during the week preceding the survey:
a) Perform a work for a wage, salary, profits or household gains, whether it was in cash or in kind.
b) Are temporarily not employed, however, they still have an official relation with their work
2) Unemployed.
All persons aged 15 years and over who were, during the week preceding the survey, without employment, willing to work and looking seriously for a job.
There is a distinction between two kinds of unemployed persons:
a) First time unemployed: They are the persons who never worked previously, and were during the week preceding the survey looking actively for work.
b) Unemployed who previously worked: They are the persons with a work experience, who during the week preceding the survey were actively looking for a job
Classification of economic activities: ISIC Rev. 4.
2. Institution which provides data
Ministry of Development Planning and Statistics
(http://www.mdps.gov.qa/en/pages/default.aspx)
3. Data availability
The Statistics Authority conducted the first labour Force Sample Survey in 2001. Starting from 2006, the execution of these surveys came to be on annual basis.
Quarterly publications of Labour Force Surveys’ data are also available since 2012.
2015′ and earlier Labour Force Surveys can be downloaded from MDPS’s website, in PDF and Excel format:
http://www.mdps.gov.qa/en/statistics1/pages/topicslisting.aspx?parent=Social&child=LaborForce
See also Qatar Information Exchange for earlier Labour Force Surveys. QIX has also an interactive data base compiling data on the labour force taken from available surveys:
http://www.qix.gov.qa/portal/page/portal/qix/subject_area/Statistics?subject_area=183
Last date of access: January 2017.
|
occupation/ profession |
| Legislators, Senior Officials and Managers |
Professionals |
Technicians and Associate Professionals |
Clerks |
Service Workers and Shop and Market Sales Workers |
Skilled Agricultural and Fishery Workers |
Craft and Related Trades Workers |
Plant and Machine Operators And Assemblers |
Elementary Occupations |
Total |
| Agriculture, forestry and fishing |
100 |
542 |
245 |
307 |
1,664 |
17,411 |
795 |
524 |
2,370 |
23,958 |
| Mining and quarrying |
5,431 |
11,323 |
8,665 |
3,761 |
2,600 |
176 |
35,593 |
12,598 |
12,210 |
92,357 |
| Manufacturing |
3,923 |
8,651 |
8,643 |
2,913 |
5,573 |
0 |
60,120 |
28,896 |
14,898 |
133,617 |
| Electricity, gas, steam and air conditioning supply |
554 |
2,343 |
4,111 |
2,004 |
2,151 |
0 |
3,206 |
2,528 |
904 |
17,801 |
| Water supply; sewerage, waste management and remediation activities |
0 |
6,120 |
1,223 |
3,189 |
1,494 |
0 |
627 |
32 |
0 |
12,685 |
| Construction |
6,677 |
30,797 |
26,813 |
14,060 |
17,322 |
722 |
454,288 |
125,100 |
107,662 |
783,441 |
| Wholesale and retail trade; repair of motor vehicles and motorcycles |
7,253 |
13,475 |
8,887 |
15,292 |
66,644 |
368 |
66,115 |
26,816 |
46,057 |
250,907 |
| Transportation and storage |
887 |
4,153 |
7,581 |
4,493 |
6,767 |
0 |
5,765 |
25,265 |
9,629 |
64,540 |
| Accommodation and food service activities |
469 |
1,158 |
2,060 |
1,782 |
23,535 |
48 |
3,413 |
2,972 |
14,640 |
50,077 |
| Information and communication |
1,136 |
4,558 |
1,565 |
594 |
153 |
0 |
982 |
680 |
843 |
10,511 |
| Financial and insurance activities |
1,999 |
3,877 |
129 |
2,057 |
1,092 |
0 |
45 |
39 |
3,047 |
12,285 |
| Real estate activities |
506 |
748 |
653 |
1,251 |
1,913 |
0 |
1,524 |
704 |
4,084 |
11,383 |
| Professional, scientific and technical activities |
1,084 |
3,498 |
1,541 |
1,192 |
1,130 |
0 |
10,540 |
3,462 |
5,947 |
28,394 |
| Administrative and support service activities |
252 |
1,913 |
1,361 |
2,708 |
3,064 |
1,327 |
8,202 |
5,747 |
30,023 |
54,597 |
| Public administration and defence; compulsory social security |
673 |
9,989 |
5,035 |
10,465 |
3,513 |
2,284 |
4,364 |
4,857 |
9,175 |
50,355 |
| Education |
1,934 |
23,065 |
1,822 |
1,279 |
7,169 |
6 |
19 |
1,317 |
2,572 |
39,183 |
| Human health and social work activities |
428 |
9,732 |
4,470 |
2,060 |
2,539 |
366 |
506 |
1,511 |
3,436 |
25,048 |
| Arts, entertainment and recreation |
445 |
1,396 |
1,232 |
580 |
287 |
297 |
4,356 |
2,943 |
2,057 |
13,593 |
| Other service activities |
48 |
1,543 |
383 |
716 |
2,747 |
237 |
1,680 |
1,321 |
5,032 |
13,707 |
| Activities of households as employers; undifferentiated goods- and services-producing activities of households for own use |
0 |
154 |
388 |
688 |
24,701 |
1,008 |
609 |
46,351 |
88,477 |
162,376 |
| Activities of extraterritorial organizations and bodies |
398 |
1,132 |
607 |
605 |
410 |
84 |
430 |
0 |
684 |
4,350 |
| Total |
34,197 |
140,167 |
87,414 |
71,996 |
176,468 |
24,334 |
663179 |
293,663 |
363,747 |
1,855,165 |
Source: Annual Bulletin of Labor Force Sample survey 2015
ANNEXED NOTE
1. Technical Notes and Definitions
The data is taken from 2015 Labour Force Survey (yearly synthesis)
Sampling frame of LFS 2015: Population Census 2010.
Sample size: 44,756 persons, in 6,953 households: 1- Qatari households; 2- Non-Qatari regular (non-collective) households;
3- Non-Qatari small collective households or labour gatherings (2 – 6 persons); 4- Non-Qatari large collective households or large labour gatherings (7 persons or more).
Data Collection: The sample was divided into equal parts to collect data monthly. Each month 1/3 of the quarterly data were collected during the first two weeks of the month.
Reference period for the labour force data: the week prior to data collection day.
Population of reference: all Qatari and non-Qatari households present in Qatar on the night of survey, living in normal and collective households.
The collective households are a group of persons not related to each other and sharing living conditions in a residential unit, I.e. labour camps, students living boarding
schools, nurses in hospitals… etc. The survey covered the small collective households (includes less than 7 persons) and large collective households (includes 7 persons or more).
The survey did not cover short periods accommodation, i.e. hotels.
The present data includes active population, i.e. employed and unemployed. It does not include persons seeking work for the first time
Relation to labour force (for persons aged 15 and above)
In the labour force (= economically active).
1) Employed.
All persons aged 15 years an above, who during the week preceding the survey:
a) Perform a work for a wage, salary, profits or household gains, whether it was in cash or in kind.
b) Are temporarily not employed, however, they still have an official relation with their work
2) Unemployed.
All persons aged 15 years and over who were, during the week preceding the survey, without employment, willing to work and looking seriously for a job.
There is a distinction between two kinds of unemployed persons:
a) First time unemployed: They are the persons who never worked previously, and were during the week preceding the survey looking actively for work.
b) Unemployed who previously worked: They are the persons with a work experience, who during the week preceding the survey were actively looking for a job
Classification of economic activities: ISIC Rev. 4.
2. Institution which provides data
Ministry of Development Planning and Statistics
(http://www.mdps.gov.qa/en/pages/default.aspx)
3. Data availability
The Statistics Authority conducted the first labour Force Sample Survey in 2001. Starting from 2006, the execution of these surveys came to be on annual basis.
Quarterly publications of Labour Force Surveys’ data are also available since 2012.
2015′ and earlier Labour Force Surveys can be downloaded from MDPS’s website, in PDF and Excel format:
http://www.mdps.gov.qa/en/statistics1/pages/topicslisting.aspx?parent=Social&child=LaborForce
See also Qatar Information Exchange for earlier Labour Force Surveys. QIX has also an interactive data base compiling data on the labour force taken from available surveys:
http://www.qix.gov.qa/portal/page/portal/qix/subject_area/Statistics?subject_area=183
Last date of access: January 2017.
| Nationality |
Sex |
Average daily working hours |
Total |
| less than 7 hours |
7 to 8 hours |
9 to 10 hours |
11 to 12 hours |
13 hours and above |
| Emirati |
Male |
0.8 |
92.8 |
5.2 |
1.1 |
0.1 |
100.0 |
| Female |
0.4 |
92.4 |
6.4 |
0.8 |
0.0 |
100.0 |
| Total |
0.7 |
92.6 |
5.6 |
1.0 |
0.1 |
100.0 |
| Non Emirati |
Male |
0.3 |
50.2 |
34.2 |
15.2 |
0.1 |
100.0 |
| Female |
2.5 |
43.6 |
39.0 |
14.6 |
0.3 |
100.0 |
| Total |
0.6 |
49.2 |
35.0 |
15.1 |
0.1 |
100.0 |
| Total |
Male |
0.3 |
51.6 |
33.3 |
14.7 |
0.1 |
100.0 |
| Female |
2.3 |
48.2 |
36.0 |
13.3 |
0.2 |
100.0 |
| Total |
0.6 |
51.0 |
33.8 |
14.5 |
0.1 |
100.0 |
Source : Dubai Statistics Center, Labor Force Survey 2015
ANNEXED NOTE
1. Characteristics of data, definitions
DSC has been conducting Labour Force Surveys on Dubai Emirate in 2008, 2009, and yearly since 2011.
Sample of LFS 2015: 3000 households (1500 Emirati households,1500 foreign households), as well as 1000 workers from workers’ communities.
The sample only includes permanent residents of Dubai and not residents of other emirates working in Dubai. The sample only takes into acco tthe population aged fifteen years and above.
Date of reference: ? 2015.
The time reference of the survey is:
Visit day is the time reference for the family personal data.
The week ended on the visit day is the time reference for the employment status (employed / unemployed).
Month ended on the visit day is the time reference for job search.
The two years ended on the visit day represent the time reference for training of people who are unemployed and seeking a job.
2. Institution which provides data
Dubai Statistics Centre (DSC).
3. Data availability
The publication of Dubai Labour Force Surveys 2015 IS available (in English, PDF format) at:
https://www.dsc.gov.ae/Publication/Bulletin%20of%20Labor%20Force%20Survey%20Results%202015.pdf
Additional tables from 2015 Labour Force Survey are published separately under the “reports” section:
https://www.dsc.gov.ae/en-us/Themes/Pages/Labour.aspx?Theme=41#DSC_Tab1
Last date of access: October 5, 2016.
|
Nationality |
|
|
|
|
|
|
|
|
|
Emiratis |
|
|
Non Emiratis |
|
|
Total |
|
|
| Sex |
Males |
Females |
Total |
Males |
Females |
Total |
Males |
Females |
Total |
| Agriculture. forestry and fishing |
0.5 |
0 |
0.3 |
0.2 |
0 |
0.2 |
0.2 |
0 |
0.2 |
| Mining and quarrying |
2.6 |
0.4 |
1.8 |
0.4 |
0.4 |
0.4 |
0.5 |
0.4 |
0.5 |
| Manufacturing |
2.7 |
1.5 |
2.3 |
10.7 |
2.7 |
9.4 |
10.4 |
2.6 |
9.1 |
| Electricity. gas. steam and air conditioning supply |
2.1 |
4.3 |
2.9 |
0.5 |
0.4 |
0.5 |
0.5 |
0.8 |
0.6 |
| Water supply; sewerage. waste management and remediation activities |
0 |
0 |
0 |
0.7 |
0 |
0.6 |
0.7 |
0 |
0.6 |
| Construction |
0.9 |
0.1 |
0.6 |
29.3 |
1.5 |
24.8 |
28.4 |
1.4 |
23.8 |
| Wholesale and retail trade; repair of motor vehicles and motorcycles |
7 |
6.1 |
6.6 |
14.7 |
13.2 |
14.5 |
14.5 |
12.5 |
14.1 |
| Transportation and storage |
7.3 |
6.6 |
7 |
8.3 |
3.7 |
7.5 |
8.2 |
4 |
7.5 |
| Accommodation and food service activities |
0.5 |
0.2 |
0.4 |
5.6 |
10.8 |
6.4 |
5.4 |
9.8 |
6.1 |
| Information and communication |
2 |
1.8 |
2 |
1.9 |
1.3 |
1.8 |
1.9 |
1.4 |
1.8 |
| Financial and insurance activities |
5 |
18.3 |
10 |
2.1 |
4.7 |
2.5 |
2.2 |
6 |
2.9 |
| Real estate activities |
2.7 |
1.6 |
2.3 |
1.7 |
1.1 |
1.6 |
1.7 |
1.1 |
1.6 |
| Professional. scientific and technical activities |
1 |
0.9 |
1 |
2.1 |
2.8 |
2.2 |
2.1 |
2.6 |
2.1 |
| Administrative and support service activities |
1.6 |
1.2 |
1.4 |
14.5 |
4.7 |
12.9 |
14.1 |
4.4 |
12.4 |
| Public administration and defence; compulsory social security |
61.6 |
45.5 |
55.5 |
2.1 |
1.5 |
2 |
4 |
5.6 |
4.3 |
| Education |
1 |
6.5 |
3.1 |
1.2 |
7.1 |
2.2 |
1.2 |
7 |
2.2 |
| Human health and social work activities |
0.7 |
4.4 |
2.1 |
0.8 |
5.5 |
1.6 |
0.8 |
5.4 |
1.6 |
| Arts. entertainment and recreation |
0.8 |
0.5 |
0.7 |
0.8 |
0.3 |
0.7 |
0.8 |
0.3 |
0.7 |
| Other service activities |
0.1 |
0 |
0.1 |
0.8 |
1.5 |
0.9 |
0.8 |
1.3 |
0.9 |
| Activities of households as employers |
0 |
0 |
0 |
1.5 |
36.8 |
7.2 |
1.4 |
33.3 |
6.9 |
| Activities of extraterritorial organizations and bodies |
0.1 |
0 |
0 |
0 |
0.2 |
0.1 |
0 |
0.1 |
0.1 |
| Total |
100 |
100 |
100 |
100 |
100 |
100 |
100 |
100 |
100 |
Source : Dubai Statistics Center. Labor Force Survey 2015
ANNEXED NOTE
1. Characteristics of data, definitions
DSC has been conducting Labour Force Surveys on Dubai Emirate in 2008, 2009, and yearly since 2011.
Sample of LFS 2015: 3000 households (1500 Emirati households,1500 foreign households), as well as 1000 workers from workers’ communities. The sample only includes permanent residents of Dubai and not residents of other emirates working in Dubai. The sample only takes into acco tthe population aged fifteen years and above.
Date of reference: ? 2015.
The time reference of the survey is:
Visit day is the time reference for the family personal data.
The week ended on the visit day is the time reference for the employment status (employed / unemployed).
Month ended on the visit day is the time reference for job search.
The two years ended on the visit day represent the time reference for training of people who are unemployed and seeking a job.
2. Institution which provides data
Dubai Statistics Centre (DSC).
3. Data availability
The publication of Dubai Labour Force Surveys 2015 IS available (in English, PDF format) at:
https://www.dsc.gov.ae/Publication/Bulletin%20of%20Labor%20Force%20Survey%20Results%202015.pdf
Additional tables from 2015 Labour Force Survey are published separately under the “reports” section:
https://www.dsc.gov.ae/en-us/Themes/Pages/Labour.aspx?Theme=41#DSC_Tab1
Last date of access: October 5, 2016.
| Nationality |
Kuwaiti |
Non-Kuwaiti |
Total |
| Governorate |
Male |
Female |
Total |
Male |
Female |
Total |
Male |
Female |
Total |
| Capital Governorate |
115,876 |
122,394 |
238,270 |
186,478 |
121,675 |
308,153 |
302,354 |
244,069 |
546,423 |
| Hawalli Governorate |
110,279 |
113,565 |
223,844 |
397,090 |
294,568 |
691,658 |
507,369 |
408,133 |
915,502 |
| Al-Ahmadi Governorate |
136,924 |
140,079 |
277,003 |
448,343 |
153,081 |
601,424 |
585,267 |
293,160 |
878,427 |
| Al-jahra Governorate |
90,434 |
94,966 |
185,400 |
203,449 |
128,657 |
332,106 |
293,883 |
223,623 |
517,506 |
| Al-Farwaniya Governorate |
112,987 |
118,967 |
231,954 |
675,892 |
225,710 |
901,602 |
788,879 |
344,677 |
1,133,556 |
| Mubarak Al-Kabeer Governorate |
74,637 |
76,238 |
150,875 |
50,149 |
41,487 |
91,636 |
124,786 |
117,725 |
242,511 |
| Not Stated |
145 |
114 |
259 |
2,863 |
1,959 |
4,822 |
3,008 |
2,073 |
5,081 |
| Total |
641,282 |
666,323 |
1,307,605 |
1,964,264 |
967,137 |
2,931,401 |
2,605,546 |
1,633,460 |
4,239,006 |
Source: PACI
ANNEXED NOTE
1. Characteristics of data and definitions
The source of data used here is the Public Authority for Civil Information (PACI), an independant government body in charge of :
1- centralising all population and labour force data in order to manage a fully computerised population register
2- issuing mandatory civil identification cards to every resident of the country, regardless of age and nationality.
The other source of demographic and socioeconomic data on Kuwait is the Central Statistical Office (CSO), operating within the Planning Ministry. The CSO has conducted ten population and housing censuses since its inception in 1957.
(a) Kuwaiti: the Kuwaiti nationality rests upon a document of Kuwaiti nationality or a certificate proving Kuwaiti nationality issued by the Ministry of Interior of Kuwait.
(b) Non-Kuwaiti: his/ her nationality is determined by the name of the State having issued the passport. The foreign national also entered Kuwait legally and has a stamp of residence.
This category includes the Bidoon, a category of stateless persons living in the Emirate. Kuwait’s Bidoon population originates from three broad categories:
1) those whose ancestors failed to apply for nationality or lacked necessary documentation at the time of Kuwait’s independence in 1961;
2) those recruited to work in Kuwait’s army or police force during the 1960s who permanently settled in Kuwait, along with their families;
3) children of Kuwaiti mothers and stateless or foreign fathers (see Human Rights Watch. Prisoners of the Past. Kuwaiti Bidun and the Burden of Statelessness, June 2011, p. 3).
2. Institution which provides data
The Public Authority for Civil Information (PACI)
3. Period of data coverage: December 2015
The database is updated three times a year and the website presents only the most recent data.
4. Data availability
The statistics section of PACI’s website (http://www.paci.gov.kw/en/ (English); http://www.paci.gov.kw/ (Arabic)) provides population and socio-economic data broken down by nationality (Kuwaiti/ non-Kuwaiti). Some data are displayed by nationality groups.
Analytical tables and data crosstabulations are available for download in PDF, html, .png and Excel (.csv) formats.
The “publications” section also proposes a selection of data tables processed thematically in downloadable Excel and PDF format (English and Arabic):
https://www.paci.gov.kw/stat/GeneralStat.aspx
The present data is in the “Population” file.
Date of access: May 2016
| |
Nationality |
| Kuwaiti |
Non-Kuwaiti |
Total |
| Male |
Female |
Total |
Male |
Female |
Total |
Male |
Female |
Total |
| Less than 5 |
84,167 |
81,130 |
165,297 |
79,316 |
75,699 |
155,015 |
163,483 |
156,829 |
320,312 |
| 5-9 |
83,395 |
80,574 |
163,969 |
72,378 |
69,108 |
141,486 |
155,773 |
149,682 |
305,455 |
| 10-14 |
73,098 |
71,380 |
144,478 |
53,558 |
49,664 |
103,222 |
126,656 |
121,044 |
247,700 |
| 15-19 |
67,634 |
64,486 |
132,120 |
43,830 |
41,004 |
84,834 |
111,464 |
105,490 |
216,954 |
| 20-24 |
61,698 |
59,807 |
121,505 |
115,480 |
54,953 |
170,433 |
177,178 |
114,760 |
291,938 |
| 25-29 |
54,189 |
54,522 |
108,711 |
287,241 |
142,272 |
429,513 |
341,430 |
196,794 |
538,224 |
| 30-34 |
45,544 |
48,744 |
94,288 |
320,317 |
145,759 |
466,076 |
365,861 |
194,503 |
560,364 |
| 35-39 |
37,905 |
41,899 |
79,804 |
310,955 |
128,806 |
439,761 |
348,860 |
170,705 |
519,565 |
| 40-44 |
32,882 |
37,361 |
70,243 |
236,981 |
98,121 |
335,102 |
269,863 |
135,482 |
405,345 |
| 45-49 |
28,399 |
32,795 |
61,194 |
188,563 |
72,587 |
261,150 |
216,962 |
105,382 |
322,344 |
| 50-54 |
23,120 |
27,282 |
50,402 |
118,541 |
41,402 |
159,943 |
141,661 |
68,684 |
210,345 |
| 55-59 |
16,445 |
21,711 |
38,156 |
74,643 |
22,897 |
97,540 |
91,088 |
44,608 |
135,696 |
| 60-64 |
12,069 |
16,311 |
28,380 |
37,060 |
11,972 |
49,032 |
49,129 |
28,283 |
77,412 |
| 65-69 |
7,582 |
11,524 |
19,106 |
15,282 |
6,073 |
21,355 |
22,864 |
17,597 |
40,461 |
| 70-74 |
5,647 |
7,829 |
13,476 |
5,933 |
3,151 |
9,084 |
11,580 |
10,980 |
22,560 |
| 75-79 |
4,168 |
4,808 |
8,976 |
2,675 |
1,900 |
4,575 |
6,843 |
6,708 |
13,551 |
| 80-84 |
1,975 |
2,543 |
4,518 |
1,046 |
997 |
2,043 |
3,021 |
3,540 |
6,561 |
| 85+ |
1,365 |
1,617 |
2,982 |
465 |
772 |
1,237 |
1,830 |
2,389 |
4,219 |
| Total |
641,282 |
666,323 |
1,307,605 |
1,964,264 |
967,137 |
2,931,401 |
2,605,546 |
1,633,460 |
4,239,006 |
Source: PACI
ANNEXED NOTE
1. Characteristics of data and definitions
The source of data used here is the Public Authority for Civil Information (PACI), an independant government body in charge of :
1- centralising all population and labour force data in order to manage a fully computerised population register
2- issuing mandatory civil identification cards to every resident of the country, regardless of age and nationality.
The other source of demographic and socioeconomic data on Kuwait is the Central Statistical Office (CSO), operating within the Planning Ministry. The CSO has conducted ten population and housing censuses since its inception in 1957.
Since 1995 a marked discrepancy was witnessed between PACI’ and CSO’ population figures. PACI’ database is connected electronically with other administrations and bodies registering demographic events and professional/ residency issues (births and death; departures and arrivals; end of service, residency and ID deliveries, etc.).
PACI’s records of residents’ movements is thus regularly updated, which limits the risk of population overcount. Therefore, it is more likely that residents were undercounted during CSO- Ministry of Planning’s census operations (see: Shah, N. Population of Kuwait. Structure and Dynamics, Kuwait: Kuwait University Academic Publication Council, 2010, chapter 1).
(a) Kuwaiti: the Kuwaiti nationality rests upon a document of Kuwaiti nationality or a certificate proving Kuwaiti nationality issued by the Ministry of Interior of Kuwait.
(b) Non-Kuwaiti: his/ her nationality is determined by the name of the State which issued the passport. The foreign national also entered Kuwait legally and has a stamp of residence.
This category includes the Bidoon, a category of stateless persons living in the Emirate. Kuwait’s Bidoon population originates from three broad categories:
1) those whose ancestors failed to apply for nationality or lacked necessary documentation at the time of Kuwait’s independence in 1961;
2) those recruited to work in Kuwait’s army or police force during the 1960s who permanently settled in Kuwait, along with their families;
3) children of Kuwaiti mothers and stateless or foreign fathers (see Human Rights Watch. Prisoners of the Past. Kuwaiti Bidun and the Burden of Statelessness, June 2011, p. 3).
(The children of Kuwaiti mothers and non-Kuwaiti fathers (with specific nationality) inherit the father’s nationality. They are stateless if the father is stateless).
2. Institution which provides data
The Public Authority for Civil Information (PACI)
3. Period of data coverage: 31 December 2015
The database is updated three times a year and the website presents only the most recent data.
4. Data availability
The statistics section of PACI’s website (http://www.paci.gov.kw/en/ (English); http://www.paci.gov.kw/ (Arabic)) provides population and socio-economic data broken down by nationality (Kuwaiti/ non-Kuwaiti). Some data are displayed by nationality groups.
Analytical tables and data crosstabulations are available for download in PDF, html, .png and Excel (.csv) formats.
The “publications” section also proposes a selection of data tables processed thematically in downloadable Excel and PDF format (English and Arabic):
https://www.paci.gov.kw/stat/GeneralStat.aspx
The present data is in the “Population” file.
Date of access: May 2016
|
Males |
Females |
Total |
| Kuwaitis |
641,282 |
666,323 |
1,307,605 |
| Arabs |
778,883 |
398,656 |
1,177,539 |
| Asians |
1,154,479 |
503,729 |
1,658,208 |
| Africans |
8,003 |
48,081 |
56,084 |
| Europeans |
8,597 |
7,301 |
15,898 |
| N. Americans |
12,411 |
7,976 |
20,387 |
| S. Americans |
935 |
689 |
1,624 |
| Australians/ Oceanians |
956 |
705 |
1,661 |
| Non-Kuwaitis |
1,964,264 |
967,137 |
2,931,401 |
| Total |
2,605,546 |
1,633,460 |
4,239,006 |
Source: PACI
ANNEXED NOTE
1. Characteristics of data and definitions
The source of data used here is the Public Authority for Civil Information (PACI), an independant government body in charge of :
1- centralising all population and labour force data in order to manage a fully computerised population register
2- issuing mandatory civil identification cards to every resident of the country, regardless of age and nationality.
The other source of demographic and socioeconomic data on Kuwait is the Central Statistical Office (CSO), operating within the Planning Ministry. The CSO has conducted ten population and housing censuses since its inception in 1957.
Since 1995 a marked discrepancy was witnessed between PACI’ and CSO’ population figures. PACI’ database is connected electronically with other administrations and bodies registering demographic events and professional/ residency issues (births and death; departures and arrivals; end of service, residency and ID deliveries, etc.).
PACI’s records of residents’ movements is thus regularly updated, which limits the risk of population overcount. Therefore, it is more likely that residents were undercounted during CSO- Ministry of Planning’s census operations (see: Shah, N. Population of Kuwait. Structure and Dynamics, Kuwait: Kuwait University Academic Publication Council, 2010, chapter 1).
(a) Kuwaiti: the Kuwaiti nationality rests upon a document of Kuwaiti nationality or a certificate proving Kuwaiti nationality issued by the Ministry of Interior of Kuwait.
(b) Non-Kuwaiti: his/ her nationality is determined by the name of the State which issued the passport. The foreign national also entered Kuwait legally and has a stamp of residence.
This category includes the Bidoon, a category of stateless persons living in the Emirate. Kuwait’s Bidoon population originates from three broad categories:
1) those whose ancestors failed to apply for nationality or lacked necessary documentation at the time of Kuwait’s independence in 1961;
2) those recruited to work in Kuwait’s army or police force during the 1960s who permanently settled in Kuwait, along with their families;
3) children of Kuwaiti mothers and stateless or foreign fathers (see Human Rights Watch. Prisoners of the Past. Kuwaiti Bidun and the Burden of Statelessness, June 2011, p. 3).
(The children of Kuwaiti mothers and non-Kuwaiti fathers (with specific nationality) inherit the father’s nationality. They are stateless if the father is stateless).
(c) Nationality group: collected according to the nationality of the head of the household.
Nationalities are grouped according to specific features common to certain population subgroups: language, geographic origin, etc. or according to internationally recognized categories such as: (Arab / non-Arab Asian countries / non-Arab African countries; European countries … etc.).
2. Institution which provides data
The Public Authority for Civil Information (PACI)
3. Period of data coverage: 31 December 2015
The database is updated three times a year and the website presents only the most recent data.
4. Data availability
The statistics section of PACI’s website (http://www.paci.gov.kw/en/ (English); http://www.paci.gov.kw/ (Arabic)) provides population and socio-economic data broken down by nationality (Kuwaiti/ non-Kuwaiti). Some data are displayed by nationality groups.
Analytical tables and data crosstabulations are available for download in PDF, html, .png and Excel (.csv) formats.
The “publications” section also proposes a selection of data tables processed thematically in downloadable Excel and PDF format (English and Arabic):
http://www.paci.gov.kw/stat/en/index.php/component/content/article?id=99
http://www.paci.gov.kw/stat/index.php/component/content/article?id=194
The present data is in the “Population” file.
Date of access: May 2016
| Locality |
Gender |
Nationality group |
| Kuwaitis |
Arabs |
Asians |
Africans |
Europeans |
N. Americans |
S. Americans |
Australians/ Oceanians |
Total non-Kuwaitis |
Total |
| Capital Governorate |
Males |
115,876 |
49,166 |
134,393 |
895 |
869 |
996 |
80 |
79 |
186,478 |
302,354 |
| Females |
122,394 |
22,863 |
87,425 |
9,646 |
800 |
843 |
51 |
47 |
121,675 |
244,069 |
| Total |
238,270 |
72,029 |
221,818 |
10,541 |
1,669 |
1,839 |
131 |
126 |
308,153 |
546,423 |
| Hawalli Governorate |
Males |
110,279 |
221,669 |
163,851 |
1,148 |
4,393 |
5,207 |
331 |
491 |
397,090 |
507,369 |
| Females |
113,565 |
134,737 |
139,215 |
11,390 |
4,280 |
4,266 |
275 |
405 |
294,568 |
408,133 |
| Total |
223,844 |
356,406 |
303,066 |
12,538 |
8,673 |
9,473 |
606 |
896 |
691,658 |
915,502 |
| Al-Ahmadi Governorate |
Males |
136,924 |
106,973 |
331,673 |
2,019 |
2,217 |
5,013 |
241 |
207 |
448,343 |
585,267 |
| Females |
140,079 |
54,053 |
88,632 |
6,948 |
1,224 |
1,919 |
171 |
134 |
153,081 |
293,160 |
| Total |
277,003 |
161,026 |
420,305 |
8,967 |
3,441 |
6,932 |
412 |
341 |
601,424 |
878,427 |
| Al-jahra Governorate |
Males |
90,434 |
111,695 |
89,669 |
1,438 |
210 |
250 |
119 |
68 |
203,449 |
293,883 |
| Females |
94,966 |
85,476 |
35,648 |
7,018 |
187 |
206 |
73 |
49 |
128,657 |
223,623 |
| Total |
185,400 |
197,171 |
125,317 |
8,456 |
397 |
456 |
192 |
117 |
332,106 |
517,506 |
| Al-Farwaniya Governorate |
Males |
112,987 |
278,078 |
394,081 |
2,236 |
632 |
650 |
131 |
84 |
675,892 |
788,879 |
| Females |
118,967 |
92,576 |
123,661 |
8,399 |
455 |
482 |
84 |
53 |
225,710 |
344,677 |
| Total |
231,954 |
370,654 |
517,742 |
10,635 |
1,087 |
1,132 |
215 |
137 |
901,602 |
1,133,556 |
| Mubarak Al-Kabeer Governorate |
Males |
74,637 |
9,408 |
39,956 |
253 |
241 |
239 |
30 |
22 |
50,149 |
124,786 |
| Females |
76,238 |
7,399 |
28,833 |
4,658 |
333 |
215 |
33 |
16 |
41,487 |
117,725 |
| Total |
150,875 |
16,807 |
68,789 |
4,911 |
574 |
454 |
63 |
38 |
91,636 |
242,511 |
| Not Stated |
Males |
145 |
1,894 |
856 |
14 |
35 |
56 |
3 |
5 |
2,863 |
3,008 |
| Females |
114 |
1,552 |
315 |
22 |
22 |
45 |
2 |
1 |
1,959 |
2,073 |
| Total |
259 |
3,446 |
1,171 |
36 |
57 |
101 |
5 |
6 |
4,822 |
5,081 |
| Total |
Males |
641,282 |
778,883 |
1,154,479 |
8,003 |
8,597 |
12,411 |
935 |
956 |
1,964,264 |
2,605,546 |
| Females |
666,323 |
398,656 |
503,729 |
48,081 |
7,301 |
7,976 |
689 |
705 |
967,137 |
1,633,460 |
| Total |
1,307,605 |
1,177,539 |
1,658,208 |
56,084 |
15,898 |
20,387 |
1,624 |
1,661 |
2,931,401 |
4,239,006 |
Source: PACI
ANNEXED NOTE
1. Characteristics of data and definitions
The source of data used here is the Public Authority for Civil Information (PACI), an independant government body in charge of :
1- centralising all population and labour force data in order to manage a fully computerised population register
2- issuing mandatory civil identification cards to every resident of the country, regardless of age and nationality.
The other source of demographic and socioeconomic data on Kuwait is the Central Statistical Office (CSO), operating within the Planning Ministry. The CSO has conducted ten population and housing censuses since its inception in 1957.
Since 1995 a marked discrepancy was witnessed between PACI’ and CSO’ population figures. PACI’ database is connected electronically with other administrations and bodies registering demographic events and professional/ residency issues (births and death; departures and arrivals; end of service, residency and ID deliveries, etc.).
PACI’s records of residents’ movements is thus regularly updated, which limits the risk of population overcount. Therefore, it is more likely that residents were undercounted during CSO- Ministry of Planning’s census operations (see: Shah, N. Population of Kuwait. Structure and Dynamics, Kuwait: Kuwait University Academic Publication Council, 2010, chapter 1).
(a) Kuwaiti: the Kuwaiti nationality rests upon a document of Kuwaiti nationality or a certificate proving Kuwaiti nationality issued by the Ministry of Interior of Kuwait.
(b) Non-Kuwaiti: his/ her nationality is determined by the name of the State which issued the passport. The foreign national also entered Kuwait legally and has a stamp of residence.
This category includes the Bidoon, a category of stateless persons living in the Emirate. Kuwait’s Bidoon population originates from three broad categories:
1) those whose ancestors failed to apply for nationality or lacked necessary documentation at the time of Kuwait’s independence in 1961;
2) those recruited to work in Kuwait’s army or police force during the 1960s who permanently settled in Kuwait, along with their families;
3) children of Kuwaiti mothers and stateless or foreign fathers (see Human Rights Watch. Prisoners of the Past. Kuwaiti Bidun and the Burden of Statelessness, June 2011, p. 3).
(The children of Kuwaiti mothers and non-Kuwaiti fathers (with specific nationality) inherit the father’s nationality. They are stateless if the father is stateless).
(c) Nationality group: collected according to the nationality of the head of the household.
Nationalities are grouped according to specific features common to certain population subgroups: language, geographic origin, etc. or according to internationally recognized categories such as: (Arab / non-Arab Asian countries / non-Arab African countries; European countries … etc.).
2. Institution which provides data
The Public Authority for Civil Information (PACI)
3. Period of data coverage: 31 December 2015
The database is updated three times a year and the website presents only the most recent data.
4. Data availability
The statistics section of PACI’s website (http://www.paci.gov.kw/en/ (English); http://www.paci.gov.kw/ (Arabic)) provides population and socio-economic data broken down by nationality (Kuwaiti/ non-Kuwaiti). Some data are displayed by nationality groups.
Analytical tables and data crosstabulations are available for download in PDF, html, .png and Excel (.csv) formats.
The “publications” section also proposes a selection of data tables processed thematically in downloadable Excel and PDF format (English and Arabic):
https://www.paci.gov.kw/stat/GeneralStat.aspx
The present data is in the “Population” file.
Date of access: May 2016
|
Born in Kuwait |
Born out of Kuwait |
Total |
| Male |
Female |
Total |
Male |
Female |
Total |
Male |
Female |
Total |
| Less than 5 |
62,199 |
59,307 |
121,506 |
17,117 |
16,392 |
33,509 |
79,316 |
75,699 |
155,015 |
| 5-9 |
47,911 |
45,991 |
93,902 |
24,467 |
23,117 |
47,584 |
72,378 |
69,108 |
141,486 |
| 10-14 |
30,191 |
28,696 |
58,887 |
23,367 |
20,968 |
44,335 |
53,558 |
49,664 |
103,222 |
| 15-19 |
25,654 |
24,974 |
50,628 |
18,176 |
16,030 |
34,206 |
43,830 |
41,004 |
84,834 |
| 20-24 |
17,904 |
17,718 |
35,622 |
97,576 |
37,235 |
134,811 |
115,480 |
54,953 |
170,433 |
| 25-29 |
20,899 |
19,798 |
40,697 |
266,342 |
122,474 |
388,816 |
287,241 |
142,272 |
429,513 |
| 30-34 |
20,223 |
16,938 |
37,161 |
300,094 |
128,821 |
428,915 |
320,317 |
145,759 |
466,076 |
| 35-39 |
15,996 |
11,569 |
27,565 |
294,959 |
117,237 |
412,196 |
310,955 |
128,806 |
439,761 |
| 40-44 |
10,892 |
7,587 |
18,479 |
226,089 |
90,534 |
316,623 |
236,981 |
98,121 |
335,102 |
| 45-49 |
8,466 |
5,770 |
14,236 |
180,097 |
66,817 |
246,914 |
188,563 |
72,587 |
261,150 |
| 50-54 |
4,935 |
2,971 |
7,906 |
113,606 |
38,431 |
152,037 |
118,541 |
41,402 |
159,943 |
| 55-59 |
2,366 |
1,103 |
3,469 |
72,277 |
21,794 |
94,071 |
74,643 |
22,897 |
97,540 |
| 60-64 |
1,336 |
356 |
1,692 |
35,724 |
11,616 |
47,340 |
37,060 |
11,972 |
49,032 |
| 65-69 |
708 |
159 |
867 |
14,574 |
5,914 |
20,488 |
15,282 |
6,073 |
21,355 |
| 70-74 |
535 |
73 |
608 |
5,398 |
3,078 |
8,476 |
5,933 |
3,151 |
9,084 |
| 75-79 |
245 |
43 |
288 |
2,430 |
1,857 |
4,287 |
2,675 |
1,900 |
4,575 |
| 80-84 |
107 |
28 |
135 |
939 |
969 |
1,908 |
1,046 |
997 |
2,043 |
| 85+ |
54 |
28 |
82 |
411 |
744 |
1,155 |
465 |
772 |
1,237 |
| Total |
270,621 |
243,109 |
513,730 |
1,693,643 |
724,028 |
2,417,671 |
1,964,264 |
967,137 |
2,931,401 |
Source: PACI
ANNEXED NOTE
1. Characteristics of data and definitions
The source of data used here is the Public Authority for Civil Information (PACI), an independant government body in charge of :
1- centralising all population and labour force data in order to manage a fully computerised population register
2- issuing mandatory civil identification cards to every resident of the country, regardless of age and nationality.
The other source of demographic and socioeconomic data on Kuwait is the Central Statistical Office (CSO), operating within the Planning Ministry. The CSO has conducted ten population and housing censuses since its inception in 1957.
Since 1995 a marked discrepancy was witnessed between PACI’ and CSO’ population figures. PACI’ database is connected electronically with other administrations and bodies registering demographic events and professional/ residency issues (births and death; departures and arrivals; end of service, residency and ID deliveries, etc.).
PACI’s records of residents’ movements is thus regularly updated, which limits the risk of population overcount. Therefore, it is more likely that residents were undercounted during CSO- Ministry of Planning’s census operations (see: Shah, N. Population of Kuwait. Structure and Dynamics, Kuwait: Kuwait University Academic Publication Council, 2010, chapter 1).
(a) Kuwaiti: the Kuwaiti nationality rests upon a document of Kuwaiti nationality or a certificate proving Kuwaiti nationality issued by the Ministry of Interior of Kuwait.
(b) Non-Kuwaiti: his/ her nationality is determined by the name of the State which issued the passport. The foreign national also entered Kuwait legally and has a stamp of residence.
This category includes the Bidoon, a category of stateless persons living in the Emirate. Kuwait’s Bidoon population originates from three broad categories:
1) those whose ancestors failed to apply for nationality or lacked necessary documentation at the time of Kuwait’s independence in 1961;
2) those recruited to work in Kuwait’s army or police force during the 1960s who permanently settled in Kuwait, along with their families;
3) children of Kuwaiti mothers and stateless or foreign fathers (see Human Rights Watch. Prisoners of the Past. Kuwaiti Bidun and the Burden of Statelessness, June 2011, p. 3).
(The children of Kuwaiti mothers and non-Kuwaiti fathers (with specific nationality) inherit the father’s nationality. They are stateless if the father is stateless).
2. Institution which provides data
The Public Authority for Civil Information (PACI)
3. Period of data coverage: 31 December 2015
The database is updated three times a year and the website presents only the most recent data.
4. Data availability
The statistics section of PACI’s website (http://www.paci.gov.kw/en/ (English); http://www.paci.gov.kw/ (Arabic)) provides population and socio-economic data broken down by nationality (Kuwaiti/ non-Kuwaiti). Some data are displayed by nationality groups.
Analytical tables and data crosstabulations are available for download in PDF, html, .png and Excel (.csv) formats.
The “publications” section also proposes a selection of data tables processed thematically in downloadable Excel and PDF format (English and Arabic):
https://www.paci.gov.kw/stat/GeneralStat.aspx
The present data is in the “Population” file.
Date of access: May 2016
|
Total |
| Kuwaitis |
1,307,605 |
| Arabs |
1,177,539 |
| Asians |
1,658,208 |
| Africans |
56,084 |
| Europeans |
15,898 |
| N. Americans |
20,387 |
| S. Americans |
1,624 |
| Australians/ Oceanians |
1,661 |
| Non-Kuwaitis |
2,931,401 |
| Total |
4,239,006 |
Source: PACI
ANNEXED NOTE
1. Characteristics of data and definitions
The source of data used here is the Public Authority for Civil Information (PACI), an independant government body in charge of :
1- centralising all population and labour force data in order to manage a fully computerised population register
2- issuing mandatory civil identification cards to every resident of the country, regardless of age and nationality.
The other source of demographic and socioeconomic data on Kuwait is the Central Statistical Office (CSO), operating within the Planning Ministry. The CSO has conducted ten population and housing censuses since its inception in 1957.
Since 1995 a marked discrepancy was witnessed between PACI’ and CSO’ population figures. PACI’ database is connected electronically with other administrations and bodies registering demographic events and professional/ residency issues (births and death; departures and arrivals; end of service, residency and ID deliveries, etc.).
PACI’s records of residents’ movements is thus regularly updated, which limits the risk of population overcount. Therefore, it is more likely that residents were undercounted during CSO- Ministry of Planning’s census operations (see: Shah, N. Population of Kuwait. Structure and Dynamics, Kuwait: Kuwait University Academic Publication Council, 2010, chapter 1).
(a) Kuwaiti: the Kuwaiti nationality rests upon a document of Kuwaiti nationality or a certificate proving Kuwaiti nationality issued by the Ministry of Interior of Kuwait.
(b) Non-Kuwaiti: his/ her nationality is determined by the name of the State which issued the passport. The foreign national also entered Kuwait legally and has a stamp of residence.
This category includes the Bidoon, a category of stateless persons living in the Emirate. Kuwait’s Bidoon population originates from three broad categories:
1) those whose ancestors failed to apply for nationality or lacked necessary documentation at the time of Kuwait’s independence in 1961;
2) those recruited to work in Kuwait’s army or police force during the 1960s who permanently settled in Kuwait, along with their families;
3) children of Kuwaiti mothers and stateless or foreign fathers (see Human Rights Watch. Prisoners of the Past. Kuwaiti Bidun and the Burden of Statelessness, June 2011, p. 3).
(The children of Kuwaiti mothers and non-Kuwaiti fathers (with specific nationality) inherit the father’s nationality. They are stateless if the father is stateless).
(c) Nationality group: collected according to the nationality of the head of the household.
Nationalities are grouped according to specific features common to certain population subgroups: language, geographic origin, etc. or according to internationally recognized categories such as: (Arab / non-Arab Asian countries / non-Arab African countries; European countries … etc.).
2. Institution which provides data
The Public Authority for Civil Information (PACI)
3. Period of data coverage: 31 December 2015
The database is updated three times a year and the website presents only the most recent data.
4. Data availability
The statistics section of PACI’s website (http://www.paci.gov.kw/en/ (English); http://www.paci.gov.kw/ (Arabic)) provides population and socio-economic data broken down by nationality (Kuwaiti/ non-Kuwaiti). Some data are displayed by nationality groups.
Analytical tables and data crosstabulations are available for download in PDF, html, .png and Excel (.csv) formats.
The “publications” section also proposes a selection of data tables processed thematically in downloadable Excel and PDF format (English and Arabic):
https://www.paci.gov.kw/stat/GeneralStat.aspx
The present data is in the “Population” file.
Date of access: May 2016
| Locality |
Gender |
Nationality group |
| Kuwaitis |
Arabs |
Asians |
Africans |
Europeans |
N. Americans |
S. Americans |
Australians/ Oceanians |
Total |
| Dasman |
Males |
205 |
752 |
579 |
0 |
6 |
15 |
0 |
0 |
1,557 |
| Females |
256 |
131 |
254 |
25 |
5 |
13 |
1 |
0 |
685 |
| Total |
461 |
883 |
833 |
25 |
11 |
28 |
1 |
0 |
2,242 |
| Sharq |
Males |
756 |
8,707 |
16,168 |
15 |
79 |
59 |
4 |
4 |
25,792 |
| Females |
775 |
1,796 |
4,112 |
112 |
43 |
34 |
6 |
1 |
6,879 |
| Total |
1,531 |
10,503 |
20,280 |
127 |
122 |
93 |
10 |
5 |
32,671 |
| Mirqab |
Males |
2 |
892 |
5,765 |
0 |
2 |
3 |
0 |
0 |
6,664 |
| Females |
2 |
125 |
432 |
3 |
0 |
1 |
0 |
0 |
563 |
| Total |
4 |
1,017 |
6,197 |
3 |
2 |
4 |
0 |
0 |
7,227 |
| Soor Gardens |
Males |
0 |
9 |
2 |
0 |
0 |
0 |
0 |
0 |
11 |
| Females |
0 |
0 |
0 |
0 |
0 |
0 |
0 |
0 |
0 |
| Total |
0 |
9 |
2 |
0 |
0 |
0 |
0 |
0 |
11 |
| Qibla |
Males |
39 |
4,325 |
9,909 |
38 |
79 |
48 |
3 |
8 |
14,449 |
| Females |
35 |
1,224 |
1,733 |
47 |
56 |
25 |
0 |
2 |
3,122 |
| Total |
74 |
5,549 |
11,642 |
85 |
135 |
73 |
3 |
10 |
17,571 |
| Coastal strip |
Males |
0 |
0 |
0 |
0 |
0 |
0 |
0 |
0 |
0 |
| Females |
0 |
0 |
0 |
0 |
0 |
0 |
0 |
0 |
0 |
| Total |
0 |
0 |
0 |
0 |
0 |
0 |
0 |
0 |
0 |
| Bneid Al – Gar |
Males |
413 |
8,840 |
19,959 |
38 |
175 |
140 |
6 |
11 |
29,582 |
| Females |
431 |
1,806 |
3,020 |
93 |
132 |
116 |
4 |
5 |
5,607 |
| Total |
844 |
10,646 |
22,979 |
131 |
307 |
256 |
10 |
16 |
35,189 |
| Dasma |
Males |
5,265 |
823 |
3,388 |
9 |
25 |
49 |
6 |
1 |
9,566 |
| Females |
5,423 |
642 |
3,675 |
452 |
31 |
40 |
5 |
1 |
10,269 |
| Total |
10,688 |
1,465 |
7,063 |
461 |
56 |
89 |
11 |
2 |
19,835 |
| Mansoriya |
Males |
2,447 |
349 |
1,559 |
9 |
25 |
10 |
1 |
1 |
4,401 |
| Females |
2,586 |
242 |
1,730 |
220 |
26 |
12 |
3 |
0 |
4,819 |
| Total |
5,033 |
591 |
3,289 |
229 |
51 |
22 |
4 |
1 |
9,220 |
| Abdalla-Alsalim |
Males |
5,502 |
653 |
4,571 |
20 |
12 |
21 |
0 |
0 |
10,779 |
| Females |
5,648 |
434 |
4,712 |
461 |
23 |
25 |
1 |
0 |
11,304 |
| Total |
11,150 |
1,087 |
9,283 |
481 |
35 |
46 |
1 |
0 |
22,083 |
| Shamiya |
Males |
4,516 |
762 |
3,308 |
29 |
15 |
23 |
3 |
0 |
8,656 |
| Females |
4,803 |
538 |
3,429 |
420 |
14 |
21 |
0 |
0 |
9,225 |
| Total |
9,319 |
1,300 |
6,737 |
449 |
29 |
44 |
3 |
0 |
17,881 |
| Diya |
Males |
4,648 |
1,457 |
3,774 |
10 |
27 |
61 |
11 |
2 |
9,990 |
| Females |
4,851 |
1,048 |
3,695 |
435 |
32 |
50 |
3 |
5 |
10,119 |
| Total |
9,499 |
2,505 |
7,469 |
445 |
59 |
111 |
14 |
7 |
20,109 |
| Qadisiya |
Males |
6,597 |
1,115 |
3,856 |
30 |
10 |
23 |
1 |
5 |
11,637 |
| Females |
6,943 |
906 |
4,666 |
548 |
23 |
20 |
2 |
1 |
13,109 |
| Total |
13,540 |
2,021 |
8,522 |
578 |
33 |
43 |
3 |
6 |
24,746 |
| Nuzha |
Males |
3,897 |
343 |
2,881 |
29 |
13 |
16 |
0 |
0 |
7,179 |
| Females |
4,276 |
247 |
3,178 |
334 |
10 |
8 |
0 |
1 |
8,054 |
| Total |
8,173 |
590 |
6,059 |
363 |
23 |
24 |
0 |
1 |
15,233 |
| Faiha |
Males |
6,225 |
1,209 |
3,837 |
20 |
8 |
17 |
2 |
0 |
11,318 |
| Females |
6,710 |
1,003 |
4,261 |
547 |
15 |
18 |
1 |
0 |
12,555 |
| Total |
12,935 |
2,212 |
8,098 |
567 |
23 |
35 |
3 |
0 |
23,873 |
| Kifan |
Males |
7,473 |
1,319 |
4,687 |
23 |
24 |
44 |
1 |
0 |
13,571 |
| Females |
8,081 |
1,226 |
5,435 |
648 |
65 |
28 |
2 |
0 |
15,485 |
| Total |
15,554 |
2,545 |
10,122 |
671 |
89 |
72 |
3 |
0 |
29,056 |
| Rawda |
Males |
10,797 |
1,205 |
5,698 |
48 |
16 |
42 |
8 |
1 |
17,815 |
| Females |
11,637 |
989 |
7,221 |
913 |
33 |
44 |
3 |
1 |
20,841 |
| Total |
22,434 |
2,194 |
12,919 |
961 |
49 |
86 |
11 |
2 |
38,656 |
| Idailiya |
Males |
5,859 |
696 |
3,645 |
19 |
18 |
17 |
7 |
4 |
10,265 |
| Females |
6,244 |
546 |
4,133 |
471 |
16 |
24 |
3 |
1 |
11,438 |
| Total |
12,103 |
1,242 |
7,778 |
490 |
34 |
41 |
10 |
5 |
21,703 |
| Khaldiya |
Males |
5,265 |
552 |
3,255 |
25 |
15 |
14 |
0 |
1 |
9,127 |
| Females |
5,445 |
386 |
3,702 |
353 |
15 |
16 |
0 |
3 |
9,920 |
| Total |
10,710 |
938 |
6,957 |
378 |
30 |
30 |
0 |
4 |
19,047 |
| Surra |
Males |
10,062 |
1,384 |
5,330 |
47 |
70 |
137 |
7 |
8 |
17,045 |
| Females |
10,316 |
1,208 |
7,030 |
794 |
84 |
133 |
7 |
8 |
19,580 |
| Total |
20,378 |
2,592 |
12,360 |
841 |
154 |
270 |
14 |
16 |
36,625 |
| Qurtuba |
Males |
9,248 |
874 |
4,851 |
188 |
53 |
42 |
0 |
2 |
15,258 |
| Females |
9,577 |
722 |
6,380 |
701 |
23 |
44 |
0 |
1 |
17,448 |
| Total |
18,825 |
1,596 |
11,231 |
889 |
76 |
86 |
0 |
3 |
32,706 |
| Al.yamouk |
Males |
6,631 |
870 |
4,731 |
25 |
38 |
35 |
1 |
0 |
12,331 |
| Females |
6,967 |
653 |
4,670 |
571 |
43 |
35 |
2 |
1 |
12,942 |
| Total |
13,598 |
1,523 |
9,401 |
596 |
81 |
70 |
3 |
1 |
25,273 |
| Shuwaikh |
Males |
1,010 |
313 |
1,821 |
7 |
2 |
4 |
0 |
1 |
3,158 |
| Females |
1,053 |
102 |
1,238 |
111 |
3 |
7 |
0 |
0 |
2,514 |
| Total |
2,063 |
415 |
3,059 |
118 |
5 |
11 |
0 |
1 |
5,672 |
| Shuwaikh – Ind |
Males |
37 |
2,309 |
5,130 |
152 |
109 |
84 |
2 |
13 |
7,836 |
| Females |
39 |
482 |
245 |
27 |
56 |
67 |
1 |
6 |
923 |
| Total |
76 |
2,791 |
5,375 |
179 |
165 |
151 |
3 |
19 |
8,759 |
| Garnada |
Males |
3,069 |
471 |
1,642 |
20 |
18 |
22 |
1 |
1 |
5,244 |
| Females |
3,114 |
402 |
1,565 |
231 |
11 |
21 |
0 |
0 |
5,344 |
| Total |
6,183 |
873 |
3,207 |
251 |
29 |
43 |
1 |
1 |
10,588 |
| Mubarakiya Comp |
Males |
0 |
287 |
2,226 |
2 |
1 |
0 |
0 |
4 |
2,520 |
| Females |
0 |
0 |
5 |
0 |
0 |
0 |
0 |
0 |
5 |
| Total |
0 |
287 |
2,231 |
2 |
1 |
0 |
0 |
4 |
2,525 |
| Health Reg |
Males |
40 |
86 |
45 |
0 |
1 |
0 |
1 |
0 |
173 |
| Females |
80 |
140 |
388 |
3 |
1 |
0 |
0 |
0 |
612 |
| Total |
120 |
226 |
433 |
3 |
2 |
0 |
1 |
0 |
785 |
| Sulaibekhat |
Males |
7,659 |
4,621 |
6,104 |
47 |
14 |
34 |
4 |
10 |
18,493 |
| Females |
8,327 |
2,964 |
3,283 |
562 |
24 |
19 |
1 |
10 |
15,190 |
| Total |
15,986 |
7,585 |
9,387 |
609 |
38 |
53 |
5 |
20 |
33,683 |
| Doha |
Males |
8,193 |
3,694 |
5,150 |
45 |
14 |
36 |
11 |
2 |
17,145 |
| Females |
8,743 |
2,893 |
3,215 |
564 |
16 |
22 |
6 |
0 |
15,459 |
| Total |
16,936 |
6,587 |
8,365 |
609 |
30 |
58 |
17 |
2 |
32,604 |
| Doha Port |
Males |
0 |
249 |
518 |
0 |
0 |
0 |
0 |
0 |
767 |
| Females |
0 |
5 |
10 |
0 |
0 |
0 |
0 |
0 |
15 |
| Total |
0 |
254 |
528 |
0 |
0 |
0 |
0 |
0 |
782 |
| Failakka Isl |
Males |
0 |
0 |
0 |
0 |
0 |
0 |
0 |
0 |
0 |
| Females |
1 |
0 |
1 |
0 |
0 |
0 |
0 |
0 |
2 |
| Total |
1 |
0 |
1 |
0 |
0 |
0 |
0 |
0 |
2 |
| Miskan Isl |
Males |
0 |
0 |
0 |
0 |
0 |
0 |
0 |
0 |
0 |
| Females |
0 |
0 |
0 |
0 |
0 |
0 |
0 |
0 |
0 |
| Total |
0 |
0 |
0 |
0 |
0 |
0 |
0 |
0 |
0 |
| Oha Isl |
Males |
0 |
0 |
0 |
0 |
0 |
0 |
0 |
0 |
0 |
| Females |
0 |
0 |
0 |
0 |
0 |
0 |
0 |
0 |
0 |
| Total |
0 |
0 |
0 |
0 |
0 |
0 |
0 |
0 |
0 |
| Kubar Isl |
Males |
0 |
0 |
0 |
0 |
0 |
0 |
0 |
0 |
0 |
| Females |
0 |
0 |
0 |
0 |
0 |
0 |
0 |
0 |
0 |
| Total |
0 |
0 |
0 |
0 |
0 |
0 |
0 |
0 |
0 |
| Qarowa Isl |
Males |
0 |
0 |
0 |
0 |
0 |
0 |
0 |
0 |
0 |
| Females |
0 |
0 |
0 |
0 |
0 |
0 |
0 |
0 |
0 |
| Total |
0 |
0 |
0 |
0 |
0 |
0 |
0 |
0 |
0 |
| Aum – Almaradim Isl |
Males |
0 |
0 |
0 |
0 |
0 |
0 |
0 |
0 |
0 |
| Females |
0 |
0 |
0 |
0 |
0 |
0 |
0 |
0 |
0 |
| Total |
0 |
0 |
0 |
0 |
0 |
0 |
0 |
0 |
0 |
| Aum – Alnamil Isl |
Males |
0 |
0 |
0 |
0 |
0 |
0 |
0 |
0 |
0 |
| Females |
0 |
0 |
0 |
0 |
0 |
0 |
0 |
0 |
0 |
| Total |
0 |
0 |
0 |
0 |
0 |
0 |
0 |
0 |
0 |
| Doha Resort |
Males |
0 |
0 |
2 |
0 |
0 |
0 |
0 |
0 |
2 |
| Females |
0 |
0 |
0 |
0 |
0 |
0 |
0 |
0 |
0 |
| Total |
0 |
0 |
2 |
0 |
0 |
0 |
0 |
0 |
2 |
| Free Zone |
Males |
0 |
0 |
0 |
0 |
0 |
0 |
0 |
0 |
0 |
| Females |
0 |
0 |
0 |
0 |
0 |
0 |
0 |
0 |
0 |
| Total |
0 |
0 |
0 |
0 |
0 |
0 |
0 |
0 |
0 |
| North-west of Sulaibekhat |
Males |
21 |
0 |
2 |
0 |
0 |
0 |
0 |
0 |
23 |
| Females |
31 |
3 |
7 |
0 |
0 |
0 |
0 |
0 |
41 |
| Total |
52 |
3 |
9 |
0 |
0 |
0 |
0 |
0 |
64 |
| Total Capital Governorate |
Males |
115,876 |
49,166 |
134,393 |
895 |
869 |
996 |
80 |
79 |
302,354 |
| Females |
122,394 |
22,863 |
87,425 |
9,646 |
800 |
843 |
51 |
47 |
244,069 |
| Total |
238,270 |
72,029 |
221,818 |
10,541 |
1,669 |
1,839 |
131 |
126 |
546,423 |
| Hawalli |
Males |
1,168 |
101,639 |
33,551 |
197 |
531 |
767 |
50 |
61 |
137,964 |
| Females |
1,214 |
47,169 |
17,122 |
1,029 |
548 |
660 |
48 |
55 |
67,845 |
| Total |
2,382 |
148,808 |
50,673 |
1,226 |
1,079 |
1,427 |
98 |
116 |
205,809 |
| Salmiya |
Males |
4,563 |
85,294 |
72,545 |
365 |
2,057 |
2,092 |
119 |
207 |
167,242 |
| Females |
4,781 |
58,561 |
53,012 |
1,831 |
1,967 |
1,602 |
105 |
142 |
122,001 |
| Total |
9,344 |
143,855 |
125,557 |
2,196 |
4,024 |
3,694 |
224 |
349 |
289,243 |
| Shaab |
Males |
3,200 |
1,922 |
2,628 |
14 |
132 |
170 |
9 |
25 |
8,100 |
| Females |
3,360 |
1,597 |
2,900 |
354 |
107 |
149 |
8 |
23 |
8,498 |
| Total |
6,560 |
3,519 |
5,528 |
368 |
239 |
319 |
17 |
48 |
16,598 |
| Rumaythiya |
Males |
17,511 |
2,483 |
8,092 |
27 |
105 |
142 |
25 |
13 |
28,398 |
| Females |
17,932 |
2,090 |
9,982 |
1,452 |
93 |
144 |
10 |
11 |
31,714 |
| Total |
35,443 |
4,573 |
18,074 |
1,479 |
198 |
286 |
35 |
24 |
60,112 |
| Salwa |
Males |
14,411 |
11,950 |
13,265 |
146 |
771 |
810 |
63 |
94 |
41,510 |
| Females |
15,585 |
9,690 |
12,553 |
1,326 |
727 |
678 |
42 |
89 |
40,690 |
| Total |
29,996 |
21,640 |
25,818 |
1,472 |
1,498 |
1,488 |
105 |
183 |
82,200 |
| Bedi |
Males |
76 |
152 |
448 |
2 |
28 |
19 |
2 |
4 |
731 |
| Females |
70 |
61 |
192 |
3 |
18 |
5 |
2 |
6 |
357 |
| Total |
146 |
213 |
640 |
5 |
46 |
24 |
4 |
10 |
1,088 |
| Mushaif |
Males |
12,923 |
837 |
5,580 |
71 |
98 |
93 |
9 |
5 |
19,616 |
| Females |
12,883 |
695 |
8,008 |
871 |
112 |
95 |
5 |
5 |
22,674 |
| Total |
25,806 |
1,532 |
13,588 |
942 |
210 |
188 |
14 |
10 |
42,290 |
| Mubarak Al-Abdel-Allah |
Males |
3,244 |
210 |
1,141 |
23 |
21 |
26 |
4 |
6 |
4,675 |
| Females |
3,240 |
163 |
1,755 |
240 |
24 |
25 |
0 |
8 |
5,455 |
| Total |
6,484 |
373 |
2,896 |
263 |
45 |
51 |
4 |
14 |
10,130 |
| Bayan |
Males |
14,713 |
1,403 |
6,495 |
60 |
78 |
95 |
8 |
4 |
22,856 |
| Females |
15,233 |
1,170 |
7,891 |
1,103 |
97 |
92 |
14 |
4 |
25,604 |
| Total |
29,946 |
2,573 |
14,386 |
1,163 |
175 |
187 |
22 |
8 |
48,460 |
| Mubarakiya |
Males |
0 |
0 |
0 |
0 |
0 |
0 |
0 |
0 |
0 |
| Females |
0 |
0 |
0 |
0 |
0 |
0 |
0 |
0 |
0 |
| Total |
0 |
0 |
0 |
0 |
0 |
0 |
0 |
0 |
0 |
| Jabriya |
Males |
11,576 |
13,945 |
10,643 |
136 |
462 |
755 |
20 |
60 |
37,597 |
| Females |
11,997 |
11,751 |
12,472 |
1,290 |
459 |
636 |
21 |
46 |
38,672 |
| Total |
23,573 |
25,696 |
23,115 |
1,426 |
921 |
1,391 |
41 |
106 |
76,269 |
| Wizarat area |
Males |
0 |
4 |
2 |
0 |
0 |
0 |
0 |
0 |
6 |
| Females |
0 |
2 |
0 |
0 |
0 |
0 |
0 |
0 |
2 |
| Total |
0 |
6 |
2 |
0 |
0 |
0 |
0 |
0 |
8 |
| Al-Shohadaa |
Males |
4,276 |
234 |
1,524 |
29 |
14 |
53 |
4 |
1 |
6,135 |
| Females |
4,306 |
247 |
2,174 |
309 |
16 |
38 |
2 |
3 |
7,095 |
| Total |
8,582 |
481 |
3,698 |
338 |
30 |
91 |
6 |
4 |
13,230 |
| Al-Zahraa |
Males |
8,229 |
606 |
2,889 |
34 |
29 |
64 |
4 |
1 |
11,856 |
| Females |
8,587 |
556 |
3,848 |
591 |
27 |
52 |
10 |
2 |
13,673 |
| Total |
16,816 |
1,162 |
6,737 |
625 |
56 |
116 |
14 |
3 |
25,529 |
| Hetteen |
Males |
6,099 |
349 |
2,052 |
12 |
14 |
27 |
2 |
1 |
8,556 |
| Females |
6,079 |
357 |
3,040 |
437 |
16 |
20 |
4 |
3 |
9,956 |
| Total |
12,178 |
706 |
5,092 |
449 |
30 |
47 |
6 |
4 |
18,512 |
| Al-Siddeek |
Males |
352 |
24 |
93 |
3 |
3 |
13 |
1 |
0 |
489 |
| Females |
333 |
26 |
145 |
15 |
4 |
12 |
0 |
0 |
535 |
| Total |
685 |
50 |
238 |
18 |
7 |
25 |
1 |
0 |
1,024 |
| Al-Salam |
Males |
7,910 |
564 |
2,730 |
29 |
33 |
66 |
11 |
9 |
11,352 |
| Females |
7,941 |
568 |
4,021 |
535 |
50 |
47 |
4 |
8 |
13,174 |
| Total |
15,851 |
1,132 |
6,751 |
564 |
83 |
113 |
15 |
17 |
24,526 |
| Anjafa |
Males |
28 |
53 |
173 |
0 |
17 |
15 |
0 |
0 |
286 |
| Females |
24 |
34 |
100 |
4 |
15 |
11 |
0 |
0 |
188 |
| Total |
52 |
87 |
273 |
4 |
32 |
26 |
0 |
0 |
474 |
| Total Hawalli Governorate |
Males |
110,279 |
221,669 |
163,851 |
1,148 |
4,393 |
5,207 |
331 |
491 |
507,369 |
| Females |
113,565 |
134,737 |
139,215 |
11,390 |
4,280 |
4,266 |
275 |
405 |
408,133 |
| Total |
223,844 |
356,406 |
303,066 |
12,538 |
8,673 |
9,473 |
606 |
896 |
915,502 |
| Ahmadi city |
Males |
5,765 |
4,899 |
7,559 |
32 |
174 |
209 |
19 |
25 |
18,682 |
| Females |
6,028 |
3,189 |
2,741 |
310 |
38 |
99 |
10 |
17 |
12,432 |
| Total |
11,793 |
8,088 |
10,300 |
342 |
212 |
308 |
29 |
42 |
31,114 |
| Fahaheel |
Males |
9,626 |
15,443 |
45,701 |
100 |
77 |
95 |
3 |
9 |
71,054 |
| Females |
9,990 |
4,702 |
11,996 |
497 |
24 |
40 |
3 |
2 |
27,254 |
| Total |
19,616 |
20,145 |
57,697 |
597 |
101 |
135 |
6 |
11 |
98,308 |
| Sabahiya |
Males |
22,458 |
6,306 |
14,398 |
91 |
22 |
28 |
6 |
7 |
43,316 |
| Females |
24,254 |
4,697 |
8,057 |
877 |
20 |
35 |
4 |
7 |
37,951 |
| Total |
46,712 |
11,003 |
22,455 |
968 |
42 |
63 |
10 |
14 |
81,267 |
| South – Sabahiya |
Males |
1 |
3 |
0 |
0 |
0 |
0 |
0 |
0 |
4 |
| Females |
0 |
1 |
0 |
0 |
0 |
0 |
0 |
0 |
1 |
| Total |
1 |
4 |
0 |
0 |
0 |
0 |
0 |
0 |
5 |
| Rikka |
Males |
15,468 |
3,067 |
8,390 |
76 |
15 |
13 |
16 |
1 |
27,046 |
| Females |
16,622 |
2,316 |
4,893 |
820 |
18 |
14 |
14 |
1 |
24,698 |
| Total |
32,090 |
5,383 |
13,283 |
896 |
33 |
27 |
30 |
2 |
51,744 |
| Hadiya |
Males |
7,976 |
742 |
3,633 |
34 |
5 |
23 |
0 |
5 |
12,418 |
| Females |
7,722 |
722 |
3,081 |
368 |
15 |
14 |
2 |
2 |
11,926 |
| Total |
15,698 |
1,464 |
6,714 |
402 |
20 |
37 |
2 |
7 |
24,344 |
| Fintas |
Males |
3,844 |
11,299 |
8,384 |
99 |
304 |
346 |
17 |
28 |
24,321 |
| Females |
3,978 |
7,719 |
3,287 |
356 |
206 |
140 |
12 |
18 |
15,716 |
| Total |
7,822 |
19,018 |
11,671 |
455 |
510 |
486 |
29 |
46 |
40,037 |
| Jaber Al-Ali |
Males |
16,964 |
1,243 |
7,411 |
41 |
4 |
10 |
2 |
0 |
25,675 |
| Females |
16,646 |
1,244 |
4,920 |
671 |
5 |
9 |
3 |
0 |
23,498 |
| Total |
33,610 |
2,487 |
12,331 |
712 |
9 |
19 |
5 |
0 |
49,173 |
| Auqqila |
Males |
2,899 |
394 |
1,422 |
26 |
100 |
83 |
9 |
7 |
4,940 |
| Females |
3,031 |
380 |
1,246 |
161 |
88 |
68 |
12 |
7 |
4,993 |
| Total |
5,930 |
774 |
2,668 |
187 |
188 |
151 |
21 |
14 |
9,933 |
| Abu- Alhasniya |
Males |
145 |
25 |
188 |
2 |
45 |
173 |
0 |
4 |
582 |
| Females |
140 |
27 |
139 |
11 |
28 |
36 |
2 |
1 |
384 |
| Total |
285 |
52 |
327 |
13 |
73 |
209 |
2 |
5 |
966 |
| Mahbula |
Males |
1,477 |
23,843 |
90,323 |
676 |
697 |
1,549 |
74 |
50 |
118,689 |
| Females |
1,628 |
7,408 |
11,594 |
529 |
423 |
616 |
40 |
35 |
22,273 |
| Total |
3,105 |
31,251 |
101,917 |
1,205 |
1,120 |
2,165 |
114 |
85 |
140,962 |
| Al- Adami |
Males |
0 |
0 |
0 |
0 |
0 |
0 |
0 |
0 |
0 |
| Females |
0 |
0 |
0 |
0 |
0 |
0 |
0 |
0 |
0 |
| Total |
0 |
0 |
0 |
0 |
0 |
0 |
0 |
0 |
0 |
| Abu-Halifa |
Males |
2,079 |
10,584 |
18,731 |
168 |
103 |
267 |
17 |
9 |
31,958 |
| Females |
2,067 |
6,922 |
8,566 |
194 |
71 |
80 |
9 |
5 |
17,914 |
| Total |
4,146 |
17,506 |
27,297 |
362 |
174 |
347 |
26 |
14 |
49,872 |
| Munkaf |
Males |
8,210 |
17,040 |
65,500 |
225 |
558 |
2,015 |
62 |
50 |
93,660 |
| Females |
8,373 |
8,222 |
18,240 |
652 |
248 |
663 |
44 |
32 |
36,474 |
| Total |
16,583 |
25,262 |
83,740 |
877 |
806 |
2,678 |
106 |
82 |
130,134 |
| Thaher |
Males |
13,204 |
2,083 |
6,612 |
54 |
0 |
4 |
2 |
1 |
21,960 |
| Females |
13,737 |
1,813 |
3,736 |
535 |
5 |
6 |
1 |
0 |
19,833 |
| Total |
26,941 |
3,896 |
10,348 |
589 |
5 |
10 |
3 |
1 |
41,793 |
| Shuaiba |
Males |
0 |
78 |
857 |
0 |
0 |
0 |
0 |
0 |
935 |
| Females |
0 |
4 |
7 |
0 |
0 |
0 |
0 |
0 |
11 |
| Total |
0 |
82 |
864 |
0 |
0 |
0 |
0 |
0 |
946 |
| Shuaiba-ind W |
Males |
0 |
2,769 |
23,825 |
20 |
20 |
2 |
0 |
0 |
26,636 |
| Females |
0 |
26 |
54 |
1 |
1 |
0 |
0 |
0 |
82 |
| Total |
0 |
2,795 |
23,879 |
21 |
21 |
2 |
0 |
0 |
26,718 |
| Abdulla -Port |
Males |
0 |
99 |
2,069 |
4 |
2 |
0 |
0 |
0 |
2,174 |
| Females |
0 |
0 |
9 |
0 |
0 |
0 |
0 |
0 |
9 |
| Total |
0 |
99 |
2,078 |
4 |
2 |
0 |
0 |
0 |
2,183 |
| Abdulla Port-Resort |
Males |
0 |
365 |
2,478 |
4 |
13 |
8 |
1 |
4 |
2,873 |
| Females |
0 |
17 |
8 |
0 |
2 |
1 |
0 |
0 |
28 |
| Total |
0 |
382 |
2,486 |
4 |
15 |
9 |
1 |
4 |
2,901 |
| Nwaiseeb resort |
Males |
0 |
0 |
0 |
0 |
0 |
0 |
0 |
0 |
0 |
| Females |
0 |
0 |
0 |
0 |
0 |
0 |
0 |
0 |
0 |
| Total |
0 |
0 |
0 |
0 |
0 |
0 |
0 |
0 |
0 |
| Al-Kayron resorts |
Males |
0 |
210 |
2,096 |
48 |
17 |
0 |
0 |
1 |
2,372 |
| Females |
0 |
26 |
52 |
1 |
4 |
0 |
0 |
0 |
83 |
| Total |
0 |
236 |
2,148 |
49 |
21 |
0 |
0 |
1 |
2,455 |
| Zoor Resort |
Males |
0 |
6 |
0 |
0 |
0 |
0 |
0 |
0 |
6 |
| Females |
0 |
6 |
0 |
0 |
0 |
0 |
0 |
0 |
6 |
| Total |
0 |
12 |
0 |
0 |
0 |
0 |
0 |
0 |
12 |
| Jlaiaa Resort |
Males |
0 |
3 |
201 |
0 |
0 |
36 |
0 |
0 |
240 |
| Females |
0 |
1 |
5 |
2 |
0 |
9 |
0 |
0 |
17 |
| Total |
0 |
4 |
206 |
2 |
0 |
45 |
0 |
0 |
257 |
| Bedier Resort |
Males |
0 |
11 |
2 |
0 |
0 |
0 |
0 |
0 |
13 |
| Females |
0 |
2 |
0 |
0 |
0 |
0 |
0 |
0 |
2 |
| Total |
0 |
13 |
2 |
0 |
0 |
0 |
0 |
0 |
15 |
| Dubaeeiya Resort |
Males |
0 |
11 |
7 |
0 |
0 |
0 |
0 |
0 |
18 |
| Females |
0 |
8 |
0 |
0 |
0 |
0 |
0 |
0 |
8 |
| Total |
0 |
19 |
7 |
0 |
0 |
0 |
0 |
0 |
26 |
| Zoor |
Males |
0 |
917 |
751 |
4 |
10 |
81 |
8 |
0 |
1,771 |
| Females |
0 |
717 |
77 |
18 |
10 |
64 |
11 |
0 |
897 |
| Total |
0 |
1,634 |
828 |
22 |
20 |
145 |
19 |
0 |
2,668 |
| Nwaiseeb |
Males |
0 |
0 |
0 |
0 |
0 |
0 |
0 |
0 |
0 |
| Females |
0 |
0 |
0 |
0 |
0 |
0 |
0 |
0 |
0 |
| Total |
0 |
0 |
0 |
0 |
0 |
0 |
0 |
0 |
0 |
| Sbainhiya |
Males |
0 |
0 |
0 |
0 |
0 |
0 |
0 |
0 |
0 |
| Females |
0 |
0 |
0 |
0 |
0 |
0 |
0 |
0 |
0 |
| Total |
0 |
0 |
0 |
0 |
0 |
0 |
0 |
0 |
0 |
| Wafra |
Males |
1 |
45 |
3 |
0 |
0 |
0 |
0 |
0 |
49 |
| Females |
0 |
50 |
0 |
0 |
0 |
0 |
0 |
0 |
50 |
| Total |
1 |
95 |
3 |
0 |
0 |
0 |
0 |
0 |
99 |
| New Wafra |
Males |
83 |
556 |
440 |
30 |
0 |
0 |
0 |
0 |
1,109 |
| Females |
70 |
366 |
63 |
8 |
0 |
0 |
0 |
0 |
507 |
| Total |
153 |
922 |
503 |
38 |
0 |
0 |
0 |
0 |
1,616 |
| Wafra -Agriculture |
Males |
1 |
1,812 |
8,507 |
184 |
0 |
1 |
0 |
0 |
10,505 |
| Females |
0 |
107 |
53 |
0 |
0 |
0 |
0 |
0 |
160 |
| Total |
1 |
1,919 |
8,560 |
184 |
0 |
1 |
0 |
0 |
10,665 |
| Wara |
Males |
0 |
0 |
0 |
0 |
0 |
0 |
0 |
0 |
0 |
| Females |
0 |
0 |
0 |
0 |
0 |
0 |
0 |
0 |
0 |
| Total |
0 |
0 |
0 |
0 |
0 |
0 |
0 |
0 |
0 |
| Muqwaa |
Males |
0 |
0 |
0 |
0 |
0 |
0 |
0 |
0 |
0 |
| Females |
0 |
0 |
0 |
0 |
0 |
0 |
0 |
0 |
0 |
| Total |
0 |
0 |
0 |
0 |
0 |
0 |
0 |
0 |
0 |
| Ahmadi – Desert |
Males |
0 |
36 |
230 |
0 |
0 |
60 |
0 |
0 |
326 |
| Females |
0 |
30 |
0 |
0 |
0 |
6 |
0 |
0 |
36 |
| Total |
0 |
66 |
230 |
0 |
0 |
66 |
0 |
0 |
362 |
| Gawakheer-South |
Males |
0 |
10 |
33 |
0 |
0 |
0 |
0 |
0 |
43 |
| Females |
0 |
0 |
0 |
0 |
0 |
0 |
0 |
0 |
0 |
| Total |
0 |
10 |
33 |
0 |
0 |
0 |
0 |
0 |
43 |
| Fahd Al – Ahmad |
Males |
7,984 |
435 |
3,128 |
37 |
3 |
10 |
3 |
2 |
11,602 |
| Females |
7,912 |
479 |
2,012 |
301 |
6 |
19 |
1 |
5 |
10,735 |
| Total |
15,896 |
914 |
5,140 |
338 |
9 |
29 |
4 |
7 |
22,337 |
| Ali Sabah Alsalem |
Males |
18,142 |
2,594 |
8,519 |
63 |
2 |
0 |
2 |
4 |
29,326 |
| Females |
17,328 |
2,813 |
3,725 |
614 |
3 |
0 |
3 |
2 |
24,488 |
| Total |
35,470 |
5,407 |
12,244 |
677 |
5 |
0 |
5 |
6 |
53,814 |
| Rajm Khashman |
Males |
0 |
27 |
36 |
1 |
0 |
0 |
0 |
0 |
64 |
| Females |
0 |
0 |
0 |
0 |
0 |
0 |
0 |
0 |
0 |
| Total |
0 |
27 |
36 |
1 |
0 |
0 |
0 |
0 |
64 |
| Sabah Al – Ahmad C |
Males |
2 |
0 |
144 |
0 |
46 |
0 |
0 |
0 |
192 |
| Females |
1 |
0 |
16 |
0 |
9 |
0 |
0 |
0 |
26 |
| Total |
3 |
0 |
160 |
0 |
55 |
0 |
0 |
0 |
218 |
| sabah al- ahmad ( 1 ) |
Males |
569 |
13 |
83 |
0 |
0 |
0 |
0 |
0 |
665 |
| Females |
521 |
34 |
53 |
22 |
0 |
0 |
0 |
0 |
630 |
| Total |
1,090 |
47 |
136 |
22 |
0 |
0 |
0 |
0 |
1,295 |
| sabah al- ahmad ( 2 ) |
Males |
0 |
0 |
0 |
0 |
0 |
0 |
0 |
0 |
0 |
| Females |
0 |
0 |
0 |
0 |
0 |
0 |
0 |
0 |
0 |
| Total |
0 |
0 |
0 |
0 |
0 |
0 |
0 |
0 |
0 |
| sabah al- ahmad ( 3 ) |
Males |
25 |
3 |
9 |
0 |
0 |
0 |
0 |
0 |
37 |
| Females |
31 |
5 |
2 |
0 |
0 |
0 |
0 |
0 |
38 |
| Total |
56 |
8 |
11 |
0 |
0 |
0 |
0 |
0 |
75 |
| sabah al- ahmad ( 4 ) |
Males |
0 |
0 |
0 |
0 |
0 |
0 |
0 |
0 |
0 |
| Females |
0 |
0 |
0 |
0 |
0 |
0 |
0 |
0 |
0 |
| Total |
0 |
0 |
0 |
0 |
0 |
0 |
0 |
0 |
0 |
| sabah al- ahmad ( 5 ) |
Males |
0 |
0 |
0 |
0 |
0 |
0 |
0 |
0 |
0 |
| Females |
0 |
0 |
0 |
0 |
0 |
0 |
0 |
0 |
0 |
| Total |
0 |
0 |
0 |
0 |
0 |
0 |
0 |
0 |
0 |
| Kabad – Agriculture |
Males |
0 |
2 |
3 |
0 |
0 |
0 |
0 |
0 |
5 |
| Females |
0 |
0 |
0 |
0 |
0 |
0 |
0 |
0 |
0 |
| Total |
0 |
2 |
3 |
0 |
0 |
0 |
0 |
0 |
5 |
| Al-Kayron residential |
Males |
1 |
0 |
0 |
0 |
0 |
0 |
0 |
0 |
1 |
| Females |
0 |
0 |
0 |
0 |
0 |
0 |
0 |
0 |
0 |
| Total |
1 |
0 |
0 |
0 |
0 |
0 |
0 |
0 |
1 |
| Total Al-Ahmadi Governorate |
Males |
136,924 |
106,973 |
331,673 |
2,019 |
2,217 |
5,013 |
241 |
207 |
585,267 |
| Females |
140,079 |
54,053 |
88,632 |
6,948 |
1,224 |
1,919 |
171 |
134 |
293,160 |
| Total |
277,003 |
161,026 |
420,305 |
8,967 |
3,441 |
6,932 |
412 |
341 |
878,427 |
| Jahra |
Males |
4,342 |
20,224 |
14,792 |
150 |
41 |
7 |
3 |
5 |
39,564 |
| Females |
4,529 |
11,116 |
5,364 |
400 |
44 |
8 |
1 |
2 |
21,464 |
| Total |
8,871 |
31,340 |
20,156 |
550 |
85 |
15 |
4 |
7 |
61,028 |
| Al – Kasser |
Males |
11,855 |
12,373 |
8,949 |
120 |
16 |
3 |
10 |
2 |
33,328 |
| Females |
13,019 |
7,507 |
4,905 |
770 |
16 |
5 |
5 |
2 |
26,229 |
| Total |
24,874 |
19,880 |
13,854 |
890 |
32 |
8 |
15 |
4 |
59,557 |
| Al – Naim |
Males |
4,718 |
1,562 |
2,152 |
57 |
5 |
3 |
1 |
0 |
8,498 |
| Females |
4,571 |
1,530 |
1,382 |
309 |
8 |
2 |
4 |
0 |
7,806 |
| Total |
9,289 |
3,092 |
3,534 |
366 |
13 |
5 |
5 |
0 |
16,304 |
| Al – Naseem |
Males |
6,879 |
1,954 |
3,487 |
86 |
2 |
3 |
0 |
2 |
12,413 |
| Females |
6,937 |
1,654 |
2,174 |
469 |
2 |
1 |
0 |
0 |
11,237 |
| Total |
13,816 |
3,608 |
5,661 |
555 |
4 |
4 |
0 |
2 |
23,650 |
| Taimaa |
Males |
1,025 |
27,947 |
2,900 |
56 |
31 |
30 |
15 |
9 |
32,013 |
| Females |
2,059 |
26,098 |
2,046 |
687 |
29 |
20 |
15 |
4 |
30,958 |
| Total |
3,084 |
54,045 |
4,946 |
743 |
60 |
50 |
30 |
13 |
62,971 |
| Waha |
Males |
10,087 |
4,864 |
6,457 |
120 |
12 |
2 |
0 |
0 |
21,542 |
| Females |
10,809 |
4,397 |
3,817 |
655 |
10 |
5 |
0 |
0 |
19,693 |
| Total |
20,896 |
9,261 |
10,274 |
775 |
22 |
7 |
0 |
0 |
41,235 |
| Al – Auyon |
Males |
11,655 |
4,148 |
6,785 |
147 |
3 |
6 |
1 |
3 |
22,748 |
| Females |
12,005 |
3,687 |
3,720 |
851 |
8 |
4 |
0 |
0 |
20,275 |
| Total |
23,660 |
7,835 |
10,505 |
998 |
11 |
10 |
1 |
3 |
43,023 |
| Sekrab – Reg |
Males |
0 |
7 |
20 |
0 |
0 |
0 |
0 |
0 |
27 |
| Females |
0 |
0 |
0 |
0 |
0 |
0 |
0 |
0 |
0 |
| Total |
0 |
7 |
20 |
0 |
0 |
0 |
0 |
0 |
27 |
| Jahraa Ind |
Males |
0 |
130 |
669 |
1 |
0 |
0 |
0 |
0 |
800 |
| Females |
0 |
11 |
6 |
0 |
0 |
0 |
0 |
0 |
17 |
| Total |
0 |
141 |
675 |
1 |
0 |
0 |
0 |
0 |
817 |
| Sulaibiya -Shabiya |
Males |
1,121 |
24,319 |
2,891 |
52 |
37 |
81 |
55 |
23 |
28,579 |
| Females |
2,809 |
22,258 |
2,043 |
639 |
28 |
67 |
36 |
25 |
27,905 |
| Total |
3,930 |
46,577 |
4,934 |
691 |
65 |
148 |
91 |
48 |
56,484 |
| Sulaibiya – Ind (1) |
Males |
0 |
353 |
1,156 |
0 |
0 |
0 |
0 |
0 |
1,509 |
| Females |
0 |
21 |
8 |
0 |
0 |
0 |
0 |
0 |
29 |
| Total |
0 |
374 |
1,164 |
0 |
0 |
0 |
0 |
0 |
1,538 |
| Sulaibiya – Ind (2) |
Males |
0 |
292 |
2,887 |
24 |
10 |
11 |
11 |
0 |
3,235 |
| Females |
0 |
7 |
33 |
5 |
0 |
3 |
0 |
0 |
48 |
| Total |
0 |
299 |
2,920 |
29 |
10 |
14 |
11 |
0 |
3,283 |
| Sulaibiya – Ind (3) |
Males |
0 |
3 |
0 |
0 |
0 |
0 |
0 |
0 |
3 |
| Females |
0 |
0 |
0 |
0 |
0 |
0 |
0 |
0 |
0 |
| Total |
0 |
3 |
0 |
0 |
0 |
0 |
0 |
0 |
3 |
| Sulaibiya -Agriculture |
Males |
0 |
626 |
2,845 |
8 |
3 |
0 |
1 |
0 |
3,483 |
| Females |
0 |
107 |
10 |
0 |
0 |
0 |
0 |
0 |
117 |
| Total |
0 |
733 |
2,855 |
8 |
3 |
0 |
1 |
0 |
3,600 |
| Abdelli |
Males |
0 |
2,391 |
6,754 |
239 |
2 |
0 |
0 |
0 |
9,386 |
| Females |
0 |
63 |
23 |
0 |
2 |
0 |
0 |
0 |
88 |
| Total |
0 |
2,454 |
6,777 |
239 |
4 |
0 |
0 |
0 |
9,474 |
| Amgara – Ind |
Males |
0 |
2,340 |
8,823 |
54 |
2 |
0 |
0 |
0 |
11,219 |
| Females |
0 |
21 |
39 |
4 |
0 |
0 |
0 |
0 |
64 |
| Total |
0 |
2,361 |
8,862 |
58 |
2 |
0 |
0 |
0 |
11,283 |
| Mitlaa |
Males |
0 |
14 |
1 |
0 |
0 |
0 |
0 |
0 |
15 |
| Females |
0 |
14 |
0 |
0 |
0 |
0 |
0 |
0 |
14 |
| Total |
0 |
28 |
1 |
0 |
0 |
0 |
0 |
0 |
29 |
| Kathma |
Males |
0 |
1 |
100 |
0 |
0 |
0 |
0 |
0 |
101 |
| Females |
0 |
0 |
0 |
0 |
0 |
0 |
0 |
0 |
0 |
| Total |
0 |
1 |
100 |
0 |
0 |
0 |
0 |
0 |
101 |
| Al – Rawadatain |
Males |
0 |
36 |
56 |
0 |
0 |
0 |
0 |
0 |
92 |
| Females |
0 |
1 |
2 |
0 |
0 |
0 |
0 |
0 |
3 |
| Total |
0 |
37 |
58 |
0 |
0 |
0 |
0 |
0 |
95 |
| Aum – Al – Ash |
Males |
0 |
1 |
25 |
0 |
0 |
0 |
0 |
0 |
26 |
| Females |
0 |
0 |
0 |
0 |
0 |
0 |
0 |
0 |
0 |
| Total |
0 |
1 |
25 |
0 |
0 |
0 |
0 |
0 |
26 |
| Al – Salmi |
Males |
0 |
188 |
436 |
5 |
0 |
0 |
0 |
0 |
629 |
| Females |
0 |
6 |
8 |
0 |
0 |
0 |
0 |
0 |
14 |
| Total |
0 |
194 |
444 |
5 |
0 |
0 |
0 |
0 |
643 |
| Kabad |
Males |
0 |
115 |
342 |
4 |
0 |
0 |
0 |
0 |
461 |
| Females |
0 |
14 |
0 |
0 |
0 |
0 |
0 |
0 |
14 |
| Total |
0 |
129 |
342 |
4 |
0 |
0 |
0 |
0 |
475 |
| Shegaya |
Males |
0 |
0 |
0 |
0 |
0 |
0 |
0 |
0 |
0 |
| Females |
0 |
0 |
0 |
0 |
0 |
0 |
0 |
0 |
0 |
| Total |
0 |
0 |
0 |
0 |
0 |
0 |
0 |
0 |
0 |
| Al – Sebiya |
Males |
0 |
1 |
29 |
0 |
0 |
0 |
0 |
0 |
30 |
| Females |
0 |
0 |
1 |
0 |
0 |
0 |
0 |
0 |
1 |
| Total |
0 |
1 |
30 |
0 |
0 |
0 |
0 |
0 |
31 |
| Jahra – Camp |
Males |
0 |
0 |
82 |
0 |
0 |
0 |
0 |
0 |
82 |
| Females |
0 |
0 |
0 |
0 |
0 |
0 |
0 |
0 |
0 |
| Total |
0 |
0 |
82 |
0 |
0 |
0 |
0 |
0 |
82 |
| Al – Atraaf |
Males |
0 |
0 |
0 |
0 |
0 |
0 |
0 |
0 |
0 |
| Females |
0 |
0 |
0 |
0 |
0 |
0 |
0 |
0 |
0 |
| Total |
0 |
0 |
0 |
0 |
0 |
0 |
0 |
0 |
0 |
| Warba Isl |
Males |
0 |
0 |
0 |
0 |
0 |
0 |
0 |
0 |
0 |
| Females |
0 |
0 |
0 |
0 |
0 |
0 |
0 |
0 |
0 |
| Total |
0 |
0 |
0 |
0 |
0 |
0 |
0 |
0 |
0 |
| Bubyan Isl |
Males |
0 |
0 |
0 |
0 |
0 |
0 |
0 |
0 |
0 |
| Females |
0 |
0 |
0 |
0 |
0 |
0 |
0 |
0 |
0 |
| Total |
0 |
0 |
0 |
0 |
0 |
0 |
0 |
0 |
0 |
| Jahara – Desert |
Males |
0 |
530 |
1,199 |
36 |
0 |
0 |
0 |
0 |
1,765 |
| Females |
0 |
9 |
4 |
0 |
0 |
0 |
0 |
0 |
13 |
| Total |
0 |
539 |
1,203 |
36 |
0 |
0 |
0 |
0 |
1,778 |
| Saad Al – Abdulla city |
Males |
29,262 |
5,813 |
12,245 |
241 |
23 |
28 |
8 |
5 |
47,625 |
| Females |
28,917 |
5,480 |
7,471 |
1,625 |
20 |
26 |
6 |
7 |
43,552 |
| Total |
58,179 |
11,293 |
19,716 |
1,866 |
43 |
54 |
14 |
12 |
91,177 |
| Qayrawan |
Males |
6,493 |
984 |
2,469 |
27 |
15 |
53 |
13 |
18 |
10,072 |
| Females |
6,312 |
976 |
1,900 |
445 |
15 |
53 |
6 |
8 |
9,715 |
| Total |
12,805 |
1,960 |
4,369 |
472 |
30 |
106 |
19 |
26 |
19,787 |
| Jahraa -Gawakheer |
Males |
0 |
1 |
2 |
0 |
0 |
0 |
0 |
0 |
3 |
| Females |
0 |
0 |
0 |
0 |
0 |
0 |
0 |
0 |
0 |
| Total |
0 |
1 |
2 |
0 |
0 |
0 |
0 |
0 |
3 |
| Kazma Resort |
Males |
0 |
0 |
0 |
0 |
0 |
0 |
0 |
0 |
0 |
| Females |
0 |
0 |
0 |
0 |
0 |
0 |
0 |
0 |
0 |
| Total |
0 |
0 |
0 |
0 |
0 |
0 |
0 |
0 |
0 |
| AlSubbiya Resort |
Males |
0 |
0 |
0 |
0 |
0 |
0 |
0 |
0 |
0 |
| Females |
0 |
0 |
0 |
0 |
0 |
0 |
0 |
0 |
0 |
| Total |
0 |
0 |
0 |
0 |
0 |
0 |
0 |
0 |
0 |
| Al-Behaith |
Males |
0 |
0 |
0 |
0 |
0 |
0 |
0 |
0 |
0 |
| Females |
0 |
0 |
0 |
0 |
0 |
0 |
0 |
0 |
0 |
| Total |
0 |
0 |
0 |
0 |
0 |
0 |
0 |
0 |
0 |
| Northwest Jahra |
Males |
0 |
14 |
67 |
1 |
0 |
2 |
0 |
0 |
84 |
| Females |
0 |
4 |
5 |
1 |
0 |
0 |
0 |
0 |
10 |
| Total |
0 |
18 |
72 |
2 |
0 |
2 |
0 |
0 |
94 |
| Jaber al-Ahmad |
Males |
2,997 |
459 |
1,010 |
10 |
8 |
21 |
1 |
1 |
4,507 |
| Females |
2,999 |
495 |
687 |
158 |
5 |
12 |
0 |
1 |
4,357 |
| Total |
5,996 |
954 |
1,697 |
168 |
13 |
33 |
1 |
2 |
8,864 |
| neayem |
Males |
0 |
5 |
39 |
0 |
0 |
0 |
0 |
0 |
44 |
| Females |
0 |
0 |
0 |
0 |
0 |
0 |
0 |
0 |
0 |
| Total |
0 |
5 |
39 |
0 |
0 |
0 |
0 |
0 |
44 |
| Total Al-jahra Governorate |
Males |
90,434 |
111,695 |
89,669 |
1,438 |
210 |
250 |
119 |
68 |
293,883 |
| Females |
94,966 |
85,476 |
35,648 |
7,018 |
187 |
206 |
73 |
49 |
223,623 |
| Total |
185,400 |
197,171 |
125,317 |
8,456 |
397 |
456 |
192 |
117 |
517,506 |
| Farwaniya |
Males |
3,064 |
97,276 |
92,707 |
882 |
207 |
119 |
13 |
10 |
194,278 |
| Females |
3,118 |
32,953 |
23,522 |
712 |
134 |
82 |
16 |
10 |
60,547 |
| Total |
6,182 |
130,229 |
116,229 |
1,594 |
341 |
201 |
29 |
20 |
254,825 |
| Surra – Park |
Males |
0 |
0 |
0 |
0 |
0 |
0 |
0 |
0 |
0 |
| Females |
0 |
0 |
0 |
0 |
0 |
0 |
0 |
0 |
0 |
| Total |
0 |
0 |
0 |
0 |
0 |
0 |
0 |
0 |
0 |
| Khitan |
Males |
6,830 |
69,522 |
48,587 |
215 |
170 |
115 |
25 |
10 |
125,474 |
| Females |
7,183 |
17,096 |
17,417 |
718 |
121 |
71 |
11 |
6 |
42,623 |
| Total |
14,013 |
86,618 |
66,004 |
933 |
291 |
186 |
36 |
16 |
168,097 |
| AlRaay |
Males |
0 |
1,150 |
3,757 |
7 |
2 |
0 |
0 |
0 |
4,916 |
| Females |
0 |
11 |
45 |
0 |
0 |
0 |
0 |
0 |
56 |
| Total |
0 |
1,161 |
3,802 |
7 |
2 |
0 |
0 |
0 |
4,972 |
| Omarya |
Males |
4,738 |
1,413 |
3,523 |
28 |
4 |
15 |
6 |
0 |
9,727 |
| Females |
5,193 |
1,099 |
2,762 |
363 |
9 |
13 |
6 |
0 |
9,445 |
| Total |
9,931 |
2,512 |
6,285 |
391 |
13 |
28 |
12 |
0 |
19,172 |
| Rabiya |
Males |
5,447 |
1,770 |
3,855 |
35 |
4 |
15 |
4 |
1 |
11,131 |
| Females |
6,000 |
1,436 |
2,646 |
319 |
10 |
10 |
2 |
5 |
10,428 |
| Total |
11,447 |
3,206 |
6,501 |
354 |
14 |
25 |
6 |
6 |
21,559 |
| Rihab |
Males |
5,720 |
524 |
2,680 |
24 |
0 |
9 |
2 |
2 |
8,961 |
| Females |
5,879 |
466 |
2,188 |
349 |
2 |
9 |
0 |
0 |
8,893 |
| Total |
11,599 |
990 |
4,868 |
373 |
2 |
18 |
2 |
2 |
17,854 |
| Jleeb Al -Shuyoukh |
Males |
2,469 |
78,776 |
176,591 |
442 |
47 |
31 |
33 |
20 |
258,409 |
| Females |
2,401 |
17,839 |
35,038 |
413 |
25 |
19 |
6 |
12 |
55,753 |
| Total |
4,870 |
96,615 |
211,629 |
855 |
72 |
50 |
39 |
32 |
314,162 |
| Reggae |
Males |
306 |
6,937 |
15,610 |
58 |
99 |
79 |
3 |
4 |
23,096 |
| Females |
373 |
3,547 |
7,785 |
115 |
47 |
63 |
2 |
0 |
11,932 |
| Total |
679 |
10,484 |
23,395 |
173 |
146 |
142 |
5 |
4 |
35,028 |
| Andalus |
Males |
11,542 |
5,367 |
7,723 |
64 |
28 |
91 |
24 |
15 |
24,854 |
| Females |
12,203 |
4,336 |
6,025 |
1,014 |
22 |
82 |
13 |
7 |
23,702 |
| Total |
23,745 |
9,703 |
13,748 |
1,078 |
50 |
173 |
37 |
22 |
48,556 |
| Ardiya |
Males |
17,135 |
3,602 |
9,152 |
100 |
17 |
36 |
6 |
0 |
30,048 |
| Females |
18,127 |
3,148 |
6,455 |
1,111 |
15 |
15 |
3 |
0 |
28,874 |
| Total |
35,262 |
6,750 |
15,607 |
1,211 |
32 |
51 |
9 |
0 |
58,922 |
| Sabah Alnasir |
Males |
12,853 |
2,178 |
6,843 |
76 |
6 |
11 |
7 |
1 |
21,975 |
| Females |
13,548 |
2,006 |
4,388 |
662 |
11 |
14 |
8 |
1 |
20,638 |
| Total |
26,401 |
4,184 |
11,231 |
738 |
17 |
25 |
15 |
2 |
42,613 |
| Ardiya(4) |
Males |
0 |
29 |
20 |
44 |
0 |
0 |
0 |
0 |
93 |
| Females |
0 |
13 |
5 |
11 |
1 |
0 |
0 |
0 |
30 |
| Total |
0 |
42 |
25 |
55 |
1 |
0 |
0 |
0 |
123 |
| Ishbiliya |
Males |
6,438 |
1,594 |
3,605 |
46 |
14 |
54 |
0 |
2 |
11,753 |
| Females |
6,741 |
1,513 |
2,901 |
360 |
8 |
49 |
1 |
4 |
11,577 |
| Total |
13,179 |
3,107 |
6,506 |
406 |
22 |
103 |
1 |
6 |
23,330 |
| Ardiya(6) |
Males |
0 |
83 |
504 |
0 |
0 |
1 |
0 |
0 |
588 |
| Females |
0 |
7 |
16 |
0 |
0 |
3 |
0 |
0 |
26 |
| Total |
0 |
90 |
520 |
0 |
0 |
4 |
0 |
0 |
614 |
| Fordus |
Males |
18,159 |
5,196 |
10,733 |
118 |
11 |
13 |
1 |
6 |
34,237 |
| Females |
19,873 |
4,461 |
6,513 |
1,080 |
15 |
10 |
10 |
4 |
31,966 |
| Total |
38,032 |
9,657 |
17,246 |
1,198 |
26 |
23 |
11 |
10 |
66,203 |
| Air Plan Noise Reg |
Males |
0 |
32 |
29 |
0 |
0 |
0 |
0 |
0 |
61 |
| Females |
0 |
2 |
3 |
0 |
0 |
0 |
0 |
0 |
5 |
| Total |
0 |
34 |
32 |
0 |
0 |
0 |
0 |
0 |
66 |
| International Air Port |
Males |
0 |
19 |
224 |
0 |
0 |
0 |
0 |
0 |
243 |
| Females |
0 |
2 |
8 |
0 |
0 |
0 |
0 |
0 |
10 |
| Total |
0 |
21 |
232 |
0 |
0 |
0 |
0 |
0 |
253 |
| Al – Nahda |
Males |
2,347 |
255 |
996 |
16 |
1 |
0 |
0 |
0 |
3,615 |
| Females |
2,358 |
258 |
782 |
187 |
4 |
3 |
0 |
0 |
3,592 |
| Total |
4,705 |
513 |
1,778 |
203 |
5 |
3 |
0 |
0 |
7,207 |
| Abdulla Mubarak AlSabah |
Males |
15,939 |
2,328 |
6,932 |
81 |
22 |
61 |
7 |
13 |
25,383 |
| Females |
15,970 |
2,383 |
5,162 |
985 |
31 |
39 |
6 |
4 |
24,580 |
| Total |
31,909 |
4,711 |
12,094 |
1,066 |
53 |
100 |
13 |
17 |
49,963 |
| Ardiya craft |
Males |
0 |
27 |
10 |
0 |
0 |
0 |
0 |
0 |
37 |
| Females |
0 |
0 |
0 |
0 |
0 |
0 |
0 |
0 |
0 |
| Total |
0 |
27 |
10 |
0 |
0 |
0 |
0 |
0 |
37 |
| Total Al-Farwaniya Governorate |
Males |
112,987 |
278,078 |
394,081 |
2,236 |
632 |
650 |
131 |
84 |
788,879 |
| Females |
118,967 |
92,576 |
123,661 |
8,399 |
455 |
482 |
84 |
53 |
344,677 |
| Total |
231,954 |
370,654 |
517,742 |
10,635 |
1,087 |
1,132 |
215 |
137 |
1,133,556 |
| Mubarak Kabeer |
Males |
14,369 |
873 |
5,432 |
42 |
12 |
33 |
4 |
2 |
20,767 |
| Females |
13,972 |
908 |
5,201 |
904 |
29 |
24 |
3 |
1 |
21,042 |
| Total |
28,341 |
1,781 |
10,633 |
946 |
41 |
57 |
7 |
3 |
41,809 |
| Qurain |
Males |
10,751 |
695 |
4,514 |
30 |
13 |
11 |
6 |
1 |
16,021 |
| Females |
10,560 |
810 |
3,782 |
681 |
19 |
12 |
3 |
0 |
15,867 |
| Total |
21,311 |
1,505 |
8,296 |
711 |
32 |
23 |
9 |
1 |
31,888 |
| Al – Adan |
Males |
11,340 |
851 |
4,743 |
29 |
26 |
30 |
2 |
0 |
17,021 |
| Females |
11,374 |
965 |
4,286 |
714 |
24 |
37 |
5 |
0 |
17,405 |
| Total |
22,714 |
1,816 |
9,029 |
743 |
50 |
67 |
7 |
0 |
34,426 |
| Qosoor |
Males |
12,507 |
897 |
4,996 |
43 |
8 |
10 |
7 |
0 |
18,468 |
| Females |
12,589 |
964 |
4,493 |
757 |
8 |
17 |
8 |
1 |
18,837 |
| Total |
25,096 |
1,861 |
9,489 |
800 |
16 |
27 |
15 |
1 |
37,305 |
| Misila |
Males |
100 |
227 |
689 |
26 |
46 |
5 |
0 |
5 |
1,098 |
| Females |
119 |
93 |
325 |
40 |
42 |
7 |
1 |
1 |
628 |
| Total |
219 |
320 |
1,014 |
66 |
88 |
12 |
1 |
6 |
1,726 |
| AL-masayel |
Males |
104 |
18 |
35 |
0 |
0 |
4 |
0 |
0 |
161 |
| Females |
114 |
18 |
47 |
6 |
0 |
5 |
0 |
0 |
190 |
| Total |
218 |
36 |
82 |
6 |
0 |
9 |
0 |
0 |
351 |
| Subah Alsalim |
Males |
25,275 |
4,340 |
12,400 |
79 |
103 |
141 |
11 |
14 |
42,363 |
| Females |
27,329 |
3,574 |
10,548 |
1,535 |
106 |
109 |
13 |
13 |
43,227 |
| Total |
52,604 |
7,914 |
22,948 |
1,614 |
209 |
250 |
24 |
27 |
85,590 |
| Fanatees |
Males |
58 |
38 |
190 |
2 |
12 |
5 |
0 |
0 |
305 |
| Females |
54 |
15 |
81 |
19 |
6 |
3 |
0 |
0 |
178 |
| Total |
112 |
53 |
271 |
21 |
18 |
8 |
0 |
0 |
483 |
| Sabhan Ind |
Males |
0 |
1,366 |
4,922 |
0 |
2 |
0 |
0 |
0 |
6,290 |
| Females |
0 |
14 |
25 |
0 |
0 |
0 |
0 |
0 |
39 |
| Total |
0 |
1,380 |
4,947 |
0 |
2 |
0 |
0 |
0 |
6,329 |
| Abu – Fatira |
Males |
133 |
23 |
44 |
0 |
0 |
0 |
0 |
0 |
200 |
| Females |
127 |
24 |
30 |
2 |
0 |
1 |
0 |
0 |
184 |
| Total |
260 |
47 |
74 |
2 |
0 |
1 |
0 |
0 |
384 |
| Mid – Reg |
Males |
0 |
73 |
1,972 |
0 |
19 |
0 |
0 |
0 |
2,064 |
| Females |
0 |
14 |
15 |
0 |
99 |
0 |
0 |
0 |
128 |
| Total |
0 |
87 |
1,987 |
0 |
118 |
0 |
0 |
0 |
2,192 |
| West Abu Fateera Ind |
Males |
0 |
7 |
19 |
2 |
0 |
0 |
0 |
0 |
28 |
| Females |
0 |
0 |
0 |
0 |
0 |
0 |
0 |
0 |
0 |
| Total |
0 |
7 |
19 |
2 |
0 |
0 |
0 |
0 |
28 |
| Total Mubarak Al-Kabeer Governorate |
Males |
74,637 |
9,408 |
39,956 |
253 |
241 |
239 |
30 |
22 |
124,786 |
| Females |
76,238 |
7,399 |
28,833 |
4,658 |
333 |
215 |
33 |
16 |
117,725 |
| Total |
150,875 |
16,807 |
68,789 |
4,911 |
574 |
454 |
63 |
38 |
242,511 |
| Not Stated |
Males |
145 |
1,894 |
856 |
14 |
35 |
56 |
3 |
5 |
3,008 |
| Females |
114 |
1,552 |
315 |
22 |
22 |
45 |
2 |
1 |
2,073 |
| Total |
259 |
3,446 |
1,171 |
36 |
57 |
101 |
5 |
6 |
5,081 |
| Total |
Males |
641,282 |
778,883 |
1,154,479 |
8,003 |
8,597 |
12,411 |
935 |
956 |
2,605,546 |
| Females |
666,323 |
398,656 |
503,729 |
48,081 |
7,301 |
7,976 |
689 |
705 |
1,633,460 |
| Total |
1,307,605 |
1,177,539 |
1,658,208 |
56,084 |
15,898 |
20,387 |
1,624 |
1,661 |
4,239,006 |
Source: PACI
ANNEXED NOTE
1. Characteristics of data and definitions
The source of data used here is the Public Authority for Civil Information (PACI), an independant government body in charge of :
1- centralising all population and labour force data in order to manage a fully computerised population register
2- issuing mandatory civil identification cards to every resident of the country, regardless of age and nationality.
The other source of demographic and socioeconomic data on Kuwait is the Central Statistical Office (CSO), operating within the Planning Ministry. The CSO has conducted ten population and housing censuses since its inception in 1957.
Since 1995 a marked discrepancy was witnessed between PACI’ and CSO’ population figures. PACI’ database is connected electronically with other administrations and bodies registering demographic events and professional/ residency issues (births and death; departures and arrivals; end of service, residency and ID deliveries, etc.).
PACI’s records of residents’ movements is thus regularly updated, which limits the risk of population overcount. Therefore, it is more likely that residents were undercounted during CSO- Ministry of Planning’s census operations (see: Shah, N. Population of Kuwait. Structure and Dynamics, Kuwait: Kuwait University Academic Publication Council, 2010, chapter 1).
(a) Kuwaiti: the Kuwaiti nationality rests upon a document of Kuwaiti nationality or a certificate proving Kuwaiti nationality issued by the Ministry of Interior of Kuwait.
(b) Non-Kuwaiti: his/ her nationality is determined by the name of the State which issued the passport. The foreign national also entered Kuwait legally and has a stamp of residence.
This category includes the Bidoon, a category of stateless persons living in the Emirate. Kuwait’s Bidoon population originates from three broad categories:
1) those whose ancestors failed to apply for nationality or lacked necessary documentation at the time of Kuwait’s independence in 1961;
2) those recruited to work in Kuwait’s army or police force during the 1960s who permanently settled in Kuwait, along with their families;
3) children of Kuwaiti mothers and stateless or foreign fathers (see Human Rights Watch. Prisoners of the Past. Kuwaiti Bidun and the Burden of Statelessness, June 2011, p. 3).
(The children of Kuwaiti mothers and non-Kuwaiti fathers (with specific nationality) inherit the father’s nationality. They are stateless if the father is stateless).
(c) Nationality group: collected according to the nationality of the head of the household.
Nationalities are grouped according to specific features common to certain population subgroups: language, geographic origin, etc. or according to internationally recognized categories such as: (Arab / non-Arab Asian countries / non-Arab African countries; European countries … etc.).
2. Institution which provides data
The Public Authority for Civil Information (PACI)
3. Period of data coverage: 31 December 2015
The database is updated three times a year and the website presents only the most recent data.
4. Data availability
The statistics section of PACI’s website (http://www.paci.gov.kw/en/ (English); http://www.paci.gov.kw/ (Arabic)) provides population and socio-economic data broken down by nationality (Kuwaiti/ non-Kuwaiti). Some data are displayed by nationality groups.
Analytical tables and data crosstabulations are available for download in PDF, html, .png and Excel (.csv) formats.
The “publications” section also proposes a selection of data tables processed thematically in downloadable Excel and PDF format (English and Arabic):
https://www.paci.gov.kw/stat/GeneralStat.aspx
The present data is in the “Population” file.
Date of access: May 2016
| year |
administrative deportations |
legal deportations |
Total deportations |
| All charges |
Residence law violations |
All charges |
Residence law violations |
All charges |
Residence law violations |
| Males |
Females |
Males |
Females |
Males |
Females |
Males |
Females |
Males |
Females |
Males |
Females |
| 2009 |
15,216 |
7,808 |
11,206 |
4,935 |
805 |
120 |
22 |
2 |
16,021 |
7,928 |
11,228 |
4,937 |
| 2010 |
15,823 |
8,315 |
7,663 |
2,087 |
828 |
183 |
31 |
2 |
16,651 |
8,498 |
7,694 |
2,089 |
| 2011 |
7,860 |
6,819 |
3,357 |
1,441 |
1,034 |
208 |
46 |
8 |
8,894 |
7,027 |
3,403 |
1,449 |
| 2012 |
7,010 |
8,249 |
3,233 |
1,246 |
814 |
151 |
37 |
6 |
7,824 |
8,400 |
3,270 |
1,252 |
| 2013 |
11,556 |
10,800 |
5,717 |
1,587 |
817 |
131 |
61 |
3 |
12,373 |
10,931 |
5,778 |
1,590 |
| 2014 |
10,659 |
10,107 |
3,881 |
1,134 |
525 |
73 |
17 |
5 |
11,184 |
10,180 |
3,898 |
1,139 |
Source: Ministry of Interior; Ministry of Justice
ANNEXED NOTE
1. Definitions
all charges’ includes ‘residence law violation’
The Interior Minister can issue an order to deport a foreigner in the following cases:
1. If there is a court ruling ordering the deportation of the foreigner after serving a prison sentence (legal deportation).
2. If his/her presence in the country is judged detrimental to public order and security and 3. If he/she does not have an apparent source of income (administrative deportation). The foreigner is then turned over to the Deportation Department, upon decision from the Ministry of Interior.
A deported foreigner will have his dependent family deported with him. Once the deported foreigner leaves the country, he/she is not allowed back to Kuwait, unless the Interior Minister issues amnesty or pardon.
2. Institution which provides data
Central Statistical Bureau (CSB), Ministry of Planning
3. Data availability
Published in the CSB’ Statistical Yearbooks, in Chapter “Social Services and Security”
Statistical Yearbooks are available online at: http://www.csb.gov.kw/Socan_Statistic_EN.aspx?ID=18 (website in English) and at http://www.csb.gov.kw/Socan_Statistic.aspx (Arabic website).
Volumes are bilingual (English and Arabic). Every Yearbook is published in PDF format since 2000 and a selection of 1964 to 1999 volumes is also available in one publication.
Date of access: April 2016
| reference number of permit |
type/ purpose of permit |
2010 |
2011 |
2012 |
2013 |
2014 |
| Number of expired residency holders |
% |
Number of expired residency holders |
% |
Number of expired residency holders |
% |
Number of expired residency holders |
% |
Number of expired residency holders |
% |
| 14 |
Temporary permits |
527 |
14.8 |
950 |
16.7 |
1,255 |
13.1 |
1,929 |
11.8 |
2,614 |
11.8 |
| 17 |
Governmental sector permits |
52 |
1.5 |
52 |
0.9 |
55 |
0.6 |
69 |
0.4 |
101 |
0.4 |
| 18 |
Private sector permits |
1,192 |
33.6 |
1,383 |
24.3 |
2,041 |
21.3 |
3,387 |
20.8 |
3,596 |
20.8 |
| 19 |
Business |
0 |
0.0 |
0 |
0.0 |
0 |
0.0 |
1 |
0.0 |
4 |
0.0 |
| 20 |
Domestic help |
1,483 |
41.8 |
2,973 |
52.2 |
5,674 |
59.2 |
9,996 |
61.4 |
12,685 |
61.4 |
| 22 |
Dependant permits |
278 |
7.8 |
328 |
5.8 |
532 |
5.5 |
891 |
5.5 |
1,802 |
5.5 |
| 23 |
Study |
0 |
0.0 |
0 |
0.0 |
2 |
0.0 |
0 |
0.0 |
0 |
0.0 |
| 24 |
Self residence permits |
17 |
0.5 |
9 |
0.2 |
30 |
0.3 |
15 |
0.1 |
45 |
0.1 |
| TOTAL |
3,549 |
100 |
5,695 |
100 |
9,589 |
100 |
16,288 |
100 |
20,847 |
100 |
Source: Ministry of Interior
ANNEXED NOTE
1. Definitions
The figures refer to foreign residents who are still living in Kuwait at the end of the reference year, but were found contravening the law on residency by staying beyond the period of validity of their residency document.
Residency procedures do not apply to nationals of other GCC countries.
The bidoun, a stateless population, are not included in the residency documents holders.
Dependent permit (number 22): spouse, children or elderly dependent relatives can join visa holder (sponsor) in Kuwait, if the expatriate has obtained a residency and is earning a minimum of 450 KD for public sector employees and 650 for private sector employees.
A working wife cannot sponsor her husband as a dependent. Also, sons over the age of 21 years cannot be sponsored as dependants, though adult daughters and parents may be permitted. Dependent family members are not allowed to work on a Dependent Visa, unless they transfer it into a work visa under Kuwaiti sponsorship. This can be done only after 6 to 12 months of holding a dependent visa.
Every children including new born babies must hold a residency permit. The application for the infant’s residence must be made within 60 days of the birth
The Dependent Visa holder is permitted to stay as long as the sponsor holds a valid visa.
Self residence permit: Expatriates may sponsor themselves under article 24 of the regulations and obtain a residence for two to five years under several conditions
(among which: being aged 60 and more, having worked no less than 25 years in Kuwait, owning a capital of 10000 KD at least; being able to produce a certificate of good conduct, being effectively residing in Kuwait with his/her family, etc.).
This form of residence can be renewed upon expiry. Self-sponsored expatriates may sponsor their wives and children.
Permits 17, 18, 19 and 20 are only granted after Ministry of Labour issues a work permit.
2. Institution which provides data
Ministry of Interior (MoI) and Central Statistical Bureau (CSB), Ministry of Planning.
3. Period of data coverage
December 31st, given years.
4. Data availability
The present data is taken from the report “Migration Statistics”, published by the CSB since 2013.
The reports reproduces Ministry of Interior’s (Directorate of Migration’s) figures of permits granted to foreign residents by type/ purpose of permit, sex and regional origin of holder, since the year 2010.
The report (in Arabic, PDF format with Excel tables) is available on CSB’s website, Arabic section only (Population Statistics, then Migration Statistics)
http://www.csb.gov.kw/Socan_Statistic.aspx?ID=56
Date of access: April 2016.
| |
2010 |
2011 |
2012 |
2013 |
2014 |
| Nationality group |
Number of expired residency holders |
% |
Number of expired residency holders |
% |
Number of expired residency holders |
% |
Number of expired residency holders |
% |
Number of expired residency holders |
% |
| Arab countries |
659 |
18.6 |
809 |
14.2 |
1,226 |
12.8 |
2,329 |
14.3 |
3,826 |
14.3 |
| Non-Arab Asian countries |
2,774 |
78.2 |
4,341 |
76.2 |
7,053 |
73.6 |
10,536 |
64.7 |
11,729 |
64.7 |
| Non-Arab African countries |
79 |
2.2 |
485 |
8.5 |
1,261 |
13.2 |
3,349 |
20.6 |
5,219 |
20.6 |
| Europe |
5 |
0.1 |
12 |
0.2 |
8 |
0.1 |
15 |
0.1 |
19 |
0.1 |
| North America |
23 |
0.6 |
31 |
0.5 |
36 |
0.4 |
35 |
0.2 |
42 |
0.2 |
| Central and South America |
5 |
0.1 |
2 |
0.0 |
5 |
0.1 |
13 |
0.1 |
8 |
0.1 |
| Australia and Oceania |
3 |
0.1 |
15 |
0.3 |
0 |
0.0 |
11 |
0.1 |
4 |
0.1 |
| Other |
1 |
0.0 |
0 |
0.0 |
0 |
0.0 |
0 |
0.0 |
0 |
0.0 |
| Total |
3,549 |
100 |
5,695 |
100 |
9,589 |
100 |
16,288 |
100 |
20,847 |
100 |
Source: Ministry of Interior
ANNEXED NOTE
1. Definitions
The figures refer to foreign residents who are still living in Kuwait at the end of the reference year, but were found contravening the law on residency by staying beyond the period of validity of their residency document.
Residency procedures do not apply to nationals of other GCC countries.
The bidoun, a stateless population, are not included in the residency documents holders.
The figures concern previous holders of all categories of residency permits: labour (number 14-temporary; 17- government labour; 18- private sector labour; 19- business; 20- domestic labour)
and other categories (22- family dependents; 23- student; 24- self-sponsorship).
2. Institution which provides data
Ministry of Interior (MoI) and Central Statistical Bureau (CSB), Ministry of Planning.
3. Period of data coverage
December 31st, given years.
4. Data availability
The present data is taken from the report “Migration Statistics”, published by the CSB since 2013.
The reports reproduces Ministry of Interior’s (Directorate of Migration’s) figures of permits granted to foreign residents by type/ purpose of permit, sex and regional origin of holder, since the year 2010.
The report (in Arabic, PDF format with Excel tables) is available on CSB’s website, Arabic section only (Population Statistics, then Migration Statistics)
http://www.csb.gov.kw/Socan_Statistic.aspx?ID=56
Date of access: April 2016.
| Month/ Year |
Arrests at Saudi borders |
| 11/2012 |
25,553 |
| 12/2012 |
21,378 |
| 1/2013 |
28,816 |
| 2/2013 |
33,005 |
| 3/2013 |
26,213 |
| 4/2013 |
24,344 |
| 5/2013 |
22,276 |
| 6/2013 |
77,552 |
| 7/2013 |
17,837 |
| 8/2013 |
20,305 |
| 9/2013 |
14,698 |
| 10/2013 |
31,436 |
| 11/2013 |
35,116 |
| 12/2013 |
27,328 |
| 01/2014 |
25,534 |
| 02/2014 |
20,260 |
| 03/2014 |
17,541 |
| 04/2014 |
23,080 |
| 05/2014 |
20,474 |
| 06/2014 |
18,939 |
| 07/2014 |
27,050 |
| 08/2014 |
15,905 |
| 09/2014 |
18,500 |
| 10/2014 |
16,817 |
| 11/2014 |
18,242 |
| 12/2014 |
20,515 |
| 1/2015 |
19,347 |
| 2/2015 |
18,605 |
| 3/2015 |
6,884 |
| 4/2015 |
4,485 |
| 5/2015 |
5,065 |
| 6/2015 |
6,327 |
| 7/2015 |
4,078 |
| 8/2015 |
726 |
| 9/2015 |
1,713 |
| 10/2015 |
1,907 |
| 11/2015 |
2,493 |
| 12/2015 |
1,760 |
| 01/2016 |
2,014 |
Source: Ministry of Interior, Border Police.
1. Definition
Infiltrators are persons who entered illegally into Saudi Arabia’s territory.
These arrests are made by border guards (Interior Ministry) at the country’s external borders.
2. Institution which provides data
Ministry of interior
3. Data availability
Figures of arrests at Saudi borders are available on the website of the General Directorate of Border Guard, Ministry of Interior
“Information center”, “Statistics”
https://www.fg.gov.sa/Arabic/MediaCenter/Statistics/Pages/default.aspx
Figures are available by month, back to November 2012 as of April 2016.
Date of access: 7 April 2016.
| |
|
|
Nationals |
Foreign nationals |
Total population |
| Country |
date/ period |
sex |
numbers |
men per 100 women |
numbers |
men per 100 women |
numbers |
men per 100 women |
| Bahrain (1) |
Mid-2014 |
males |
217,760 |
103 |
450,788 |
273 |
668,548 |
178 |
| |
|
females |
211,529 |
164,898 |
376,427 |
| Kuwait (2) |
December 2015 |
males |
400,622 |
92 |
1,759,012 |
228 |
2,159,634 |
179 |
| |
|
females |
433,239 |
772,666 |
1,205,905 |
| Oman(3) |
Mid-2015 |
males |
757,980 |
101 |
1,453,720 |
539 |
2,211,700 |
217 |
| |
|
females |
749,311 |
269,477 |
1,018,788 |
| Qatar (4) |
September 2015 |
males |
93,886 |
96 |
1,580,985 |
458 |
1,674,871 |
378 |
| |
|
females |
97,779 |
344,953 |
442,732 |
| Saudi Arabia (5) |
November 2015 |
males |
6,930,631 |
98 |
6,136,833 |
257 |
13,067,464 |
138 |
| |
|
females |
7,065,469 |
2,384,591 |
9,450,060 |
| United Arab Emirates* (6) |
mid-2010 |
males |
293,981 |
100 |
5,076,366 |
420 |
5,370,347 |
357 |
| |
|
females |
293,571 |
1,209,178 |
1,502,749 |
| GCC Total** |
|
males |
8,694,860 |
98 |
16,457,704 |
320 |
25,152,564 |
180 |
|
|
females |
8,850,898 |
5,145,763 |
13,996,661 |
Sources: national institutes of statistics, latest year or period available as of 20 April 2016.
* Our estimates of non-nationals aged 15 and above for 2010.
** Total provides the sum of population numbers at different dates. It is not exactly the total population at any of these dates.
1- Definition:
Non-nationals are:
1- persons bearing nationality of a foreign State other than the GCC State of residence, or bearing no proof of nationality from any given state (stateless persons and holders of refugee status and travel document in a third country) ;
2- Holders of residence permit residing in the given GCC country at date of census, as per definition of residence used in each of the countries.
Figures for Bahrain and the UAE are estimates.
2- Sources of data:
(1) Bahrain Central Informatics Organisation (CIO), CIO’s website, “Statistics” and “Population” sections http://www.data.gov.bh/en/ResourceCenter
(2) Kuwait Public Authority for Civil Information (PACI), “Population” Bulletin 2015, 31 December 2015
(3) National Centre for Statistical Information (NCSI), Bulletin of Population Statistics n°5, 2015
(4) Qatar Statistics Authority (QSA), Labor Force Survey 2015, Third Quarter (July-September 2015).
(5) Saudi Arabia Central Department for Statistics and Information (CDSI), Labour Force Survey 2015 (Round 2)
(6) UAE National Bureau of Statistics (NBS), our estimates from: http://www.uaestatistics.gov.ae/EnglishHome/ReportDetailsEnglish/tabid/121/Default.aspx?ItemId=1914&PTID=104&MenuId=1
Date of access: 20 April 2016
| |
date/ period |
Total population |
date/ period |
Nationals |
Foreign nationals |
% in total population |
| Country |
Nationals |
Foreign nationals |
| Bahrain (1) |
mid-2014 |
1,314,562 |
mid-2014 |
630,744 |
683,818 |
48.0 |
52.0 |
| Kuwait (2) |
31 March 2016 |
4,294,171 |
31 March 2016 |
1,316,147 |
2,978,024 |
30.6 |
69.4 |
| Oman (3) |
20 April 2016 |
4,419,193 |
20 April 2016 |
2,412,624 |
2,006,569 |
54.6 |
45.4 |
| Qatar (4) |
April 2015 |
2,404,776 |
April 2010 |
243,019 |
2,161,757 |
10.1 |
89.9 |
| Saudi Arabia (5) |
mid-2014 |
30,770,375 |
mid-2014 |
20,702,536 |
10,067,839 |
67.3 |
32.7 |
| United Arab Emirates (6) |
mid-2010 |
8,264,070 |
mid-2010 |
947,997 |
7,316,073 |
11.5 |
88.5 |
| Total* |
|
51,467,147 |
|
26,253,067 |
25,214,080 |
51.0 |
49.0 |
Sources: national institutes of statistics, latest year or period available as of 20 April 2016.
* Total provides the sum of population numbers at different dates. It is not exactly the total population at any of these dates.
1- Definition:
Non-nationals are:
1- persons bearing nationality of a foreign State other than the GCC State of residence, or bearing no proof of nationality from any given state (stateless persons and holders of refugee status and travel document in a third country) ;
2- Holders of residence permit residing in the given GCC country at date of census, as per definition of residence used in each of the countries.
Figures for Bahrain, Saudi Arabia and the UAE are estimates.
2- Sources of data:
(1) Bahrain Central Informatics Organisation (CIO), CIO’s website, “Statistics” and “Population” sections http://www.data.gov.bh/en/ResourceCenter
(2) Kuwait Public Authority for Civil Information (PACI), Homepage as of 20 April 2016, http://www.paci.gov.kw/en/
(3) National Centre for Statistical Information (NCSI), homepage as of 20 April 2016, http://www.ncsi.gov.om/NCSI_website/N_default.aspx;
(4) Qatar Ministry of Development Planning and Statistics, census 2015 (total population); Qatar Statistics Authority (QSA), Census 2010, http://gulfmigration.eu/population-by-nationality-qatari-non-qatari-census-1970-2010/;
(5) Saudi Arabia Central Department for Statistics and Information (CDSI), estimates. http://www.cdsi.gov.sa/
(6) UAE National Bureau of Statistics (NBS), estimates. http://www.uaestatistics.gov.ae/EnglishHome/ReportDetailsEnglish/tabid/121/Default.aspx?ItemId=1914&PTID=104&MenuId=1
Date of access: 20 April 2016
|
Monthly figures |
Cumulated figures |
| 3/2011 |
33,323 |
33,323 |
| 4/2011 |
34,311 |
67,634 |
| 5/2011 |
30,504 |
98,138 |
| 6/2011 |
38,703 |
136,841 |
| 7/2011 |
29,724 |
166,565 |
| 8/2011 |
30,751 |
197,316 |
| 9/2011 |
43,704 |
241,020 |
| 10/2011 |
36,087 |
277,107 |
| 11/2011 |
53,014 |
330,121 |
| 12/2011 |
54,384 |
384,505 |
| Total 3 to 12/ 2011 |
384,505 |
|
| 1/2012 |
47,473 |
431,978 |
| 2/2012 |
48,826 |
480,804 |
| 3/2012 |
46,413 |
527,217 |
| 4/2012 |
49,296 |
576,513 |
| 5/2012 |
50,734 |
627,247 |
| 6/2012 |
53,851 |
681,098 |
| 7/2012 |
44,693 |
725,791 |
| 8/2012 |
60,972 |
786,763 |
| 9/2012 |
51,963 |
838,726 |
| 10/2012 |
41,944 |
880,670 |
| 11/2012 |
51,049 |
931,719 |
| 12/2012 |
47,288 |
979,007 |
| Total 2012 |
594,502 |
|
| 1/2013 |
46,579 |
1,025,586 |
| 2/2013 |
51,009 |
1,076,595 |
| 3/2013 |
52,322 |
1,128,917 |
| 4/2013 |
53,713 |
1,182,630 |
| 5/2013 |
61,203 |
1,243,833 |
| 6/2013 |
50,157 |
1,293,990 |
| 7/2013 |
30,585 |
1,324,575 |
| 8/2013 |
29,395 |
1,353,970 |
| 9/2013 |
34,266 |
1,388,236 |
| 10/2013 |
32,300 |
1,420,536 |
| 11/2013 |
123,470 |
1,544,006 |
| 12/2013 |
100,961 |
1,644,967 |
| Total 2013 |
665,960 |
|
| 01/2014 |
55,069 |
1,700,036 |
| 02/2014 |
52,283 |
1,752,319 |
| 03/2014 |
50,960 |
1,803,279 |
| 04/2014 |
42,295 |
1,845,574 |
| 05/2014 |
49,437 |
1,895,011 |
| 06/2014 |
50,543 |
1,945,554 |
| 07/2014 |
44,119 |
1,989,673 |
| 08/2014 |
43,650 |
2,033,323 |
| 09/2014 |
55,186 |
2,088,509 |
| 10/2014 |
44,781 |
2,133,290 |
| 11/2014 |
55,410 |
2,188,700 |
| 12/2014 |
61,687 |
2,250,387 |
| Total 2014 |
605,420 |
|
| 01/2015 |
55,930 |
2,306,317 |
| 02/2015 |
58,230 |
2,364,547 |
| 03/2015 |
63,134 |
2,427,681 |
| 04/2015 |
63,785 |
2,491,466 |
| 05/2015 |
47,405 |
2,538,871 |
| 06/2015 |
31,403 |
2,570,274 |
| 07/2015 |
21,355 |
2,591,629 |
| 08/2015 |
21,676 |
2,613,305 |
| 09/2015 |
24,214 |
2,637,519 |
| 10/2015 |
18,257 |
2,655,776 |
| 11/2015 |
34,107 |
2,689,883 |
| 12/2015 |
28,379 |
2,718,262 |
| Total 2014 |
467,875 |
|
| 01/2016 |
29,050 |
2,747,312 |
| 02/2016 |
30,403 |
2,777,715 |
Source: Ministry of Interior.
1. Definition
Saudi Arabia for years has been routinely performing deportations of illegal workers, during amnesty periods and rounding up operations of various scales.
Nitaqat, a massive program of saudization of the work force, was formally launched by the Saudi Ministry of Labour in September 2011 (Ministerial Resolution n°4040, dated 12/10/1432 H.).
Premium and Green categories include the companies with highest Saudization rates, while Yellow and Red include the ones with low rates.
The amnesty period expired on November 3rd, 2013. Since then, systematic country-wide raid operations are conducted by Ministry of Labour (in work sites) and by Ministry of Interior (in locations inhabited by aliens).
Deported workersare barred from coming back.
2. Institution which provides data
Ministry of interior
3. Data availability
Monthly figures for irregulars’ arrests and deportations are available online on the Ministry of Interior’s website,
Section “National center for security operations”, “monthly statistics”.
Figures are computed by Hijrah months, in Arabic only.
Last date of access: 07 April 2016
|
2014 |
|
Males |
Females |
Total |
| Arab countries |
860 |
810 |
1,670 |
| Non-Arab Asian countries |
194 |
217 |
411 |
| Non-Arab African countries |
7 |
10 |
17 |
| Europe |
19 |
21 |
40 |
| North America |
42 |
23 |
65 |
| Central and South America |
7 |
1 |
8 |
| Australia and Oceania |
4 |
5 |
9 |
| Other |
0 |
0 |
0 |
| Total |
1,133 |
1,087 |
2,220 |
Source: Ministry of Interior
ANNEXED NOTE
1. Definitions
Residency procedures do not apply to GCC nationals.
The bidoun, a stateless population, are not included in the residency documents holders.
Data presented in the table are stock data: all the non-national residents holding a residence permit on December 31st, the given year. The table excludes the Bedoon, the non-Kuwaiti GCC citizens and those in irregular situation.
Self sponsorship permit: Expatriates may sponsor themselves under article 24 of the regulations and obtain a residence for two to five years under several conditions
(among which: being aged 60 and more, having worked no less than 25 years in Kuwait, owning a capital of 10000 KD at least; being able to produce a certificate of good conduct, being effectively residing in Kuwait with his/her family, etc.).
This form of residence can be renewed upon expiry. Self-sponsored expatriates may sponsor their wives and children.
Totals for the year 2012 presented here differ slightly from totals in other tables pertaining to this year published in the database.
2. Institution which provides data
Central Statistical Bureau (CSB), Ministry of Planning.
3. Period of data coverage
December 31st, given years.
4. Data availability
The present data is taken from the report “Migration Statistics 2014”, published by the CSB.
The report processes Ministry of Interior’s (Directorate of Migration’s) raw figures of permits granted to foreign residents by type/ purpose of permit, sex and regional origin of holder, for the years 2011 to 2014.
The report (in Arabic, PDF format with Excel tables) is available on CSB’s website (Population Statistics, then Migration Statistics)
http://www.csb.gov.kw/Socan_Statistic.aspx?ID=56
Date of access: February 2016.
|
2014 |
|
Males |
Females |
Total |
| Arab countries |
73 |
20 |
93 |
| Non-Arab Asian countries |
265 |
102 |
367 |
| Non-Arab African countries |
285 |
60 |
345 |
| Europe |
26 |
13 |
39 |
| North America |
5 |
6 |
11 |
| Central and South America |
0 |
0 |
0 |
| Australia and Oceania |
0 |
0 |
0 |
| Other |
0 |
0 |
0 |
| Total |
654 |
201 |
855 |
Source: Ministry of Interior
ANNEXED NOTE
1. Definitions
Residency procedures do not apply to GCC nationals.
The bidoun, a stateless population, are not included in the residency documents holders.
Data presented in the table are stock data: all the non-national residents holding a residence permit on December 31st, the given year. The table excludes the Bedoon, the non-Kuwaiti GCC citizens and those in irregular situation.
Totals for the year 2012 presented here differ slightly from totals in other tables pertaining to this year published in the database.
2. Institution which provides data
Central Statistical Bureau (CSB), Ministry of Planning.
3. Period of data coverage
December 31st, given years.
4. Data availability
The present data is taken from the report “Migration Statistics 2014”, published by the CSB.
The report processes Ministry of Interior’s (Directorate of Migration’s) raw figures of permits granted to foreign residents by type/ purpose of permit, sex and regional origin of holder, for the years 2011 to 2014.
The report (in Arabic, PDF format with Excel tables) is available on CSB’s website (Population Statistics, then Migration Statistics)
http://www.csb.gov.kw/Socan_Statistic.aspx?ID=56
Date of access: February 2016.
| reference number of permit |
purpose of permit |
type of permits |
Males |
Females |
Total |
| 22 |
residence |
Dependant permits |
191,673 |
331,611 |
523,284 |
| 23 |
Study |
654 |
201 |
855 |
| 24 |
Self residence permits |
1,133 |
1,087 |
2,220 |
| 17 |
work |
Governmental sector permits |
64,978 |
36,821 |
101,799 |
| 18 |
Private sector permits |
1,114,283 |
104,676 |
1,218,959 |
| 19 |
Business |
342 |
20 |
362 |
| 20 |
Domestic help |
264,870 |
355,669 |
620,539 |
| TOTAL |
1,637,933 |
830,085 |
2,468,018 |
Source: Ministry of Interior
ANNEXED NOTE
1. Definitions
Residency procedures do not apply to GCC nationals.
The bidoun, a stateless population, are not included in the residency documents holders.
Data presented in the table are stock data: all the non-national residents holding a residence permit on December 31st, the given year. The table excludes the Bedoon, the non-Kuwaiti GCC citizens and those in irregular situation.
Dependent permit: spouse, children or elderly dependent relatives can join visa holder (sponsor) in Kuwait, if the expatriate has obtained a residency and is earning a minimum of KD250 a month (private and governement sector alike).
A working wife cannot sponsor her husband as a dependent. Also, sons over the age of 21 years cannot be sponsored as dependants, though adult daughters and parents may be permitted. Dependent family members are not allowed to work on a Dependent Visa, unless they transfer it into a work visa under Kuwaiti sponsorship. This can be done only after 6 to 12 months of holding a dependent visa.
Every children including new born babies must hold a residency permit. The application for the infant’s residence must be made within 60 days of the birth
The Dependent Visa holder is permitted to stay as long as the sponsor holds a valid visa.
Self residence permit: Expatriates may sponsor themselves under article 24 of the regulations and obtain a residence for two to five years under several conditions
(among which: being aged 60 and more, having worked no less than 25 years in Kuwait, owning a capital of 10000 KD at least; being able to produce a certificate of good conduct, being effectively residing in Kuwait with his/her family, etc.).
This form of residence can be renewed upon expiry. Self-sponsored expatriates may sponsor their wives and children.
Permits 17, 18, 19 and 20 are only granted after Ministry of Labour issues a work permit.
2. Institution which provides data
Central Statistical Bureau (CSB), Ministry of Planning.
3. Period of data coverage
December 31st, given years.
4. Data availability
The present data is taken from the report “Migration Statistics 2014”, published by the CSB.
The report processes Ministry of Interior’s (Directorate of Migration’s) raw figures of permits granted to foreign residents by type/ purpose of permit, sex and regional origin of holder, for the years 2011 to 2014.
The report (in Arabic, PDF format with Excel tables) is available on CSB’s website (Population Statistics, then Migration Statistics)
http://www.csb.gov.kw/Socan_Statistic.aspx?ID=56
Date of access: February 2016.
|
2014 |
|
Males |
Females |
Total |
| Arab countries |
126,495 |
205,215 |
331,710 |
| Non-Arab Asian countries |
58,362 |
115,871 |
174,233 |
| Non-Arab African countries |
650 |
1,414 |
2,064 |
| Europe |
1,672 |
3,249 |
4,921 |
| North America |
3,956 |
5,027 |
8,983 |
| Central and South America |
212 |
369 |
581 |
| Australia and Oceania |
323 |
464 |
787 |
| Other |
3 |
2 |
5 |
| Total |
191,673 |
331,611 |
523,284 |
Source: Ministry of Interior
ANNEXED NOTE
1. Definitions
Residency procedures do not apply to GCC nationals.
The bidoun, a stateless population, are not included in the residency documents holders.
Data presented in the table are stock data: all the non-national residents holding a residence permit on December 31st, the given year. The table excludes the Bedoon, the non-Kuwaiti GCC citizens and those in irregular situation.
Totals for the year 2012 presented here differ slightly from totals in other tables pertaining to this year published in the database.
2. Institution which provides data
Central Statistical Bureau (CSB), Ministry of Planning.
3. Period of data coverage
December 31st, given years.
4. Data availability
The present data is taken from the report “Migration Statistics 2014”, published by the CSB.
The report processes Ministry of Interior’s (Directorate of Migration’s) raw figures of permits granted to foreign residents by type/ purpose of permit, sex and regional origin of holder, for the years 2011 to 2014.
The report (in Arabic, PDF format with Excel tables) is available on CSB’s website (Population Statistics, then Migration Statistics)
http://www.csb.gov.kw/Socan_Statistic.aspx?ID=56
Date of access: February 2016.
|
2014 |
|
Males |
Females |
Total |
| Arab countries |
2,788 |
264 |
3,052 |
| Non-Arab Asian countries |
258,637 |
294,735 |
553,372 |
| Non-Arab African countries |
3,437 |
60,656 |
64,093 |
| Europe |
4 |
2 |
6 |
| North America |
0 |
1 |
1 |
| Central and South America |
3 |
6 |
9 |
| Australia and Oceania |
0 |
5 |
5 |
| Other |
1 |
0 |
1 |
| Total |
264,870 |
355,669 |
620,539 |
Source: Ministry of Interior
ANNEXED NOTE
1. Definitions
Residency procedures do not apply to GCC nationals.
The bidoun, a stateless population, are not included in the residency documents holders.
Data presented in the table are stock data: all the non-national residents holding a residence permit on December 31st, the given year. The table excludes the Bedoon, the non-Kuwaiti GCC citizens and those in irregular situation.
Permits 17, 18, 19 and 20 are only granted after Ministry of Labour issues a work permit.
“Domestic services” designate the activities performed within households, such as that of personal drivers, cooks, nannies, servants, sheperds, governesses, etc.
Totals for the year 2012 presented here differ slightly from totals in other tables pertaining to this year published in the database.
2. Institution which provides data
Central Statistical Bureau (CSB), Ministry of Planning.
3. Period of data coverage
December 31st, given years.
4. Data availability
The present data is taken from the report “Migration Statistics 2014”, published by the CSB.
The report processes Ministry of Interior’s (Directorate of Migration’s) raw figures of permits granted to foreign residents by type/ purpose of permit, sex and regional origin of holder, for the years 2011 to 2014.
The report (in Arabic, PDF format with Excel tables) is available on CSB’s website (Population Statistics, then Migration Statistics)
http://www.csb.gov.kw/Socan_Statistic.aspx?ID=56
Date of access: February 2016.
|
2014 |
|
Males |
Females |
Total |
| Arab countries |
413,314 |
27,769 |
441,083 |
| Non-Arab Asian countries |
686,093 |
70,789 |
756,882 |
| Non-Arab African countries |
3,897 |
2,353 |
6,250 |
| Europe |
3,876 |
1,583 |
5,459 |
| North America |
6,332 |
1,965 |
8,297 |
| Central and South America |
340 |
88 |
428 |
| Australia and Oceania |
429 |
129 |
558 |
| Other |
2 |
0 |
2 |
| Total |
1,114,283 |
104,676 |
1,218,959 |
Source: Ministry of Interior
ANNEXED NOTE
1. Definitions
Residency procedures do not apply to GCC nationals.
The bidoun, a stateless population, are not included in the residency documents holders.
Data presented in the table are stock data: all the non-national residents holding a residence permit on December 31st, the given year. The table excludes the Bedoon, the non-Kuwaiti GCC citizens and those in irregular situation.
Permits 17, 18, 19 and 20 are only granted after Ministry of Labour issues a work permit.
Totals for the year 2012 presented here differ slightly from totals in other tables pertaining to this year published in the database.
2. Institution which provides data
Central Statistical Bureau (CSB), Ministry of Planning.
3. Period of data coverage
December 31st, given years.
4. Data availability
The present data is taken from the report “Migration Statistics 2014”, published by the CSB.
The report processes Ministry of Interior’s (Directorate of Migration’s) raw figures of permits granted to foreign residents by type/ purpose of permit, sex and regional origin of holder, for the years 2011 to 2014.
The report (in Arabic, PDF format with Excel tables) is available on CSB’s website (Population Statistics, then Migration Statistics)
http://www.csb.gov.kw/Socan_Statistic.aspx?ID=56
Date of access: February 2016.
|
2014 |
|
Males |
Females |
Total |
| Arab countries |
195 |
14 |
209 |
| Non-Arab Asian countries |
125 |
2 |
127 |
| Non-Arab African countries |
0 |
0 |
0 |
| Europe |
7 |
3 |
10 |
| North America |
13 |
1 |
14 |
| Central and South America |
1 |
0 |
1 |
| Australia and Oceania |
1 |
0 |
1 |
| Other |
0 |
0 |
0 |
| Total |
342 |
20 |
362 |
Source: Ministry of Interior
ANNEXED NOTE
1. Definitions
Residency procedures do not apply to GCC nationals.
The bidoun, a stateless population, are not included in the residency documents holders.
Data presented in the table are stock data: all the non-national residents holding a residence permit on December 31st, the given year. The table excludes the Bedoon, the non-Kuwaiti GCC citizens and those in irregular situation.
Permits 17, 18, 19 and 20 are only granted after Ministry of Labour issues a work permit.
Totals for the year 2012 presented here differ slightly from totals in other tables pertaining to this year published in the database.
2. Institution which provides data
Central Statistical Bureau (CSB), Ministry of Planning.
3. Period of data coverage
December 31st, given years.
4. Data availability
The present data is taken from the report “Migration Statistics 2014”, published by the CSB.
The report processes Ministry of Interior’s (Directorate of Migration’s) raw figures of permits granted to foreign residents by type/ purpose of permit, sex and regional origin of holder, for the years 2011 to 2014.
The report (in Arabic, PDF format with Excel tables) is available on CSB’s website (Population Statistics, then Migration Statistics)
http://www.csb.gov.kw/Socan_Statistic.aspx?ID=56
Date of access: February 2016.
|
2014 |
|
Males |
Females |
Total |
| Arab countries |
39,484 |
20,062 |
59,546 |
| Non-Arab Asian countries |
23,630 |
16,061 |
39,691 |
| Non-Arab African countries |
371 |
160 |
531 |
| Europe |
637 |
331 |
968 |
| North America |
754 |
172 |
926 |
| Central and South America |
54 |
23 |
77 |
| Australia and Oceania |
47 |
12 |
59 |
| Other |
1 |
0 |
1 |
| Total |
64,978 |
36,821 |
101,799 |
Source: Ministry of Interior
ANNEXED NOTE
1. Definitions
Residency procedures do not apply to GCC nationals.
The bidoun, a stateless population, are not included in the residency documents holders.
Data presented in the table are stock data: all the non-national residents holding a residence permit on December 31st, the given year. The table excludes the Bedoon, the non-Kuwaiti GCC citizens and those in irregular situation.
Permits 17, 18, 19 and 20 are only granted after Ministry of Labour issues a work permit.
Totals for the year 2012 presented here differ slightly from totals in other tables pertaining to this year published in the database.
2. Institution which provides data
Central Statistical Bureau (CSB), Ministry of Planning.
3. Period of data coverage
December 31st, given years.
4. Data availability
The present data is taken from the report “Migration Statistics 2014”, published by the CSB.
The report processes Ministry of Interior’s (Directorate of Migration’s) raw figures of permits granted to foreign residents by type/ purpose of permit, sex and regional origin of holder, for the years 2011 to 2014.
The report (in Arabic, PDF format with Excel tables) is available on CSB’s website (Population Statistics, then Migration Statistics)
http://www.csb.gov.kw/Socan_Statistic.aspx?ID=56
Date of access: February 2016.
|
2014 |
|
Males |
Females |
Number |
| Arab countries |
583,209 |
254,154 |
837,363 |
| Non-Arab Asian countries |
1,027,306 |
497,777 |
1,525,083 |
| Non-Arab African countries |
8,647 |
64,653 |
73,300 |
| Europe |
6,241 |
5,202 |
11,443 |
| North America |
11,102 |
7,195 |
18,297 |
| Central and South America |
617 |
487 |
1,104 |
| Australia and Oceania |
804 |
615 |
1,419 |
| Other |
7 |
2 |
9 |
| Total |
1,637,933 |
830,085 |
2,468,018 |
Source: Ministry of Interior
ANNEXED NOTE
1. Definitions
Residency procedures do not apply to GCC nationals.
The bidoun, a stateless population, are not included in the residency documents holders.
Data presented in the table are stock data: all the non-national residents holding a residence permit on December 31st, the given year. The table excludes the Bedoon, the non-Kuwaiti GCC citizens and those in irregular situation.
Dependent permit: spouse, children or elderly dependent relatives can join visa holder (sponsor) in Kuwait, if the expatriate has obtained a residency and is earning a minimum of KD250 a month (private and governement sector alike).
A working wife cannot sponsor her husband as a dependent. Also, sons over the age of 21 years cannot be sponsored as dependants, though adult daughters and parents may be permitted. Dependent family members are not allowed to work on a Dependent Visa, unless they transfer it into a work visa under Kuwaiti sponsorship. This can be done only after 6 to 12 months of holding a dependent visa.
Every children including new born babies must hold a residency permit. The application for the infant’s residence must be made within 60 days of the birth
The Dependent Visa holder is permitted to stay as long as the sponsor holds a valid visa.
Self residence permit: Expatriates may sponsor themselves under article 24 of the regulations and obtain a residence for two to five years under several conditions
(among which: being aged 60 and more, having worked no less than 25 years in Kuwait, owning a capital of 10000 KD at least; being able to produce a certificate of good conduct, being effectively residing in Kuwait with his/her family, etc.).
This form of residence can be renewed upon expiry. Self-sponsored expatriates may sponsor their wives and children.
Permits 17, 18, 19 and 20 are only granted after Ministry of Labour issues a work permit.
The present figures do not include the holders of permit n°14 (temporary residents).
Totals for the year 2012 presented here differ slightly from totals in other tables pertaining to this year published in the database.
2. Institution which provides data
Central Statistical Bureau (CSB), Ministry of Planning.
3. Period of data coverage
December 31st, given years.
4. Data availability
The present data is taken from the report “Migration Statistics 2014”, published by the CSB.
The report processes Ministry of Interior’s (Directorate of Migration’s) raw figures of permits granted to foreign residents by type/ purpose of permit, sex and regional origin of holder, for the years 2011 to 2014.
The report (in Arabic, PDF format with Excel tables) is available on CSB’s website (Population Statistics, then Migration Statistics)
http://www.csb.gov.kw/Socan_Statistic.aspx?ID=56
Date of access: February 2016.
| reference number of permit |
purpose of permit |
type of permits |
2014 |
| 22 |
residence |
Dependant permits |
523,284 |
| 23 |
Study |
855 |
| 24 |
Self residence permits |
2,220 |
| 17 |
work |
Governmental sector permits |
101,799 |
| 18 |
Private sector permits |
1,218,959 |
| 19 |
Business |
362 |
| 20 |
Domestic help |
620,539 |
| TOTAL |
2,468,018 |
Source: Ministry of Interior
ANNEXED NOTE
1. Definitions
Residency procedures do not apply to GCC nationals.
The bidoun, a stateless population, are not included in the residency documents holders.
Data presented in the table are stock data: all the non-national residents holding a residence permit on December 31st, the given year. The table excludes the Bedoon, the non-Kuwaiti GCC citizens and those in irregular situation.
Dependent permit: spouse, children or elderly dependent relatives can join visa holder (sponsor) in Kuwait, if the expatriate has obtained a residency and is earning a minimum of KD250 a month (private and governement sector alike).
A working wife cannot sponsor her husband as a dependent. Also, sons over the age of 21 years cannot be sponsored as dependants, though adult daughters and parents may be permitted. Dependent family members are not allowed to work on a Dependent Visa, unless they transfer it into a work visa under Kuwaiti sponsorship. This can be done only after 6 to 12 months of holding a dependent visa.
Every children including new born babies must hold a residency permit. The application for the infant’s residence must be made within 60 days of the birth
The Dependent Visa holder is permitted to stay as long as the sponsor holds a valid visa.
Self residence permit: Expatriates may sponsor themselves under article 24 of the regulations and obtain a residence for two to five years under several conditions
(among which: being aged 60 and more, having worked no less than 25 years in Kuwait, owning a capital of 10000 KD at least; being able to produce a certificate of good conduct, being effectively residing in Kuwait with his/her family, etc.).
This form of residence can be renewed upon expiry. Self-sponsored expatriates may sponsor their wives and children.
Permits 17, 18, 19 and 20 are only granted after Ministry of Labour issues a work permit.
2. Institution which provides data
Central Statistical Bureau (CSB), Ministry of Planning.
3. Period of data coverage
December 31st, given years.
4. Data availability
The present data is taken from the report “Migration Statistics 2014”, published by the CSB.
The report processes Ministry of Interior’s (Directorate of Migration’s) raw figures of permits granted to foreign residents by type/ purpose of permit, sex and regional origin of holder, for the years 2011 to 2014.
The report (in Arabic, PDF format with Excel tables) is available on CSB’s website (Population Statistics, then Migration Statistics)
http://www.csb.gov.kw/Socan_Statistic.aspx?ID=56
Date of access: February 2016.
| |
2014 |
| |
Number |
% |
| Arab countries |
837,363 |
33.93 |
| Non-Arab Asian countries |
1,525,083 |
61.79 |
| Non-Arab African countries |
73,300 |
2.97 |
| Europe |
11,443 |
0.46 |
| North America |
18,297 |
0.74 |
| Central and South America |
1,104 |
0.04 |
| Australia and Oceania |
1,419 |
0.06 |
| Other |
9 |
0.00 |
| Total |
2,468,018 |
100.00 |
Source: Ministry of Interior
ANNEXED NOTE
1. Definitions
Residency procedures do not apply to GCC nationals.
The bidoun, a stateless population, are not included in the residency documents holders.
Data presented in the table are stock data: all the non-national residents holding a residence permit on December 31st, the given year. The table excludes the Bedoon, the non-Kuwaiti GCC citizens and those in irregular situation.
Dependent permit: spouse, children or elderly dependent relatives can join visa holder (sponsor) in Kuwait, if the expatriate has obtained a residency and is earning a minimum of KD250 a month (private and governement sector alike).
A working wife cannot sponsor her husband as a dependent. Also, sons over the age of 21 years cannot be sponsored as dependants, though adult daughters and parents may be permitted. Dependent family members are not allowed to work on a Dependent Visa, unless they transfer it into a work visa under Kuwaiti sponsorship. This can be done only after 6 to 12 months of holding a dependent visa.
Every children including new born babies must hold a residency permit. The application for the infant’s residence must be made within 60 days of the birth
The Dependent Visa holder is permitted to stay as long as the sponsor holds a valid visa.
Self residence permit: Expatriates may sponsor themselves under article 24 of the regulations and obtain a residence for two to five years under several conditions
(among which: being aged 60 and more, having worked no less than 25 years in Kuwait, owning a capital of 10000 KD at least; being able to produce a certificate of good conduct, being effectively residing in Kuwait with his/her family, etc.).
This form of residence can be renewed upon expiry. Self-sponsored expatriates may sponsor their wives and children.
Permits 17, 18, 19 and 20 are only granted after Ministry of Labour issues a work permit.
The present figures do not include the holders of permit n°14 (temporary residents).
Totals for the year 2012 presented here differ slightly from totals in other tables published in the database.
2. Institution which provides data
Central Statistical Bureau (CSB), Ministry of Planning.
3. Period of data coverage
December 31st, given years.
4. Data availability
The present data is taken from the report “Migration Statistics 2014”, published by the CSB.
The report processes Ministry of Interior’s (Directorate of Migration’s) raw figures of permits granted to foreign residents by type/ purpose of permit, sex and regional origin of holder, for the years 2011 to 2014.
The report (in Arabic, PDF format with Excel tables) is available on CSB’s website (Population Statistics, then Migration Statistics)
http://www.csb.gov.kw/Socan_Statistic.aspx?ID=56
Date of access: February 2016.
|
Applications |
Approved transfers |
| Males |
Females |
Total |
Males |
Females |
Total |
| Riyadh |
462,030 |
12,581 |
474,611 |
283,376 |
4,963 |
288,339 |
| Makkah |
356,276 |
9,427 |
365,703 |
206,848 |
2,819 |
209,667 |
| Madinah |
65,062 |
1,009 |
66,071 |
37,485 |
484 |
37,969 |
| Al-Qasseem |
58,962 |
798 |
59,760 |
38,350 |
406 |
38,756 |
| Eastern |
217,162 |
3,235 |
220,397 |
134,800 |
1,371 |
136,171 |
| Assir |
48,187 |
855 |
49,042 |
26,161 |
515 |
26,676 |
| Hail |
17,973 |
277 |
18,250 |
11,092 |
159 |
11,251 |
| Tabouk |
15,599 |
258 |
15,857 |
8,121 |
66 |
8,187 |
| Al-Baha |
7,114 |
66 |
7,180 |
4,138 |
32 |
4,170 |
| Northern Border |
6,927 |
54 |
6,981 |
3,862 |
20 |
3,882 |
| Al-Jouf |
13,733 |
160 |
13,893 |
8,673 |
86 |
8,759 |
| Jazan |
20,743 |
193 |
20,936 |
11,500 |
70 |
11,570 |
| Najran |
21,218 |
147 |
21,365 |
13,436 |
78 |
13,514 |
| Total |
1,310,986 |
29,060 |
1,340,046 |
787,842 |
11,069 |
798,911 |
Source: Ministry of Labour
1. Definition
All foreign residents in Saudi Arabia are under the responsibility of a local “sponsor”, usually the employer. Only certain categories of investors are spared the obligation.
The Saudi Labour Law has provisions allowing the worker to change sponsor. However, the procedure was conditionned to obtaining a Non-Objection Certificate from the first sponsor.
Since the onset of the Nitaqat (“ranges”, “zones”) campaign of Saudisation of the work force in September 2011, which classifies private sector companies by “range” based on the
Saudisation performance, changes of sponsor have been made easier for the workers in companies displaying the poorest rates of Saudisation (classified in “red” and “yellow” categories).
Workers in these categories can now freely join sponsors whose companies are in highest saudisation performance’ categories (“Green” and “Premium” or “Excellent”), without NOC from previous sponsor.
Since September 2014, the obligation for a worker to stay a minimum of two years with a sponsor before applying for sponsorship’ change was repealed.
2013′ figure is notably higher than previous ones as a result of the “correction campaign” or amnesty period run by the government from April 3 to November 3, 2013.
Ahead of a crackdown on irregular workers/ sojourners planned for November 4, 2013, the amnesty was meant to allow workers to sort out their administrative situation:
renew expired documents; register their current employer as their sponsor; register changes in profession and in activity sector, etc., or leave without paying a penalty.
2. Institution which provides data
Ministry of Labour
3. Data availability
The figures are published in the Ministry of Labour’s website (open data section) (in Arabic).
http://portal.mol.gov.sa/ar/Statistics/Pages/opendata.aspx?m=8
Last date of access: 18 December 2015.
|
Changes of sponsorship |
| Agriculture, Forests, Hunting and Fishing |
8,573 |
| Mines, Oil, Gas and Quarries |
1,069 |
| Manufacturing industries |
55,251 |
| Electricity, Gas and Water |
819 |
| Construction |
432,468 |
| Wholesale Trade and Retail |
199,849 |
| Transports, Storage and Communications |
25,143 |
| Finance, Insurance, Real estate services and Businesses |
13,230 |
| Collective, Social, and Personal services |
62,509 |
| Total |
798,911 |
Source: Ministry of Labour
1. Definition
All foreign residents in Saudi Arabia are under the responsibility of a local “sponsor”, usually the employer. Only certain categories of investors are spared the obligation.
The Saudi Labour Law has provisions allowing the worker to change sponsor. However, the procedure was conditionned to obtaining a Non-Objection Certificate from the first sponsor.
Since the onset of the Nitaqat (“ranges”, “zones”) campaign of Saudisation of the work force in September 2011, which classifies private sector companies by “range” based on the
Saudisation performance, changes of sponsor have been made easier for the workers in companies displaying the poorest rates of Saudisation (classified in “red” and “yellow” categories).
Workers in these categories can now freely join sponsors whose companies are in highest saudisation performance’ categories (“Green” and “Premium” or “Excellent”), without NOC from previous sponsor.
Since September 2014, the obligation for a worker to stay a minimum of two years with a sponsor before applying for sponsorship’ change was repealed.
2013′ figure is notably higher than previous ones as a result of the “correction campaign” or amnesty period run by the government from April 3 to November 3, 2013.
Ahead of a crackdown on irregular workers/ sojourners planned for November 4, 2013, the amnesty was meant to allow workers to sort out their administrative situation:
renew expired documents; register their current employer as their sponsor; register changes in profession and in activity sector, etc., or leave without paying a penalty.
2. Institution which provides data
Ministry of Labour
3. Data availability
The figures are published in the Ministry of Labour’s website (open data section) (in Arabic).
http://portal.mol.gov.sa/ar/Statistics/Pages/opendata.aspx?m=8
Last date of access: 18 December 2015.
| Occupation group |
Transfers of services |
| Managers and Business Managers |
3,722 |
| Specialists in Scientific, Technical and Humanities Fields |
77,225 |
| Technicians in Scientific, Technical and Humanities Fields |
54,201 |
| Clerical Workers |
3,182 |
| Sales Workers |
38,694 |
| Services Workers |
241,927 |
| Agriculture, Animal Husbandry and Fishing |
16,570 |
| Industrial, Chemical and Food Industries |
20,450 |
| Engineering Support |
342,697 |
| Other occupations |
243 |
| TOTAL |
798,911 |
Source: Ministry of Labour
1. Definition
The Saudi Labour Law has provisions allowing the worker to change sponsor. However, the procedure was conditionned to obtaining a Non-Objection Certificate from the first sponsor.
Since the onset of the Nitaqat (“ranges”, “zones”) campaign of Saudisation of the work force in September 2011, which classifies private sector companies by “range” based on the
Saudisation performance, changes of sponsor have been made easier for the workers in companies displaying the poorest rates of Saudisation (classified in “red” and “yellow” categories).
Workers in these categories can now freely join sponsors whose companies are in highest saudisation performance’ categories (“Green” and “Premium” or “Excellent”), without NOC from previous sponsor.
Since September 2014, the obligation for a worker to stay a minimum of two years with a sponsor before applying for sponsorship’ change was repealed.
2013′ figure is notably higher than previous ones as a result of the “correction campaign” or amnesty period run by the government from April 3 to November 3, 2013.
Ahead of a crackdown on irregular workers/ sojourners planned for November 4, 2013, the amnesty was meant to allow workers to sort out their administrative situation:
renew expired documents; register their current employer as their sponsor; register changes in profession and in activity sector, etc., or leave without paying a penalty.
2. Institution which provides data
Ministry of Labour
3. Data availability
The figures are published in the Ministry of Labour’s website (open data section) (in Arabic).
http://portal.mol.gov.sa/ar/Statistics/Pages/opendata.aspx?m=8
Last date of access: 18 December 2015.
|
Applications to profession changes |
Approved profession changes |
| Males |
Females |
Total |
Males |
Females |
Total |
| Riyadh |
158,782 |
2,798 |
161,580 |
130,892 |
2,271 |
133,163 |
| Makkah |
147,930 |
3,330 |
151,260 |
122,331 |
2,839 |
125,170 |
| Madinah |
23,077 |
323 |
23,400 |
19,221 |
294 |
19,515 |
| Al-Qasseem |
13,199 |
212 |
13,411 |
11,085 |
174 |
11,259 |
| Eastern |
85,601 |
577 |
86,178 |
73,743 |
488 |
74,231 |
| Assir |
15,815 |
96 |
15,911 |
12,914 |
74 |
12,988 |
| Hail |
5,039 |
86 |
5,125 |
4,079 |
69 |
4,148 |
| Tabouk |
6,465 |
35 |
6,500 |
5,420 |
27 |
5,447 |
| Al-Baha |
2,168 |
11 |
2,179 |
1,827 |
4 |
1,831 |
| Northern Border |
2,002 |
8 |
2,010 |
1,604 |
8 |
1,612 |
| Al-Jouf |
3,797 |
15 |
3,812 |
3,173 |
8 |
3,181 |
| Jazan |
7,783 |
51 |
7,834 |
6,319 |
23 |
6,342 |
| Najran |
6,135 |
25 |
6,160 |
4,955 |
15 |
4,970 |
| Total |
477,793 |
7,567 |
485,360 |
397,563 |
6,294 |
403,857 |
Source: Ministry of Labour
1. Definition
To the exception of certain categories of investors, all foreign residents in Saudi Arabia are under the responsibility of a local “sponsor”, usually the employer.
The sponsor receives the agreement to bring a foreign employee upon certification that he / she will employ the labourer in a specific profession. The “Iqama” (residency card”) mentions the profession of the worker, which also conditions certain rights (family reunion for instance).
The Saudi Labour Law has provisions allowing the worker to change profession/ sponsor. However, the procedure was conditionned to obtaining a Non-Objection Certificate from the first sponsor.
Since the onset of the Nitaqat (“ranges”, “zones”) campaign of Saudisation of the work force in September 2011, which classifies private sector companies by “range” based on the
Saudisation performance, changes of profession/ sponsor have been made easier for the workers in companies displaying the highest saudisation performance’ categories (“Green” and “Premium” or “Excellent”).
Those in companies with poorest rates of Saudisation (classified in “red” and “yellow” categories) cannot change profession.
2013′ figure is notably higher than previous ones as a result of the “correction campaign” or amnesty period run by the government from April 3 to November 3, 2013.
Ahead of a crackdown on irregular workers/ sojourners planned for November 4, 2013, the amnesty was meant to allow workers to sort out their administrative situation:
renew expired documents; register their current employer as their sponsor; register changes in profession and in activity sector, etc., or leave without paying a penalty.
2. Institution which provides data
Ministry of Labour
3. Data availability
The figures are published in the Ministry of Labour’s website (open data section) (in Arabic).
http://portal.mol.gov.sa/ar/Statistics/Pages/opendata.aspx?m=8
Last date of access: 18 December 2015.
|
Males |
Females |
Total |
% of total |
| India |
465,467 |
6,421 |
471,888 |
28.8 |
| Pakistan |
286,519 |
704 |
287,223 |
17.5 |
| Egypt |
236,301 |
3,432 |
239,733 |
14.6 |
| Philippines |
159,722 |
27,312 |
187,034 |
11.4 |
| Nepal |
130,084 |
3,278 |
133,362 |
8.1 |
| Sudan |
57,066 |
499 |
57,565 |
3.5 |
| Yemen |
53,570 |
244 |
53,814 |
3.3 |
| Sri Lanka |
38,332 |
2,464 |
40,796 |
2.5 |
| Indonesia |
20,853 |
5,214 |
26,067 |
1.6 |
| Turkey |
21,833 |
74 |
21,907 |
1.3 |
| China |
20,059 |
61 |
20,120 |
1.2 |
| Jordan |
18,290 |
750 |
19,040 |
1.2 |
| Bangladesh |
10,347 |
270 |
10,617 |
0.6 |
| Vietnam |
7,505 |
2,337 |
9,842 |
0.6 |
| Lebanon |
6,760 |
404 |
7,164 |
0.4 |
| Kenya |
2,561 |
4,285 |
6,846 |
0.4 |
| UK |
4,815 |
741 |
5,556 |
0.3 |
| USA |
4,779 |
646 |
5,425 |
0.3 |
| Morocco |
4,480 |
899 |
5,379 |
0.3 |
| South Korea |
2,485 |
2 |
2,487 |
0.2 |
| Other countries |
20,587 |
4,204 |
24,791 |
1.5 |
| Total |
1,572,415 |
64,241 |
1,636,656 |
100.0 |
Source: Ministry of Labour
1. Definitions
The labour visa allows the worker to enter Saudi Arabia. It is issued by the Ministry of Foreign Affairs after Ministry of Labour issues its agreement.
In order to employ workers from abroad, the sponsoring company must first file a “Block Visa” request with the Ministry of Labor, requesting pre-approval to sponsor foreign employees.
Once the Block Visa request is approved, the sponsoring company in Saudi Arabia should obtain a visa authorization number and an electronic power of attorney authorized by the Ministry of Foreign Affairs in Saudi Arabia.
Foreign nationals may then apply for work visas through Saudi consular posts in their country of residence. Several documents are required before issuance of work visas, including medical certificate.
Therefore, work visas are more than the actual workers present in the country and granted labour permits, as some eventually do not terminate the procedure, or are rejected at a later stage (entry visa; residency procedures…).
Temporary or seasonal visas are alloted for short-term and limited employment duration, for example for the provision of sevices during the Hajj season in Makkah and Madina, or in agriculture.
2. Institution which provides data
Ministry of Labour of Saudi Arabia (http://portal.mol.gov.sa/Sites/default.aspx)
3. Data availability
The figures are published in the Ministry of Labour’s website (open data section) (in Arabic).
http://portal.mol.gov.sa/ar/Statistics/Pages/opendata.aspx?m=8
Last date of access: 18 December 2015.
| Governorate |
Labour permits |
| Riyadh |
2,848,185 |
| Makkah |
1,779,868 |
| Madinah |
272,905 |
| Al-Qasseem |
308,175 |
| Eastern |
1,582,864 |
| Assir |
248,685 |
| Hail |
103,089 |
| Tabouk |
63,225 |
| Al-Baha |
37,204 |
| Northern Border |
34,086 |
| Al-Jouf |
54,825 |
| Jazan |
85,684 |
| Najran |
105,531 |
| Total |
7,524,326 |
Source: Ministry of Labour
1. Definitions
Classification used for economic activity is adapted from ISIC 3.1
2. Data collection methodology
The issuance of the work permits begins with filing an application with the Ministry of Labor.
After its approval, the Ministry of Labor forwards the application to the Ministry of Interior for the issuance of the residency permit.
3. Institution which provides data
Ministry of Labour
4. Data availability
The figures are published in the Ministry of Labour’s website (open data section) (in Arabic).
http://portal.mol.gov.sa/ar/Statistics/Pages/opendata.aspx?m=8
Last date of access: 18 December 2015.
| Occupation group |
Work permits |
| Managers and Business Managers |
43,168 |
| Specialists in Scientific, Technical and Humanities Fields |
670,622 |
| Technicians in Scientific, Technical and Humanities Fields |
679,036 |
| Clerical Workers |
53,177 |
| Sales Workers |
397,408 |
| Services Workers |
2,206,953 |
| Agriculture, Animal Husbandry and Fishing |
89,735 |
| Industrial, Chemical and Food Industries |
210,646 |
| Engineering Support |
3,169,703 |
| Other occupations |
3,878 |
| Total |
7,524,326 |
Source: Ministry of Labour
1. Definitions
Classification used for economic activity is adapted from ISIC 3.1
2. Data collection methodology
The issuance of the residency and work permits begins with filing an application with the Ministry of Labor.
After its approval, the Ministry of Labor forwards the application to the Ministry of Interior for the issuance of the residency permit.
3. Institution which provides data
Ministry of Labour
4. Data availability
The figures are published in the Ministry of Labour’s website (open data section) (in Arabic).
http://portal.mol.gov.sa/ar/Statistics/Pages/opendata.aspx?m=8
Last date of access: 18 December 2015.
| Economic activity sector of permit holder |
Work permits |
| Agriculture, Forests, Hunting and Fishing |
91,960 |
| Mines, Oil, Gas and Quarries |
27,374 |
| Manufacturing industries |
679,918 |
| Electricity, Gas and Water |
12,342 |
| Construction |
4,256,643 |
| Wholesale Trade and Retail |
1,458,049 |
| Transports, Storage and Communications |
253,323 |
| Finance, Insurance, Real estate services and Businesses |
118,154 |
| Collective, Social, and Personal services |
626,563 |
| Total |
7,524,326 |
Source: Ministry of Labour
1. Definitions
Classification used for economic activity is adapted from ISIC 3.1
2. Data collection methodology
The issuance of the residency and work permits begins with filing an application with the Ministry of Labor.
After its approval, the Ministry of Labor forwards the application to the Ministry of Interior for the issuance of the residency permit.
3. Institution which provides data
Ministry of Labour
4. Data availability
The figures are published in the Ministry of Labour’s website (open data section) (in Arabic).
http://portal.mol.gov.sa/ar/Statistics/Pages/opendata.aspx?m=8
Last date of access: 18 December 2015.
| Country of nationality |
Population |
% of total population |
Year of data |
| India |
2,600,000 |
27,15% |
2014 |
| Pakistan |
1,200,000 |
12,53% |
2014 |
| UAE |
1,084,764 |
11,32% |
2015 |
| Bangladesh |
700,000 |
7,31% |
2013 |
| Philippines |
525,530 |
5,49% |
2014 |
| Iran* |
400,000 – 500,000 |
4,18% – 5,22% |
N/A |
| Egypt* |
400,000 |
4,18% |
2014 |
| Nepal |
300,000 |
3,13% |
2014 |
| Sri Lanka |
300,000 |
3,13% |
2015 |
| China |
200,000 |
2,09% |
2015 |
| Jordan |
200,000 |
2,09% |
2015 |
| Afghanistan |
150,000 |
1,57% |
<2011 |
| Palestine |
150,000 |
1,57% |
2009 |
| United Kingdom |
120,000 |
1,25% |
2015 |
| South Africa |
100,000 |
1,04% |
2014 |
| Lebanon* |
100,000 |
1,04% |
2015 |
| Ethiopia |
90,000 |
0,94% |
2014 |
| Yemen |
90,000 |
0,94% |
2013 |
| Indonesia |
85,000 |
0,89% |
2015 |
| Sudan |
75,000 |
0,78% |
2013 |
| Somalia |
70,000 |
0,73% |
2015 |
| Iraq |
52,000 |
0,54% |
2014 |
| USA |
50,000 |
0,52% |
2015 |
| Canada |
40,000 |
0,42% |
2014 |
| Kenya |
40,000 |
0,42% |
2014 |
| France |
25,000 |
0,26% |
2015 |
| Australia |
16,000 |
0,17% |
2015 |
| Germany |
12,000 |
0,12% |
2013 |
| Spain |
12,000 |
0,11% |
2015 |
| Algeria |
10,000 |
0,10% |
2014 |
| Italy |
10,000 |
0,10% |
2014 |
| South Korea |
10,000 |
0,10% |
2014 |
| Thailand |
10,000 |
0,10% |
2014 |
| Turkey |
10,000 |
0,10% |
2014 |
| Azerbaijan |
7,000 |
0,07% |
2015 |
| Ireland |
7,000 |
0,07% |
2015 |
| Malaysia |
6,000 – 7,000 |
0,06% – 0,07% |
2015 |
| Kazakhstan |
5,000 – 6,000 |
0,05% – 0,06% |
2015 |
| Greece |
5,000 |
0,05% |
2015 |
| Mauritania |
5,000 |
0,05% |
2015 |
| Netherlands |
5,000 |
0,05% |
2015 |
| Serbia |
5,000 |
0,05% |
2015 |
| Ukraine |
5,000 |
0,05% |
2014 |
| Sweden |
4,000 |
0,04% |
2015 |
| Denmark |
3,000 – 4,000 |
~0,03% |
2015 |
| Mexico |
3,000 – 3,500 |
~0,03% |
2014 |
| Belgium |
3,000 |
0,03% |
2015 |
| Eritrea |
3,000 |
0,03% |
2015 |
| Japan |
2,603 |
~0,03% |
2015 |
| Dominican Republic |
2,000-3,000 |
0,02% – 0,03% |
2015 |
| Austria |
2,500 |
~0,03% |
2015 |
| Belarus |
2,500 |
~0,03% |
2015 |
| Hungary |
2,500 |
~0,03% |
2015 |
| Switzerland |
2,430 |
~0,03% |
2013 |
| Poland |
2,348 |
~0,02% |
2015 |
| Singapore |
>2,000 |
~0,02% |
2015 |
| BIH |
1,000 – 2,000 |
0,01% – 0,02% |
2015 |
| Czech Republic |
1,500 |
~0,02% |
2015 |
| Venezuela |
1,200 |
~0,01% |
2015 |
| Norway |
1,184 |
~0,01% |
2015 |
| Finland |
1,180 |
~0,01% |
2014 |
| Cyprus |
1,000 |
~0,01% |
2014 |
| Slovakia |
1,000 |
~0,01% |
2014 |
| Senegal |
700 – 800 |
< 0,01% |
2015 |
| Ghana |
500 |
< 0,01% |
2015 |
| New Zealand |
444 |
< 0,01% |
2015 |
| Taiwan |
400 |
< 0,01% |
2015 |
| Latvia |
300 |
< 0,01% |
2014 |
| Peru |
300 |
< 0,01% |
2015 |
| Chile |
270 |
< 0,01% |
2014 |
| Albania |
200 – 300 |
< 0,01% |
2015 |
| Chad |
200 |
< 0,01% |
2015 |
| Slovenia |
100 – 150 |
< 0,01% |
2015 |
| Angola |
100 |
< 0,01% |
2015 |
Source: Foreign embassies in the UAE and press quotes, in BQ Magazine
ANNEXED NOTE
1. Technical Notes and Definitions
The data has been compiled by BQ magazine. The present data was published by BQ on April 12, 2015.
Here are some excerpts of BQ’s article introducing the data and sources:
“In fact the list is not complete and we do not claim these are the only nationalities living in UAE.
On the contrary, the list only shows the population of nationals of the countries for which it was possible to collect reliable data for.
Having said that it currently is the most detailed, wide ranging and recent resource on the numbers of different nationalities living in UAE.
We have tried to get as recent information as possible and mostly stuck to 2014 or 2015 data.
Only in 8 out of 70 cases the figures are older and mostly correspond to 2013, with Iran, Afghanistan and Palesting being older”.
Sources used by the authors of the article:
1.) Data provided to bq magazine directly by embassies (phone, email or their websites): Angola, Chad, Peru, Taiwan, New Zealand, Ghana, Finland,
Norway, Venezuela, Poland, Austria, Belarus, Hungary, Japan, Belgium, Eritrea, Sweden, Mauritania, Netherlands, Serbia, Ireland, Australia,
France, USA, Somalia, UK, Jordan, Sri Lanka, Spain, Thailand, Singapore, Slovenia, Denmark and Switzerland.
2.) Existing sources previously published in the media: Chile, Latvia, Cyprus, Slovakia, Czech Republic, Slovakia, Ukraine, Azerbaijan, Algeria, Italy,
South Korea, Turkey, Germany, Canada, Kenya, Iraq, Sudan, Indonesia, Ethiopia, Yemen, South Africa, Afghanistan, China, Nepal, Philippines, Bangladesh, Pakistan and India:
http://businessweekme.com/Bloomberg/newsmid/190/newsid/76%20http://www.alarabiya.net/articles/2011/04/09/144872.htmland http://www.ncr-iran.org/en/news/iran-world/14130-uae-steps-up-expulsions-of-iranian-residents-report
http://www.khaleejtimes.com/kt-article-display-1.asp?section=newsmakers&xfile=/data/newsmakers/2014/September/newsmakers_September16.xml
http://www.dailystar.com.lb/News/Lebanon-News/2015/Mar-13/290638-uae-plans-to-deport-70-lebanese-report.ashx
http://www.thenational.ae/uae/sheikh-nahyan-bin-mubarak/sheikh-nahyan-praises-contribution-of-indian-expatriates-to-uaes-success
https://en-maktoob.news.yahoo.com/around-20-000-pakistani-children-uae-don-t-093558327.html
http://www.thenational.ae/uae/government/passport-rush-forces-bangladesh-embassy-in-uae-to-expand
http://gulfnews.com/gn-focus/philippines/overcoming-labour-pains-for-filipinos-in-uae-1.1346012
http://gulfnews.com/news/gulf/uae/community-reports/egyptians-in-uae-to-vote-on-new-charter-on-wednesday-1.1274651 http://gulfnews.com/news/uae/general/egyptian-expatriates-in-uae-vote-on-draft-constitution-1.1275146
http://www.thenational.ae/uae/nepalis-face-potential-passport-problems
http://gulfnews.com/news/gulf/uae/society/family-festivities-mark-chinese-new-year-in-uae-1.1459119
http://www.afghanembassy-uae.com/en/afghanistan-uae.html
http://www.khaleejtimes.com/kt-article-display-1.asp?xfile=data/community/2014/May/community_May5.xml§ion=community
http://7daysindubai.com/ethiopian-maids-reveal-abuse-employers-uae/
http://www.tradeandexportme.com/2013/04/sanaa-etihad-airways-latest-destination/
https://en-maktoob.news.yahoo.com/indonesian-housemaids-uae-continue-working-choose-052110323.html
www.worldsustainable.org/index.php/component/docman/doc_download/198-sudanese-immigrant-families-structure-and-living-arrangements-in-the-uae?Itemid=
http://www.aawsat.net/2014/04/article55331687/iraqi-troops-and-expats-begin-voting
http://www.canadainternational.gc.ca/uae-eau/bilateral_relations_bilaterales/index.aspx?lang=eng&menu_id=9
http://gulfnews.com/news/gulf/uae/society/kenyans-find-uae-a-land-of-opportunity-1.1384354
http://www.thenational.ae/news/uae-news/politics/german-voters-in-uae-prepare-to-head-to-the-polls
http://gulfnews.com/news/gulf/uae/society/algerians-in-dubai-flock-to-cast-votes-on-last-day-of-elections-1.1320921
http://gulfnews.com/news/gulf/uae/government/italy-looks-to-strengthen-ties-with-uae-says-ambassador-1.1351112
http://gulfnews.com/news/gulf/uae/s-korean-expats-in-uae-on-increase-1.1407921
http://www.thenational.ae/uae/turks-living-in-the-uae-vote-in-presidential-elections
http://gulfnews.com/news/gulf/uae/society/azerbaijan-community-doubles-in-size-in-uae-1.1443363
http://www.thenational.ae/uae/ukrainian-expats-in-the-uae-vote-in-presidential-elections
http://m.gulfnews.com/news/uae/czech-president-inaugurates-new-premises-of-czech-embassy-1.1456693
http://www.thenational.ae/uae/tourism/emiratis-visa-free-travel-to-europe-applauded-by-cyprus
http://www.wam.ae/en/news/general/1395262756866.html
http://www.thenational.ae/uae/uae-latvian-community-will-benefit-from-embassy-opening
http://gulfnews.com/news/gulf/uae/society/from-chile-with-love-1.1386815
3.) Sources wishing to remain anonymous: Greece
4.) UAE population: http://www.uaestatistics.gov.ae/ReportPDF/Population%20Estimates%202006%20-%202010.pdf
TOTAL in official UAE 2010 census: 8,264,070 residents.
GLMM did not include here the population totals provided in BQ’s original article.
2. Institution which provides data
BQ Magazine, a monthly business newspaper published in Doha, Qatar http://www.bqdoha.com/
3. Data availability
The data and table are taken from:
Snoj, Jure. “UAE’s population- by nationality”, BQ Magazine, Doha, April 12, 2015.
http://www.bq-magazine.com/economy/socioeconomics/2015/04/uae-population-by-nationality
Last date of access: 4 December 2015.
|
In the labour force |
Out of the labour force |
Total |
|
Saudis |
non-Saudis |
Total |
Saudis |
non-Saudis |
Total |
Saudis |
non-Saudis |
Total |
| Illiterate |
54,475 |
150,551 |
205,026 |
714,228 |
96,612 |
810,840 |
768,703 |
247,163 |
1,015,866 |
| Read & Write |
145,211 |
837,430 |
982,641 |
735,891 |
174,404 |
910,295 |
881,102 |
1,011,834 |
1,892,936 |
| Primary |
373,361 |
1,059,200 |
1,432,561 |
1,143,090 |
201,015 |
1,344,105 |
1,516,451 |
1,260,215 |
2,776,666 |
| Intermediate |
634,769 |
1,372,420 |
2,007,189 |
2,185,733 |
537,214 |
2,722,947 |
2,820,502 |
1,909,634 |
4,730,136 |
| Secondary or Equivalent |
1,938,530 |
1,016,008 |
2,954,538 |
2,651,554 |
533,039 |
3,184,593 |
4,590,084 |
1,549,047 |
6,139,131 |
| Diploma |
560,533 |
360,902 |
921,435 |
111,383 |
62,951 |
174,334 |
671,916 |
423,853 |
1,095,769 |
| Bachelor Degree |
1,730,023 |
1,068,191 |
2,798,214 |
391,688 |
299,393 |
691,081 |
2,121,711 |
1,367,584 |
3,489,295 |
| Higher Diploma / Master Degree |
77,294 |
92,882 |
170,176 |
12,952 |
15,907 |
28,859 |
90,246 |
108,789 |
199,035 |
| Doctorate |
31,565 |
97,079 |
128,644 |
5,257 |
4,590 |
9,847 |
36,822 |
101,669 |
138,491 |
| Total |
5,545,761 |
6,054,663 |
11,600,424 |
7,951,776 |
1,925,125 |
9,876,901 |
13,497,537 |
7,979,788 |
21,477,325 |
source: Labour Force Survey 2014 (Round 1).
ANNEXED NOTE
1. Technical Notes and Definitions
Sampling frame of LFS 2014 Round 1: Population Census 2010.
Sample size: 33500 households
Reference period: January 2014.
Population of reference: all individuals (nationals and non-nationals) residing in the Kingdom during the period of reference.
The ultimate sampling unit is the household.
(a) Person in the labour force: a person aged 15 years and over, employed or unemployed.
(b) Person out of the labour force: A person aged 15 years and over who is not included in the labour force, among which: the persons staying home for domestic activities,
the students, the retired, the self sufficients, the ones unable to enrol in labour, who are not working and do not look for employment for any other reason.
2. Institution which provides data
Central Department of Statistics and Information (CDSI), Ministry and Economy and Planning
3. Data availability
Surveys conducted since 1999 are available on the website of the CDSI (http://www.cdsi.gov.sa/), in PDF format. Tables are also sometimes available in Excel format.
https://www.stats.gov.sa/en/814 (website English version)
https://www.stats.gov.sa/ar/814
The technical notes and tables of contents are displayed in the PDF version, in Arabic only. The tables are in both languages.
Since 2007, Statistical Yearbooks have introduced a section on “Labour Statistics”, which presents a selection of tables from Manpower Surveys.
https://www.stats.gov.sa/en/46
Date of access: October 2014.
| Age |
|
In the labour force |
|
|
Out of the labour force |
|
|
Total |
|
| group |
Saudis |
non-Saudis |
Total |
Saudis |
non-Saudis |
Total |
Saudis |
non-Saudis |
Total |
| 19-15 |
48,325 |
22,852 |
71,177 |
2,055,335 |
432,541 |
2,487,876 |
2,103,660 |
455,393 |
2,559,053 |
| 24-20 |
539,904 |
236,907 |
776,811 |
1,444,943 |
202,130 |
1,647,073 |
1,984,847 |
439,037 |
2,423,884 |
| 29-25 |
1,129,131 |
549,040 |
1,678,171 |
729,319 |
171,318 |
900,637 |
1,858,450 |
720,358 |
2,578,808 |
| 34-30 |
1,069,427 |
1,050,548 |
2,119,975 |
587,949 |
239,276 |
827,225 |
1,657,376 |
1,289,824 |
2,947,200 |
| 39-35 |
902,479 |
1,387,128 |
2,289,607 |
520,846 |
298,548 |
819,394 |
1,423,325 |
1,685,676 |
3,109,001 |
| 44-40 |
693,451 |
1,121,720 |
1,815,171 |
464,377 |
234,066 |
698,443 |
1,157,828 |
1,355,786 |
2,513,614 |
| 49-45 |
493,094 |
770,683 |
1,263,777 |
442,541 |
117,277 |
559,818 |
935,635 |
887,960 |
1,823,595 |
| 54-50 |
303,734 |
475,769 |
779,503 |
408,558 |
66,646 |
475,204 |
712,292 |
542,415 |
1,254,707 |
| 59-55 |
182,467 |
269,359 |
451,826 |
368,889 |
52,082 |
420,971 |
551,356 |
321,441 |
872,797 |
| 64-60 |
70,690 |
118,549 |
189,239 |
323,414 |
45,230 |
368,644 |
394,104 |
163,779 |
557,883 |
| 65+ |
113,059 |
52,108 |
165,167 |
605,605 |
66,011 |
671,616 |
718,664 |
118,119 |
836,783 |
| Total |
5,545,761 |
6,054,663 |
11,600,424 |
7,951,776 |
1,925,125 |
9,876,901 |
13,497,537 |
7,979,788 |
21,477,325 |
source: Labour Force Survey 2014 (Round 1).
ANNEXED NOTE
1. Technical Notes and Definitions
Sampling frame of LFS 2014 Round 1: Population Census 2010.
Sample size: 33500 households
Reference period: January 2014.
Population of reference: all individuals (nationals and non-nationals) residing in the Kingdom during the period of reference.
The ultimate sampling unit is the household.
(a) Person in the labour force: a person aged 15 years and over, employed or unemployed.
(b) Person out of the labour force: A person aged 15 years and over who is not included in the labour force, among which: the persons staying home for domestic activities,
the students, the retired, the self sufficients, the ones unable to enrol in labour, who are not working and do not look for employment for any other reason.
2. Institution which provides data
Central Department of Statistics and Information (CDSI), Ministry and Economy and Planning
3. Data availability
Surveys conducted since 1999 are available on the website of the CDSI (http://www.cdsi.gov.sa/), in PDF format. Tables are also sometimes available in Excel format.
https://www.stats.gov.sa/en/814 (website English version)
https://www.stats.gov.sa/ar/814
The technical notes and tables of contents are displayed in the PDF version, in Arabic only. The tables are in both languages.
Since 2007, Statistical Yearbooks have introduced a section on “Labour Statistics”, which presents a selection of tables from Manpower Surveys.
https://www.stats.gov.sa/en/46
Date of access: October 2014.
|
Saudis |
non-Saudis |
Total |
| Illiterate |
768,703 |
247,163 |
1,015,866 |
| Read & Write |
881,102 |
1,011,834 |
1,892,936 |
| Primary |
1,516,451 |
1,260,215 |
2,776,666 |
| Intermediate |
2,820,502 |
1,909,634 |
4,730,136 |
| Secondary or Equivalent |
4,590,084 |
1,549,047 |
6,139,131 |
| Diploma |
671,916 |
423,853 |
1,095,769 |
| Bachelor Degree |
2,121,711 |
1,367,584 |
3,489,295 |
| Higher Diploma / Master Degree |
90,246 |
108,789 |
199,035 |
| Doctorate |
36,822 |
101,669 |
138,491 |
| Total |
13,497,537 |
7,979,788 |
21,477,325 |
source: Labour Force Survey 2014 (Round 1).
ANNEXED NOTE
1. Technical Notes and Definitions
Sampling frame of LFS 2014 Round 1: Population Census 2010.
Sample size: 33500 households
Reference period: January 2014.
Population of reference: all individuals (nationals and non-nationals) residing in the Kingdom during the period of reference.
The ultimate sampling unit is the household.
2. Institution which provides data
Central Department of Statistics and Information (CDSI), Ministry and Economy and Planning
3. Data availability
Surveys conducted since 1999 are available on the website of the CDSI (http://www.cdsi.gov.sa/), in PDF format. Tables are also sometimes available in Excel format.
https://www.stats.gov.sa/en/814 (website English version)
https://www.stats.gov.sa/ar/814
The technical notes and tables of contents are displayed in the PDF version, in Arabic only. The tables are in both languages.
Since 2007, Statistical Yearbooks have introduced a section on “Labour Statistics”, which presents a selection of tables from Manpower Surveys.
https://www.stats.gov.sa/en/46
Date of access: October 2014.
| Activity status |
|
In the labour force |
|
|
Out of the labour force |
|
|
Total |
|
| |
Male |
Female |
Total |
Male |
Female |
Total |
Male |
Female |
Total |
| Saudis |
4,352,792 |
1,192,969 |
5,545,761 |
2,368,183 |
5,583,593 |
7,951,776 |
6,720,975 |
6,776,562 |
13,497,537 |
| Non-Saudis |
5,414,022 |
640,641 |
6,054,663 |
359,375 |
1,565,750 |
1,925,125 |
5,773,397 |
2,206,391 |
7,979,788 |
| Total |
9,766,814 |
1,833,610 |
11,600,424 |
2,727,558 |
7,149,343 |
9,876,901 |
12,494,372 |
8,982,953 |
21,477,325 |
source: Labour Force Survey 2014 (Round 1).
ANNEXED NOTE
1. Technical Notes and Definitions
Sampling frame of LFS 2014 Round 1: Population Census 2010.
Sample size: 33500 households
Reference period: January 2014.
Population of reference: all individuals (nationals and non-nationals) residing in the Kingdom during the period of reference.
The ultimate sampling unit is the household.
(a) Person in the labour force: a person aged 15 years and over, employed or unemployed.
(b) Person out of the labour force: A person aged 15 years and over who is not included in the labour force, among which: the persons staying home for domestics activities, the students, the retired, the self sufficients,
the ones unable to enrol in labour, who are not working and do not look for employment for any other reason.
2. Institution which provides data
Central Department of Statistics and Information (CDSI), Ministry and Economy and Planning
3. Data availability
Surveys conducted since 1999 are available on the website of the CDSI (http://www.cdsi.gov.sa/), in PDF format. Tables are also sometimes available in Excel format.
https://www.stats.gov.sa/en/814 (website English version)
https://www.stats.gov.sa/ar/814
The technical notes and tables of contents are displayed in the PDF version, in Arabic only. The tables are in both languages.
Since 2007, Statistical Yearbooks have introduced a section on “Labour Statistics”, which presents a selection of tables from Manpower Surveys.
https://www.stats.gov.sa/en/46
Date of access: October 2014.
| Age |
|
Saudis |
|
|
Non-Saudis |
|
|
Total |
|
| group |
Male |
Female |
Total |
Male |
Female |
Total |
Male |
Female |
Total |
| 19-15 |
1,051,274 |
1,052,386 |
2,103,660 |
236,285 |
219,108 |
455,393 |
1,287,559 |
1,271,494 |
2,559,053 |
| 24-20 |
982,990 |
1,001,857 |
1,984,847 |
249,439 |
189,598 |
439,037 |
1,232,429 |
1,191,455 |
2,423,884 |
| 29-25 |
934,404 |
924,046 |
1,858,450 |
471,434 |
248,924 |
720,358 |
1,405,838 |
1,172,970 |
2,578,808 |
| 34-30 |
819,701 |
837,675 |
1,657,376 |
912,106 |
377,718 |
1,289,824 |
1,731,807 |
1,215,393 |
2,947,200 |
| 39-35 |
700,117 |
723,208 |
1,423,325 |
1,216,840 |
468,836 |
1,685,676 |
1,916,957 |
1,192,044 |
3,109,001 |
| 44-40 |
576,897 |
580,931 |
1,157,828 |
997,021 |
358,765 |
1,355,786 |
1,573,918 |
939,696 |
2,513,614 |
| 49-45 |
469,133 |
466,502 |
935,635 |
738,665 |
149,295 |
887,960 |
1,207,798 |
615,797 |
1,823,595 |
| 54-50 |
361,493 |
350,799 |
712,292 |
469,502 |
72,913 |
542,415 |
830,995 |
423,712 |
1,254,707 |
| 59-55 |
278,321 |
273,035 |
551,356 |
272,053 |
49,388 |
321,441 |
550,374 |
322,423 |
872,797 |
| 64-60 |
197,795 |
196,309 |
394,104 |
131,673 |
32,106 |
163,779 |
329,468 |
228,415 |
557,883 |
| 65+ |
348,850 |
369,814 |
718,664 |
78,379 |
39,740 |
118,119 |
427,229 |
409,554 |
836,783 |
| Total |
6,720,975 |
6,776,562 |
13,497,537 |
5,773,397 |
2,206,391 |
7,979,788 |
12,494,372 |
8,982,953 |
21,477,325 |
source: Labour Force Survey 2014 (Round 1).
ANNEXED NOTE
1. Technical Notes and Definitions
Sampling frame of LFS 2014 Round 1: Population Census 2010.
Sample size: 33500 households
Reference period: January 2014.
Population of reference: all individuals (nationals and non-nationals) residing in the Kingdom during the period of reference.
The ultimate sampling unit is the household.
(a) Person in the labour force: a person aged 15 years and over, employed or unemployed.
(b) Person out of the labour force: A person aged 15 years and over who is not included in the labour force, among which: the persons staying home for domestic activities,
the students, the retired, the self sufficients, the ones unable to enrol in labour, who are not working and do not look for employment for any other reason.
2. Institution which provides data
Central Department of Statistics and Information (CDSI), Ministry and Economy and Planning
3. Data availability
Surveys conducted since 1999 are available on the website of the CDSI (http://www.cdsi.gov.sa/), in PDF format. Tables are also sometimes available in Excel format.
https://www.stats.gov.sa/en/814 (website English version)
https://www.stats.gov.sa/ar/814
The technical notes and tables of contents are displayed in the PDF version, in Arabic only. The tables are in both languages.
Since 2007, Statistical Yearbooks have introduced a section on “Labour Statistics”, which presents a selection of tables from Manpower Surveys.
https://www.stats.gov.sa/en/46
Date of access: October 2014.
| Age |
|
Saudis |
|
|
Non-Saudis |
|
|
Total |
|
| group |
Male |
Female |
Total |
Male |
Female |
Total |
Male |
Female |
Total |
| 15-19 |
1,050,956 |
1,064,519 |
2,115,475 |
236,285 |
219,108 |
455,393 |
1,287,241 |
1,283,627 |
2,570,868 |
| 20-24 |
1,020,230 |
1,024,617 |
2,044,847 |
249,439 |
189,598 |
439,037 |
1,269,669 |
1,214,215 |
2,483,884 |
| 25-29 |
924,827 |
944,985 |
1,869,812 |
471,434 |
248,924 |
720,358 |
1,396,261 |
1,193,909 |
2,590,170 |
| 30-34 |
807,581 |
839,633 |
1,647,214 |
912,106 |
377,718 |
1,289,824 |
1,719,687 |
1,217,351 |
2,937,038 |
| 35-39 |
698,730 |
731,399 |
1,430,129 |
1,216,840 |
468,836 |
1,685,676 |
1,915,570 |
1,200,235 |
3,115,805 |
| 40-44 |
582,648 |
602,429 |
1,185,077 |
997,021 |
358,765 |
1,355,786 |
1,579,669 |
961,194 |
2,540,863 |
| 45-49 |
483,249 |
492,622 |
975,871 |
738,665 |
149,295 |
887,960 |
1,221,914 |
641,917 |
1,863,831 |
| 50-54 |
384,714 |
381,643 |
766,357 |
469,502 |
72,913 |
542,415 |
854,216 |
454,556 |
1,308,772 |
| 55-59 |
299,909 |
296,156 |
596,065 |
272,053 |
49,388 |
321,441 |
571,962 |
345,544 |
917,506 |
| 60-64 |
212,810 |
212,266 |
425,076 |
131,673 |
32,106 |
163,779 |
344,483 |
244,372 |
588,855 |
| 65+ |
373,715 |
393,946 |
767,661 |
78,379 |
39,740 |
118,119 |
452,094 |
433,686 |
885,780 |
| Total |
6,839,369 |
6,984,215 |
13,823,584 |
5,773,397 |
2,206,391 |
7,979,788 |
12,612,766 |
9,190,606 |
21,803,372 |
source: Labour Force Survey 2015 (Round 1).
ANNEXED NOTE
1. Technical Notes and Definitions
Sampling frame of LFS 2015 Round 1: Population Census 2010.
Sample size: 33500 households
Reference period: May 2015.
Population of reference: all individuals (nationals and non-nationals) residing in the Kingdom during the period of reference.
The ultimate sampling unit is the household.
The data include:
(a) Person in the labour force: a person aged 15 years and over, employed or unemployed.
(b) Person out of the labour force: A person aged 15 years and over who is not included in the labour force, among which: the persons staying home for domestic activities,
the students, the retired, the self sufficients, the ones unable to enrol in labour, who are not working and do not look for employment for any other reason.
2. Institution which provides data
Central Department of Statistics and Information (CDSI), Ministry and Economy and Planning
3. Data availability
Surveys conducted since 1999 are available on the website of the CDSI (http://www.cdsi.gov.sa/), in PDF format. Tables are also sometimes available in Excel format.
https://www.stats.gov.sa/en/814 (website English version)
https://www.stats.gov.sa/ar/814
The technical notes and tables of contents are displayed in the PDF version, in Arabic only. The tables are in both languages.
Since 2007, Statistical Yearbooks have introduced a section on “Labour Statistics”, which presents a selection of tables from Manpower Surveys.
https://www.stats.gov.sa/en/46
Date of access: October 2015.
| Age |
Saudis |
|
non-Saudis |
|
Total |
| group |
Male |
Female |
Total |
Male |
Female |
Total |
Male |
Female |
Total |
| 19-15 |
1,018,687 |
1,057,943 |
2,076,630 |
237,300 |
227,489 |
464,789 |
1,255,987 |
1,285,432 |
2,541,419 |
| 24-20 |
618,894 |
880,046 |
1,498,940 |
71,998 |
156,908 |
228,906 |
690,892 |
1,036,954 |
1,727,846 |
| 29-25 |
87,070 |
638,429 |
725,499 |
12,236 |
171,417 |
183,653 |
99,306 |
809,846 |
909,152 |
| 34-30 |
26,698 |
573,255 |
599,953 |
5,040 |
234,119 |
239,159 |
31,738 |
807,374 |
839,112 |
| 39-35 |
20,628 |
512,308 |
532,936 |
5,324 |
290,291 |
295,615 |
25,952 |
802,599 |
828,551 |
| 44-40 |
20,913 |
462,289 |
483,202 |
4,666 |
266,004 |
270,670 |
25,579 |
728,293 |
753,872 |
| 49-45 |
37,926 |
414,122 |
452,048 |
5,536 |
134,420 |
139,956 |
43,462 |
548,542 |
592,004 |
| 54-50 |
75,876 |
350,166 |
426,042 |
4,842 |
64,039 |
68,881 |
80,718 |
414,205 |
494,923 |
| 59-55 |
108,290 |
283,873 |
392,163 |
7,041 |
43,916 |
50,957 |
115,331 |
327,789 |
443,120 |
| 64-60 |
144,347 |
211,039 |
355,386 |
18,782 |
34,411 |
53,193 |
163,129 |
245,450 |
408,579 |
| 65+ |
295,903 |
393,319 |
689,222 |
40,720 |
43,302 |
84,022 |
336,623 |
436,621 |
773,244 |
| Total |
2,455,232 |
5,776,789 |
8,232,021 |
413,485 |
1,666,316 |
2,079,801 |
2,868,717 |
7,443,105 |
10,311,822 |
source: Labour Force Survey 2015 (Round 1).
ANNEXED NOTE
1. Technical Notes and Definitions
Sampling frame of LFS 2015 Round 1: Population Census 2010.
Sample size: 33500 households
Reference period: May 2015
Population of reference: all individuals (nationals and non-nationals) residing in the Kingdom during the period of reference.
The ultimate sampling unit is the household.
An inactive person (out of the labour force) is a person aged 15 years and over who is not included in the labour force, among which: the persons staying home for domestics activities,
the students, the retired, the self sufficients, the ones unable to enrol in labour, who are not working and do not look for employment for any other reason.
2. Institution which provides data
Central Department of Statistics and Information (CDSI), Ministry and Economy and Planning
3. Data availability
Surveys conducted since 1999 are available on the website of the CDSI (http://www.cdsi.gov.sa/), in PDF format. Tables are also sometimes available in Excel format.
https://www.stats.gov.sa/en/814 (website English version)
https://www.stats.gov.sa/ar/814
The technical notes and tables of contents are displayed in the PDF version, in Arabic only. The tables are in both languages.
Since 2007, Statistical Yearbooks have introduced a section on “Labour Statistics”, which presents a selection of tables from Manpower Surveys.
https://www.stats.gov.sa/en/46
Date of access: October 2015.
| Age |
Saudis |
|
non-Saudis |
|
Total |
| group |
Male |
Female |
Total |
Male |
Female |
Total |
Male |
Female |
Total |
| 19-15 |
1,014,256 |
1,041,079 |
2,055,335 |
220,998 |
211,543 |
432,541 |
1,235,254 |
1,252,622 |
2,487,876 |
| 24-20 |
591,792 |
853,151 |
1,444,943 |
56,351 |
145,779 |
202,130 |
648,143 |
998,930 |
1,647,073 |
| 29-25 |
92,385 |
636,934 |
729,319 |
9,514 |
161,804 |
171,318 |
101,899 |
798,738 |
900,637 |
| 34-30 |
29,273 |
558,676 |
587,949 |
4,870 |
234,406 |
239,276 |
34,143 |
793,082 |
827,225 |
| 39-35 |
20,193 |
500,653 |
520,846 |
4,410 |
294,138 |
298,548 |
24,603 |
794,791 |
819,394 |
| 44-40 |
22,554 |
441,823 |
464,377 |
3,409 |
230,657 |
234,066 |
25,963 |
672,480 |
698,443 |
| 49-45 |
37,574 |
404,967 |
442,541 |
4,185 |
113,092 |
117,277 |
41,759 |
518,059 |
559,818 |
| 54-50 |
84,265 |
324,293 |
408,558 |
6,282 |
60,364 |
66,646 |
90,547 |
384,657 |
475,204 |
| 59-55 |
106,536 |
262,353 |
368,889 |
8,149 |
43,933 |
52,082 |
114,685 |
306,286 |
420,971 |
| 64-60 |
129,860 |
193,554 |
323,414 |
14,473 |
30,757 |
45,230 |
144,333 |
224,311 |
368,644 |
| 65+ |
239,495 |
366,110 |
605,605 |
26,734 |
39,277 |
66,011 |
266,229 |
405,387 |
671,616 |
| Total |
2,368,183 |
5,583,593 |
7,951,776 |
359,375 |
1,565,750 |
1,925,125 |
2,727,558 |
7,149,343 |
9,876,901 |
source: Labour Force Survey 2014 (Round 1).
ANNEXED NOTE
1. Technical Notes and Definitions
Sampling frame of LFS 2014 Round 1: Population Census 2010.
Sample size: 33500 households
Reference period: January 2014.
Population of reference: all individuals (nationals and non-nationals) residing in the Kingdom during the period of reference.
The ultimate sampling unit is the household.
An inactive person (out of the labour force) is a person aged 15 years and over who is not included in the labour force, among which: the persons staying home for domestics activities,
the students, the retired, the self sufficients, the ones unable to enrol in labour, who are not working and do not look for employment for any other reason.
2. Institution which provides data
Central Department of Statistics and Information (CDSI), Ministry and Economy and Planning
3. Data availability
Surveys conducted since 1999 are available on the website of the CDSI (http://www.cdsi.gov.sa/), in PDF format. Tables are also sometimes available in Excel format.
https://www.stats.gov.sa/en/814 (website English version)
https://www.stats.gov.sa/ar/814
The technical notes and tables of contents are displayed in the PDF version, in Arabic only. The tables are in both languages.
Since 2007, Statistical Yearbooks have introduced a section on “Labour Statistics”, which presents a selection of tables from Manpower Surveys.
https://www.stats.gov.sa/en/46
Date of access: October 2014.
| Age |
|
In the labour force |
|
|
Out of the labour force |
|
|
Total |
|
| group |
Saudis |
non-Saudis |
Total |
Saudis |
non-Saudis |
Total |
Saudis |
non-Saudis |
Total |
| 15-19 |
38,845 |
27,125 |
65,970 |
2,076,630 |
464,789 |
2,541,419 |
2,115,475 |
491,914 |
2,607,389 |
| 20-24 |
545,907 |
236,555 |
782,462 |
1,498,940 |
228,906 |
1,727,846 |
2,044,847 |
465,461 |
2,510,308 |
| 25-29 |
1,144,313 |
524,226 |
1,668,539 |
725,499 |
183,653 |
909,152 |
1,869,812 |
707,879 |
2,577,691 |
| 30-34 |
1,047,261 |
989,932 |
2,037,193 |
599,953 |
239,159 |
839,112 |
1,647,214 |
1,229,091 |
2,876,305 |
| 35-39 |
897,193 |
1,444,411 |
2,341,604 |
532,936 |
295,615 |
828,551 |
1,430,129 |
1,740,026 |
3,170,155 |
| 40-44 |
701,875 |
1,214,637 |
1,916,512 |
483,202 |
270,670 |
753,872 |
1,185,077 |
1,485,307 |
2,670,384 |
| 45-49 |
523,823 |
847,055 |
1,370,878 |
452,048 |
139,956 |
592,004 |
975,871 |
987,011 |
1,962,882 |
| 50-54 |
340,315 |
531,380 |
871,695 |
426,042 |
68,881 |
494,923 |
766,357 |
600,261 |
1,366,618 |
| 55-59 |
203,902 |
310,000 |
513,902 |
392,163 |
50,957 |
443,120 |
596,065 |
360,957 |
957,022 |
| 60-64 |
69,690 |
142,295 |
211,985 |
355,386 |
53,193 |
408,579 |
425,076 |
195,488 |
620,564 |
| 65+ |
78,439 |
53,030 |
131,469 |
689,222 |
84,022 |
773,244 |
767,661 |
137,052 |
904,713 |
| Total |
5,591,563 |
6,320,646 |
11,912,209 |
8,232,021 |
2,079,801 |
10,311,822 |
13,823,584 |
8,400,447 |
22,224,031 |
source: Labour Force Survey 2015 (Round 1).
ANNEXED NOTE
1. Technical Notes and Definitions
Sampling frame of LFS 2015 Round 1: Population Census 2010.
Sample size: 33500 households
Reference period: May 2015.
Population of reference: all individuals (nationals and non-nationals) residing in the Kingdom during the period of reference.
The ultimate sampling unit is the household.
(a) Person in the labour force: a person aged 15 years and over, employed or unemployed.
(b) Person out of the labour force: A person aged 15 years and over who is not included in the labour force, among which: the persons staying home for domestic activities,
the students, the retired, the self sufficients, the ones unable to enrol in labour, who are not working and do not look for employment for any other reason.
2. Institution which provides data
Central Department of Statistics and Information (CDSI), Ministry and Economy and Planning
3. Data availability
Surveys conducted since 1999 are available on the website of the CDSI (http://www.cdsi.gov.sa/), in PDF format. Tables are also sometimes available in Excel format.
https://www.stats.gov.sa/en/814 (website English version)
https://www.stats.gov.sa/ar/814
The technical notes and tables of contents are displayed in the PDF version, in Arabic only. The tables are in both languages.
Since 2007, Statistical Yearbooks have introduced a section on “Labour Statistics”, which presents a selection of tables from Manpower Surveys.
https://www.stats.gov.sa/en/46
Date of access: October 2015.
| Groups of countries |
1995 |
1996 |
1997 |
1998 |
1999 |
2000 |
2001 |
2002 |
2003 |
2004 |
2005 |
2006 |
2007 |
2008 |
2009 |
2010 |
2011 |
2012 |
2013 |
| Kuwait |
847,846 |
971,637 |
1,066,757 |
1,223,459 |
1,191,092 |
1,354,962 |
1,638,307 |
1,693,212 |
1,753,923 |
1,909,480 |
2,149,827 |
2,456,901 |
2,714,495 |
2,866,762 |
3,234,577 |
3,323,671 |
3,481,257 |
3,730,939 |
4,049,002 |
| GCC Countries |
n.a. |
939,134 |
993,233 |
1,058,316 |
1,130,123 |
971,329 |
1,277,051 |
1,409,905 |
1,523,604 |
1,788,683 |
1,185,704 |
1,320,989 |
1,531,896 |
1,620,195 |
1,830,066 |
1,925,718 |
2,281,844 |
2,429,175 |
2,720,250 |
| Other Arab countries |
841,251 |
926,387 |
1,115,053 |
1,188,381 |
1,199,130 |
1,212,091 |
1,186,927 |
1,219,525 |
1,273,423 |
| Non-Arab Asian countries |
n.a. |
521,209 |
530,615 |
584,287 |
621,884 |
510,266 |
678,210 |
767,481 |
872,359 |
1,016,171 |
1,164,862 |
1,322,351 |
1,429,068 |
1,468,120 |
1,561,287 |
1,554,207 |
1,578,496 |
1,586,183 |
1,709,711 |
| Non-Arab African countries |
n.a. |
4,304 |
4,116 |
6,184 |
5,349 |
467,120 |
5,551 |
5,798 |
8,298 |
9,681 |
13,109 |
18,602 |
26,265 |
34,258 |
40,533 |
60,665 |
78,728 |
74,018 |
88,761 |
| Europe |
n.a. |
55,999 |
59,948 |
60,491 |
68,684 |
66,121 |
63,455 |
73,939 |
85,137 |
112,152 |
121,507 |
135,618 |
157,487 |
163,041 |
167,479 |
175,406 |
172,922 |
171,050 |
184,700 |
| America |
n.a. |
27,215 |
31,815 |
33,392 |
39,191 |
39,479 |
39,261 |
50,267 |
103,447 |
115,260 |
131,644 |
155,203 |
189,775 |
219,039 |
229,288 |
226,943 |
222,973 |
184,619 |
174,906 |
| Australia and Pacific |
n.a. |
3,463 |
3,621 |
3,769 |
4,327 |
4,529 |
4,453 |
5,230 |
7,219 |
10,922 |
13,002 |
16,339 |
18,243 |
19,179 |
21,286 |
19,198 |
15,479 |
13,948 |
13,146 |
| Other |
n.a. |
13,736 |
14,472 |
16,200 |
14,071 |
23,384 |
3,635 |
2,950 |
2,236 |
3,224 |
3,188 |
3,616 |
13,847 |
23,697 |
38,712 |
33,557 |
36,933 |
50,179 |
52,039 |
| Total non-Kuwaitis |
0 |
1,565,060 |
1,637,820 |
1,762,639 |
1,883,629 |
2,082,228 |
2,071,616 |
2,315,570 |
2,602,300 |
3,056,093 |
3,474,267 |
3,899,105 |
4,481,634 |
4,735,910 |
5,087,781 |
5,207,785 |
5,574,302 |
5,728,697 |
6,216,936 |
| Grand total |
847,846 |
2,536,697 |
2,704,577 |
2,986,098 |
3,074,721 |
3,437,190 |
3,709,923 |
4,008,782 |
4,356,223 |
4,965,573 |
5,624,094 |
6,356,006 |
7,196,129 |
7,602,672 |
8,322,358 |
8,531,456 |
9,055,559 |
9,459,636 |
10,265,938 |
|
DEPARTURES |
|
|
| |
|
|
| Groups of countries |
1995 |
1996 |
1997 |
1998 |
1999 |
2000 |
2001 |
2002 |
2003 |
2004 |
2005 |
2006 |
2007 |
2008 |
2009 |
2010 |
2011 |
2012 |
2013 |
| Kuwait |
878,222 |
1,050,877 |
1,097,410 |
1,263,584 |
1,208,742 |
1,236,431 |
1,666,029 |
1,725,271 |
1,773,781 |
1,927,851 |
2,172,839 |
2,529,313 |
2,648,845 |
2,899,114 |
3,251,020 |
3,330,064 |
3,484,743 |
3,732,701 |
4,078,973 |
| GCC Countries |
687,198 |
952,727 |
1,008,681 |
1,078,016 |
1,144,389 |
870,636 |
1,637,747 |
1,409,434 |
1,505,863 |
1,749,208 |
1,178,081 |
1,308,567 |
1,539,347 |
1,626,516 |
1,817,341 |
1,921,482 |
2,274,580 |
2,421,562 |
2,717,363 |
| Other Arab countries |
825,887 |
920,807 |
1,077,131 |
1,182,075 |
1,215,340 |
1,207,493 |
1,167,598 |
1,182,190 |
1,242,319 |
| Non-Arab Asian countries |
423,764 |
482,795 |
516,468 |
561,388 |
601,052 |
490,443 |
659,906 |
722,515 |
782,746 |
897,580 |
1,071,383 |
1,270,153 |
1,422,153 |
1,496,161 |
1,569,585 |
1,543,328 |
1,575,576 |
1,531,545 |
1,664,526 |
| Non-Arab African countries |
195,443 |
3,858 |
4,258 |
6,221 |
5,452 |
487,793 |
5,728 |
6,234 |
7,917 |
9,336 |
12,601 |
16,894 |
20,118 |
24,575 |
32,963 |
39,478 |
49,865 |
66,079 |
80,287 |
| Europe |
49,776 |
55,943 |
60,572 |
61,104 |
68,206 |
66,884 |
63,789 |
72,276 |
80,450 |
108,584 |
119,276 |
134,754 |
153,714 |
157,415 |
167,541 |
173,568 |
171,244 |
168,525 |
179,992 |
| America |
24,784 |
27,917 |
32,540 |
34,223 |
39,206 |
304,101 |
273,924 |
47,731 |
77,212 |
106,068 |
122,644 |
142,924 |
169,549 |
192,728 |
209,929 |
203,706 |
195,533 |
166,506 |
159,519 |
| Australia and Pacific |
3,106 |
3,845 |
4,028 |
4,066 |
4,617 |
4,591 |
4,526 |
5,192 |
6,635 |
10,390 |
12,908 |
15,868 |
17,031 |
17,999 |
20,773 |
19,154 |
15,540 |
13,963 |
13,165 |
| Other |
11,295 |
15,367 |
15,846 |
17,619 |
15,356 |
13,084 |
3,832 |
3,079 |
2,359 |
3,337 |
3,622 |
4,242 |
14,339 |
24,548 |
39,297 |
34,686 |
37,330 |
51,373 |
53,157 |
| Total non-Kuwaitis |
1,395,366 |
1,542,452 |
1,642,393 |
1,762,637 |
1,878,278 |
2,237,532 |
2,649,452 |
2,266,461 |
2,463,182 |
2,884,503 |
3,346,402 |
3,814,209 |
4,413,382 |
4,722,017 |
5,072,769 |
5,142,895 |
5,487,266 |
5,601,743 |
6,110,328 |
| Grand total |
2,273,588 |
2,593,329 |
2,739,803 |
3,026,221 |
3,087,020 |
3,473,963 |
4,315,481 |
3,991,732 |
4,236,963 |
4,812,354 |
5,519,241 |
6,343,522 |
7,062,227 |
7,621,131 |
8,323,789 |
8,472,959 |
8,972,009 |
9,334,444 |
10,189,301 |
Source: Ministry of Interior
ANNEXED NOTE
1. Definitions
Kuwait and the countries classified as “Arab countries” are the 22 members of the League of the Arab States:
Kuwait and the other Gulf Cooperation Council member states (Saudi Arabia; the UAE; Bahrain; Oman, Qatar), as well as Yemen; Syria; Lebanon; Jordan; Palestine; Iraq; Egypt; Libya; Tunisia; Algeria; Morocco; Mauritania; Sudan; Djibouti; Comores Islands; Somalia.
2. Institution which provides data
Central Statistical Bureau (CSB), Ministry of Planning
3. Data availability
Published in the CSB’ Statistical Yearbooks, in Chapter “Transport and Communication”
Statistical Yearbooks are available online at:
http://www.csb.gov.kw/Socan_Statistic_EN.aspx?ID=18 (website in English)
http://www.csb.gov.kw/Socan_Statistic.aspx (Arabic website).
Volumes are bilingual (English and Arabic). Every Yearbook is published in PDF format since 2000 and a selection of 1964 to 1999 volumes is also available in one publication.
Data is also available by country of citizenship in the Annual Statistical Bulletin of Transport (available in PDF; also in Excel format for 2012 and 2013).
http://www.csb.gov.kw/Socan_Statistic_EN.aspx?ID=41
http://www.csb.gov.kw/Socan_Statistic.aspx?ID=41
Date of access: October 2015.
| Activity status |
|
In the labour force |
|
|
Out of the labour force |
|
|
Total |
|
|
Saudis |
non-Saudis |
Total |
Saudis |
non-Saudis |
Total |
Saudis |
non-Saudis |
Total |
| Riyadh |
1,323,901 |
1,832,642 |
3,156,543 |
1,778,830 |
536,220 |
2,315,050 |
3,102,731 |
2,368,862 |
5,471,593 |
| Makkah |
1,244,975 |
1,678,611 |
2,923,586 |
1,814,823 |
809,148 |
2,623,971 |
3,059,798 |
2,487,759 |
5,547,557 |
| Madinah |
341,736 |
324,036 |
665,772 |
521,390 |
150,101 |
671,491 |
863,126 |
474,137 |
1,337,263 |
| Qassim |
278,417 |
264,906 |
543,323 |
382,319 |
35,786 |
418,105 |
660,736 |
300,692 |
961,428 |
| Easte. Prov. |
859,779 |
998,109 |
1,857,888 |
1,248,489 |
217,567 |
1,466,056 |
2,108,268 |
1,215,676 |
3,323,944 |
| Asir |
429,553 |
307,715 |
737,268 |
706,150 |
29,166 |
735,316 |
1,135,703 |
336,881 |
1,472,584 |
| Tabuk |
189,617 |
117,093 |
306,710 |
247,208 |
16,917 |
264,125 |
436,825 |
134,010 |
570,835 |
| Hail |
144,885 |
104,037 |
248,922 |
207,013 |
11,403 |
218,416 |
351,898 |
115,440 |
467,338 |
| North.Bord. |
79,484 |
50,531 |
130,015 |
110,580 |
4,750 |
115,330 |
190,064 |
55,281 |
245,345 |
| Jazan |
301,508 |
158,421 |
459,929 |
480,805 |
71,108 |
551,913 |
782,313 |
229,529 |
1,011,842 |
| Najran |
126,194 |
79,026 |
205,220 |
167,143 |
20,275 |
187,418 |
293,337 |
99,301 |
392,638 |
| AL – Baha |
118,628 |
59,188 |
177,816 |
147,104 |
7,643 |
154,747 |
265,732 |
66,831 |
332,563 |
| AL – Jouf |
107,084 |
80,348 |
187,432 |
139,922 |
15,041 |
154,963 |
247,006 |
95,389 |
342,395 |
| Total |
5,545,761 |
6,054,663 |
11,600,424 |
7,951,776 |
1,925,125 |
9,876,901 |
13,497,537 |
7,979,788 |
21,477,325 |
source: Labour Force Survey 2014 (Round 1).
ANNEXED NOTE
1. Technical Notes and Definitions
Sampling frame of LFS 2014 Round 1: Population Census 2010.
Sample size: 33500 households
Reference period: January 2014.
Population of reference: all individuals (nationals and non-nationals) residing in the Kingdom during the period of reference.
The ultimate sampling unit is the household.
(a) Person in the labour force: a person aged 15 years and over, employed or unemployed.
(b) Person out of the labour force: A person aged 15 years and over who is not included in the labour force, among which: the persons staying home for domestics activities, the students, the retired, the self sufficients,
the ones unable to enrol in labour, who are not working and do not look for employment for any other reason.
2. Institution which provides data
Central Department of Statistics and Information (CDSI), Ministry and Economy and Planning
3. Data availability
Surveys conducted since 1999 are available on the website of the CDSI (http://www.cdsi.gov.sa/), in PDF format. Tables are also sometimes available in Excel format.
https://www.stats.gov.sa/en/814 (website English version)
https://www.stats.gov.sa/ar/814
The technical notes and tables of contents are displayed in the PDF version, in Arabic only. The tables are in both languages.
Since 2007, Statistical Yearbooks have introduced a section on “Labour Statistics”, which presents a selection of tables from Manpower Surveys.
https://www.stats.gov.sa/en/46
Date of access: October 2014.
| Activity status |
|
In the labour force |
|
|
Out of the labour force |
|
|
Total |
|
| |
Saudis |
non-Saudis |
Total |
Saudis |
non-Saudis |
Total |
Saudis |
non-Saudis |
Total |
| Riyadh |
1,289,317 |
1,905,968 |
3,195,285 |
1,887,081 |
582,404 |
2,469,485 |
3,176,398 |
2,488,372 |
5,664,770 |
| Makkah |
1,322,733 |
1,775,216 |
3,097,949 |
1,828,886 |
864,070 |
2,692,956 |
3,151,619 |
2,639,286 |
5,790,905 |
| Madinah |
325,239 |
337,875 |
663,114 |
565,458 |
164,144 |
729,602 |
890,697 |
502,019 |
1,392,716 |
| Qassim |
270,248 |
275,787 |
546,035 |
408,068 |
36,878 |
444,946 |
678,316 |
312,665 |
990,981 |
| Easte. Prov. |
884,487 |
1,010,287 |
1,894,774 |
1,274,562 |
263,065 |
1,537,627 |
2,159,049 |
1,273,352 |
3,432,401 |
| Asir |
423,686 |
314,285 |
737,971 |
734,280 |
36,255 |
770,535 |
1,157,966 |
350,540 |
1,508,506 |
| Tabuk |
208,718 |
126,686 |
335,404 |
236,521 |
14,065 |
250,586 |
445,239 |
140,751 |
585,990 |
| Hail |
144,217 |
107,789 |
252,006 |
222,632 |
13,697 |
236,329 |
366,849 |
121,486 |
488,335 |
| North.Bord. |
83,399 |
53,375 |
136,774 |
104,121 |
5,975 |
110,096 |
187,520 |
59,350 |
246,870 |
| Jazan |
321,455 |
179,385 |
500,840 |
496,017 |
60,507 |
556,524 |
817,472 |
239,892 |
1,057,364 |
| Najran |
98,744 |
83,641 |
182,385 |
181,674 |
20,125 |
201,799 |
280,418 |
103,766 |
384,184 |
| AL – Baha |
113,428 |
60,792 |
174,220 |
151,269 |
8,607 |
159,876 |
264,697 |
69,399 |
334,096 |
| AL – Jouf |
105,892 |
89,560 |
195,452 |
141,452 |
10,009 |
151,461 |
247,344 |
99,569 |
346,913 |
| Total |
5,591,563 |
6,320,646 |
11,912,209 |
8,232,021 |
2,079,801 |
10,311,822 |
13,823,584 |
8,400,447 |
22,224,031 |
source: Labour Force Survey 2015 (Round 1).
ANNEXED NOTE
1. Technical Notes and Definitions
Sampling frame of LFS 2015 Round 1: Population Census 2010.
Sample size: 33500 households
Reference period: May 2015
Population of reference: all individuals (nationals and non-nationals) residing in the Kingdom during the period of reference.
The ultimate sampling unit is the household.
(a) Person in the labour force: a person aged 15 years and over, employed or unemployed.
(b) Person out of the labour force: A person aged 15 years and over who is not included in the labour force, among which: the persons staying home for domestics activities, the students, the retired, the self sufficients,
the ones unable to enrol in labour, who are not working and do not look for employment for any other reason.
2. Institution which provides data
Central Department of Statistics and Information (CDSI), Ministry and Economy and Planning
3. Data availability
Surveys conducted since 1999 are available on the website of the CDSI (http://www.cdsi.gov.sa/), in PDF format. Tables are also sometimes available in Excel format.
https://www.stats.gov.sa/en/814 (website English version)
https://www.stats.gov.sa/ar/814
The technical notes and tables of contents are displayed in the PDF version, in Arabic only. The tables are in both languages.
Since 2007, Statistical Yearbooks have introduced a section on “Labour Statistics”, which presents a selection of tables from Manpower Surveys.
https://www.stats.gov.sa/en/46
Date of access: October 2015.
| Age |
|
In the labour force |
|
|
Out of the labour force |
|
|
Total |
|
| group |
Saudis |
non-Saudis |
Total |
Saudis |
non-Saudis |
Total |
Saudis |
non-Saudis |
Total |
| 19-15 |
38,845 |
27,125 |
65,970 |
2,076,630 |
464,789 |
2,541,419 |
2,115,475 |
491,914 |
2,607,389 |
| 24-20 |
545,907 |
236,555 |
782,462 |
1,498,940 |
228,906 |
1,727,846 |
2,044,847 |
465,461 |
2,510,308 |
| 29-25 |
1,144,313 |
524,226 |
1,668,539 |
725,499 |
183,653 |
909,152 |
1,869,812 |
707,879 |
2,577,691 |
| 34-30 |
1,047,261 |
989,932 |
2,037,193 |
599,953 |
239,159 |
839,112 |
1,647,214 |
1,229,091 |
2,876,305 |
| 39-35 |
897,193 |
1,444,411 |
2,341,604 |
532,936 |
295,615 |
828,551 |
1,430,129 |
1,740,026 |
3,170,155 |
| 44-40 |
701,875 |
1,214,637 |
1,916,512 |
483,202 |
270,670 |
753,872 |
1,185,077 |
1,485,307 |
2,670,384 |
| 49-45 |
523,823 |
847,055 |
1,370,878 |
452,048 |
139,956 |
592,004 |
975,871 |
987,011 |
1,962,882 |
| 54-50 |
340,315 |
531,380 |
871,695 |
426,042 |
68,881 |
494,923 |
766,357 |
600,261 |
1,366,618 |
| 59-55 |
203,902 |
310,000 |
513,902 |
392,163 |
50,957 |
443,120 |
596,065 |
360,957 |
957,022 |
| 64-60 |
69,690 |
142,295 |
211,985 |
355,386 |
53,193 |
408,579 |
425,076 |
195,488 |
620,564 |
| 65+ |
78,439 |
53,030 |
131,469 |
689,222 |
84,022 |
773,244 |
767,661 |
137,052 |
904,713 |
| Total |
5,591,563 |
6,320,646 |
11,912,209 |
8,232,021 |
2,079,801 |
10,311,822 |
13,823,584 |
8,400,447 |
22,224,031 |
source: Labour Force Survey 2015 (Round 1).
ANNEXED NOTE
1. Technical Notes and Definitions
Sampling frame of LFS 2015 Round 1: Population Census 2010.
Sample size: 33500 households
Reference period: May 2015.
Population of reference: all individuals (nationals and non-nationals) residing in the Kingdom during the period of reference.
The ultimate sampling unit is the household.
(a) Person in the labour force: a person aged 15 years and over, employed or unemployed.
(b) Person out of the labour force: A person aged 15 years and over who is not included in the labour force, among which: the persons staying home for domestic activities,
the students, the retired, the self sufficients, the ones unable to enrol in labour, who are not working and do not look for employment for any other reason.
2. Institution which provides data
Central Department of Statistics and Information (CDSI), Ministry and Economy and Planning
3. Data availability
Surveys conducted since 1999 are available on the website of the CDSI (https://www.stats.gov.sa/en), in PDF format. Tables are also sometimes available in Excel format.
https://www.stats.gov.sa/en/814 (website English version)
https://www.stats.gov.sa/ar/814
The technical notes and tables of contents are displayed in the PDF version, in Arabic only. The tables are in both languages.
Since 2007, Statistical Yearbooks have introduced a section on “Labour Statistics”, which presents a selection of tables from Manpower Surveys.
https://www.stats.gov.sa/en/46
Date of access: October 2015.
| Age |
|
In the labour force |
|
|
Out of the labour force |
|
|
Total |
|
| group |
Saudis |
non-Saudis |
Total |
Saudis |
non-Saudis |
Total |
Saudis |
non-Saudis |
Total |
| 19-15 |
48,325 |
22,852 |
71,177 |
2,055,335 |
432,541 |
2,487,876 |
2,103,660 |
455,393 |
2,559,053 |
| 24-20 |
539,904 |
236,907 |
776,811 |
1,444,943 |
202,130 |
1,647,073 |
1,984,847 |
439,037 |
2,423,884 |
| 29-25 |
1,129,131 |
549,040 |
1,678,171 |
729,319 |
171,318 |
900,637 |
1,858,450 |
720,358 |
2,578,808 |
| 34-30 |
1,069,427 |
1,050,548 |
2,119,975 |
587,949 |
239,276 |
827,225 |
1,657,376 |
1,289,824 |
2,947,200 |
| 39-35 |
902,479 |
1,387,128 |
2,289,607 |
520,846 |
298,548 |
819,394 |
1,423,325 |
1,685,676 |
3,109,001 |
| 44-40 |
693,451 |
1,121,720 |
1,815,171 |
464,377 |
234,066 |
698,443 |
1,157,828 |
1,355,786 |
2,513,614 |
| 49-45 |
493,094 |
770,683 |
1,263,777 |
442,541 |
117,277 |
559,818 |
935,635 |
887,960 |
1,823,595 |
| 54-50 |
303,734 |
475,769 |
779,503 |
408,558 |
66,646 |
475,204 |
712,292 |
542,415 |
1,254,707 |
| 59-55 |
182,467 |
269,359 |
451,826 |
368,889 |
52,082 |
420,971 |
551,356 |
321,441 |
872,797 |
| 64-60 |
70,690 |
118,549 |
189,239 |
323,414 |
45,230 |
368,644 |
394,104 |
163,779 |
557,883 |
| 65+ |
113,059 |
52,108 |
165,167 |
605,605 |
66,011 |
671,616 |
718,664 |
118,119 |
836,783 |
| Total |
5,545,761 |
6,054,663 |
11,600,424 |
7,951,776 |
1,925,125 |
9,876,901 |
13,497,537 |
7,979,788 |
21,477,325 |
source: Labour Force Survey 2014 (Round 1).
ANNEXED NOTE
1. Technical Notes and Definitions
Sampling frame of LFS 2014 Round 1: Population Census 2010.
Sample size: 33500 households
Reference period: January 2014.
Population of reference: all individuals (nationals and non-nationals) residing in the Kingdom during the period of reference.
The ultimate sampling unit is the household.
(a) Person in the labour force: a person aged 15 years and over, employed or unemployed.
(b) Person out of the labour force: A person aged 15 years and over who is not included in the labour force, among which: the persons staying home for domestic activities,
the students, the retired, the self sufficients, the ones unable to enrol in labour, who are not working and do not look for employment for any other reason.
2. Institution which provides data
Central Department of Statistics and Information (CDSI), Ministry and Economy and Planning
3. Data availability
Surveys conducted since 1999 are available on the website of the CDSI (http://www.cdsi.gov.sa/), in PDF format. Tables are also sometimes available in Excel format.
https://www.stats.gov.sa/en/814 (website English version)
https://www.stats.gov.sa/ar/814
The technical notes and tables of contents are displayed in the PDF version, in Arabic only. The tables are in both languages.
Since 2007, Statistical Yearbooks have introduced a section on “Labour Statistics”, which presents a selection of tables from Manpower Surveys.
https://www.stats.gov.sa/en/46
Date of access: October 2014.
| Activity status |
|
In the labour force |
|
|
Out of the labour force |
|
|
Total |
|
| |
Male |
Female |
Total |
Male |
Female |
Total |
Male |
Female |
Total |
| Saudis |
4,352,792 |
1,192,969 |
5,545,761 |
2,368,183 |
5,583,593 |
7,951,776 |
6,720,975 |
6,776,562 |
13,497,537 |
| Non-Saudis |
5,414,022 |
640,641 |
6,054,663 |
359,375 |
1,565,750 |
1,925,125 |
5,773,397 |
2,206,391 |
7,979,788 |
| Total |
9,766,814 |
1,833,610 |
11,600,424 |
2,727,558 |
7,149,343 |
9,876,901 |
12,494,372 |
8,982,953 |
21,477,325 |
source: Labour Force Survey 2014 (Round 1).
ANNEXED NOTE
1. Technical Notes and Definitions
Sampling frame of LFS 2014 Round 1: Population Census 2010.
Sample size: 33500 households
Reference period: January 2014.
Population of reference: all individuals (nationals and non-nationals) residing in the Kingdom during the period of reference.
The ultimate sampling unit is the household.
(a) Person in the labour force: a person aged 15 years and over, employed or unemployed.
(b) Person out of the labour force: A person aged 15 years and over who is not included in the labour force, among which: the persons staying home for domestics activities, the students, the retired, the self sufficients,
the ones unable to enrol in labour, who are not working and do not look for employment for any other reason.
2. Institution which provides data
Central Department of Statistics and Information (CDSI), Ministry and Economy and Planning
3. Data availability
Surveys conducted since 1999 are available on the website of the CDSI (https://www.stats.gov.sa/en), in PDF format. Tables are also sometimes available in Excel format.
https://www.stats.gov.sa/en/814 (website English version)
https://www.stats.gov.sa/ar/814
The technical notes and tables of contents are displayed in the PDF version, in Arabic only. The tables are in both languages.
Since 2007, Statistical Yearbooks have introduced a section on “Labour Statistics”, which presents a selection of tables from Manpower Surveys.
https://www.stats.gov.sa/en/46
Date of access: October 2014.
| Activity status |
|
In the labour force |
|
|
Out of the labour force |
|
|
Total |
|
| |
Male |
Female |
Total |
Male |
Female |
Total |
Male |
Female |
Total |
| Saudis |
4,384,137 |
1,207,426 |
5,591,563 |
2,455,232 |
5,776,789 |
8,232,021 |
6,839,369 |
6,984,215 |
13,823,584 |
| Non-Saudis |
5,643,005 |
677,641 |
6,320,646 |
413,485 |
1,666,316 |
2,079,801 |
6,056,490 |
2,343,957 |
8,400,447 |
| Total |
10,027,142 |
1,885,067 |
11,912,209 |
2,868,717 |
7,443,105 |
10,311,822 |
12,895,859 |
9,328,172 |
22,224,031 |
source: Labour Force Survey 2015 (Round 1).
ANNEXED NOTE
1. Technical Notes and Definitions
Sampling frame of LFS 2015 Round 1: Population Census 2010.
Sample size: 33500 households
Reference period: May 2015.
Population of reference: all individuals (nationals and non-nationals) residing in the Kingdom during the period of reference.
The ultimate sampling unit is the household.
(a) Person in the labour force: a person aged 15 years and over, employed or unemployed.
(b) Person out of the labour force: A person aged 15 years and over who is not included in the labour force, among which: the persons staying home for domestics activities, the students, the retired, the self sufficients,
the ones unable to enrol in labour, who are not working and do not look for employment for any other reason.
2. Institution which provides data
Central Department of Statistics and Information (CDSI), Ministry and Economy and Planning
3. Data availability
Surveys conducted since 1999 are available on the website of the CDSI (http://www.cdsi.gov.sa/), in PDF format. Tables are also sometimes available in Excel format.
https://www.stats.gov.sa/en/814 (website English version)
https://www.stats.gov.sa/ar/814
The technical notes and tables of contents are displayed in the PDF version, in Arabic only. The tables are in both languages.
Since 2007, Statistical Yearbooks have introduced a section on “Labour Statistics”, which presents a selection of tables from Manpower Surveys.
https://www.stats.gov.sa/en/46
Date of access: October 2015.
|
Departures |
|
2010 |
2011 |
2012 |
2013 |
|
Male |
Female |
Total |
Male |
Female |
Total |
Male |
Female |
Total |
Male |
Female |
Total |
| Kuwait |
2,250,997 |
1,079,067 |
3,330,064 |
2,337,974 |
1,146,769 |
3,484,743 |
2,489,936 |
1,242,765 |
3,732,701 |
2,730,406 |
1,348,567 |
4,078,973 |
| Other GCC Countries |
1,371,126 |
550,356 |
1,921,482 |
1,625,950 |
648,630 |
2,274,580 |
1,710,489 |
711,073 |
2,421,562 |
1,881,580 |
835,783 |
2,717,363 |
| Bahrain |
74,708 |
45,108 |
119,816 |
73,928 |
47,232 |
121,160 |
102,112 |
62,583 |
164,695 |
140,551 |
89,178 |
229,729 |
| Oman |
13,278 |
4,670 |
17,948 |
13,118 |
4,694 |
17,812 |
14,429 |
5,345 |
19,774 |
15,301 |
5,644 |
20,945 |
| Qatar |
20,856 |
10,049 |
30,905 |
22,340 |
10,508 |
32,848 |
23,750 |
11,875 |
35,625 |
25,704 |
13,244 |
38,948 |
| Saudi Arabia |
1,234,498 |
472,578 |
1,707,076 |
1,489,238 |
569,112 |
2,058,350 |
1,540,311 |
611,676 |
2,151,987 |
1,662,372 |
701,275 |
2,363,647 |
| United Arab Emirates |
27,786 |
17,951 |
45,737 |
27,326 |
17,084 |
44,410 |
29,887 |
19,594 |
49,481 |
37,652 |
26,442 |
64,094 |
| Asian Arab Countries |
446,626 |
161,840 |
608,466 |
413,010 |
144,101 |
557,111 |
390,606 |
133,436 |
524,042 |
376,167 |
134,712 |
510,879 |
| Iraq |
53,711 |
15,676 |
69,387 |
55,025 |
15,640 |
70,665 |
60,610 |
16,686 |
77,296 |
59,298 |
18,027 |
77,325 |
| Jordan |
61,720 |
32,488 |
94,208 |
63,407 |
32,749 |
96,156 |
67,608 |
34,445 |
102,053 |
75,151 |
36,924 |
112,075 |
| Lebanon |
80,496 |
38,715 |
119,211 |
70,408 |
35,128 |
105,536 |
71,876 |
36,509 |
108,385 |
73,207 |
38,175 |
111,382 |
| Palestine |
4,796 |
2,900 |
7,696 |
4,258 |
2,473 |
6,731 |
4,257 |
2,592 |
6,849 |
4,416 |
2,517 |
6,933 |
| Syria |
237,648 |
69,668 |
307,316 |
212,489 |
55,857 |
268,346 |
177,716 |
40,525 |
218,241 |
155,528 |
36,302 |
191,830 |
| Yemen |
8,255 |
2,393 |
10,648 |
7,423 |
2,254 |
9,677 |
8,539 |
2,679 |
11,218 |
8,567 |
2,767 |
11,334 |
| Asian Muslim Countries |
409,457 |
108,668 |
518,125 |
399,737 |
93,980 |
493,717 |
369,513 |
71,914 |
441,427 |
389,945 |
67,577 |
457,522 |
| Afghanistan |
13,071 |
506 |
13,577 |
12,651 |
620 |
13,271 |
12,049 |
648 |
12,697 |
12,527 |
784 |
13,311 |
| Azerbaijan |
155 |
108 |
263 |
226 |
122 |
348 |
319 |
95 |
414 |
372 |
130 |
502 |
| Bangladesh |
107,887 |
6,226 |
114,113 |
115,918 |
6,523 |
122,441 |
104,531 |
6,028 |
110,559 |
106,349 |
6,459 |
112,808 |
| Brunei |
34 |
6 |
40 |
12 |
1 |
13 |
18 |
3 |
21 |
6 |
3 |
9 |
| Indonesia |
4,447 |
54,570 |
59,017 |
4,772 |
41,657 |
46,429 |
4,018 |
19,998 |
24,016 |
4,143 |
12,547 |
16,690 |
| Iran |
60,070 |
22,514 |
82,584 |
53,121 |
21,044 |
74,165 |
53,200 |
20,680 |
73,880 |
55,206 |
22,018 |
77,224 |
| Kazakhstan |
130 |
106 |
236 |
158 |
123 |
281 |
116 |
103 |
219 |
181 |
142 |
323 |
| Kyrgyzstan |
149 |
483 |
632 |
226 |
476 |
702 |
156 |
490 |
646 |
221 |
597 |
818 |
| Malaysia |
2,486 |
1,568 |
4,054 |
3,071 |
1,274 |
4,345 |
2,553 |
1,671 |
4,224 |
2,840 |
1,907 |
4,747 |
| Maldives Islands |
8 |
6 |
14 |
38 |
4 |
42 |
19 |
30 |
49 |
68 |
18 |
86 |
| Pakistan |
210,707 |
20,801 |
231,508 |
199,379 |
20,438 |
219,817 |
183,382 |
20,228 |
203,610 |
197,948 |
20,615 |
218,563 |
| Tajikstan |
86 |
24 |
110 |
100 |
25 |
125 |
172 |
31 |
203 |
328 |
39 |
367 |
| Turkey |
9,745 |
1,592 |
11,337 |
9,680 |
1,503 |
11,183 |
8,557 |
1,714 |
10,271 |
9,475 |
2,086 |
11,561 |
| Turkmenistan |
45 |
4 |
49 |
6 |
6 |
12 |
14 |
14 |
28 |
12 |
13 |
25 |
| Uzbekistan |
437 |
154 |
591 |
379 |
164 |
543 |
409 |
181 |
590 |
269 |
219 |
488 |
| Other Asian Countries |
691,769 |
333,434 |
1,025,203 |
720,434 |
361,425 |
1,081,859 |
717,079 |
373,039 |
1,090,118 |
800,034 |
406,970 |
1,207,004 |
| Armenia |
361 |
149 |
510 |
375 |
203 |
578 |
314 |
250 |
564 |
383 |
422 |
805 |
| Bhutan |
61 |
9 |
70 |
80 |
30 |
110 |
42 |
33 |
75 |
89 |
25 |
114 |
| Borneo |
26 |
24 |
50 |
45 |
39 |
84 |
59 |
32 |
91 |
27 |
36 |
63 |
| Cambodia |
42 |
14 |
56 |
47 |
21 |
68 |
87 |
20 |
107 |
57 |
21 |
78 |
| Cyprus |
201 |
87 |
288 |
284 |
96 |
380 |
487 |
114 |
601 |
434 |
138 |
572 |
| East Timor |
7 |
1 |
8 |
5 |
1 |
6 |
4 |
1 |
5 |
2 |
2 |
4 |
| Georgia |
1,666 |
150 |
1,816 |
1,020 |
140 |
1,160 |
379 |
184 |
563 |
345 |
199 |
544 |
| Hong Kong |
179 |
71 |
250 |
160 |
50 |
210 |
155 |
68 |
223 |
189 |
84 |
273 |
| India |
558,125 |
169,597 |
727,722 |
586,287 |
182,393 |
768,680 |
594,880 |
187,488 |
782,368 |
665,032 |
206,994 |
872,026 |
| Japan |
4,327 |
615 |
4,942 |
4,228 |
621 |
4,849 |
4,649 |
631 |
5,280 |
4,456 |
605 |
5,061 |
| Korea |
6,918 |
797 |
7,715 |
8,928 |
850 |
9,778 |
9,950 |
1,071 |
11,021 |
10,790 |
1,200 |
11,990 |
| Laos |
12 |
5 |
17 |
13 |
3 |
16 |
24 |
7 |
31 |
21 |
5 |
26 |
| Macau |
5 |
0 |
5 |
10 |
1 |
11 |
3 |
0 |
3 |
3 |
0 |
3 |
| Mongolia |
126 |
36 |
162 |
285 |
113 |
398 |
149 |
58 |
207 |
142 |
51 |
193 |
| Myanmar (Burma) |
153 |
43 |
196 |
177 |
93 |
270 |
289 |
65 |
354 |
200 |
82 |
282 |
| Nepal |
22,908 |
21,636 |
44,544 |
21,558 |
26,192 |
47,750 |
17,082 |
26,833 |
43,915 |
20,122 |
26,402 |
46,524 |
| North Korea |
0 |
0 |
0 |
359 |
118 |
477 |
290 |
94 |
384 |
221 |
84 |
305 |
| Philippines |
46,835 |
74,721 |
121,556 |
44,081 |
81,114 |
125,195 |
40,707 |
90,792 |
131,499 |
45,561 |
105,501 |
151,062 |
| Republic of China |
8,340 |
2,148 |
10,488 |
10,978 |
2,116 |
13,094 |
11,799 |
2,251 |
14,050 |
12,650 |
2,436 |
15,086 |
| Singapore |
890 |
448 |
1,338 |
896 |
410 |
1,306 |
788 |
361 |
1,149 |
723 |
354 |
1,077 |
| South Korea |
1,157 |
10 |
1,167 |
936 |
9 |
945 |
995 |
11 |
1,006 |
1,454 |
19 |
1,473 |
| Sri Lanka |
35,541 |
57,886 |
93,427 |
36,083 |
63,562 |
99,645 |
30,571 |
59,519 |
90,090 |
33,971 |
58,424 |
92,395 |
| Thailand |
3,296 |
4,778 |
8,074 |
3,050 |
3,099 |
6,149 |
2,837 |
3,031 |
5,868 |
2,727 |
3,736 |
6,463 |
| Timur Islands |
|
|
|
|
|
|
0 |
1 |
1 |
0 |
0 |
0 |
| Taiwan |
93 |
67 |
160 |
141 |
52 |
193 |
80 |
37 |
117 |
125 |
62 |
187 |
| Vietnam |
500 |
142 |
642 |
408 |
99 |
507 |
459 |
87 |
546 |
310 |
88 |
398 |
| African Arab Countries |
459,568 |
139,459 |
599,027 |
464,125 |
146,362 |
610,487 |
491,184 |
166,964 |
658,148 |
546,094 |
185,346 |
731,440 |
| Algeria |
2,963 |
716 |
3,679 |
2,765 |
806 |
3,571 |
3,069 |
970 |
4,039 |
3,243 |
1,047 |
4,290 |
| Comoros Islands |
339 |
56 |
395 |
217 |
80 |
297 |
305 |
115 |
420 |
312 |
162 |
474 |
| Djibouti |
78 |
18 |
96 |
46 |
32 |
78 |
95 |
21 |
116 |
123 |
36 |
159 |
| Egypt |
440,589 |
123,472 |
564,061 |
445,596 |
130,520 |
576,116 |
470,676 |
149,233 |
619,909 |
523,367 |
165,964 |
689,331 |
| Libya |
532 |
152 |
684 |
343 |
104 |
447 |
611 |
152 |
763 |
724 |
193 |
917 |
| Mauritania |
3,383 |
8,457 |
11,840 |
223 |
67 |
290 |
312 |
68 |
380 |
404 |
104 |
508 |
| Morocco |
230 |
37 |
267 |
3,175 |
8,192 |
11,367 |
3,491 |
9,287 |
12,778 |
3,620 |
10,228 |
13,848 |
| Somalia |
1,728 |
510 |
2,238 |
1,465 |
554 |
2,019 |
1,436 |
556 |
1,992 |
1,488 |
528 |
2,016 |
| South Sudan |
6,902 |
1,014 |
7,916 |
7,323 |
1,150 |
8,473 |
7,739 |
1,321 |
9,060 |
57 |
5 |
62 |
| Sudan |
9,217 |
1,893 |
11,110 |
| Tunisia |
2,824 |
5,027 |
7,851 |
2,972 |
4,857 |
7,829 |
3,450 |
5,241 |
8,691 |
3,539 |
5,186 |
8,725 |
| African Muslim Countries |
3,219 |
1,528 |
4,747 |
2,964 |
1,470 |
4,434 |
3,048 |
1,347 |
4,395 |
4,159 |
2,301 |
6,460 |
| Benin |
140 |
41 |
181 |
152 |
66 |
218 |
194 |
54 |
248 |
204 |
58 |
262 |
| Burkina Faso |
56 |
13 |
69 |
78 |
18 |
96 |
85 |
12 |
97 |
121 |
23 |
144 |
| Cameroon |
86 |
20 |
106 |
38 |
17 |
55 |
36 |
12 |
48 |
107 |
21 |
128 |
| Chad |
998 |
31 |
1,029 |
760 |
22 |
782 |
550 |
25 |
575 |
776 |
41 |
817 |
| Eritrea |
372 |
774 |
1,146 |
351 |
733 |
1,084 |
442 |
570 |
1,012 |
521 |
577 |
1,098 |
| Gabon |
2 |
3 |
5 |
3 |
1 |
4 |
3 |
6 |
9 |
67 |
21 |
88 |
| Gambia |
40 |
10 |
50 |
55 |
8 |
63 |
62 |
9 |
71 |
98 |
24 |
122 |
| Mali |
101 |
7 |
108 |
112 |
14 |
126 |
148 |
16 |
164 |
476 |
21 |
497 |
| Niger |
111 |
55 |
166 |
152 |
36 |
188 |
139 |
60 |
199 |
153 |
56 |
209 |
| Nigeria |
884 |
429 |
1,313 |
803 |
379 |
1,182 |
843 |
324 |
1,167 |
937 |
443 |
1,380 |
| Senegal |
229 |
92 |
321 |
255 |
119 |
374 |
330 |
106 |
436 |
369 |
93 |
462 |
| Sierra Leone |
108 |
24 |
132 |
120 |
26 |
146 |
135 |
33 |
168 |
193 |
39 |
232 |
| Uganda |
92 |
29 |
121 |
85 |
31 |
116 |
81 |
120 |
201 |
137 |
884 |
1,021 |
| Other African Countries |
10,821 |
23,910 |
34,731 |
9,843 |
35,588 |
45,431 |
10,123 |
51,561 |
61,684 |
12,072 |
61,755 |
73,827 |
| Angola |
12 |
0 |
12 |
13 |
2 |
15 |
32 |
2 |
34 |
37 |
8 |
45 |
| Botswana |
2 |
3 |
5 |
13 |
9 |
22 |
21 |
14 |
35 |
24 |
15 |
39 |
| Burundi |
5 |
5 |
10 |
12 |
9 |
21 |
9 |
8 |
17 |
45 |
13 |
58 |
| Central African Republic |
9 |
11 |
20 |
15 |
9 |
24 |
23 |
7 |
30 |
18 |
13 |
31 |
| Congo (Brazzaville) |
0 |
0 |
0 |
6 |
1 |
7 |
2 |
2 |
4 |
31 |
13 |
44 |
| Dem. Republic of Congo |
25 |
9 |
34 |
30 |
6 |
36 |
20 |
7 |
27 |
44 |
17 |
61 |
| Ethiopia |
1,528 |
21,541 |
23,069 |
2,024 |
33,485 |
35,509 |
3,221 |
49,014 |
52,235 |
4,514 |
57,276 |
61,790 |
| Ghana |
2,903 |
135 |
3,038 |
2,567 |
134 |
2,701 |
1,783 |
232 |
2,015 |
1,257 |
435 |
1,692 |
| Guinea |
82 |
17 |
99 |
49 |
20 |
69 |
63 |
20 |
83 |
84 |
28 |
112 |
| Ivory Coast |
45 |
13 |
58 |
48 |
23 |
71 |
52 |
24 |
76 |
63 |
21 |
84 |
| Kenya |
1,391 |
264 |
1,655 |
1,164 |
264 |
1,428 |
1,039 |
350 |
1,389 |
999 |
399 |
1,398 |
| Lesotho |
41 |
16 |
57 |
10 |
3 |
13 |
17 |
10 |
27 |
43 |
30 |
73 |
| Liberia |
225 |
55 |
280 |
167 |
60 |
227 |
164 |
61 |
225 |
174 |
52 |
226 |
| Madagascar |
548 |
67 |
615 |
191 |
77 |
268 |
141 |
352 |
493 |
164 |
1,632 |
1,796 |
| Malawi |
8 |
33 |
41 |
31 |
52 |
83 |
71 |
31 |
102 |
97 |
53 |
150 |
| Mauritius |
85 |
38 |
123 |
85 |
29 |
114 |
58 |
29 |
87 |
87 |
37 |
124 |
| Mozambique |
17 |
1 |
18 |
25 |
8 |
33 |
26 |
9 |
35 |
20 |
6 |
26 |
| Namibia |
11 |
4 |
15 |
11 |
3 |
14 |
8 |
0 |
8 |
19 |
10 |
29 |
| Rwanda |
2 |
0 |
2 |
9 |
5 |
14 |
11 |
7 |
18 |
40 |
15 |
55 |
| Seychelles Islands |
9 |
19 |
28 |
8 |
19 |
27 |
11 |
20 |
31 |
26 |
19 |
45 |
| South Africa |
3,055 |
1,484 |
4,539 |
2,863 |
1,216 |
4,079 |
2,885 |
1,195 |
4,080 |
3,392 |
1,412 |
4,804 |
| Swaziland |
146 |
80 |
226 |
27 |
34 |
61 |
53 |
61 |
114 |
69 |
52 |
121 |
| Tanzania |
170 |
32 |
202 |
164 |
32 |
196 |
209 |
32 |
241 |
357 |
64 |
421 |
| Togo |
268 |
23 |
291 |
133 |
32 |
165 |
47 |
23 |
70 |
91 |
58 |
149 |
| Zambia |
48 |
0 |
48 |
31 |
3 |
34 |
9 |
8 |
17 |
34 |
17 |
51 |
| Zimbabwe |
167 |
55 |
222 |
137 |
50 |
187 |
136 |
41 |
177 |
300 |
51 |
351 |
| Other |
19 |
5 |
24 |
10 |
3 |
13 |
12 |
2 |
14 |
43 |
9 |
52 |
| Oceania |
13,369 |
5,785 |
19,154 |
10,679 |
4,861 |
15,540 |
9,585 |
4,378 |
13,963 |
9,168 |
3,997 |
13,165 |
| Australia |
10,548 |
4,787 |
15,335 |
8,619 |
3,977 |
12,596 |
7,645 |
3,568 |
11,213 |
7,308 |
3,250 |
10,558 |
| Fiji Islands |
531 |
15 |
546 |
160 |
3 |
163 |
82 |
3 |
85 |
63 |
7 |
70 |
| New Zealand |
2,266 |
972 |
3,238 |
1,886 |
866 |
2,752 |
1,842 |
795 |
2,637 |
1,791 |
733 |
2,524 |
| Other |
24 |
11 |
35 |
14 |
15 |
29 |
16 |
12 |
28 |
6 |
7 |
13 |
| North America |
151,125 |
47,866 |
198,991 |
144,119 |
46,138 |
190,257 |
117,744 |
43,471 |
161,215 |
109,112 |
44,975 |
154,087 |
| Canada |
27,913 |
13,340 |
41,253 |
26,497 |
12,046 |
38,543 |
26,567 |
12,414 |
38,981 |
26,502 |
13,333 |
39,835 |
| U.S.A |
123,212 |
34,521 |
157,733 |
117,622 |
34,087 |
151,709 |
91,155 |
31,047 |
122,202 |
82,610 |
31,641 |
114,251 |
| Other |
0 |
5 |
5 |
0 |
5 |
5 |
22 |
10 |
32 |
0 |
1 |
1 |
| South & Central America |
3,377 |
1,338 |
4,715 |
3,671 |
1,605 |
5,276 |
3,722 |
1,569 |
5,291 |
3,691 |
1,741 |
5,432 |
| Argentina |
318 |
123 |
441 |
451 |
161 |
612 |
373 |
156 |
529 |
351 |
150 |
501 |
| Belize |
160 |
11 |
171 |
123 |
30 |
153 |
121 |
8 |
129 |
101 |
10 |
111 |
| Bolivia |
61 |
29 |
90 |
54 |
38 |
92 |
40 |
39 |
79 |
48 |
37 |
85 |
| Brazil |
997 |
367 |
1,364 |
939 |
303 |
1,242 |
933 |
291 |
1,224 |
956 |
331 |
1,287 |
| Chile |
71 |
19 |
90 |
65 |
14 |
79 |
61 |
27 |
88 |
43 |
31 |
74 |
| Colombia |
260 |
153 |
413 |
231 |
174 |
405 |
316 |
152 |
468 |
270 |
174 |
444 |
| Costa Rica |
5 |
9 |
14 |
16 |
7 |
23 |
7 |
9 |
16 |
9 |
11 |
20 |
| Cuba |
9 |
12 |
21 |
9 |
23 |
32 |
34 |
27 |
61 |
18 |
18 |
36 |
| Dominican Republic |
120 |
50 |
170 |
147 |
51 |
198 |
207 |
47 |
254 |
199 |
88 |
287 |
| El Salvador |
159 |
1 |
160 |
43 |
9 |
52 |
28 |
11 |
39 |
15 |
4 |
19 |
| Equador |
111 |
38 |
149 |
113 |
41 |
154 |
170 |
35 |
205 |
81 |
22 |
103 |
| Grenada |
19 |
10 |
29 |
10 |
3 |
13 |
13 |
4 |
17 |
19 |
23 |
42 |
| Guatemala |
4 |
4 |
8 |
12 |
7 |
19 |
24 |
6 |
30 |
56 |
18 |
74 |
| Guyana |
17 |
3 |
20 |
13 |
3 |
16 |
8 |
15 |
23 |
8 |
16 |
24 |
| Haiti |
2 |
2 |
4 |
11 |
2 |
13 |
5 |
4 |
9 |
16 |
3 |
19 |
| Honduras |
2 |
3 |
5 |
15 |
6 |
21 |
7 |
4 |
11 |
10 |
1 |
11 |
| Jamaica |
30 |
25 |
55 |
65 |
25 |
90 |
60 |
29 |
89 |
54 |
33 |
87 |
| Mexico |
166 |
96 |
262 |
241 |
117 |
358 |
227 |
151 |
378 |
306 |
198 |
504 |
| Nicaragua |
3 |
1 |
4 |
2 |
0 |
2 |
3 |
1 |
4 |
9 |
1 |
10 |
| Panama |
18 |
2 |
20 |
15 |
4 |
19 |
34 |
12 |
46 |
50 |
14 |
64 |
| Paraguay |
1 |
7 |
8 |
2 |
4 |
6 |
3 |
2 |
5 |
23 |
4 |
27 |
| Peru |
31 |
9 |
40 |
39 |
10 |
49 |
120 |
24 |
144 |
96 |
24 |
120 |
| Suriname |
6 |
0 |
6 |
2 |
0 |
2 |
3 |
2 |
5 |
6 |
13 |
19 |
| Trinidad & Tobago |
82 |
41 |
123 |
92 |
39 |
131 |
76 |
21 |
97 |
99 |
36 |
135 |
| Uruguay |
27 |
2 |
29 |
44 |
4 |
48 |
42 |
6 |
48 |
55 |
3 |
58 |
| Venezuela |
651 |
314 |
965 |
877 |
518 |
1,395 |
781 |
469 |
1,250 |
735 |
463 |
1,198 |
| Others |
47 |
7 |
54 |
40 |
12 |
52 |
26 |
17 |
43 |
58 |
15 |
73 |
| Europe |
126,117 |
47,451 |
173,568 |
128,291 |
42,953 |
171,244 |
124,116 |
44,409 |
168,525 |
129,895 |
50,097 |
179,992 |
| Albania |
151 |
43 |
194 |
148 |
50 |
198 |
154 |
55 |
209 |
118 |
48 |
166 |
| Andorra |
1 |
0 |
1 |
5 |
2 |
7 |
8 |
0 |
8 |
4 |
0 |
4 |
| Austria |
1,616 |
382 |
1,998 |
1,531 |
386 |
1,917 |
1,318 |
377 |
1,695 |
1,344 |
450 |
1,794 |
| Belarus |
125 |
206 |
331 |
121 |
202 |
323 |
88 |
165 |
253 |
149 |
224 |
373 |
| Belgium |
2,260 |
511 |
2,771 |
1,973 |
418 |
2,391 |
1,662 |
385 |
2,047 |
1,666 |
391 |
2,057 |
| Bosnia & Herzegovina |
756 |
352 |
1,108 |
864 |
350 |
1,214 |
638 |
399 |
1,037 |
441 |
360 |
801 |
| Bulgaria |
1,322 |
2,177 |
3,499 |
1,360 |
1,921 |
3,281 |
1,434 |
1,865 |
3,299 |
1,420 |
1,929 |
3,349 |
| Croatia |
729 |
86 |
815 |
674 |
82 |
756 |
565 |
96 |
661 |
772 |
101 |
873 |
| Czech Republic |
602 |
752 |
1,354 |
471 |
315 |
786 |
431 |
191 |
622 |
468 |
198 |
666 |
| Denmark |
2,308 |
894 |
3,202 |
2,179 |
871 |
3,050 |
2,280 |
969 |
3,249 |
2,294 |
959 |
3,253 |
| Estonia |
24 |
6 |
30 |
22 |
5 |
27 |
30 |
18 |
48 |
34 |
33 |
67 |
| Finland |
783 |
242 |
1,025 |
818 |
278 |
1,096 |
658 |
265 |
923 |
660 |
259 |
919 |
| France |
11,482 |
3,571 |
15,053 |
11,706 |
3,510 |
15,216 |
11,973 |
3,762 |
15,735 |
11,659 |
4,067 |
15,726 |
| Germany |
11,638 |
3,021 |
14,659 |
11,621 |
2,841 |
14,462 |
10,456 |
2,857 |
13,313 |
11,769 |
4,599 |
16,368 |
| Greece |
1,702 |
635 |
2,337 |
2,251 |
572 |
2,823 |
1,933 |
554 |
2,487 |
2,232 |
674 |
2,906 |
| Hungary |
935 |
458 |
1,393 |
881 |
437 |
1,318 |
952 |
549 |
1,501 |
1,024 |
547 |
1,571 |
| Iceland |
57 |
19 |
76 |
76 |
21 |
97 |
64 |
30 |
94 |
54 |
38 |
92 |
| Ireland |
2,250 |
705 |
2,955 |
2,364 |
809 |
3,173 |
2,534 |
849 |
3,383 |
2,544 |
864 |
3,408 |
| Italy |
8,972 |
1,973 |
10,945 |
8,346 |
1,633 |
9,979 |
9,157 |
1,792 |
10,949 |
11,539 |
1,933 |
13,472 |
| Kosovo |
166 |
28 |
194 |
154 |
41 |
195 |
162 |
34 |
196 |
84 |
29 |
113 |
| Latvia |
55 |
26 |
81 |
40 |
51 |
91 |
96 |
59 |
155 |
86 |
53 |
139 |
| Liechtenstein |
8 |
2 |
10 |
11 |
2 |
13 |
62 |
6 |
68 |
4 |
6 |
10 |
| Lithuania |
54 |
54 |
108 |
59 |
57 |
116 |
135 |
71 |
206 |
139 |
51 |
190 |
| Luxembourg |
55 |
34 |
89 |
43 |
39 |
82 |
52 |
49 |
101 |
58 |
33 |
91 |
| Macedonia |
604 |
210 |
814 |
225 |
144 |
369 |
232 |
164 |
396 |
253 |
193 |
446 |
| Malta |
181 |
32 |
213 |
144 |
24 |
168 |
187 |
34 |
221 |
194 |
40 |
234 |
| Moldova |
20 |
32 |
52 |
19 |
31 |
50 |
42 |
29 |
71 |
9 |
41 |
50 |
| Monaco |
4 |
2 |
6 |
1 |
0 |
1 |
2 |
1 |
3 |
3 |
0 |
3 |
| Montenegro |
10 |
1 |
11 |
28 |
4 |
32 |
33 |
7 |
40 |
39 |
9 |
48 |
| Netherlands |
5,642 |
1,411 |
7,053 |
5,998 |
1,562 |
7,560 |
5,066 |
1,571 |
6,637 |
5,596 |
2,228 |
7,824 |
| Norway |
1,817 |
839 |
2,656 |
1,638 |
807 |
2,445 |
1,315 |
646 |
1,961 |
1,023 |
509 |
1,532 |
| Poland |
1,199 |
743 |
1,942 |
1,116 |
633 |
1,749 |
1,150 |
665 |
1,815 |
1,159 |
781 |
1,940 |
| Portugal |
931 |
225 |
1,156 |
756 |
214 |
970 |
1,118 |
343 |
1,461 |
1,476 |
539 |
2,015 |
| Romania |
1,685 |
3,884 |
5,569 |
2,010 |
1,525 |
3,535 |
1,801 |
1,611 |
3,412 |
2,053 |
1,851 |
3,904 |
| Russian Federation |
1,635 |
760 |
2,395 |
2,257 |
859 |
3,116 |
2,053 |
946 |
2,999 |
2,116 |
1,095 |
3,211 |
| San Marino |
3 |
0 |
3 |
6 |
0 |
6 |
6 |
2 |
8 |
8 |
2 |
10 |
| Serbia |
365 |
218 |
583 |
623 |
289 |
912 |
544 |
365 |
909 |
679 |
454 |
1,133 |
| Slovakia |
634 |
2,121 |
2,755 |
323 |
587 |
910 |
267 |
443 |
710 |
336 |
420 |
756 |
| Slovenia |
224 |
63 |
287 |
162 |
62 |
224 |
222 |
73 |
295 |
273 |
106 |
379 |
| Spain |
5,755 |
840 |
6,595 |
5,111 |
1,009 |
6,120 |
4,532 |
1,097 |
5,629 |
5,466 |
1,484 |
6,950 |
| Sweden |
4,265 |
2,188 |
6,453 |
4,495 |
2,294 |
6,789 |
4,272 |
2,570 |
6,842 |
3,464 |
1,997 |
5,461 |
| Switzerland |
1,699 |
399 |
2,098 |
1,740 |
433 |
2,173 |
1,660 |
385 |
2,045 |
1,640 |
398 |
2,038 |
| Ukraine |
507 |
535 |
1,042 |
635 |
387 |
1,022 |
716 |
426 |
1,142 |
899 |
522 |
1,421 |
| United Kingdom |
50,563 |
16,543 |
67,106 |
53,054 |
17,036 |
70,090 |
51,868 |
17,504 |
69,372 |
52,443 |
19,474 |
71,917 |
| Vatican |
8 |
0 |
8 |
17 |
0 |
17 |
19 |
1 |
20 |
23 |
2 |
25 |
| Yugoslavia |
315 |
228 |
543 |
215 |
160 |
375 |
169 |
129 |
298 |
181 |
106 |
287 |
| Others |
|
|
|
|
|
|
0 |
0 |
0 |
0 |
0 |
0 |
| Others |
23,587 |
11,099 |
34,686 |
24,910 |
12,420 |
37,330 |
33,931 |
17,442 |
51,373 |
34,967 |
18,190 |
53,157 |
| U.N |
49 |
17 |
66 |
103 |
37 |
140 |
149 |
48 |
197 |
93 |
30 |
123 |
| Unstated Nationality |
166 |
112 |
278 |
132 |
117 |
249 |
106 |
111 |
217 |
85 |
97 |
182 |
| Non Kuwaiti |
23,372 |
10,970 |
34,342 |
24,675 |
12,266 |
36,941 |
33,676 |
17,283 |
50,959 |
34,789 |
18,063 |
52,852 |
| Grand Total |
5,961,158 |
2,511,801 |
8,472,959 |
6,285,707 |
2,686,302 |
8,972,009 |
6,471,076 |
2,863,368 |
9,334,444 |
7,027,290 |
3,162,011 |
10,189,301 |
Source: Annual Statistical Bulletin of Transport and Communication
ANNEXED NOTE
1. Definitions
The “Non-Kuwaitis are the Bidoun populations.
2. Institution which provides data
Central Statistical Bureau (CSB), Ministry of Planning
3. Data availability
The data is taken from the Annual Statistical Bulletin of Transport and Communication (available in PDF; also in Excel format for 2012 and 2013).
http://www.csb.gov.kw/Socan_Statistic_EN.aspx?ID=41
http://www.csb.gov.kw/Socan_Statistic.aspx?ID=41
Date of access: October 2015.
|
Arrivals |
| 2010 |
2011 |
2012 |
2013 |
| Males |
Females |
Total |
Males |
Females |
Total |
Males |
Females |
Total |
Male |
Female |
Total |
| Kuwait |
2,247,402 |
1,076,269 |
3,323,671 |
2,336,630 |
1,144,627 |
3,481,257 |
2,488,901 |
1,242,038 |
3,730,939 |
2,712,912 |
1,336,090 |
4,049,002 |
| Other GCC Countries |
1,373,706 |
552,012 |
1,925,718 |
1,630,324 |
651,520 |
2,281,844 |
1,714,645 |
714,530 |
2,429,175 |
1,883,065 |
837,185 |
2,720,250 |
| Bahrain |
76,243 |
45,949 |
122,192 |
74,113 |
47,369 |
121,482 |
101,611 |
62,172 |
163,783 |
140,854 |
89,415 |
230,269 |
| Oman |
13,389 |
4,646 |
18,035 |
13,189 |
4,676 |
17,865 |
14,482 |
5,300 |
19,782 |
15,276 |
5,646 |
20,922 |
| Qatar |
20,856 |
10,017 |
30,873 |
22,473 |
10,550 |
33,023 |
23,911 |
11,950 |
35,861 |
25,762 |
13,286 |
39,048 |
| Saudi Arabia |
1,235,295 |
473,366 |
1,708,661 |
1,492,514 |
571,301 |
2,063,815 |
1,544,740 |
615,551 |
2,160,291 |
1,663,165 |
702,097 |
2,365,262 |
| United Arab Emirates |
27,923 |
18,034 |
45,957 |
28,035 |
17,624 |
45,659 |
29,901 |
19,557 |
49,458 |
38,008 |
26,741 |
64,749 |
| Asian Arab Countries |
445,622 |
161,925 |
607,547 |
413,743 |
144,044 |
557,787 |
394,687 |
138,559 |
533,246 |
379,181 |
139,796 |
518,977 |
| Iraq |
53,545 |
15,535 |
69,080 |
54,701 |
15,357 |
70,058 |
60,264 |
16,493 |
76,757 |
59,261 |
17,952 |
77,213 |
| Jordan |
61,893 |
32,587 |
94,480 |
63,959 |
33,308 |
97,267 |
68,109 |
34,911 |
103,020 |
75,399 |
37,219 |
112,618 |
| Lebanon |
79,473 |
38,213 |
117,686 |
69,803 |
34,936 |
104,739 |
71,764 |
36,513 |
108,277 |
73,166 |
38,242 |
111,408 |
| Palestine |
4,759 |
2,863 |
7,622 |
4,201 |
2,439 |
6,640 |
4,204 |
2,571 |
6,775 |
4,370 |
2,461 |
6,831 |
| Syria |
237,749 |
70,200 |
307,949 |
213,405 |
55,608 |
269,013 |
181,996 |
45,433 |
227,429 |
158,391 |
41,065 |
199,456 |
| Yemen |
8,203 |
2,527 |
10,730 |
7,674 |
2,396 |
10,070 |
8,350 |
2,638 |
10,988 |
8,594 |
2,857 |
11,451 |
| Asian Muslim Countries |
392,338 |
85,048 |
477,386 |
379,700 |
71,286 |
450,986 |
361,433 |
63,912 |
425,345 |
382,953 |
63,935 |
446,888 |
| Afghanistan |
12,122 |
485 |
12,607 |
11,858 |
599 |
12,457 |
11,855 |
612 |
12,467 |
12,359 |
761 |
13,120 |
| Azerbaijan |
171 |
119 |
290 |
224 |
116 |
340 |
316 |
94 |
410 |
377 |
142 |
519 |
| Bangladesh |
96,817 |
5,573 |
102,390 |
102,010 |
5,807 |
107,817 |
100,217 |
5,766 |
105,983 |
102,550 |
6,238 |
108,788 |
| Brunei |
33 |
4 |
37 |
13 |
1 |
14 |
18 |
3 |
21 |
4 |
3 |
7 |
| Indonesia |
4,386 |
31,278 |
35,664 |
4,673 |
21,120 |
25,793 |
3,914 |
13,779 |
17,693 |
4,059 |
9,741 |
13,800 |
| Iran |
58,700 |
22,436 |
81,136 |
51,589 |
20,478 |
72,067 |
52,248 |
20,184 |
72,432 |
54,567 |
21,817 |
76,384 |
| Kazakhstan |
130 |
108 |
238 |
159 |
118 |
159 |
115 |
103 |
218 |
178 |
142 |
320 |
| Kyrgyzstan |
150 |
484 |
634 |
229 |
467 |
229 |
157 |
492 |
649 |
216 |
610 |
826 |
| Malaysia |
2,511 |
1,594 |
4,105 |
3,044 |
1,276 |
4,320 |
2,608 |
1,686 |
4,294 |
2,844 |
1,889 |
4,733 |
| Maldives Islands |
8 |
6 |
14 |
36 |
5 |
36 |
19 |
30 |
49 |
71 |
19 |
90 |
| Pakistan |
206,866 |
21,162 |
228,028 |
195,605 |
19,589 |
215,194 |
180,835 |
19,202 |
200,037 |
195,566 |
20,176 |
215,742 |
| Tajikstan |
90 |
28 |
118 |
100 |
29 |
129 |
178 |
30 |
208 |
333 |
43 |
376 |
| Turkey |
9,872 |
1,606 |
11,478 |
9,773 |
1,500 |
11,273 |
8,533 |
1,721 |
10,254 |
9,535 |
2,106 |
11,641 |
| Turkmenistan |
44 |
4 |
48 |
6 |
6 |
12 |
15 |
18 |
33 |
11 |
11 |
22 |
| Uzbekistan |
438 |
161 |
599 |
381 |
175 |
556 |
405 |
192 |
597 |
282 |
237 |
519 |
| Others |
|
|
|
|
|
|
|
|
|
1 |
0 |
1 |
| Other Asian Countries |
717,939 |
358,882 |
1,076,821 |
757,414 |
370,096 |
1,127,510 |
762,100 |
398,738 |
1,160,838 |
843,381 |
419,442 |
1,262,823 |
| Armenia |
366 |
160 |
526 |
385 |
201 |
586 |
344 |
299 |
643 |
382 |
425 |
807 |
| Bhutan |
61 |
11 |
72 |
90 |
33 |
123 |
43 |
34 |
77 |
97 |
28 |
125 |
| Borneo |
28 |
23 |
51 |
45 |
39 |
84 |
56 |
32 |
88 |
27 |
34 |
61 |
| Cambodia |
47 |
17 |
64 |
52 |
18 |
70 |
91 |
22 |
113 |
61 |
20 |
81 |
| Cyprus |
202 |
84 |
286 |
282 |
98 |
380 |
495 |
119 |
614 |
431 |
142 |
573 |
| East Timur |
7 |
1 |
8 |
5 |
1 |
6 |
4 |
1 |
5 |
2 |
2 |
4 |
| Georgia |
1,679 |
153 |
1,832 |
992 |
143 |
1,135 |
361 |
190 |
551 |
337 |
197 |
534 |
| Hong Kong |
175 |
69 |
244 |
161 |
50 |
211 |
152 |
66 |
218 |
188 |
81 |
269 |
| India |
576,253 |
174,806 |
751,059 |
607,976 |
181,718 |
789,694 |
629,316 |
197,210 |
826,526 |
701,640 |
215,899 |
917,539 |
| Japan |
4,347 |
612 |
4,959 |
4,189 |
609 |
4,798 |
4,657 |
634 |
5,291 |
4,465 |
607 |
5,072 |
| Korea |
6,912 |
814 |
7,726 |
9,425 |
923 |
10,348 |
10,237 |
1,082 |
11,319 |
10,894 |
1,266 |
12,160 |
| Laos |
13 |
7 |
20 |
13 |
1 |
14 |
25 |
9 |
34 |
20 |
5 |
25 |
| Macau |
4 |
0 |
4 |
9 |
1 |
10 |
4 |
0 |
4 |
4 |
0 |
4 |
| Mongolia |
130 |
40 |
170 |
281 |
118 |
399 |
146 |
51 |
197 |
134 |
53 |
187 |
| Myanmar (Burma) |
128 |
60 |
188 |
304 |
72 |
376 |
223 |
74 |
297 |
193 |
95 |
288 |
| Nepal |
27,605 |
25,366 |
52,971 |
29,395 |
24,417 |
53,812 |
22,038 |
25,508 |
47,546 |
23,236 |
27,673 |
50,909 |
| North Korea |
0 |
0 |
0 |
327 |
115 |
442 |
265 |
89 |
354 |
185 |
88 |
273 |
| Philippines |
47,660 |
87,522 |
135,182 |
45,514 |
94,474 |
139,988 |
43,976 |
110,413 |
154,389 |
46,753 |
110,199 |
156,952 |
| Republic of China |
8,844 |
2,081 |
10,925 |
12,014 |
2,194 |
14,208 |
10,979 |
2,304 |
13,283 |
13,051 |
2,377 |
15,428 |
| Singapore |
998 |
459 |
1,457 |
932 |
391 |
1,323 |
813 |
361 |
1,174 |
774 |
352 |
1,126 |
| South Korea |
1,374 |
11 |
1,385 |
1,318 |
11 |
1,329 |
1,397 |
15 |
1,412 |
1,652 |
21 |
1,673 |
| Sri Lanka |
37,681 |
61,649 |
99,330 |
39,488 |
61,294 |
100,782 |
33,237 |
57,023 |
90,260 |
36,054 |
56,012 |
92,066 |
| Thailand |
2,877 |
4,754 |
7,631 |
3,638 |
3,032 |
6,670 |
2,454 |
3,090 |
5,544 |
2,415 |
3,717 |
6,132 |
| Timur Islands |
|
|
|
|
|
|
1 |
1 |
2 |
0 |
0 |
0 |
| Taiwan |
94 |
64 |
158 |
141 |
55 |
196 |
79 |
31 |
110 |
122 |
62 |
184 |
| Vietnam |
454 |
119 |
573 |
438 |
88 |
526 |
707 |
80 |
787 |
264 |
87 |
351 |
| African Arab Countries |
461,237 |
143,307 |
604,544 |
478,052 |
151,088 |
629,140 |
514,146 |
172,133 |
686,279 |
564,888 |
189,558 |
754,446 |
| Algeria |
2,960 |
734 |
3,694 |
2,731 |
835 |
3,566 |
3,112 |
1,004 |
4,116 |
3,206 |
1,053 |
4,259 |
| Comoros Islands |
368 |
57 |
425 |
218 |
85 |
303 |
282 |
129 |
411 |
305 |
155 |
460 |
| Djibouti |
75 |
17 |
92 |
50 |
32 |
82 |
98 |
18 |
116 |
137 |
37 |
174 |
| Egypt |
442,190 |
127,262 |
569,452 |
459,047 |
135,052 |
594,099 |
492,365 |
153,728 |
646,093 |
540,367 |
170,048 |
710,415 |
| Libya |
527 |
150 |
677 |
350 |
105 |
455 |
613 |
160 |
773 |
719 |
195 |
914 |
| Mauritania |
3,370 |
8,438 |
11,808 |
230 |
63 |
293 |
320 |
67 |
387 |
403 |
113 |
516 |
| Morocco |
223 |
43 |
266 |
3,148 |
8,303 |
11,451 |
3,576 |
9,430 |
13,006 |
3,670 |
10,308 |
13,978 |
| Somalia |
1,682 |
488 |
2,170 |
1,403 |
532 |
1,935 |
1,410 |
538 |
1,948 |
1,486 |
477 |
1,963 |
| South Sudan |
|
|
|
|
|
|
|
|
|
51 |
7 |
58 |
| Sudan |
7,007 |
1,036 |
8,043 |
7,868 |
1,181 |
9,049 |
8,805 |
1,615 |
10,420 |
11,030 |
1,965 |
12,995 |
| Tunisia |
2,835 |
5,082 |
7,917 |
3,007 |
4,900 |
7,907 |
3,565 |
5,444 |
9,009 |
3,514 |
5,200 |
8,714 |
| African Muslim Countries |
3,271 |
1,419 |
4,690 |
3,005 |
1,374 |
4,379 |
3,211 |
1,698 |
4,909 |
4,614 |
4,032 |
8,646 |
| Benin |
159 |
44 |
203 |
165 |
61 |
226 |
206 |
54 |
260 |
233 |
48 |
281 |
| Burkina Faso |
59 |
11 |
70 |
78 |
23 |
101 |
85 |
12 |
97 |
133 |
29 |
162 |
| Cameroon |
89 |
19 |
108 |
36 |
14 |
50 |
43 |
17 |
60 |
105 |
21 |
126 |
| Chad |
1,000 |
32 |
1,032 |
774 |
20 |
794 |
547 |
24 |
571 |
786 |
49 |
835 |
| Eritrea |
358 |
686 |
1,044 |
341 |
628 |
969 |
436 |
540 |
976 |
527 |
548 |
1,075 |
| Gabon |
1 |
4 |
5 |
5 |
3 |
8 |
5 |
7 |
12 |
68 |
19 |
87 |
| Gambia |
46 |
8 |
54 |
53 |
13 |
66 |
65 |
7 |
72 |
100 |
23 |
123 |
| Mali |
112 |
8 |
120 |
127 |
16 |
143 |
219 |
19 |
238 |
650 |
26 |
676 |
| Niger |
126 |
47 |
173 |
146 |
43 |
189 |
138 |
51 |
189 |
169 |
54 |
223 |
| Nigeria |
880 |
401 |
1,281 |
797 |
376 |
1,173 |
840 |
330 |
1,170 |
930 |
447 |
1,377 |
| Senegal |
240 |
96 |
336 |
266 |
119 |
385 |
333 |
110 |
443 |
359 |
93 |
452 |
| Sierra Leone |
106 |
27 |
133 |
132 |
26 |
158 |
206 |
41 |
247 |
251 |
42 |
293 |
| Uganda |
95 |
36 |
131 |
85 |
32 |
117 |
88 |
486 |
574 |
303 |
2,633 |
2,936 |
| Other African Countries |
12,829 |
43,146 |
55,975 |
12,084 |
62,265 |
74,349 |
12,542 |
56,567 |
69,109 |
13,884 |
66,231 |
80,115 |
| Angola |
12 |
0 |
12 |
17 |
3 |
20 |
32 |
2 |
34 |
37 |
9 |
46 |
| Botswana |
4 |
2 |
6 |
15 |
14 |
29 |
22 |
15 |
37 |
27 |
15 |
42 |
| Burundi |
5 |
6 |
11 |
12 |
10 |
22 |
8 |
7 |
15 |
50 |
12 |
62 |
| Central African Republic |
11 |
21 |
32 |
16 |
18 |
34 |
25 |
12 |
37 |
19 |
12 |
31 |
| Congo (Brazzaville) |
0 |
0 |
0 |
6 |
1 |
7 |
3 |
2 |
5 |
31 |
14 |
45 |
| Dem. Republic of Congo |
24 |
6 |
30 |
31 |
5 |
36 |
20 |
6 |
26 |
44 |
28 |
72 |
| Ethiopia |
3,142 |
40,469 |
43,611 |
4,043 |
59,823 |
63,866 |
5,300 |
52,241 |
57,541 |
5,740 |
59,440 |
65,180 |
| Ghana |
2,932 |
152 |
3,084 |
2,535 |
127 |
2,662 |
1,853 |
478 |
2,331 |
1,432 |
875 |
2,307 |
| Guinea |
78 |
19 |
97 |
51 |
19 |
70 |
58 |
20 |
78 |
97 |
32 |
129 |
| Ivory Coast |
46 |
12 |
58 |
54 |
35 |
89 |
50 |
21 |
71 |
72 |
30 |
102 |
| Kenya |
1,357 |
265 |
1,622 |
1,147 |
269 |
1,416 |
1,037 |
359 |
1,396 |
1,068 |
413 |
1,481 |
| Lesotho |
44 |
18 |
62 |
10 |
3 |
13 |
14 |
9 |
23 |
43 |
30 |
73 |
| Liberia |
228 |
60 |
288 |
163 |
61 |
224 |
162 |
59 |
221 |
173 |
56 |
229 |
| Madagascar |
533 |
172 |
705 |
182 |
276 |
458 |
149 |
1,829 |
1,978 |
167 |
3,343 |
3,510 |
| Malawi |
14 |
36 |
50 |
37 |
55 |
92 |
70 |
32 |
102 |
99 |
54 |
153 |
| Mauritius |
100 |
43 |
143 |
65 |
21 |
86 |
74 |
29 |
103 |
68 |
40 |
108 |
| Mozambique |
15 |
2 |
17 |
25 |
7 |
32 |
29 |
8 |
37 |
21 |
9 |
30 |
| Namibia |
11 |
4 |
15 |
11 |
2 |
13 |
9 |
0 |
9 |
19 |
11 |
30 |
| Rwanda |
2 |
1 |
3 |
9 |
6 |
15 |
10 |
8 |
18 |
40 |
14 |
54 |
| Seychelles Islands |
11 |
13 |
24 |
11 |
23 |
34 |
12 |
20 |
32 |
26 |
18 |
44 |
| South Africa |
3,377 |
1,646 |
5,023 |
3,107 |
1,317 |
4,424 |
3,098 |
1,214 |
4,312 |
3,634 |
1,464 |
5,098 |
| Swaziland |
150 |
81 |
231 |
31 |
40 |
71 |
52 |
61 |
113 |
66 |
49 |
115 |
| Tanzania |
176 |
35 |
211 |
175 |
37 |
212 |
207 |
28 |
235 |
369 |
68 |
437 |
| Togo |
276 |
23 |
299 |
138 |
36 |
174 |
61 |
50 |
111 |
139 |
105 |
244 |
| Zambia |
74 |
1 |
75 |
47 |
5 |
52 |
12 |
11 |
23 |
38 |
20 |
58 |
| Zimbabwe |
187 |
54 |
241 |
136 |
51 |
187 |
158 |
41 |
199 |
321 |
56 |
377 |
| Other |
20 |
5 |
25 |
4 |
0 |
4 |
17 |
5 |
22 |
44 |
14 |
58 |
| Oceania |
13,425 |
5,773 |
19,198 |
10,669 |
4,810 |
15,479 |
9,594 |
4,354 |
13,948 |
9,217 |
3,929 |
13,146 |
| Australia |
10,538 |
4,768 |
15,306 |
8,615 |
3,928 |
12,543 |
7,631 |
3,549 |
11,180 |
7,312 |
3,183 |
10,495 |
| Fiji Islands |
555 |
10 |
565 |
142 |
5 |
147 |
89 |
3 |
92 |
82 |
12 |
94 |
| New Zealand |
2,274 |
977 |
3,251 |
1,886 |
864 |
2,750 |
1,849 |
792 |
2,641 |
1,808 |
722 |
2,530 |
| Other |
58 |
18 |
76 |
26 |
13 |
39 |
25 |
10 |
35 |
15 |
12 |
27 |
| North America |
170,176 |
51,822 |
221,998 |
167,053 |
50,602 |
217,655 |
131,866 |
47,349 |
179,215 |
121,187 |
48,230 |
169,417 |
| Canada |
27,840 |
13,316 |
41,156 |
27,050 |
12,080 |
39,130 |
26,661 |
12,399 |
39,060 |
26,765 |
13,203 |
39,968 |
| U.S.A |
142,336 |
38,502 |
180,838 |
140,001 |
38,516 |
178,517 |
105,183 |
34,941 |
140,124 |
94,422 |
35,026 |
129,448 |
| Other |
0 |
4 |
4 |
2 |
6 |
8 |
22 |
9 |
31 |
0 |
1 |
1 |
| South & Central America |
3,538 |
1,407 |
4,945 |
3,734 |
1,584 |
5,318 |
3,830 |
1,574 |
5,404 |
3,743 |
1,746 |
5,489 |
| Argentina |
318 |
123 |
441 |
609 |
160 |
449 |
381 |
151 |
532 |
339 |
146 |
485 |
| Belize |
163 |
12 |
175 |
153 |
29 |
124 |
122 |
5 |
127 |
101 |
12 |
113 |
| Bolivia |
65 |
34 |
99 |
86 |
33 |
53 |
39 |
41 |
80 |
53 |
35 |
88 |
| Brazil |
1,005 |
369 |
1,374 |
1,252 |
307 |
945 |
925 |
284 |
1,209 |
957 |
329 |
1,286 |
| Chile |
76 |
23 |
99 |
72 |
12 |
60 |
63 |
28 |
91 |
43 |
32 |
75 |
| Colombia |
263 |
157 |
420 |
410 |
167 |
243 |
315 |
154 |
469 |
273 |
178 |
451 |
| Costarica |
11 |
10 |
21 |
24 |
8 |
16 |
8 |
11 |
19 |
10 |
12 |
22 |
| Cuba |
8 |
10 |
18 |
33 |
23 |
10 |
35 |
30 |
65 |
18 |
18 |
36 |
| Dominican Republic |
117 |
48 |
165 |
196 |
51 |
145 |
199 |
49 |
248 |
200 |
87 |
287 |
| El Salvador |
158 |
1 |
159 |
50 |
9 |
41 |
28 |
11 |
39 |
15 |
5 |
20 |
| Equador |
123 |
43 |
166 |
138 |
34 |
104 |
165 |
32 |
197 |
84 |
21 |
105 |
| Grenada |
19 |
11 |
30 |
13 |
3 |
10 |
13 |
4 |
17 |
17 |
23 |
40 |
| Guatemala |
6 |
4 |
10 |
20 |
7 |
13 |
25 |
11 |
36 |
58 |
13 |
71 |
| Guyana |
17 |
3 |
20 |
13 |
4 |
17 |
8 |
15 |
23 |
8 |
16 |
24 |
| Haiti |
25 |
6 |
31 |
72 |
12 |
60 |
66 |
18 |
84 |
59 |
18 |
77 |
| Honduras |
1 |
3 |
4 |
15 |
6 |
21 |
6 |
4 |
10 |
11 |
2 |
13 |
| Jamaica |
36 |
25 |
61 |
62 |
26 |
88 |
61 |
32 |
93 |
55 |
36 |
91 |
| Mexico |
178 |
98 |
276 |
369 |
120 |
249 |
232 |
153 |
385 |
317 |
197 |
514 |
| Nicaragua |
3 |
1 |
4 |
2 |
0 |
2 |
3 |
1 |
4 |
12 |
5 |
17 |
| Panama |
23 |
3 |
26 |
20 |
4 |
16 |
44 |
11 |
55 |
52 |
14 |
66 |
| Paraguay |
0 |
6 |
6 |
9 |
5 |
4 |
5 |
2 |
7 |
25 |
5 |
30 |
| Peru |
31 |
11 |
42 |
52 |
11 |
41 |
123 |
26 |
149 |
91 |
20 |
111 |
| Suriname |
9 |
0 |
9 |
12 |
0 |
12 |
19 |
7 |
26 |
16 |
16 |
32 |
| Trinidad & Tobago |
83 |
40 |
123 |
91 |
34 |
125 |
77 |
22 |
99 |
98 |
34 |
132 |
| Uruguay |
27 |
2 |
29 |
51 |
5 |
46 |
42 |
6 |
48 |
56 |
3 |
59 |
| Venezuela |
712 |
352 |
1,064 |
1,373 |
503 |
870 |
796 |
452 |
1,248 |
718 |
454 |
1,172 |
| Others |
61 |
12 |
73 |
40 |
11 |
51 |
30 |
14 |
44 |
57 |
15 |
72 |
| Europe |
127,380 |
48,026 |
175,406 |
129,413 |
43,509 |
172,922 |
125,099 |
45,951 |
171,050 |
131,775 |
52,925 |
184,700 |
| Albania |
154 |
45 |
199 |
154 |
51 |
205 |
163 |
61 |
224 |
117 |
54 |
171 |
| Andorra |
2 |
0 |
2 |
5 |
2 |
7 |
8 |
0 |
8 |
3 |
0 |
3 |
| Austria |
1,607 |
390 |
1,997 |
1,520 |
394 |
1,914 |
1,304 |
386 |
1,690 |
1,362 |
464 |
1,826 |
| Belarus |
245 |
209 |
454 |
176 |
200 |
376 |
117 |
170 |
287 |
159 |
229 |
388 |
| Belgium |
2,250 |
505 |
2,755 |
1,984 |
423 |
2,407 |
1,655 |
380 |
2,035 |
1,695 |
405 |
2,100 |
| Bosnia & Herzegovina |
767 |
357 |
1,124 |
964 |
363 |
1,327 |
509 |
395 |
904 |
459 |
357 |
816 |
| Bulgaria |
1,356 |
2,134 |
3,490 |
1,335 |
1,888 |
3,223 |
1,458 |
1,907 |
3,365 |
1,411 |
1,914 |
3,325 |
| Croatia |
726 |
80 |
806 |
687 |
87 |
774 |
563 |
95 |
658 |
787 |
112 |
899 |
| Czech Republic |
587 |
766 |
1,353 |
475 |
304 |
779 |
427 |
191 |
618 |
474 |
195 |
669 |
| Denmark |
2,319 |
887 |
3,206 |
2,197 |
866 |
3,063 |
2,296 |
983 |
3,279 |
2,312 |
992 |
3,304 |
| Estonia |
27 |
11 |
38 |
24 |
9 |
33 |
30 |
21 |
51 |
34 |
31 |
65 |
| Finland |
785 |
240 |
1,025 |
815 |
282 |
1,097 |
658 |
272 |
930 |
667 |
263 |
930 |
| France |
11,508 |
3,576 |
15,084 |
11,728 |
3,481 |
15,209 |
12,048 |
3,796 |
15,844 |
11,692 |
4,126 |
15,818 |
| Germany |
11,874 |
3,409 |
15,283 |
11,788 |
3,174 |
14,962 |
10,845 |
3,610 |
14,455 |
12,378 |
5,704 |
18,082 |
| Greece |
1,776 |
640 |
2,416 |
2,172 |
587 |
2,759 |
1,957 |
553 |
2,510 |
2,237 |
672 |
2,909 |
| Hungary |
928 |
452 |
1,380 |
892 |
453 |
1,345 |
961 |
536 |
1,497 |
1,028 |
555 |
1,583 |
| Iceland |
62 |
19 |
81 |
86 |
24 |
110 |
76 |
29 |
105 |
65 |
40 |
105 |
| Ireland |
2,284 |
716 |
3,000 |
2,364 |
810 |
3,174 |
2,567 |
857 |
3,424 |
2,569 |
872 |
3,441 |
| Italy |
8,987 |
1,938 |
10,925 |
8,375 |
1,646 |
10,021 |
9,195 |
1,807 |
11,002 |
11,626 |
1,972 |
13,598 |
| Kosovo |
166 |
32 |
198 |
153 |
36 |
189 |
156 |
36 |
192 |
88 |
28 |
116 |
| Latvia |
59 |
26 |
85 |
44 |
54 |
98 |
95 |
57 |
152 |
87 |
55 |
142 |
| Liechtenstein |
10 |
3 |
13 |
21 |
2 |
23 |
62 |
8 |
70 |
7 |
6 |
13 |
| Lithuania |
55 |
52 |
107 |
62 |
58 |
120 |
134 |
75 |
209 |
140 |
48 |
188 |
| Luxembourg |
62 |
35 |
97 |
44 |
43 |
87 |
55 |
49 |
104 |
65 |
30 |
95 |
| Macedonia |
589 |
202 |
791 |
223 |
149 |
372 |
221 |
165 |
386 |
257 |
202 |
459 |
| Malta |
186 |
36 |
222 |
146 |
23 |
169 |
190 |
33 |
223 |
190 |
40 |
230 |
| Moldova |
21 |
33 |
54 |
22 |
30 |
52 |
41 |
45 |
86 |
7 |
34 |
41 |
| Monaco |
4 |
2 |
6 |
0 |
0 |
0 |
2 |
1 |
3 |
3 |
0 |
3 |
| Montenegro |
10 |
1 |
11 |
29 |
4 |
33 |
38 |
10 |
48 |
32 |
6 |
38 |
| Netherlands |
5,670 |
1,431 |
7,101 |
6,128 |
1,741 |
7,869 |
5,238 |
2,005 |
7,243 |
5,857 |
3,062 |
8,919 |
| Norway |
1,824 |
835 |
2,659 |
1,627 |
806 |
2,433 |
1,311 |
651 |
1,962 |
1,034 |
511 |
1,545 |
| Poland |
1,210 |
745 |
1,955 |
1,141 |
665 |
1,806 |
1,145 |
636 |
1,781 |
1,173 |
787 |
1,960 |
| Portugal |
924 |
217 |
1,141 |
765 |
224 |
989 |
1,118 |
331 |
1,449 |
1,478 |
541 |
2,019 |
| Romania |
1,723 |
3,886 |
5,609 |
1,998 |
1,501 |
3,499 |
1,829 |
1,651 |
3,480 |
2,093 |
1,854 |
3,947 |
| Russian Federation |
1,790 |
789 |
2,579 |
2,309 |
881 |
3,190 |
2,134 |
985 |
3,119 |
2,170 |
1,093 |
3,263 |
| San Marino |
3 |
0 |
3 |
7 |
0 |
7 |
6 |
2 |
8 |
10 |
2 |
12 |
| Serbia |
386 |
242 |
628 |
637 |
286 |
923 |
560 |
382 |
942 |
690 |
460 |
1,150 |
| Slovakia |
634 |
2,138 |
2,772 |
338 |
577 |
915 |
262 |
431 |
693 |
346 |
426 |
772 |
| Slovenia |
224 |
62 |
286 |
165 |
66 |
231 |
225 |
71 |
296 |
274 |
112 |
386 |
| Spain |
5,927 |
844 |
6,771 |
5,315 |
1,067 |
6,382 |
4,567 |
1,124 |
5,691 |
5,522 |
1,524 |
7,046 |
| Sweden |
4,343 |
2,271 |
6,614 |
4,527 |
2,299 |
6,826 |
4,268 |
2,552 |
6,820 |
3,504 |
2,035 |
5,539 |
| Switzerland |
1,716 |
399 |
2,115 |
1,765 |
433 |
2,198 |
1,659 |
383 |
2,042 |
1,654 |
413 |
2,067 |
| Ukraine |
517 |
533 |
1,050 |
656 |
395 |
1,051 |
697 |
444 |
1,141 |
900 |
524 |
1,424 |
| United Kingdom |
50,756 |
16,606 |
67,362 |
53,327 |
16,970 |
70,297 |
52,056 |
17,646 |
69,702 |
52,924 |
20,076 |
73,000 |
| Vatican |
7 |
0 |
7 |
18 |
0 |
18 |
18 |
2 |
20 |
23 |
2 |
25 |
| Yugoslavia |
319 |
232 |
551 |
205 |
155 |
360 |
175 |
127 |
302 |
172 |
97 |
269 |
| Others |
1 |
0 |
1 |
|
|
|
|
|
|
|
|
|
| Others |
23,025 |
10,532 |
33,557 |
24,767 |
12,166 |
36,933 |
33,150 |
17,029 |
50,179 |
34,295 |
17,744 |
52,039 |
| U.N |
51 |
16 |
67 |
105 |
38 |
143 |
151 |
51 |
202 |
101 |
33 |
134 |
| Unstated Nationality |
169 |
112 |
281 |
139 |
118 |
257 |
108 |
110 |
218 |
88 |
96 |
184 |
| Non Kuwaiti |
22,805 |
10,404 |
33,209 |
24,523 |
12,010 |
36,533 |
32,891 |
16,868 |
49,759 |
34,106 |
17,615 |
51,721 |
| Grand Total |
5,991,888 |
2,539,568 |
8,531,456 |
6,346,588 |
2,708,971 |
9,055,559 |
6,555,204 |
2,904,432 |
9,459,636 |
7,085,095 |
3,180,843 |
10,265,938 |
Source: Annual Statistical Bulletin of Transport and Communication
ANNEXED NOTE
1. Definitions
The “Non-Kuwaitis are the Bidoun populations.
2. Institution which provides data
Central Statistical Bureau (CSB), Ministry of Planning
3. Data availability
The data is taken from the Annual Statistical Bulletin of Transport and Communication (available in PDF; also in Excel format for 2012 and 2013).
http://www.csb.gov.kw/Socan_Statistic_EN.aspx?ID=41
http://www.csb.gov.kw/Socan_Statistic.aspx?ID=41
Date of access: October 2015.
|
Arrivals |
Departures |
|
2010 |
2011 |
2012 |
2013 |
2010 |
2011 |
2012 |
2013 |
| Kuwait |
3,323,671 |
3,481,257 |
3,730,939 |
4,049,002 |
3,330,064 |
3,484,743 |
3,732,701 |
4,078,973 |
| Other GCC Countries |
1,925,718 |
2,281,844 |
2,429,175 |
2,720,250 |
1,921,482 |
2,274,580 |
2,421,562 |
2,717,363 |
| Bahrain |
122,192 |
121,482 |
163,783 |
230,269 |
119,816 |
121,160 |
164,695 |
229,729 |
| Oman |
18,035 |
17,865 |
19,782 |
20,922 |
17,948 |
17,812 |
19,774 |
20,945 |
| Qatar |
30,873 |
33,023 |
35,861 |
39,048 |
30,905 |
32,848 |
35,625 |
38,948 |
| Saudi Arabia |
1,708,661 |
2,063,815 |
2,160,291 |
2,365,262 |
1,707,076 |
2,058,350 |
2,151,987 |
2,363,647 |
| United Arab Emirates |
45,957 |
45,659 |
49,458 |
64,749 |
45,737 |
44,410 |
49,481 |
64,094 |
| Asian Arab Countries |
607,547 |
557,787 |
533,246 |
518,977 |
608,466 |
557,111 |
524,042 |
510,879 |
| Iraq |
69,080 |
70,058 |
76,757 |
77,213 |
69,387 |
70,665 |
77,296 |
77,325 |
| Jordan |
94,480 |
97,267 |
103,020 |
112,618 |
94,208 |
96,156 |
102,053 |
112,075 |
| Lebanon |
117,686 |
104,739 |
108,277 |
111,408 |
119,211 |
105,536 |
108,385 |
111,382 |
| Palestine |
7,622 |
6,640 |
6,775 |
6,831 |
7,696 |
6,731 |
6,849 |
6,933 |
| Syria |
307,949 |
269,013 |
227,429 |
199,456 |
307,316 |
268,346 |
218,241 |
191,830 |
| Yemen |
10,730 |
10,070 |
10,988 |
11,451 |
10,648 |
9,677 |
11,218 |
11,334 |
| Asian Muslim Countries |
477,386 |
450,986 |
425,345 |
446,888 |
518,125 |
493,717 |
441,427 |
457,522 |
| Afghanistan |
12,607 |
12,457 |
12,467 |
13,120 |
13,577 |
13,271 |
12,697 |
13,311 |
| Azerbaijan |
290 |
340 |
410 |
519 |
263 |
348 |
414 |
502 |
| Bangladesh |
102,390 |
107,817 |
105,983 |
108,788 |
114,113 |
122,441 |
110,559 |
112,808 |
| Brunei |
37 |
14 |
21 |
7 |
40 |
13 |
21 |
9 |
| Indonesia |
35,664 |
25,793 |
17,693 |
13,800 |
59,017 |
46,429 |
24,016 |
16,690 |
| Iran |
81,136 |
72,067 |
72,432 |
76,384 |
82,584 |
74,165 |
73,880 |
77,224 |
| Kazakhstan |
238 |
159 |
218 |
320 |
236 |
281 |
219 |
323 |
| Kyrgyzstan |
634 |
229 |
649 |
826 |
632 |
702 |
646 |
818 |
| Malaysia |
4,105 |
4,320 |
4,294 |
4,733 |
4,054 |
4,345 |
4,224 |
4,747 |
| Maldives Islands |
14 |
36 |
49 |
90 |
14 |
42 |
49 |
86 |
| Pakistan |
228,028 |
215,194 |
200,037 |
215,742 |
231,508 |
219,817 |
203,610 |
218,563 |
| Tajikstan |
118 |
129 |
208 |
376 |
110 |
125 |
203 |
367 |
| Turkey |
11,478 |
11,273 |
10,254 |
11,641 |
11,337 |
11,183 |
10,271 |
11,561 |
| Turkmenistan |
48 |
12 |
33 |
22 |
49 |
12 |
28 |
25 |
| Uzbekistan |
599 |
556 |
597 |
519 |
591 |
543 |
590 |
488 |
| Others |
|
|
|
1 |
|
|
|
|
| Other Asian Countries |
1,076,821 |
1,127,510 |
1,160,838 |
1,262,823 |
1,025,203 |
1,081,859 |
1,090,118 |
1,207,004 |
| Armenia |
526 |
586 |
643 |
807 |
510 |
578 |
564 |
805 |
| Bhutan |
72 |
123 |
77 |
125 |
70 |
110 |
75 |
114 |
| Borneo |
51 |
84 |
88 |
61 |
50 |
84 |
91 |
63 |
| Cambodia |
64 |
70 |
113 |
81 |
56 |
68 |
107 |
78 |
| Cyprus |
286 |
380 |
614 |
573 |
288 |
380 |
601 |
572 |
| East Timur |
8 |
6 |
5 |
4 |
8 |
6 |
5 |
4 |
| Georgia |
1,832 |
1,135 |
551 |
534 |
1,816 |
1,160 |
563 |
544 |
| Hong Kong |
244 |
211 |
218 |
269 |
250 |
210 |
223 |
273 |
| India |
751,059 |
789,694 |
826,526 |
917,539 |
727,722 |
768,680 |
782,368 |
872,026 |
| Japan |
4,959 |
4,798 |
5,291 |
5,072 |
4,942 |
4,849 |
5,280 |
5,061 |
| Korea |
7,726 |
10,348 |
11,319 |
12,160 |
7,715 |
9,778 |
11,021 |
11,990 |
| Laos |
20 |
14 |
34 |
25 |
17 |
16 |
31 |
26 |
| Macau |
4 |
10 |
4 |
4 |
5 |
11 |
3 |
3 |
| Mongolia |
170 |
399 |
197 |
187 |
162 |
398 |
207 |
193 |
| Myanmar (Burma) |
188 |
376 |
297 |
288 |
196 |
270 |
354 |
282 |
| Nepal |
52,971 |
53,812 |
47,546 |
50,909 |
44,544 |
47,750 |
43,915 |
46,524 |
| North Korea |
0 |
442 |
354 |
273 |
0 |
477 |
384 |
305 |
| Philippines |
135,182 |
139,988 |
154,389 |
156,952 |
121,556 |
125,195 |
131,499 |
151,062 |
| Republic of China |
10,925 |
14,208 |
13,283 |
15,428 |
10,488 |
13,094 |
14,050 |
15,086 |
| Singapore |
1,457 |
1,323 |
1,174 |
1,126 |
1,338 |
1,306 |
1,149 |
1,077 |
| South Korea |
1,385 |
1,329 |
1,412 |
1,673 |
1,167 |
945 |
1,006 |
1,473 |
| Sri Lanka |
99,330 |
100,782 |
90,260 |
92,066 |
93,427 |
99,645 |
90,090 |
92,395 |
| Thailand |
7,631 |
6,670 |
5,544 |
6,132 |
8,074 |
6,149 |
5,868 |
6,463 |
| Timur Islands |
|
|
2 |
0 |
|
|
1 |
0 |
| Taiwan |
158 |
196 |
110 |
184 |
160 |
193 |
117 |
187 |
| Vietnam |
573 |
526 |
787 |
351 |
642 |
507 |
546 |
398 |
| African Arab Countries |
604,544 |
629,140 |
686,279 |
754,446 |
599,027 |
610,487 |
658,148 |
731,440 |
| Algeria |
3,694 |
3,566 |
4,116 |
4,259 |
3,679 |
3,571 |
4,039 |
4,290 |
| Comoros Islands |
425 |
303 |
411 |
460 |
395 |
297 |
420 |
474 |
| Djibouti |
92 |
82 |
116 |
174 |
96 |
78 |
116 |
159 |
| Egypt |
569,452 |
594,099 |
646,093 |
710,415 |
564,061 |
576,116 |
619,909 |
689,331 |
| Libya |
677 |
455 |
773 |
914 |
684 |
447 |
763 |
917 |
| Mauritania |
11,808 |
293 |
387 |
516 |
11,840 |
290 |
380 |
508 |
| Morocco |
266 |
11,451 |
13,006 |
13,978 |
267 |
11,367 |
12,778 |
13,848 |
| Somalia |
2,170 |
1,935 |
1,948 |
1,963 |
2,238 |
2,019 |
1,992 |
2,016 |
| South Sudan |
|
|
|
58 |
7,916 |
8,473 |
9,060 |
62 |
| Sudan |
8,043 |
9,049 |
10,420 |
12,995 |
11,110 |
| Tunisia |
7,917 |
7,907 |
9,009 |
8,714 |
7,851 |
7,829 |
8,691 |
8,725 |
| African Muslim Countries |
4,690 |
4,379 |
4,909 |
8,646 |
4,747 |
4,434 |
4,395 |
6,460 |
| Benin |
203 |
226 |
260 |
281 |
181 |
218 |
248 |
262 |
| Burkina Faso |
70 |
101 |
97 |
162 |
69 |
96 |
97 |
144 |
| Cameroon |
108 |
50 |
60 |
126 |
106 |
55 |
48 |
128 |
| Chad |
1,032 |
794 |
571 |
835 |
1,029 |
782 |
575 |
817 |
| Eritrea |
1,044 |
969 |
976 |
1,075 |
1,146 |
1,084 |
1,012 |
1,098 |
| Gabon |
5 |
8 |
12 |
87 |
5 |
4 |
9 |
88 |
| Gambia |
54 |
66 |
72 |
123 |
50 |
63 |
71 |
122 |
| Mali |
120 |
143 |
238 |
676 |
108 |
126 |
164 |
497 |
| Niger |
173 |
189 |
189 |
223 |
166 |
188 |
199 |
209 |
| Nigeria |
1,281 |
1,173 |
1,170 |
1,377 |
1,313 |
1,182 |
1,167 |
1,380 |
| Senegal |
336 |
385 |
443 |
452 |
321 |
374 |
436 |
462 |
| Sierra Leone |
133 |
158 |
247 |
293 |
132 |
146 |
168 |
232 |
| Uganda |
131 |
117 |
574 |
2,936 |
121 |
116 |
201 |
1,021 |
| Other African Countries |
55,975 |
74,349 |
69,109 |
80,115 |
34,731 |
45,431 |
61,684 |
73,827 |
| Angola |
12 |
20 |
34 |
46 |
12 |
15 |
34 |
45 |
| Botswana |
6 |
29 |
37 |
42 |
5 |
22 |
35 |
39 |
| Burundi |
11 |
22 |
15 |
62 |
10 |
21 |
17 |
58 |
| Central African Republic |
32 |
34 |
37 |
31 |
20 |
24 |
30 |
31 |
| Congo (Brazzaville) |
0 |
7 |
5 |
45 |
0 |
7 |
4 |
44 |
| Dem. Republic of Congo |
30 |
36 |
26 |
72 |
34 |
36 |
27 |
61 |
| Ethiopia |
43,611 |
63,866 |
57,541 |
65,180 |
23,069 |
35,509 |
52,235 |
61,790 |
| Ghana |
3,084 |
2,662 |
2,331 |
2,307 |
3,038 |
2,701 |
2,015 |
1,692 |
| Guinea |
97 |
70 |
78 |
129 |
99 |
69 |
83 |
112 |
| Ivory Coast |
58 |
89 |
71 |
102 |
58 |
71 |
76 |
84 |
| Kenya |
1,622 |
1,416 |
1,396 |
1,481 |
1,655 |
1,428 |
1,389 |
1,398 |
| Lesotho |
62 |
13 |
23 |
73 |
57 |
13 |
27 |
73 |
| Liberia |
288 |
224 |
221 |
229 |
280 |
227 |
225 |
226 |
| Madagascar |
705 |
458 |
1,978 |
3,510 |
615 |
268 |
493 |
1,796 |
| Malawi |
50 |
92 |
102 |
153 |
41 |
83 |
102 |
150 |
| Mauritius |
143 |
86 |
103 |
108 |
123 |
114 |
87 |
124 |
| Mozambique |
17 |
32 |
37 |
30 |
18 |
33 |
35 |
26 |
| Namibia |
15 |
13 |
9 |
30 |
15 |
14 |
8 |
29 |
| Rwanda |
3 |
15 |
18 |
54 |
2 |
14 |
18 |
55 |
| Seychelles Islands |
24 |
34 |
32 |
44 |
28 |
27 |
31 |
45 |
| South Africa |
5,023 |
4,424 |
4,312 |
5,098 |
4,539 |
4,079 |
4,080 |
4,804 |
| Swaziland |
231 |
71 |
113 |
115 |
226 |
61 |
114 |
121 |
| Tanzania |
211 |
212 |
235 |
437 |
202 |
196 |
241 |
421 |
| Togo |
299 |
174 |
111 |
244 |
291 |
165 |
70 |
149 |
| Zambia |
75 |
52 |
23 |
58 |
48 |
34 |
17 |
51 |
| Zimbabwe |
241 |
187 |
199 |
377 |
222 |
187 |
177 |
351 |
| Other |
25 |
4 |
22 |
58 |
24 |
13 |
14 |
52 |
| Oceania |
19,198 |
15,479 |
13,948 |
13,146 |
19,154 |
15,540 |
13,963 |
13,165 |
| Australia |
15,306 |
12,543 |
11,180 |
10,495 |
15,335 |
12,596 |
11,213 |
10,558 |
| Fiji Islands |
565 |
147 |
92 |
94 |
546 |
163 |
85 |
70 |
| New Zealand |
3,251 |
2,750 |
2,641 |
2,530 |
3,238 |
2,752 |
2,637 |
2,524 |
| Other |
76 |
39 |
35 |
27 |
35 |
29 |
28 |
13 |
| North America |
221,998 |
217,655 |
179,215 |
169,417 |
198,991 |
190,257 |
161,215 |
154,087 |
| Canada |
41,156 |
39,130 |
39,060 |
39,968 |
41,253 |
38,543 |
38,981 |
39,835 |
| U.S.A |
180,838 |
178,517 |
140,124 |
129,448 |
157,733 |
151,709 |
122,202 |
114,251 |
| Other |
4 |
8 |
31 |
1 |
5 |
5 |
32 |
1 |
| South & Central America |
4,945 |
5,318 |
5,404 |
5,489 |
4,715 |
5,276 |
5,291 |
5,432 |
| Argentina |
441 |
449 |
532 |
485 |
441 |
612 |
529 |
501 |
| Belize |
175 |
124 |
127 |
113 |
171 |
153 |
129 |
111 |
| Bolivia |
99 |
53 |
80 |
88 |
90 |
92 |
79 |
85 |
| Brazil |
1,374 |
945 |
1,209 |
1,286 |
1,364 |
1,242 |
1,224 |
1,287 |
| Chile |
99 |
60 |
91 |
75 |
90 |
79 |
88 |
74 |
| Colombia |
420 |
243 |
469 |
451 |
413 |
405 |
468 |
444 |
| Costarica |
21 |
16 |
19 |
22 |
14 |
23 |
16 |
20 |
| Cuba |
18 |
10 |
65 |
36 |
21 |
32 |
61 |
36 |
| Dominican Republic |
165 |
145 |
248 |
287 |
170 |
198 |
254 |
287 |
| El Salvador |
159 |
41 |
39 |
20 |
160 |
52 |
39 |
19 |
| Equador |
166 |
104 |
197 |
105 |
149 |
154 |
205 |
103 |
| Grenada |
30 |
10 |
17 |
40 |
29 |
13 |
17 |
42 |
| Guatemala |
10 |
13 |
36 |
71 |
8 |
19 |
30 |
74 |
| Guyana |
20 |
17 |
23 |
24 |
20 |
16 |
23 |
24 |
| Haiti |
31 |
60 |
84 |
77 |
4 |
13 |
9 |
19 |
| Honduras |
4 |
21 |
10 |
13 |
5 |
21 |
11 |
11 |
| Jamaica |
61 |
88 |
93 |
91 |
55 |
90 |
89 |
87 |
| Mexico |
276 |
249 |
385 |
514 |
262 |
358 |
378 |
504 |
| Nicaragua |
4 |
2 |
4 |
17 |
4 |
2 |
4 |
10 |
| Panama |
26 |
16 |
55 |
66 |
20 |
19 |
46 |
64 |
| Paraguay |
6 |
4 |
7 |
30 |
8 |
6 |
5 |
27 |
| Peru |
42 |
41 |
149 |
111 |
40 |
49 |
144 |
120 |
| Suriname |
9 |
12 |
26 |
32 |
6 |
2 |
5 |
19 |
| Trinidad & Tobago |
123 |
125 |
99 |
132 |
123 |
131 |
97 |
135 |
| Uruguay |
29 |
46 |
48 |
59 |
29 |
48 |
48 |
58 |
| Venezuela |
1,064 |
870 |
1,248 |
1,172 |
965 |
1,395 |
1,250 |
1,198 |
| Others |
73 |
51 |
44 |
72 |
54 |
52 |
43 |
73 |
| Europe |
175,406 |
172,922 |
171,050 |
184,700 |
173,568 |
171,244 |
168,525 |
179,992 |
| Albania |
199 |
205 |
224 |
171 |
194 |
198 |
209 |
166 |
| Andorra |
2 |
7 |
8 |
3 |
1 |
7 |
8 |
4 |
| Austria |
1,997 |
1,914 |
1,690 |
1,826 |
1,998 |
1,917 |
1,695 |
1,794 |
| Belarus |
454 |
376 |
287 |
388 |
331 |
323 |
253 |
373 |
| Belgium |
2,755 |
2,407 |
2,035 |
2,100 |
2,771 |
2,391 |
2,047 |
2,057 |
| Bosnia & Herzegovina |
1,124 |
1,327 |
904 |
816 |
1,108 |
1,214 |
1,037 |
801 |
| Bulgaria |
3,490 |
3,223 |
3,365 |
3,325 |
3,499 |
3,281 |
3,299 |
3,349 |
| Croatia |
806 |
774 |
658 |
899 |
815 |
756 |
661 |
873 |
| Czech Republic |
1,353 |
779 |
618 |
669 |
1,354 |
786 |
622 |
666 |
| Denmark |
3,206 |
3,063 |
3,279 |
3,304 |
3,202 |
3,050 |
3,249 |
3,253 |
| Estonia |
38 |
33 |
51 |
65 |
30 |
27 |
48 |
67 |
| Finland |
1,025 |
1,097 |
930 |
930 |
1,025 |
1,096 |
923 |
919 |
| France |
15,084 |
15,209 |
15,844 |
15,818 |
15,053 |
15,216 |
15,735 |
15,726 |
| Germany |
15,283 |
14,962 |
14,455 |
18,082 |
14,659 |
14,462 |
13,313 |
16,368 |
| Greece |
2,416 |
2,759 |
2,510 |
2,909 |
2,337 |
2,823 |
2,487 |
2,906 |
| Hungary |
1,380 |
1,345 |
1,497 |
1,583 |
1,393 |
1,318 |
1,501 |
1,571 |
| Iceland |
81 |
110 |
105 |
105 |
76 |
97 |
94 |
92 |
| Ireland |
3,000 |
3,174 |
3,424 |
3,441 |
2,955 |
3,173 |
3,383 |
3,408 |
| Italy |
10,925 |
10,021 |
11,002 |
13,598 |
10,945 |
9,979 |
10,949 |
13,472 |
| Kosovo |
198 |
189 |
192 |
116 |
194 |
195 |
196 |
113 |
| Latvia |
85 |
98 |
152 |
142 |
81 |
91 |
155 |
139 |
| Liechtenstein |
13 |
23 |
70 |
13 |
10 |
13 |
68 |
10 |
| Lithuania |
107 |
120 |
209 |
188 |
108 |
116 |
206 |
190 |
| Luxembourg |
97 |
87 |
104 |
95 |
89 |
82 |
101 |
91 |
| Macedonia |
791 |
372 |
386 |
459 |
814 |
369 |
396 |
446 |
| Malta |
222 |
169 |
223 |
230 |
213 |
168 |
221 |
234 |
| Moldova |
54 |
52 |
86 |
41 |
52 |
50 |
71 |
50 |
| Monaco |
6 |
0 |
3 |
3 |
6 |
1 |
3 |
3 |
| Montenegro |
11 |
33 |
48 |
38 |
11 |
32 |
40 |
48 |
| Netherlands |
7,101 |
7,869 |
7,243 |
8,919 |
7,053 |
7,560 |
6,637 |
7,824 |
| Norway |
2,659 |
2,433 |
1,962 |
1,545 |
2,656 |
2,445 |
1,961 |
1,532 |
| Poland |
1,955 |
1,806 |
1,781 |
1,960 |
1,942 |
1,749 |
1,815 |
1,940 |
| Portugal |
1,141 |
989 |
1,449 |
2,019 |
1,156 |
970 |
1,461 |
2,015 |
| Romania |
5,609 |
3,499 |
3,480 |
3,947 |
5,569 |
3,535 |
3,412 |
3,904 |
| Russian Federation |
2,579 |
3,190 |
3,119 |
3,263 |
2,395 |
3,116 |
2,999 |
3,211 |
| San Marino |
3 |
7 |
8 |
12 |
3 |
6 |
8 |
10 |
| Serbia |
628 |
923 |
942 |
1,150 |
583 |
912 |
909 |
1,133 |
| Slovakia |
2,772 |
915 |
693 |
772 |
2,755 |
910 |
710 |
756 |
| Slovenia |
286 |
231 |
296 |
386 |
287 |
224 |
295 |
379 |
| Spain |
6,771 |
6,382 |
5,691 |
7,046 |
6,595 |
6,120 |
5,629 |
6,950 |
| Sweden |
6,614 |
6,826 |
6,820 |
5,539 |
6,453 |
6,789 |
6,842 |
5,461 |
| Switzerland |
2,115 |
2,198 |
2,042 |
2,067 |
2,098 |
2,173 |
2,045 |
2,038 |
| Ukraine |
1,050 |
1,051 |
1,141 |
1,424 |
1,042 |
1,022 |
1,142 |
1,421 |
| United Kingdom |
67,362 |
70,297 |
69,702 |
73,000 |
67,106 |
70,090 |
69,372 |
71,917 |
| Vatican |
7 |
18 |
20 |
25 |
8 |
17 |
20 |
25 |
| Yugoslavia |
551 |
360 |
302 |
269 |
543 |
375 |
298 |
287 |
| Others |
1 |
|
|
|
|
|
0 |
0 |
| Others |
33,557 |
36,933 |
50,179 |
52,039 |
34,686 |
37,330 |
51,373 |
53,157 |
| U.N |
67 |
143 |
202 |
134 |
66 |
140 |
197 |
123 |
| Unstated Nationality |
281 |
257 |
218 |
184 |
278 |
249 |
217 |
182 |
| Non Kuwaiti |
33,209 |
36,533 |
49,759 |
51,721 |
34,342 |
36,941 |
50,959 |
52,852 |
| Grand Total |
8,531,456 |
9,055,559 |
9,459,636 |
10,265,938 |
8,472,959 |
8,972,009 |
9,334,444 |
10,189,301 |
Source: Annual Statistical Bulletin of Transport and Communication
ANNEXED NOTE
1. Definitions
The “Non-Kuwaitis are the Bidoun populations.
2. Institution which provides data
Central Statistical Bureau (CSB), Ministry of Planning
3. Data availability
The data is taken from the Annual Statistical Bulletin of Transport and Communication (available in PDF; also in Excel format for 2012 and 2013).
http://www.csb.gov.kw/Socan_Statistic_EN.aspx?ID=41
http://www.csb.gov.kw/Socan_Statistic.aspx?ID=41
Date of access: October 2015.
|
Workers |
Dependents* |
|
Males |
Females |
Total |
Males |
Females |
Total |
| India |
200,987 |
8,485 |
209,472 |
17,982 |
43,669 |
61,651 |
| Egypt |
7,351 |
1,279 |
8,630 |
4,116 |
7,057 |
11,173 |
| Pakistan |
41,804 |
422 |
42,226 |
2,954 |
6,625 |
9,579 |
| Jordan |
2,623 |
418 |
3,041 |
1,715 |
2,706 |
4,421 |
| Bangladesh |
104,678 |
534 |
105,212 |
1,115 |
2,664 |
3,779 |
| Philippines |
12,343 |
15,454 |
27,797 |
1,044 |
2,264 |
3,308 |
| Yemen |
2,300 |
24 |
2,324 |
935 |
1,507 |
2,442 |
| Sri Lanka |
4,109 |
2,021 |
6,130 |
452 |
1,299 |
1,751 |
| United Kingdom |
1,762 |
551 |
2,313 |
562 |
1,151 |
1,713 |
| Syria |
1,343 |
87 |
1,430 |
596 |
1,072 |
1,668 |
| Others |
25,658 |
6,707 |
32,365 |
3,078 |
6,505 |
9,583 |
| Total |
404,958 |
35,982 |
440,940 |
34,549 |
76,519 |
111,068 |
Source: Labour Market Regulatory Authority (LMRA), Expatriate Management System (EMS)
ANNEXED NOTE
1. Technical Notes and Definitions
The data displays the stocks, at a given date, of expats visa holders, registered as workers or as family dependants (LMRA Law 19/2006) in EMS.
Non-Bahraini workers (for male, female and both sexes) are Expat visa applications (GCC workers are not included).
The scope of the system covers regular, temporary and investor work visas for foreign workers, their dependents, in the commercial sector, the government sector and the non-commercial, non-government sector.
It presently excludes domestic workers, and work visas for artists and certain other categories of workers in non-civilian organizations.
It distinguishes four types of visas for operational purposes: regular work visas for workers with 24-month validity; temporary work visas issued for workers with 6-month validity; investor work visas issued for investors investing up to BD 100,000;
and dependent visas issued for dependent members of eligible foreign workers.
The system tracks visa applications, renewals, mobility of workers between employers and from one occupation to another as well as notification of termination and runaway workers, and in general all operations of LMRA including inspection and offence management.
The system is updated continuously and linked with other labour-related databases of the Kingdom, including CIO, GDNPR, GOSI, PFC, CSB, Ministry of Labour (MoL), and Ministry of Industry and Commerce (MOIC).
Work Visa is a legal certificate to allow a foreign worker to enter the country for working purposes for a period of two years with the possibility of renewal.
Worker is a generic term that refers to an employed person in general, or to an employee, a self-employed, or a particular category of worker, such as full-time or part-time worker, depending on the context in which the term is used. Four major categories of workers in terms of their status in employment are employees, employers, own-account workers, and unpaid family workers.
* The figure of family dependents is for April 2015 (last available to date).
2. Institution which provides data
Labour Market Regulatory Authority (LMRA).
3. Data availability
Source: Labour Market Regulatory Authority (LMRA), Kingdom of Bahrain, based on data from Bahrain Labour Market Indicators website http://www.lmra.bh/blmi.
The data can be retrieved from the data section of LMRA website. Tables are updated on a quarterly basis and are available in PDF and in Excel formats.
Date of access: 13 October 2015
|
Workers |
Dependents* |
|
Males |
Females |
Total |
Males |
Females |
Total |
| India |
188,525 |
7,679 |
196,204 |
17,214 |
41,925 |
59,139 |
| Egypt |
7,032 |
1,155 |
8,187 |
3,869 |
6,727 |
10,596 |
| Pakistan |
38,406 |
351 |
38,757 |
2,771 |
6,298 |
9,069 |
| Jordan |
2,429 |
391 |
2,820 |
1,587 |
2,498 |
4,085 |
| Bangladesh |
90,315 |
275 |
90,590 |
982 |
2,369 |
3,351 |
| Philippines |
11,843 |
14,060 |
25,903 |
1,025 |
2,268 |
3,293 |
| Yemen |
2,563 |
18 |
2,581 |
754 |
1,227 |
1,981 |
| Sri Lanka |
3,871 |
1,978 |
5,849 |
418 |
1,225 |
1,643 |
| United Kingdom |
1,755 |
505 |
2,260 |
540 |
1,116 |
1,656 |
| Syria |
1,279 |
90 |
1,369 |
501 |
866 |
1,367 |
| Others |
25,357 |
5,910 |
31,267 |
2,801 |
6,004 |
8,805 |
| Total |
373,375 |
32,412 |
405,787 |
32,462 |
72,523 |
104,985 |
Source: Labour Market Regulatory Authority (LMRA), Expatriate Management System (EMS)
ANNEXED NOTE
1. Technical Notes and Definitions
The data displays the stocks, at a given date, of expats visa holders, registered as workers or as family dependants (LMRA Law 19/2006) in EMS.
Non-Bahraini workers (for male, female and both sexes) are Expat visa applications (GCC workers are not included).
The scope of the system covers regular, temporary and investor work visas for foreign workers, their dependents, in the commercial sector, the government sector and the non-commercial, non-government sector.
It presently excludes domestic workers, and work visas for artists and certain other categories of workers in non-civilian organizations.
It distinguishes four types of visas for operational purposes: regular work visas for workers with 24-month validity; temporary work visas issued for workers with 6-month validity; investor work visas issued for investors investing up to BD 100,000;
and dependent visas issued for dependent members of eligible foreign workers.
The system tracks visa applications, renewals, mobility of workers between employers and from one occupation to another as well as notification of termination and runaway workers, and in general all operations of LMRA including inspection and offence management.
The system is updated continuously and linked with other labour-related databases of the Kingdom, including CIO, GDNPR, GOSI, PFC, CSB, Ministry of Labour (MoL), and Ministry of Industry and Commerce (MOIC).
Work Visa is a legal certificate to allow a foreign worker to enter the country for working purposes for a period of two years with the possibility of renewal.
Worker is a generic term that refers to an employed person in general, or to an employee, a self-employed, or a particular category of worker, such as full-time or part-time worker, depending on the context in which the term is used. Four major categories of workers in terms of their status in employment are employees, employers, own-account workers, and unpaid family workers.
* The figure of family dependents is for July 2014.
2. Institution which provides data
Labour Market Regulatory Authority (LMRA).
3. Data availability
Source: Labour Market Regulatory Authority (LMRA), Kingdom of Bahrain, based on data from Bahrain Labour Market Indicators website http://lmra.bh/portal/en/page/show/223.
The data can be retrieved from the data section of LMRA website. Tables are updated on a quarterly basis and are available in PDF and in Excel formats.
Date of access: 13 October 2015
|
Workers |
Dependents* |
|
Males |
Females |
Total |
Males |
Females |
Total |
| India |
192,504 |
7,169 |
199,673 |
16,178 |
39,745 |
55,923 |
| Egypt |
6,612 |
916 |
7,528 |
3,472 |
6,116 |
9,588 |
| Pakistan |
39,178 |
305 |
39,483 |
2,523 |
5,783 |
8,306 |
| Jordan |
2,131 |
244 |
2,375 |
1,345 |
2,215 |
3,560 |
| Bangladesh |
89,683 |
152 |
89,835 |
863 |
2,067 |
2,930 |
| Philippines |
11,622 |
13,052 |
24,674 |
986 |
2,178 |
3,164 |
| Yemen |
3,716 |
18 |
3,734 |
542 |
876 |
1,418 |
| Sri Lanka |
3,710 |
1,736 |
5,446 |
393 |
1,184 |
1,577 |
| United Kingdom |
1,815 |
536 |
2,351 |
561 |
1,127 |
1,688 |
| Syria |
1,158 |
72 |
1,230 |
383 |
659 |
1,042 |
| Others |
26,735 |
5,520 |
32,255 |
2,596 |
5,765 |
8,361 |
| Total |
378,864 |
29,720 |
408,584 |
29,842 |
67,715 |
97,557 |
Source: Labour Market Regulatory Authority (LMRA), Expatriate Management System (EMS)
ANNEXED NOTE
1. Technical Notes and Definitions
The data displays the stocks, at a given date, of expats visa holders, registered as workers or as family dependants (LMRA Law 19/2006) in EMS.
Non-Bahraini workers (for male, female and both sexes) are Expat visa applications (GCC workers are not included).
The scope of the system covers regular, temporary and investor work visas for foreign workers, their dependents, in the commercial sector, the government sector and the non-commercial, non-government sector.
It presently excludes domestic workers, and work visas for artists and certain other categories of workers in non-civilian organizations.
It distinguishes four types of visas for operational purposes: regular work visas for workers with 24-month validity; temporary work visas issued for workers with 6-month validity; investor work visas issued for investors investing up to BD 100,000;
and dependent visas issued for dependent members of eligible foreign workers.
The system tracks visa applications, renewals, mobility of workers between employers and from one occupation to another as well as notification of termination and runaway workers, and in general all operations of LMRA including inspection and offence management.
The system is updated continuously and linked with other labour-related databases of the Kingdom, including CIO, GDNPR, GOSI, PFC, CSB, Ministry of Labour (MoL), and Ministry of Industry and Commerce (MOIC).
Work Visa is a legal certificate to allow a foreign worker to enter the country for working purposes for a period of two years with the possibility of renewal.
Worker is a generic term that refers to an employed person in general, or to an employee, a self-employed, or a particular category of worker, such as full-time or part-time worker, depending on the context in which the term is used. Four major categories of workers in terms of their status in employment are employees, employers, own-account workers, and unpaid family workers.
* The figure of family dependents is for July 2013.
2. Institution which provides data
Labour Market Regulatory Authority (LMRA).
3. Data availability
Source: Labour Market Regulatory Authority (LMRA), Kingdom of Bahrain, based on data from Bahrain Labour Market Indicators website http://www.lmra.bh/blmi.
The data can be retrieved from the data section of LMRA website. Tables are updated on a quarterly basis and are available in PDF and in Excel formats.
Date of access: 13 October 2015
|
Workers |
Dependents |
|
Males |
Females |
Total |
Males |
Females |
Total |
| India |
194,600 |
8,036 |
202,636 |
17,566 |
42,787 |
60,353 |
| Egypt |
7,412 |
1,364 |
8,776 |
4,141 |
7,099 |
11,240 |
| Pakistan |
40,265 |
375 |
40,640 |
2,929 |
6,501 |
9,430 |
| Jordan |
2,687 |
444 |
3,131 |
1,704 |
2,663 |
4,367 |
| Bangladesh |
97,115 |
381 |
97,496 |
1,080 |
2,572 |
3,652 |
| Philippines |
12,127 |
14,881 |
27,008 |
1,016 |
2,271 |
3,287 |
| Yemen |
2,299 |
22 |
2,321 |
894 |
1,454 |
2,348 |
| Sri Lanka |
4,040 |
2,033 |
6,073 |
446 |
1,276 |
1,722 |
| United Kingdom |
1,791 |
546 |
2,337 |
566 |
1,136 |
1,702 |
| Syria |
1,323 |
87 |
1,410 |
590 |
1,038 |
1,628 |
| Others |
25,855 |
6,445 |
32,300 |
3,034 |
6,419 |
9,453 |
| Total |
389,514 |
34,614 |
424,128 |
33,966 |
75,216 |
109,182 |
Source: Labour Market Regulatory Authority (LMRA), Expatriate Management System (EMS)
ANNEXED NOTE
1. Technical Notes and Definitions
The data displays the stocks, at a given date, of expats visa holders, registered as workers or as family dependants (LMRA Law 19/2006) in EMS.
Non-Bahraini workers (for male, female and both sexes) are Expat visa applications (GCC workers are not included).
The scope of the system covers regular, temporary and investor work visas for foreign workers, their dependents, in the commercial sector, the government sector and the non-commercial, non-government sector.
It presently excludes domestic workers, and work visas for artists and certain other categories of workers in non-civilian organizations.
It distinguishes four types of visas for operational purposes: regular work visas for workers with 24-month validity; temporary work visas issued for workers with 6-month validity; investor work visas issued for investors investing up to BD 100,000;
and dependent visas issued for dependent members of eligible foreign workers.
The system tracks visa applications, renewals, mobility of workers between employers and from one occupation to another as well as notification of termination and runaway workers, and in general all operations of LMRA including inspection and offence management.
The system is updated continuously and linked with other labour-related databases of the Kingdom, including CIO, GDNPR, GOSI, PFC, CSB, Ministry of Labour (MoL), and Ministry of Industry and Commerce (MOIC).
Work Visa is a legal certificate to allow a foreign worker to enter the country for working purposes for a period of two years with the possibility of renewal.
Worker is a generic term that refers to an employed person in general, or to an employee, a self-employed, or a particular category of worker, such as full-time or part-time worker, depending on the context in which the term is used. Four major categories of workers in terms of their status in employment are employees, employers, own-account workers, and unpaid family workers.
2. Institution which provides data
Labour Market Regulatory Authority (LMRA).
3. Data availability
Source: Labour Market Regulatory Authority (LMRA), Kingdom of Bahrain, based on data from Bahrain Labour Market Indicators website http://www.lmra.bh/blmi.
The data can be retrieved from the data section of LMRA website. Tables are updated on a quarterly basis and are available in PDF and in Excel formats.
Date of access: October 2015
|
Workers |
Dependents |
|
Males |
Females |
Total |
Males |
Females |
Total |
| India |
189,852 |
7,421 |
197,273 |
16,460 |
40,206 |
56,666 |
| Egypt |
6,893 |
1,190 |
8,083 |
3,723 |
6,453 |
10,176 |
| Pakistan |
39,427 |
338 |
39,765 |
2,650 |
5,997 |
8,647 |
| Jordan |
2,353 |
443 |
2,796 |
1,538 |
2,425 |
3,963 |
| Bangladesh |
91,882 |
271 |
92,153 |
914 |
2,202 |
3,116 |
| Philippines |
11,816 |
13,752 |
25,568 |
999 |
2,190 |
3,189 |
| Yemen |
2,951 |
16 |
2,967 |
656 |
1,074 |
1,730 |
| Sri Lanka |
3,820 |
1,970 |
5,790 |
408 |
1,224 |
1,632 |
| United Kingdom |
1,830 |
537 |
2,367 |
555 |
1,155 |
1,710 |
| Syria |
1,210 |
85 |
1,295 |
410 |
728 |
1,138 |
| Others |
25,967 |
5,773 |
31,740 |
2,708 |
5,936 |
8,644 |
| Total |
378,001 |
31,796 |
409,797 |
31,021 |
69,590 |
100,611 |
Source: Labour Market Regulatory Authority (LMRA), Expatriate Management System (EMS)
ANNEXED NOTE
1. Technical Notes and Definitions
The data displays the stocks, at a given date, of expats visa holders, registered as workers or as family dependants (LMRA Law 19/2006) in EMS.
Non-Bahraini workers (for male, female and both sexes) are Expat visa applications (GCC workers are not included).
The scope of the system covers regular, temporary and investor work visas for foreign workers, their dependents, in the commercial sector, the government sector and the non-commercial, non-government sector.
It presently excludes domestic workers, and work visas for artists and certain other categories of workers in non-civilian organizations.
It distinguishes four types of visas for operational purposes: regular work visas for workers with 24-month validity; temporary work visas issued for workers with 6-month validity; investor work visas issued for investors investing up to BD 100,000;
and dependent visas issued for dependent members of eligible foreign workers.
The system tracks visa applications, renewals, mobility of workers between employers and from one occupation to another as well as notification of termination and runaway workers, and in general all operations of LMRA including inspection and offence management.
The system is updated continuously and linked with other labour-related databases of the Kingdom, including CIO, GDNPR, GOSI, PFC, CSB, Ministry of Labour (MoL), and Ministry of Industry and Commerce (MOIC).
Work Visa is a legal certificate to allow a foreign worker to enter the country for working purposes for a period of two years with the possibility of renewal.
Worker is a generic term that refers to an employed person in general, or to an employee, a self-employed, or a particular category of worker, such as full-time or part-time worker, depending on the context in which the term is used. Four major categories of workers in terms of their status in employment are employees, employers, own-account workers, and unpaid family workers.
2. Institution which provides data
Labour Market Regulatory Authority (LMRA).
3. Data availability
Source: Labour Market Regulatory Authority (LMRA), Kingdom of Bahrain, based on data from Bahrain Labour Market Indicators website http://www.lmra.bh/blmi.
The data can be retrieved from the data section of LMRA website. Tables are updated on a quarterly basis and are available in PDF and in Excel formats.
Date of access: October 2015
|
Workers |
Dependents |
|
Males |
Females |
Total |
Males |
Females |
Total |
| India |
189,760 |
6,868 |
196,628 |
15,178 |
37,516 |
52,694 |
| Egypt |
6,302 |
780 |
7,082 |
3,278 |
5,820 |
9,098 |
| Pakistan |
37,149 |
283 |
37,432 |
2,374 |
5,474 |
7,848 |
| Jordan |
2,039 |
180 |
2,219 |
1,326 |
2,187 |
3,513 |
| Bangladesh |
80,473 |
141 |
80,614 |
771 |
1,825 |
2,596 |
| Philippines |
11,443 |
12,175 |
23,618 |
913 |
2,029 |
2,942 |
| Yemen |
4,119 |
15 |
4,134 |
403 |
677 |
1,080 |
| Sri Lanka |
3,636 |
1,713 |
5,349 |
368 |
1,153 |
1,521 |
| United Kingdom |
1,928 |
586 |
2,514 |
572 |
1,157 |
1,729 |
| Syria |
1,076 |
68 |
1,144 |
316 |
562 |
878 |
| Others |
27,003 |
5,236 |
32,239 |
2,582 |
5,777 |
8,359 |
| Total |
364,928 |
28,045 |
392,973 |
28,081 |
64,177 |
92,258 |
Source: Labour Market Regulatory Authority (LMRA), Expatriate Management System (EMS)
ANNEXED NOTE
1. Technical Notes and Definitions
The data displays the stocks, at a given date, of expats visa holders, registered as workers or as family dependants (LMRA Law 19/2006) in EMS.
Non-Bahraini workers (for male, female and both sexes) are Expat visa applications (GCC workers are not included).
The scope of the system covers regular, temporary and investor work visas for foreign workers, their dependents, in the commercial sector, the government sector and the non-commercial, non-government sector.
It presently excludes domestic workers, and work visas for artists and certain other categories of workers in non-civilian organizations.
It distinguishes four types of visas for operational purposes: regular work visas for workers with 24-month validity; temporary work visas issued for workers with 6-month validity; investor work visas issued for investors investing up to BD 100,000;
and dependent visas issued for dependent members of eligible foreign workers.
The system tracks visa applications, renewals, mobility of workers between employers and from one occupation to another as well as notification of termination and runaway workers, and in general all operations of LMRA including inspection and offence management.
The system is updated continuously and linked with other labour-related databases of the Kingdom, including CIO, GDNPR, GOSI, PFC, CSB, Ministry of Labour (MoL), and Ministry of Industry and Commerce (MOIC).
Work Visa is a legal certificate to allow a foreign worker to enter the country for working purposes for a period of two years with the possibility of renewal.
Worker is a generic term that refers to an employed person in general, or to an employee, a self-employed, or a particular category of worker, such as full-time or part-time worker, depending on the context in which the term is used. Four major categories of workers in terms of their status in employment are employees, employers, own-account workers, and unpaid family workers.
2. Institution which provides data
Labour Market Regulatory Authority (LMRA).
3. Data availability
Source: Labour Market Regulatory Authority (LMRA), Kingdom of Bahrain, based on data from Bahrain Labour Market Indicators website http://www.lmra.bh/blmi.
The data can be retrieved from the data section of LMRA website. Tables are updated on a quarterly basis and are available in PDF and in Excel formats.
Date of access: October 2015
| Nationality |
|
In the labour force |
Outside the labour force |
Grand Total |
| |
Employed |
Unemployed |
Total in labour force |
Housewife |
Student |
Disabled |
Retired |
Other |
Total |
| |
Seeking work for 1st time |
Unpd. with previous employment |
| Qatari |
Males |
62,202 |
209 |
48 |
62,459 |
0 |
15,941 |
1,269 |
10,202 |
822 |
28,234 |
90,693 |
| |
Females |
31,282 |
569 |
0 |
31,851 |
27,752 |
21,663 |
2,110 |
5,881 |
1,662 |
59,068 |
90,919 |
| |
Total |
93,484 |
778 |
48 |
94,310 |
27,752 |
37,604 |
3,379 |
16,083 |
2,484 |
87,302 |
181,612 |
| Non-Qatari |
Males |
1,419,940 |
659 |
117 |
1,420,716 |
0 |
27,615 |
1,999 |
0 |
2,963 |
32,577 |
1,453,293 |
| |
Females |
173,247 |
1,635 |
25 |
174,907 |
87,582 |
25,922 |
1,317 |
0 |
4,530 |
119,351 |
294,258 |
| |
Total |
1,593,187 |
2,294 |
142 |
1,595,623 |
87,582 |
53,537 |
3,316 |
0 |
7,493 |
151,928 |
1,747,551 |
| Total |
Males |
1,482,142 |
868 |
165 |
1,483,175 |
0 |
43,556 |
3,268 |
10,202 |
3,785 |
60,811 |
1,543,986 |
|
Females |
204,529 |
2,204 |
25 |
206,758 |
115,334 |
47,585 |
3,427 |
5,881 |
6,192 |
178,419 |
385,177 |
|
Total |
1,686,671 |
3,072 |
190 |
1,689,933 |
115,334 |
91,141 |
6,695 |
16,083 |
9,977 |
239,230 |
1,929,163 |
Source: Annual Bulletin of Labor Force Sample survey 2014
ANNEXED NOTE
1. Technical Notes and Definitions
The data is taken from 2014 Labour Force Survey (yearly synthesis)
Sampling frame of LFS 2014: Population Census 2010.
Sample size: Around 7,000 households: 1- Qatari households; 2- Non-Qatari regular (non-collective) households; 3- Non-Qatari small collective households or labour gatherings (2 – 6 persons); 4- Non-Qatari large collective households or large labour gatherings (7 persons or more).
Data Collection: The sample was divided into equal parts to collect data monthly. Each month 1/3 of the quarterly data were collected during the first two weeks of the month.
Reference period for the labour force data: the week prior to data collection day.
Population of reference: all Qatari and non-Qatari households present in Qatar on the night of survey, living in normal and collective households.
The collective households are a group of persons not related to each other and sharing living conditions in a residential unit, I.e. labour camps, students living boarding schools, nurses in hospitals… etc. The survey covered the small collective households (includes less than 7 persons) and large collective households (includes 7 persons or more).
The survey did not cover short periods accommodation, i.e. hotels.
Relation to labour force (for persons aged 15 and above)
In the labour force (= economically active).
1) Employed.
All persons aged 15 years an above, who during the week preceding the survey:
a) Perform a work for a wage, salary, profits or household gains, whether it was in cash or in kind.
b) Are temporarily not employed, however, they still have an official relation with their work
2) Unemployed.
All persons aged 15 years and over who were, during the week preceding the survey, without employment, willing to work and looking seriously for a job.
There is a distinction between two kinds of unemployed persons:
a) First time unemployed: They are the persons who never worked previously, and were during the week preceding the survey looking actively for work.
b) Unemployed who previously worked: They are the persons with a work experience, who during the week preceding the survey were actively looking for a job
Outside the labour force (=economically inactive):
Full-time student: The person (15 years or older) enrolled in any educational institution as a full-time persistent student with purpose of attaining an academic degree, irrespective of whether the schooling hours are in the morning or evening. Any trainee enrolled in vocational training institutes is regarded as a full-time student.
Full-time housewife: The female (15 years or older) who is fully engaged in home management and family care, and does not practice any other work
Retired: The person who does not look for a job during the week preceding the survey and gets a fixed pension for work he/she had joined before
Disabled: The person (15 years or older) who is not capable of work due to illness, handicap or old age.
Others: Those able to work but not willing to, not enrolled in education, as well as any other cases encountered by the enumerator other than the above mentioned.
2. Institution which provides data
Qatar Statistics Authority (QSA), Ministry of Development Planning and Statistics
(http://www.qsa.gov.qa/eng/index.htm for website in English; http://www.qsa.gov.qa/Ar/index.htm for website in Arabic)
3. Data availability
The Statistics Authority conducted the first labour Force Sample Survey in 2001. Starting from 2006, the execution of these surveys came to be on annual basis. Quarterly publications of Labour Force Surveys’ data are also available since 2012.
Most Labour Force Surveys and publications related to the labour force are available on QSA’s website, in PDF format. LFS 2013 can be downloaded from:
http://www.qsa.gov.qa/Eng/publication/annabs/2015/population-chapters/2_Labour_Force_2014.xlsx
See also Qatar Information Exchange for earlier Labour Force Surveys. QIX has also an interactive data base compiling data on the labour force taken from available surveys:
http://www.qix.gov.qa/portal/page/portal/qix/subject_area/Statistics?subject_area=183
Last date of access: September 2015.
|
Qatari |
Non-Qatari |
Total |
|
Males |
Females |
Total |
Males |
Females |
Total |
Males |
Females |
Total |
| 15 – 19 |
757 |
136 |
893 |
6,727 |
327 |
7,054 |
7,484 |
463 |
7,947 |
| 20 – 24 |
10,956 |
4,198 |
15,154 |
158,769 |
19,652 |
178,421 |
169,725 |
23,850 |
193,575 |
| 25 – 29 |
11,795 |
7,761 |
19,556 |
268,823 |
42,916 |
311,739 |
280,618 |
50,677 |
331,295 |
| 30 – 34 |
10,041 |
6,748 |
16,789 |
306,117 |
37,636 |
343,753 |
316,158 |
44,384 |
360,542 |
| 35 – 39 |
8,254 |
4,301 |
12,555 |
206,946 |
28,850 |
235,796 |
215,200 |
33,151 |
248,351 |
| 40 – 44 |
6,835 |
4,080 |
10,915 |
183,289 |
19,293 |
202,582 |
190,124 |
23,373 |
213,497 |
| 45 – 49 |
5,802 |
2,387 |
8,189 |
128,147 |
14,202 |
142,349 |
133,949 |
16,589 |
150,538 |
| 50 – 54 |
4,570 |
1,050 |
5,620 |
80,299 |
6,868 |
87,167 |
84,869 |
7,918 |
92,787 |
| 55 – 59 |
2,143 |
524 |
2,667 |
52,393 |
2,341 |
54,734 |
54,536 |
2,865 |
57,401 |
| 60 – 64 |
1,029 |
63 |
1,092 |
23,438 |
1,000 |
24,438 |
24,467 |
1,063 |
25,530 |
| 65 + |
68 |
34 |
102 |
5,109 |
187 |
5,296 |
5,177 |
221 |
5,398 |
| Total |
62,250 |
31,282 |
93,532 |
1,420,057 |
173,272 |
1,593,329 |
1,482,307 |
204,554 |
1,686,861 |
Source: Annual Bulletin of Labor Force Sample survey 2014
ANNEXED NOTE
1. Technical Notes and Definitions
The data is taken from 2014 Labour Force Survey (yearly synthesis)
Sampling frame of LFS 2014: Population Census 2010.
Sample size: Around 7,000 households: 1- Qatari households; 2- Non-Qatari regular (non-collective) households; 3- Non-Qatari small collective households or labour gatherings (2 – 6 persons); 4- Non-Qatari large collective households or large labour gatherings (7 persons or more).
Data Collection: The sample was divided into equal parts to collect data monthly. Each month 1/3 of the quarterly data were collected during the first two weeks of the month.
Reference period for the labour force data: the week prior to data collection day.
Population of reference: all Qatari and non-Qatari households present in Qatar on the night of survey, living in normal and collective households.
The collective households are a group of persons not related to each other and sharing living conditions in a residential unit, I.e. labour camps, students living boarding schools, nurses in hospitals… etc. The survey covered the small collective households (includes less than 7 persons) and large collective households (includes 7 persons or more).
The survey did not cover short periods accommodation, i.e. hotels.
Relation to labour force (for persons aged 15 and above)
In the labour force (= economically active).
1) Employed.
All persons aged 15 years an above, who during the week preceding the survey:
a) Perform a work for a wage, salary, profits or household gains, whether it was in cash or in kind.
b) Are temporarily not employed, however, they still have an official relation with their work
2) Unemployed.
All persons aged 15 years and over who were, during the week preceding the survey, without employment, willing to work and looking seriously for a job.
There is a distinction between two kinds of unemployed persons:
a) First time unemployed: They are the persons who never worked previously, and were during the week preceding the survey looking actively for work.
b) Unemployed who previously worked: They are the persons with a work experience, who during the week preceding the survey were actively looking for a job
Outside the labour force (=economically inactive):
Full-time student: The person (15 years or older) enrolled in any educational institution as a full-time persistent student with purpose of attaining an academic degree, irrespective of whether the schooling hours are in the morning or evening. Any trainee enrolled in vocational training institutes is regarded as a full-time student.
Full-time housewife: The female (15 years or older) who is fully engaged in home management and family care, and does not practice any other work
Retired: The person who does not look for a job during the week preceding the survey and gets a fixed pension for work he/she had joined before
Disabled: The person (15 years or older) who is not capable of work due to illness, handicap or old age.
Others: Those able to work but not willing to, not enrolled in education, as well as any other cases encountered by the enumerator other than the above mentioned.
Figures do not include persons seeking work for the first time
2. Institution which provides data
Qatar Statistics Authority (QSA), Ministry of Development Planning and Statistics
(https://www.mdps.gov.qa/en/Pages/default.aspx for website in English; https://www.mdps.gov.qa/ar/pages/default.aspx for website in Arabic)
3. Data availability
The Statistics Authority conducted the first labour Force Sample Survey in 2001. Starting from 2006, the execution of these surveys came to be on annual basis. Quarterly publications of Labour Force Surveys’ data are also available since 2012.
Most Labour Force Surveys and publications related to the labour force are available on QSA’s website, in PDF format. LFS 2013 can be downloaded from:
https://www.mdps.gov.qa/en/statistics1/pages/topicslisting.aspx?parent=Social&child=LaborForce
See also Qatar Information Exchange for earlier Labour Force Surveys. QIX has also an interactive data base compiling data on the labour force taken from available surveys:
http://www.qix.gov.qa/portal/page/portal/qix/subject_area/Statistics?subject_area=183
Last date of access: September 2015.
|
Qatari |
Non-Qatari |
Total |
|
Males |
Females |
Total |
Males |
Females |
Total |
Males |
Females |
Total |
| Illiterate |
246 |
46 |
292 |
32,481 |
2,546 |
35,027 |
32,727 |
2,592 |
35,319 |
| Read & Write |
1,966 |
358 |
2,324 |
200,858 |
19,741 |
220,599 |
202,824 |
20,099 |
222,923 |
| Primary |
3,671 |
368 |
4,039 |
245,039 |
37,835 |
282,874 |
248,710 |
38,203 |
286,913 |
| Preparatory |
9,220 |
844 |
10,064 |
400,474 |
34,224 |
434,698 |
409,694 |
35,068 |
444,762 |
| Secondary |
21,102 |
7,866 |
28,968 |
278,292 |
22,885 |
301,177 |
299,394 |
30,751 |
330,145 |
| Pre.U. Diploma |
2,477 |
609 |
3,086 |
59,236 |
4,621 |
63,857 |
61,713 |
5,230 |
66,943 |
| University |
20,528 |
19,692 |
40,220 |
183,260 |
47,113 |
230,373 |
203,788 |
66,805 |
270,593 |
| Higher Diploma |
742 |
538 |
1,280 |
7,763 |
582 |
8,345 |
8,505 |
1,120 |
9,625 |
| M.A / M.Sc. |
1,700 |
652 |
2,352 |
8,297 |
3,217 |
11,514 |
9,997 |
3,869 |
13,866 |
| Ph.D. |
598 |
309 |
907 |
4,357 |
508 |
4,865 |
4,955 |
817 |
5,772 |
| Total |
62,250 |
31,282 |
93,532 |
1,420,057 |
173,272 |
1,593,329 |
1,482,307 |
204,554 |
1,686,861 |
Source: Annual Bulletin of Labor Force Sample survey 2014
ANNEXED NOTE
1. Technical Notes and Definitions
The data is taken from 2014 Labour Force Survey (yearly synthesis)
Sampling frame of LFS 2014: Population Census 2010.
Sample size: Around 7,000 households: 1- Qatari households; 2- Non-Qatari regular (non-collective) households; 3- Non-Qatari small collective households or labour gatherings (2 – 6 persons); 4- Non-Qatari large collective households or large labour gatherings (7 persons or more).
Data Collection: The sample was divided into equal parts to collect data monthly. Each month 1/3 of the quarterly data were collected during the first two weeks of the month.
Reference period for the labour force data: the week prior to data collection day.
Population of reference: all Qatari and non-Qatari households present in Qatar on the night of survey, living in normal and collective households.
The collective households are a group of persons not related to each other and sharing living conditions in a residential unit, I.e. labour camps, students living boarding schools, nurses in hospitals… etc. The survey covered the small collective households (includes less than 7 persons) and large collective households (includes 7 persons or more).
The survey did not cover short periods accommodation, i.e. hotels.
Relation to labour force (for persons aged 15 and above)
In the labour force (= economically active).
1) Employed.
All persons aged 15 years an above, who during the week preceding the survey:
a) Perform a work for a wage, salary, profits or household gains, whether it was in cash or in kind.
b) Are temporarily not employed, however, they still have an official relation with their work
2) Unemployed.
All persons aged 15 years and over who were, during the week preceding the survey, without employment, willing to work and looking seriously for a job.
There is a distinction between two kinds of unemployed persons:
a) First time unemployed: They are the persons who never worked previously, and were during the week preceding the survey looking actively for work.
b) Unemployed who previously worked: They are the persons with a work experience, who during the week preceding the survey were actively looking for a job
Figures do not include persons seeking work for the first time
Outside the labour force (=economically inactive):
Full-time student: The person (15 years or older) enrolled in any educational institution as a full-time persistent student with purpose of attaining an academic degree, irrespective of whether the schooling hours are in the morning or evening. Any trainee enrolled in vocational training institutes is regarded as a full-time student.
Full-time housewife: The female (15 years or older) who is fully engaged in home management and family care, and does not practice any other work
Retired: The person who does not look for a job during the week preceding the survey and gets a fixed pension for work he/she had joined before
Disabled: The person (15 years or older) who is not capable of work due to illness, handicap or old age.
Others: Those able to work but not willing to, not enrolled in education, as well as any other cases encountered by the enumerator other than the above mentioned.
2. Institution which provides data
Qatar Statistics Authority (QSA), Ministry of Development Planning and Statistics
(http://www.qsa.gov.qa/eng/index.htm for website in English; http://www.qsa.gov.qa/Ar/index.htm for website in Arabic)
3. Data availability
The Statistics Authority conducted the first labour Force Sample Survey in 2001. Starting from 2006, the execution of these surveys came to be on annual basis. Quarterly publications of Labour Force Surveys’ data are also available since 2012.
Most Labour Force Surveys and publications related to the labour force are available on QSA’s website, in PDF format. LFS 2013 can be downloaded from:
http://www.qsa.gov.qa/Eng/publication/annabs/2015/population-chapters/2_Labour_Force_2014.xlsx
See also Qatar Information Exchange for earlier Labour Force Surveys. QIX has also an interactive data base compiling data on the labour force taken from available surveys:
http://www.qix.gov.qa/portal/page/portal/qix/subject_area/Statistics?subject_area=183
Last date of access: September 2015.
|
Qatari |
Non-Qatari |
Total |
|
Males |
Females |
Total |
Males |
Females |
Total |
Males |
Females |
Total |
| Employer |
2,291 |
629 |
2,920 |
1,995 |
164 |
2,159 |
4,286 |
793 |
5,079 |
| Own Account Worker |
204 |
0 |
204 |
2,167 |
115 |
2,282 |
2,371 |
115 |
2,486 |
| Employee |
59,755 |
30,653 |
90,408 |
1,415,070 |
172,993 |
1,588,063 |
1,474,825 |
203,646 |
1,678,471 |
| Unpaid Family Worker |
0 |
0 |
0 |
825 |
0 |
825 |
825 |
0 |
825 |
| Total |
62,250 |
31,282 |
93,532 |
1,420,057 |
173,272 |
1,593,329 |
1,482,307 |
204,554 |
1,686,861 |
Source: Annual Bulletin of Labor Force Sample survey 2014
ANNEXED NOTE
1. Technical Notes and Definitions
The data is taken from 2014 Labour Force Survey (yearly synthesis)
Sampling frame of LFS 2014: Population Census 2010.
Sample size: Around 7,000 households: 1- Qatari households; 2- Non-Qatari regular (non-collective) households; 3- Non-Qatari small collective households or labour gatherings (2 – 6 persons); 4- Non-Qatari large collective households or large labour gatherings (7 persons or more).
Data Collection: The sample was divided into equal parts to collect data monthly. Each month 1/3 of the quarterly data were collected during the first two weeks of the month.
Reference period for the labour force data: the week prior to data collection day.
Population of reference: all Qatari and non-Qatari households present in Qatar on the night of survey, living in normal and collective households.
The collective households are a group of persons not related to each other and sharing living conditions in a residential unit, I.e. labour camps, students living boarding schools, nurses in hospitals… etc. The survey covered the small collective households (includes less than 7 persons) and large collective households (includes 7 persons or more).
The survey did not cover short periods accommodation, i.e. hotels.
Relation to labour force (for persons aged 15 and above)
In the labour force (= economically active).
1) Employed.
All persons aged 15 years an above, who during the week preceding the survey:
a) Perform a work for a wage, salary, profits or household gains, whether it was in cash or in kind.
b) Are temporarily not employed, however, they still have an official relation with their work
2) Unemployed.
All persons aged 15 years and over who were, during the week preceding the survey, without employment, willing to work and looking seriously for a job.
There is a distinction between two kinds of unemployed persons:
a) First time unemployed: They are the persons who never worked previously, and were during the week preceding the survey looking actively for work.
b) Unemployed who previously worked: They are the persons with a work experience, who during the week preceding the survey were actively looking for a job
Outside the labour force (=economically inactive):
Full-time student: The person (15 years or older) enrolled in any educational institution as a full-time persistent student with purpose of attaining an academic degree, irrespective of whether the schooling hours are in the morning or evening. Any trainee enrolled in vocational training institutes is regarded as a full-time student.
Full-time housewife: The female (15 years or older) who is fully engaged in home management and family care, and does not practice any other work
Retired: The person who does not look for a job during the week preceding the survey and gets a fixed pension for work he/she had joined before
Disabled: The person (15 years or older) who is not capable of work due to illness, handicap or old age.
Others: Those able to work but not willing to, not enrolled in education, as well as any other cases encountered by the enumerator other than the above mentioned.
Figures do not include persons seeking work for the first time
2. Institution which provides data
Qatar Statistics Authority (QSA), Ministry of Development Planning and Statistics
(http://www.qsa.gov.qa/eng/index.htm for website in English; http://www.qsa.gov.qa/Ar/index.htm for website in Arabic)
3. Data availability
The Statistics Authority conducted the first labour Force Sample Survey in 2001. Starting from 2006, the execution of these surveys came to be on annual basis. Quarterly publications of Labour Force Surveys’ data are also available since 2012.
Most Labour Force Surveys and publications related to the labour force are available on QSA’s website, in PDF format. LFS 2013 can be downloaded from:
http://www.qsa.gov.qa/Eng/publication/annabs/2015/population-chapters/2_Labour_Force_2014.xlsx
See also Qatar Information Exchange for earlier Labour Force Surveys. QIX has also an interactive data base compiling data on the labour force taken from available surveys:
http://www.qix.gov.qa/portal/page/portal/qix/subject_area/Statistics?subject_area=183
Last date of access: September 2015.
|
Qatari |
Non-Qatari |
Total |
|
Males |
Females |
Total |
Males |
Females |
Total |
Males |
Females |
Total |
| Agriculture, forestry and fishing |
24 |
0 |
24 |
23,099 |
0 |
23,099 |
23,123 |
0 |
23,123 |
| Mining and quarrying |
7,566 |
1,073 |
8,639 |
86,608 |
4,173 |
90,781 |
94,174 |
5,246 |
99,420 |
| Manufacturing |
1,344 |
132 |
1,476 |
131,320 |
1,775 |
133,095 |
132,664 |
1,907 |
134,571 |
| Electricity, gas, steam and air conditioning supply |
1,192 |
268 |
1,460 |
18,456 |
615 |
19,071 |
19,648 |
883 |
20,531 |
| Water supply; sewerage, waste management and remediation activities |
240 |
181 |
421 |
12,907 |
368 |
13,275 |
13,147 |
549 |
13,696 |
| Construction |
1,071 |
352 |
1,423 |
630,796 |
4,037 |
634,833 |
631,867 |
4,389 |
636,256 |
| Wholesale and retail trade; repair of motor vehicles and motorcycles |
1,229 |
354 |
1,583 |
188,970 |
7,026 |
195,996 |
190,199 |
7,380 |
197,579 |
| Transportation and storage |
1,414 |
382 |
1,796 |
44,270 |
8,790 |
53,060 |
45,684 |
9,172 |
54,856 |
| Accommodation and food service activities |
469 |
356 |
825 |
37,908 |
3,646 |
41,554 |
38,377 |
4,002 |
42,379 |
| Information and communication |
2,117 |
778 |
2,895 |
7,775 |
2,448 |
10,223 |
9,892 |
3,226 |
13,118 |
| Financial and insurance activities |
1,531 |
1,674 |
3,205 |
7,554 |
2,213 |
9,767 |
9,085 |
3,887 |
12,972 |
| Real estate activities |
759 |
176 |
935 |
10,360 |
455 |
10,815 |
11,119 |
631 |
11,750 |
| Professional, scientific and technical activities |
287 |
236 |
523 |
26,609 |
1,396 |
28,005 |
26,896 |
1,632 |
28,528 |
| Administrative and support service activities |
433 |
680 |
1,113 |
44,351 |
3,414 |
47,765 |
44,784 |
4,094 |
48,878 |
| Public administration and defence; compulsory social security |
38,441 |
11,288 |
49,729 |
44,014 |
4,304 |
48,318 |
82,455 |
15,592 |
98,047 |
| Education |
1,968 |
9,343 |
11,311 |
13,266 |
17,036 |
30,302 |
15,234 |
26,379 |
41,613 |
| Human health and social work activities |
1,448 |
3,578 |
5,026 |
11,836 |
11,393 |
23,229 |
13,284 |
14,971 |
28,255 |
| Arts, entertainment and recreation |
492 |
391 |
883 |
11,911 |
945 |
12,856 |
12,403 |
1,336 |
13,739 |
| Other service activities |
140 |
34 |
174 |
9,325 |
1,313 |
10,638 |
9,465 |
1,347 |
10,812 |
| Activities of households as employers; undifferentiated goods- and services-producing activities of households for own use |
0 |
0 |
0 |
56,855 |
97,202 |
154,057 |
56,855 |
97,202 |
154,057 |
| Activities of extraterritorial organizations and bodies |
85 |
6 |
91 |
1,867 |
723 |
2,590 |
1,952 |
729 |
2,681 |
| Total |
62,250 |
31,282 |
93,532 |
1,420,057 |
173,272 |
1,593,329 |
1,482,307 |
204,554 |
1,686,861 |
Source: Annual Bulletin of Labor Force Sample survey 2014
ANNEXED NOTE
1. Technical Notes and Definitions
The data is taken from 2014 Labour Force Survey (yearly synthesis)
Sampling frame of LFS 2014: Population Census 2010.
Sample size: Around 7,000 households: 1- Qatari households; 2- Non-Qatari regular (non-collective) households; 3- Non-Qatari small collective households or labour gatherings (2 – 6 persons); 4- Non-Qatari large collective households or large labour gatherings (7 persons or more).
Data Collection: The sample was divided into equal parts to collect data monthly. Each month 1/3 of the quarterly data were collected during the first two weeks of the month.
Reference period for the labour force data: the week prior to data collection day.
Population of reference: all Qatari and non-Qatari households present in Qatar on the night of survey, living in normal and collective households.
The collective households are a group of persons not related to each other and sharing living conditions in a residential unit, I.e. labour camps, students living boarding schools, nurses in hospitals… etc. The survey covered the small collective households (includes less than 7 persons) and large collective households (includes 7 persons or more).
The survey did not cover short periods accommodation, i.e. hotels.
Relation to labour force (for persons aged 15 and above)
In the labour force (= economically active).
1) Employed.
All persons aged 15 years an above, who during the week preceding the survey:
a) Perform a work for a wage, salary, profits or household gains, whether it was in cash or in kind.
b) Are temporarily not employed, however, they still have an official relation with their work
2) Unemployed.
All persons aged 15 years and over who were, during the week preceding the survey, without employment, willing to work and looking seriously for a job.
There is a distinction between two kinds of unemployed persons:
a) First time unemployed: They are the persons who never worked previously, and were during the week preceding the survey looking actively for work.
b) Unemployed who previously worked: They are the persons with a work experience, who during the week preceding the survey were actively looking for a job
Figures do not include persons seeking work for the first time
Outside the labour force (=economically inactive):
Full-time student: The person (15 years or older) enrolled in any educational institution as a full-time persistent student with purpose of attaining an academic degree, irrespective of whether the schooling hours are in the morning or evening. Any trainee enrolled in vocational training institutes is regarded as a full-time student.
Full-time housewife: The female (15 years or older) who is fully engaged in home management and family care, and does not practice any other work
Retired: The person who does not look for a job during the week preceding the survey and gets a fixed pension for work he/she had joined before
Disabled: The person (15 years or older) who is not capable of work due to illness, handicap or old age.
Others: Those able to work but not willing to, not enrolled in education, as well as any other cases encountered by the enumerator other than the above mentioned.
2. Institution which provides data
Qatar Statistics Authority (QSA), Ministry of Development Planning and Statistics
(http://www.qsa.gov.qa/eng/index.htm for website in English; http://www.qsa.gov.qa/Ar/index.htm for website in Arabic)
3. Data availability
The Statistics Authority conducted the first labour Force Sample Survey in 2001. Starting from 2006, the execution of these surveys came to be on annual basis. Quarterly publications of Labour Force Surveys’ data are also available since 2012.
Most Labour Force Surveys and publications related to the labour force are available on QSA’s website, in PDF format. LFS 2013 can be downloaded from:
http://www.qsa.gov.qa/Eng/publication/annabs/2015/population-chapters/2_Labour_Force_2014.xlsx
See also Qatar Information Exchange for earlier Labour Force Surveys. QIX has also an interactive data base compiling data on the labour force taken from available surveys:
http://www.qix.gov.qa/portal/page/portal/qix/subject_area/Statistics?subject_area=183
Last date of access: September 2015.
|
Qatari |
Non-Qatari |
Total |
|
Males |
Females |
Total |
Males |
Females |
Total |
Males |
Females |
Total |
| Government Department |
42,259 |
22,084 |
64,343 |
60,083 |
16,246 |
76,329 |
102,342 |
38,330 |
140,672 |
| Government Company/ Corporation |
7,844 |
3,639 |
11,483 |
42,463 |
8,105 |
50,568 |
50,307 |
11,744 |
62,051 |
| Mixed |
4,860 |
1,504 |
6,364 |
43,408 |
5,276 |
48,684 |
48,268 |
6,780 |
55,048 |
| Private |
6,953 |
3,877 |
10,830 |
1,214,727 |
45,356 |
1,260,083 |
1,221,680 |
49,233 |
1,270,913 |
| Diplomatic/International/Regional |
85 |
6 |
91 |
1,867 |
723 |
2,590 |
1,952 |
729 |
2,681 |
| Non profit |
249 |
172 |
421 |
654 |
364 |
1,018 |
903 |
536 |
1,439 |
| Domestic |
0 |
0 |
0 |
56,855 |
97,202 |
154,057 |
56,855 |
97,202 |
154,057 |
| Total |
62,250 |
31,282 |
93,532 |
1,420,057 |
173,272 |
1,593,329 |
1,482,307 |
204,554 |
1,686,861 |
Source: Annual Bulletin of Labor Force Sample survey 2014
ANNEXED NOTE
1. Technical Notes and Definitions
The data is taken from 2014 Labour Force Survey (yearly synthesis)
Sampling frame of LFS 2014: Population Census 2010.
Sample size: Around 7,000 households: 1- Qatari households; 2- Non-Qatari regular (non-collective) households; 3- Non-Qatari small collective households or labour gatherings (2 – 6 persons); 4- Non-Qatari large collective households or large labour gatherings (7 persons or more).
Data Collection: The sample was divided into equal parts to collect data monthly. Each month 1/3 of the quarterly data were collected during the first two weeks of the month.
Reference period for the labour force data: the week prior to data collection day.
Population of reference: all Qatari and non-Qatari households present in Qatar on the night of survey, living in normal and collective households.
The collective households are a group of persons not related to each other and sharing living conditions in a residential unit, I.e. labour camps, students living boarding schools, nurses in hospitals… etc. The survey covered the small collective households (includes less than 7 persons) and large collective households (includes 7 persons or more).
The survey did not cover short periods accommodation, i.e. hotels.
Relation to labour force (for persons aged 15 and above)
In the labour force (= economically active).
1) Employed.
All persons aged 15 years an above, who during the week preceding the survey:
a) Perform a work for a wage, salary, profits or household gains, whether it was in cash or in kind.
b) Are temporarily not employed, however, they still have an official relation with their work
2) Unemployed.
All persons aged 15 years and over who were, during the week preceding the survey, without employment, willing to work and looking seriously for a job.
There is a distinction between two kinds of unemployed persons:
a) First time unemployed: They are the persons who never worked previously, and were during the week preceding the survey looking actively for work.
b) Unemployed who previously worked: They are the persons with a work experience, who during the week preceding the survey were actively looking for a job
Figures do not include persons seeking work for the first time
Outside the labour force (=economically inactive):
Full-time student: The person (15 years or older) enrolled in any educational institution as a full-time persistent student with purpose of attaining an academic degree, irrespective of whether the schooling hours are in the morning or evening. Any trainee enrolled in vocational training institutes is regarded as a full-time student.
Full-time housewife: The female (15 years or older) who is fully engaged in home management and family care, and does not practice any other work
Retired: The person who does not look for a job during the week preceding the survey and gets a fixed pension for work he/she had joined before
Disabled: The person (15 years or older) who is not capable of work due to illness, handicap or old age.
Others: Those able to work but not willing to, not enrolled in education, as well as any other cases encountered by the enumerator other than the above mentioned.
2. Institution which provides data
Qatar Statistics Authority (QSA), Ministry of Development Planning and Statistics
(https://www.mdps.gov.qa/en/Pages/default.aspx for website in English; https://www.mdps.gov.qa/ar/pages/default.aspx for website in Arabic)
3. Data availability
The Statistics Authority conducted the first labour Force Sample Survey in 2001. Starting from 2006, the execution of these surveys came to be on annual basis. Quarterly publications of Labour Force Surveys’ data are also available since 2012.
Most Labour Force Surveys and publications related to the labour force are available on QSA’s website, in PDF format. LFS 2013 can be downloaded from:
https://www.mdps.gov.qa/en/statistics1/pages/topicslisting.aspx?parent=Social&child=LaborForce
See also Qatar Information Exchange for earlier Labour Force Surveys. QIX has also an interactive data base compiling data on the labour force taken from available surveys:
http://www.qix.gov.qa/portal/page/portal/qix/subject_area/Statistics?subject_area=183
Last date of access: September 2015.
|
Qatari |
Non-Qatari |
Total |
|
Males |
Females |
Total |
Males |
Females |
Total |
Males |
Females |
Total |
| Legislators, Senior Officials And Managers |
7,511 |
1,826 |
9,337 |
31,384 |
4,409 |
35,793 |
38,895 |
6,235 |
45,130 |
| Professionals |
13,039 |
15,548 |
28,587 |
102,320 |
28,328 |
130,648 |
115,359 |
43,876 |
159,235 |
| Technicians And Associate Professionals |
10,462 |
4,141 |
14,603 |
70,911 |
10,541 |
81,452 |
81,373 |
14,682 |
96,055 |
| Clerks |
14,673 |
7,957 |
22,630 |
53,028 |
10,487 |
63,515 |
67,701 |
18,444 |
86,145 |
| Service Workers And Shop And Market Sales Workers |
4,934 |
1,468 |
6,402 |
136,572 |
24,768 |
161,340 |
141,506 |
26,236 |
167,742 |
| Skilled Agricultural And Fishery Workers |
0 |
0 |
0 |
23,972 |
0 |
23,972 |
23,972 |
0 |
23,972 |
| Craft And Related Trades Workers |
5,417 |
0 |
5,417 |
553,593 |
472 |
554,065 |
559,010 |
472 |
559,482 |
| Plant And Machine Operators And Assemblers |
1,121 |
0 |
1,121 |
199,876 |
1,033 |
200,909 |
200,997 |
1,033 |
202,030 |
| Elementary Occupations |
5,093 |
342 |
5,435 |
248,401 |
93,234 |
341,635 |
253,494 |
93,576 |
347,070 |
| Total |
62,250 |
31,282 |
93,532 |
1,420,057 |
173,272 |
1,593,329 |
1,482,307 |
204,554 |
1,686,861 |
Source: Annual Bulletin of Labor Force Sample survey 2014
ANNEXED NOTE
1. Technical Notes and Definitions
The data is taken from 2014 Labour Force Survey (yearly synthesis)
Sampling frame of LFS 2014: Population Census 2010.
Sample size: Around 7,000 households: 1- Qatari households; 2- Non-Qatari regular (non-collective) households; 3- Non-Qatari small collective households or labour gatherings (2 – 6 persons); 4- Non-Qatari large collective households or large labour gatherings (7 persons or more).
Data Collection: The sample was divided into equal parts to collect data monthly. Each month 1/3 of the quarterly data were collected during the first two weeks of the month.
Reference period for the labour force data: the week prior to data collection day.
Population of reference: all Qatari and non-Qatari households present in Qatar on the night of survey, living in normal and collective households.
The collective households are a group of persons not related to each other and sharing living conditions in a residential unit, I.e. labour camps, students living boarding schools, nurses in hospitals… etc. The survey covered the small collective households (includes less than 7 persons) and large collective households (includes 7 persons or more).
The survey did not cover short periods accommodation, i.e. hotels.
Relation to labour force (for persons aged 15 and above)
In the labour force (= economically active).
1) Employed.
All persons aged 15 years an above, who during the week preceding the survey:
a) Perform a work for a wage, salary, profits or household gains, whether it was in cash or in kind.
b) Are temporarily not employed, however, they still have an official relation with their work
2) Unemployed.
All persons aged 15 years and over who were, during the week preceding the survey, without employment, willing to work and looking seriously for a job.
There is a distinction between two kinds of unemployed persons:
a) First time unemployed: They are the persons who never worked previously, and were during the week preceding the survey looking actively for work.
b) Unemployed who previously worked: They are the persons with a work experience, who during the week preceding the survey were actively looking for a job
Outside the labour force (=economically inactive):
Full-time student: The person (15 years or older) enrolled in any educational institution as a full-time persistent student with purpose of attaining an academic degree, irrespective of whether the schooling hours are in the morning or evening. Any trainee enrolled in vocational training institutes is regarded as a full-time student.
Full-time housewife: The female (15 years or older) who is fully engaged in home management and family care, and does not practice any other work
Retired: The person who does not look for a job during the week preceding the survey and gets a fixed pension for work he/she had joined before
Disabled: The person (15 years or older) who is not capable of work due to illness, handicap or old age.
Others: Those able to work but not willing to, not enrolled in education, as well as any other cases encountered by the enumerator other than the above mentioned.
Figures do not include persons seeking work for the first time
2. Institution which provides data
Qatar Statistics Authority (QSA), Ministry of Development Planning and Statistics
(http://www.qsa.gov.qa/eng/index.htm for website in English; http://www.qsa.gov.qa/Ar/index.htm for website in Arabic)
3. Data availability
The Statistics Authority conducted the first labour Force Sample Survey in 2001. Starting from 2006, the execution of these surveys came to be on annual basis. Quarterly publications of Labour Force Surveys’ data are also available since 2012.
Most Labour Force Surveys and publications related to the labour force are available on QSA’s website, in PDF format. LFS 2013 can be downloaded from:
http://www.qsa.gov.qa/Eng/publication/annabs/2015/population-chapters/2_Labour_Force_2014.xlsx
See also Qatar Information Exchange for earlier Labour Force Surveys. QIX has also an interactive data base compiling data on the labour force taken from available surveys:
http://www.qix.gov.qa/portal/page/portal/qix/subject_area/Statistics?subject_area=183
Last date of access: September 2015.
|
Western countries |
Arab countries |
Asian countries |
| CEO/MD – Multinational |
44,721 |
45,314 |
37,393 |
| CEO/MD – Local Company |
26,743 |
24,551 |
20,719 |
| Human Resources – Manager |
12,447 |
9,683 |
9,989 |
| Information Technology – Manager |
12,901 |
13,553 |
10,620 |
| Sales/Marketing – Account Manager |
8,370 |
8,167 |
5,452 |
| Legal – Lawyer Marketer/Manager |
11,567 |
11,557 |
9,491 |
| Facilities Management – Manager |
10,406 |
9,112 |
8,500 |
| Finance & Accounting – Manager |
9,664 |
10,020 |
7,458 |
| Recruitment – Manager |
9,238 |
9,456 |
7,631 |
| Healthcare – General Practitioner/ Manager |
10,355 |
11,132 |
8,802 |
| Real Estate – Manager |
11,471 |
13,022 |
10,516 |
| Banking – Branch Manager |
12,402 |
10,282 |
9,335 |
| Banking – Treasury Manager |
16,097 |
14,433 |
12,445 |
| Banking – Retail/Personal Banking Manager |
12,161 |
11,358 |
8,623 |
| Media – Advertising Creative Manager |
12,914 |
11,217 |
8,011 |
| Media – Public Relations Manager |
12,806 |
11,769 |
7,949 |
| Media – Publishing Editor |
9,531 |
9,336 |
6,518 |
| Construction – Project Manager |
14,594 |
12,738 |
10,603 |
| Events – Manager |
7,354 |
7,996 |
5,748 |
| Executive Secretary/PA |
5,714 |
5,729 |
3,975 |
Source: Gulf Business, March 23, 2015
ANNEXED NOTE
1. Technical Notes and Definitions
The Gulf Business 2015 Salary Survey polled the average remuneration for 20 professions and sectors, including finance, real estate and media, across the six Gulf countries.
The 2015 Salary Survey was compiled based on inputs from regional recruitment companies including Nadia, Charterhouse and Michael Page.
2. Institution which provides data
Gulf Business 2015 Salary Survey
3. Data availability
Robert Anderson. “Revealed: The Gulf Business 2015 Salary Survey”, Gulf Business, vol. 19, Issue 11, March 23, 2015.
http://gulfbusiness.com/2015/03/revealed-gulf-business-2015-salary-survey/#.VfwSg_ntmko
Date of access: September 2015.
|
Western countries |
Arab countries |
Asian countries |
| CEO/MD – Multinational |
41,888 |
40,639 |
36,456 |
| CEO/MD – Local Company |
25,498 |
23,332 |
19,344 |
| Human Resources – Manager |
9,992 |
9,498 |
8,322 |
| Information Technology – Manager |
11,390 |
11,588 |
9,552 |
| Sales/Marketing – Account Manager |
7,992 |
6,339 |
5,041 |
| Legal – Lawyer Marketer/Manager |
11,291 |
10,778 |
9,044 |
| Facilities Management – Manager |
9,828 |
9,401 |
7,834 |
| Finance & Accounting – Manager |
8,965 |
8,163 |
7,062 |
| Recruitment – Manager |
7,736 |
8,090 |
6,478 |
| Healthcare – General Practitioner/ Manager |
9,123 |
9,738 |
7,790 |
| Real Estate – Manager |
10,013 |
8,724 |
8,208 |
| Banking – Branch Manager |
11,530 |
9,129 |
8,582 |
| Banking – Treasury Manager |
14,770 |
12,935 |
11,247 |
| Banking – Retail/Personal Banking Manager |
10,833 |
9,078 |
8,321 |
| Media – Advertising Creative Manager |
11,845 |
9,678 |
7,413 |
| Media – Public Relations Manager |
10,882 |
9,114 |
7,161 |
| Media – Publishing Editor |
7,736 |
8,620 |
5,326 |
| Construction – Project Manager |
13,857 |
11,312 |
9,307 |
| Events – Manager |
6,520 |
6,692 |
4,527 |
| Executive Secretary/PA |
5,438 |
4,835 |
3,612 |
Source: Gulf Business, March 23, 2015
ANNEXED NOTE
1. Technical Notes and Definitions
The Gulf Business 2015 Salary Survey polled the average remuneration for 20 professions and sectors, including finance, real estate and media, across the six Gulf countries.
The 2015 Salary Survey was compiled based on inputs from regional recruitment companies including Nadia, Charterhouse and Michael Page.
2. Institution which provides data
Gulf Business 2015 Salary Survey
3. Data availability
Robert Anderson. “Revealed: The Gulf Business 2015 Salary Survey”, Gulf Business, vol. 19, Issue 11, March 23, 2015.
http://gulfbusiness.com/2015/03/revealed-gulf-business-2015-salary-survey/#.VfwSg_ntmko
Date of access: September 2015.
|
Western countries |
Arab countries |
Asian countries |
| CEO/MD – Multinational |
39,132 |
37,717 |
22,569 |
| CEO/MD – Local Company |
22,916 |
21,397 |
15,925 |
| Human Resources – Manager |
9,595 |
9,175 |
6,987 |
| Information Technology – Manager |
10,701 |
10,710 |
8,375 |
| Sales/Marketing – Account Manager |
6,921 |
6,030 |
4,863 |
| Legal – Lawyer Marketer/Manager |
9,860 |
9,720 |
7,086 |
| Facilities Management – Manager |
7,405 |
7,196 |
5,125 |
| Finance & Accounting – Manager |
8,145 |
7,985 |
5,459 |
| Recruitment – Manager |
6,222 |
6,441 |
5,108 |
| Healthcare – General Practitioner/ Manager |
8,116 |
8,623 |
6,899 |
| Real Estate – Manager |
10,910 |
8,530 |
7,748 |
| Banking – Branch Manager |
11,054 |
8,536 |
8,592 |
| Banking – Treasury Manager |
13,807 |
11,141 |
9,371 |
| Banking – Retail/Personal Banking Manager |
10,139 |
8,618 |
6,831 |
| Media – Advertising Creative Manager |
9,648 |
8,671 |
7,097 |
| Media – Public Relations Manager |
10,179 |
8,810 |
5,727 |
| Media – Publishing Editor |
7,058 |
7,622 |
4,867 |
| Construction – Project Manager |
11,888 |
10,279 |
8,112 |
| Events – Manager |
4,835 |
5,739 |
4,329 |
| Executive Secretary/PA |
4,857 |
4,708 |
3,003 |
Source: Gulf Business, March 23, 2015
ANNEXED NOTE
1. Technical Notes and Definitions
The Gulf Business 2015 Salary Survey polled the average remuneration for 20 professions and sectors, including finance, real estate and media, across the six Gulf countries.
The 2015 Salary Survey was compiled based on inputs from regional recruitment companies including Nadia, Charterhouse and Michael Page.
2. Institution which provides data
Gulf Business 2015 Salary Survey
3. Data availability
Robert Anderson. “Revealed: The Gulf Business 2015 Salary Survey”, Gulf Business, vol. 19, Issue 11, March 23, 2015.
http://gulfbusiness.com/2015/03/revealed-gulf-business-2015-salary-survey/#.VfwSg_ntmko
Date of access: September 2015.
| |
|
Saudis |
|
|
Non-Saudis |
|
|
Total |
|
| year |
males |
females |
total |
males |
females |
total |
males |
females |
total |
| 1974 |
3,166,013 |
2,997,792 |
6,163,805 |
517,178 |
257,219 |
774,397 |
3,683,191 |
3,255,011 |
6,938,202 |
| 1975 |
3,299,247 |
3,129,932 |
6,429,179 |
574,639 |
283,192 |
857,831 |
3,873,886 |
3,413,124 |
7,287,010 |
| 1976 |
3,436,784 |
3,266,657 |
6,703,441 |
638,241 |
311,670 |
949,911 |
4,075,025 |
3,578,327 |
7,653,352 |
| 1977 |
3,578,634 |
3,408,002 |
6,986,636 |
708,602 |
342,876 |
1,051,478 |
4,287,236 |
3,750,878 |
8,038,114 |
| 1978 |
3,724,791 |
3,553,986 |
7,278,777 |
786,393 |
377,049 |
1,163,442 |
4,511,184 |
3,931,035 |
8,442,219 |
| 1979 |
3,875,233 |
3,704,613 |
7,579,846 |
872,345 |
414,448 |
1,286,793 |
4,747,578 |
4,119,061 |
8,866,639 |
| 1980 |
4,029,922 |
3,859,872 |
7,889,794 |
967,252 |
455,350 |
1,422,602 |
4,997,174 |
4,315,222 |
9,312,396 |
| 1981 |
4,188,801 |
4,019,733 |
8,208,534 |
1,071,977 |
500,051 |
1,572,028 |
5,260,778 |
4,519,784 |
9,780,562 |
| 1982 |
4,351,793 |
4,184,148 |
8,535,941 |
1,187,454 |
548,870 |
1,736,324 |
5,539,247 |
4,733,018 |
10,272,265 |
| 1983 |
4,518,803 |
4,353,048 |
8,871,851 |
1,314,694 |
602,145 |
1,916,839 |
5,833,497 |
4,955,193 |
10,788,690 |
| 1984 |
4,689,709 |
4,526,340 |
9,216,049 |
1,454,788 |
660,237 |
2,115,025 |
6,144,497 |
5,186,577 |
11,331,074 |
| 1985 |
4,864,370 |
4,703,911 |
9,568,281 |
1,608,915 |
723,531 |
2,332,446 |
6,473,285 |
5,427,442 |
11,900,727 |
| 1986 |
5,042,619 |
4,885,623 |
9,928,242 |
1,778,342 |
792,434 |
2,570,776 |
6,820,961 |
5,678,057 |
12,499,018 |
| 1987 |
5,224,266 |
5,071,312 |
10,295,578 |
1,964,432 |
867,378 |
2,831,810 |
7,188,698 |
5,938,690 |
13,127,388 |
| 1988 |
5,409,093 |
5,260,787 |
10,669,880 |
2,168,647 |
948,820 |
3,117,467 |
7,577,740 |
6,209,607 |
13,787,347 |
| 1989 |
5,596,859 |
5,453,833 |
11,050,692 |
2,392,552 |
1,037,242 |
3,429,794 |
7,989,411 |
6,491,075 |
14,480,486 |
| 1990 |
5,787,294 |
5,650,206 |
11,437,500 |
2,637,820 |
1,133,151 |
3,770,971 |
8,425,114 |
6,783,357 |
15,208,471 |
| 1991 |
5,980,104 |
5,849,635 |
11,829,739 |
2,906,237 |
1,237,079 |
4,143,316 |
8,886,341 |
7,086,714 |
15,973,055 |
| 1992 |
6,170,757 |
6,047,443 |
12,218,200 |
3,193,111 |
1,347,068 |
4,540,179 |
9,363,868 |
7,394,511 |
16,758,379 |
| 1993 |
6,334,907 |
6,216,789 |
12,551,696 |
3,322,551 |
1,402,925 |
4,725,476 |
9,657,458 |
7,619,714 |
17,277,172 |
| 1994 |
6,488,628 |
6,375,082 |
12,863,710 |
3,397,772 |
1,440,127 |
4,837,899 |
9,886,400 |
7,815,209 |
17,701,609 |
| 1995 |
6,646,071 |
6,537,398 |
13,183,469 |
3,474,692 |
1,478,314 |
4,953,006 |
10,120,763 |
8,015,712 |
18,136,475 |
| 1996 |
6,807,325 |
6,703,837 |
13,511,162 |
3,553,349 |
1,517,511 |
5,070,860 |
10,360,674 |
8,221,348 |
18,582,022 |
| 1997 |
6,972,483 |
6,874,505 |
13,846,988 |
3,633,782 |
1,557,746 |
5,191,528 |
10,606,265 |
8,432,251 |
19,038,516 |
| 1998 |
7,141,639 |
7,049,510 |
14,191,149 |
3,716,031 |
1,599,045 |
5,315,076 |
10,857,670 |
8,648,555 |
19,506,225 |
| 1999 |
7,314,889 |
7,228,960 |
14,543,849 |
3,800,137 |
1,641,438 |
5,441,575 |
11,115,026 |
8,870,398 |
19,985,424 |
| 2000 |
7,492,332 |
7,412,968 |
14,905,300 |
3,886,141 |
1,684,952 |
5,571,093 |
11,378,473 |
9,097,920 |
20,476,393 |
| 2001 |
7,674,070 |
7,601,651 |
15,275,721 |
3,974,087 |
1,729,617 |
5,703,704 |
11,648,157 |
9,331,268 |
20,979,425 |
| 2002 |
7,860,206 |
7,795,126 |
15,655,332 |
4,064,017 |
1,775,464 |
5,839,481 |
11,924,223 |
9,570,590 |
21,494,813 |
| 2003 |
8,050,847 |
7,993,515 |
16,044,362 |
4,155,978 |
1,822,524 |
5,978,502 |
12,206,825 |
9,816,039 |
22,022,864 |
| 2004 |
8,245,575 |
8,198,412 |
16,443,987 |
4,248,335 |
1,871,564 |
6,119,899 |
12,493,910 |
10,069,976 |
22,563,886 |
| 2005 |
8,453,097 |
8,401,060 |
16,854,157 |
4,506,528 |
1,968,899 |
6,475,427 |
12,959,625 |
10,369,959 |
23,329,584 |
| 2006 |
8,663,597 |
8,606,584 |
17,270,181 |
4,780,413 |
2,071,296 |
6,851,709 |
13,444,010 |
10,677,880 |
24,121,890 |
| 2007 |
8,876,666 |
8,814,670 |
17,691,336 |
5,070,944 |
2,179,018 |
7,249,962 |
13,947,610 |
10,993,688 |
24,941,298 |
| 2008 |
9,091,249 |
9,024,301 |
18,115,550 |
5,379,132 |
2,292,343 |
7,671,475 |
14,470,381 |
11,316,644 |
25,787,025 |
| 2009 |
9,307,550 |
9,235,696 |
18,543,246 |
5,706,050 |
2,411,561 |
8,117,611 |
15,013,600 |
11,647,257 |
26,660,857 |
| 2010* |
9,525,178 |
9,448,437 |
18,973,615 |
6,052,837 |
2,536,980 |
8,589,817 |
15,578,015 |
11,985,417 |
27,563,432 |
| 2011** |
9,743,626 |
9,662,059 |
19,405,685 |
6,297,735 |
2,672,935 |
8,970,670 |
16,041,361 |
12,334,994 |
28,376,355 |
| 2012** |
9,962,431 |
9,876,017 |
19,838,448 |
6,591,296 |
2,766,151 |
9,357,447 |
16,553,727 |
12,642,168 |
29,195,895 |
| 2013** |
10,181,018 |
10,090,040 |
20,271,058 |
6,643,278 |
3,079,936 |
9,723,214 |
16,824,296 |
13,169,976 |
29,994,272 |
| 2014** |
10,398,993 |
10,303,543 |
20,702,536 |
6,867,332 |
3,200,507 |
10,067,839 |
17,266,325 |
13,504,050 |
30,770,375 |
| 2015** |
10,614,813 |
10,515,147 |
21,129,960 |
7,076,815 |
3,314,643 |
10,391,458 |
17,691,628 |
13,829,790 |
31,521,418 |
Source: Population estimates based on the results of population censuses (1974; 1992; 2004; 2010 preliminary results),
Central Department for Statistics and Information (CDSI)/ General Authority for Statistics (GaStat)
* preliminary results
** estimates from census 2010′ preliminary figures
ANNEXED NOTE
1. Technical Notes and Definitions
Reference periods: middle of given years
Population of reference: all individuals (nationals and non-nationals) present within the Kingdom’s borders during time of reference, be they permanent or temporary residents.
Implementation method: the Censuses are carried out according to de facto methodology, i.e. counting persons where they are during time of reference, be they usual residents of the place or temporary residents.
Estimates are based upon censuses’ results.
The first Saudi census was launched in 1962. It is usually not used, as it did not cover the whole of the resident population. 1974 census is the first comprehensive one in Saudi history. However, its rate of coverage and accuracy of data are considered weak.
1992 census’ population figures, along with ensuing estimates of Saudi population and rates of demographic growth for the following years, were shown to be inflated (see Winckler, O. “The Surprising Results of the Saudi Arabian 2004 Demographic Census”, IJMES, n°40, 2008, pp. 12-15).
Between 2004 and 2010 censuses, Saudi population figures seem consistent with natural increase figures. As non-national population is concerned, it is probably underestimated in official counts. Irregular workers and sojourners are also many (non-official, hence unverifiable estimates range between 1 and 2 millions).
Regarding mid-year estimates, it has to be noted that after each census CDSI has readjusted past figures for Saudi and non-Saudi populations, intercensal data as well as data for census years. Therefore, present data differ significantly from available census figures.
2. Institution which provides data
Central Department of Statistics and Information (CDSI), Ministry and Economy and Planning/ General Authority for Statistics (GaStat)
3. Data availability
Results of censuses conducted in 1992 and 2004 are available on the website of the General Authority for Statistics (http://www.stats.gov.sa/en), previously CDSI (http://www.cdsi.gov.sa/), in downloadable PDF format.
http://www.stats.gov.sa/en/73
http://www.stats.gov.sa/ar/73
Final results of 2010′ census have been released in May 2016. However, figures of population published by GaStat for 2015 in the Annual Yearbook (http://www.stats.gov.sa/en/46) are calculated on the basis of the preliminary results of census 2010.
Mid-year estimates of population in Saudi Arabia since 1974 are available in Saudi Arabia Monetary Agency (SAMA) Annual Reports and Yearly Statistics: http://www.sama.gov.sa/en-US/EconomicReports/Pages/YearlyStatistics.aspx
Date of access: June 2016.
| year |
Saudis |
Non-Saudis |
Total |
| 1974 |
6,163,805 |
774,397 |
6,938,202 |
| 1975 |
6,429,179 |
857,831 |
7,287,010 |
| 1976 |
6,703,441 |
949,911 |
7,653,352 |
| 1977 |
6,986,636 |
1,051,478 |
8,038,114 |
| 1978 |
7,278,777 |
1,163,442 |
8,442,219 |
| 1979 |
7,579,846 |
1,286,793 |
8,866,639 |
| 1980 |
7,889,794 |
1,422,602 |
9,312,396 |
| 1981 |
8,208,534 |
1,572,028 |
9,780,562 |
| 1982 |
8,535,941 |
1,736,324 |
10,272,265 |
| 1983 |
8,871,851 |
1,916,839 |
10,788,690 |
| 1984 |
9,216,049 |
2,115,025 |
11,331,074 |
| 1985 |
9,568,281 |
2,332,446 |
11,900,727 |
| 1986 |
9,928,242 |
2,570,776 |
12,499,018 |
| 1987 |
10,295,578 |
2,831,810 |
13,127,388 |
| 1988 |
10,669,880 |
3,117,467 |
13,787,347 |
| 1989 |
11,050,692 |
3,429,794 |
14,480,486 |
| 1990 |
11,437,500 |
3,770,971 |
15,208,471 |
| 1991 |
11,829,739 |
4,143,316 |
15,973,055 |
| 1992 |
12,218,200 |
4,540,179 |
16,758,379 |
| 1993 |
12,551,696 |
4,725,476 |
17,277,172 |
| 1994 |
12,863,710 |
4,837,899 |
17,701,609 |
| 1995 |
13,183,469 |
4,953,006 |
18,136,475 |
| 1996 |
13,511,162 |
5,070,860 |
18,582,022 |
| 1997 |
13,846,988 |
5,191,528 |
19,038,516 |
| 1998 |
14,191,149 |
5,315,076 |
19,506,225 |
| 1999 |
14,543,849 |
5,441,575 |
19,985,424 |
| 2000 |
14,905,300 |
5,571,093 |
20,476,393 |
| 2001 |
15,275,721 |
5,703,704 |
20,979,425 |
| 2002 |
15,655,332 |
5,839,481 |
21,494,813 |
| 2003 |
16,044,362 |
5,978,502 |
22,022,864 |
| 2004 |
16,443,987 |
6,119,899 |
22,563,886 |
| 2005 |
16,854,157 |
6,475,427 |
23,329,584 |
| 2006 |
17,270,181 |
6,851,709 |
24,121,890 |
| 2007 |
17,691,336 |
7,249,962 |
24,941,298 |
| 2008 |
18,115,550 |
7,671,475 |
25,787,025 |
| 2009 |
18,543,246 |
8,117,611 |
26,660,857 |
| 2010* |
18,973,615 |
8,589,817 |
27,563,432 |
| 2011** |
19,405,685 |
8,970,670 |
28,376,355 |
| 2012** |
19,838,448 |
9,357,447 |
29,195,895 |
| 2013** |
20,271,058 |
9,723,214 |
29,994,272 |
| 2014** |
20,702,536 |
10,067,839 |
30,770,375 |
Source: Population estimates based on the results of population censuses (1974; 1992; 2004; 2010 preliminary results),
Central Department for Statistics and Information (CDSI)/ General Authority for Statistics (GaStat)
* preliminary results
** estimates from census 2010′ preliminary figures
ANNEXED NOTE
1. Technical Notes and Definitions
Reference periods: middle of given years
Population of reference: all individuals (nationals and non-nationals) present within the Kingdom’s borders during time of reference, be they permanent or temporary residents.
Implementation method: the Censuses are carried out according to de facto methodology, i.e. counting persons where they are during time of reference, be they usual residents of the place or temporary residents.
Estimates are based upon censuses’ results.
The first Saudi census was launched in 1962. It is usually not used, as it did not cover the whole of the resident population. 1974 census is the first comprehensive one in Saudi history. However, its rate of coverage and accuracy of data are considered weak.
1992 census’ population figures, along with ensuing estimates of Saudi population and rates of demographic growth for the following years, were shown to be inflated (see Winckler, O. “The Surprising Results of the Saudi Arabian 2004 Demographic Census”, IJMES, n°40, 2008, pp. 12-15).
Between 2004 and 2010 censuses, Saudi population figures seem consistent with natural increase figures. As non-national population is concerned, it is probably underestimated in official counts. Irregular workers and sojourners are also many (non-official, hence unverifiable estimates range between 1 and 2 millions).
Regarding mid-year estimates, it has to be noted that after each census CDSI has readjusted past figures for Saudi and non-Saudi populations, intercensal data as well as data for census years. Therefore, present data differ significantly from available census figures.
2. Institution which provides data
Central Department of Statistics and Information (CDSI), Ministry and Economy and Planning/ General Authority for Statistics (GaStat)
3. Data availability
Results of censuses conducted in 1992 and 2004 are available on the website of the General Authority for Statistics (http://www.stats.gov.sa/en), previously CDSI (http://www.cdsi.gov.sa/), in downloadable PDF format.
http://www.stats.gov.sa/en/73
http://www.stats.gov.sa/ar/73
Final results of 2010′ census have been released in May 2016. However, figures of population published by GaStat for 2015 in the Annual Yearbooks (http://www.stats.gov.sa/en/46) are calculated on the basis of the preliminary results of census 2010.
Mid-year estimates of population in Saudi Arabia since 1974 are available in Saudi Arabia Monetary Agency (SAMA) Annual Reports and Yearly Statistics: http://www.sama.gov.sa/en-US/EconomicReports/Pages/YearlyStatistics.aspx
Date of access: June 2016.
|
Western countries |
Arab countries |
Asian countries |
| CEO/MD – Multinational |
37,921 |
29,625 |
33,027 |
| CEO/MD – Local Company |
21,850 |
19,979 |
17,744 |
| Human Resources – Manager |
10,067 |
8,836 |
8,106 |
| Information Technology – Manager |
10,775 |
10,774 |
9,161 |
| Sales/Marketing – Account Manager |
7,563 |
5,995 |
4,792 |
| Legal – Lawyer Marketer/Manager |
9,825 |
9,525 |
8,295 |
| Facilities Management – Manager |
8,797 |
8,647 |
7,226 |
| Finance & Accounting – Manager |
8,033 |
7,208 |
6,218 |
| Recruitment – Manager |
7,296 |
7,471 |
6,259 |
| Healthcare – General Practitioner/ Manager |
9,225 |
9,225 |
7,790 |
| Real Estate – Manager |
7,848 |
8,120 |
8,538 |
| Banking – Branch Manager |
8,904 |
7,987 |
7,608 |
| Banking – Treasury Manager |
12,179 |
10,997 |
10,696 |
| Banking – Retail/Personal Banking Manager |
9,830 |
7,681 |
7,422 |
| Media – Advertising Creative Manager |
9,750 |
8,708 |
6,177 |
| Media – Public Relations Manager |
9,725 |
8,547 |
5,846 |
| Media – Publishing Editor |
7,064 |
7,621 |
5,357 |
| Construction – Project Manager |
11,429 |
9,762 |
8,438 |
| Events – Manager |
5,581 |
5,874 |
4,547 |
| Executive Secretary/PA |
4,692 |
4,144 |
3,386 |
Source: Gulf Business, March 23, 2015
ANNEXED NOTE
1. Technical Notes and Definitions
The Gulf Business 2015 Salary Survey polled the average remuneration for 20 professions and sectors, including finance, real estate and media, across the six Gulf countries.
The 2015 Salary Survey was compiled based on inputs from regional recruitment companies including Nadia, Charterhouse and Michael Page.
2. Institution which provides data
Gulf Business 2015 Salary Survey
3. Data availability
Robert Anderson. “Revealed: The Gulf Business 2015 Salary Survey”, Gulf Business, vol. 19, Issue 11, March 23, 2015.
http://gulfbusiness.com/2015/03/revealed-gulf-business-2015-salary-survey/#.VfwSg_ntmko
Date of access: September 2015.
|
Western countries |
Arab countries |
Asian countries |
| CEO/MD – Multinational |
40,950 |
40,669 |
34,900 |
| CEO/MD – Local Company |
25,567 |
21,946 |
19,392 |
| Human Resources – Manager |
11,113 |
11,020 |
10,864 |
| Information Technology – Manager |
12,092 |
12,131 |
9,638 |
| Sales/Marketing – Account Manager |
7,808 |
6,952 |
5,697 |
| Legal – Lawyer Marketer/Manager |
10,892 |
10,659 |
8,754 |
| Facilities Management – Manager |
9,683 |
9,712 |
7,750 |
| Finance & Accounting – Manager |
9,496 |
8,864 |
6,898 |
| Recruitment – Manager |
7,968 |
8,228 |
6,378 |
| Healthcare – General Practitioner/ Manager |
9,738 |
10,250 |
8,200 |
| Real Estate – Manager |
9,541 |
8,978 |
6,361 |
| Banking – Branch Manager |
11,327 |
9,177 |
8,535 |
| Banking – Treasury Manager |
14,553 |
11,770 |
10,763 |
| Banking – Retail/Personal Banking Manager |
11,163 |
9,948 |
7,571 |
| Media – Advertising Creative Manager |
11,959 |
9,972 |
7,532 |
| Media – Public Relations Manager |
12,010 |
10,111 |
7,293 |
| Media – Publishing Editor |
9,259 |
8,702 |
5,070 |
| Construction – Project Manager |
14,050 |
11,479 |
9,458 |
| Events – Manager |
6,451 |
6,717 |
5,110 |
| Executive Secretary/PA |
5,371 |
5,466 |
3,542 |
Source: Gulf Business, March 23, 2015
ANNEXED NOTE
1. Technical Notes and Definitions
The Gulf Business 2015 Salary Survey polled the average remuneration for 20 professions and sectors, including finance, real estate and media, across the six Gulf countries.
The 2015 Salary Survey was compiled based on inputs from regional recruitment companies including Nadia, Charterhouse and Michael Page.
2. Institution which provides data
Gulf Business 2015 Salary Survey
3. Data availability
Robert Anderson. “Revealed: The Gulf Business 2015 Salary Survey”, Gulf Business, vol. 19, Issue 11, March 23, 2015.
http://gulfbusiness.com/2015/03/revealed-gulf-business-2015-salary-survey/#.VfwSg_ntmko
Date of access: September 2015.
|
Western countries |
Arab countries |
Asian countries |
| CEO/MD – Multinational |
46,960 |
44,747 |
38,819 |
| CEO/MD – Local Company |
27,608 |
25,447 |
22,171 |
| Human Resources – Manager |
12,810 |
12,026 |
9,754 |
| Information Technology – Manager |
13,493 |
13,638 |
11,343 |
| Sales/Marketing – Account Manager |
9,523 |
8,120 |
6,037 |
| Legal – Lawyer Marketer/Manager |
12,044 |
11,819 |
9,759 |
| Facilities Management – Manager |
11,122 |
10,795 |
8,787 |
| Finance & Accounting – Manager |
9,898 |
9,923 |
7,742 |
| Recruitment – Manager |
10,029 |
10,167 |
7,968 |
| Healthcare – General Practitioner/ Manager |
12,363 |
13,239 |
10,560 |
| Real Estate – Manager |
12,928 |
13,830 |
9,577 |
| Banking – Branch Manager |
12,542 |
11,733 |
11,332 |
| Banking – Treasury Manager |
15,918 |
15,328 |
13,951 |
| Banking – Retail/Personal Banking Manager |
11,312 |
10,948 |
8,909 |
| Media – Advertising Creative Manager |
14,376 |
11,417 |
8,467 |
| Media – Public Relations Manager |
13,352 |
11,645 |
8,825 |
| Media – Publishing Editor |
9,833 |
9,428 |
6,373 |
| Construction – Project Manager |
15,803 |
13,412 |
10,654 |
| Events – Manager |
8,512 |
8,030 |
5,936 |
| Executive Secretary/PA |
5,611 |
5,645 |
4,361 |
Source: Gulf Business, March 23, 2015
ANNEXED NOTE
1. Technical Notes and Definitions
The Gulf Business 2015 Salary Survey polled the average remuneration for 20 professions and sectors, including finance, real estate and media, across the six Gulf countries.
The 2015 Salary Survey was compiled based on inputs from regional recruitment companies including Nadia, Charterhouse and Michael Page.
2. Institution which provides data
Gulf Business 2015 Salary Survey
3. Data availability
Robert Anderson. “Revealed: The Gulf Business 2015 Salary Survey”, Gulf Business, vol. 19, Issue 11, March 23, 2015.
http://gulfbusiness.com/2015/03/revealed-gulf-business-2015-salary-survey/#.VfwSg_ntmko
Date of access: September 2015.
|
Arrests |
Deportations |
| Muscat Governorate |
7,557 |
4,578 |
| Al Batinah (North and South) |
3,393 |
934 |
| Ad Dakhliyah Region |
1,615 |
601 |
| Dhofar Governorate |
1,325 |
625 |
| Ash Sharqiyah (North and South) |
1,039 |
331 |
| Adh Dhahirah Region |
883 |
291 |
| Al Buraymi Governorate |
73 |
31 |
| Total |
15,885 |
7,391 |
Source: Ministry of Manpower, Annual Yearbook 2013
ANNEXED NOTE
1. Technical Notes and Definitions
The table refers to all arrests and deportations performed during the given year, due to any type of contravention to entry, residency and labor laws
(infiltrators, those working with a tourist or visitors’ visa; those working in a profession other than that stated on their iqama, etc).
Operations of detection of foreign nationals in irregular situation are conducted in private sector’s establishments by MoM’s Search Department (taftish) jointly with the Royal Police of Oman.
2. Institution which provides data
Ministry of Manpower, Mascate
3. Data availability
Ministry of Manpower’s website:
English
Arabic
MoM’s Annual Reports for the years 2009 to 2013 are available in PDF format (in Arabic only) in the “Media Center” section of MoM’s website:
http://www.manpower.gov.om/portal/media/AnnualReport.aspx
Last date of access: September 2015.
|
Arrests |
Deportations |
| Muscat Governorate |
8,732 |
6,030 |
| Al Batinah (North and South) |
2,865 |
25 |
| Dhofar Governorate |
1,193 |
682 |
| Adh Dhahirah Region |
1,031 |
423 |
| Ad Dakhliyah Region |
1,023 |
650 |
| Ash Sharqiyah (North and South) |
661 |
389 |
| Al Buraymi Governorate |
113 |
52 |
| Musandam Governorate |
9 |
1 |
| Al Wusta Region |
|
|
| Total |
15,627 |
7,391 |
Source: Ministry of Manpower, Annual Yearbook 2012
ANNEXED NOTE
1. Technical Notes and Definitions
The table refers to all arrests and deportations performed during the given year, due to any type of contravention to entry, residency and labor laws
(infiltrators, those working with a tourist or visitors’ visa; those working in a profession other than that stated on their iqama, etc).
Operations of detection of foreign nationals in irregular situation are conducted in private sector’s establishments by MoM’s Search Department (taftish) jointly with the Royal Police of Oman.
2. Institution which provides data
Ministry of Manpower, Mascate
3. Data availability
Ministry of Manpower’s website:
English
Arabic
MoM’s Annual Reports for the years 2009 to 2013 are available in PDF format (in Arabic only) in the “Media Center” section of MoM’s website:
http://www.manpower.gov.om/portal/media/AnnualReport.aspx
Last date of access: September 2015.
|
Arrests |
Deportations |
| Muscat Governorate |
5,544 |
3,010 |
| Al Batinah (North and South) |
1,054 |
624 |
| Adh Dhahirah Region |
571 |
304 |
| Ad Dakhliyah Region |
340 |
251 |
| Ash Sharqiyah (North and South) |
208 |
0 |
| Dhofar Governorate |
467 |
377 |
| Al Buraymi Governorate |
16 |
10 |
| Total |
8,200 |
4,576 |
Source: Ministry of Manpower, Annual Yearbook 2011
ANNEXED NOTE
1. Technical Notes and Definitions
The table refers to all arrests and deportations performed during the given year, due to any type of contravention to entry, residency and labor laws
(infiltrators, those working with a tourist or visitors’ visa; those working in a profession other than that stated on their iqama, etc).
Operations of detection of foreign nationals in irregular situation are conducted in private sector’s establishments by MoM’s Search Department (taftish) jointly with the Royal Police of Oman.
2. Institution which provides data
Ministry of Manpower, Mascate
3. Data availability
Ministry of Manpower’s website:
English
Arabic
MoM’s Annual Reports for the years 2009 to 2013 are available in PDF format (in Arabic only) in the “Media Center” section of MoM’s website:
http://www.manpower.gov.om/portal/media/AnnualReport.aspx
Last date of access: September 2015.
|
Arrests |
Deportations |
| Muscat Governorate |
4,597 |
2,541 |
| Al Batinah (North and South) |
768 |
644 |
| Adh Dhahirah Region |
622 |
464 |
| Ad Dakhliyah Region |
491 |
252 |
| Ash Sharqiyah (North and South) |
394 |
63 |
| Dhofar Governorate |
703 |
509 |
| Al Buraymi Governorate |
119 |
28 |
| Total |
7,694 |
4,501 |
Source: Ministry of Manpower, Annual Yearbook 2010
ANNEXED NOTE
1. Technical Notes and Definitions
The table refers to all arrests and deportations performed during the given year, due to any type of contravention to entry, residency and labor laws
(infiltrators, those working with a tourist or visitors’ visa; those working in a profession other than that stated on their iqama, etc).
Operations of detection of foreign nationals in irregular situation are conducted in private sector’s establishments by MoM’s Search Department (taftish) jointly with the Royal Police of Oman.
2. Institution which provides data
Ministry of Manpower, Mascate
3. Data availability
Ministry of Manpower’s website:
English
Arabic
MoM’s Annual Reports for the years 2009 to 2013 are available in PDF format (in Arabic only) in the “Media Center” section of MoM’s website:
http://www.manpower.gov.om/portal/media/AnnualReport.aspx
Last date of access: September 2015.
| Country of nationality |
Arrests |
| Bangladesh |
8,552 |
| Pakistan |
3,923 |
| India |
2,072 |
| Other nationalities |
1,338 |
| Total |
15,885 |
Source: Ministry of Manpower, Annual Yearbook 2013
ANNEXED NOTE
1. Technical Notes and Definitions
The table refers to all arrests performed during the given year, due to any type of contravention to entry, residency and labor laws
(infiltrators, those working with a tourist or visitors’ visa; those working in a profession other than that stated on their iqama, etc).
Operations of detection of foreign nationals in irregular situation are conducted in private sector’s establishments by MoM’s Search Department (taftish) jointly with the Royal Police of Oman.
2. Institution which provides data
Ministry of Manpower, Mascate
3. Data availability
Ministry of Manpower’s website:
English
Arabic:
MoM’s Annual Reports for the years 2009 to 2013 are available in PDF format (in Arabic only) in the “Media Center” section of MoM’s website:
http://www.manpower.gov.om/portal/media/AnnualReport.aspx
Last date of access: September 2015.
| Country of nationality |
Arrests |
| Bangladesh |
7,059 |
| Pakistan |
4,379 |
| India |
2,716 |
| Other nationalities |
1,473 |
| Total |
15,627 |
Source: Ministry of Manpower, Annual Yearbook 2012
ANNEXED NOTE
1. Technical Notes and Definitions
The table refers to all arrests performed during the given year, due to any type of contravention to entry, residency and labor laws
(infiltrators, those working with a tourist or visitors’ visa; those working in a profession other than that stated on their iqama, etc).
Operations of detection of foreign nationals in irregular situation are conducted in private sector’s establishments by MoM’s Search Department (taftish) jointly with the Royal Police of Oman.
2. Institution which provides data
Ministry of Manpower, Mascate
3. Data availability
Ministry of Manpower’s website:
English
Arabic
MoM’s Annual Reports for the years 2009 to 2013 are available in PDF format (in Arabic only) in the “Media Center” section of MoM’s website:
http://www.manpower.gov.om/portal/media/AnnualReport.aspx
Last date of access: September 2015.
| |
2010 |
2011 |
2012 |
2013 |
| Nationality group |
Number of expired residency holders |
% |
Number of expired residency holders |
% |
Number of expired residency holders |
% |
Number of expired residency holders |
% |
| Arab countries |
659 |
18.6 |
809 |
14.2 |
1,226 |
12.8 |
2,329 |
14.3 |
| Non-Arab Asian countries |
2,774 |
78.2 |
4,341 |
76.2 |
7,053 |
73.6 |
10,536 |
64.7 |
| Non-Arab African countries |
79 |
2.2 |
485 |
8.5 |
1,261 |
13.2 |
3,349 |
20.6 |
| Europe |
5 |
0.1 |
12 |
0.2 |
8 |
0.1 |
15 |
0.1 |
| North America |
23 |
0.6 |
31 |
0.5 |
36 |
0.4 |
35 |
0.2 |
| Central and South America |
5 |
0.1 |
2 |
0.0 |
5 |
0.1 |
13 |
0.1 |
| Australia and Oceania |
3 |
0.1 |
15 |
0.3 |
0 |
0.0 |
11 |
0.1 |
| Other |
1 |
0.0 |
0 |
0.0 |
0 |
0.0 |
0 |
0.0 |
| Total |
3,549 |
100 |
5,695 |
100 |
9,589 |
100 |
16,288 |
100 |
Source: Ministry of Interior
ANNEXED NOTE
1. Definitions
The figures refer to foreign residents who are still living in Kuwait at the end of the reference year, but were found contravening the law on residency by staying beyond the period of validity of their residency document.
Residency procedures do not apply to nationals of other GCC countries.
The bidoun, a stateless population, are not included in the residency documents holders.
The figures concern previous holders of all categories of residency permits: labour (number 14-temporary; 17- government labour; 18- private sector labour; 19- business; 20- domestic labour)
and other categories (22- family dependents; 23- student; 24- self-sponsorship).
2. Institution which provides data
Ministry of Interior (MoI) and Central Statistical Bureau (CSB), Ministry of Planning.
3. Period of data coverage
December 31st, given years.
4. Data availability
The present data is taken from the report “Migration Statistics 2013”, published by the CSB.
The report reproduces Ministry of Interior’s (Directorate of Migration’s) figures of permits granted to foreign residents by type/ purpose of permit, sex and regional origin of holder, for the years 2010 to 2013.
The report (in Arabic, PDF format with Excel tables) is available on CSB’s website (Population Statistics, then Migration Statistics)
http://www.csb.gov.kw/Socan_Statistic.aspx?ID=56
Date of access: July 2015.
|
|
Economically Active |
Non-Economically Active |
% |
|
|
Employed |
Unemployed |
Total |
% |
Housewife |
Full time student |
Other |
Total |
% |
| |
Males |
98,92 |
1,08 |
100 |
61,78 |
– |
57,89 |
42,11 |
100 |
38,22 |
100 |
| Emiratis |
Females |
94,75 |
5,25 |
100 |
32,08 |
42,61 |
32,97 |
24,42 |
100 |
67,92 |
100 |
| |
Total |
97,43 |
2,57 |
100 |
46,46 |
27,88 |
41,59 |
30,53 |
100 |
53,54 |
100 |
| |
Males |
99,97 |
0,03 |
100 |
97,02 |
– |
80,78 |
19,22 |
100 |
2,98 |
100 |
| Non-Emiratis |
Females |
99,88 |
0,12 |
100 |
52,08 |
75,96 |
14,35 |
9,69 |
100 |
47,92 |
100 |
| |
Total |
99,96 |
0,04 |
100 |
84,21 |
65,69 |
23,33 |
10,98 |
100 |
15,79 |
100 |
| |
Males |
99,94 |
0,06 |
100 |
95,13 |
– |
71,16 |
28,84 |
100 |
4,87 |
100 |
| Total |
Females |
99,44 |
0,56 |
100 |
49,45 |
70,07 |
17,64 |
12,29 |
100 |
50,55 |
100 |
| |
Total |
99,84 |
0,16 |
100 |
81,3 |
57,34 |
27,36 |
15,3 |
100 |
18,7 |
100 |
Source: Labour Force Survey 2012
ANNEXED NOTE
1. Characteristics of data, definitions
DSC has conducted Labour Force Surveys on Dubai Emirate in 2008, 2009, 2011 and 2012.
Sample of LFS 2012: 2,560 households, distributed as follows: 1,100 Emirati households, 1,010 non-Emirati households; 450 collective households, and
900 workers from labour gatherings.”
The population taken into account is the population residing in Dubai. The survey results do not include the population aged 15 and above, working in Dubai but residing in other Emirates.
Date of reference: mid- 2012.
The time reference of the survey is:
Visit day is the time reference for the family personal data.
The week ended on the visit day is the time reference for the employment status (employed / unemployed).
Month ended on the visit day is the time reference for job search.
The two years ended on the visit day represent the time reference for training of people who are unemployed and seeking a job.
Economically active population: Adult individuals, 15 years old or older, who are either employed or unemployed.
Economically inactive population: Individuals who are below 15 years old and individuals who are 15 years old or older but the definitions of employed and unemployed person are not applicable to them.
The results of LFS 2012 are not available in numbers, nor is there any publication of the distribution of Dubai’s population broken down by nationality for 2012.
Total population aged 15 and over residing in Dubai in 2012: 1,865,786 (https://www.dsc.gov.ae/Report/DSC_SYB_2012_01%20_%2003.pdf)
2. Institution which provides data
Dubai Statistics Centre (DSC).
3. Data availability
The results of Dubai Labour Force Surveys are available (in English and in Arabic) at:
https://www.dsc.gov.ae/Publication/نشرة%20القوى%20العاملة%202012%20انجليزي%20نهائي%20aa%2022.pdf
https://www.dsc.gov.ae/Publication/%D9%86%D8%B4%D8%B1%D8%A9%20%D8%A7%D9%84%D9%82%D9%88%D9%89%20%D8%A7%D9%84%D8%B9%D8%A7%D9%85%D9%84%D8%A9%202012%20%D8%B9%D8%B1%D8%A8%D9%8A%20%D9%86%D9%87%D8%A7%D8%A6%D9%8A.pdf
Some tables (in PDF format), definition of concepts and partial methodological indications are available in the LFS’ project page on DSC’s website (do not include 2012’s LFS)
https://www.dsc.gov.ae/en-us/Programs-Statistical-Surveys/Pages/Statistical-Project-details.aspx?ProjectId=21#DSC_Tab1
Last date of access: August 2015.

In case the links to the primary data source are broken, please refer to the new
DSC website until links to publications are restored.
| |
|
Single |
Married |
Divorced |
Widowed |
Total |
| |
Males |
37 |
60,7 |
2 |
0,3 |
100 |
| Emiratis |
Females |
52,1 |
41,2 |
5,3 |
1,4 |
100 |
| |
Total |
42,2 |
54 |
3,2 |
0,6 |
100 |
| |
Males |
24,1 |
75,5 |
0,3 |
0,1 |
100 |
| Non-Emiratis |
Females |
36,8 |
59,3 |
2,8 |
1,1 |
100 |
| |
Total |
26,3 |
72,6 |
0,8 |
0,3 |
100 |
| |
Males |
24,5 |
75 |
0,3 |
0,2 |
100 |
| Total |
Females |
38,1 |
57,8 |
3 |
1,1 |
100 |
| |
Total |
27 |
71,9 |
0,8 |
0,3 |
100 |
Source: Labour Force Survey 2012
ANNEXED NOTE
1. Characteristics of data, definitions
DSC has conducted Labour Force Surveys on Dubai Emirate in 2008, 2009, 2011 and 2012.
Sample of LFS 2012: 2,560 households, distributed as follows: 1,100 Emirati households, 1,010 non-Emirati households; 450 collective households, and
900 workers from labour gatherings.”
The population taken into account is the population residing in Dubai. The survey results do not include the population aged 15 and above, working in Dubai but residing in other Emirates.
Date of reference: mid- 2012.
The time reference of the survey is:
Visit day is the time reference for the family personal data.
The week ended on the visit day is the time reference for the employment status (employed / unemployed).
Month ended on the visit day is the time reference for job search.
The two years ended on the visit day represent the time reference for training of people who are unemployed and seeking a job.
Economically active population: Adult individuals, 15 years old or older, who are either employed or unemployed.
Economically inactive population: Individuals who are below 15 years old and individuals who are 15 years old or older but the definitions of employed and unemployed person are not applicable to them.
The results of LFS 2012 are not available in numbers, nor is there any publication of the distribution of Dubai’s population broken down by nationality for 2012.
Total population aged 15 and over residing in Dubai in 2012: 1,865,786 (https://www.dsc.gov.ae/Report/DSC_SYB_2012_01%20_%2003.pdf)
2. Institution which provides data
Dubai Statistics Centre (DSC).
3. Data availability
The results of Dubai Labour Force Surveys are available (in English and in Arabic) at:
https://www.dsc.gov.ae/Publication/نشرة%20القوى%20العاملة%202012%20انجليزي%20نهائي%20aa%2022.pdf
https://www.dsc.gov.ae/Publication/%D9%86%D8%B4%D8%B1%D8%A9%20%D8%A7%D9%84%D9%82%D9%88%D9%89%20%D8%A7%D9%84%D8%B9%D8%A7%D9%85%D9%84%D8%A9%202012%20%D8%B9%D8%B1%D8%A8%D9%8A%20%D9%86%D9%87%D8%A7%D8%A6%D9%8A.pdf
Some tables (in PDF format), definition of concepts and partial methodological indications are available in the LFS’ project page on DSC’s website (do not include 2012’s LFS)
https://www.dsc.gov.ae/en-us/Programs-Statistical-Surveys/Pages/Statistical-Project-details.aspx?ProjectId=21#DSC_Tab1
Last date of access: August 2015.
In case the links to the primary data source are broken, please refer to the new
DSC website until links to publications are restored.
|
|
Illiterate |
Read & Write |
Primary |
Preparatory |
Secondary |
Below University |
University |
Above University |
Master |
Doctorate |
Total |
| |
Males |
1,2 |
2,6 |
6 |
13,5 |
37,7 |
6,4 |
26,6 |
2,1 |
3 |
0,9 |
100 |
| Emiratis |
Females |
0,5 |
0,2 |
1,3 |
4,6 |
30,7 |
10,4 |
46,1 |
2,3 |
3,5 |
0,4 |
100 |
| |
Total |
1 |
1,8 |
4,4 |
10,4 |
35,2 |
7,8 |
33,4 |
2,2 |
3,1 |
0,7 |
100 |
| |
Males |
3,6 |
5 |
10,3 |
24,9 |
22,9 |
4,8 |
23,2 |
1,6 |
3,4 |
0,3 |
100 |
| Non-Emiratis |
Females |
2,4 |
9,6 |
7 |
8,6 |
19,4 |
6,9 |
38 |
2,9 |
5,1 |
0,1 |
100 |
| |
Total |
3,4 |
5,8 |
9,8 |
22,1 |
22,2 |
5,2 |
25,6 |
1,9 |
3,7 |
0,3 |
100 |
| |
Males |
3,5 |
4,9 |
10,2 |
24,5 |
23,4 |
4,9 |
23,2 |
1,7 |
3,4 |
0,3 |
100 |
| Total |
Females |
2,2 |
8,8 |
6,5 |
8,2 |
20,4 |
7,2 |
38,6 |
2,9 |
4,9 |
0,2 |
100 |
| |
Total |
3,3 |
5,6 |
9,5 |
21,6 |
22,8 |
5,3 |
26 |
1,9 |
3,7 |
0,3 |
100 |
Source: Labour Force Survey 2012
ANNEXED NOTE
1. Characteristics of data, definitions
DSC has conducted Labour Force Surveys on Dubai Emirate in 2008, 2009, 2011 and 2012.
Sample of LFS 2012: 2,560 households, distributed as follows: 1,100 Emirati households, 1,010 non-Emirati households; 450 collective households, and
900 workers from labour gatherings.”
The population taken into account is the population residing in Dubai. The survey results do not include the population aged 15 and above, working in Dubai but residing in other Emirates.
Date of reference: mid- 2012.
The time reference of the survey is:
Visit day is the time reference for the family personal data.
The week ended on the visit day is the time reference for the employment status (employed / unemployed).
Month ended on the visit day is the time reference for job search.
The two years ended on the visit day represent the time reference for training of people who are unemployed and seeking a job.
Economically active population: Adult individuals, 15 years old or older, who are either employed or unemployed.
Economically inactive population: Individuals who are below 15 years old and individuals who are 15 years old or older but the definitions of employed and unemployed person are not applicable to them.
The results of LFS 2012 are not available in numbers, nor is there any publication of the distribution of Dubai’s population broken down by nationality for 2012.
Total population aged 15 and over residing in Dubai in 2012: 1,865,786 (https://www.dsc.gov.ae/Report/DSC_SYB_2012_01%20_%2003.pdf)
2. Institution which provides data
Dubai Statistics Centre (DSC).
3. Data availability
The results of Dubai Labour Force Surveys are available (in English and in Arabic) at:
https://www.dsc.gov.ae/Publication/نشرة%20القوى%20العاملة%202012%20انجليزي%20نهائي%20aa%2022.pdf
https://www.dsc.gov.ae/Publication/%D9%86%D8%B4%D8%B1%D8%A9%20%D8%A7%D9%84%D9%82%D9%88%D9%89%20%D8%A7%D9%84%D8%B9%D8%A7%D9%85%D9%84%D8%A9%202012%20%D8%B9%D8%B1%D8%A8%D9%8A%20%D9%86%D9%87%D8%A7%D8%A6%D9%8A.pdf
Some tables (in PDF format), definition of concepts and partial methodological indications are available in the LFS’ project page on DSC’s website (do not include 2012’s LFS)
https://www.dsc.gov.ae/en-us/Programs-Statistical-Surveys/Pages/Statistical-Project-details.aspx?ProjectId=21#DSC_Tab1
Last date of access: August 2015.
In case the links to the primary data source are broken, please refer to the new
DSC website until links to publications are restored.
|
|
15-19 |
20-24 |
25-29 |
30-34 |
35-39 |
40-44 |
45-49 |
50-54 |
55-59 |
60-64 |
65+ |
Total |
|
Males |
1,6 |
15,2 |
18,7 |
15,7 |
13,2 |
11,6 |
9,9 |
5,5 |
3,6 |
2,8 |
2,2 |
100 |
| Emiratis |
Females |
1 |
14,5 |
29,2 |
20,9 |
16,1 |
10,9 |
4,6 |
2,3 |
0,3 |
0 |
0,2 |
100 |
| |
Total |
1,5 |
14,9 |
22,3 |
17,5 |
14,2 |
11,4 |
8 |
4,4 |
2,5 |
1,8 |
1,5 |
100 |
| |
Males |
0,1 |
6,1 |
23,8 |
22,8 |
17,3 |
13 |
8,3 |
4,9 |
2,5 |
1 |
0,2 |
100 |
| Non-Emiratis |
Females |
0,7 |
10,1 |
25,7 |
26,1 |
16,4 |
11 |
5,1 |
3,7 |
1,1 |
0,1 |
0 |
100 |
| |
Total |
0,2 |
6,8 |
24,1 |
23,4 |
17 |
12,6 |
7,9 |
4,7 |
2,2 |
0,9 |
0,2 |
100 |
| |
Males |
0,2 |
6,4 |
23,6 |
22,6 |
17,2 |
12,9 |
8,4 |
4,9 |
2,5 |
1,1 |
0,3 |
100 |
| Total |
Females |
0,7 |
10,5 |
26 |
25,7 |
16,4 |
11 |
5 |
3,6 |
1 |
0,1 |
0 |
100 |
|
Total |
0,3 |
7,2 |
24 |
23,3 |
17 |
12,6 |
7,8 |
4,6 |
2,1 |
0,9 |
0,2 |
100 |
Source: Labour Force Survey 2012
ANNEXED NOTE
1. Characteristics of data, definitions
DSC has conducted Labour Force Surveys on Dubai Emirate in 2008, 2009, 2011 and 2012.
Sample of LFS 2012: 2,560 households, distributed as follows: 1,100 Emirati households, 1,010 non-Emirati households; 450 collective households, and
900 workers from labour gatherings.”
The population taken into account is the population residing in Dubai. The survey results do not include the population aged 15 and above, working in Dubai but residing in other Emirates.
Date of reference: mid- 2012.
The time reference of the survey is:
Visit day is the time reference for the family personal data.
The week ended on the visit day is the time reference for the employment status (employed / unemployed).
Month ended on the visit day is the time reference for job search.
The two years ended on the visit day represent the time reference for training of people who are unemployed and seeking a job.
Economically active population: Adult individuals, 15 years old or older, who are either employed or unemployed.
Economically inactive population: Individuals who are below 15 years old and individuals who are 15 years old or older but the definitions of employed and unemployed person are not applicable to them.
The results of LFS 2012 are not available in numbers, nor is there any publication of the distribution of Dubai’s population broken down by nationality for 2012.
Total population aged 15 and over residing in Dubai in 2012: 1,865,786 (https://www.dsc.gov.ae/Report/DSC_SYB_2012_01%20_%2003.pdf)
2. Institution which provides data
Dubai Statistics Centre (DSC).
3. Data availability
The results of Dubai Labour Force Surveys are available (in English and in Arabic) at:
https://www.dsc.gov.ae/Publication/نشرة%20القوى%20العاملة%202012%20انجليزي%20نهائي%20aa%2022.pdf
https://www.dsc.gov.ae/Publication/%D9%86%D8%B4%D8%B1%D8%A9%20%D8%A7%D9%84%D9%82%D9%88%D9%89%20%D8%A7%D9%84%D8%B9%D8%A7%D9%85%D9%84%D8%A9%202012%20%D8%B9%D8%B1%D8%A8%D9%8A%20%D9%86%D9%87%D8%A7%D8%A6%D9%8A.pdf
Some tables (in PDF format), definition of concepts and partial methodological indications are available in the LFS’ project page on DSC’s website (do not include 2012’s LFS)
https://www.dsc.gov.ae/en-us/Programs-Statistical-Surveys/Pages/Statistical-Project-details.aspx?ProjectId=21#DSC_Tab1
Last date of access: August 2015.
In case the links to the primary data source are broken, please refer to the new
DSC website until links to publications are restored.
|
|
Legislators and senior officials |
Professionals |
Technicians |
Clerks |
Services and Sales |
Elementary Occupations |
Craft & Related Workers |
Plant and machine operators |
Skilled agriculture and fishery workers |
Armed Forces |
Total |
|
Males |
11 |
19,3 |
25,5 |
10 |
18,1 |
1,7 |
0,4 |
2,1 |
0,3 |
11,6 |
100 |
| Emiratis |
Females |
9,8 |
23,1 |
28,9 |
30,2 |
6,7 |
0,7 |
0,3 |
0 |
0 |
0,4 |
100 |
| |
Total |
10,6 |
20,6 |
26,6 |
17 |
14,2 |
1,4 |
0,3 |
1,4 |
0,2 |
7,7 |
100 |
| |
Males |
7,7 |
13,5 |
10,5 |
4,3 |
6,6 |
15,9 |
29,4 |
11 |
1 |
0,1 |
100 |
| Non-Emiratis |
Females |
6,9 |
17,6 |
20 |
9,2 |
32,8 |
6,6 |
0,6 |
6,3 |
0 |
0 |
100 |
| |
Total |
7,6 |
14,3 |
12,2 |
5,2 |
11,2 |
14,2 |
24,2 |
10,2 |
0,8 |
0,1 |
100 |
| |
Males |
7,8 |
13,7 |
11,1 |
4,5 |
7 |
15,4 |
28,5 |
10,7 |
0,9 |
0,4 |
100 |
| Total |
Females |
7,2 |
18 |
20,7 |
10,9 |
30,7 |
6,1 |
0,6 |
5,8 |
0 |
0 |
100 |
|
Total |
7,7 |
14,5 |
12,8 |
5,7 |
11,3 |
13,7 |
23,4 |
9,8 |
0,8 |
0,3 |
100 |
Source: Labour Force Survey 2012
ANNEXED NOTE
1. Characteristics of data, definitions
DSC has conducted Labour Force Surveys on Dubai Emirate in 2008, 2009, 2011 and 2012.
Sample of LFS 2012: 2,560 households, distributed as follows: 1,100 Emirati households, 1,010 non-Emirati households; 450 collective households, and
900 workers from labour gatherings.”
The population taken into account is the population residing in Dubai. The survey results do not include the population aged 15 and above, working in Dubai but residing in other Emirates.
Date of reference: mid- 2012.
The time reference of the survey is:
Visit day is the time reference for the family personal data.
The week ended on the visit day is the time reference for the employment status (employed / unemployed).
Month ended on the visit day is the time reference for job search.
The two years ended on the visit day represent the time reference for training of people who are unemployed and seeking a job.
Economically active population: Adult individuals, 15 years old or older, who are either employed or unemployed.
Economically inactive population: Individuals who are below 15 years old and individuals who are 15 years old or older but the definitions of employed and unemployed person are not applicable to them.
The results of LFS 2012 are not available in numbers, nor is there any publication of the distribution of Dubai’s population broken down by nationality for 2012.
Total population aged 15 and over residing in Dubai in 2012: 1,865,786 (https://www.dsc.gov.ae/Report/DSC_SYB_2012_01%20_%2003.pdf)
2. Institution which provides data
Dubai Statistics Centre (DSC).
3. Data availability
The results of Dubai Labour Force Surveys are available (in English and in Arabic) at:
https://www.dsc.gov.ae/Publication/نشرة%20القوى%20العاملة%202012%20انجليزي%20نهائي%20aa%2022.pdf
https://www.dsc.gov.ae/Publication/%D9%86%D8%B4%D8%B1%D8%A9%20%D8%A7%D9%84%D9%82%D9%88%D9%89%20%D8%A7%D9%84%D8%B9%D8%A7%D9%85%D9%84%D8%A9%202012%20%D8%B9%D8%B1%D8%A8%D9%8A%20%D9%86%D9%87%D8%A7%D8%A6%D9%8A.pdf
Some tables (in PDF format), definition of concepts and partial methodological indications are available in the LFS’ project page on DSC’s website (do not include 2012’s LFS)
https://www.dsc.gov.ae/en-us/Programs-Statistical-Surveys/Pages/Statistical-Project-details.aspx?ProjectId=21#DSC_Tab1
Last date of access: August 2015.
In case the links to the primary data source are broken, please refer to the new
DSC website until links to publications are restored.
|
Males |
Females |
Total |
| Belgium |
132 |
145 |
277 |
| Bulgaria |
36 |
25 |
61 |
| Czech Republic |
31 |
15 |
46 |
| Denmark |
170 |
151 |
321 |
| Germany |
890 |
800 |
1,690 |
| Estonia |
4 |
2 |
6 |
| Ireland |
274 |
225 |
499 |
| Greece |
50 |
39 |
89 |
| Spain |
450 |
75 |
525 |
| France |
369 |
441 |
810 |
| Croatia |
10 |
7 |
17 |
| Italy |
139 |
135 |
274 |
| Cyprus |
56 |
52 |
108 |
| Latvia |
3 |
4 |
7 |
| Lithuania |
0 |
0 |
0 |
| Luxembourg |
9 |
8 |
17 |
| Hungary |
46 |
19 |
65 |
| Malta |
16 |
9 |
25 |
| Netherlands |
0 |
0 |
0 |
| Austria |
119 |
116 |
235 |
| Poland |
51 |
63 |
114 |
| Portugal |
15 |
20 |
35 |
| Romania |
103 |
80 |
183 |
| Slovenia |
8 |
7 |
15 |
| Slovakia |
33 |
18 |
51 |
| Finland |
52 |
26 |
78 |
| Sweden |
433 |
363 |
796 |
| United Kingdom |
6,530 |
4,925 |
11,455 |
| Iceland |
1 |
1 |
2 |
| Liechtenstein |
0 |
0 |
0 |
| Norway |
158 |
149 |
307 |
| Switzerland |
36 |
190 |
226 |
| Total UAE-borns in Europe |
10,224 |
8,110 |
18,334 |
Source: National censuses 2011
ANNEXED NOTES
1. Technical Notes and Definitions
The 2011 Census database is the result of a joint effort by the European Statistical System (ESS) to better disseminate the results of the Population and Housing Censuses in Europe, providing users with easy access to detailed census data that are structured in the same way and methodologically comparable between countries.
The data presented here are based on a set of European statistical legislation that provides key statistical definitions and defines the data and metadata to be produced.
The national census exercises are also undertaken following international guidelines and recommendations prepared by the United Nations in cooperation with Eurostat. This helps to ensure comparability of the data presented here.
The tool (the “Census Hub”) constructed for data dissemination is based on the concept of data sharing, where National Statistical Institutes (NSIs) provide access to their data according to standard processes, formats and technologies
while Eurostat provides the IT structure that allows users to quickly and flexibly specify, compile and extract data stored in the different national census databases.
Switzerland: The values do not refer to the total Swiss population but rather to the resident permanent population aged 15 years or older in private households.
Austria: For data privacy protection reasons, the statistical disclosure control method of \Target Swapping\” has been used on a part of the data. Therefore, in cell values <= 5 no reliable assertions can be made.”
Netherlands: the data presented here is taken from Eurostats database “Population on January 1st by age, sex and country of birth” [migr_pop3ctb].
Metadata referring to each EU member State’s census operation is available at:
https://ec.europa.eu/CensusHub2/metadata.do?method=loadMetadata
2. Institution which provides data
Eurostat.
3. Data availability
Data is compiled from Eurostats website:
http://ec.europa.eu/eurostat/web/main
Explanations on 2011′ harmonised census round, on the concept of the 2011 “census hub” and access to it:
http://ec.europa.eu/eurostat/web/population-and-housing-census/census-data/2011-census
Eurostats “census hub” data compilation device:
https://ec.europa.eu/CensusHub2/metadata.do?method=loadMetadata
Last date of access: 28 July 2015
|
Total born in UAE |
| Belgium |
277 |
| Bulgaria |
61 |
| Czech Republic |
46 |
| Denmark |
321 |
| Germany |
1,690 |
| Estonia |
6 |
| Ireland |
499 |
| Greece |
89 |
| Spain |
525 |
| France |
810 |
| Croatia |
17 |
| Italy |
274 |
| Cyprus |
108 |
| Latvia |
7 |
| Lithuania |
0 |
| Luxembourg |
17 |
| Hungary |
65 |
| Malta |
25 |
| Netherlands |
0 |
| Austria |
235 |
| Poland |
114 |
| Portugal |
35 |
| Romania |
183 |
| Slovenia |
15 |
| Slovakia |
51 |
| Finland |
78 |
| Sweden |
796 |
| United Kingdom |
11,455 |
| Iceland |
2 |
| Liechtenstein |
0 |
| Norway |
307 |
| Switzerland |
224 |
| Total UAE-borns in Europe |
18,332 |
Source: National censuses 2011
ANNEXED NOTES
1. Technical Notes and Definitions
The 2011 Census database is the result of a joint effort by the European Statistical System (ESS) to better disseminate the results of the Population and Housing Censuses in Europe, providing users with easy access to detailed census data that are structured in the same way and methodologically comparable between countries.
The data presented here are based on a set of European statistical legislation that provides key statistical definitions and defines the data and metadata to be produced.
The national census exercises are also undertaken following international guidelines and recommendations prepared by the United Nations in cooperation with Eurostat. This helps to ensure comparability of the data presented here.
The tool (the “Census Hub”) constructed for data dissemination is based on the concept of data sharing, where National Statistical Institutes (NSIs) provide access to their data according to standard processes, formats and technologies
while Eurostat provides the IT structure that allows users to quickly and flexibly specify, compile and extract data stored in the different national census databases.
Switzerland: The values do not refer to the total Swiss population but rather to the resident permanent population aged 15 years or older in private households.
Austria: For data privacy protection reasons, the statistical disclosure control method of \Target Swapping\” has been used on a part of the data. Therefore, in cell values <= 5 no reliable assertions can be made.”
Netherlands: the data presented here is taken from Eurostats database “Population on January 1st by age, sex and country of birth” [migr_pop3ctb].
Metadata referring to each EU member State’s census operation is available at:
https://ec.europa.eu/CensusHub2/metadata.do?method=loadMetadata
2. Institution which provides data
Eurostat.
3. Data availability
Data is compiled from Eurostats website:
http://ec.europa.eu/eurostat/web/main
Explanations on 2011′ harmonised census round, on the concept of the 2011 “census hub” and access to it:
http://ec.europa.eu/eurostat/web/population-and-housing-census/census-data/2011-census
Eurostats “census hub” data compilation device:
https://ec.europa.eu/CensusHub2/metadata.do?method=loadMetadata
Last date of access: 28 July 2015
|
Males |
Females |
Total |
| Belgium |
172 |
160 |
332 |
| Bulgaria |
19 |
14 |
33 |
| Czech Republic |
110 |
25 |
135 |
| Denmark |
129 |
122 |
251 |
| Germany |
1,970 |
1,310 |
3,280 |
| Estonia |
0 |
1 |
1 |
| Ireland |
1,145 |
869 |
2,014 |
| Greece |
226 |
214 |
440 |
| Spain |
210 |
205 |
415 |
| France |
1,350 |
1,262 |
2,612 |
| Croatia |
0 |
0 |
0 |
| Italy |
370 |
332 |
702 |
| Cyprus |
76 |
81 |
157 |
| Latvia |
4 |
1 |
5 |
| Lithuania |
0 |
0 |
0 |
| Luxembourg |
6 |
2 |
8 |
| Hungary |
177 |
111 |
288 |
| Malta |
12 |
14 |
26 |
| Netherlands |
0 |
0 |
0 |
| Austria |
250 |
191 |
441 |
| Poland |
198 |
108 |
306 |
| Portugal |
27 |
25 |
52 |
| Romania |
80 |
36 |
116 |
| Slovenia |
10 |
3 |
13 |
| Slovakia |
23 |
1 |
24 |
| Finland |
127 |
116 |
243 |
| Sweden |
998 |
879 |
1,877 |
| United Kingdom |
19,585 |
14,040 |
33,625 |
| Iceland |
4 |
5 |
9 |
| Liechtenstein |
0 |
0 |
0 |
| Norway |
222 |
202 |
424 |
| Switzerland |
96 |
186 |
282 |
| Total SA-borns in Europe |
27,596 |
20,515 |
48,111 |
Source: National censuses 2011
ANNEXED NOTES
1. Technical Notes and Definitions
The 2011 Census database is the result of a joint effort by the European Statistical System (ESS) to better disseminate the results of the Population and Housing Censuses in Europe, providing users with easy access to detailed census data that are structured in the same way and methodologically comparable between countries.
The data presented here are based on a set of European statistical legislation that provides key statistical definitions and defines the data and metadata to be produced.
The national census exercises are also undertaken following international guidelines and recommendations prepared by the United Nations in cooperation with Eurostat. This helps to ensure comparability of the data presented here.
The tool (the “Census Hub”) constructed for data dissemination is based on the concept of data sharing, where National Statistical Institutes (NSIs) provide access to their data according to standard processes, formats and technologies
while Eurostat provides the IT structure that allows users to quickly and flexibly specify, compile and extract data stored in the different national census databases.
Switzerland: The values do not refer to the total Swiss population but rather to the resident permanent population aged 15 years or older in private households.
Austria: For data privacy protection reasons, the statistical disclosure control method of \Target Swapping\” has been used on a part of the data. Therefore, in cell values <= 5 no reliable assertions can be made.”
Netherlands: the data presented here is taken from Eurostats database “Population on January 1st by age, sex and country of birth” [migr_pop3ctb].
Metadata referring to each EU member State’s census operation is available at:
https://ec.europa.eu/CensusHub2/metadata.do?method=loadMetadata
2. Institution which provides data
Eurostat.
3. Data availability
Data is compiled from Eurostats website:
http://ec.europa.eu/eurostat/web/main
Explanations on 2011′ harmonised census round, on the concept of the 2011 “census hub” and access to it:
http://ec.europa.eu/eurostat/web/population-and-housing-census/census-data/2011-census
Eurostats “census hub” data compilation device:
https://ec.europa.eu/CensusHub2/metadata.do?method=loadMetadata
Last date of access: 28 July 2015
|
Total born in Saudi Arabia |
| Belgium |
332 |
| Bulgaria |
33 |
| Czech Republic |
135 |
| Denmark |
251 |
| Germany |
3,290 |
| Estonia |
1 |
| Ireland |
2,014 |
| Greece |
440 |
| Spain |
410 |
| France |
2,612 |
| Croatia |
: |
| Italy |
702 |
| Cyprus |
157 |
| Latvia |
5 |
| Lithuania |
: |
| Luxembourg |
8 |
| Hungary |
288 |
| Malta |
26 |
| Netherlands |
: |
| Austria |
441 |
| Poland |
306 |
| Portugal |
52 |
| Romania |
116 |
| Slovenia |
13 |
| Slovakia |
24 |
| Finland |
243 |
| Sweden |
1,877 |
| United Kingdom |
33,630 |
| Iceland |
9 |
| Liechtenstein |
0 |
| Norway |
424 |
| Switzerland |
282 |
| Total SA-borns in Europe |
48,121 |
Source: National censuses 2011
ANNEXED NOTES
1. Technical Notes and Definitions
The 2011 Census database is the result of a joint effort by the European Statistical System (ESS) to better disseminate the results of the Population and Housing Censuses in Europe, providing users with easy access to detailed census data that are structured in the same way and methodologically comparable between countries.
The data presented here are based on a set of European statistical legislation that provides key statistical definitions and defines the data and metadata to be produced.
The national census exercises are also undertaken following international guidelines and recommendations prepared by the United Nations in cooperation with Eurostat. This helps to ensure comparability of the data presented here.
The tool (the “Census Hub”) constructed for data dissemination is based on the concept of data sharing, where National Statistical Institutes (NSIs) provide access to their data according to standard processes, formats and technologies
while Eurostat provides the IT structure that allows users to quickly and flexibly specify, compile and extract data stored in the different national census databases.
Switzerland: The values do not refer to the total Swiss population but rather to the resident permanent population aged 15 years or older in private households.
Austria: For data privacy protection reasons, the statistical disclosure control method of \Target Swapping\” has been used on a part of the data. Therefore, in cell values <= 5 no reliable assertions can be made.”
Netherlands: the data presented here is taken from Eurostats database “Population on January 1st by age, sex and country of birth” [migr_pop3ctb].
Metadata referring to each EU member State’s census operation is available at:
https://ec.europa.eu/CensusHub2/metadata.do?method=loadMetadata
2. Institution which provides data
Eurostat.
3. Data availability
Data is compiled from Eurostats website:
http://ec.europa.eu/eurostat/web/main
Explanations on 2011′ harmonised census round, on the concept of the 2011 “census hub” and access to it:
http://ec.europa.eu/eurostat/web/population-and-housing-census/census-data/2011-census
Eurostats “census hub” data compilation device:
https://ec.europa.eu/CensusHub2/metadata.do?method=loadMetadata
Last date of access: 28 July 2015
|
Males |
Females |
Total |
| Belgium |
20 |
14 |
34 |
| Bulgaria |
6 |
0 |
6 |
| Czech Republic |
8 |
5 |
13 |
| Denmark |
25 |
51 |
76 |
| Germany |
70 |
100 |
170 |
| Estonia |
1 |
0 |
1 |
| Ireland |
42 |
37 |
79 |
| Greece |
529 |
612 |
1,141 |
| Spain |
90 |
20 |
110 |
| France |
84 |
95 |
179 |
| Croatia |
0 |
0 |
0 |
| Italy |
27 |
35 |
62 |
| Cyprus |
4 |
3 |
7 |
| Latvia |
0 |
0 |
0 |
| Lithuania |
0 |
0 |
0 |
| Luxembourg |
1 |
2 |
3 |
| Hungary |
6 |
6 |
12 |
| Malta |
1 |
0 |
1 |
| Netherlands |
0 |
0 |
0 |
| Austria |
13 |
6 |
19 |
| Poland |
13 |
15 |
28 |
| Portugal |
1 |
10 |
11 |
| Romania |
25 |
17 |
42 |
| Slovenia |
2 |
1 |
3 |
| Slovakia |
1 |
0 |
1 |
| Finland |
8 |
4 |
12 |
| Sweden |
23 |
15 |
38 |
| United Kingdom |
1,580 |
940 |
2,520 |
| Iceland |
0 |
2 |
2 |
| Liechtenstein |
0 |
0 |
0 |
| Norway |
24 |
19 |
43 |
| Switzerland |
0 |
0 |
0 |
| Total Qatar-borns in Europe |
2,604 |
2,009 |
4,613 |
Source: National censuses 2011
ANNEXED NOTES
1. Technical Notes and Definitions
The 2011 Census database is the result of a joint effort by the European Statistical System (ESS) to better disseminate the results of the Population and Housing Censuses in Europe, providing users with easy access to detailed census data that are structured in the same way and methodologically comparable between countries.
The data presented here are based on a set of European statistical legislation that provides key statistical definitions and defines the data and metadata to be produced.
The national census exercises are also undertaken following international guidelines and recommendations prepared by the United Nations in cooperation with Eurostat. This helps to ensure comparability of the data presented here.
The tool (the “Census Hub”) constructed for data dissemination is based on the concept of data sharing, where National Statistical Institutes (NSIs) provide access to their data according to standard processes, formats and technologies
while Eurostat provides the IT structure that allows users to quickly and flexibly specify, compile and extract data stored in the different national census databases.
Switzerland: The values do not refer to the total Swiss population but rather to the resident permanent population aged 15 years or older in private households.
Austria: For data privacy protection reasons, the statistical disclosure control method of \Target Swapping\” has been used on a part of the data. Therefore, in cell values <= 5 no reliable assertions can be made.”
Netherlands: the data presented here is taken from Eurostats database “Population on January 1st by age, sex and country of birth” [migr_pop3ctb].
Metadata referring to each EU member State’s census operation is available at:
https://ec.europa.eu/CensusHub2/metadata.do?method=loadMetadata
2. Institution which provides data
Eurostat.
3. Data availability
Data is compiled from Eurostats website:
http://ec.europa.eu/eurostat/web/main
Explanations on 2011′ harmonised census round, on the concept of the 2011 “census hub” and access to it:
http://ec.europa.eu/eurostat/web/population-and-housing-census/census-data/2011-census
Eurostats “census hub” data compilation device:
https://ec.europa.eu/CensusHub2/metadata.do?method=loadMetadata
Last date of access: 28 July 2015
|
Total born in Qatar |
| Belgium |
34 |
| Bulgaria |
8 |
| Czech Republic |
13 |
| Denmark |
76 |
| Germany |
160 |
| Estonia |
1 |
| Ireland |
79 |
| Greece |
1,141 |
| Spain |
110 |
| France |
179 |
| Croatia |
0 |
| Italy |
62 |
| Cyprus |
7 |
| Latvia |
0 |
| Lithuania |
0 |
| Luxembourg |
3 |
| Hungary |
12 |
| Malta |
1 |
| Netherlands |
0 |
| Austria |
19 |
| Poland |
28 |
| Portugal |
11 |
| Romania |
42 |
| Slovenia |
3 |
| Slovakia |
1 |
| Finland |
12 |
| Sweden |
38 |
| United Kingdom |
2,520 |
| Iceland |
2 |
| Liechtenstein |
0 |
| Norway |
43 |
| Switzerland |
0 |
| Total Qatar-borns in Europe |
4,605 |
Source: National censuses 2011
ANNEXED NOTES
1. Technical Notes and Definitions
The 2011 Census database is the result of a joint effort by the European Statistical System (ESS) to better disseminate the results of the Population and Housing Censuses in Europe, providing users with easy access to detailed census data that are structured in the same way and methodologically comparable between countries.
The data presented here are based on a set of European statistical legislation that provides key statistical definitions and defines the data and metadata to be produced.
The national census exercises are also undertaken following international guidelines and recommendations prepared by the United Nations in cooperation with Eurostat. This helps to ensure comparability of the data presented here.
The tool (the “Census Hub”) constructed for data dissemination is based on the concept of data sharing, where National Statistical Institutes (NSIs) provide access to their data according to standard processes, formats and technologies
while Eurostat provides the IT structure that allows users to quickly and flexibly specify, compile and extract data stored in the different national census databases.
Switzerland: The values do not refer to the total Swiss population but rather to the resident permanent population aged 15 years or older in private households.
Austria: For data privacy protection reasons, the statistical disclosure control method of \Target Swapping\” has been used on a part of the data. Therefore, in cell values <= 5 no reliable assertions can be made.”
Netherlands: the data presented here is taken from Eurostats database “Population on January 1st by age, sex and country of birth” [migr_pop3ctb].
Metadata referring to each EU member State’s census operation is available at:
https://ec.europa.eu/CensusHub2/metadata.do?method=loadMetadata
2. Institution which provides data
Eurostat.
3. Data availability
Data is compiled from Eurostats website:
http://ec.europa.eu/eurostat/web/main
Explanations on 2011′ harmonised census round, on the concept of the 2011 “census hub” and access to it:
http://ec.europa.eu/eurostat/web/population-and-housing-census/census-data/2011-census
Eurostats “census hub” data compilation device:
https://ec.europa.eu/CensusHub2/metadata.do?method=loadMetadata
Last date of access: 28 July 2015
|
Males |
Females |
Total |
| Belgium |
15 |
9 |
24 |
| Bulgaria |
0 |
0 |
0 |
| Czech Republic |
0 |
0 |
0 |
| Denmark |
8 |
13 |
21 |
| Germany |
220 |
130 |
350 |
| Estonia |
0 |
0 |
0 |
| Ireland |
97 |
71 |
168 |
| Greece |
2 |
3 |
5 |
| Spain |
0 |
10 |
10 |
| France |
91 |
36 |
127 |
| Croatia |
0 |
0 |
0 |
| Italy |
36 |
35 |
71 |
| Cyprus |
11 |
14 |
25 |
| Latvia |
0 |
0 |
0 |
| Lithuania |
0 |
0 |
0 |
| Luxembourg |
0 |
1 |
1 |
| Hungary |
2 |
2 |
4 |
| Malta |
1 |
1 |
2 |
| Netherlands |
0 |
0 |
0 |
| Austria |
18 |
10 |
28 |
| Poland |
0 |
0 |
0 |
| Portugal |
1 |
3 |
4 |
| Romania |
0 |
0 |
0 |
| Slovenia |
2 |
0 |
2 |
| Slovakia |
0 |
3 |
3 |
| Finland |
0 |
0 |
0 |
| Sweden |
7 |
9 |
16 |
| United Kingdom |
1,745 |
1,450 |
3,195 |
| Iceland |
2 |
2 |
4 |
| Liechtenstein |
0 |
0 |
0 |
| Norway |
24 |
9 |
33 |
| Switzerland |
0 |
0 |
0 |
| Total Oman-borns in Europe |
2,282 |
1,811 |
4,093 |
Source: National censuses 2011
ANNEXED NOTES
1. Technical Notes and Definitions
The 2011 Census database is the result of a joint effort by the European Statistical System (ESS) to better disseminate the results of the Population and Housing Censuses in Europe, providing users with easy access to detailed census data that are structured in the same way and methodologically comparable between countries.
The data presented here are based on a set of European statistical legislation that provides key statistical definitions and defines the data and metadata to be produced.
The national census exercises are also undertaken following international guidelines and recommendations prepared by the United Nations in cooperation with Eurostat. This helps to ensure comparability of the data presented here.
The tool (the “Census Hub”) constructed for data dissemination is based on the concept of data sharing, where National Statistical Institutes (NSIs) provide access to their data according to standard processes, formats and technologies
while Eurostat provides the IT structure that allows users to quickly and flexibly specify, compile and extract data stored in the different national census databases.
Switzerland: The values do not refer to the total Swiss population but rather to the resident permanent population aged 15 years or older in private households.
Austria: For data privacy protection reasons, the statistical disclosure control method of \Target Swapping\” has been used on a part of the data. Therefore, in cell values <= 5 no reliable assertions can be made.”
Netherlands: the data presented here is taken from Eurostats database “Population on January 1st by age, sex and country of birth” [migr_pop3ctb].
Metadata referring to each EU member State’s census operation is available at:
https://ec.europa.eu/CensusHub2/metadata.do?method=loadMetadata
2. Institution which provides data
Eurostat.
3. Data availability
Data is compiled from Eurostats website:
http://ec.europa.eu/eurostat/web/main
Explanations on 2011′ harmonised census round, on the concept of the 2011 “census hub” and access to it:
http://ec.europa.eu/eurostat/web/population-and-housing-census/census-data/2011-census
Eurostats “census hub” data compilation device:
https://ec.europa.eu/CensusHub2/metadata.do?method=loadMetadata
Last date of access: 28 July 2015
| |
Total born in Oman |
| Belgium |
24 |
| Bulgaria |
0 |
| Czech Republic |
0 |
| Denmark |
21 |
| Germany |
350 |
| Estonia |
0 |
| Ireland |
168 |
| Greece |
5 |
| Spain |
10 |
| France |
127 |
| Croatia |
0 |
| Italy |
71 |
| Cyprus |
25 |
| Latvia |
0 |
| Lithuania |
0 |
| Luxembourg |
1 |
| Hungary |
4 |
| Malta |
2 |
| Netherlands |
0 |
| Austria |
28 |
| Poland |
0 |
| Portugal |
4 |
| Romania |
0 |
| Slovenia |
2 |
| Slovakia |
3 |
| Finland |
0 |
| Sweden |
16 |
| United Kingdom |
3,195 |
| Iceland |
4 |
| Liechtenstein |
0 |
| Norway |
33 |
| Switzerland |
0 |
| Total Oman-borns in Europe |
4,093 |
Source: National censuses 2011
ANNEXED NOTES
1. Technical Notes and Definitions
The 2011 Census database is the result of a joint effort by the European Statistical System (ESS) to better disseminate the results of the Population and Housing Censuses in Europe, providing users with easy access to detailed census data that are structured in the same way and methodologically comparable between countries.
The data presented here are based on a set of European statistical legislation that provides key statistical definitions and defines the data and metadata to be produced.
The national census exercises are also undertaken following international guidelines and recommendations prepared by the United Nations in cooperation with Eurostat. This helps to ensure comparability of the data presented here.
The tool (the “Census Hub”) constructed for data dissemination is based on the concept of data sharing, where National Statistical Institutes (NSIs) provide access to their data according to standard processes, formats and technologies
while Eurostat provides the IT structure that allows users to quickly and flexibly specify, compile and extract data stored in the different national census databases.
Switzerland: The values do not refer to the total Swiss population but rather to the resident permanent population aged 15 years or older in private households.
Austria: For data privacy protection reasons, the statistical disclosure control method of \Target Swapping\” has been used on a part of the data. Therefore, in cell values <= 5 no reliable assertions can be made.”
Netherlands: the data presented here is taken from Eurostats database “Population on January 1st by age, sex and country of birth” [migr_pop3ctb].
Metadata referring to each EU member State’s census operation is available at:
https://ec.europa.eu/CensusHub2/metadata.do?method=loadMetadata
2. Institution which provides data
Eurostat.
3. Data availability
Data is compiled from Eurostats website:
http://ec.europa.eu/eurostat/web/main
Explanations on 2011′ harmonised census round, on the concept of the 2011 “census hub” and access to it:
http://ec.europa.eu/eurostat/web/population-and-housing-census/census-data/2011-census
Eurostats “census hub” data compilation device:
https://ec.europa.eu/CensusHub2/metadata.do?method=loadMetadata
Last date of access: 28 July 2015
|
Males |
Females |
Total |
| Belgium |
152 |
69 |
221 |
| Bulgaria |
76 |
25 |
101 |
| Czech Republic |
84 |
35 |
119 |
| Denmark |
746 |
553 |
1,299 |
| Germany |
820 |
630 |
1,450 |
| Estonia |
5 |
0 |
5 |
| Ireland |
366 |
205 |
571 |
| Greece |
83 |
62 |
145 |
| Spain |
195 |
245 |
440 |
| France |
351 |
353 |
704 |
| Croatia |
16 |
8 |
24 |
| Italy |
249 |
185 |
434 |
| Cyprus |
81 |
57 |
138 |
| Latvia |
3 |
1 |
4 |
| Lithuania |
0 |
0 |
0 |
| Luxembourg |
6 |
7 |
13 |
| Hungary |
88 |
30 |
118 |
| Malta |
37 |
20 |
57 |
| Netherlands |
0 |
0 |
0 |
| Austria |
148 |
86 |
234 |
| Poland |
135 |
34 |
169 |
| Portugal |
8 |
5 |
13 |
| Romania |
144 |
39 |
183 |
| Slovenia |
7 |
4 |
11 |
| Slovakia |
34 |
17 |
51 |
| Finland |
72 |
35 |
107 |
| Sweden |
888 |
626 |
1,514 |
| United Kingdom |
7,705 |
5,370 |
13,075 |
| Iceland |
3 |
1 |
4 |
| Liechtenstein |
0 |
0 |
0 |
| Norway |
203 |
144 |
347 |
| Switzerland |
139 |
97 |
236 |
| Total Kuwait-borns in Europe |
12,844 |
8,943 |
21,787 |
Source: National censuses 2011
ANNEXED NOTES
1. Technical Notes and Definitions
The 2011 Census database is the result of a joint effort by the European Statistical System (ESS) to better disseminate the results of the Population and Housing Censuses in Europe, providing users with easy access to detailed census data that are structured in the same way and methodologically comparable between countries.
The data presented here are based on a set of European statistical legislation that provides key statistical definitions and defines the data and metadata to be produced.
The national census exercises are also undertaken following international guidelines and recommendations prepared by the United Nations in cooperation with Eurostat. This helps to ensure comparability of the data presented here.
The tool (the “Census Hub”) constructed for data dissemination is based on the concept of data sharing, where National Statistical Institutes (NSIs) provide access to their data according to standard processes, formats and technologies
while Eurostat provides the IT structure that allows users to quickly and flexibly specify, compile and extract data stored in the different national census databases.
Switzerland: The values do not refer to the total Swiss population but rather to the resident permanent population aged 15 years or older in private households.
Austria: For data privacy protection reasons, the statistical disclosure control method of \Target Swapping\” has been used on a part of the data. Therefore, in cell values <= 5 no reliable assertions can be made.”
Netherlands: the data presented here is taken from Eurostats database “Population on January 1st by age, sex and country of birth” [migr_pop3ctb].
Metadata referring to each EU member State’s census operation is available at:
https://ec.europa.eu/CensusHub2/metadata.do?method=loadMetadata
2. Institution which provides data
Eurostat.
3. Data availability
Data is compiled from Eurostats website:
http://ec.europa.eu/eurostat/web/main
Explanations on 2011′ harmonised census round, on the concept of the 2011 “census hub” and access to it:
http://ec.europa.eu/eurostat/web/population-and-housing-census/census-data/2011-census
Eurostats “census hub” data compilation device:
https://ec.europa.eu/CensusHub2/metadata.do?method=loadMetadata
Last date of access: 28 July 2015
|
Total born in Kuwait |
| Belgium |
221 |
| Bulgaria |
101 |
| Czech Republic |
119 |
| Denmark |
1,299 |
| Germany |
1,450 |
| Estonia |
5 |
| Ireland |
571 |
| Greece |
145 |
| Spain |
435 |
| France |
705 |
| Croatia |
24 |
| Italy |
434 |
| Cyprus |
138 |
| Latvia |
4 |
| Lithuania |
0 |
| Luxembourg |
13 |
| Hungary |
118 |
| Malta |
57 |
| Netherlands |
0 |
| Austria |
234 |
| Poland |
168 |
| Portugal |
13 |
| Romania |
183 |
| Slovenia |
11 |
| Slovakia |
51 |
| Finland |
107 |
| Sweden |
1,514 |
| United Kingdom |
13,075 |
| Iceland |
4 |
| Liechtenstein |
0 |
| Norway |
347 |
| Switzerland |
235 |
| Total Kuwait-borns in Europe |
21,781 |
Source: National censuses 2011
ANNEXED NOTES
1. Technical Notes and Definitions
The 2011 Census database is the result of a joint effort by the European Statistical System (ESS) to better disseminate the results of the Population and Housing Censuses in Europe, providing users with easy access to detailed census data that are structured in the same way and methodologically comparable between countries.
The data presented here are based on a set of European statistical legislation that provides key statistical definitions and defines the data and metadata to be produced.
The national census exercises are also undertaken following international guidelines and recommendations prepared by the United Nations in cooperation with Eurostat. This helps to ensure comparability of the data presented here.
The tool (the “Census Hub”) constructed for data dissemination is based on the concept of data sharing, where National Statistical Institutes (NSIs) provide access to their data according to standard processes, formats and technologies
while Eurostat provides the IT structure that allows users to quickly and flexibly specify, compile and extract data stored in the different national census databases.
Switzerland: The values do not refer to the total Swiss population but rather to the resident permanent population aged 15 years or older in private households.
Austria: For data privacy protection reasons, the statistical disclosure control method of \Target Swapping\” has been used on a part of the data. Therefore, in cell values <= 5 no reliable assertions can be made.”
Netherlands: the data presented here is taken from Eurostats database “Population on January 1st by age, sex and country of birth” [migr_pop3ctb].
Metadata referring to each EU member State’s census operation is available at:
https://ec.europa.eu/CensusHub2/metadata.do?method=loadMetadata
2. Institution which provides data
Eurostat.
3. Data availability
Data is compiled from Eurostats website:
http://ec.europa.eu/eurostat/web/main
Explanations on 2011′ harmonised census round, on the concept of the 2011 “census hub” and access to it:
http://ec.europa.eu/eurostat/web/population-and-housing-census/census-data/2011-census
Eurostats “census hub” data compilation device:
https://ec.europa.eu/CensusHub2/metadata.do?method=loadMetadata
Last date of access: 28 July 2015
|
Males |
Females |
Total |
| Belgium |
30 |
25 |
55 |
| Bulgaria |
4 |
4 |
8 |
| Czech Republic |
12 |
2 |
14 |
| Denmark |
41 |
39 |
80 |
| Germany |
40 |
50 |
90 |
| Estonia |
0 |
1 |
1 |
| Ireland |
97 |
104 |
201 |
| Greece |
15 |
9 |
24 |
| Spain |
20 |
40 |
60 |
| France |
96 |
61 |
157 |
| Croatia |
0 |
0 |
0 |
| Italy |
65 |
90 |
155 |
| Cyprus |
23 |
31 |
54 |
| Latvia |
0 |
2 |
2 |
| Lithuania |
0 |
0 |
0 |
| Luxembourg |
1 |
1 |
2 |
| Hungary |
6 |
5 |
11 |
| Malta |
2 |
0 |
2 |
| Netherlands |
0 |
0 |
0 |
| Austria |
7 |
9 |
16 |
| Poland |
0 |
0 |
0 |
| Portugal |
16 |
17 |
33 |
| Romania |
0 |
3 |
3 |
| Slovenia |
0 |
0 |
0 |
| Slovakia |
9 |
4 |
13 |
| Finland |
11 |
4 |
15 |
| Sweden |
29 |
7 |
36 |
| United Kingdom |
3,020 |
2,805 |
5,825 |
| Iceland |
1 |
0 |
1 |
| Liechtenstein |
0 |
0 |
0 |
| Norway |
12 |
15 |
27 |
| Switzerland |
0 |
254 |
335 |
| Total Bahrain-borns in Europe |
3,557 |
3,582 |
7,220 |
Source: National censuses 2011
ANNEXED NOTES
1. Technical Notes and Definitions
The 2011 Census database is the result of a joint effort by the European Statistical System (ESS) to better disseminate the results of the Population and Housing Censuses in Europe, providing users with easy access to detailed census data that are structured in the same way and methodologically comparable between countries.
The data presented here are based on a set of European statistical legislation that provides key statistical definitions and defines the data and metadata to be produced.
The national census exercises are also undertaken following international guidelines and recommendations prepared by the United Nations in cooperation with Eurostat. This helps to ensure comparability of the data presented here.
The tool (the “Census Hub”) constructed for data dissemination is based on the concept of data sharing, where National Statistical Institutes (NSIs) provide access to their data according to standard processes, formats and technologies
while Eurostat provides the IT structure that allows users to quickly and flexibly specify, compile and extract data stored in the different national census databases.
Switzerland: The values do not refer to the total Swiss population but rather to the resident permanent population aged 15 years or older in private households.
Austria: For data privacy protection reasons, the statistical disclosure control method of \Target Swapping\” has been used on a part of the data. Therefore, in cell values <= 5 no reliable assertions can be made.”
Netherlands: the data presented here is taken from Eurostats database “Population on January 1st by age, sex and country of birth” [migr_pop3ctb].
Metadata referring to each EU member State’s census operation is available at:
https://ec.europa.eu/CensusHub2/metadata.do?method=loadMetadata
2. Institution which provides data
Eurostat.
3. Data availability
Data is compiled from Eurostats website:
http://ec.europa.eu/eurostat/web/main
Explanations on 2011′ harmonised census round, on the concept of the 2011 “census hub” and access to it:
http://ec.europa.eu/eurostat/web/population-and-housing-census/census-data/2011-census
Eurostats “census hub” data compilation device:
https://ec.europa.eu/CensusHub2/metadata.do?method=loadMetadata
Last date of access: 28 July 2015
|
Total born in Bahrain |
| Belgium |
55 |
| Bulgaria |
8 |
| Czech Republic |
14 |
| Denmark |
80 |
| Germany |
90 |
| Estonia |
1 |
| Ireland |
201 |
| Greece |
24 |
| Spain |
60 |
| France |
157 |
| Croatia |
0 |
| Italy |
155 |
| Cyprus |
54 |
| Latvia |
2 |
| Lithuania |
0 |
| Luxembourg |
2 |
| Hungary |
11 |
| Malta |
2 |
| Netherlands |
0 |
| Austria |
16 |
| Poland |
0 |
| Portugal |
33 |
| Romania |
3 |
| Slovenia |
0 |
| Slovakia |
13 |
| Finland |
15 |
| Sweden |
36 |
| United Kingdom |
5,825 |
| Iceland |
1 |
| Liechtenstein |
0 |
| Norway |
27 |
| Switzerland |
335 |
| Total born in Bahrain |
7,220 |
Source: National censuses 2011
ANNEXED NOTES
1. Technical Notes and Definitions
The 2011 Census database is the result of a joint effort by the European Statistical System (ESS) to better disseminate the results of the Population and Housing Censuses in Europe, providing users with easy access to detailed census data that are structured in the same way and methodologically comparable between countries.
The data presented here are based on a set of European statistical legislation that provides key statistical definitions and defines the data and metadata to be produced.
The national census exercises are also undertaken following international guidelines and recommendations prepared by the United Nations in cooperation with Eurostat. This helps to ensure comparability of the data presented here.
The tool (the “Census Hub”) constructed for data dissemination is based on the concept of data sharing, where National Statistical Institutes (NSIs) provide access to their data according to standard processes, formats and technologies
while Eurostat provides the IT structure that allows users to quickly and flexibly specify, compile and extract data stored in the different national census databases.
Switzerland: The values do not refer to the total Swiss population but rather to the resident permanent population aged 15 years or older in private households.
Austria: For data privacy protection reasons, the statistical disclosure control method of \Target Swapping\” has been used on a part of the data. Therefore, in cell values <= 5 no reliable assertions can be made.”
Netherlands: the data presented here is taken from Eurostats database “Population on January 1st by age, sex and country of birth” [migr_pop3ctb].
Metadata referring to each EU member State’s census operation is available at:
https://ec.europa.eu/CensusHub2/metadata.do?method=loadMetadata
2. Institution which provides data
Eurostat.
3. Data availability
Data is compiled from Eurostats website:
http://ec.europa.eu/eurostat/web/main
Explanations on 2011′ harmonised census round, on the concept of the 2011 “census hub” and access to it:
http://ec.europa.eu/eurostat/web/population-and-housing-census/census-data/2011-census
Eurostats “census hub” data compilation device:
https://ec.europa.eu/CensusHub2/metadata.do?method=loadMetadata
Last date of access: 28 July 2015
|
Changes of sponsorship |
| Agriculture, Forests, Hunting and Fishing |
57,944 |
| Mines, Oil, Gas and Quarries |
2,190 |
| Manufacturing industries |
246,279 |
| Electricity, Gas and Water |
3,120 |
| Construction |
1,557,022 |
| Retails and Hotels |
741,844 |
| Transports and Storage |
84,382 |
| Finance, Insurance, Real estate services and Businesses |
38,321 |
| Collective, Social, and Personal services |
221,470 |
| Total |
2,952,572 |
Source: Ministry of Labour
1. Definition
All foreign residents in Saudi Arabia are under the responsibility of a local “sponsor”, usually the employer. Only certain categories of investors are spared the obligation.
The Saudi Labour Law has provisions allowing the worker to change sponsor. However, the procedure was conditionned to obtaining a Non-Objection Certificate from the first sponsor.
Since the onset of the Nitaqat (“ranges”, “zones”) campaign of Saudisation of the work force in September 2011, which classifies private sector companies by “range” based on the
Saudisation performance, changes of sponsor have been made easier for the workers in companies displaying the poorest rates of Saudisation (classified in “red” and “yellow” categories).
Workers in these categories can now freely join sponsors whose companies are in highest saudisation performance’ categories (“Green” and “Premium” or “Excellent”), without NOC from previous sponsor.
Since September 2014, the obligation for a worker to stay a minimum of two years with a sponsor before applying for sponsorship’ change was repealed.
2013′ figure is notably higher than previous ones as a result of the “correction campaign” or amnesty period run by the government from April 3 to November 3, 2013.
Ahead of a crackdown on irregular workers/ sojourners planned for November 4, 2013, the amnesty was meant to allow workers to sort out their administrative situation:
renew expired documents; register their current employer as their sponsor; register changes in profession and in activity sector, etc., or leave without paying a penalty.
2. Institution which provides data
Ministry of Labour
3. Data availability
The figures are published in the Ministry of Labour’s 2013 Statistical Yearbook (in Arabic).
http://portal.mol.gov.sa/ar/Statistics/Documents/%D8%A7%D9%84%D9%83%D8%AA%D8%A7%D8%A8%20%D8%A7%D9%84%D8%A7%D8%AD%D8%B5%D8%A7%D8%A6%D9%8A%202013.pdf
Last date of access: July 2015.
| Occupation of permit holder |
2013 |
| Managers and Business Managers |
17,759 |
| Specialists in Scientific, Technical and Humanities Fields |
574,031 |
| Technicians in Scientific, Technical and Humanities Fields |
541,819 |
| Clerical Workers |
21,724 |
| Sales Persons |
224,624 |
| Service Persons |
2,093,041 |
| Agriculture, Animal Husbandry and Fishing |
122,665 |
| Industrial, Chemical and Food Industries |
213,935 |
| Engineering Support |
3,063,833 |
| Non stated |
1,368 |
| TOTAL |
6,874,799 |
Source: Ministry of Labour
1. Definitions
Classification used for occupations is adapted from ISCO 1988.
2. Data collection methodology
The issuance of the residency and work permits begins with filing an application with the Ministry of Labor.
After its approval, the Ministry of Labor forwards the application to the Ministry of Interior for the issuance of the residency permit.
3. Institution which provides data
Ministry of Labour
4. Data availability
Published in Ministry of Labour’s Statistical Yearbooks
MoL Yearbooks (in Arabic) are available online at http://portal.mol.gov.sa/ar/Statistics/Pages/default.aspx (all issues since 2004)
2013’s Yearbook:
http://portal.mol.gov.sa/ar/Statistics/Documents/%D8%A7%D9%84%D9%83%D8%AA%D8%A7%D8%A8%20%D8%A7%D9%84%D8%A7%D8%AD%D8%B5%D8%A7%D8%A6%D9%8A%202013.pdf
Last date of access: July 2015.
| Governorate |
Labour permits |
| Riyadh |
2,539,800 |
| Makkah |
1,521,470 |
| Madinah |
247,681 |
| Al-Qasseem |
372,031 |
| Eastern |
1,449,990 |
| Assir |
228,113 |
| Hail |
107,468 |
| Tabouk |
53,484 |
| Al-Baha |
34,610 |
| Northern Border |
34,826 |
| Al-Jouf |
56,575 |
| Jazan |
84,458 |
| Najran |
144,293 |
| Total |
6,874,799 |
Source: Ministry of Labour
1. Definitions
Classification used for economic activity is adapted from ISIC 3.1
2. Data collection methodology
The issuance of the residency and work permits begins with filing an application with the Ministry of Labor.
After its approval, the Ministry of Labor forwards the application to the Ministry of Interior for the issuance of the residency permit.
3. Institution which provides data
Ministry of Labour
4. Data availability
Published in Ministry of Labour’s Statistical Yearbooks
MoL Yearbooks (in Arabic) are available online at http://portal.mol.gov.sa/ar/Statistics/Pages/default.aspx (all issues since 2004)
2013’s Yearbook:
http://portal.mol.gov.sa/ar/Statistics/Documents/%D8%A7%D9%84%D9%83%D8%AA%D8%A7%D8%A8%20%D8%A7%D9%84%D8%A7%D8%AD%D8%B5%D8%A7%D8%A6%D9%8A%202013.pdf
Last date of access: July 2015.
| Economic activity sector of permit holder |
Work permits |
| Agriculture, Forests, Hunting and Fishing |
85,919 |
| Mines, Oil, Gas and Quarries |
22,318 |
| Manufacturing industries |
671,155 |
| Electricity, Gas and Water |
11,787 |
| Construction |
3,784,677 |
| Retails and Hotels |
1,397,951 |
| Transports and Storage |
239,054 |
| Finance, Insurance, Real estate services and Businesses |
109,538 |
| Collective, Social, and Personal services |
550,377 |
| Non stated |
2,023 |
| Total |
6,874,799 |
Source: Ministry of Labour
1. Definitions
Classification used for economic activity is adapted from ISIC 3.1
2. Data collection methodology
The issuance of the residency and work permits begins with filing an application with the Ministry of Labor.
After its approval, the Ministry of Labor forwards the application to the Ministry of Interior for the issuance of the residency permit.
3. Institution which provides data
Ministry of Labour
4. Data availability
Published in Ministry of Labour’s Statistical Yearbooks
MoL Yearbooks (in Arabic) are available online at http://portal.mol.gov.sa/ar/Statistics/Pages/default.aspx (all issues since 2004)
2013’s Yearbook:
http://portal.mol.gov.sa/ar/Statistics/Documents/%D8%A7%D9%84%D9%83%D8%AA%D8%A7%D8%A8%20%D8%A7%D9%84%D8%A7%D8%AD%D8%B5%D8%A7%D8%A6%D9%8A%202013.pdf
Last date of access: July 2015.
| Occupation of permit holder |
2012 |
| Managers and Business Managers |
5,783 |
| Specialists in Scientific, Technical and Humanities Fields |
346,015 |
| Technicians in Scientific, Technical and Humanities Fields |
355,758 |
| Clerical Workers |
4,655 |
| Sales Persons |
96,774 |
| Service Persons |
1,476,851 |
| Agriculture, Animal Husbandry and Fishing |
104,082 |
| Industrial, Chemical and Food Industries |
157,549 |
| Engineering Support |
2,262,432 |
| Non stated |
1,196 |
| TOTAL |
4,811,095 |
Source: Ministry of Labour
1. Definitions
Classification used for occupations is adapted from ISCO 1988.
2. Data collection methodology
The issuance of the residency and work permits begins with filing an application with the Ministry of Labor.
After its approval, the Ministry of Labor forwards the application to the Ministry of Interior for the issuance of the residency permit.
3. Institution which provides data
Ministry of Labour
4. Data availability
Published in Ministry of Labour’s Statistical Yearbooks
MoL Yearbooks (in Arabic) are available online at http://portal.mol.gov.sa/ar/Statistics/Pages/default.aspx (all issues since 2004)
2012’s Yearbook:
http://portal.mol.gov.sa/ar/Statistics/Pages/%D8%A7%D9%84%D9%83%D8%AA%D8%A7%D8%A8_%D8%A7%D9%84%D8%A7%D8%AD%D8%B5%D8%A7%D8%A6%D9%8A_%D8%A7%D9%84%D8%B3%D9%86%D9%88%D9%8A_%D9%84%D8%B9%D8%A7%D9%85_14331434%D9%87%D9%80-2012%D9%85.aspx
Last date of access: July 2015.
| Governorate |
Labour permits |
| Riyadh |
1,692,236 |
| Makkah |
957,245 |
| Madinah |
163,231 |
| Al-Qasseem |
293,953 |
| Eastern |
1,146,432 |
| Assir |
157,872 |
| Hail |
96,862 |
| Tabouk |
43,694 |
| Al-Baha |
26,390 |
| Northern Border |
22,963 |
| Al-Jouf |
44,542 |
| Jazan |
47,987 |
| Najran |
117,688 |
| Total |
4,811,095 |
Source: Ministry of Labour
1. Definitions
Classification used for economic activity is adapted from ISIC 3.1
2. Data collection methodology
The issuance of the residency and work permits begins with filing an application with the Ministry of Labor.
After its approval, the Ministry of Labor forwards the application to the Ministry of Interior for the issuance of the residency permit.
3. Institution which provides data
Ministry of Labour
4. Data availability
Published in Ministry of Labour’s Statistical Yearbooks
MoL Yearbooks (in Arabic) are available online at http://portal.mol.gov.sa/ar/Statistics/Pages/default.aspx (all issues since 2004)
2012’s Yearbook:
http://portal.mol.gov.sa/ar/Statistics/Documents/%D8%A7%D9%84%D9%83%D8%AA%D8%A7%D8%A8%20%D8%A7%D9%84%D8%A7%D8%AD%D8%B5%D8%A7%D8%A6%D9%8A%20%D8%A7%D9%84%D8%B3%D9%86%D9%88%D9%8A%20%D9%84%D8%B9%D8%A7%D9%85%202012%D9%85%20.pdf
Last date of access: July 2015.
| Economic activity sector of work permit’ holder |
year |
| 2010 |
2011 |
| Agriculture, Forests, Hunting and Fishing |
97,414 |
135,689 |
| Mines, Oil, Gas and Quarries |
13,691 |
11,355 |
| Manufacturing industries |
342,181 |
418,885 |
| Electricity, Gas and Water |
10,483 |
7,340 |
| Construction |
1,762,186 |
2,263,656 |
| Retails and Hotels |
636,953 |
691,985 |
| Transports and Storage |
92,733 |
133,215 |
| Finance, Insurance, Real estate services and Businesses |
51,272 |
55,550 |
| Collective, Social, and Personal services |
323,033 |
370,418 |
| Non stated |
15,684 |
0 |
| TOTAL |
3,345,630 |
4,088,093 |
Source: Ministry of Labour
1. Definitions
Classification used for economic activity is adapted from ISIC 3.1
2. Data collection methodology
The issuance of the residency and work permits begins with filing an application with the Ministry of Labor.
After its approval, the Ministry of Labor forwards the application to the Ministry of Interior for the issuance of the residency permit.
3. Institution which provides data
Ministry of Labour
4. Data availability
Published in Ministry of Labour’s Statistical Yearbooks
MoL Yearbooks (in Arabic) are available online at http://portal.mol.gov.sa/ar/Statistics/Pages/default.aspx (all issues since 2004)
Date of access: May 2013.
|
Males |
Females |
Total |
| Arab countries |
280,175 |
5,794 |
285,969 |
| Non-Arab Asian countries |
680,539 |
27,752 |
708,291 |
| Non-Arab African countries |
5,229 |
3,049 |
8,278 |
| South America |
639 |
7 |
646 |
| North America |
4,804 |
630 |
5,434 |
| Europe |
8,626 |
1,264 |
9,890 |
| Oceania |
633 |
100 |
733 |
| Others |
34 |
0 |
34 |
| Total |
980,679 |
38,596 |
1,019,275 |
Source: Ministry of Labour
1. Definitions
The labour visa allows the worker to enter Saudi Arabia. It is issued by the Ministry of Foreign Affairs after Ministry of Labour issues its agreement.
In order to employ workers from abroad, the sponsoring company must first file a “Block Visa” request with the Ministry of Labor, requesting pre-approval to sponsor foreign employees.
Once the Block Visa request is approved, the sponsoring company in Saudi Arabia should obtain a visa authorization number and an electronic power of attorney authorized by the Ministry of Foreign Affairs in Saudi Arabia.
Foreign nationals may then apply for work visas through Saudi consular posts in their country of residence. Several documents are required before issuance of work visas, including medical certificate.
Therefore, work visas are more than the actual workers present in the country and granted labour permits, as some eventually do not terminate the procedure, or are rejected at a later stage (entry visa; residency procedures…).
Temporary or seasonal visas are alloted for short-term and limited employment duration, for example for the provision of sevices during the Hajj season in Makkah and Madina, or in agriculture.
2. Institution which provides data
Ministry of Labour of Saudi Arabia (http://portal.mol.gov.sa/Sites/default.aspx)
3. Data availability
Published in Ministry of Labour’s Statistical Yearbooks
MoL Yearbooks (in Arabic, PDF format) are available online at http://portal.mol.gov.sa/ar/Statistics/Pages/default.aspx?m=2
(Issues 2004 to 2013)
Date of access: July 2015
| reference number of permit |
type/ purpose of permit |
2010 |
2011 |
2012 |
2013 |
| Number of expired residency holders |
% |
Number of expired residency holders |
% |
Number of expired residency holders |
% |
Number of expired residency holders |
% |
| 14 |
Temporary permits |
527 |
14.8 |
950 |
16.7 |
1,255 |
13.1 |
1,929 |
11.8 |
| 17 |
Governmental sector permits |
52 |
1.5 |
52 |
0.9 |
55 |
0.6 |
69 |
0.4 |
| 18 |
Private sector permits |
1,192 |
33.6 |
1,383 |
24.3 |
2,041 |
21.3 |
3,387 |
20.8 |
| 19 |
Business |
0 |
0.0 |
0 |
0.0 |
0 |
0.0 |
1 |
0.0 |
| 20 |
Domestic help |
1,483 |
41.8 |
2,973 |
52.2 |
5,674 |
59.2 |
9,996 |
61.4 |
| 22 |
Dependant permits |
278 |
7.8 |
328 |
5.8 |
532 |
5.5 |
891 |
5.5 |
| 23 |
Study |
0 |
0.0 |
0 |
0.0 |
2 |
0.0 |
0 |
0.0 |
| 24 |
Self residence permits |
17 |
0.5 |
9 |
0.2 |
30 |
0.3 |
15 |
0.1 |
| TOTAL |
3,549 |
100 |
5,695 |
100 |
9,589 |
100 |
16,288 |
100 |
Source: Ministry of Interior
ANNEXED NOTE
1. Definitions
The figures refer to foreign residents who are still living in Kuwait at the end of the reference year, but were found contravening the law on residency by staying beyond the period of validity of their residency document.
Residency procedures do not apply to nationals of other GCC countries.
The bidoun, a stateless population, are not included in the residency documents holders.
Dependent permit (number 22): spouse, children or elderly dependent relatives can join visa holder (sponsor) in Kuwait, if the expatriate has obtained a residency and is earning a minimum of 450 KD for public sector employees and 650 for private sector employees.
A working wife cannot sponsor her husband as a dependent. Also, sons over the age of 21 years cannot be sponsored as dependants, though adult daughters and parents may be permitted. Dependent family members are not allowed to work on a Dependent Visa, unless they transfer it into a work visa under Kuwaiti sponsorship. This can be done only after 6 to 12 months of holding a dependent visa.
Every children including new born babies must hold a residency permit. The application for the infant’s residence must be made within 60 days of the birth
The Dependent Visa holder is permitted to stay as long as the sponsor holds a valid visa.
Self residence permit: Expatriates may sponsor themselves under article 24 of the regulations and obtain a residence for two to five years under several conditions
(among which: being aged 60 and more, having worked no less than 25 years in Kuwait, owning a capital of 10000 KD at least; being able to produce a certificate of good conduct, being effectively residing in Kuwait with his/her family, etc.).
This form of residence can be renewed upon expiry. Self-sponsored expatriates may sponsor their wives and children.
Permits 17, 18, 19 and 20 are only granted after Ministry of Labour issues a work permit.
2. Institution which provides data
Ministry of Interior (MoI) and Central Statistical Bureau (CSB), Ministry of Planning.
3. Period of data coverage
December 31st, given years.
4. Data availability
The present data is taken from the report “Migration Statistics 2013”, published by the CSB.
The report reproduces Ministry of Interior’s (Directorate of Migration’s) figures of permits granted to foreign residents by type/ purpose of permit, sex and regional origin of holder, for the years 2010 to 2013.
The report (in Arabic, PDF format with Excel tables) is available on CSB’s website (Population Statistics, then Migration Statistics)
http://www.csb.gov.kw/Socan_Statistic.aspx?ID=56
Date of access: May 2015.
|
2010 |
2011 |
2012 |
2013 |
| Nationality group |
Number of expired residency holders |
% |
Number of expired residency holders |
% |
Number of expired residency holders |
% |
Number of expired residency holders |
% |
| Arab countries |
659 |
18.6 |
809 |
14.2 |
1,226 |
12.8 |
2,329 |
14.3 |
| Non-Arab Asian countries |
2,774 |
78.2 |
4,341 |
76.2 |
7,053 |
73.6 |
10,536 |
64.7 |
| Non-Arab African countries |
79 |
2.2 |
485 |
8.5 |
1,261 |
13.2 |
3,349 |
20.6 |
| Europe |
5 |
0.1 |
12 |
0.2 |
8 |
0.1 |
15 |
0.1 |
| North America |
23 |
0.6 |
31 |
0.5 |
36 |
0.4 |
35 |
0.2 |
| Central and South America |
5 |
0.1 |
2 |
0.0 |
5 |
0.1 |
13 |
0.1 |
| Australia and Oceania |
3 |
0.1 |
15 |
0.3 |
0 |
0.0 |
11 |
0.1 |
| Other |
1 |
0.0 |
0 |
0.0 |
0 |
0.0 |
0 |
0.0 |
| Total |
3,549 |
100 |
5,695 |
100 |
9,589 |
100 |
16,288 |
100 |
Source: Ministry of Interior
ANNEXED NOTE
1. Definitions
The figures refer to foreign residents who are still living in Kuwait at the end of the reference year, but were found contravening the law on residency by staying beyond the period of validity of their residency document.
Residency procedures do not apply to nationals of other GCC countries.
The bidoun, a stateless population, are not included in the residency documents holders.
The figures concern previous holders of all categories of residency permits: labour (number 14-temporary; 17- government labour; 18- private sector labour; 19- business; 20- domestic labour)
and other categories (22- family dependents; 23- student; 24- self-sponsorship).
2. Institution which provides data
Ministry of Interior (MoI) and Central Statistical Bureau (CSB), Ministry of Planning.
3. Period of data coverage
December 31st, given years.
4. Data availability
The present data is taken from the report “Migration Statistics 2013”, published by the CSB.
The report reproduces Ministry of Interior’s (Directorate of Migration’s) figures of permits granted to foreign residents by type/ purpose of permit, sex and regional origin of holder, for the years 2010 to 2013.
The report (in Arabic, PDF format with Excel tables) is available on CSB’s website (Population Statistics, then Migration Statistics)
http://www.csb.gov.kw/Socan_Statistic.aspx?ID=56
Date of access: May 2015.
| reference of permit |
14 |
17-18-19 |
20 |
22 |
23-24 |
Total permits |
| type/ purpose |
Temporary |
Labour |
Domestic help |
Dependant |
Other permits |
| of permit |
| 2001 |
51,962 |
46,739 |
45,482 |
9,130 |
1,654 |
154,967 |
| 2002 |
83,019 |
53,580 |
37,850 |
9,108 |
1,448 |
185,005 |
| 2003 |
79,346 |
101,465 |
35,692 |
10,881 |
700 |
228,084 |
| 2004 |
190,301 |
128,584 |
106,599 |
13,582 |
512 |
439,578 |
| 2005 |
229,338 |
162,216 |
115,128 |
15,878 |
540 |
523,100 |
| 2006 |
194,504 |
163,559 |
118,343 |
14,167 |
430 |
491,003 |
| 2007 |
103,754 |
94,473 |
112,784 |
12,413 |
468 |
323,892 |
| 2008 |
65,056 |
89,370 |
92,301 |
12,588 |
215 |
259,530 |
| 2009 |
68,101 |
95,918 |
78,480 |
9,906 |
107 |
252,512 |
| 2010 |
99,533 |
129,640 |
82,170 |
8,451 |
199 |
319,993 |
| 2011 |
73,261 |
64,771 |
62,502 |
6,886 |
147 |
207,567 |
| 2012 |
68,392 |
57,431 |
45,200 |
7,512 |
103 |
178,638 |
| 2013 |
54,422 |
43,819 |
26,112 |
12,437 |
63 |
136,853 |
Source: Ministry of Interior’s records
ANNEXED NOTE
1. Definitions
The table refers to all types of residency permits, i.e. granted under articles 14, 17, 18, 19, 20, 22, 23, 24 of the immigration regulations, cancelled during the given years.
A residence visa is cancelled if the holder leaves Kuwait for a continuous period of six months, after termination of his employment period or not. The only exceptions are for those who:
· Are studying abroad
· Are receiving necessary treatment abroad, or
· Are required by virtue of their work to be abroad,
In all three cases, permission has to be obtained before leaving Kuwait.
The bidoun, a stateless population, are not included in the residency documents holders.
Residency procedures do not apply to GCC nationals.
2. Institution which provides data
Ministry of Interior (MoI) and Central Statistical Bureau (CSB), Ministry of Planning.
3. Period of data coverage
January 1st- December 31st, given years
4. Data availability
a- 2005-2009′ data is published in MoI’ 2009 Statistical Yearbook, in Chapter “Immigration statistics”, available online at: http://www.moi.gov.kw/portal/varabic/statistics/stats.htm
Last date of access: Sept.3rd, 2013.
b- 2007-2011′ data is tabulated in MoI’ 2011 Statistical Yearbook, in Chapter “Immigration statistics” (not available online). The volume may be directly obtained from MoI.
c- 2001-2010′ data is also available in the “Annual Bulletins of Social Statistics”, given years (data is not disagregated by nationality group or by citizenship of permit holder), available for download in PDF format of Central Statistical Bureau (CSB) website.
http://www.csb.gov.kw/Socan_Statistic_EN.aspx?ID=38
d- 2010-2013′ data is available in the report “Migration Statistics 2013”, published by the CSB.
The report (in Arabic, PDF format with Excel tables) is available on CSB’s website (Population Statistics, then Migration Statistics)
http://www.csb.gov.kw/Socan_Statistic.aspx?ID=56
Date of access: May 2015.
| reference number of permit |
purpose of permit |
type of permits |
Males |
Females |
Total |
| 22 |
residence |
Dependant permits |
184,757 |
320,190 |
504,947 |
| 23 |
Study |
625 |
187 |
812 |
| 24 |
Self residence permits |
1,107 |
1,072 |
2,179 |
| 17 |
work |
Governmental sector permits |
63,738 |
35,480 |
99,218 |
| 18 |
Private sector permits |
1,050,932 |
98,250 |
1,149,182 |
| 19 |
Business |
328 |
17 |
345 |
| 20 |
Domestic help |
263,227 |
365,179 |
628,406 |
| TOTAL |
1,564,714 |
820,375 |
2,385,089 |
Source: Ministry of Interior
ANNEXED NOTE
1. Definitions
Residency procedures do not apply to GCC nationals.
The bidoun, a stateless population, are not included in the residency documents holders.
Data presented in the table are stock data: all the non-national residents holding a residence permit on December 31st, the given year. The table excludes the Bedoon, the non-Kuwaiti GCC citizens and those in irregular situation.
Dependent permit: spouse, children or elderly dependent relatives can join visa holder (sponsor) in Kuwait, if the expatriate has obtained a residency and is earning a minimum of KD250 a month (private and governement sector alike).
A working wife cannot sponsor her husband as a dependent. Also, sons over the age of 21 years cannot be sponsored as dependants, though adult daughters and parents may be permitted. Dependent family members are not allowed to work on a Dependent Visa, unless they transfer it into a work visa under Kuwaiti sponsorship. This can be done only after 6 to 12 months of holding a dependent visa.
Every children including new born babies must hold a residency permit. The application for the infant’s residence must be made within 60 days of the birth
The Dependent Visa holder is permitted to stay as long as the sponsor holds a valid visa.
Self residence permit: Expatriates may sponsor themselves under article 24 of the regulations and obtain a residence for two to five years under several conditions
(among which: being aged 60 and more, having worked no less than 25 years in Kuwait, owning a capital of 10000 KD at least; being able to produce a certificate of good conduct, being effectively residing in Kuwait with his/her family, etc.).
This form of residence can be renewed upon expiry. Self-sponsored expatriates may sponsor their wives and children.
Permits 17, 18, 19 and 20 are only granted after Ministry of Labour issues a work permit.
2. Institution which provides data
Central Statistical Bureau (CSB), Ministry of Planning.
3. Period of data coverage
December 31st, given years.
4. Data availability
The present data is taken from the report “Migration Statistics 2013”, published by the CSB.
The report processes Ministry of Interior’s (Directorate of Migration’s) raw figures of permits granted to foreign residents by type/ purpose of permit, sex and regional origin of holder, for the years 2010 to 2013.
The report (in Arabic, PDF format with Excel tables) is available on CSB’s website (Population Statistics, then Migration Statistics)
http://www.csb.gov.kw/Socan_Statistic.aspx?ID=56
Date of access: May 2015.
| reference number of permit |
purpose of permit |
type of permits |
Males |
Females |
Total |
| 22 |
residence |
Dependant permits |
159,596 |
277,170 |
436,766 |
| 23 |
Study |
561 |
177 |
738 |
| 24 |
Self residence permits |
875 |
936 |
1,811 |
| 17 |
work |
Governmental sector permits |
59,531 |
31,328 |
90,859 |
| 18 |
Private sector permits |
907,594 |
76,364 |
983,958 |
| 19 |
Business |
341 |
15 |
356 |
| 20 |
Domestic help |
249,238 |
320,418 |
569,656 |
| TOTAL |
1,377,736 |
706,408 |
2,084,144 |
Source: Ministry of Interior
ANNEXED NOTE
1. Definitions
Residency procedures do not apply to GCC nationals.
The bidoun, a stateless population, are not included in the residency documents holders.
Data presented in the table are stock data: all the non-national residents holding a residence permit on December 31st, the given year. The table excludes the Bedoon, the non-Kuwaiti GCC citizens and those in irregular situation.
Dependent permit: spouse, children or elderly dependent relatives can join visa holder (sponsor) in Kuwait, if the expatriate has obtained a residency and is earning a minimum of KD250 a month (private and governement sector alike).
A working wife cannot sponsor her husband as a dependent. Also, sons over the age of 21 years cannot be sponsored as dependants, though adult daughters and parents may be permitted. Dependent family members are not allowed to work on a Dependent Visa, unless they transfer it into a work visa under Kuwaiti sponsorship. This can be done only after 6 to 12 months of holding a dependent visa.
Every children including new born babies must hold a residency permit. The application for the infant’s residence must be made within 60 days of the birth
The Dependent Visa holder is permitted to stay as long as the sponsor holds a valid visa.
Self residence permit: Expatriates may sponsor themselves under article 24 of the regulations and obtain a residence for two to five years under several conditions
(among which: being aged 60 and more, having worked no less than 25 years in Kuwait, owning a capital of 10000 KD at least; being able to produce a certificate of good conduct, being effectively residing in Kuwait with his/her family, etc.).
This form of residence can be renewed upon expiry. Self-sponsored expatriates may sponsor their wives and children.
Permits 17, 18, 19 and 20 are only granted after Ministry of Labour issues a work permit.
2. Institution which provides data
Central Statistical Bureau (CSB), Ministry of Planning.
3. Period of data coverage
December 31st, given years.
4. Data availability
The present data is taken from the report “Migration Statistics 2013”, published by the CSB.
The report reproduces Ministry of Interior’s (Directorate of Migration’s) figures of permits granted to foreign residents by type/ purpose of permit, sex and regional origin of holder, for the years 2010 to 2013.
The report (in Arabic, PDF format with Excel tables) is available on CSB’s website (Population Statistics, then Migration Statistics)
http://www.csb.gov.kw/Socan_Statistic.aspx?ID=56
Date of access: May 2015.
|
2010 |
2011 |
2012 |
2013 |
|
Males |
Females |
Total |
Males |
Females |
Total |
Males |
Females |
Total |
Males |
Females |
Total |
| Arab countries |
623 |
696 |
1,319 |
639 |
701 |
1,340 |
716 |
747 |
1,463 |
833 |
793 |
1,626 |
| Non-Arab Asian countries |
189 |
194 |
383 |
186 |
196 |
382 |
185 |
205 |
390 |
198 |
213 |
411 |
| Non-Arab African countries |
9 |
8 |
17 |
7 |
11 |
18 |
7 |
12 |
19 |
7 |
14 |
21 |
| Europe |
17 |
21 |
38 |
19 |
21 |
40 |
17 |
21 |
38 |
20 |
23 |
43 |
| North America |
30 |
11 |
41 |
29 |
12 |
41 |
37 |
16 |
53 |
39 |
23 |
62 |
| Central and South America |
7 |
3 |
10 |
6 |
4 |
10 |
6 |
1 |
7 |
7 |
1 |
8 |
| Australia and Oceania |
0 |
3 |
3 |
0 |
3 |
3 |
1 |
4 |
5 |
3 |
5 |
8 |
| Other |
0 |
0 |
0 |
0 |
0 |
0 |
0 |
0 |
0 |
0 |
0 |
0 |
| Total |
875 |
936 |
1,811 |
886 |
948 |
1,834 |
969 |
1,006 |
1,975 |
1,107 |
1,072 |
2,179 |
Source: Ministry of Interior
ANNEXED NOTE
1. Definitions
Residency procedures do not apply to GCC nationals.
The bidoun, a stateless population, are not included in the residency documents holders.
Data presented in the table are stock data: all the non-national residents holding a residence permit on December 31st, the given year. The table excludes the Bedoon, the non-Kuwaiti GCC citizens and those in irregular situation.
Self sponsorship permit: Expatriates may sponsor themselves under article 24 of the regulations and obtain a residence for two to five years under several conditions
(among which: being aged 60 and more, having worked no less than 25 years in Kuwait, owning a capital of 10000 KD at least; being able to produce a certificate of good conduct, being effectively residing in Kuwait with his/her family, etc.).
This form of residence can be renewed upon expiry. Self-sponsored expatriates may sponsor their wives and children.
Totals for the year 2012 presented here differ slightly from totals in other tables pertaining to this year published in the database.
2. Institution which provides data
Central Statistical Bureau (CSB), Ministry of Planning.
3. Period of data coverage
December 31st, given years.
4. Data availability
The present data is taken from the report “Migration Statistics 2013”, published by the CSB.
The report processes Ministry of Interior’s (Directorate of Migration’s) raw figures of permits granted to foreign residents by type/ purpose of permit, sex and regional origin of holder, for the years 2010 to 2013.
The report (in Arabic, PDF format with Excel tables) is available on CSB’s website (Population Statistics, then Migration Statistics)
http://www.csb.gov.kw/Socan_Statistic.aspx?ID=56
Date of access: May 2015.
|
2010 |
2011 |
2012 |
2013 |
|
Males |
Females |
Total |
Males |
Females |
Total |
Males |
Females |
Total |
Males |
Females |
Total |
| Arab countries |
71 |
16 |
87 |
68 |
15 |
83 |
76 |
16 |
92 |
70 |
16 |
86 |
| Non-Arab Asian countries |
206 |
92 |
298 |
221 |
97 |
318 |
240 |
94 |
334 |
245 |
89 |
334 |
| Non-Arab African countries |
253 |
57 |
310 |
262 |
57 |
319 |
286 |
57 |
343 |
285 |
56 |
341 |
| Europe |
20 |
7 |
27 |
17 |
14 |
31 |
24 |
17 |
41 |
19 |
17 |
36 |
| North America |
10 |
5 |
15 |
11 |
3 |
14 |
6 |
5 |
11 |
6 |
9 |
15 |
| Central and South America |
1 |
0 |
1 |
0 |
0 |
0 |
0 |
0 |
0 |
0 |
0 |
0 |
| Australia and Oceania |
0 |
0 |
0 |
0 |
0 |
0 |
0 |
0 |
0 |
0 |
0 |
0 |
| Other |
0 |
0 |
0 |
0 |
0 |
0 |
0 |
0 |
0 |
0 |
0 |
0 |
| Total |
561 |
177 |
738 |
579 |
186 |
765 |
632 |
189 |
821 |
625 |
187 |
812 |
Source: Ministry of Interior
ANNEXED NOTE
1. Definitions
Residency procedures do not apply to GCC nationals.
The bidoun, a stateless population, are not included in the residency documents holders.
Data presented in the table are stock data: all the non-national residents holding a residence permit on December 31st, the given year. The table excludes the Bedoon, the non-Kuwaiti GCC citizens and those in irregular situation.
Totals for the year 2012 presented here differ slightly from totals in other tables pertaining to this year published in the database.
2. Institution which provides data
Central Statistical Bureau (CSB), Ministry of Planning.
3. Period of data coverage
December 31st, given years.
4. Data availability
The present data is taken from the report “Migration Statistics 2013”, published by the CSB.
The report processes Ministry of Interior’s (Directorate of Migration’s) raw figures of permits granted to foreign residents by type/ purpose of permit, sex and regional origin of holder, for the years 2010 to 2013.
The report (in Arabic, PDF format with Excel tables) is available on CSB’s website (Population Statistics, then Migration Statistics)
http://www.csb.gov.kw/Socan_Statistic.aspx?ID=56
Date of access: May 2015.
|
2010 |
2011 |
2012 |
2013 |
|
Males |
Females |
Total |
Males |
Females |
Total |
Males |
Females |
Total |
Males |
Females |
Total |
| Arab countries |
104,366 |
166,920 |
271,286 |
108,396 |
174,775 |
283,171 |
113,266 |
184,336 |
297,602 |
121,894 |
196,944 |
318,838 |
| Non-Arab Asian countries |
49,031 |
100,350 |
149,381 |
51,523 |
104,023 |
155,546 |
53,859 |
108,412 |
162,271 |
56,241 |
112,888 |
169,129 |
| Non-Arab African countries |
598 |
1,201 |
1,799 |
623 |
1,284 |
1,907 |
651 |
1,296 |
1,947 |
620 |
1,324 |
1,944 |
| Europe |
1,426 |
2,914 |
4,340 |
1,461 |
2,983 |
4,444 |
1,547 |
3,064 |
4,611 |
1,584 |
3,135 |
4,719 |
| North America |
3,663 |
4,915 |
8,578 |
3,709 |
4,897 |
8,606 |
3,785 |
5,037 |
8,822 |
3,875 |
5,021 |
8,896 |
| Central and South America |
201 |
381 |
582 |
217 |
408 |
625 |
225 |
400 |
625 |
221 |
382 |
603 |
| Australia and Oceania |
306 |
482 |
788 |
319 |
491 |
810 |
332 |
490 |
822 |
319 |
493 |
812 |
| Other |
5 |
7 |
12 |
5 |
3 |
8 |
3 |
4 |
7 |
3 |
3 |
6 |
| Total |
159,596 |
277,170 |
436,766 |
166,253 |
288,864 |
455,117 |
173,668 |
303,039 |
476,707 |
184,757 |
320,190 |
504,947 |
Source: Ministry of Interior
ANNEXED NOTE
1. Definitions
Residency procedures do not apply to GCC nationals.
The bidoun, a stateless population, are not included in the residency documents holders.
Data presented in the table are stock data: all the non-national residents holding a residence permit on December 31st, the given year. The table excludes the Bedoon, the non-Kuwaiti GCC citizens and those in irregular situation.
Totals for the year 2012 presented here differ slightly from totals in other tables pertaining to this year published in the database.
2. Institution which provides data
Central Statistical Bureau (CSB), Ministry of Planning.
3. Period of data coverage
December 31st, given years.
4. Data availability
The present data is taken from the report “Migration Statistics 2013”, published by the CSB.
The report processes Ministry of Interior’s (Directorate of Migration’s) raw figures of permits granted to foreign residents by type/ purpose of permit, sex and regional origin of holder, for the years 2010 to 2013.
The report (in Arabic, PDF format with Excel tables) is available on CSB’s website (Population Statistics, then Migration Statistics)
http://www.csb.gov.kw/Socan_Statistic.aspx?ID=56
Date of access: May 2015.
|
2010 |
2011 |
2012 |
2013 |
|
Males |
Females |
Total |
Males |
Females |
Total |
Males |
Females |
Total |
Males |
Females |
Total |
| Arab countries |
2,444 |
287 |
2,731 |
2,520 |
286 |
2,806 |
2,491 |
271 |
2,762 |
2,574 |
266 |
2,840 |
| Non-Arab Asian countries |
245,720 |
278,463 |
524,183 |
250,873 |
272,878 |
523,751 |
252,386 |
278,466 |
530,852 |
256,398 |
284,942 |
541,340 |
| Non-Arab African countries |
1,069 |
41,661 |
42,730 |
1,933 |
64,769 |
66,702 |
3,297 |
72,023 |
75,320 |
4,249 |
79,959 |
84,208 |
| Europe |
3 |
2 |
5 |
2 |
2 |
4 |
2 |
6 |
8 |
3 |
2 |
5 |
| North America |
0 |
0 |
0 |
3 |
0 |
3 |
2 |
2 |
4 |
0 |
2 |
2 |
| Central and South America |
1 |
1 |
2 |
1 |
0 |
1 |
1 |
2 |
3 |
2 |
3 |
5 |
| Australia and Oceania |
0 |
4 |
4 |
0 |
2 |
2 |
0 |
3 |
3 |
0 |
5 |
5 |
| Other |
1 |
0 |
1 |
1 |
0 |
1 |
1 |
0 |
1 |
1 |
0 |
1 |
| Total |
249,238 |
320,418 |
569,656 |
255,333 |
337,937 |
593,270 |
258,180 |
350,773 |
608,953 |
263,227 |
365,179 |
628,406 |
Source: Ministry of Interior
ANNEXED NOTE
1. Definitions
Residency procedures do not apply to GCC nationals.
The bidoun, a stateless population, are not included in the residency documents holders.
Data presented in the table are stock data: all the non-national residents holding a residence permit on December 31st, the given year. The table excludes the Bedoon, the non-Kuwaiti GCC citizens and those in irregular situation.
Permits 17, 18, 19 and 20 are only granted after Ministry of Labour issues a work permit.
“Domestic services” designate the activities performed within households, such as that of personal drivers, cooks, nannies, servants, sheperds, governesses, etc.
Totals for the year 2012 presented here differ slightly from totals in other tables pertaining to this year published in the database.
2. Institution which provides data
Central Statistical Bureau (CSB), Ministry of Planning.
3. Period of data coverage
December 31st, given years.
4. Data availability
The present data is taken from the report “Migration Statistics 2013”, published by the CSB.
The report processes Ministry of Interior’s (Directorate of Migration’s) raw figures of permits granted to foreign residents by type/ purpose of permit, sex and regional origin of holder, for the years 2010 to 2013.
The report (in Arabic, PDF format with Excel tables) is available on CSB’s website (Population Statistics, then Migration Statistics)
http://www.csb.gov.kw/Socan_Statistic.aspx?ID=56
Date of access: May 2015.
|
2010 |
2011 |
2012 |
2013 |
|
Males |
Females |
Total |
Males |
Females |
Total |
Males |
Females |
Total |
Males |
Females |
Total |
| Arab countries |
182 |
10 |
192 |
178 |
10 |
188 |
185 |
11 |
196 |
192 |
12 |
204 |
| Non-Arab Asian countries |
140 |
1 |
141 |
129 |
1 |
130 |
122 |
1 |
123 |
113 |
1 |
114 |
| Non-Arab African countries |
0 |
0 |
0 |
0 |
0 |
0 |
0 |
0 |
0 |
0 |
0 |
0 |
| Europe |
5 |
3 |
8 |
6 |
3 |
9 |
6 |
3 |
9 |
6 |
3 |
9 |
| North America |
14 |
1 |
15 |
14 |
1 |
15 |
17 |
1 |
18 |
15 |
1 |
16 |
| Central and South America |
0 |
0 |
0 |
0 |
0 |
0 |
0 |
0 |
0 |
1 |
0 |
1 |
| Australia and Oceania |
0 |
0 |
0 |
0 |
0 |
0 |
0 |
0 |
0 |
1 |
0 |
1 |
| Other |
0 |
0 |
0 |
0 |
0 |
0 |
0 |
0 |
0 |
0 |
0 |
0 |
| Total |
341 |
15 |
356 |
327 |
15 |
342 |
330 |
16 |
346 |
328 |
17 |
345 |
Source: Ministry of Interior
ANNEXED NOTE
1. Definitions
Residency procedures do not apply to GCC nationals.
The bidoun, a stateless population, are not included in the residency documents holders.
Data presented in the table are stock data: all the non-national residents holding a residence permit on December 31st, the given year. The table excludes the Bedoon, the non-Kuwaiti GCC citizens and those in irregular situation.
Permits 17, 18, 19 and 20 are only granted after Ministry of Labour issues a work permit.
Totals for the year 2012 presented here differ slightly from totals in other tables pertaining to this year published in the database.
2. Institution which provides data
Central Statistical Bureau (CSB), Ministry of Planning.
3. Period of data coverage
December 31st, given years.
4. Data availability
The present data is taken from the report “Migration Statistics 2013”, published by the CSB.
The report processes Ministry of Interior’s (Directorate of Migration’s) raw figures of permits granted to foreign residents by type/ purpose of permit, sex and regional origin of holder, for the years 2010 to 2013.
The report (in Arabic, PDF format with Excel tables) is available on CSB’s website (Population Statistics, then Migration Statistics)
http://www.csb.gov.kw/Socan_Statistic.aspx?ID=56
Date of access: May 2015.
|
2010 |
2011 |
2012 |
2013 |
|
Males |
Females |
Total |
Males |
Females |
Total |
Males |
Females |
Total |
Males |
Females |
Total |
| Arab countries |
344,316 |
21,905 |
366,221 |
354,411 |
22,876 |
377,287 |
366,187 |
23,818 |
390,005 |
392,758 |
26,370 |
419,128 |
| Non-Arab Asian countries |
549,264 |
50,063 |
599,327 |
568,235 |
53,481 |
621,716 |
600,257 |
60,039 |
660,296 |
643,489 |
66,162 |
709,651 |
| Non-Arab African countries |
2,135 |
990 |
3,125 |
2,547 |
1,335 |
3,882 |
3,240 |
1,706 |
4,946 |
3,910 |
2,049 |
5,959 |
| Europe |
3,215 |
1,256 |
4,471 |
3,420 |
1,281 |
4,701 |
3,476 |
1,364 |
4,840 |
3,605 |
1,532 |
5,137 |
| North America |
7,861 |
1,942 |
9,803 |
7,679 |
1,985 |
9,664 |
7,379 |
2,142 |
9,521 |
6,415 |
1,940 |
8,355 |
| Central and South America |
349 |
75 |
424 |
344 |
71 |
415 |
342 |
79 |
421 |
328 |
85 |
413 |
| Australia and Oceania |
453 |
133 |
586 |
413 |
123 |
536 |
403 |
115 |
518 |
426 |
112 |
538 |
| Other |
1 |
0 |
1 |
1 |
0 |
1 |
1 |
0 |
1 |
1 |
0 |
1 |
| Total |
907,594 |
76,364 |
983,958 |
937,050 |
81,152 |
1,018,202 |
981,285 |
89,263 |
1,070,548 |
1,050,932 |
98,250 |
1,149,182 |
Source: Ministry of Interior
ANNEXED NOTE
1. Definitions
Residency procedures do not apply to GCC nationals.
The bidoun, a stateless population, are not included in the residency documents holders.
Data presented in the table are stock data: all the non-national residents holding a residence permit on December 31st, the given year. The table excludes the Bedoon, the non-Kuwaiti GCC citizens and those in irregular situation.
Permits 17, 18, 19 and 20 are only granted after Ministry of Labour issues a work permit.
Totals for the year 2012 presented here differ slightly from totals in other tables pertaining to this year published in the database.
2. Institution which provides data
Central Statistical Bureau (CSB), Ministry of Planning.
3. Period of data coverage
December 31st, given years.
4. Data availability
The present data is taken from the report “Migration Statistics 2013”, published by the CSB.
The report processes Ministry of Interior’s (Directorate of Migration’s) raw figures of permits granted to foreign residents by type/ purpose of permit, sex and regional origin of holder, for the years 2010 to 2013.
The report (in Arabic, PDF format with Excel tables) is available on CSB’s website (Population Statistics, then Migration Statistics)
http://www.csb.gov.kw/Socan_Statistic.aspx?ID=56
Date of access: May 2015.
|
2010 |
2011 |
2012 |
2013 |
|
Males |
Females |
Total |
Males |
Females |
Total |
Males |
Females |
Total |
Males |
Females |
Total |
| Arab countries |
36,867 |
18,027 |
54,894 |
38,764 |
18,936 |
57,700 |
38,959 |
19,347 |
58,306 |
39,533 |
19,958 |
59,491 |
| Non-Arab Asian countries |
20,813 |
12,692 |
33,505 |
21,680 |
14,817 |
36,497 |
21,945 |
14,829 |
36,774 |
22,347 |
14,835 |
37,182 |
| Non-Arab African countries |
386 |
119 |
505 |
428 |
147 |
575 |
416 |
153 |
569 |
377 |
154 |
531 |
| Europe |
664 |
317 |
981 |
664 |
323 |
987 |
669 |
338 |
1,007 |
640 |
332 |
972 |
| North America |
691 |
153 |
844 |
670 |
178 |
848 |
708 |
174 |
882 |
729 |
169 |
898 |
| Central and South America |
55 |
8 |
63 |
59 |
11 |
70 |
58 |
17 |
75 |
59 |
20 |
79 |
| Australia and Oceania |
55 |
12 |
67 |
53 |
12 |
65 |
49 |
11 |
60 |
50 |
12 |
62 |
| Other |
0 |
0 |
0 |
3 |
0 |
3 |
4 |
0 |
4 |
3 |
0 |
3 |
| Total |
59,531 |
31,328 |
90,859 |
62,321 |
34,424 |
96,745 |
62,808 |
34,869 |
97,677 |
63,738 |
35,480 |
99,218 |
Source: Ministry of Interior
ANNEXED NOTE
1. Definitions
Residency procedures do not apply to GCC nationals.
The bidoun, a stateless population, are not included in the residency documents holders.
Data presented in the table are stock data: all the non-national residents holding a residence permit on December 31st, the given year. The table excludes the Bedoon, the non-Kuwaiti GCC citizens and those in irregular situation.
Permits 17, 18, 19 and 20 are only granted after Ministry of Labour issues a work permit.
Totals for the year 2012 presented here differ slightly from totals in other tables pertaining to this year published in the database.
2. Institution which provides data
Central Statistical Bureau (CSB), Ministry of Planning.
3. Period of data coverage
December 31st, given years.
4. Data availability
The present data is taken from the report “Migration Statistics 2013”, published by the CSB.
The report processes Ministry of Interior’s (Directorate of Migration’s) raw figures of permits granted to foreign residents by type/ purpose of permit, sex and regional origin of holder, for the years 2010 to 2013.
The report (in Arabic, PDF format with Excel tables) is available on CSB’s website (Population Statistics, then Migration Statistics)
http://www.csb.gov.kw/Socan_Statistic.aspx?ID=56
Date of access: May 2015.
|
2010 |
2011 |
2012 |
2013 |
|
Males |
Females |
Total |
Males |
Females |
Total |
Males |
Females |
Number |
Males |
Females |
Number |
| Arab countries |
488,869 |
207,861 |
696,730 |
504,976 |
217,599 |
722,575 |
521,880 |
228,546 |
750,426 |
557,854 |
244,359 |
802,213 |
| Non-Arab Asian countries |
865,363 |
441,855 |
1,307,218 |
892,847 |
445,493 |
1,338,340 |
928,994 |
462,046 |
1,391,040 |
979,031 |
479,130 |
1,458,161 |
| Non-Arab African countries |
4,450 |
44,036 |
48,486 |
5,800 |
67,603 |
73,403 |
7,897 |
75,247 |
83,144 |
9,448 |
83,556 |
93,004 |
| Europe |
5,350 |
4,520 |
9,870 |
5,589 |
4,627 |
10,216 |
5,741 |
4,813 |
10,554 |
5,877 |
5,044 |
10,921 |
| North America |
12,269 |
7,027 |
19,296 |
12,115 |
7,076 |
19,191 |
11,934 |
7,377 |
19,311 |
11,079 |
7,165 |
18,244 |
| Central and South America |
614 |
468 |
1,082 |
627 |
494 |
1,121 |
632 |
499 |
1,131 |
618 |
491 |
1,109 |
| Australia and Oceania |
814 |
634 |
1,448 |
785 |
631 |
1,416 |
785 |
623 |
1,408 |
799 |
627 |
1,426 |
| Other |
7 |
7 |
14 |
10 |
3 |
13 |
9 |
4 |
13 |
8 |
3 |
11 |
| Total |
1,377,736 |
706,408 |
2,084,144 |
1,422,749 |
743,526 |
2,166,275 |
1,477,872 |
779,155 |
2,257,027 |
1,564,714 |
820,375 |
2,385,089 |
Source: Ministry of Interior
ANNEXED NOTE
1. Definitions
Residency procedures do not apply to GCC nationals.
The bidoun, a stateless population, are not included in the residency documents holders.
Data presented in the table are stock data: all the non-national residents holding a residence permit on December 31st, the given year. The table excludes the Bedoon, the non-Kuwaiti GCC citizens and those in irregular situation.
Dependent permit: spouse, children or elderly dependent relatives can join visa holder (sponsor) in Kuwait, if the expatriate has obtained a residency and is earning a minimum of KD250 a month (private and governement sector alike).
A working wife cannot sponsor her husband as a dependent. Also, sons over the age of 21 years cannot be sponsored as dependants, though adult daughters and parents may be permitted. Dependent family members are not allowed to work on a Dependent Visa, unless they transfer it into a work visa under Kuwaiti sponsorship. This can be done only after 6 to 12 months of holding a dependent visa.
Every children including new born babies must hold a residency permit. The application for the infant’s residence must be made within 60 days of the birth
The Dependent Visa holder is permitted to stay as long as the sponsor holds a valid visa.
Self residence permit: Expatriates may sponsor themselves under article 24 of the regulations and obtain a residence for two to five years under several conditions
(among which: being aged 60 and more, having worked no less than 25 years in Kuwait, owning a capital of 10000 KD at least; being able to produce a certificate of good conduct, being effectively residing in Kuwait with his/her family, etc.).
This form of residence can be renewed upon expiry. Self-sponsored expatriates may sponsor their wives and children.
Permits 17, 18, 19 and 20 are only granted after Ministry of Labour issues a work permit.
The present figures do not include the holders of permit n°14 (temporary residents).
Totals for the year 2012 presented here differ slightly from totals in other tables pertaining to this year published in the database.
2. Institution which provides data
Central Statistical Bureau (CSB), Ministry of Planning.
3. Period of data coverage
December 31st, given years.
4. Data availability
The present data is taken from the report “Migration Statistics 2013”, published by the CSB.
The report processes Ministry of Interior’s (Directorate of Migration’s) raw figures of permits granted to foreign residents by type/ purpose of permit, sex and regional origin of holder, for the years 2010 to 2013.
The report (in Arabic, PDF format with Excel tables) is available on CSB’s website (Population Statistics, then Migration Statistics)
http://www.csb.gov.kw/Socan_Statistic.aspx?ID=56
Date of access: May 2015.
| reference number of permit |
purpose of permit |
type of permits |
2013 |
| 22 |
residence |
Dependant permits |
504,947 |
| 23 |
Study |
812 |
| 24 |
Self residence permits |
2,179 |
| 17 |
work |
Governmental sector permits |
99,218 |
| 18 |
Private sector permits |
1,149,182 |
| 19 |
Business |
345 |
| 20 |
Domestic help |
628,406 |
| TOTAL |
2,385,089 |
Source: Ministry of Interior
ANNEXED NOTE
1. Definitions
Residency procedures do not apply to GCC nationals.
The bidoun, a stateless population, are not included in the residency documents holders.
Data presented in the table are stock data: all the non-national residents holding a residence permit on December 31st, the given year. The table excludes the Bedoon, the non-Kuwaiti GCC citizens and those in irregular situation.
Dependent permit: spouse, children or elderly dependent relatives can join visa holder (sponsor) in Kuwait, if the expatriate has obtained a residency and is earning a minimum of KD250 a month (private and governement sector alike).
A working wife cannot sponsor her husband as a dependent. Also, sons over the age of 21 years cannot be sponsored as dependants, though adult daughters and parents may be permitted. Dependent family members are not allowed to work on a Dependent Visa, unless they transfer it into a work visa under Kuwaiti sponsorship. This can be done only after 6 to 12 months of holding a dependent visa.
Every children including new born babies must hold a residency permit. The application for the infant’s residence must be made within 60 days of the birth
The Dependent Visa holder is permitted to stay as long as the sponsor holds a valid visa.
Self residence permit: Expatriates may sponsor themselves under article 24 of the regulations and obtain a residence for two to five years under several conditions
(among which: being aged 60 and more, having worked no less than 25 years in Kuwait, owning a capital of 10000 KD at least; being able to produce a certificate of good conduct, being effectively residing in Kuwait with his/her family, etc.).
This form of residence can be renewed upon expiry. Self-sponsored expatriates may sponsor their wives and children.
Permits 17, 18, 19 and 20 are only granted after Ministry of Labour issues a work permit.
2. Institution which provides data
Central Statistical Bureau (CSB), Ministry of Planning.
3. Period of data coverage
December 31st, given years.
4. Data availability
The present data is taken from the report “Migration Statistics 2013”, published by the CSB.
The report reproduces Ministry of Interior’s (Directorate of Migration’s) figures of permits granted to foreign residents by type/ purpose of permit, sex and regional origin of holder, for the years 2010 to 2013.
The report (in Arabic, PDF format with Excel tables) is available on CSB’s website (Population Statistics, then Migration Statistics)
http://www.csb.gov.kw/Socan_Statistic.aspx?ID=56
Date of access: May 2015.
| reference number of permit |
purpose of permit |
type of permits |
2010 |
| 22 |
residence |
Dependant permits |
436,766 |
| 23 |
Study |
738 |
| 24 |
Self residence permits |
1,811 |
| 17 |
work |
Governmental sector permits |
90,859 |
| 18 |
Private sector permits |
983,958 |
| 19 |
Business |
356 |
| 20 |
Domestic help |
569,656 |
| TOTAL |
2,084,144 |
Source: Ministry of Interior
ANNEXED NOTE
1. Definitions
Residency procedures do not apply to GCC nationals.
The bidoun, a stateless population, are not included in the residency documents holders.
Data presented in the table are stock data: all the non-national residents holding a residence permit on December 31st, the given year. The table excludes the Bedoon, the non-Kuwaiti GCC citizens and those in irregular situation.
Dependent permit: spouse, children or elderly dependent relatives can join visa holder (sponsor) in Kuwait, if the expatriate has obtained a residency and is earning a minimum of KD250 a month (private and governement sector alike).
A working wife cannot sponsor her husband as a dependent. Also, sons over the age of 21 years cannot be sponsored as dependants, though adult daughters and parents may be permitted. Dependent family members are not allowed to work on a Dependent Visa, unless they transfer it into a work visa under Kuwaiti sponsorship. This can be done only after 6 to 12 months of holding a dependent visa.
Every children including new born babies must hold a residency permit. The application for the infant’s residence must be made within 60 days of the birth
The Dependent Visa holder is permitted to stay as long as the sponsor holds a valid visa.
Self residence permit: Expatriates may sponsor themselves under article 24 of the regulations and obtain a residence for two to five years under several conditions
(among which: being aged 60 and more, having worked no less than 25 years in Kuwait, owning a capital of 10000 KD at least; being able to produce a certificate of good conduct, being effectively residing in Kuwait with his/her family, etc.).
This form of residence can be renewed upon expiry. Self-sponsored expatriates may sponsor their wives and children.
Permits 17, 18, 19 and 20 are only granted after Ministry of Labour issues a work permit.
2. Institution which provides data
Central Statistical Bureau (CSB), Ministry of Planning.
3. Period of data coverage
December 31st, given years.
4. Data availability
The present data is taken from the report “Migration Statistics 2013”, published by the CSB.
The report reproduces Ministry of Interior’s (Directorate of Migration’s) figures of permits granted to foreign residents by type/ purpose of permit, sex and regional origin of holder, for the years 2010 to 2013.
The report (in Arabic, PDF format with Excel tables) is available on CSB’s website (Population Statistics, then Migration Statistics)
http://www.csb.gov.kw/Socan_Statistic.aspx?ID=56
Date of access: May 2015.
|
2010 |
2011 |
2012 |
2013 |
|
Number |
% |
Number |
% |
Number |
% |
Number |
% |
| Arab countries |
696,730 |
33.43 |
722,575 |
33.36 |
750,426 |
33.25 |
802,213 |
33.63 |
| Non-Arab Asian countries |
1,307,218 |
62.72 |
1,338,340 |
61.78 |
1,391,040 |
61.63 |
1,458,161 |
61.14 |
| Non-Arab African countries |
48,486 |
2.33 |
73,403 |
3.39 |
83,144 |
3.68 |
93,004 |
3.90 |
| Europe |
9,870 |
0.47 |
10,216 |
0.47 |
10,554 |
0.47 |
10,921 |
0.46 |
| North America |
19,296 |
0.93 |
19,191 |
0.89 |
19,311 |
0.86 |
18,244 |
0.76 |
| Central and South America |
1,082 |
0.05 |
1,121 |
0.05 |
1,131 |
0.05 |
1,109 |
0.05 |
| Australia and Oceania |
1,448 |
0.07 |
1,416 |
0.07 |
1,408 |
0.06 |
1,426 |
0.06 |
| Other |
14 |
0.00 |
13 |
0.00 |
13 |
0.00 |
11 |
0.00 |
| Total |
2,084,144 |
100.00 |
2,166,275 |
100.00 |
2,257,027 |
100.00 |
2,385,089 |
100.00 |
Source: Ministry of Interior
ANNEXED NOTE
1. Definitions
Residency procedures do not apply to GCC nationals.
The bidoun, a stateless population, are not included in the residency documents holders.
Data presented in the table are stock data: all the non-national residents holding a residence permit on December 31st, the given year. The table excludes the Bedoon, the non-Kuwaiti GCC citizens and those in irregular situation.
Dependent permit: spouse, children or elderly dependent relatives can join visa holder (sponsor) in Kuwait, if the expatriate has obtained a residency and is earning a minimum of KD250 a month (private and governement sector alike).
A working wife cannot sponsor her husband as a dependent. Also, sons over the age of 21 years cannot be sponsored as dependants, though adult daughters and parents may be permitted. Dependent family members are not allowed to work on a Dependent Visa, unless they transfer it into a work visa under Kuwaiti sponsorship. This can be done only after 6 to 12 months of holding a dependent visa.
Every children including new born babies must hold a residency permit. The application for the infant’s residence must be made within 60 days of the birth
The Dependent Visa holder is permitted to stay as long as the sponsor holds a valid visa.
Self residence permit: Expatriates may sponsor themselves under article 24 of the regulations and obtain a residence for two to five years under several conditions
(among which: being aged 60 and more, having worked no less than 25 years in Kuwait, owning a capital of 10000 KD at least; being able to produce a certificate of good conduct, being effectively residing in Kuwait with his/her family, etc.).
This form of residence can be renewed upon expiry. Self-sponsored expatriates may sponsor their wives and children.
Permits 17, 18, 19 and 20 are only granted after Ministry of Labour issues a work permit.
The present figures do not include the holders of permit n°14 (temporary residents).
Totals for the year 2012 presented here differ slightly from totals in other tables published in the database.
2. Institution which provides data
Central Statistical Bureau (CSB), Ministry of Planning.
3. Period of data coverage
December 31st, given years.
4. Data availability
The present data is taken from the report “Migration Statistics 2013”, published by the CSB.
The report processes Ministry of Interior’s (Directorate of Migration’s) raw figures of permits granted to foreign residents by type/ purpose of permit, sex and regional origin of holder, for the years 2010 to 2013.
The report (in Arabic, PDF format with Excel tables) is available on CSB’s website (Population Statistics, then Migration Statistics)
http://www.csb.gov.kw/Socan_Statistic.aspx?ID=56
Date of access: May 2015.
|
|
Kuwaitis |
|
|
Non-Kuwaitis |
|
Total |
|
|
Males |
Females |
Total |
Males |
Females |
Total |
Males |
Females |
Total |
| In the labour force |
224,489 |
197,836 |
422,325 |
1,552,436 |
481,837 |
2,034,273 |
1,776,925 |
679,673 |
2,456,598 |
| Out of the labour force |
156,166 |
222,121 |
378,287 |
80,495 |
282,259 |
362,754 |
236,661 |
504,380 |
741,041 |
| Not stated |
7,996 |
0 |
7,996 |
15,001 |
0 |
15,001 |
22,997 |
0 |
22,997 |
| Total |
388,651 |
419,957 |
808,608 |
1,647,932 |
764,096 |
2,412,028 |
2,036,583 |
1,184,053 |
3,220,636 |
Source: PACI
ANNEXED NOTE
1. Characteristics of data and definitions
The source of data used here is the Public Authority for Civil Information (PACI), an independant government body in charge of :
1- centralising all population and labour force data in order to manage a fully computerised population register
2- issuing mandatory civil identification cards to every resident of the country, regardless of age and nationality.
The other source of demographic and socioeconomic data on Kuwait is the Central Statistical Office (CSO), operating within the Planning Ministry. The CSO has conducted ten population and housing censuses since its inception in 1957.
(a) Kuwaiti: the Kuwaiti nationality rests upon a document of Kuwaiti nationality or a certificate proving Kuwaiti nationality issued by the Ministry of Interior of Kuwait.
(b) Non-Kuwaiti: his/ her nationality is determined by the name of the State having issued the passport. The foreign national also entered Kuwait legally and has a stamp of residence.
This category includes the Bidoon, a category of stateless persons living in the Emirate. Kuwait’s Bidoon population originates from three broad categories:
1) those whose ancestors failed to apply for nationality or lacked necessary documentation at the time of Kuwait’s independence in 1961;
2) those recruited to work in Kuwait’s army or police force during the 1960s who permanently settled in Kuwait, along with their families;
3) children of Kuwaiti mothers and stateless or foreign fathers (see Human Rights Watch. Prisoners of the Past. Kuwaiti Bidun and the Burden of Statelessness, June 2011, p. 3).
(c) Population in the labour force: population aged 15 years and above, included in the labour market, either employed (in the government or private sector, as itinerant worker, employed in the domestic sector), or unemployed.
(d) Population out of the labour force: population aged 15 years and above, not contributing to any economic activity and not included in the labour market, among which the students, the housewives, the retired persons or self-sufficients.
2. Institution which provides data
The Public Authority for Civil Information (PACI)
3. Period of data coverage: December 2014
The database is updated three times a year and the website presents only the most recent data.
4. Data availability
Analytical tables and data crosstabulations are available for download in PDF, html, .png and Excel (.csv) formats.
Date of access: May 2015
| Locality |
Gender |
Nationality group |
| Kuwaitis |
Arabs |
Asians |
Africans |
Europeans |
N. Americans |
S. Americans |
Australians/ Oceanians |
Total |
| Dasman |
Males |
205 |
745 |
546 |
0 |
9 |
12 |
0 |
1 |
1,518 |
| Females |
257 |
130 |
249 |
29 |
6 |
9 |
1 |
1 |
682 |
| Total |
462 |
875 |
795 |
29 |
15 |
21 |
1 |
2 |
2,200 |
| Sharq |
Males |
792 |
8,062 |
15,966 |
10 |
74 |
66 |
9 |
3 |
24,982 |
| Females |
831 |
1,836 |
4,504 |
145 |
46 |
43 |
8 |
1 |
7,414 |
| Total |
1,623 |
9,898 |
20,470 |
155 |
120 |
109 |
17 |
4 |
32,396 |
| Mirqab |
Males |
3 |
895 |
5,925 |
0 |
3 |
4 |
0 |
0 |
6,830 |
| Females |
2 |
116 |
504 |
3 |
1 |
1 |
0 |
0 |
627 |
| Total |
5 |
1,011 |
6,429 |
3 |
4 |
5 |
0 |
0 |
7,457 |
| Soor Gardens |
Males |
0 |
9 |
2 |
0 |
0 |
0 |
0 |
0 |
11 |
| Females |
0 |
0 |
0 |
0 |
0 |
0 |
0 |
0 |
0 |
| Total |
0 |
9 |
2 |
0 |
0 |
0 |
0 |
0 |
11 |
| Qibla |
Males |
40 |
4,275 |
9,348 |
37 |
79 |
47 |
1 |
6 |
13,833 |
| Females |
34 |
1,269 |
1,810 |
52 |
50 |
24 |
0 |
2 |
3,241 |
| Total |
74 |
5,544 |
11,158 |
89 |
129 |
71 |
1 |
8 |
17,074 |
| Coastal strip |
Males |
0 |
0 |
0 |
0 |
0 |
0 |
0 |
0 |
0 |
| Females |
0 |
0 |
0 |
0 |
0 |
0 |
0 |
0 |
0 |
| Total |
0 |
0 |
0 |
0 |
0 |
0 |
0 |
0 |
0 |
| Bneid Al – Gar |
Males |
444 |
8,124 |
19,697 |
36 |
178 |
162 |
5 |
10 |
28,656 |
| Females |
464 |
1,754 |
3,124 |
109 |
137 |
122 |
4 |
5 |
5,719 |
| Total |
908 |
9,878 |
22,821 |
145 |
315 |
284 |
9 |
15 |
34,375 |
| Dasma |
Males |
5,331 |
811 |
3,330 |
6 |
24 |
46 |
6 |
1 |
9,555 |
| Females |
5,475 |
658 |
3,670 |
533 |
28 |
36 |
4 |
1 |
10,405 |
| Total |
10,806 |
1,469 |
7,000 |
539 |
52 |
82 |
10 |
2 |
19,960 |
| Mansoriya |
Males |
2,447 |
329 |
1,494 |
3 |
25 |
16 |
1 |
1 |
4,316 |
| Females |
2,567 |
224 |
1,645 |
270 |
23 |
13 |
4 |
0 |
4,746 |
| Total |
5,014 |
553 |
3,139 |
273 |
48 |
29 |
5 |
1 |
9,062 |
| Abdalla-Alsalim |
Males |
5,446 |
647 |
4,395 |
12 |
14 |
21 |
0 |
2 |
10,537 |
| Females |
5,601 |
419 |
4,536 |
542 |
31 |
27 |
0 |
0 |
11,156 |
| Total |
11,047 |
1,066 |
8,931 |
554 |
45 |
48 |
0 |
2 |
21,693 |
| Shamiya |
Males |
4,505 |
761 |
3,192 |
38 |
11 |
23 |
4 |
0 |
8,534 |
| Females |
4,776 |
551 |
3,282 |
472 |
14 |
22 |
0 |
0 |
9,117 |
| Total |
9,281 |
1,312 |
6,474 |
510 |
25 |
45 |
4 |
0 |
17,651 |
| Diya |
Males |
4,658 |
1,437 |
3,668 |
12 |
22 |
62 |
8 |
2 |
9,869 |
| Females |
4,857 |
1,064 |
3,622 |
510 |
30 |
48 |
2 |
5 |
10,138 |
| Total |
9,515 |
2,501 |
7,290 |
522 |
52 |
110 |
10 |
7 |
20,007 |
| Qadisiya |
Males |
6,578 |
1,117 |
3,604 |
26 |
12 |
26 |
1 |
5 |
11,369 |
| Females |
6,913 |
898 |
4,404 |
637 |
24 |
25 |
1 |
1 |
12,903 |
| Total |
13,491 |
2,015 |
8,008 |
663 |
36 |
51 |
2 |
6 |
24,272 |
| Nuzha |
Males |
3,892 |
353 |
2,791 |
21 |
14 |
14 |
0 |
0 |
7,085 |
| Females |
4,240 |
255 |
3,015 |
390 |
13 |
9 |
0 |
1 |
7,923 |
| Total |
8,132 |
608 |
5,806 |
411 |
27 |
23 |
0 |
1 |
15,008 |
| Faiha |
Males |
6,140 |
1,191 |
3,714 |
16 |
7 |
16 |
2 |
0 |
11,086 |
| Females |
6,615 |
988 |
4,018 |
615 |
19 |
17 |
1 |
0 |
12,273 |
| Total |
12,755 |
2,179 |
7,732 |
631 |
26 |
33 |
3 |
0 |
23,359 |
| Kifan |
Males |
7,416 |
1,313 |
4,508 |
21 |
21 |
50 |
1 |
0 |
13,330 |
| Females |
8,028 |
1,213 |
5,169 |
768 |
56 |
32 |
0 |
0 |
15,266 |
| Total |
15,444 |
2,526 |
9,677 |
789 |
77 |
82 |
1 |
0 |
28,596 |
| Rawda |
Males |
10,662 |
1,206 |
5,432 |
48 |
14 |
43 |
12 |
0 |
17,417 |
| Females |
11,476 |
1,015 |
6,899 |
1,085 |
39 |
43 |
4 |
0 |
20,561 |
| Total |
22,138 |
2,221 |
12,331 |
1,133 |
53 |
86 |
16 |
0 |
37,978 |
| Idailiya |
Males |
5,815 |
713 |
3,527 |
22 |
23 |
15 |
8 |
4 |
10,127 |
| Females |
6,198 |
553 |
3,951 |
541 |
24 |
24 |
1 |
3 |
11,295 |
| Total |
12,013 |
1,266 |
7,478 |
563 |
47 |
39 |
9 |
7 |
21,422 |
| Khaldiya |
Males |
5,167 |
567 |
3,152 |
23 |
15 |
11 |
0 |
1 |
8,936 |
| Females |
5,364 |
381 |
3,548 |
438 |
17 |
16 |
0 |
3 |
9,767 |
| Total |
10,531 |
948 |
6,700 |
461 |
32 |
27 |
0 |
4 |
18,703 |
| Surra |
Males |
9,963 |
1,396 |
5,129 |
51 |
71 |
146 |
6 |
10 |
16,772 |
| Females |
10,143 |
1,191 |
6,796 |
942 |
70 |
138 |
6 |
8 |
19,294 |
| Total |
20,106 |
2,587 |
11,925 |
993 |
141 |
284 |
12 |
18 |
36,066 |
| Qurtuba |
Males |
8,982 |
850 |
4,611 |
199 |
55 |
43 |
0 |
2 |
14,742 |
| Females |
9,298 |
710 |
6,020 |
841 |
35 |
37 |
0 |
2 |
16,943 |
| Total |
18,280 |
1,560 |
10,631 |
1,040 |
90 |
80 |
0 |
4 |
31,685 |
| Al.yamouk |
Males |
6,494 |
839 |
4,741 |
26 |
46 |
37 |
1 |
3 |
12,187 |
| Females |
6,784 |
654 |
4,446 |
673 |
50 |
37 |
3 |
4 |
12,651 |
| Total |
13,278 |
1,493 |
9,187 |
699 |
96 |
74 |
4 |
7 |
24,838 |
| Shuwaikh |
Males |
1,001 |
320 |
1,793 |
7 |
2 |
5 |
0 |
1 |
3,129 |
| Females |
1,053 |
97 |
1,221 |
123 |
4 |
8 |
0 |
1 |
2,507 |
| Total |
2,054 |
417 |
3,014 |
130 |
6 |
13 |
0 |
2 |
5,636 |
| Shuwaikh – Ind |
Males |
33 |
2,375 |
5,276 |
166 |
102 |
92 |
3 |
15 |
8,062 |
| Females |
35 |
522 |
275 |
30 |
59 |
76 |
1 |
9 |
1,007 |
| Total |
68 |
2,897 |
5,551 |
196 |
161 |
168 |
4 |
24 |
9,069 |
| Garnada |
Males |
3,051 |
442 |
1,541 |
20 |
19 |
20 |
0 |
3 |
5,096 |
| Females |
3,081 |
372 |
1,469 |
274 |
10 |
20 |
0 |
3 |
5,229 |
| Total |
6,132 |
814 |
3,010 |
294 |
29 |
40 |
0 |
6 |
10,325 |
| Mubarakiya Comp |
Males |
0 |
257 |
1,802 |
1 |
1 |
0 |
0 |
3 |
2,064 |
| Females |
0 |
1 |
7 |
0 |
0 |
0 |
0 |
1 |
9 |
| Total |
0 |
258 |
1,809 |
1 |
1 |
0 |
0 |
4 |
2,073 |
| Health Reg |
Males |
42 |
95 |
59 |
0 |
2 |
0 |
1 |
0 |
199 |
| Females |
80 |
176 |
426 |
3 |
1 |
0 |
0 |
0 |
686 |
| Total |
122 |
271 |
485 |
3 |
3 |
0 |
1 |
0 |
885 |
| Sulaibekhat |
Males |
7,488 |
4,570 |
5,910 |
54 |
16 |
42 |
2 |
11 |
18,093 |
| Females |
8,091 |
2,930 |
3,145 |
702 |
24 |
25 |
1 |
11 |
14,929 |
| Total |
15,579 |
7,500 |
9,055 |
756 |
40 |
67 |
3 |
22 |
33,022 |
| Doha |
Males |
8,155 |
3,653 |
4,884 |
51 |
12 |
37 |
9 |
4 |
16,805 |
| Females |
8,691 |
2,922 |
3,210 |
660 |
17 |
26 |
8 |
2 |
15,536 |
| Total |
16,846 |
6,575 |
8,094 |
711 |
29 |
63 |
17 |
6 |
32,341 |
| Doha Port |
Males |
0 |
253 |
617 |
0 |
0 |
0 |
0 |
0 |
870 |
| Females |
0 |
4 |
11 |
0 |
0 |
0 |
0 |
0 |
15 |
| Total |
0 |
257 |
628 |
0 |
0 |
0 |
0 |
0 |
885 |
| Failakka Isl |
Males |
0 |
0 |
0 |
0 |
0 |
0 |
0 |
0 |
0 |
| Females |
1 |
0 |
1 |
0 |
0 |
0 |
0 |
0 |
2 |
| Total |
1 |
0 |
1 |
0 |
0 |
0 |
0 |
0 |
2 |
| Miskan Isl |
Males |
0 |
0 |
0 |
0 |
0 |
0 |
0 |
0 |
0 |
| Females |
0 |
0 |
0 |
0 |
0 |
0 |
0 |
0 |
0 |
| Total |
0 |
0 |
0 |
0 |
0 |
0 |
0 |
0 |
0 |
| Oha Isl |
Males |
0 |
0 |
0 |
0 |
0 |
0 |
0 |
0 |
0 |
| Females |
0 |
0 |
0 |
0 |
0 |
0 |
0 |
0 |
0 |
| Total |
0 |
0 |
0 |
0 |
0 |
0 |
0 |
0 |
0 |
| Kubar Isl |
Males |
0 |
0 |
0 |
0 |
0 |
0 |
0 |
0 |
0 |
| Females |
0 |
0 |
0 |
0 |
0 |
0 |
0 |
0 |
0 |
| Total |
0 |
0 |
0 |
0 |
0 |
0 |
0 |
0 |
0 |
| Qarowa Isl |
Males |
0 |
0 |
0 |
0 |
0 |
0 |
0 |
0 |
0 |
| Females |
0 |
0 |
0 |
0 |
0 |
0 |
0 |
0 |
0 |
| Total |
0 |
0 |
0 |
0 |
0 |
0 |
0 |
0 |
0 |
| Aum – Almaradim Isl |
Males |
0 |
0 |
0 |
0 |
0 |
0 |
0 |
0 |
0 |
| Females |
0 |
0 |
0 |
0 |
0 |
0 |
0 |
0 |
0 |
| Total |
0 |
0 |
0 |
0 |
0 |
0 |
0 |
0 |
0 |
| Aum – Alnamil Isl |
Males |
0 |
0 |
0 |
0 |
0 |
0 |
0 |
0 |
0 |
| Females |
0 |
0 |
0 |
0 |
0 |
0 |
0 |
0 |
0 |
| Total |
0 |
0 |
0 |
0 |
0 |
0 |
0 |
0 |
0 |
| Doha Resort |
Males |
0 |
0 |
2 |
0 |
0 |
0 |
0 |
0 |
2 |
| Females |
0 |
0 |
0 |
0 |
0 |
0 |
0 |
0 |
0 |
| Total |
0 |
0 |
2 |
0 |
0 |
0 |
0 |
0 |
2 |
| Free Zone |
Males |
0 |
0 |
0 |
0 |
0 |
0 |
0 |
0 |
0 |
| Females |
0 |
0 |
0 |
0 |
0 |
0 |
0 |
0 |
0 |
| Total |
0 |
0 |
0 |
0 |
0 |
0 |
0 |
0 |
0 |
| North-west of Sulaibekhat |
Males |
0 |
0 |
0 |
0 |
0 |
0 |
0 |
0 |
0 |
| Females |
0 |
0 |
0 |
0 |
0 |
0 |
0 |
0 |
0 |
| Total |
0 |
0 |
0 |
0 |
0 |
0 |
0 |
0 |
0 |
| Total Capital Governorate |
Males |
114,750 |
47,605 |
130,656 |
906 |
871 |
1,056 |
80 |
88 |
296,012 |
| Females |
120,955 |
22,903 |
84,977 |
11,387 |
828 |
878 |
49 |
64 |
242,041 |
| Total |
235,705 |
70,508 |
215,633 |
12,293 |
1,699 |
1,934 |
129 |
152 |
538,053 |
| Hawalli |
Males |
1,203 |
97,498 |
33,130 |
181 |
517 |
813 |
45 |
69 |
133,456 |
| Females |
1,248 |
47,509 |
17,366 |
1,099 |
561 |
720 |
37 |
57 |
68,597 |
| Total |
2,451 |
145,007 |
50,496 |
1,280 |
1,078 |
1,533 |
82 |
126 |
202,053 |
| Salmiya |
Males |
4,781 |
84,906 |
69,576 |
387 |
2,041 |
2,248 |
114 |
206 |
164,259 |
| Females |
5,026 |
60,202 |
52,673 |
2,051 |
2,063 |
1,789 |
116 |
167 |
124,087 |
| Total |
9,807 |
145,108 |
122,249 |
2,438 |
4,104 |
4,037 |
230 |
373 |
288,346 |
| Shaab |
Males |
3,186 |
1,886 |
2,540 |
15 |
131 |
187 |
9 |
28 |
7,982 |
| Females |
3,353 |
1,647 |
2,821 |
424 |
125 |
179 |
10 |
25 |
8,584 |
| Total |
6,539 |
3,533 |
5,361 |
439 |
256 |
366 |
19 |
53 |
16,566 |
| Rumaythiya |
Males |
17,338 |
2,429 |
7,629 |
33 |
98 |
144 |
26 |
13 |
27,710 |
| Females |
17,795 |
2,053 |
9,507 |
1,753 |
86 |
150 |
6 |
11 |
31,361 |
| Total |
35,133 |
4,482 |
17,136 |
1,786 |
184 |
294 |
32 |
24 |
59,071 |
| Salwa |
Males |
14,539 |
11,282 |
12,909 |
154 |
756 |
843 |
75 |
95 |
40,653 |
| Females |
15,682 |
9,277 |
12,475 |
1,565 |
744 |
743 |
50 |
98 |
40,634 |
| Total |
30,221 |
20,559 |
25,384 |
1,719 |
1,500 |
1,586 |
125 |
193 |
81,287 |
| Bedi |
Males |
71 |
158 |
439 |
1 |
34 |
20 |
1 |
8 |
732 |
| Females |
66 |
79 |
213 |
8 |
18 |
8 |
0 |
8 |
400 |
| Total |
137 |
237 |
652 |
9 |
52 |
28 |
1 |
16 |
1,132 |
| Mushaif |
Males |
12,523 |
808 |
5,229 |
73 |
91 |
86 |
8 |
6 |
18,824 |
| Females |
12,488 |
687 |
7,387 |
1,018 |
128 |
101 |
6 |
7 |
21,822 |
| Total |
25,011 |
1,495 |
12,616 |
1,091 |
219 |
187 |
14 |
13 |
40,646 |
| Mubarak Al-Abdel-Allah |
Males |
2,991 |
195 |
1,027 |
26 |
21 |
27 |
4 |
4 |
4,295 |
| Females |
3,020 |
162 |
1,557 |
277 |
30 |
30 |
0 |
8 |
5,084 |
| Total |
6,011 |
357 |
2,584 |
303 |
51 |
57 |
4 |
12 |
9,379 |
| Bayan |
Males |
14,675 |
1,372 |
6,107 |
48 |
79 |
113 |
8 |
6 |
22,408 |
| Females |
15,154 |
1,189 |
7,552 |
1,276 |
107 |
107 |
15 |
7 |
25,407 |
| Total |
29,829 |
2,561 |
13,659 |
1,324 |
186 |
220 |
23 |
13 |
47,815 |
| Mubarakiya |
Males |
0 |
0 |
0 |
0 |
0 |
0 |
0 |
0 |
0 |
| Females |
0 |
0 |
0 |
0 |
0 |
0 |
0 |
0 |
0 |
| Total |
0 |
0 |
0 |
0 |
0 |
0 |
0 |
0 |
0 |
| Jabriya |
Males |
11,602 |
14,028 |
10,312 |
134 |
432 |
810 |
16 |
73 |
37,407 |
| Females |
11,949 |
11,928 |
12,326 |
1,503 |
440 |
690 |
19 |
70 |
38,925 |
| Total |
23,551 |
25,956 |
22,638 |
1,637 |
872 |
1,500 |
35 |
143 |
76,332 |
| Wizarat area |
Males |
0 |
5 |
2 |
0 |
0 |
0 |
0 |
0 |
7 |
| Females |
0 |
2 |
0 |
0 |
0 |
0 |
0 |
0 |
2 |
| Total |
0 |
7 |
2 |
0 |
0 |
0 |
0 |
0 |
9 |
| Al-Shohadaa |
Males |
4,047 |
194 |
1,359 |
29 |
14 |
51 |
1 |
1 |
5,696 |
| Females |
4,051 |
216 |
1,931 |
339 |
15 |
41 |
0 |
3 |
6,596 |
| Total |
8,098 |
410 |
3,290 |
368 |
29 |
92 |
1 |
4 |
12,292 |
| Al-Zahraa |
Males |
7,351 |
509 |
2,439 |
36 |
30 |
60 |
5 |
1 |
10,431 |
| Females |
7,681 |
486 |
3,404 |
665 |
33 |
54 |
8 |
1 |
12,332 |
| Total |
15,032 |
995 |
5,843 |
701 |
63 |
114 |
13 |
2 |
22,763 |
| Hetteen |
Males |
5,676 |
305 |
1,810 |
7 |
11 |
30 |
1 |
3 |
7,843 |
| Females |
5,711 |
313 |
2,704 |
477 |
20 |
19 |
3 |
2 |
9,249 |
| Total |
11,387 |
618 |
4,514 |
484 |
31 |
49 |
4 |
5 |
17,092 |
| Al-Siddeek |
Males |
142 |
18 |
39 |
0 |
3 |
10 |
1 |
0 |
213 |
| Females |
149 |
15 |
62 |
6 |
2 |
7 |
0 |
0 |
241 |
| Total |
291 |
33 |
101 |
6 |
5 |
17 |
1 |
0 |
454 |
| Al-Salam |
Males |
7,365 |
495 |
2,449 |
29 |
40 |
61 |
13 |
6 |
10,458 |
| Females |
7,396 |
472 |
3,643 |
635 |
54 |
33 |
8 |
6 |
12,247 |
| Total |
14,761 |
967 |
6,092 |
664 |
94 |
94 |
21 |
12 |
22,705 |
| Anjafa |
Males |
26 |
54 |
170 |
0 |
13 |
16 |
0 |
0 |
279 |
| Females |
22 |
34 |
95 |
4 |
13 |
12 |
0 |
0 |
180 |
| Total |
48 |
88 |
265 |
4 |
26 |
28 |
0 |
0 |
459 |
| Total Hawalli Governorate |
Males |
107,516 |
216,142 |
157,166 |
1,153 |
4,311 |
5,519 |
327 |
519 |
492,653 |
| Females |
110,791 |
136,271 |
135,716 |
13,100 |
4,439 |
4,683 |
278 |
470 |
405,748 |
| Total |
218,307 |
352,413 |
292,882 |
14,253 |
8,750 |
10,202 |
605 |
989 |
898,401 |
| Ahmadi city |
Males |
5,701 |
4,868 |
7,463 |
26 |
94 |
197 |
25 |
30 |
18,404 |
| Females |
5,963 |
3,272 |
2,540 |
363 |
38 |
113 |
10 |
20 |
12,319 |
| Total |
11,664 |
8,140 |
10,003 |
389 |
132 |
310 |
35 |
50 |
30,723 |
| Fahaheel |
Males |
9,772 |
14,802 |
43,991 |
94 |
68 |
101 |
5 |
5 |
68,838 |
| Females |
10,083 |
4,856 |
12,230 |
550 |
23 |
50 |
4 |
2 |
27,798 |
| Total |
19,855 |
19,658 |
56,221 |
644 |
91 |
151 |
9 |
7 |
96,636 |
| Sabahiya |
Males |
22,184 |
6,313 |
13,706 |
104 |
25 |
24 |
5 |
7 |
42,368 |
| Females |
23,924 |
4,705 |
7,621 |
969 |
22 |
36 |
5 |
8 |
37,290 |
| Total |
46,108 |
11,018 |
21,327 |
1,073 |
47 |
60 |
10 |
15 |
79,658 |
| South – Sabahiya |
Males |
1 |
4 |
0 |
0 |
0 |
0 |
0 |
0 |
5 |
| Females |
0 |
1 |
0 |
0 |
0 |
0 |
0 |
0 |
1 |
| Total |
1 |
5 |
0 |
0 |
0 |
0 |
0 |
0 |
6 |
| Rikka |
Males |
15,268 |
3,038 |
8,035 |
82 |
13 |
12 |
7 |
1 |
26,456 |
| Females |
16,332 |
2,352 |
4,592 |
866 |
20 |
18 |
4 |
1 |
24,185 |
| Total |
31,600 |
5,390 |
12,627 |
948 |
33 |
30 |
11 |
2 |
50,641 |
| Hadiya |
Males |
7,781 |
712 |
3,364 |
34 |
3 |
21 |
0 |
1 |
11,916 |
| Females |
7,488 |
720 |
2,831 |
446 |
13 |
19 |
2 |
1 |
11,520 |
| Total |
15,269 |
1,432 |
6,195 |
480 |
16 |
40 |
2 |
2 |
23,436 |
| Fintas |
Males |
3,794 |
11,002 |
7,889 |
101 |
259 |
377 |
12 |
24 |
23,458 |
| Females |
3,875 |
7,540 |
3,243 |
402 |
182 |
161 |
11 |
22 |
15,436 |
| Total |
7,669 |
18,542 |
11,132 |
503 |
441 |
538 |
23 |
46 |
38,894 |
| Jaber Al-Ali |
Males |
16,513 |
1,188 |
6,701 |
61 |
4 |
8 |
1 |
0 |
24,476 |
| Females |
16,175 |
1,189 |
4,442 |
777 |
7 |
8 |
0 |
0 |
22,598 |
| Total |
32,688 |
2,377 |
11,143 |
838 |
11 |
16 |
1 |
0 |
47,074 |
| Auqqila |
Males |
2,571 |
331 |
1,191 |
26 |
91 |
77 |
8 |
9 |
4,304 |
| Females |
2,636 |
317 |
1,016 |
200 |
74 |
50 |
8 |
11 |
4,312 |
| Total |
5,207 |
648 |
2,207 |
226 |
165 |
127 |
16 |
20 |
8,616 |
| Abu- Alhasniya |
Males |
134 |
20 |
130 |
2 |
41 |
160 |
0 |
1 |
488 |
| Females |
135 |
22 |
130 |
12 |
26 |
31 |
0 |
1 |
357 |
| Total |
269 |
42 |
260 |
14 |
67 |
191 |
0 |
2 |
845 |
| Mahbula |
Males |
1,470 |
20,514 |
75,334 |
572 |
599 |
1,721 |
78 |
41 |
100,329 |
| Females |
1,621 |
6,346 |
10,932 |
528 |
348 |
681 |
44 |
24 |
20,524 |
| Total |
3,091 |
26,860 |
86,266 |
1,100 |
947 |
2,402 |
122 |
65 |
120,853 |
| Al- Adami |
Males |
0 |
0 |
0 |
0 |
0 |
0 |
0 |
0 |
0 |
| Females |
0 |
0 |
0 |
0 |
0 |
0 |
0 |
0 |
0 |
| Total |
0 |
0 |
0 |
0 |
0 |
0 |
0 |
0 |
0 |
| Abu-Halifa |
Males |
2,094 |
10,731 |
17,423 |
111 |
102 |
276 |
13 |
12 |
30,762 |
| Females |
2,084 |
7,269 |
8,412 |
210 |
64 |
91 |
4 |
5 |
18,139 |
| Total |
4,178 |
18,000 |
25,835 |
321 |
166 |
367 |
17 |
17 |
48,901 |
| Munkaf |
Males |
7,997 |
16,331 |
58,780 |
185 |
499 |
1,777 |
39 |
36 |
85,644 |
| Females |
8,118 |
8,385 |
18,070 |
716 |
244 |
640 |
36 |
24 |
36,233 |
| Total |
16,115 |
24,716 |
76,850 |
901 |
743 |
2,417 |
75 |
60 |
121,877 |
| Thaher |
Males |
13,058 |
2,007 |
5,943 |
66 |
0 |
4 |
3 |
1 |
21,082 |
| Females |
13,441 |
1,781 |
3,364 |
604 |
5 |
5 |
1 |
0 |
19,201 |
| Total |
26,499 |
3,788 |
9,307 |
670 |
5 |
9 |
4 |
1 |
40,283 |
| Shuaiba |
Males |
0 |
88 |
973 |
0 |
0 |
0 |
0 |
0 |
1,061 |
| Females |
0 |
5 |
9 |
0 |
0 |
0 |
0 |
0 |
14 |
| Total |
0 |
93 |
982 |
0 |
0 |
0 |
0 |
0 |
1,075 |
| Shuaiba-ind W |
Males |
0 |
2,872 |
22,526 |
19 |
16 |
2 |
0 |
0 |
25,435 |
| Females |
0 |
31 |
79 |
2 |
2 |
0 |
0 |
0 |
114 |
| Total |
0 |
2,903 |
22,605 |
21 |
18 |
2 |
0 |
0 |
25,549 |
| Abdulla -Port |
Males |
0 |
100 |
1,833 |
1 |
3 |
0 |
0 |
0 |
1,937 |
| Females |
0 |
1 |
3 |
0 |
0 |
0 |
0 |
0 |
4 |
| Total |
0 |
101 |
1,836 |
1 |
3 |
0 |
0 |
0 |
1,941 |
| Abdulla Port-Resort |
Males |
0 |
223 |
629 |
3 |
1 |
3 |
0 |
0 |
859 |
| Females |
0 |
12 |
8 |
0 |
3 |
0 |
0 |
0 |
23 |
| Total |
0 |
235 |
637 |
3 |
4 |
3 |
0 |
0 |
882 |
| Nwaiseeb resort |
Males |
0 |
1 |
0 |
0 |
0 |
0 |
0 |
0 |
1 |
| Females |
0 |
0 |
0 |
0 |
0 |
0 |
0 |
0 |
0 |
| Total |
0 |
1 |
0 |
0 |
0 |
0 |
0 |
0 |
1 |
| Al-Kayron resorts |
Males |
0 |
213 |
1,717 |
40 |
14 |
0 |
0 |
0 |
1,984 |
| Females |
0 |
25 |
56 |
0 |
3 |
0 |
0 |
0 |
84 |
| Total |
0 |
238 |
1,773 |
40 |
17 |
0 |
0 |
0 |
2,068 |
| Zoor Resort |
Males |
0 |
6 |
0 |
0 |
0 |
0 |
0 |
0 |
6 |
| Females |
0 |
6 |
0 |
0 |
0 |
0 |
0 |
0 |
6 |
| Total |
0 |
12 |
0 |
0 |
0 |
0 |
0 |
0 |
12 |
| Jlaiaa Resort |
Males |
0 |
4 |
202 |
0 |
0 |
44 |
0 |
0 |
250 |
| Females |
0 |
1 |
11 |
2 |
0 |
10 |
0 |
0 |
24 |
| Total |
0 |
5 |
213 |
2 |
0 |
54 |
0 |
0 |
274 |
| Bedier Resort |
Males |
0 |
14 |
2 |
0 |
0 |
0 |
0 |
0 |
16 |
| Females |
0 |
3 |
0 |
0 |
0 |
0 |
0 |
0 |
3 |
| Total |
0 |
17 |
2 |
0 |
0 |
0 |
0 |
0 |
19 |
| Dubaeeiya Resort |
Males |
0 |
9 |
8 |
0 |
0 |
0 |
0 |
0 |
17 |
| Females |
0 |
6 |
0 |
0 |
0 |
0 |
0 |
0 |
6 |
| Total |
0 |
15 |
8 |
0 |
0 |
0 |
0 |
0 |
23 |
| Zoor |
Males |
0 |
945 |
885 |
6 |
14 |
117 |
9 |
5 |
1,981 |
| Females |
1 |
735 |
131 |
24 |
12 |
102 |
12 |
5 |
1,022 |
| Total |
1 |
1,680 |
1,016 |
30 |
26 |
219 |
21 |
10 |
3,003 |
| Nwaiseeb |
Males |
0 |
0 |
0 |
0 |
0 |
0 |
0 |
0 |
0 |
| Females |
0 |
0 |
0 |
0 |
0 |
0 |
0 |
0 |
0 |
| Total |
0 |
0 |
0 |
0 |
0 |
0 |
0 |
0 |
0 |
| Sbainhiya |
Males |
0 |
0 |
0 |
0 |
0 |
0 |
0 |
0 |
0 |
| Females |
0 |
0 |
0 |
0 |
0 |
0 |
0 |
0 |
0 |
| Total |
0 |
0 |
0 |
0 |
0 |
0 |
0 |
0 |
0 |
| Wafra |
Males |
1 |
45 |
5 |
0 |
0 |
0 |
0 |
0 |
51 |
| Females |
0 |
50 |
0 |
0 |
0 |
0 |
0 |
0 |
50 |
| Total |
1 |
95 |
5 |
0 |
0 |
0 |
0 |
0 |
101 |
| New Wafra |
Males |
70 |
511 |
353 |
23 |
0 |
0 |
0 |
0 |
957 |
| Females |
61 |
340 |
65 |
6 |
0 |
0 |
0 |
0 |
472 |
| Total |
131 |
851 |
418 |
29 |
0 |
0 |
0 |
0 |
1,429 |
| Wafra -Agriculture |
Males |
1 |
1,694 |
7,704 |
210 |
0 |
0 |
0 |
0 |
9,609 |
| Females |
0 |
111 |
47 |
0 |
0 |
0 |
0 |
0 |
158 |
| Total |
1 |
1,805 |
7,751 |
210 |
0 |
0 |
0 |
0 |
9,767 |
| Wara |
Males |
0 |
0 |
1 |
0 |
0 |
0 |
0 |
0 |
1 |
| Females |
0 |
0 |
0 |
0 |
0 |
0 |
0 |
0 |
0 |
| Total |
0 |
0 |
1 |
0 |
0 |
0 |
0 |
0 |
1 |
| Muqwaa |
Males |
0 |
53 |
119 |
1 |
0 |
0 |
0 |
0 |
173 |
| Females |
0 |
0 |
0 |
0 |
0 |
0 |
0 |
0 |
0 |
| Total |
0 |
53 |
119 |
1 |
0 |
0 |
0 |
0 |
173 |
| Ahmadi – Desert |
Males |
0 |
29 |
230 |
0 |
0 |
0 |
0 |
0 |
259 |
| Females |
0 |
21 |
1 |
0 |
0 |
0 |
0 |
0 |
22 |
| Total |
0 |
50 |
231 |
0 |
0 |
0 |
0 |
0 |
281 |
| Gawakheer-South |
Males |
0 |
9 |
31 |
0 |
0 |
0 |
0 |
0 |
40 |
| Females |
0 |
0 |
0 |
0 |
0 |
0 |
0 |
0 |
0 |
| Total |
0 |
9 |
31 |
0 |
0 |
0 |
0 |
0 |
40 |
| Fahd Al – Ahmad |
Males |
7,391 |
387 |
2,652 |
31 |
6 |
9 |
3 |
3 |
10,482 |
| Females |
7,294 |
446 |
1,735 |
289 |
5 |
14 |
0 |
5 |
9,788 |
| Total |
14,685 |
833 |
4,387 |
320 |
11 |
23 |
3 |
8 |
20,270 |
| Ali Sabah Alsalem |
Males |
17,760 |
2,355 |
7,543 |
88 |
9 |
0 |
0 |
4 |
27,759 |
| Females |
16,908 |
2,574 |
3,395 |
670 |
6 |
0 |
1 |
4 |
23,558 |
| Total |
34,668 |
4,929 |
10,938 |
758 |
15 |
0 |
1 |
8 |
51,317 |
| Rajm Khashman |
Males |
0 |
23 |
25 |
1 |
0 |
0 |
0 |
0 |
49 |
| Females |
0 |
0 |
0 |
0 |
0 |
0 |
0 |
0 |
0 |
| Total |
0 |
23 |
25 |
1 |
0 |
0 |
0 |
0 |
49 |
| Sabah Al – Ahmad C |
Males |
1 |
0 |
17 |
0 |
6 |
0 |
0 |
0 |
24 |
| Females |
1 |
0 |
3 |
0 |
0 |
0 |
0 |
0 |
4 |
| Total |
2 |
0 |
20 |
0 |
6 |
0 |
0 |
0 |
28 |
| sabah al- ahmad ( 1 ) |
Males |
0 |
0 |
0 |
0 |
0 |
0 |
0 |
0 |
0 |
| Females |
0 |
0 |
0 |
0 |
0 |
0 |
0 |
0 |
0 |
| Total |
0 |
0 |
0 |
0 |
0 |
0 |
0 |
0 |
0 |
| sabah al- ahmad ( 2 ) |
Males |
0 |
0 |
0 |
0 |
0 |
0 |
0 |
0 |
0 |
| Females |
0 |
0 |
0 |
0 |
0 |
0 |
0 |
0 |
0 |
| Total |
0 |
0 |
0 |
0 |
0 |
0 |
0 |
0 |
0 |
| sabah al- ahmad ( 3 ) |
Males |
3 |
0 |
3 |
0 |
0 |
0 |
0 |
0 |
6 |
| Females |
4 |
0 |
0 |
0 |
0 |
0 |
0 |
0 |
4 |
| Total |
7 |
0 |
3 |
0 |
0 |
0 |
0 |
0 |
10 |
| sabah al- ahmad ( 4 ) |
Males |
0 |
0 |
0 |
0 |
0 |
0 |
0 |
0 |
0 |
| Females |
0 |
0 |
0 |
0 |
0 |
0 |
0 |
0 |
0 |
| Total |
0 |
0 |
0 |
0 |
0 |
0 |
0 |
0 |
0 |
| sabah al- ahmad ( 5 ) |
Males |
0 |
0 |
0 |
0 |
0 |
0 |
0 |
0 |
0 |
| Females |
0 |
0 |
0 |
0 |
0 |
0 |
0 |
0 |
0 |
| Total |
0 |
0 |
0 |
0 |
0 |
0 |
0 |
0 |
0 |
| Kabad – Agriculture |
Males |
0 |
1 |
0 |
0 |
0 |
0 |
0 |
0 |
1 |
| Females |
0 |
0 |
0 |
0 |
0 |
0 |
0 |
0 |
0 |
| Total |
0 |
1 |
0 |
0 |
0 |
0 |
0 |
0 |
1 |
| Al-Kayron residential |
Males |
0 |
0 |
0 |
0 |
0 |
0 |
0 |
0 |
0 |
| Females |
0 |
0 |
0 |
0 |
0 |
0 |
0 |
0 |
0 |
| Total |
0 |
0 |
0 |
0 |
0 |
0 |
0 |
0 |
0 |
| Total Al-Ahmadi Governorate |
Males |
133,565 |
101,443 |
297,408 |
1,887 |
1,867 |
4,930 |
208 |
180 |
541,488 |
| Females |
136,144 |
53,122 |
84,966 |
7,636 |
1,097 |
2,029 |
142 |
133 |
285,269 |
| Total |
269,709 |
154,565 |
382,374 |
9,523 |
2,964 |
6,959 |
350 |
313 |
826,757 |
| Jahra |
Males |
4,437 |
19,211 |
13,813 |
121 |
36 |
8 |
2 |
10 |
37,638 |
| Females |
4,591 |
11,197 |
5,297 |
472 |
39 |
10 |
1 |
7 |
21,614 |
| Total |
9,028 |
30,408 |
19,110 |
593 |
75 |
18 |
3 |
17 |
59,252 |
| Al – Kasser |
Males |
11,819 |
11,662 |
8,566 |
142 |
16 |
4 |
6 |
2 |
32,217 |
| Females |
12,836 |
7,475 |
4,589 |
918 |
13 |
5 |
3 |
2 |
25,841 |
| Total |
24,655 |
19,137 |
13,155 |
1,060 |
29 |
9 |
9 |
4 |
58,058 |
| Al – Naim |
Males |
4,547 |
1,470 |
1,927 |
54 |
0 |
3 |
1 |
0 |
8,002 |
| Females |
4,397 |
1,466 |
1,225 |
378 |
4 |
4 |
2 |
0 |
7,476 |
| Total |
8,944 |
2,936 |
3,152 |
432 |
4 |
7 |
3 |
0 |
15,478 |
| Al – Naseem |
Males |
6,768 |
1,942 |
3,239 |
94 |
3 |
2 |
0 |
5 |
12,053 |
| Females |
6,777 |
1,629 |
2,019 |
576 |
1 |
1 |
0 |
2 |
11,005 |
| Total |
13,545 |
3,571 |
5,258 |
670 |
4 |
3 |
0 |
7 |
23,058 |
| Taimaa |
Males |
1,035 |
27,302 |
2,936 |
62 |
11 |
23 |
10 |
10 |
31,389 |
| Females |
2,057 |
25,786 |
2,092 |
876 |
10 |
18 |
9 |
5 |
30,853 |
| Total |
3,092 |
53,088 |
5,028 |
938 |
21 |
41 |
19 |
15 |
62,242 |
| Waha |
Males |
10,023 |
4,779 |
6,136 |
133 |
7 |
3 |
0 |
0 |
21,081 |
| Females |
10,739 |
4,352 |
3,508 |
845 |
8 |
6 |
0 |
0 |
19,458 |
| Total |
20,762 |
9,131 |
9,644 |
978 |
15 |
9 |
0 |
0 |
40,539 |
| Al – Auyon |
Males |
11,499 |
3,967 |
6,270 |
152 |
2 |
6 |
1 |
3 |
21,900 |
| Females |
11,785 |
3,564 |
3,392 |
1,030 |
7 |
4 |
0 |
0 |
19,782 |
| Total |
23,284 |
7,531 |
9,662 |
1,182 |
9 |
10 |
1 |
3 |
41,682 |
| Sekrab – Reg |
Males |
0 |
47 |
109 |
0 |
0 |
0 |
0 |
0 |
156 |
| Females |
0 |
0 |
0 |
0 |
0 |
0 |
0 |
0 |
0 |
| Total |
0 |
47 |
109 |
0 |
0 |
0 |
0 |
0 |
156 |
| Jahraa Ind |
Males |
0 |
135 |
676 |
0 |
0 |
0 |
0 |
0 |
811 |
| Females |
0 |
14 |
8 |
0 |
0 |
0 |
0 |
0 |
22 |
| Total |
0 |
149 |
684 |
0 |
0 |
0 |
0 |
0 |
833 |
| Sulaibiya -Shabiya |
Males |
1,195 |
24,075 |
2,892 |
41 |
30 |
81 |
35 |
16 |
28,365 |
| Females |
2,903 |
22,266 |
2,056 |
809 |
21 |
63 |
19 |
18 |
28,155 |
| Total |
4,098 |
46,341 |
4,948 |
850 |
51 |
144 |
54 |
34 |
56,520 |
| Sulaibiya – Ind (1) |
Males |
0 |
373 |
1,045 |
0 |
0 |
0 |
0 |
0 |
1,418 |
| Females |
0 |
19 |
3 |
0 |
0 |
0 |
0 |
0 |
22 |
| Total |
0 |
392 |
1,048 |
0 |
0 |
0 |
0 |
0 |
1,440 |
| Sulaibiya – Ind (2) |
Males |
0 |
317 |
3,098 |
32 |
14 |
16 |
12 |
0 |
3,489 |
| Females |
0 |
12 |
35 |
5 |
4 |
5 |
0 |
0 |
61 |
| Total |
0 |
329 |
3,133 |
37 |
18 |
21 |
12 |
0 |
3,550 |
| Sulaibiya – Ind (3) |
Males |
0 |
4 |
2 |
0 |
0 |
0 |
0 |
0 |
6 |
| Females |
0 |
0 |
0 |
0 |
0 |
0 |
0 |
0 |
0 |
| Total |
0 |
4 |
2 |
0 |
0 |
0 |
0 |
0 |
6 |
| Sulaibiya -Agriculture |
Males |
0 |
623 |
2,728 |
12 |
2 |
0 |
0 |
0 |
3,365 |
| Females |
0 |
105 |
10 |
0 |
0 |
0 |
0 |
0 |
115 |
| Total |
0 |
728 |
2,738 |
12 |
2 |
0 |
0 |
0 |
3,480 |
| Abdelli |
Males |
0 |
2,194 |
5,718 |
322 |
3 |
0 |
0 |
0 |
8,237 |
| Females |
0 |
56 |
25 |
0 |
0 |
0 |
0 |
0 |
81 |
| Total |
0 |
2,250 |
5,743 |
322 |
3 |
0 |
0 |
0 |
8,318 |
| Amgara – Ind |
Males |
0 |
2,764 |
9,278 |
75 |
2 |
0 |
0 |
0 |
12,119 |
| Females |
0 |
26 |
52 |
2 |
0 |
0 |
0 |
0 |
80 |
| Total |
0 |
2,790 |
9,330 |
77 |
2 |
0 |
0 |
0 |
12,199 |
| Mitlaa |
Males |
0 |
14 |
1 |
0 |
0 |
0 |
0 |
0 |
15 |
| Females |
0 |
12 |
0 |
0 |
0 |
0 |
0 |
0 |
12 |
| Total |
0 |
26 |
1 |
0 |
0 |
0 |
0 |
0 |
27 |
| Kathma |
Males |
0 |
1 |
99 |
0 |
0 |
0 |
0 |
0 |
100 |
| Females |
0 |
0 |
0 |
0 |
0 |
0 |
0 |
0 |
0 |
| Total |
0 |
1 |
99 |
0 |
0 |
0 |
0 |
0 |
100 |
| Al – Rawadatain |
Males |
0 |
38 |
50 |
0 |
0 |
0 |
0 |
0 |
88 |
| Females |
0 |
3 |
1 |
0 |
0 |
0 |
0 |
0 |
4 |
| Total |
0 |
41 |
51 |
0 |
0 |
0 |
0 |
0 |
92 |
| Aum – Al – Ash |
Males |
0 |
1 |
25 |
0 |
0 |
0 |
0 |
0 |
26 |
| Females |
0 |
0 |
0 |
0 |
0 |
0 |
0 |
0 |
0 |
| Total |
0 |
1 |
25 |
0 |
0 |
0 |
0 |
0 |
26 |
| Al – Salmi |
Males |
0 |
182 |
411 |
6 |
0 |
0 |
0 |
0 |
599 |
| Females |
0 |
5 |
8 |
0 |
0 |
0 |
0 |
0 |
13 |
| Total |
0 |
187 |
419 |
6 |
0 |
0 |
0 |
0 |
612 |
| Kabad |
Males |
0 |
100 |
297 |
9 |
0 |
0 |
0 |
0 |
406 |
| Females |
0 |
9 |
1 |
0 |
0 |
0 |
0 |
0 |
10 |
| Total |
0 |
109 |
298 |
9 |
0 |
0 |
0 |
0 |
416 |
| Shegaya |
Males |
0 |
0 |
0 |
0 |
0 |
0 |
0 |
0 |
0 |
| Females |
0 |
0 |
0 |
0 |
0 |
0 |
0 |
0 |
0 |
| Total |
0 |
0 |
0 |
0 |
0 |
0 |
0 |
0 |
0 |
| Al – Sebiya |
Males |
0 |
1 |
35 |
0 |
0 |
0 |
0 |
0 |
36 |
| Females |
0 |
0 |
2 |
0 |
0 |
0 |
0 |
0 |
2 |
| Total |
0 |
1 |
37 |
0 |
0 |
0 |
0 |
0 |
38 |
| Jahra – Camp |
Males |
0 |
0 |
84 |
0 |
0 |
0 |
0 |
0 |
84 |
| Females |
0 |
0 |
0 |
0 |
0 |
0 |
0 |
0 |
0 |
| Total |
0 |
0 |
84 |
0 |
0 |
0 |
0 |
0 |
84 |
| Al – Atraaf |
Males |
0 |
0 |
0 |
0 |
0 |
0 |
0 |
0 |
0 |
| Females |
0 |
0 |
0 |
0 |
0 |
0 |
0 |
0 |
0 |
| Total |
0 |
0 |
0 |
0 |
0 |
0 |
0 |
0 |
0 |
| Warba Isl |
Males |
0 |
0 |
0 |
0 |
0 |
0 |
0 |
0 |
0 |
| Females |
0 |
0 |
0 |
0 |
0 |
0 |
0 |
0 |
0 |
| Total |
0 |
0 |
0 |
0 |
0 |
0 |
0 |
0 |
0 |
| Bubyan Isl |
Males |
0 |
0 |
0 |
0 |
0 |
0 |
0 |
0 |
0 |
| Females |
0 |
0 |
0 |
0 |
0 |
0 |
0 |
0 |
0 |
| Total |
0 |
0 |
0 |
0 |
0 |
0 |
0 |
0 |
0 |
| Jahara – Desert |
Males |
0 |
533 |
1,144 |
19 |
0 |
0 |
0 |
0 |
1,696 |
| Females |
0 |
11 |
4 |
0 |
0 |
0 |
0 |
0 |
15 |
| Total |
0 |
544 |
1,148 |
19 |
0 |
0 |
0 |
0 |
1,711 |
| Saad Al – Abdulla city |
Males |
27,330 |
5,163 |
10,477 |
241 |
18 |
29 |
3 |
7 |
43,268 |
| Females |
26,913 |
4,951 |
6,412 |
1,876 |
17 |
31 |
4 |
10 |
40,214 |
| Total |
54,243 |
10,114 |
16,889 |
2,117 |
35 |
60 |
7 |
17 |
83,482 |
| Qayrawan |
Males |
5,613 |
881 |
2,075 |
33 |
11 |
47 |
11 |
17 |
8,688 |
| Females |
5,459 |
851 |
1,657 |
506 |
12 |
41 |
4 |
4 |
8,534 |
| Total |
11,072 |
1,732 |
3,732 |
539 |
23 |
88 |
15 |
21 |
17,222 |
| Jahraa -Gawakheer |
Males |
0 |
1 |
2 |
0 |
0 |
0 |
0 |
0 |
3 |
| Females |
0 |
0 |
0 |
0 |
0 |
0 |
0 |
0 |
0 |
| Total |
0 |
1 |
2 |
0 |
0 |
0 |
0 |
0 |
3 |
| Kazma Resort |
Males |
0 |
0 |
0 |
0 |
0 |
0 |
0 |
0 |
0 |
| Females |
0 |
0 |
0 |
0 |
0 |
0 |
0 |
0 |
0 |
| Total |
0 |
0 |
0 |
0 |
0 |
0 |
0 |
0 |
0 |
| AlSubbiya Resort |
Males |
0 |
0 |
0 |
0 |
0 |
0 |
0 |
0 |
0 |
| Females |
0 |
0 |
0 |
0 |
0 |
0 |
0 |
0 |
0 |
| Total |
0 |
0 |
0 |
0 |
0 |
0 |
0 |
0 |
0 |
| Al-Behaith |
Males |
0 |
0 |
0 |
0 |
0 |
0 |
0 |
0 |
0 |
| Females |
0 |
0 |
0 |
0 |
0 |
0 |
0 |
0 |
0 |
| Total |
0 |
0 |
0 |
0 |
0 |
0 |
0 |
0 |
0 |
| Northwest Jahra |
Males |
0 |
12 |
70 |
1 |
0 |
2 |
0 |
0 |
85 |
| Females |
0 |
3 |
5 |
2 |
0 |
0 |
0 |
0 |
10 |
| Total |
0 |
15 |
75 |
3 |
0 |
2 |
0 |
0 |
95 |
| Jaber al-Ahmad |
Males |
1,942 |
327 |
650 |
6 |
3 |
14 |
1 |
1 |
2,944 |
| Females |
1,961 |
312 |
434 |
125 |
2 |
10 |
0 |
2 |
2,846 |
| Total |
3,903 |
639 |
1,084 |
131 |
5 |
24 |
1 |
3 |
5,790 |
| neayem |
Males |
0 |
0 |
6 |
0 |
0 |
0 |
0 |
0 |
6 |
| Females |
0 |
0 |
0 |
0 |
0 |
0 |
0 |
0 |
0 |
| Total |
0 |
0 |
6 |
0 |
0 |
0 |
0 |
0 |
6 |
| Total Al-jahra Governorate |
Males |
86,208 |
108,119 |
83,859 |
1,555 |
158 |
238 |
82 |
71 |
280,290 |
| Females |
90,418 |
84,124 |
32,835 |
8,420 |
138 |
198 |
42 |
50 |
216,225 |
| Total |
176,626 |
192,243 |
116,694 |
9,975 |
296 |
436 |
124 |
121 |
496,515 |
| Farwaniya |
Males |
3,439 |
91,740 |
86,517 |
899 |
227 |
143 |
17 |
11 |
182,993 |
| Females |
3,546 |
34,367 |
23,886 |
825 |
138 |
113 |
14 |
11 |
62,900 |
| Total |
6,985 |
126,107 |
110,403 |
1,724 |
365 |
256 |
31 |
22 |
245,893 |
| Surra – Park |
Males |
0 |
0 |
0 |
0 |
0 |
0 |
0 |
0 |
0 |
| Females |
0 |
0 |
0 |
0 |
0 |
0 |
0 |
0 |
0 |
| Total |
0 |
0 |
0 |
0 |
0 |
0 |
0 |
0 |
0 |
| Khitan |
Males |
6,853 |
61,447 |
44,933 |
224 |
116 |
109 |
22 |
7 |
113,711 |
| Females |
7,202 |
17,162 |
17,154 |
845 |
84 |
73 |
14 |
5 |
42,539 |
| Total |
14,055 |
78,609 |
62,087 |
1,069 |
200 |
182 |
36 |
12 |
156,250 |
| AlRaay |
Males |
0 |
1,585 |
4,624 |
5 |
3 |
3 |
0 |
0 |
6,220 |
| Females |
0 |
13 |
71 |
1 |
2 |
0 |
0 |
0 |
87 |
| Total |
0 |
1,598 |
4,695 |
6 |
5 |
3 |
0 |
0 |
6,307 |
| Omarya |
Males |
4,653 |
1,326 |
3,397 |
28 |
7 |
15 |
4 |
0 |
9,430 |
| Females |
5,104 |
1,036 |
2,795 |
453 |
10 |
11 |
3 |
0 |
9,412 |
| Total |
9,757 |
2,362 |
6,192 |
481 |
17 |
26 |
7 |
0 |
18,842 |
| Rabiya |
Males |
5,290 |
1,698 |
3,770 |
35 |
4 |
15 |
4 |
1 |
10,817 |
| Females |
5,832 |
1,370 |
2,558 |
384 |
6 |
10 |
0 |
4 |
10,164 |
| Total |
11,122 |
3,068 |
6,328 |
419 |
10 |
25 |
4 |
5 |
20,981 |
| Rihab |
Males |
5,642 |
517 |
2,400 |
33 |
0 |
9 |
0 |
2 |
8,603 |
| Females |
5,800 |
456 |
2,077 |
436 |
3 |
8 |
0 |
0 |
8,780 |
| Total |
11,442 |
973 |
4,477 |
469 |
3 |
17 |
0 |
2 |
17,383 |
| Jleeb Al -Shuyoukh |
Males |
2,795 |
74,432 |
170,183 |
470 |
33 |
28 |
33 |
18 |
247,992 |
| Females |
2,709 |
18,571 |
35,775 |
474 |
27 |
21 |
1 |
8 |
57,586 |
| Total |
5,504 |
93,003 |
205,958 |
944 |
60 |
49 |
34 |
26 |
305,578 |
| Reggae |
Males |
318 |
7,084 |
16,120 |
72 |
141 |
95 |
3 |
5 |
23,838 |
| Females |
398 |
3,803 |
8,040 |
142 |
67 |
81 |
2 |
2 |
12,535 |
| Total |
716 |
10,887 |
24,160 |
214 |
208 |
176 |
5 |
7 |
36,373 |
| Andalus |
Males |
11,731 |
5,083 |
7,461 |
76 |
34 |
82 |
18 |
13 |
24,498 |
| Females |
12,235 |
4,175 |
5,780 |
1,209 |
25 |
87 |
10 |
6 |
23,527 |
| Total |
23,966 |
9,258 |
13,241 |
1,285 |
59 |
169 |
28 |
19 |
48,025 |
| Ardiya |
Males |
16,838 |
3,466 |
8,539 |
112 |
14 |
36 |
5 |
0 |
29,010 |
| Females |
17,794 |
3,036 |
6,312 |
1,340 |
11 |
15 |
3 |
0 |
28,511 |
| Total |
34,632 |
6,502 |
14,851 |
1,452 |
25 |
51 |
8 |
0 |
57,521 |
| Sabah Alnasir |
Males |
12,554 |
2,129 |
6,318 |
63 |
9 |
13 |
7 |
1 |
21,094 |
| Females |
13,186 |
1,991 |
4,143 |
750 |
10 |
16 |
9 |
4 |
20,109 |
| Total |
25,740 |
4,120 |
10,461 |
813 |
19 |
29 |
16 |
5 |
41,203 |
| Ardiya(4) |
Males |
0 |
20 |
16 |
23 |
0 |
0 |
0 |
0 |
59 |
| Females |
0 |
10 |
1 |
10 |
1 |
0 |
0 |
0 |
22 |
| Total |
0 |
30 |
17 |
33 |
1 |
0 |
0 |
0 |
81 |
| Ishbiliya |
Males |
6,275 |
1,241 |
2,955 |
37 |
5 |
49 |
2 |
2 |
10,566 |
| Females |
6,547 |
1,206 |
2,474 |
402 |
4 |
45 |
4 |
0 |
10,682 |
| Total |
12,822 |
2,447 |
5,429 |
439 |
9 |
94 |
6 |
2 |
21,248 |
| Ardiya(6) |
Males |
0 |
82 |
483 |
0 |
0 |
1 |
0 |
0 |
566 |
| Females |
0 |
9 |
16 |
0 |
0 |
3 |
0 |
0 |
28 |
| Total |
0 |
91 |
499 |
0 |
0 |
4 |
0 |
0 |
594 |
| Fordus |
Males |
17,684 |
4,997 |
9,915 |
135 |
11 |
12 |
2 |
6 |
32,762 |
| Females |
19,420 |
4,307 |
6,130 |
1,277 |
16 |
10 |
9 |
6 |
31,175 |
| Total |
37,104 |
9,304 |
16,045 |
1,412 |
27 |
22 |
11 |
12 |
63,937 |
| Air Plan Noise Reg |
Males |
0 |
13 |
30 |
0 |
0 |
0 |
0 |
0 |
43 |
| Females |
0 |
2 |
3 |
0 |
0 |
0 |
0 |
0 |
5 |
| Total |
0 |
15 |
33 |
0 |
0 |
0 |
0 |
0 |
48 |
| International Airport |
Males |
0 |
19 |
197 |
0 |
0 |
0 |
0 |
0 |
216 |
| Females |
0 |
2 |
11 |
0 |
0 |
0 |
0 |
0 |
13 |
| Total |
0 |
21 |
208 |
0 |
0 |
0 |
0 |
0 |
229 |
| Al – Nahda |
Males |
2,313 |
222 |
882 |
8 |
2 |
0 |
0 |
0 |
3,427 |
| Females |
2,328 |
222 |
758 |
219 |
1 |
2 |
0 |
0 |
3,530 |
| Total |
4,641 |
444 |
1,640 |
227 |
3 |
2 |
0 |
0 |
6,957 |
| Abdulla Mubarak AlSabah |
Males |
15,252 |
2,088 |
6,190 |
83 |
27 |
58 |
5 |
9 |
23,712 |
| Females |
15,199 |
2,215 |
4,736 |
1,162 |
38 |
47 |
3 |
5 |
23,405 |
| Total |
30,451 |
4,303 |
10,926 |
1,245 |
65 |
105 |
8 |
14 |
47,117 |
| Ardiya craft |
Males |
0 |
6 |
3 |
0 |
0 |
0 |
0 |
0 |
9 |
| Females |
0 |
0 |
0 |
0 |
0 |
0 |
0 |
0 |
0 |
| Total |
0 |
6 |
3 |
0 |
0 |
0 |
0 |
0 |
9 |
| Total Al-Farwaniya Governorate |
Males |
111,637 |
259,195 |
374,933 |
2,303 |
633 |
668 |
122 |
75 |
749,566 |
| Females |
117,300 |
93,953 |
122,720 |
9,929 |
443 |
542 |
72 |
51 |
345,010 |
| Total |
228,937 |
353,148 |
497,653 |
12,232 |
1,076 |
1,210 |
194 |
126 |
1,094,576 |
| Mubarak Kabeer |
Males |
13,591 |
873 |
4,838 |
39 |
15 |
38 |
3 |
4 |
19,401 |
| Females |
13,134 |
924 |
4,635 |
1,060 |
30 |
31 |
1 |
0 |
19,815 |
| Total |
26,725 |
1,797 |
9,473 |
1,099 |
45 |
69 |
4 |
4 |
39,216 |
| Qurain |
Males |
10,481 |
648 |
4,104 |
25 |
16 |
6 |
8 |
1 |
15,289 |
| Females |
10,343 |
781 |
3,519 |
773 |
17 |
9 |
1 |
0 |
15,443 |
| Total |
20,824 |
1,429 |
7,623 |
798 |
33 |
15 |
9 |
1 |
30,732 |
| Al – Adan |
Males |
10,946 |
809 |
4,343 |
33 |
24 |
31 |
2 |
1 |
16,189 |
| Females |
10,913 |
946 |
3,964 |
862 |
25 |
39 |
4 |
0 |
16,753 |
| Total |
21,859 |
1,755 |
8,307 |
895 |
49 |
70 |
6 |
1 |
32,942 |
| Qosoor |
Males |
12,284 |
850 |
4,565 |
48 |
8 |
9 |
5 |
2 |
17,771 |
| Females |
12,381 |
944 |
4,138 |
931 |
5 |
16 |
8 |
2 |
18,425 |
| Total |
24,665 |
1,794 |
8,703 |
979 |
13 |
25 |
13 |
4 |
36,196 |
| Misila |
Males |
103 |
244 |
659 |
34 |
51 |
6 |
0 |
3 |
1,100 |
| Females |
124 |
102 |
331 |
43 |
39 |
7 |
2 |
0 |
648 |
| Total |
227 |
346 |
990 |
77 |
90 |
13 |
2 |
3 |
1,748 |
| AL-masayel |
Males |
33 |
1 |
17 |
0 |
0 |
0 |
0 |
0 |
51 |
| Females |
36 |
2 |
9 |
1 |
0 |
0 |
0 |
0 |
48 |
| Total |
69 |
3 |
26 |
1 |
0 |
0 |
0 |
0 |
99 |
| Subah Alsalim |
Males |
24,918 |
4,198 |
11,626 |
84 |
88 |
135 |
9 |
10 |
41,068 |
| Females |
26,847 |
3,578 |
9,981 |
1,823 |
106 |
99 |
11 |
11 |
42,456 |
| Total |
51,765 |
7,776 |
21,607 |
1,907 |
194 |
234 |
20 |
21 |
83,524 |
| Fanatees |
Males |
58 |
40 |
196 |
2 |
8 |
1 |
0 |
0 |
305 |
| Females |
53 |
16 |
84 |
19 |
6 |
2 |
0 |
0 |
180 |
| Total |
111 |
56 |
280 |
21 |
14 |
3 |
0 |
0 |
485 |
| Sabhan Ind |
Males |
0 |
1,191 |
4,063 |
1 |
1 |
0 |
0 |
0 |
5,256 |
| Females |
0 |
23 |
33 |
1 |
1 |
0 |
0 |
0 |
58 |
| Total |
0 |
1,214 |
4,096 |
2 |
2 |
0 |
0 |
0 |
5,314 |
| Abu – Fatira |
Males |
11 |
6 |
22 |
0 |
0 |
0 |
0 |
0 |
39 |
| Females |
11 |
1 |
2 |
0 |
0 |
0 |
0 |
0 |
14 |
| Total |
22 |
7 |
24 |
0 |
0 |
0 |
0 |
0 |
53 |
| Mid – Reg |
Males |
0 |
80 |
1,852 |
0 |
21 |
0 |
0 |
0 |
1,953 |
| Females |
0 |
16 |
16 |
1 |
113 |
0 |
0 |
0 |
146 |
| Total |
0 |
96 |
1,868 |
1 |
134 |
0 |
0 |
0 |
2,099 |
| West Abu Fateera Ind |
Males |
0 |
2 |
17 |
1 |
0 |
0 |
0 |
0 |
20 |
| Females |
0 |
0 |
0 |
0 |
0 |
0 |
0 |
0 |
0 |
| Total |
0 |
2 |
17 |
1 |
0 |
0 |
0 |
0 |
20 |
| Total Mubarak Al-Kabeer Governorate |
Males |
72,425 |
8,942 |
36,302 |
267 |
232 |
226 |
27 |
21 |
118,442 |
| Females |
73,842 |
7,333 |
26,712 |
5,514 |
342 |
203 |
27 |
13 |
113,986 |
| Total |
146,267 |
16,275 |
63,014 |
5,781 |
574 |
429 |
54 |
34 |
232,428 |
| Not Stated |
Males |
155 |
1,947 |
869 |
21 |
39 |
47 |
1 |
5 |
3,084 |
| Females |
151 |
1,565 |
348 |
36 |
27 |
47 |
2 |
3 |
2,179 |
| Total |
306 |
3,512 |
1,217 |
57 |
66 |
94 |
3 |
8 |
5,263 |
| Total |
Males |
626,256 |
743,393 |
1,081,193 |
8,092 |
8,111 |
12,684 |
847 |
959 |
2,481,535 |
| Females |
649,601 |
399,271 |
488,274 |
56,022 |
7,314 |
8,580 |
612 |
784 |
1,610,458 |
| Total |
1,275,857 |
1,142,664 |
1,569,467 |
64,114 |
15,425 |
21,264 |
1,459 |
1,743 |
4,091,993 |
Source: PACI
ANNEXED NOTE
1. Characteristics of data and definitions
The source of data used here is the Public Authority for Civil Information (PACI), an independant government body in charge of :
1- centralising all population and labour force data in order to manage a fully computerised population register
2- issuing mandatory civil identification cards to every resident of the country, regardless of age and nationality.
The other source of demographic and socioeconomic data on Kuwait is the Central Statistical Office (CSO), operating within the Planning Ministry. The CSO has conducted ten population and housing censuses since its inception in 1957.
Since 1995 a marked discrepancy was witnessed between PACI’ and CSO’ population figures. PACI’ database is connected electronically with other administrations and bodies registering demographic events and professional/ residency issues (births and death; departures and arrivals; end of service, residency and ID deliveries, etc.).
PACI’s records of residents’ movements is thus regularly updated, which limits the risk of population overcount. Therefore, it is more likely that residents were undercounted during CSO- Ministry of Planning’s census operations (see: Shah, N. Population of Kuwait. Structure and Dynamics, Kuwait: Kuwait University Academic Publication Council, 2010, chapter 1).
(a) Kuwaiti: the Kuwaiti nationality rests upon a document of Kuwaiti nationality or a certificate proving Kuwaiti nationality issued by the Ministry of Interior of Kuwait.
(b) Non-Kuwaiti: his/ her nationality is determined by the name of the State which issued the passport. The foreign national also entered Kuwait legally and has a stamp of residence.
This category includes the Bidoon, a category of stateless persons living in the Emirate. Kuwait’s Bidoon population originates from three broad categories:
1) those whose ancestors failed to apply for nationality or lacked necessary documentation at the time of Kuwait’s independence in 1961;
2) those recruited to work in Kuwait’s army or police force during the 1960s who permanently settled in Kuwait, along with their families;
3) children of Kuwaiti mothers and stateless or foreign fathers (see Human Rights Watch. Prisoners of the Past. Kuwaiti Bidun and the Burden of Statelessness, June 2011, p. 3).
(The children of Kuwaiti mothers and non-Kuwaiti fathers (with specific nationality) inherit the father’s nationality. They are stateless if the father is stateless).
(c) Nationality group: collected according to the nationality of the head of the household.
Nationalities are grouped according to specific features common to certain population subgroups: language, geographic origin, etc. or according to internationally recognized categories such as: (Arab / non-Arab Asian countries / non-Arab African countries; European countries … etc.).
2. Institution which provides data
The Public Authority for Civil Information (PACI)
3. Period of data coverage: 31 December 2014
The database is updated three times a year and the website presents only the most recent data.
4. Data availability
The statistics section of PACI’s website (http://www.paci.gov.kw/en/ (English); http://www.paci.gov.kw/ (Arabic)) provides population and socio-economic data broken down by nationality (Kuwaiti/ non-Kuwaiti). Some data are displayed by nationality groups.
Analytical tables and data crosstabulations are available for download in PDF, html, .png and Excel (.csv) formats.
The “publications” section also proposes a selection of data tables processed thematically in downloadable Excel and PDF format (English and Arabic):
http://www.paci.gov.kw/stat/en/index.php/component/content/article?id=99
http://www.paci.gov.kw/stat/index.php/component/content/article?id=194
The present data is in the “Population” file.
Date of access: May 2015
| Locality |
Kuwaiti |
Non-Kuwaiti |
Total |
| Male |
Female |
Total |
Male |
Female |
Total |
Male |
Female |
Total |
| Dasman |
205 |
257 |
462 |
1,313 |
425 |
1,738 |
1,518 |
682 |
2,200 |
| Sharq |
792 |
831 |
1,623 |
24,190 |
6,583 |
30,773 |
24,982 |
7,414 |
32,396 |
| Mirqab |
3 |
2 |
5 |
6,827 |
625 |
7,452 |
6,830 |
627 |
7,457 |
| Soor Gardens |
0 |
0 |
0 |
11 |
0 |
11 |
11 |
0 |
11 |
| Qibla |
40 |
34 |
74 |
13,793 |
3,207 |
17,000 |
13,833 |
3,241 |
17,074 |
| Coastal strip |
0 |
0 |
0 |
0 |
0 |
0 |
0 |
0 |
0 |
| Bneid Al – Gar |
444 |
464 |
908 |
28,212 |
5,255 |
33,467 |
28,656 |
5,719 |
34,375 |
| Dasma |
5,331 |
5,475 |
10,806 |
4,224 |
4,930 |
9,154 |
9,555 |
10,405 |
19,960 |
| Mansoriya |
2,447 |
2,567 |
5,014 |
1,869 |
2,179 |
4,048 |
4,316 |
4,746 |
9,062 |
| Abdalla-Alsalim |
5,446 |
5,601 |
11,047 |
5,091 |
5,555 |
10,646 |
10,537 |
11,156 |
21,693 |
| Shamiya |
4,505 |
4,776 |
9,281 |
4,029 |
4,341 |
8,370 |
8,534 |
9,117 |
17,651 |
| Diya |
4,658 |
4,857 |
9,515 |
5,211 |
5,281 |
10,492 |
9,869 |
10,138 |
20,007 |
| Qadisiya |
6,578 |
6,913 |
13,491 |
4,791 |
5,990 |
10,781 |
11,369 |
12,903 |
24,272 |
| Nuzha |
3,892 |
4,240 |
8,132 |
3,193 |
3,683 |
6,876 |
7,085 |
7,923 |
15,008 |
| Faiha |
6,140 |
6,615 |
12,755 |
4,946 |
5,658 |
10,604 |
11,086 |
12,273 |
23,359 |
| Kifan |
7,416 |
8,028 |
15,444 |
5,914 |
7,238 |
13,152 |
13,330 |
15,266 |
28,596 |
| Rawda |
10,662 |
11,476 |
22,138 |
6,755 |
9,085 |
15,840 |
17,417 |
20,561 |
37,978 |
| Idailiya |
5,815 |
6,198 |
12,013 |
4,312 |
5,097 |
9,409 |
10,127 |
11,295 |
21,422 |
| Khaldiya |
5,167 |
5,364 |
10,531 |
3,769 |
4,403 |
8,172 |
8,936 |
9,767 |
18,703 |
| Surra |
9,963 |
10,143 |
20,106 |
6,809 |
9,151 |
15,960 |
16,772 |
19,294 |
36,066 |
| Qurtuba |
8,982 |
9,298 |
18,280 |
5,760 |
7,645 |
13,405 |
14,742 |
16,943 |
31,685 |
| Al.yamouk |
6,494 |
6,784 |
13,278 |
5,693 |
5,867 |
11,560 |
12,187 |
12,651 |
24,838 |
| Shuwaikh |
1,001 |
1,053 |
2,054 |
2,128 |
1,454 |
3,582 |
3,129 |
2,507 |
5,636 |
| Shuwaikh – Ind |
33 |
35 |
68 |
8,029 |
972 |
9,001 |
8,062 |
1,007 |
9,069 |
| Garnada |
3,051 |
3,081 |
6,132 |
2,045 |
2,148 |
4,193 |
5,096 |
5,229 |
10,325 |
| Mubarakiya Comp |
0 |
0 |
0 |
2,064 |
9 |
2,073 |
2,064 |
9 |
2,073 |
| Health Reg |
42 |
80 |
122 |
157 |
606 |
763 |
199 |
686 |
885 |
| Sulaibekhat |
7,488 |
8,091 |
15,579 |
10,605 |
6,838 |
17,443 |
18,093 |
14,929 |
33,022 |
| Doha |
8,155 |
8,691 |
16,846 |
8,650 |
6,845 |
15,495 |
16,805 |
15,536 |
32,341 |
| Doha Port |
0 |
0 |
0 |
870 |
15 |
885 |
870 |
15 |
885 |
| Failakka Isl |
0 |
1 |
1 |
0 |
1 |
1 |
0 |
2 |
2 |
| Miskan Isl |
0 |
0 |
0 |
0 |
0 |
0 |
0 |
0 |
0 |
| Oha Isl |
0 |
0 |
0 |
0 |
0 |
0 |
0 |
0 |
0 |
| Kubar Isl |
0 |
0 |
0 |
0 |
0 |
0 |
0 |
0 |
0 |
| Qarowa Isl |
0 |
0 |
0 |
0 |
0 |
0 |
0 |
0 |
0 |
| Aum – Almaradim Isl |
0 |
0 |
0 |
0 |
0 |
0 |
0 |
0 |
0 |
| Aum – Alnamil Isl |
0 |
0 |
0 |
0 |
0 |
0 |
0 |
0 |
0 |
| Doha Resort |
0 |
0 |
0 |
2 |
0 |
2 |
2 |
0 |
2 |
| Free Zone |
0 |
0 |
0 |
0 |
0 |
0 |
0 |
0 |
0 |
| North-west of Sulaibekhat |
0 |
0 |
0 |
0 |
0 |
0 |
0 |
0 |
0 |
| Total Capital Governorate |
114,750 |
120,955 |
235,705 |
181,262 |
121,086 |
302,348 |
296,012 |
242,041 |
538,053 |
| Hawalli |
1,203 |
1,248 |
2,451 |
132,253 |
67,349 |
199,602 |
133,456 |
68,597 |
202,053 |
| Salmiya |
4,781 |
5,026 |
9,807 |
159,478 |
119,061 |
278,539 |
164,259 |
124,087 |
288,346 |
| Shaab |
3,186 |
3,353 |
6,539 |
4,796 |
5,231 |
10,027 |
7,982 |
8,584 |
16,566 |
| Rumaythiya |
17,338 |
17,795 |
35,133 |
10,372 |
13,566 |
23,938 |
27,710 |
31,361 |
59,071 |
| Salwa |
14,539 |
15,682 |
30,221 |
26,114 |
24,952 |
51,066 |
40,653 |
40,634 |
81,287 |
| Bedi |
71 |
66 |
137 |
661 |
334 |
995 |
732 |
400 |
1,132 |
| Mushaif |
12,523 |
12,488 |
25,011 |
6,301 |
9,334 |
15,635 |
18,824 |
21,822 |
40,646 |
| Mubarak Al-Abdel-Allah |
2,991 |
3,020 |
6,011 |
1,304 |
2,064 |
3,368 |
4,295 |
5,084 |
9,379 |
| Bayan |
14,675 |
15,154 |
29,829 |
7,733 |
10,253 |
17,986 |
22,408 |
25,407 |
47,815 |
| Mubarakiya |
0 |
0 |
0 |
0 |
0 |
0 |
0 |
0 |
0 |
| Jabriya |
11,602 |
11,949 |
23,551 |
25,805 |
26,976 |
52,781 |
37,407 |
38,925 |
76,332 |
| Wizarat area |
0 |
0 |
0 |
7 |
2 |
9 |
7 |
2 |
9 |
| Al-Shohadaa |
4,047 |
4,051 |
8,098 |
1,649 |
2,545 |
4,194 |
5,696 |
6,596 |
12,292 |
| Al-Zahraa |
7,351 |
7,681 |
15,032 |
3,080 |
4,651 |
7,731 |
10,431 |
12,332 |
22,763 |
| Hetteen |
5,676 |
5,711 |
11,387 |
2,167 |
3,538 |
5,705 |
7,843 |
9,249 |
17,092 |
| Al-Siddeek |
142 |
149 |
291 |
71 |
92 |
163 |
213 |
241 |
454 |
| Al-Salam |
7,365 |
7,396 |
14,761 |
3,093 |
4,851 |
7,944 |
10,458 |
12,247 |
22,705 |
| Anjafa |
26 |
22 |
48 |
253 |
158 |
411 |
279 |
180 |
459 |
| Total Hawalli Governorate |
107,516 |
110,791 |
218,307 |
385,137 |
294,957 |
680,094 |
492,653 |
405,748 |
898,401 |
| Ahmadi city |
5,701 |
5,963 |
11,664 |
12,703 |
6,356 |
19,059 |
18,404 |
12,319 |
30,723 |
| Fahaheel |
9,772 |
10,083 |
19,855 |
59,066 |
17,715 |
76,781 |
68,838 |
27,798 |
96,636 |
| Sabahiya |
22,184 |
23,924 |
46,108 |
20,184 |
13,366 |
33,550 |
42,368 |
37,290 |
79,658 |
| South – Sabahiya |
1 |
0 |
1 |
4 |
1 |
5 |
5 |
1 |
6 |
| Rikka |
15,268 |
16,332 |
31,600 |
11,188 |
7,853 |
19,041 |
26,456 |
24,185 |
50,641 |
| Hadiya |
7,781 |
7,488 |
15,269 |
4,135 |
4,032 |
8,167 |
11,916 |
11,520 |
23,436 |
| Fintas |
3,794 |
3,875 |
7,669 |
19,664 |
11,561 |
31,225 |
23,458 |
15,436 |
38,894 |
| Jaber Al-Ali |
16,513 |
16,175 |
32,688 |
7,963 |
6,423 |
14,386 |
24,476 |
22,598 |
47,074 |
| Auqqila |
2,571 |
2,636 |
5,207 |
1,733 |
1,676 |
3,409 |
4,304 |
4,312 |
8,616 |
| Abu- Alhasniya |
134 |
135 |
269 |
354 |
222 |
576 |
488 |
357 |
845 |
| Mahbula |
1,470 |
1,621 |
3,091 |
98,859 |
18,903 |
117,762 |
100,329 |
20,524 |
120,853 |
| Al- Adami |
0 |
0 |
0 |
0 |
0 |
0 |
0 |
0 |
0 |
| Abu-Halifa |
2,094 |
2,084 |
4,178 |
28,668 |
16,055 |
44,723 |
30,762 |
18,139 |
48,901 |
| Munkaf |
7,997 |
8,118 |
16,115 |
77,647 |
28,115 |
105,762 |
85,644 |
36,233 |
121,877 |
| Thaher |
13,058 |
13,441 |
26,499 |
8,024 |
5,760 |
13,784 |
21,082 |
19,201 |
40,283 |
| Shuaiba |
0 |
0 |
0 |
1,061 |
14 |
1,075 |
1,061 |
14 |
1,075 |
| Shuaiba-ind W |
0 |
0 |
0 |
25,435 |
114 |
25,549 |
25,435 |
114 |
25,549 |
| Abdulla -Port |
0 |
0 |
0 |
1,937 |
4 |
1,941 |
1,937 |
4 |
1,941 |
| Abdulla Port-Resort |
0 |
0 |
0 |
859 |
23 |
882 |
859 |
23 |
882 |
| Nwaiseeb resort |
0 |
0 |
0 |
1 |
0 |
1 |
1 |
0 |
1 |
| Al-Kayron resorts |
0 |
0 |
0 |
1,984 |
84 |
2,068 |
1,984 |
84 |
2,068 |
| Zoor Resort |
0 |
0 |
0 |
6 |
6 |
12 |
6 |
6 |
12 |
| Jlaiaa Resort |
0 |
0 |
0 |
250 |
24 |
274 |
250 |
24 |
274 |
| Bedier Resort |
0 |
0 |
0 |
16 |
3 |
19 |
16 |
3 |
19 |
| Dubaeeiya Resort |
0 |
0 |
0 |
17 |
6 |
23 |
17 |
6 |
23 |
| Zoor |
0 |
1 |
1 |
1,981 |
1,021 |
3,002 |
1,981 |
1,022 |
3,003 |
| Nwaiseeb |
0 |
0 |
0 |
0 |
0 |
0 |
0 |
0 |
0 |
| Sbainhiya |
0 |
0 |
0 |
0 |
0 |
0 |
0 |
0 |
0 |
| Wafra |
1 |
0 |
1 |
50 |
50 |
100 |
51 |
50 |
101 |
| New Wafra |
70 |
61 |
131 |
887 |
411 |
1,298 |
957 |
472 |
1,429 |
| Wafra -Agriculture |
1 |
0 |
1 |
9,608 |
158 |
9,766 |
9,609 |
158 |
9,767 |
| Wara |
0 |
0 |
0 |
1 |
0 |
1 |
1 |
0 |
1 |
| Muqwaa |
0 |
0 |
0 |
173 |
0 |
173 |
173 |
0 |
173 |
| Ahmadi- Desert |
0 |
0 |
0 |
259 |
22 |
281 |
259 |
22 |
281 |
| Gawakheer-South |
0 |
0 |
0 |
40 |
0 |
40 |
40 |
0 |
40 |
| Fahd Al – Ahmad |
7,391 |
7,294 |
14,685 |
3,091 |
2,494 |
5,585 |
10,482 |
9,788 |
20,270 |
| Ali Sabah Alsalem |
17,760 |
16,908 |
34,668 |
9,999 |
6,650 |
16,649 |
27,759 |
23,558 |
51,317 |
| Rajm Khashman |
0 |
0 |
0 |
49 |
0 |
49 |
49 |
0 |
49 |
| Sabah Al-Ahmad C |
1 |
1 |
2 |
23 |
3 |
26 |
24 |
4 |
28 |
| sabah al- ahmad ( 1 ) |
0 |
0 |
0 |
0 |
0 |
0 |
0 |
0 |
0 |
| sabah al- ahmad (2 ) |
0 |
0 |
0 |
0 |
0 |
0 |
0 |
0 |
0 |
| sabah al- ahmad ( 3 ) |
3 |
4 |
7 |
3 |
0 |
3 |
6 |
4 |
10 |
| sabah al- ahmad (4 ) |
0 |
0 |
0 |
0 |
0 |
0 |
0 |
0 |
0 |
| sabah al- ahmad (5 ) |
0 |
0 |
0 |
0 |
0 |
0 |
0 |
0 |
0 |
| Kabad – Agriculture |
0 |
0 |
0 |
1 |
0 |
1 |
1 |
0 |
1 |
| Al-Kayron residential |
0 |
0 |
0 |
0 |
0 |
0 |
0 |
0 |
0 |
| Total Al-Ahmadi Governorate |
133,565 |
136,144 |
269,709 |
407,923 |
149,125 |
557,048 |
541,488 |
285,269 |
826,757 |
| Jahra |
4,437 |
4,591 |
9,028 |
33,201 |
17,023 |
50,224 |
37,638 |
21,614 |
59,252 |
| Al-Kasser |
11,819 |
12,836 |
24,655 |
20,398 |
13,005 |
33,403 |
32,217 |
25,841 |
58,058 |
| Al -Naim |
4,547 |
4,397 |
8,944 |
3,455 |
3,079 |
6,534 |
8,002 |
7,476 |
15,478 |
| Al -Naseem |
6,768 |
6,777 |
13,545 |
5,285 |
4,228 |
9,513 |
12,053 |
11,005 |
23,058 |
| Taimaa |
1,035 |
2,057 |
3,092 |
30,354 |
28,796 |
59,150 |
31,389 |
30,853 |
62,242 |
| Waha |
10,023 |
10,739 |
20,762 |
11,058 |
8,719 |
19,777 |
21,081 |
19,458 |
40,539 |
| Al -Auyon |
11,499 |
11,785 |
23,284 |
10,401 |
7,997 |
18,398 |
21,900 |
19,782 |
41,682 |
| Sekrab -Reg |
0 |
0 |
0 |
156 |
0 |
156 |
156 |
0 |
156 |
| Jahraa Ind |
0 |
0 |
0 |
811 |
22 |
833 |
811 |
22 |
833 |
| Sulaibiya -Shabiya |
1,195 |
2,903 |
4,098 |
27,170 |
25,252 |
52,422 |
28,365 |
28,155 |
56,520 |
| Sulaibiya – Ind (1) |
0 |
0 |
0 |
1,418 |
22 |
1,440 |
1,418 |
22 |
1,440 |
| Sulaibiya – Ind (2) |
0 |
0 |
0 |
3,489 |
61 |
3,550 |
3,489 |
61 |
3,550 |
| Sulaibiya – Ind (3) |
0 |
0 |
0 |
6 |
0 |
6 |
6 |
0 |
6 |
| Sulaibiya – Agriculture |
0 |
0 |
0 |
3,365 |
115 |
3,480 |
3,365 |
115 |
3,480 |
| Abdelli |
0 |
0 |
0 |
8,237 |
81 |
8,318 |
8,237 |
81 |
8,318 |
| Amgara – Ind |
0 |
0 |
0 |
12,119 |
80 |
12,199 |
12,119 |
80 |
12,199 |
| Mitlaa |
0 |
0 |
0 |
15 |
12 |
27 |
15 |
12 |
27 |
| Kathma |
0 |
0 |
0 |
100 |
0 |
100 |
100 |
0 |
100 |
| Al – Rawadatain |
0 |
0 |
0 |
88 |
4 |
92 |
88 |
4 |
92 |
| Aum – Al -Ash |
0 |
0 |
0 |
26 |
0 |
26 |
26 |
0 |
26 |
| Al – Salmi |
0 |
0 |
0 |
599 |
13 |
612 |
599 |
13 |
612 |
| Kabad |
0 |
0 |
0 |
406 |
10 |
416 |
406 |
10 |
416 |
| Shegaya |
0 |
0 |
0 |
0 |
0 |
0 |
0 |
0 |
0 |
| Al – Sebiya |
0 |
0 |
0 |
36 |
2 |
38 |
36 |
2 |
38 |
| Jahra – Camp |
0 |
0 |
0 |
84 |
0 |
84 |
84 |
0 |
84 |
| Al – Atraaf |
0 |
0 |
0 |
0 |
0 |
0 |
0 |
0 |
0 |
| Warba Isl |
0 |
0 |
0 |
0 |
0 |
0 |
0 |
0 |
0 |
| Bubyan Isl |
0 |
0 |
0 |
0 |
0 |
0 |
0 |
0 |
0 |
| Jahara – Desert |
0 |
0 |
0 |
1,696 |
15 |
1,711 |
1,696 |
15 |
1,711 |
| Saad Al – Abdulla city |
27,330 |
26,913 |
54,243 |
15,938 |
13,301 |
29,239 |
43,268 |
40,214 |
83,482 |
| Qayrawan |
5,613 |
5,459 |
11,072 |
3,075 |
3,075 |
6,150 |
8,688 |
8,534 |
17,222 |
| Jahraa – Gawakheer |
0 |
0 |
0 |
3 |
0 |
3 |
3 |
0 |
3 |
| Kazma Resort |
0 |
0 |
0 |
0 |
0 |
0 |
0 |
0 |
0 |
| AlSubbiya Resort |
0 |
0 |
0 |
0 |
0 |
0 |
0 |
0 |
0 |
| Al – Behaith |
0 |
0 |
0 |
0 |
0 |
0 |
0 |
0 |
0 |
| Northwest Jahra |
0 |
0 |
0 |
85 |
10 |
95 |
85 |
10 |
95 |
| Jaber al-Ahmad |
1,942 |
1,961 |
3,903 |
1,002 |
885 |
1,887 |
2,944 |
2,846 |
5,790 |
| Neayem |
0 |
0 |
0 |
6 |
0 |
6 |
6 |
0 |
6 |
| Total Al-Jahra Governorate |
86,208 |
90,418 |
176,626 |
194,082 |
125,807 |
319,889 |
280,290 |
216,225 |
496,515 |
| Farwaniya |
3,439 |
3,546 |
6,985 |
179,554 |
59,354 |
238,908 |
182,993 |
62,900 |
245,893 |
| Surra – Park |
0 |
0 |
0 |
0 |
0 |
0 |
0 |
0 |
0 |
| Khitan |
6,853 |
7,202 |
14,055 |
106,858 |
35,337 |
142,195 |
113,711 |
42,539 |
156,250 |
| AlRaay |
0 |
0 |
0 |
6,220 |
87 |
6,307 |
6,220 |
87 |
6,307 |
| Omarya |
4,653 |
5,104 |
9,757 |
4,777 |
4,308 |
9,085 |
9,430 |
9,412 |
18,842 |
| Rabiya |
5,290 |
5,832 |
11,122 |
5,527 |
4,332 |
9,859 |
10,817 |
10,164 |
20,981 |
| Rihab |
5,642 |
5,800 |
11,442 |
2,961 |
2,980 |
5,941 |
8,603 |
8,780 |
17,383 |
| Jleeb Al – Shuyoukh |
2,795 |
2,709 |
5,504 |
245,197 |
54,877 |
300,074 |
247,992 |
57,586 |
305,578 |
| Reggae |
318 |
398 |
716 |
23,520 |
12,137 |
35,657 |
23,838 |
12,535 |
36,373 |
| Andalus |
11,731 |
12,235 |
23,966 |
12,767 |
11,292 |
24,059 |
24,498 |
23,527 |
48,025 |
| Ardiya |
16,838 |
17,794 |
34,632 |
12,172 |
10,717 |
22,889 |
29,010 |
28,511 |
57,521 |
| Sabah Alnasir |
12,554 |
13,186 |
25,740 |
8,540 |
6,923 |
15,463 |
21,094 |
20,109 |
41,203 |
| Ardiya(4) |
0 |
0 |
0 |
59 |
22 |
81 |
59 |
22 |
81 |
| Ishbiliya |
6,275 |
6,547 |
12,822 |
4,291 |
4,135 |
8,426 |
10,566 |
10,682 |
21,248 |
| Ardiya(6) |
0 |
0 |
0 |
566 |
28 |
594 |
566 |
28 |
594 |
| Fordus |
17,684 |
19,420 |
37,104 |
15,078 |
11,755 |
26,833 |
32,762 |
31,175 |
63,937 |
| Air Plan Noise Reg |
0 |
0 |
0 |
43 |
5 |
48 |
43 |
5 |
48 |
| International Air Port |
0 |
0 |
0 |
216 |
13 |
229 |
216 |
13 |
229 |
| Al – Nahda |
2,313 |
2,328 |
4,641 |
1,114 |
1,202 |
2,316 |
3,427 |
3,530 |
6,957 |
| Abdulla Mubarak AlSabah |
15,252 |
15,199 |
30,451 |
8,460 |
8,206 |
16,666 |
23,712 |
23,405 |
47,117 |
| Ardiya craft |
0 |
0 |
0 |
9 |
0 |
9 |
9 |
0 |
9 |
| Total Al-Farwaniya Governorate |
111,637 |
117,300 |
228,937 |
637,929 |
227,710 |
865,639 |
749,566 |
345,010 |
1,094,576 |
| Mubarak Kabeer |
13,591 |
13,134 |
26,725 |
5,810 |
6,681 |
12,491 |
19,401 |
19,815 |
39,216 |
| Qurain |
10,481 |
10,343 |
20,824 |
4,808 |
5,100 |
9,908 |
15,289 |
15,443 |
30,732 |
| Al-Adan |
10,946 |
10,913 |
21,859 |
5,243 |
5,840 |
11,083 |
16,189 |
16,753 |
32,942 |
| Qosoor |
12,284 |
12,381 |
24,665 |
5,487 |
6,044 |
11,531 |
17,771 |
18,425 |
36,196 |
| Misila |
103 |
124 |
227 |
997 |
524 |
1,521 |
1,100 |
648 |
1,748 |
| Al-Masayel |
33 |
36 |
69 |
18 |
12 |
30 |
51 |
48 |
99 |
| Subah Alsalim |
24,918 |
26,847 |
51,765 |
16,150 |
15,609 |
31,759 |
41,068 |
42,456 |
83,524 |
| Fanatees |
58 |
53 |
111 |
247 |
127 |
374 |
305 |
180 |
485 |
| Sabhan Ind |
0 |
0 |
0 |
5,256 |
58 |
5,314 |
5,256 |
58 |
5,314 |
| Abu – Fatira |
11 |
11 |
22 |
28 |
3 |
31 |
39 |
14 |
53 |
| Mid – Reg |
0 |
0 |
0 |
1,953 |
146 |
2,099 |
1,953 |
146 |
2,099 |
| West Abu Fateera Ind |
0 |
0 |
0 |
20 |
0 |
20 |
20 |
0 |
20 |
| Total Mubarak Al-Kabeer Governorate |
72,425 |
73,842 |
146,267 |
46,017 |
40,144 |
86,161 |
118,442 |
113,986 |
232,428 |
| Not Stated |
155 |
151 |
306 |
2,929 |
2,028 |
4,957 |
3,084 |
2,179 |
5,263 |
| Total |
626,256 |
649,601 |
1,275,857 |
1,855,279 |
960,857 |
2,816,136 |
2,481,535 |
1,610,458 |
4,091,993 |
Source: PACI
ANNEXED NOTE
1. Characteristics of data and definitions
The source of data used here is the Public Authority for Civil Information (PACI), an independant government body in charge of :
1- centralising all population and labour force data in order to manage a fully computerised population register
2- issuing mandatory civil identification cards to every resident of the country, regardless of age and nationality.
The other source of demographic and socioeconomic data on Kuwait is the Central Statistical Office (CSO), operating within the Planning Ministry. The CSO has conducted ten population and housing censuses since its inception in 1957.
Since 1995 a marked discrepancy was witnessed between PACI’ and CSO’ population figures. PACI’ database is connected electronically with other administrations and bodies registering demographic events and professional/ residency issues (births and death; departures and arrivals; end of service, residency and ID deliveries, etc.).
PACI’s records of residents’ movements is thus regularly updated, which limits the risk of population overcount. Therefore, it is more likely that residents were undercounted during CSO- Ministry of Planning’s census operations (see: Shah, N. Population of Kuwait. Structure and Dynamics, Kuwait: Kuwait University Academic Publication Council, 2010, chapter 1).
(a) Kuwaiti: the Kuwaiti nationality rests upon a document of Kuwaiti nationality or a certificate proving Kuwaiti nationality issued by the Ministry of Interior of Kuwait.
(b) Non-Kuwaiti: his/ her nationality is determined by the name of the State which issued the passport. The foreign national also entered Kuwait legally and has a stamp of residence.
This category includes the Bidoon, a category of stateless persons living in the Emirate. Kuwait’s Bidoon population originates from three broad categories:
1) those whose ancestors failed to apply for nationality or lacked necessary documentation at the time of Kuwait’s independence in 1961;
2) those recruited to work in Kuwait’s army or police force during the 1960s who permanently settled in Kuwait, along with their families;
3) children of Kuwaiti mothers and stateless or foreign fathers (see Human Rights Watch. Prisoners of the Past. Kuwaiti Bidun and the Burden of Statelessness, June 2011, p. 3).
(The children of Kuwaiti mothers and non-Kuwaiti fathers (with specific nationality) inherit the father’s nationality. They are stateless if the father is stateless).
(c) Nationality group: collected according to the nationality of the head of the household.
Nationalities are grouped according to specific features common to certain population subgroups: language, geographic origin, etc. or according to internationally recognized categories such as: (Arab / non-Arab Asian countries / non-Arab African countries; European countries … etc.).
2. Institution which provides data
The Public Authority for Civil Information (PACI)
3. Period of data coverage: 31 December 2014
The database is updated three times a year and the website presents only the most recent data.
4. Data availability
The statistics section of PACI’s website (http://www.paci.gov.kw/en/ (English); http://www.paci.gov.kw/ (Arabic)) provides population and socio-economic data broken down by nationality (Kuwaiti/ non-Kuwaiti). Some data are displayed by nationality groups.
Analytical tables and data crosstabulations are available for download in PDF, html, .png and Excel (.csv) formats.
The “publications” section also proposes a selection of data tables processed thematically in downloadable Excel and PDF format (English and Arabic):
http://www.paci.gov.kw/stat/en/index.php/component/content/article?id=99
http://www.paci.gov.kw/stat/index.php/component/content/article?id=194
The present data is in the “Population” file.
Date of access: May 2015
| Locality |
Gender |
Nationality group |
| Kuwaitis |
Arabs |
Asians |
Africans |
Europeans |
N. Americans |
S. Americans |
Australians/ Oceanians |
Total |
| Dasman |
Males |
205 |
745 |
546 |
0 |
9 |
12 |
0 |
1 |
1,518 |
| Females |
257 |
130 |
249 |
29 |
6 |
9 |
1 |
1 |
682 |
| Total |
462 |
875 |
795 |
29 |
15 |
21 |
1 |
2 |
2,200 |
| Sharq |
Males |
792 |
8,062 |
15,966 |
10 |
74 |
66 |
9 |
3 |
24,982 |
| Females |
831 |
1,836 |
4,504 |
145 |
46 |
43 |
8 |
1 |
7,414 |
| Total |
1,623 |
9,898 |
20,470 |
155 |
120 |
109 |
17 |
4 |
32,396 |
| Mirqab |
Males |
3 |
895 |
5,925 |
0 |
3 |
4 |
0 |
0 |
6,830 |
| Females |
2 |
116 |
504 |
3 |
1 |
1 |
0 |
0 |
627 |
| Total |
5 |
1,011 |
6,429 |
3 |
4 |
5 |
0 |
0 |
7,457 |
| Soor Gardens |
Males |
0 |
9 |
2 |
0 |
0 |
0 |
0 |
0 |
11 |
| Females |
0 |
0 |
0 |
0 |
0 |
0 |
0 |
0 |
0 |
| Total |
0 |
9 |
2 |
0 |
0 |
0 |
0 |
0 |
11 |
| Qibla |
Males |
40 |
4,275 |
9,348 |
37 |
79 |
47 |
1 |
6 |
13,833 |
| Females |
34 |
1,269 |
1,810 |
52 |
50 |
24 |
0 |
2 |
3,241 |
| Total |
74 |
5,544 |
11,158 |
89 |
129 |
71 |
1 |
8 |
17,074 |
| Coastal strip |
Males |
0 |
0 |
0 |
0 |
0 |
0 |
0 |
0 |
0 |
| Females |
0 |
0 |
0 |
0 |
0 |
0 |
0 |
0 |
0 |
| Total |
0 |
0 |
0 |
0 |
0 |
0 |
0 |
0 |
0 |
| Bneid Al – Gar |
Males |
444 |
8,124 |
19,697 |
36 |
178 |
162 |
5 |
10 |
28,656 |
| Females |
464 |
1,754 |
3,124 |
109 |
137 |
122 |
4 |
5 |
5,719 |
| Total |
908 |
9,878 |
22,821 |
145 |
315 |
284 |
9 |
15 |
34,375 |
| Dasma |
Males |
5,331 |
811 |
3,330 |
6 |
24 |
46 |
6 |
1 |
9,555 |
| Females |
5,475 |
658 |
3,670 |
533 |
28 |
36 |
4 |
1 |
10,405 |
| Total |
10,806 |
1,469 |
7,000 |
539 |
52 |
82 |
10 |
2 |
19,960 |
| Mansoriya |
Males |
2,447 |
329 |
1,494 |
3 |
25 |
16 |
1 |
1 |
4,316 |
| Females |
2,567 |
224 |
1,645 |
270 |
23 |
13 |
4 |
0 |
4,746 |
| Total |
5,014 |
553 |
3,139 |
273 |
48 |
29 |
5 |
1 |
9,062 |
| Abdalla-Alsalim |
Males |
5,446 |
647 |
4,395 |
12 |
14 |
21 |
0 |
2 |
10,537 |
| Females |
5,601 |
419 |
4,536 |
542 |
31 |
27 |
0 |
0 |
11,156 |
| Total |
11,047 |
1,066 |
8,931 |
554 |
45 |
48 |
0 |
2 |
21,693 |
| Shamiya |
Males |
4,505 |
761 |
3,192 |
38 |
11 |
23 |
4 |
0 |
8,534 |
| Females |
4,776 |
551 |
3,282 |
472 |
14 |
22 |
0 |
0 |
9,117 |
| Total |
9,281 |
1,312 |
6,474 |
510 |
25 |
45 |
4 |
0 |
17,651 |
| Diya |
Males |
4,658 |
1,437 |
3,668 |
12 |
22 |
62 |
8 |
2 |
9,869 |
| Females |
4,857 |
1,064 |
3,622 |
510 |
30 |
48 |
2 |
5 |
10,138 |
| Total |
9,515 |
2,501 |
7,290 |
522 |
52 |
110 |
10 |
7 |
20,007 |
| Qadisiya |
Males |
6,578 |
1,117 |
3,604 |
26 |
12 |
26 |
1 |
5 |
11,369 |
| Females |
6,913 |
898 |
4,404 |
637 |
24 |
25 |
1 |
1 |
12,903 |
| Total |
13,491 |
2,015 |
8,008 |
663 |
36 |
51 |
2 |
6 |
24,272 |
| Nuzha |
Males |
3,892 |
353 |
2,791 |
21 |
14 |
14 |
0 |
0 |
7,085 |
| Females |
4,240 |
255 |
3,015 |
390 |
13 |
9 |
0 |
1 |
7,923 |
| Total |
8,132 |
608 |
5,806 |
411 |
27 |
23 |
0 |
1 |
15,008 |
| Faiha |
Males |
6,140 |
1,191 |
3,714 |
16 |
7 |
16 |
2 |
0 |
11,086 |
| Females |
6,615 |
988 |
4,018 |
615 |
19 |
17 |
1 |
0 |
12,273 |
| Total |
12,755 |
2,179 |
7,732 |
631 |
26 |
33 |
3 |
0 |
23,359 |
| Kifan |
Males |
7,416 |
1,313 |
4,508 |
21 |
21 |
50 |
1 |
0 |
13,330 |
| Females |
8,028 |
1,213 |
5,169 |
768 |
56 |
32 |
0 |
0 |
15,266 |
| Total |
15,444 |
2,526 |
9,677 |
789 |
77 |
82 |
1 |
0 |
28,596 |
| Rawda |
Males |
10,662 |
1,206 |
5,432 |
48 |
14 |
43 |
12 |
0 |
17,417 |
| Females |
11,476 |
1,015 |
6,899 |
1,085 |
39 |
43 |
4 |
0 |
20,561 |
| Total |
22,138 |
2,221 |
12,331 |
1,133 |
53 |
86 |
16 |
0 |
37,978 |
| Idailiya |
Males |
5,815 |
713 |
3,527 |
22 |
23 |
15 |
8 |
4 |
10,127 |
| Females |
6,198 |
553 |
3,951 |
541 |
24 |
24 |
1 |
3 |
11,295 |
| Total |
12,013 |
1,266 |
7,478 |
563 |
47 |
39 |
9 |
7 |
21,422 |
| Khaldiya |
Males |
5,167 |
567 |
3,152 |
23 |
15 |
11 |
0 |
1 |
8,936 |
| Females |
5,364 |
381 |
3,548 |
438 |
17 |
16 |
0 |
3 |
9,767 |
| Total |
10,531 |
948 |
6,700 |
461 |
32 |
27 |
0 |
4 |
18,703 |
| Surra |
Males |
9,963 |
1,396 |
5,129 |
51 |
71 |
146 |
6 |
10 |
16,772 |
| Females |
10,143 |
1,191 |
6,796 |
942 |
70 |
138 |
6 |
8 |
19,294 |
| Total |
20,106 |
2,587 |
11,925 |
993 |
141 |
284 |
12 |
18 |
36,066 |
| Qurtuba |
Males |
8,982 |
850 |
4,611 |
199 |
55 |
43 |
0 |
2 |
14,742 |
| Females |
9,298 |
710 |
6,020 |
841 |
35 |
37 |
0 |
2 |
16,943 |
| Total |
18,280 |
1,560 |
10,631 |
1,040 |
90 |
80 |
0 |
4 |
31,685 |
| Al.yamouk |
Males |
6,494 |
839 |
4,741 |
26 |
46 |
37 |
1 |
3 |
12,187 |
| Females |
6,784 |
654 |
4,446 |
673 |
50 |
37 |
3 |
4 |
12,651 |
| Total |
13,278 |
1,493 |
9,187 |
699 |
96 |
74 |
4 |
7 |
24,838 |
| Shuwaikh |
Males |
1,001 |
320 |
1,793 |
7 |
2 |
5 |
0 |
1 |
3,129 |
| Females |
1,053 |
97 |
1,221 |
123 |
4 |
8 |
0 |
1 |
2,507 |
| Total |
2,054 |
417 |
3,014 |
130 |
6 |
13 |
0 |
2 |
5,636 |
| Shuwaikh – Ind |
Males |
33 |
2,375 |
5,276 |
166 |
102 |
92 |
3 |
15 |
8,062 |
| Females |
35 |
522 |
275 |
30 |
59 |
76 |
1 |
9 |
1,007 |
| Total |
68 |
2,897 |
5,551 |
196 |
161 |
168 |
4 |
24 |
9,069 |
| Garnada |
Males |
3,051 |
442 |
1,541 |
20 |
19 |
20 |
0 |
3 |
5,096 |
| Females |
3,081 |
372 |
1,469 |
274 |
10 |
20 |
0 |
3 |
5,229 |
| Total |
6,132 |
814 |
3,010 |
294 |
29 |
40 |
0 |
6 |
10,325 |
| Mubarakiya Comp |
Males |
0 |
257 |
1,802 |
1 |
1 |
0 |
0 |
3 |
2,064 |
| Females |
0 |
1 |
7 |
0 |
0 |
0 |
0 |
1 |
9 |
| Total |
0 |
258 |
1,809 |
1 |
1 |
0 |
0 |
4 |
2,073 |
| Health Reg |
Males |
42 |
95 |
59 |
0 |
2 |
0 |
1 |
0 |
199 |
| Females |
80 |
176 |
426 |
3 |
1 |
0 |
0 |
0 |
686 |
| Total |
122 |
271 |
485 |
3 |
3 |
0 |
1 |
0 |
885 |
| Sulaibekhat |
Males |
7,488 |
4,570 |
5,910 |
54 |
16 |
42 |
2 |
11 |
18,093 |
| Females |
8,091 |
2,930 |
3,145 |
702 |
24 |
25 |
1 |
11 |
14,929 |
| Total |
15,579 |
7,500 |
9,055 |
756 |
40 |
67 |
3 |
22 |
33,022 |
| Doha |
Males |
8,155 |
3,653 |
4,884 |
51 |
12 |
37 |
9 |
4 |
16,805 |
| Females |
8,691 |
2,922 |
3,210 |
660 |
17 |
26 |
8 |
2 |
15,536 |
| Total |
16,846 |
6,575 |
8,094 |
711 |
29 |
63 |
17 |
6 |
32,341 |
| Doha Port |
Males |
0 |
253 |
617 |
0 |
0 |
0 |
0 |
0 |
870 |
| Females |
0 |
4 |
11 |
0 |
0 |
0 |
0 |
0 |
15 |
| Total |
0 |
257 |
628 |
0 |
0 |
0 |
0 |
0 |
885 |
| Failakka Isl |
Males |
0 |
0 |
0 |
0 |
0 |
0 |
0 |
0 |
0 |
| Females |
1 |
0 |
1 |
0 |
0 |
0 |
0 |
0 |
2 |
| Total |
1 |
0 |
1 |
0 |
0 |
0 |
0 |
0 |
2 |
| Miskan Isl |
Males |
0 |
0 |
0 |
0 |
0 |
0 |
0 |
0 |
0 |
| Females |
0 |
0 |
0 |
0 |
0 |
0 |
0 |
0 |
0 |
| Total |
0 |
0 |
0 |
0 |
0 |
0 |
0 |
0 |
0 |
| Oha Isl |
Males |
0 |
0 |
0 |
0 |
0 |
0 |
0 |
0 |
0 |
| Females |
0 |
0 |
0 |
0 |
0 |
0 |
0 |
0 |
0 |
| Total |
0 |
0 |
0 |
0 |
0 |
0 |
0 |
0 |
0 |
| Kubar Isl |
Males |
0 |
0 |
0 |
0 |
0 |
0 |
0 |
0 |
0 |
| Females |
0 |
0 |
0 |
0 |
0 |
0 |
0 |
0 |
0 |
| Total |
0 |
0 |
0 |
0 |
0 |
0 |
0 |
0 |
0 |
| Qarowa Isl |
Males |
0 |
0 |
0 |
0 |
0 |
0 |
0 |
0 |
0 |
| Females |
0 |
0 |
0 |
0 |
0 |
0 |
0 |
0 |
0 |
| Total |
0 |
0 |
0 |
0 |
0 |
0 |
0 |
0 |
0 |
| Aum – Almaradim Isl |
Males |
0 |
0 |
0 |
0 |
0 |
0 |
0 |
0 |
0 |
| Females |
0 |
0 |
0 |
0 |
0 |
0 |
0 |
0 |
0 |
| Total |
0 |
0 |
0 |
0 |
0 |
0 |
0 |
0 |
0 |
| Aum – Alnamil Isl |
Males |
0 |
0 |
0 |
0 |
0 |
0 |
0 |
0 |
0 |
| Females |
0 |
0 |
0 |
0 |
0 |
0 |
0 |
0 |
0 |
| Total |
0 |
0 |
0 |
0 |
0 |
0 |
0 |
0 |
0 |
| Doha Resort |
Males |
0 |
0 |
2 |
0 |
0 |
0 |
0 |
0 |
2 |
| Females |
0 |
0 |
0 |
0 |
0 |
0 |
0 |
0 |
0 |
| Total |
0 |
0 |
2 |
0 |
0 |
0 |
0 |
0 |
2 |
| Free Zone |
Males |
0 |
0 |
0 |
0 |
0 |
0 |
0 |
0 |
0 |
| Females |
0 |
0 |
0 |
0 |
0 |
0 |
0 |
0 |
0 |
| Total |
0 |
0 |
0 |
0 |
0 |
0 |
0 |
0 |
0 |
| North-west of Sulaibekhat |
Males |
0 |
0 |
0 |
0 |
0 |
0 |
0 |
0 |
0 |
| Females |
0 |
0 |
0 |
0 |
0 |
0 |
0 |
0 |
0 |
| Total |
0 |
0 |
0 |
0 |
0 |
0 |
0 |
0 |
0 |
| Total Capital Governorate |
Males |
114,750 |
47,605 |
130,656 |
906 |
871 |
1,056 |
80 |
88 |
296,012 |
| Females |
120,955 |
22,903 |
84,977 |
11,387 |
828 |
878 |
49 |
64 |
242,041 |
| Total |
235,705 |
70,508 |
215,633 |
12,293 |
1,699 |
1,934 |
129 |
152 |
538,053 |
| Hawalli |
Males |
1,203 |
97,498 |
33,130 |
181 |
517 |
813 |
45 |
69 |
133,456 |
| Females |
1,248 |
47,509 |
17,366 |
1,099 |
561 |
720 |
37 |
57 |
68,597 |
| Total |
2,451 |
145,007 |
50,496 |
1,280 |
1,078 |
1,533 |
82 |
126 |
202,053 |
| Salmiya |
Males |
4,781 |
84,906 |
69,576 |
387 |
2,041 |
2,248 |
114 |
206 |
164,259 |
| Females |
5,026 |
60,202 |
52,673 |
2,051 |
2,063 |
1,789 |
116 |
167 |
124,087 |
| Total |
9,807 |
145,108 |
122,249 |
2,438 |
4,104 |
4,037 |
230 |
373 |
288,346 |
| Shaab |
Males |
3,186 |
1,886 |
2,540 |
15 |
131 |
187 |
9 |
28 |
7,982 |
| Females |
3,353 |
1,647 |
2,821 |
424 |
125 |
179 |
10 |
25 |
8,584 |
| Total |
6,539 |
3,533 |
5,361 |
439 |
256 |
366 |
19 |
53 |
16,566 |
| Rumaythiya |
Males |
17,338 |
2,429 |
7,629 |
33 |
98 |
144 |
26 |
13 |
27,710 |
| Females |
17,795 |
2,053 |
9,507 |
1,753 |
86 |
150 |
6 |
11 |
31,361 |
| Total |
35,133 |
4,482 |
17,136 |
1,786 |
184 |
294 |
32 |
24 |
59,071 |
| Salwa |
Males |
14,539 |
11,282 |
12,909 |
154 |
756 |
843 |
75 |
95 |
40,653 |
| Females |
15,682 |
9,277 |
12,475 |
1,565 |
744 |
743 |
50 |
98 |
40,634 |
| Total |
30,221 |
20,559 |
25,384 |
1,719 |
1,500 |
1,586 |
125 |
193 |
81,287 |
| Bedi |
Males |
71 |
158 |
439 |
1 |
34 |
20 |
1 |
8 |
732 |
| Females |
66 |
79 |
213 |
8 |
18 |
8 |
0 |
8 |
400 |
| Total |
137 |
237 |
652 |
9 |
52 |
28 |
1 |
16 |
1,132 |
| Mushaif |
Males |
12,523 |
808 |
5,229 |
73 |
91 |
86 |
8 |
6 |
18,824 |
| Females |
12,488 |
687 |
7,387 |
1,018 |
128 |
101 |
6 |
7 |
21,822 |
| Total |
25,011 |
1,495 |
12,616 |
1,091 |
219 |
187 |
14 |
13 |
40,646 |
| Mubarak Al-Abdel-Allah |
Males |
2,991 |
195 |
1,027 |
26 |
21 |
27 |
4 |
4 |
4,295 |
| Females |
3,020 |
162 |
1,557 |
277 |
30 |
30 |
0 |
8 |
5,084 |
| Total |
6,011 |
357 |
2,584 |
303 |
51 |
57 |
4 |
12 |
9,379 |
| Bayan |
Males |
14,675 |
1,372 |
6,107 |
48 |
79 |
113 |
8 |
6 |
22,408 |
| Females |
15,154 |
1,189 |
7,552 |
1,276 |
107 |
107 |
15 |
7 |
25,407 |
| Total |
29,829 |
2,561 |
13,659 |
1,324 |
186 |
220 |
23 |
13 |
47,815 |
| Mubarakiya |
Males |
0 |
0 |
0 |
0 |
0 |
0 |
0 |
0 |
0 |
| Females |
0 |
0 |
0 |
0 |
0 |
0 |
0 |
0 |
0 |
| Total |
0 |
0 |
0 |
0 |
0 |
0 |
0 |
0 |
0 |
| Jabriya |
Males |
11,602 |
14,028 |
10,312 |
134 |
432 |
810 |
16 |
73 |
37,407 |
| Females |
11,949 |
11,928 |
12,326 |
1,503 |
440 |
690 |
19 |
70 |
38,925 |
| Total |
23,551 |
25,956 |
22,638 |
1,637 |
872 |
1,500 |
35 |
143 |
76,332 |
| Wizarat area |
Males |
0 |
5 |
2 |
0 |
0 |
0 |
0 |
0 |
7 |
| Females |
0 |
2 |
0 |
0 |
0 |
0 |
0 |
0 |
2 |
| Total |
0 |
7 |
2 |
0 |
0 |
0 |
0 |
0 |
9 |
| Al-Shohadaa |
Males |
4,047 |
194 |
1,359 |
29 |
14 |
51 |
1 |
1 |
5,696 |
| Females |
4,051 |
216 |
1,931 |
339 |
15 |
41 |
0 |
3 |
6,596 |
| Total |
8,098 |
410 |
3,290 |
368 |
29 |
92 |
1 |
4 |
12,292 |
| Al-Zahraa |
Males |
7,351 |
509 |
2,439 |
36 |
30 |
60 |
5 |
1 |
10,431 |
| Females |
7,681 |
486 |
3,404 |
665 |
33 |
54 |
8 |
1 |
12,332 |
| Total |
15,032 |
995 |
5,843 |
701 |
63 |
114 |
13 |
2 |
22,763 |
| Hetteen |
Males |
5,676 |
305 |
1,810 |
7 |
11 |
30 |
1 |
3 |
7,843 |
| Females |
5,711 |
313 |
2,704 |
477 |
20 |
19 |
3 |
2 |
9,249 |
| Total |
11,387 |
618 |
4,514 |
484 |
31 |
49 |
4 |
5 |
17,092 |
| Al-Siddeek |
Males |
142 |
18 |
39 |
0 |
3 |
10 |
1 |
0 |
213 |
| Females |
149 |
15 |
62 |
6 |
2 |
7 |
0 |
0 |
241 |
| Total |
291 |
33 |
101 |
6 |
5 |
17 |
1 |
0 |
454 |
| Al-Salam |
Males |
7,365 |
495 |
2,449 |
29 |
40 |
61 |
13 |
6 |
10,458 |
| Females |
7,396 |
472 |
3,643 |
635 |
54 |
33 |
8 |
6 |
12,247 |
| Total |
14,761 |
967 |
6,092 |
664 |
94 |
94 |
21 |
12 |
22,705 |
| Anjafa |
Males |
26 |
54 |
170 |
0 |
13 |
16 |
0 |
0 |
279 |
| Females |
22 |
34 |
95 |
4 |
13 |
12 |
0 |
0 |
180 |
| Total |
48 |
88 |
265 |
4 |
26 |
28 |
0 |
0 |
459 |
| Total Hawalli Governorate |
Males |
107,516 |
216,142 |
157,166 |
1,153 |
4,311 |
5,519 |
327 |
519 |
492,653 |
| Females |
110,791 |
136,271 |
135,716 |
13,100 |
4,439 |
4,683 |
278 |
470 |
405,748 |
| Total |
218,307 |
352,413 |
292,882 |
14,253 |
8,750 |
10,202 |
605 |
989 |
898,401 |
| Ahmadi city |
Males |
5,701 |
4,868 |
7,463 |
26 |
94 |
197 |
25 |
30 |
18,404 |
| Females |
5,963 |
3,272 |
2,540 |
363 |
38 |
113 |
10 |
20 |
12,319 |
| Total |
11,664 |
8,140 |
10,003 |
389 |
132 |
310 |
35 |
50 |
30,723 |
| Fahaheel |
Males |
9,772 |
14,802 |
43,991 |
94 |
68 |
101 |
5 |
5 |
68,838 |
| Females |
10,083 |
4,856 |
12,230 |
550 |
23 |
50 |
4 |
2 |
27,798 |
| Total |
19,855 |
19,658 |
56,221 |
644 |
91 |
151 |
9 |
7 |
96,636 |
| Sabahiya |
Males |
22,184 |
6,313 |
13,706 |
104 |
25 |
24 |
5 |
7 |
42,368 |
| Females |
23,924 |
4,705 |
7,621 |
969 |
22 |
36 |
5 |
8 |
37,290 |
| Total |
46,108 |
11,018 |
21,327 |
1,073 |
47 |
60 |
10 |
15 |
79,658 |
| South – Sabahiya |
Males |
1 |
4 |
0 |
0 |
0 |
0 |
0 |
0 |
5 |
| Females |
0 |
1 |
0 |
0 |
0 |
0 |
0 |
0 |
1 |
| Total |
1 |
5 |
0 |
0 |
0 |
0 |
0 |
0 |
6 |
| Rikka |
Males |
15,268 |
3,038 |
8,035 |
82 |
13 |
12 |
7 |
1 |
26,456 |
| Females |
16,332 |
2,352 |
4,592 |
866 |
20 |
18 |
4 |
1 |
24,185 |
| Total |
31,600 |
5,390 |
12,627 |
948 |
33 |
30 |
11 |
2 |
50,641 |
| Hadiya |
Males |
7,781 |
712 |
3,364 |
34 |
3 |
21 |
0 |
1 |
11,916 |
| Females |
7,488 |
720 |
2,831 |
446 |
13 |
19 |
2 |
1 |
11,520 |
| Total |
15,269 |
1,432 |
6,195 |
480 |
16 |
40 |
2 |
2 |
23,436 |
| Fintas |
Males |
3,794 |
11,002 |
7,889 |
101 |
259 |
377 |
12 |
24 |
23,458 |
| Females |
3,875 |
7,540 |
3,243 |
402 |
182 |
161 |
11 |
22 |
15,436 |
| Total |
7,669 |
18,542 |
11,132 |
503 |
441 |
538 |
23 |
46 |
38,894 |
| Jaber Al-Ali |
Males |
16,513 |
1,188 |
6,701 |
61 |
4 |
8 |
1 |
0 |
24,476 |
| Females |
16,175 |
1,189 |
4,442 |
777 |
7 |
8 |
0 |
0 |
22,598 |
| Total |
32,688 |
2,377 |
11,143 |
838 |
11 |
16 |
1 |
0 |
47,074 |
| Auqqila |
Males |
2,571 |
331 |
1,191 |
26 |
91 |
77 |
8 |
9 |
4,304 |
| Females |
2,636 |
317 |
1,016 |
200 |
74 |
50 |
8 |
11 |
4,312 |
| Total |
5,207 |
648 |
2,207 |
226 |
165 |
127 |
16 |
20 |
8,616 |
| Abu- Alhasniya |
Males |
134 |
20 |
130 |
2 |
41 |
160 |
0 |
1 |
488 |
| Females |
135 |
22 |
130 |
12 |
26 |
31 |
0 |
1 |
357 |
| Total |
269 |
42 |
260 |
14 |
67 |
191 |
0 |
2 |
845 |
| Mahbula |
Males |
1,470 |
20,514 |
75,334 |
572 |
599 |
1,721 |
78 |
41 |
100,329 |
| Females |
1,621 |
6,346 |
10,932 |
528 |
348 |
681 |
44 |
24 |
20,524 |
| Total |
3,091 |
26,860 |
86,266 |
1,100 |
947 |
2,402 |
122 |
65 |
120,853 |
| Al- Adami |
Males |
0 |
0 |
0 |
0 |
0 |
0 |
0 |
0 |
0 |
| Females |
0 |
0 |
0 |
0 |
0 |
0 |
0 |
0 |
0 |
| Total |
0 |
0 |
0 |
0 |
0 |
0 |
0 |
0 |
0 |
| Abu-Halifa |
Males |
2,094 |
10,731 |
17,423 |
111 |
102 |
276 |
13 |
12 |
30,762 |
| Females |
2,084 |
7,269 |
8,412 |
210 |
64 |
91 |
4 |
5 |
18,139 |
| Total |
4,178 |
18,000 |
25,835 |
321 |
166 |
367 |
17 |
17 |
48,901 |
| Munkaf |
Males |
7,997 |
16,331 |
58,780 |
185 |
499 |
1,777 |
39 |
36 |
85,644 |
| Females |
8,118 |
8,385 |
18,070 |
716 |
244 |
640 |
36 |
24 |
36,233 |
| Total |
16,115 |
24,716 |
76,850 |
901 |
743 |
2,417 |
75 |
60 |
121,877 |
| Thaher |
Males |
13,058 |
2,007 |
5,943 |
66 |
0 |
4 |
3 |
1 |
21,082 |
| Females |
13,441 |
1,781 |
3,364 |
604 |
5 |
5 |
1 |
0 |
19,201 |
| Total |
26,499 |
3,788 |
9,307 |
670 |
5 |
9 |
4 |
1 |
40,283 |
| Shuaiba |
Males |
0 |
88 |
973 |
0 |
0 |
0 |
0 |
0 |
1,061 |
| Females |
0 |
5 |
9 |
0 |
0 |
0 |
0 |
0 |
14 |
| Total |
0 |
93 |
982 |
0 |
0 |
0 |
0 |
0 |
1,075 |
| Shuaiba-ind W |
Males |
0 |
2,872 |
22,526 |
19 |
16 |
2 |
0 |
0 |
25,435 |
| Females |
0 |
31 |
79 |
2 |
2 |
0 |
0 |
0 |
114 |
| Total |
0 |
2,903 |
22,605 |
21 |
18 |
2 |
0 |
0 |
25,549 |
| Abdulla -Port |
Males |
0 |
100 |
1,833 |
1 |
3 |
0 |
0 |
0 |
1,937 |
| Females |
0 |
1 |
3 |
0 |
0 |
0 |
0 |
0 |
4 |
| Total |
0 |
101 |
1,836 |
1 |
3 |
0 |
0 |
0 |
1,941 |
| Abdulla Port-Resort |
Males |
0 |
223 |
629 |
3 |
1 |
3 |
0 |
0 |
859 |
| Females |
0 |
12 |
8 |
0 |
3 |
0 |
0 |
0 |
23 |
| Total |
0 |
235 |
637 |
3 |
4 |
3 |
0 |
0 |
882 |
| Nwaiseeb resort |
Males |
0 |
1 |
0 |
0 |
0 |
0 |
0 |
0 |
1 |
| Females |
0 |
0 |
0 |
0 |
0 |
0 |
0 |
0 |
0 |
| Total |
0 |
1 |
0 |
0 |
0 |
0 |
0 |
0 |
1 |
| Al-Kayron resorts |
Males |
0 |
213 |
1,717 |
40 |
14 |
0 |
0 |
0 |
1,984 |
| Females |
0 |
25 |
56 |
0 |
3 |
0 |
0 |
0 |
84 |
| Total |
0 |
238 |
1,773 |
40 |
17 |
0 |
0 |
0 |
2,068 |
| Zoor Resort |
Males |
0 |
6 |
0 |
0 |
0 |
0 |
0 |
0 |
6 |
| Females |
0 |
6 |
0 |
0 |
0 |
0 |
0 |
0 |
6 |
| Total |
0 |
12 |
0 |
0 |
0 |
0 |
0 |
0 |
12 |
| Jlaiaa Resort |
Males |
0 |
4 |
202 |
0 |
0 |
44 |
0 |
0 |
250 |
| Females |
0 |
1 |
11 |
2 |
0 |
10 |
0 |
0 |
24 |
| Total |
0 |
5 |
213 |
2 |
0 |
54 |
0 |
0 |
274 |
| Bedier Resort |
Males |
0 |
14 |
2 |
0 |
0 |
0 |
0 |
0 |
16 |
| Females |
0 |
3 |
0 |
0 |
0 |
0 |
0 |
0 |
3 |
| Total |
0 |
17 |
2 |
0 |
0 |
0 |
0 |
0 |
19 |
| Dubaeeiya Resort |
Males |
0 |
9 |
8 |
0 |
0 |
0 |
0 |
0 |
17 |
| Females |
0 |
6 |
0 |
0 |
0 |
0 |
0 |
0 |
6 |
| Total |
0 |
15 |
8 |
0 |
0 |
0 |
0 |
0 |
23 |
| Zoor |
Males |
0 |
945 |
885 |
6 |
14 |
117 |
9 |
5 |
1,981 |
| Females |
1 |
735 |
131 |
24 |
12 |
102 |
12 |
5 |
1,022 |
| Total |
1 |
1,680 |
1,016 |
30 |
26 |
219 |
21 |
10 |
3,003 |
| Nwaiseeb |
Males |
0 |
0 |
0 |
0 |
0 |
0 |
0 |
0 |
0 |
| Females |
0 |
0 |
0 |
0 |
0 |
0 |
0 |
0 |
0 |
| Total |
0 |
0 |
0 |
0 |
0 |
0 |
0 |
0 |
0 |
| Sbainhiya |
Males |
0 |
0 |
0 |
0 |
0 |
0 |
0 |
0 |
0 |
| Females |
0 |
0 |
0 |
0 |
0 |
0 |
0 |
0 |
0 |
| Total |
0 |
0 |
0 |
0 |
0 |
0 |
0 |
0 |
0 |
| Wafra |
Males |
1 |
45 |
5 |
0 |
0 |
0 |
0 |
0 |
51 |
| Females |
0 |
50 |
0 |
0 |
0 |
0 |
0 |
0 |
50 |
| Total |
1 |
95 |
5 |
0 |
0 |
0 |
0 |
0 |
101 |
| New Wafra |
Males |
70 |
511 |
353 |
23 |
0 |
0 |
0 |
0 |
957 |
| Females |
61 |
340 |
65 |
6 |
0 |
0 |
0 |
0 |
472 |
| Total |
131 |
851 |
418 |
29 |
0 |
0 |
0 |
0 |
1,429 |
| Wafra -Agriculture |
Males |
1 |
1,694 |
7,704 |
210 |
0 |
0 |
0 |
0 |
9,609 |
| Females |
0 |
111 |
47 |
0 |
0 |
0 |
0 |
0 |
158 |
| Total |
1 |
1,805 |
7,751 |
210 |
0 |
0 |
0 |
0 |
9,767 |
| Wara |
Males |
0 |
0 |
1 |
0 |
0 |
0 |
0 |
0 |
1 |
| Females |
0 |
0 |
0 |
0 |
0 |
0 |
0 |
0 |
0 |
| Total |
0 |
0 |
1 |
0 |
0 |
0 |
0 |
0 |
1 |
| Muqwaa |
Males |
0 |
53 |
119 |
1 |
0 |
0 |
0 |
0 |
173 |
| Females |
0 |
0 |
0 |
0 |
0 |
0 |
0 |
0 |
0 |
| Total |
0 |
53 |
119 |
1 |
0 |
0 |
0 |
0 |
173 |
| Ahmadi – Desert |
Males |
0 |
29 |
230 |
0 |
0 |
0 |
0 |
0 |
259 |
| Females |
0 |
21 |
1 |
0 |
0 |
0 |
0 |
0 |
22 |
| Total |
0 |
50 |
231 |
0 |
0 |
0 |
0 |
0 |
281 |
| Gawakheer-South |
Males |
0 |
9 |
31 |
0 |
0 |
0 |
0 |
0 |
40 |
| Females |
0 |
0 |
0 |
0 |
0 |
0 |
0 |
0 |
0 |
| Total |
0 |
9 |
31 |
0 |
0 |
0 |
0 |
0 |
40 |
| Fahd Al – Ahmad |
Males |
7,391 |
387 |
2,652 |
31 |
6 |
9 |
3 |
3 |
10,482 |
| Females |
7,294 |
446 |
1,735 |
289 |
5 |
14 |
0 |
5 |
9,788 |
| Total |
14,685 |
833 |
4,387 |
320 |
11 |
23 |
3 |
8 |
20,270 |
| Ali Sabah Alsalem |
Males |
17,760 |
2,355 |
7,543 |
88 |
9 |
0 |
0 |
4 |
27,759 |
| Females |
16,908 |
2,574 |
3,395 |
670 |
6 |
0 |
1 |
4 |
23,558 |
| Total |
34,668 |
4,929 |
10,938 |
758 |
15 |
0 |
1 |
8 |
51,317 |
| Rajm Khashman |
Males |
0 |
23 |
25 |
1 |
0 |
0 |
0 |
0 |
49 |
| Females |
0 |
0 |
0 |
0 |
0 |
0 |
0 |
0 |
0 |
| Total |
0 |
23 |
25 |
1 |
0 |
0 |
0 |
0 |
49 |
| Sabah Al – Ahmad C |
Males |
1 |
0 |
17 |
0 |
6 |
0 |
0 |
0 |
24 |
| Females |
1 |
0 |
3 |
0 |
0 |
0 |
0 |
0 |
4 |
| Total |
2 |
0 |
20 |
0 |
6 |
0 |
0 |
0 |
28 |
| sabah al- ahmad ( 1 ) |
Males |
0 |
0 |
0 |
0 |
0 |
0 |
0 |
0 |
0 |
| Females |
0 |
0 |
0 |
0 |
0 |
0 |
0 |
0 |
0 |
| Total |
0 |
0 |
0 |
0 |
0 |
0 |
0 |
0 |
0 |
| sabah al- ahmad ( 2 ) |
Males |
0 |
0 |
0 |
0 |
0 |
0 |
0 |
0 |
0 |
| Females |
0 |
0 |
0 |
0 |
0 |
0 |
0 |
0 |
0 |
| Total |
0 |
0 |
0 |
0 |
0 |
0 |
0 |
0 |
0 |
| sabah al- ahmad ( 3 ) |
Males |
3 |
0 |
3 |
0 |
0 |
0 |
0 |
0 |
6 |
| Females |
4 |
0 |
0 |
0 |
0 |
0 |
0 |
0 |
4 |
| Total |
7 |
0 |
3 |
0 |
0 |
0 |
0 |
0 |
10 |
| sabah al- ahmad ( 4 ) |
Males |
0 |
0 |
0 |
0 |
0 |
0 |
0 |
0 |
0 |
| Females |
0 |
0 |
0 |
0 |
0 |
0 |
0 |
0 |
0 |
| Total |
0 |
0 |
0 |
0 |
0 |
0 |
0 |
0 |
0 |
| sabah al- ahmad ( 5 ) |
Males |
0 |
0 |
0 |
0 |
0 |
0 |
0 |
0 |
0 |
| Females |
0 |
0 |
0 |
0 |
0 |
0 |
0 |
0 |
0 |
| Total |
0 |
0 |
0 |
0 |
0 |
0 |
0 |
0 |
0 |
| Kabad – Agriculture |
Males |
0 |
1 |
0 |
0 |
0 |
0 |
0 |
0 |
1 |
| Females |
0 |
0 |
0 |
0 |
0 |
0 |
0 |
0 |
0 |
| Total |
0 |
1 |
0 |
0 |
0 |
0 |
0 |
0 |
1 |
| Al-Kayron residential |
Males |
0 |
0 |
0 |
0 |
0 |
0 |
0 |
0 |
0 |
| Females |
0 |
0 |
0 |
0 |
0 |
0 |
0 |
0 |
0 |
| Total |
0 |
0 |
0 |
0 |
0 |
0 |
0 |
0 |
0 |
| Total Al-Ahmadi Governorate |
Males |
133,565 |
101,443 |
297,408 |
1,887 |
1,867 |
4,930 |
208 |
180 |
541,488 |
| Females |
136,144 |
53,122 |
84,966 |
7,636 |
1,097 |
2,029 |
142 |
133 |
285,269 |
| Total |
269,709 |
154,565 |
382,374 |
9,523 |
2,964 |
6,959 |
350 |
313 |
826,757 |
| Jahra |
Males |
4,437 |
19,211 |
13,813 |
121 |
36 |
8 |
2 |
10 |
37,638 |
| Females |
4,591 |
11,197 |
5,297 |
472 |
39 |
10 |
1 |
7 |
21,614 |
| Total |
9,028 |
30,408 |
19,110 |
593 |
75 |
18 |
3 |
17 |
59,252 |
| Al – Kasser |
Males |
11,819 |
11,662 |
8,566 |
142 |
16 |
4 |
6 |
2 |
32,217 |
| Females |
12,836 |
7,475 |
4,589 |
918 |
13 |
5 |
3 |
2 |
25,841 |
| Total |
24,655 |
19,137 |
13,155 |
1,060 |
29 |
9 |
9 |
4 |
58,058 |
| Al – Naim |
Males |
4,547 |
1,470 |
1,927 |
54 |
0 |
3 |
1 |
0 |
8,002 |
| Females |
4,397 |
1,466 |
1,225 |
378 |
4 |
4 |
2 |
0 |
7,476 |
| Total |
8,944 |
2,936 |
3,152 |
432 |
4 |
7 |
3 |
0 |
15,478 |
| Al – Naseem |
Males |
6,768 |
1,942 |
3,239 |
94 |
3 |
2 |
0 |
5 |
12,053 |
| Females |
6,777 |
1,629 |
2,019 |
576 |
1 |
1 |
0 |
2 |
11,005 |
| Total |
13,545 |
3,571 |
5,258 |
670 |
4 |
3 |
0 |
7 |
23,058 |
| Taimaa |
Males |
1,035 |
27,302 |
2,936 |
62 |
11 |
23 |
10 |
10 |
31,389 |
| Females |
2,057 |
25,786 |
2,092 |
876 |
10 |
18 |
9 |
5 |
30,853 |
| Total |
3,092 |
53,088 |
5,028 |
938 |
21 |
41 |
19 |
15 |
62,242 |
| Waha |
Males |
10,023 |
4,779 |
6,136 |
133 |
7 |
3 |
0 |
0 |
21,081 |
| Females |
10,739 |
4,352 |
3,508 |
845 |
8 |
6 |
0 |
0 |
19,458 |
| Total |
20,762 |
9,131 |
9,644 |
978 |
15 |
9 |
0 |
0 |
40,539 |
| Al – Auyon |
Males |
11,499 |
3,967 |
6,270 |
152 |
2 |
6 |
1 |
3 |
21,900 |
| Females |
11,785 |
3,564 |
3,392 |
1,030 |
7 |
4 |
0 |
0 |
19,782 |
| Total |
23,284 |
7,531 |
9,662 |
1,182 |
9 |
10 |
1 |
3 |
41,682 |
| Sekrab – Reg |
Males |
0 |
47 |
109 |
0 |
0 |
0 |
0 |
0 |
156 |
| Females |
0 |
0 |
0 |
0 |
0 |
0 |
0 |
0 |
0 |
| Total |
0 |
47 |
109 |
0 |
0 |
0 |
0 |
0 |
156 |
| Jahraa Ind |
Males |
0 |
135 |
676 |
0 |
0 |
0 |
0 |
0 |
811 |
| Females |
0 |
14 |
8 |
0 |
0 |
0 |
0 |
0 |
22 |
| Total |
0 |
149 |
684 |
0 |
0 |
0 |
0 |
0 |
833 |
| Sulaibiya -Shabiya |
Males |
1,195 |
24,075 |
2,892 |
41 |
30 |
81 |
35 |
16 |
28,365 |
| Females |
2,903 |
22,266 |
2,056 |
809 |
21 |
63 |
19 |
18 |
28,155 |
| Total |
4,098 |
46,341 |
4,948 |
850 |
51 |
144 |
54 |
34 |
56,520 |
| Sulaibiya – Ind (1) |
Males |
0 |
373 |
1,045 |
0 |
0 |
0 |
0 |
0 |
1,418 |
| Females |
0 |
19 |
3 |
0 |
0 |
0 |
0 |
0 |
22 |
| Total |
0 |
392 |
1,048 |
0 |
0 |
0 |
0 |
0 |
1,440 |
| Sulaibiya – Ind (2) |
Males |
0 |
317 |
3,098 |
32 |
14 |
16 |
12 |
0 |
3,489 |
| Females |
0 |
12 |
35 |
5 |
4 |
5 |
0 |
0 |
61 |
| Total |
0 |
329 |
3,133 |
37 |
18 |
21 |
12 |
0 |
3,550 |
| Sulaibiya – Ind (3) |
Males |
0 |
4 |
2 |
0 |
0 |
0 |
0 |
0 |
6 |
| Females |
0 |
0 |
0 |
0 |
0 |
0 |
0 |
0 |
0 |
| Total |
0 |
4 |
2 |
0 |
0 |
0 |
0 |
0 |
6 |
| Sulaibiya -Agriculture |
Males |
0 |
623 |
2,728 |
12 |
2 |
0 |
0 |
0 |
3,365 |
| Females |
0 |
105 |
10 |
0 |
0 |
0 |
0 |
0 |
115 |
| Total |
0 |
728 |
2,738 |
12 |
2 |
0 |
0 |
0 |
3,480 |
| Abdelli |
Males |
0 |
2,194 |
5,718 |
322 |
3 |
0 |
0 |
0 |
8,237 |
| Females |
0 |
56 |
25 |
0 |
0 |
0 |
0 |
0 |
81 |
| Total |
0 |
2,250 |
5,743 |
322 |
3 |
0 |
0 |
0 |
8,318 |
| Amgara – Ind |
Males |
0 |
2,764 |
9,278 |
75 |
2 |
0 |
0 |
0 |
12,119 |
| Females |
0 |
26 |
52 |
2 |
0 |
0 |
0 |
0 |
80 |
| Total |
0 |
2,790 |
9,330 |
77 |
2 |
0 |
0 |
0 |
12,199 |
| Mitlaa |
Males |
0 |
14 |
1 |
0 |
0 |
0 |
0 |
0 |
15 |
| Females |
0 |
12 |
0 |
0 |
0 |
0 |
0 |
0 |
12 |
| Total |
0 |
26 |
1 |
0 |
0 |
0 |
0 |
0 |
27 |
| Kathma |
Males |
0 |
1 |
99 |
0 |
0 |
0 |
0 |
0 |
100 |
| Females |
0 |
0 |
0 |
0 |
0 |
0 |
0 |
0 |
0 |
| Total |
0 |
1 |
99 |
0 |
0 |
0 |
0 |
0 |
100 |
| Al – Rawadatain |
Males |
0 |
38 |
50 |
0 |
0 |
0 |
0 |
0 |
88 |
| Females |
0 |
3 |
1 |
0 |
0 |
0 |
0 |
0 |
4 |
| Total |
0 |
41 |
51 |
0 |
0 |
0 |
0 |
0 |
92 |
| Aum – Al – Ash |
Males |
0 |
1 |
25 |
0 |
0 |
0 |
0 |
0 |
26 |
| Females |
0 |
0 |
0 |
0 |
0 |
0 |
0 |
0 |
0 |
| Total |
0 |
1 |
25 |
0 |
0 |
0 |
0 |
0 |
26 |
| Al – Salmi |
Males |
0 |
182 |
411 |
6 |
0 |
0 |
0 |
0 |
599 |
| Females |
0 |
5 |
8 |
0 |
0 |
0 |
0 |
0 |
13 |
| Total |
0 |
187 |
419 |
6 |
0 |
0 |
0 |
0 |
612 |
| Kabad |
Males |
0 |
100 |
297 |
9 |
0 |
0 |
0 |
0 |
406 |
| Females |
0 |
9 |
1 |
0 |
0 |
0 |
0 |
0 |
10 |
| Total |
0 |
109 |
298 |
9 |
0 |
0 |
0 |
0 |
416 |
| Shegaya |
Males |
0 |
0 |
0 |
0 |
0 |
0 |
0 |
0 |
0 |
| Females |
0 |
0 |
0 |
0 |
0 |
0 |
0 |
0 |
0 |
| Total |
0 |
0 |
0 |
0 |
0 |
0 |
0 |
0 |
0 |
| Al – Sebiya |
Males |
0 |
1 |
35 |
0 |
0 |
0 |
0 |
0 |
36 |
| Females |
0 |
0 |
2 |
0 |
0 |
0 |
0 |
0 |
2 |
| Total |
0 |
1 |
37 |
0 |
0 |
0 |
0 |
0 |
38 |
| Jahra – Camp |
Males |
0 |
0 |
84 |
0 |
0 |
0 |
0 |
0 |
84 |
| Females |
0 |
0 |
0 |
0 |
0 |
0 |
0 |
0 |
0 |
| Total |
0 |
0 |
84 |
0 |
0 |
0 |
0 |
0 |
84 |
| Al – Atraaf |
Males |
0 |
0 |
0 |
0 |
0 |
0 |
0 |
0 |
0 |
| Females |
0 |
0 |
0 |
0 |
0 |
0 |
0 |
0 |
0 |
| Total |
0 |
0 |
0 |
0 |
0 |
0 |
0 |
0 |
0 |
| Warba Isl |
Males |
0 |
0 |
0 |
0 |
0 |
0 |
0 |
0 |
0 |
| Females |
0 |
0 |
0 |
0 |
0 |
0 |
0 |
0 |
0 |
| Total |
0 |
0 |
0 |
0 |
0 |
0 |
0 |
0 |
0 |
| Bubyan Isl |
Males |
0 |
0 |
0 |
0 |
0 |
0 |
0 |
0 |
0 |
| Females |
0 |
0 |
0 |
0 |
0 |
0 |
0 |
0 |
0 |
| Total |
0 |
0 |
0 |
0 |
0 |
0 |
0 |
0 |
0 |
| Jahara – Desert |
Males |
0 |
533 |
1,144 |
19 |
0 |
0 |
0 |
0 |
1,696 |
| Females |
0 |
11 |
4 |
0 |
0 |
0 |
0 |
0 |
15 |
| Total |
0 |
544 |
1,148 |
19 |
0 |
0 |
0 |
0 |
1,711 |
| Saad Al – Abdulla city |
Males |
27,330 |
5,163 |
10,477 |
241 |
18 |
29 |
3 |
7 |
43,268 |
| Females |
26,913 |
4,951 |
6,412 |
1,876 |
17 |
31 |
4 |
10 |
40,214 |
| Total |
54,243 |
10,114 |
16,889 |
2,117 |
35 |
60 |
7 |
17 |
83,482 |
| Qayrawan |
Males |
5,613 |
881 |
2,075 |
33 |
11 |
47 |
11 |
17 |
8,688 |
| Females |
5,459 |
851 |
1,657 |
506 |
12 |
41 |
4 |
4 |
8,534 |
| Total |
11,072 |
1,732 |
3,732 |
539 |
23 |
88 |
15 |
21 |
17,222 |
| Jahraa -Gawakheer |
Males |
0 |
1 |
2 |
0 |
0 |
0 |
0 |
0 |
3 |
| Females |
0 |
0 |
0 |
0 |
0 |
0 |
0 |
0 |
0 |
| Total |
0 |
1 |
2 |
0 |
0 |
0 |
0 |
0 |
3 |
| Kazma Resort |
Males |
0 |
0 |
0 |
0 |
0 |
0 |
0 |
0 |
0 |
| Females |
0 |
0 |
0 |
0 |
0 |
0 |
0 |
0 |
0 |
| Total |
0 |
0 |
0 |
0 |
0 |
0 |
0 |
0 |
0 |
| AlSubbiya Resort |
Males |
0 |
0 |
0 |
0 |
0 |
0 |
0 |
0 |
0 |
| Females |
0 |
0 |
0 |
0 |
0 |
0 |
0 |
0 |
0 |
| Total |
0 |
0 |
0 |
0 |
0 |
0 |
0 |
0 |
0 |
| Al-Behaith |
Males |
0 |
0 |
0 |
0 |
0 |
0 |
0 |
0 |
0 |
| Females |
0 |
0 |
0 |
0 |
0 |
0 |
0 |
0 |
0 |
| Total |
0 |
0 |
0 |
0 |
0 |
0 |
0 |
0 |
0 |
| Northwest Jahra |
Males |
0 |
12 |
70 |
1 |
0 |
2 |
0 |
0 |
85 |
| Females |
0 |
3 |
5 |
2 |
0 |
0 |
0 |
0 |
10 |
| Total |
0 |
15 |
75 |
3 |
0 |
2 |
0 |
0 |
95 |
| Jaber al-Ahmad |
Males |
1,942 |
327 |
650 |
6 |
3 |
14 |
1 |
1 |
2,944 |
| Females |
1,961 |
312 |
434 |
125 |
2 |
10 |
0 |
2 |
2,846 |
| Total |
3,903 |
639 |
1,084 |
131 |
5 |
24 |
1 |
3 |
5,790 |
| neayem |
Males |
0 |
0 |
6 |
0 |
0 |
0 |
0 |
0 |
6 |
| Females |
0 |
0 |
0 |
0 |
0 |
0 |
0 |
0 |
0 |
| Total |
0 |
0 |
6 |
0 |
0 |
0 |
0 |
0 |
6 |
| Total Al-jahra Governorate |
Males |
86,208 |
108,119 |
83,859 |
1,555 |
158 |
238 |
82 |
71 |
280,290 |
| Females |
90,418 |
84,124 |
32,835 |
8,420 |
138 |
198 |
42 |
50 |
216,225 |
| Total |
176,626 |
192,243 |
116,694 |
9,975 |
296 |
436 |
124 |
121 |
496,515 |
| Farwaniya |
Males |
3,439 |
91,740 |
86,517 |
899 |
227 |
143 |
17 |
11 |
182,993 |
| Females |
3,546 |
34,367 |
23,886 |
825 |
138 |
113 |
14 |
11 |
62,900 |
| Total |
6,985 |
126,107 |
110,403 |
1,724 |
365 |
256 |
31 |
22 |
245,893 |
| Surra – Park |
Males |
0 |
0 |
0 |
0 |
0 |
0 |
0 |
0 |
0 |
| Females |
0 |
0 |
0 |
0 |
0 |
0 |
0 |
0 |
0 |
| Total |
0 |
0 |
0 |
0 |
0 |
0 |
0 |
0 |
0 |
| Khitan |
Males |
6,853 |
61,447 |
44,933 |
224 |
116 |
109 |
22 |
7 |
113,711 |
| Females |
7,202 |
17,162 |
17,154 |
845 |
84 |
73 |
14 |
5 |
42,539 |
| Total |
14,055 |
78,609 |
62,087 |
1,069 |
200 |
182 |
36 |
12 |
156,250 |
| AlRaay |
Males |
0 |
1,585 |
4,624 |
5 |
3 |
3 |
0 |
0 |
6,220 |
| Females |
0 |
13 |
71 |
1 |
2 |
0 |
0 |
0 |
87 |
| Total |
0 |
1,598 |
4,695 |
6 |
5 |
3 |
0 |
0 |
6,307 |
| Omarya |
Males |
4,653 |
1,326 |
3,397 |
28 |
7 |
15 |
4 |
0 |
9,430 |
| Females |
5,104 |
1,036 |
2,795 |
453 |
10 |
11 |
3 |
0 |
9,412 |
| Total |
9,757 |
2,362 |
6,192 |
481 |
17 |
26 |
7 |
0 |
18,842 |
| Rabiya |
Males |
5,290 |
1,698 |
3,770 |
35 |
4 |
15 |
4 |
1 |
10,817 |
| Females |
5,832 |
1,370 |
2,558 |
384 |
6 |
10 |
0 |
4 |
10,164 |
| Total |
11,122 |
3,068 |
6,328 |
419 |
10 |
25 |
4 |
5 |
20,981 |
| Rihab |
Males |
5,642 |
517 |
2,400 |
33 |
0 |
9 |
0 |
2 |
8,603 |
| Females |
5,800 |
456 |
2,077 |
436 |
3 |
8 |
0 |
0 |
8,780 |
| Total |
11,442 |
973 |
4,477 |
469 |
3 |
17 |
0 |
2 |
17,383 |
| Jleeb Al -Shuyoukh |
Males |
2,795 |
74,432 |
170,183 |
470 |
33 |
28 |
33 |
18 |
247,992 |
| Females |
2,709 |
18,571 |
35,775 |
474 |
27 |
21 |
1 |
8 |
57,586 |
| Total |
5,504 |
93,003 |
205,958 |
944 |
60 |
49 |
34 |
26 |
305,578 |
| Reggae |
Males |
318 |
7,084 |
16,120 |
72 |
141 |
95 |
3 |
5 |
23,838 |
| Females |
398 |
3,803 |
8,040 |
142 |
67 |
81 |
2 |
2 |
12,535 |
| Total |
716 |
10,887 |
24,160 |
214 |
208 |
176 |
5 |
7 |
36,373 |
| Andalus |
Males |
11,731 |
5,083 |
7,461 |
76 |
34 |
82 |
18 |
13 |
24,498 |
| Females |
12,235 |
4,175 |
5,780 |
1,209 |
25 |
87 |
10 |
6 |
23,527 |
| Total |
23,966 |
9,258 |
13,241 |
1,285 |
59 |
169 |
28 |
19 |
48,025 |
| Ardiya |
Males |
16,838 |
3,466 |
8,539 |
112 |
14 |
36 |
5 |
0 |
29,010 |
| Females |
17,794 |
3,036 |
6,312 |
1,340 |
11 |
15 |
3 |
0 |
28,511 |
| Total |
34,632 |
6,502 |
14,851 |
1,452 |
25 |
51 |
8 |
0 |
57,521 |
| Sabah Alnasir |
Males |
12,554 |
2,129 |
6,318 |
63 |
9 |
13 |
7 |
1 |
21,094 |
| Females |
13,186 |
1,991 |
4,143 |
750 |
10 |
16 |
9 |
4 |
20,109 |
| Total |
25,740 |
4,120 |
10,461 |
813 |
19 |
29 |
16 |
5 |
41,203 |
| Ardiya(4) |
Males |
0 |
20 |
16 |
23 |
0 |
0 |
0 |
0 |
59 |
| Females |
0 |
10 |
1 |
10 |
1 |
0 |
0 |
0 |
22 |
| Total |
0 |
30 |
17 |
33 |
1 |
0 |
0 |
0 |
81 |
| Ishbiliya |
Males |
6,275 |
1,241 |
2,955 |
37 |
5 |
49 |
2 |
2 |
10,566 |
| Females |
6,547 |
1,206 |
2,474 |
402 |
4 |
45 |
4 |
0 |
10,682 |
| Total |
12,822 |
2,447 |
5,429 |
439 |
9 |
94 |
6 |
2 |
21,248 |
| Ardiya(6) |
Males |
0 |
82 |
483 |
0 |
0 |
1 |
0 |
0 |
566 |
| Females |
0 |
9 |
16 |
0 |
0 |
3 |
0 |
0 |
28 |
| Total |
0 |
91 |
499 |
0 |
0 |
4 |
0 |
0 |
594 |
| Fordus |
Males |
17,684 |
4,997 |
9,915 |
135 |
11 |
12 |
2 |
6 |
32,762 |
| Females |
19,420 |
4,307 |
6,130 |
1,277 |
16 |
10 |
9 |
6 |
31,175 |
| Total |
37,104 |
9,304 |
16,045 |
1,412 |
27 |
22 |
11 |
12 |
63,937 |
| Air Plan Noise Reg |
Males |
0 |
13 |
30 |
0 |
0 |
0 |
0 |
0 |
43 |
| Females |
0 |
2 |
3 |
0 |
0 |
0 |
0 |
0 |
5 |
| Total |
0 |
15 |
33 |
0 |
0 |
0 |
0 |
0 |
48 |
| International Airport |
Males |
0 |
19 |
197 |
0 |
0 |
0 |
0 |
0 |
216 |
| Females |
0 |
2 |
11 |
0 |
0 |
0 |
0 |
0 |
13 |
| Total |
0 |
21 |
208 |
0 |
0 |
0 |
0 |
0 |
229 |
| Al – Nahda |
Males |
2,313 |
222 |
882 |
8 |
2 |
0 |
0 |
0 |
3,427 |
| Females |
2,328 |
222 |
758 |
219 |
1 |
2 |
0 |
0 |
3,530 |
| Total |
4,641 |
444 |
1,640 |
227 |
3 |
2 |
0 |
0 |
6,957 |
| Abdulla Mubarak AlSabah |
Males |
15,252 |
2,088 |
6,190 |
83 |
27 |
58 |
5 |
9 |
23,712 |
| Females |
15,199 |
2,215 |
4,736 |
1,162 |
38 |
47 |
3 |
5 |
23,405 |
| Total |
30,451 |
4,303 |
10,926 |
1,245 |
65 |
105 |
8 |
14 |
47,117 |
| Ardiya craft |
Males |
0 |
6 |
3 |
0 |
0 |
0 |
0 |
0 |
9 |
| Females |
0 |
0 |
0 |
0 |
0 |
0 |
0 |
0 |
0 |
| Total |
0 |
6 |
3 |
0 |
0 |
0 |
0 |
0 |
9 |
| Total Al-Farwaniya Governorate |
Males |
111,637 |
259,195 |
374,933 |
2,303 |
633 |
668 |
122 |
75 |
749,566 |
| Females |
117,300 |
93,953 |
122,720 |
9,929 |
443 |
542 |
72 |
51 |
345,010 |
| Total |
228,937 |
353,148 |
497,653 |
12,232 |
1,076 |
1,210 |
194 |
126 |
1,094,576 |
| Mubarak Kabeer |
Males |
13,591 |
873 |
4,838 |
39 |
15 |
38 |
3 |
4 |
19,401 |
| Females |
13,134 |
924 |
4,635 |
1,060 |
30 |
31 |
1 |
0 |
19,815 |
| Total |
26,725 |
1,797 |
9,473 |
1,099 |
45 |
69 |
4 |
4 |
39,216 |
| Qurain |
Males |
10,481 |
648 |
4,104 |
25 |
16 |
6 |
8 |
1 |
15,289 |
| Females |
10,343 |
781 |
3,519 |
773 |
17 |
9 |
1 |
0 |
15,443 |
| Total |
20,824 |
1,429 |
7,623 |
798 |
33 |
15 |
9 |
1 |
30,732 |
| Al – Adan |
Males |
10,946 |
809 |
4,343 |
33 |
24 |
31 |
2 |
1 |
16,189 |
| Females |
10,913 |
946 |
3,964 |
862 |
25 |
39 |
4 |
0 |
16,753 |
| Total |
21,859 |
1,755 |
8,307 |
895 |
49 |
70 |
6 |
1 |
32,942 |
| Qosoor |
Males |
12,284 |
850 |
4,565 |
48 |
8 |
9 |
5 |
2 |
17,771 |
| Females |
12,381 |
944 |
4,138 |
931 |
5 |
16 |
8 |
2 |
18,425 |
| Total |
24,665 |
1,794 |
8,703 |
979 |
13 |
25 |
13 |
4 |
36,196 |
| Misila |
Males |
103 |
244 |
659 |
34 |
51 |
6 |
0 |
3 |
1,100 |
| Females |
124 |
102 |
331 |
43 |
39 |
7 |
2 |
0 |
648 |
| Total |
227 |
346 |
990 |
77 |
90 |
13 |
2 |
3 |
1,748 |
| AL-masayel |
Males |
33 |
1 |
17 |
0 |
0 |
0 |
0 |
0 |
51 |
| Females |
36 |
2 |
9 |
1 |
0 |
0 |
0 |
0 |
48 |
| Total |
69 |
3 |
26 |
1 |
0 |
0 |
0 |
0 |
99 |
| Subah Alsalim |
Males |
24,918 |
4,198 |
11,626 |
84 |
88 |
135 |
9 |
10 |
41,068 |
| Females |
26,847 |
3,578 |
9,981 |
1,823 |
106 |
99 |
11 |
11 |
42,456 |
| Total |
51,765 |
7,776 |
21,607 |
1,907 |
194 |
234 |
20 |
21 |
83,524 |
| Fanatees |
Males |
58 |
40 |
196 |
2 |
8 |
1 |
0 |
0 |
305 |
| Females |
53 |
16 |
84 |
19 |
6 |
2 |
0 |
0 |
180 |
| Total |
111 |
56 |
280 |
21 |
14 |
3 |
0 |
0 |
485 |
| Sabhan Ind |
Males |
0 |
1,191 |
4,063 |
1 |
1 |
0 |
0 |
0 |
5,256 |
| Females |
0 |
23 |
33 |
1 |
1 |
0 |
0 |
0 |
58 |
| Total |
0 |
1,214 |
4,096 |
2 |
2 |
0 |
0 |
0 |
5,314 |
| Abu – Fatira |
Males |
11 |
6 |
22 |
0 |
0 |
0 |
0 |
0 |
39 |
| Females |
11 |
1 |
2 |
0 |
0 |
0 |
0 |
0 |
14 |
| Total |
22 |
7 |
24 |
0 |
0 |
0 |
0 |
0 |
53 |
| Mid – Reg |
Males |
0 |
80 |
1,852 |
0 |
21 |
0 |
0 |
0 |
1,953 |
| Females |
0 |
16 |
16 |
1 |
113 |
0 |
0 |
0 |
146 |
| Total |
0 |
96 |
1,868 |
1 |
134 |
0 |
0 |
0 |
2,099 |
| West Abu Fateera Ind |
Males |
0 |
2 |
17 |
1 |
0 |
0 |
0 |
0 |
20 |
| Females |
0 |
0 |
0 |
0 |
0 |
0 |
0 |
0 |
0 |
| Total |
0 |
2 |
17 |
1 |
0 |
0 |
0 |
0 |
20 |
| Total Mubarak Al-Kabeer Governorate |
Males |
72,425 |
8,942 |
36,302 |
267 |
232 |
226 |
27 |
21 |
118,442 |
| Females |
73,842 |
7,333 |
26,712 |
5,514 |
342 |
203 |
27 |
13 |
113,986 |
| Total |
146,267 |
16,275 |
63,014 |
5,781 |
574 |
429 |
54 |
34 |
232,428 |
| Not Stated |
Males |
155 |
1,947 |
869 |
21 |
39 |
47 |
1 |
5 |
3,084 |
| Females |
151 |
1,565 |
348 |
36 |
27 |
47 |
2 |
3 |
2,179 |
| Total |
306 |
3,512 |
1,217 |
57 |
66 |
94 |
3 |
8 |
5,263 |
| Total |
Males |
626,256 |
743,393 |
1,081,193 |
8,092 |
8,111 |
12,684 |
847 |
959 |
2,481,535 |
| Females |
649,601 |
399,271 |
488,274 |
56,022 |
7,314 |
8,580 |
612 |
784 |
1,610,458 |
| Total |
1,275,857 |
1,142,664 |
1,569,467 |
64,114 |
15,425 |
21,264 |
1,459 |
1,743 |
4,091,993 |
Source: PACI
ANNEXED NOTE
1. Characteristics of data and definitions
The source of data used here is the Public Authority for Civil Information (PACI), an independant government body in charge of :
1- centralising all population and labour force data in order to manage a fully computerised population register
2- issuing mandatory civil identification cards to every resident of the country, regardless of age and nationality.
The other source of demographic and socioeconomic data on Kuwait is the Central Statistical Office (CSO), operating within the Planning Ministry. The CSO has conducted ten population and housing censuses since its inception in 1957.
Since 1995 a marked discrepancy was witnessed between PACI’ and CSO’ population figures. PACI’ database is connected electronically with other administrations and bodies registering demographic events and professional/ residency issues (births and death; departures and arrivals; end of service, residency and ID deliveries, etc.).
PACI’s records of residents’ movements is thus regularly updated, which limits the risk of population overcount. Therefore, it is more likely that residents were undercounted during CSO- Ministry of Planning’s census operations (see: Shah, N. Population of Kuwait. Structure and Dynamics, Kuwait: Kuwait University Academic Publication Council, 2010, chapter 1).
(a) Kuwaiti: the Kuwaiti nationality rests upon a document of Kuwaiti nationality or a certificate proving Kuwaiti nationality issued by the Ministry of Interior of Kuwait.
(b) Non-Kuwaiti: his/ her nationality is determined by the name of the State which issued the passport. The foreign national also entered Kuwait legally and has a stamp of residence.
This category includes the Bidoon, a category of stateless persons living in the Emirate. Kuwait’s Bidoon population originates from three broad categories:
1) those whose ancestors failed to apply for nationality or lacked necessary documentation at the time of Kuwait’s independence in 1961;
2) those recruited to work in Kuwait’s army or police force during the 1960s who permanently settled in Kuwait, along with their families;
3) children of Kuwaiti mothers and stateless or foreign fathers (see Human Rights Watch. Prisoners of the Past. Kuwaiti Bidun and the Burden of Statelessness, June 2011, p. 3).
(The children of Kuwaiti mothers and non-Kuwaiti fathers (with specific nationality) inherit the father’s nationality. They are stateless if the father is stateless).
(c) Nationality group: collected according to the nationality of the head of the household.
Nationalities are grouped according to specific features common to certain population subgroups: language, geographic origin, etc. or according to internationally recognized categories such as: (Arab / non-Arab Asian countries / non-Arab African countries; European countries … etc.).
2. Institution which provides data
The Public Authority for Civil Information (PACI)
3. Period of data coverage: 31 December 2014
The database is updated three times a year and the website presents only the most recent data.
4. Data availability
The statistics section of PACI’s website (http://www.paci.gov.kw/en/ (English); http://www.paci.gov.kw/ (Arabic)) provides population and socio-economic data broken down by nationality (Kuwaiti/ non-Kuwaiti). Some data are displayed by nationality groups.
Analytical tables and data crosstabulations are available for download in PDF, html, .png and Excel (.csv) formats.
The “publications” section also proposes a selection of data tables processed thematically in downloadable Excel and PDF format (English and Arabic):
http://www.paci.gov.kw/stat/en/index.php/component/content/article?id=99
http://www.paci.gov.kw/stat/index.php/component/content/article?id=194
The present data is in the “Population” file.
Date of access: May 2015
|
|
Kuwaitis |
|
|
Non-Kuwaitis |
|
Total |
|
|
Males |
Females |
Total |
Males |
Females |
Total |
Males |
Females |
Total |
| In the labour force |
224,489 |
197,836 |
422,325 |
1,552,436 |
481,837 |
2,034,273 |
1,776,925 |
679,673 |
2,456,598 |
| Out of the labour force |
156,166 |
222,121 |
378,287 |
80,495 |
282,259 |
362,754 |
236,661 |
504,380 |
741,041 |
| Not stated |
7,996 |
0 |
7,996 |
15,001 |
0 |
15,001 |
22,997 |
0 |
22,997 |
| Total |
388,651 |
419,957 |
808,608 |
1,647,932 |
764,096 |
2,412,028 |
2,036,583 |
1,184,053 |
3,220,636 |
Source: PACI
ANNEXED NOTE
1. Characteristics of data and definitions
The source of data used here is the Public Authority for Civil Information (PACI), an independant government body in charge of :
1- centralising all population and labour force data in order to manage a fully computerised population register
2- issuing mandatory civil identification cards to every resident of the country, regardless of age and nationality.
The other source of demographic and socioeconomic data on Kuwait is the Central Statistical Office (CSO), operating within the Planning Ministry. The CSO has conducted ten population and housing censuses since its inception in 1957.
(a) Kuwaiti: the Kuwaiti nationality rests upon a document of Kuwaiti nationality or a certificate proving Kuwaiti nationality issued by the Ministry of Interior of Kuwait.
(b) Non-Kuwaiti: his/ her nationality is determined by the name of the State having issued the passport. The foreign national also entered Kuwait legally and has a stamp of residence.
This category includes the Bidoon, a category of stateless persons living in the Emirate. Kuwait’s Bidoon population originates from three broad categories:
1) those whose ancestors failed to apply for nationality or lacked necessary documentation at the time of Kuwait’s independence in 1961;
2) those recruited to work in Kuwait’s army or police force during the 1960s who permanently settled in Kuwait, along with their families;
3) children of Kuwaiti mothers and stateless or foreign fathers (see Human Rights Watch. Prisoners of the Past. Kuwaiti Bidun and the Burden of Statelessness, June 2011, p. 3).
(c) Population in the labour force: population aged 15 years and above, included in the labour market, either employed (in the government or private sector, as itinerant worker, employed in the domestic sector), or unemployed.
(d) Population out of the labour force: population aged 15 years and above, not contributing to any economic activity and not included in the labour market, among which the students, the housewives, the retired persons or self-sufficients.
2. Institution which provides data
The Public Authority for Civil Information (PACI)
3. Period of data coverage: December 2014
The database is updated three times a year and the website presents only the most recent data.
4. Data availability
Analytical tables and data crosstabulations are available for download in PDF, html, .png and Excel (.csv) formats.
Date of access: May 2015
| Locality |
Kuwaiti |
Non-Kuwaiti |
Total |
| Male |
Female |
Total |
Male |
Female |
Total |
Male |
Female |
Total |
| Dasman |
205 |
257 |
462 |
1,313 |
425 |
1,738 |
1,518 |
682 |
2,200 |
| Sharq |
792 |
831 |
1,623 |
24,190 |
6,583 |
30,773 |
24,982 |
7,414 |
32,396 |
| Mirqab |
3 |
2 |
5 |
6,827 |
625 |
7,452 |
6,830 |
627 |
7,457 |
| Soor Gardens |
0 |
0 |
0 |
11 |
0 |
11 |
11 |
0 |
11 |
| Qibla |
40 |
34 |
74 |
13,793 |
3,207 |
17,000 |
13,833 |
3,241 |
17,074 |
| Coastal strip |
0 |
0 |
0 |
0 |
0 |
0 |
0 |
0 |
0 |
| Bneid Al – Gar |
444 |
464 |
908 |
28,212 |
5,255 |
33,467 |
28,656 |
5,719 |
34,375 |
| Dasma |
5,331 |
5,475 |
10,806 |
4,224 |
4,930 |
9,154 |
9,555 |
10,405 |
19,960 |
| Mansoriya |
2,447 |
2,567 |
5,014 |
1,869 |
2,179 |
4,048 |
4,316 |
4,746 |
9,062 |
| Abdalla-Alsalim |
5,446 |
5,601 |
11,047 |
5,091 |
5,555 |
10,646 |
10,537 |
11,156 |
21,693 |
| Shamiya |
4,505 |
4,776 |
9,281 |
4,029 |
4,341 |
8,370 |
8,534 |
9,117 |
17,651 |
| Diya |
4,658 |
4,857 |
9,515 |
5,211 |
5,281 |
10,492 |
9,869 |
10,138 |
20,007 |
| Qadisiya |
6,578 |
6,913 |
13,491 |
4,791 |
5,990 |
10,781 |
11,369 |
12,903 |
24,272 |
| Nuzha |
3,892 |
4,240 |
8,132 |
3,193 |
3,683 |
6,876 |
7,085 |
7,923 |
15,008 |
| Faiha |
6,140 |
6,615 |
12,755 |
4,946 |
5,658 |
10,604 |
11,086 |
12,273 |
23,359 |
| Kifan |
7,416 |
8,028 |
15,444 |
5,914 |
7,238 |
13,152 |
13,330 |
15,266 |
28,596 |
| Rawda |
10,662 |
11,476 |
22,138 |
6,755 |
9,085 |
15,840 |
17,417 |
20,561 |
37,978 |
| Idailiya |
5,815 |
6,198 |
12,013 |
4,312 |
5,097 |
9,409 |
10,127 |
11,295 |
21,422 |
| Khaldiya |
5,167 |
5,364 |
10,531 |
3,769 |
4,403 |
8,172 |
8,936 |
9,767 |
18,703 |
| Surra |
9,963 |
10,143 |
20,106 |
6,809 |
9,151 |
15,960 |
16,772 |
19,294 |
36,066 |
| Qurtuba |
8,982 |
9,298 |
18,280 |
5,760 |
7,645 |
13,405 |
14,742 |
16,943 |
31,685 |
| Al.yamouk |
6,494 |
6,784 |
13,278 |
5,693 |
5,867 |
11,560 |
12,187 |
12,651 |
24,838 |
| Shuwaikh |
1,001 |
1,053 |
2,054 |
2,128 |
1,454 |
3,582 |
3,129 |
2,507 |
5,636 |
| Shuwaikh – Ind |
33 |
35 |
68 |
8,029 |
972 |
9,001 |
8,062 |
1,007 |
9,069 |
| Garnada |
3,051 |
3,081 |
6,132 |
2,045 |
2,148 |
4,193 |
5,096 |
5,229 |
10,325 |
| Mubarakiya Comp |
0 |
0 |
0 |
2,064 |
9 |
2,073 |
2,064 |
9 |
2,073 |
| Health Reg |
42 |
80 |
122 |
157 |
606 |
763 |
199 |
686 |
885 |
| Sulaibekhat |
7,488 |
8,091 |
15,579 |
10,605 |
6,838 |
17,443 |
18,093 |
14,929 |
33,022 |
| Doha |
8,155 |
8,691 |
16,846 |
8,650 |
6,845 |
15,495 |
16,805 |
15,536 |
32,341 |
| Doha Port |
0 |
0 |
0 |
870 |
15 |
885 |
870 |
15 |
885 |
| Failakka Isl |
0 |
1 |
1 |
0 |
1 |
1 |
0 |
2 |
2 |
| Miskan Isl |
0 |
0 |
0 |
0 |
0 |
0 |
0 |
0 |
0 |
| Oha Isl |
0 |
0 |
0 |
0 |
0 |
0 |
0 |
0 |
0 |
| Kubar Isl |
0 |
0 |
0 |
0 |
0 |
0 |
0 |
0 |
0 |
| Qarowa Isl |
0 |
0 |
0 |
0 |
0 |
0 |
0 |
0 |
0 |
| Aum – Almaradim Isl |
0 |
0 |
0 |
0 |
0 |
0 |
0 |
0 |
0 |
| Aum – Alnamil Isl |
0 |
0 |
0 |
0 |
0 |
0 |
0 |
0 |
0 |
| Doha Resort |
0 |
0 |
0 |
2 |
0 |
2 |
2 |
0 |
2 |
| Free Zone |
0 |
0 |
0 |
0 |
0 |
0 |
0 |
0 |
0 |
| North-west of Sulaibekhat |
0 |
0 |
0 |
0 |
0 |
0 |
0 |
0 |
0 |
| Total Capital Governorate |
114,750 |
120,955 |
235,705 |
181,262 |
121,086 |
302,348 |
296,012 |
242,041 |
538,053 |
| Hawalli |
1,203 |
1,248 |
2,451 |
132,253 |
67,349 |
199,602 |
133,456 |
68,597 |
202,053 |
| Salmiya |
4,781 |
5,026 |
9,807 |
159,478 |
119,061 |
278,539 |
164,259 |
124,087 |
288,346 |
| Shaab |
3,186 |
3,353 |
6,539 |
4,796 |
5,231 |
10,027 |
7,982 |
8,584 |
16,566 |
| Rumaythiya |
17,338 |
17,795 |
35,133 |
10,372 |
13,566 |
23,938 |
27,710 |
31,361 |
59,071 |
| Salwa |
14,539 |
15,682 |
30,221 |
26,114 |
24,952 |
51,066 |
40,653 |
40,634 |
81,287 |
| Bedi |
71 |
66 |
137 |
661 |
334 |
995 |
732 |
400 |
1,132 |
| Mushaif |
12,523 |
12,488 |
25,011 |
6,301 |
9,334 |
15,635 |
18,824 |
21,822 |
40,646 |
| Mubarak Al-Abdel-Allah |
2,991 |
3,020 |
6,011 |
1,304 |
2,064 |
3,368 |
4,295 |
5,084 |
9,379 |
| Bayan |
14,675 |
15,154 |
29,829 |
7,733 |
10,253 |
17,986 |
22,408 |
25,407 |
47,815 |
| Mubarakiya |
0 |
0 |
0 |
0 |
0 |
0 |
0 |
0 |
0 |
| Jabriya |
11,602 |
11,949 |
23,551 |
25,805 |
26,976 |
52,781 |
37,407 |
38,925 |
76,332 |
| Wizarat area |
0 |
0 |
0 |
7 |
2 |
9 |
7 |
2 |
9 |
| Al-Shohadaa |
4,047 |
4,051 |
8,098 |
1,649 |
2,545 |
4,194 |
5,696 |
6,596 |
12,292 |
| Al-Zahraa |
7,351 |
7,681 |
15,032 |
3,080 |
4,651 |
7,731 |
10,431 |
12,332 |
22,763 |
| Hetteen |
5,676 |
5,711 |
11,387 |
2,167 |
3,538 |
5,705 |
7,843 |
9,249 |
17,092 |
| Al-Siddeek |
142 |
149 |
291 |
71 |
92 |
163 |
213 |
241 |
454 |
| Al-Salam |
7,365 |
7,396 |
14,761 |
3,093 |
4,851 |
7,944 |
10,458 |
12,247 |
22,705 |
| Anjafa |
26 |
22 |
48 |
253 |
158 |
411 |
279 |
180 |
459 |
| Total Hawalli Governorate |
107,516 |
110,791 |
218,307 |
385,137 |
294,957 |
680,094 |
492,653 |
405,748 |
898,401 |
| Ahmadi city |
5,701 |
5,963 |
11,664 |
12,703 |
6,356 |
19,059 |
18,404 |
12,319 |
30,723 |
| Fahaheel |
9,772 |
10,083 |
19,855 |
59,066 |
17,715 |
76,781 |
68,838 |
27,798 |
96,636 |
| Sabahiya |
22,184 |
23,924 |
46,108 |
20,184 |
13,366 |
33,550 |
42,368 |
37,290 |
79,658 |
| South – Sabahiya |
1 |
0 |
1 |
4 |
1 |
5 |
5 |
1 |
6 |
| Rikka |
15,268 |
16,332 |
31,600 |
11,188 |
7,853 |
19,041 |
26,456 |
24,185 |
50,641 |
| Hadiya |
7,781 |
7,488 |
15,269 |
4,135 |
4,032 |
8,167 |
11,916 |
11,520 |
23,436 |
| Fintas |
3,794 |
3,875 |
7,669 |
19,664 |
11,561 |
31,225 |
23,458 |
15,436 |
38,894 |
| Jaber Al-Ali |
16,513 |
16,175 |
32,688 |
7,963 |
6,423 |
14,386 |
24,476 |
22,598 |
47,074 |
| Auqqila |
2,571 |
2,636 |
5,207 |
1,733 |
1,676 |
3,409 |
4,304 |
4,312 |
8,616 |
| Abu- Alhasniya |
134 |
135 |
269 |
354 |
222 |
576 |
488 |
357 |
845 |
| Mahbula |
1,470 |
1,621 |
3,091 |
98,859 |
18,903 |
117,762 |
100,329 |
20,524 |
120,853 |
| Al- Adami |
0 |
0 |
0 |
0 |
0 |
0 |
0 |
0 |
0 |
| Abu-Halifa |
2,094 |
2,084 |
4,178 |
28,668 |
16,055 |
44,723 |
30,762 |
18,139 |
48,901 |
| Munkaf |
7,997 |
8,118 |
16,115 |
77,647 |
28,115 |
105,762 |
85,644 |
36,233 |
121,877 |
| Thaher |
13,058 |
13,441 |
26,499 |
8,024 |
5,760 |
13,784 |
21,082 |
19,201 |
40,283 |
| Shuaiba |
0 |
0 |
0 |
1,061 |
14 |
1,075 |
1,061 |
14 |
1,075 |
| Shuaiba-ind W |
0 |
0 |
0 |
25,435 |
114 |
25,549 |
25,435 |
114 |
25,549 |
| Abdulla -Port |
0 |
0 |
0 |
1,937 |
4 |
1,941 |
1,937 |
4 |
1,941 |
| Abdulla Port-Resort |
0 |
0 |
0 |
859 |
23 |
882 |
859 |
23 |
882 |
| Nwaiseeb resort |
0 |
0 |
0 |
1 |
0 |
1 |
1 |
0 |
1 |
| Al-Kayron resorts |
0 |
0 |
0 |
1,984 |
84 |
2,068 |
1,984 |
84 |
2,068 |
| Zoor Resort |
0 |
0 |
0 |
6 |
6 |
12 |
6 |
6 |
12 |
| Jlaiaa Resort |
0 |
0 |
0 |
250 |
24 |
274 |
250 |
24 |
274 |
| Bedier Resort |
0 |
0 |
0 |
16 |
3 |
19 |
16 |
3 |
19 |
| Dubaeeiya Resort |
0 |
0 |
0 |
17 |
6 |
23 |
17 |
6 |
23 |
| Zoor |
0 |
1 |
1 |
1,981 |
1,021 |
3,002 |
1,981 |
1,022 |
3,003 |
| Nwaiseeb |
0 |
0 |
0 |
0 |
0 |
0 |
0 |
0 |
0 |
| Sbainhiya |
0 |
0 |
0 |
0 |
0 |
0 |
0 |
0 |
0 |
| Wafra |
1 |
0 |
1 |
50 |
50 |
100 |
51 |
50 |
101 |
| New Wafra |
70 |
61 |
131 |
887 |
411 |
1,298 |
957 |
472 |
1,429 |
| Wafra -Agriculture |
1 |
0 |
1 |
9,608 |
158 |
9,766 |
9,609 |
158 |
9,767 |
| Wara |
0 |
0 |
0 |
1 |
0 |
1 |
1 |
0 |
1 |
| Muqwaa |
0 |
0 |
0 |
173 |
0 |
173 |
173 |
0 |
173 |
| Ahmadi- Desert |
0 |
0 |
0 |
259 |
22 |
281 |
259 |
22 |
281 |
| Gawakheer-South |
0 |
0 |
0 |
40 |
0 |
40 |
40 |
0 |
40 |
| Fahd Al – Ahmad |
7,391 |
7,294 |
14,685 |
3,091 |
2,494 |
5,585 |
10,482 |
9,788 |
20,270 |
| Ali Sabah Alsalem |
17,760 |
16,908 |
34,668 |
9,999 |
6,650 |
16,649 |
27,759 |
23,558 |
51,317 |
| Rajm Khashman |
0 |
0 |
0 |
49 |
0 |
49 |
49 |
0 |
49 |
| Sabah Al-Ahmad C |
1 |
1 |
2 |
23 |
3 |
26 |
24 |
4 |
28 |
| sabah al- ahmad ( 1 ) |
0 |
0 |
0 |
0 |
0 |
0 |
0 |
0 |
0 |
| sabah al- ahmad (2 ) |
0 |
0 |
0 |
0 |
0 |
0 |
0 |
0 |
0 |
| sabah al- ahmad ( 3 ) |
3 |
4 |
7 |
3 |
0 |
3 |
6 |
4 |
10 |
| sabah al- ahmad (4 ) |
0 |
0 |
0 |
0 |
0 |
0 |
0 |
0 |
0 |
| sabah al- ahmad (5 ) |
0 |
0 |
0 |
0 |
0 |
0 |
0 |
0 |
0 |
| Kabad – Agriculture |
0 |
0 |
0 |
1 |
0 |
1 |
1 |
0 |
1 |
| Al-Kayron residential |
0 |
0 |
0 |
0 |
0 |
0 |
0 |
0 |
0 |
| Total Al-Ahmadi Governorate |
133,565 |
136,144 |
269,709 |
407,923 |
149,125 |
557,048 |
541,488 |
285,269 |
826,757 |
| Jahra |
4,437 |
4,591 |
9,028 |
33,201 |
17,023 |
50,224 |
37,638 |
21,614 |
59,252 |
| Al-Kasser |
11,819 |
12,836 |
24,655 |
20,398 |
13,005 |
33,403 |
32,217 |
25,841 |
58,058 |
| Al -Naim |
4,547 |
4,397 |
8,944 |
3,455 |
3,079 |
6,534 |
8,002 |
7,476 |
15,478 |
| Al -Naseem |
6,768 |
6,777 |
13,545 |
5,285 |
4,228 |
9,513 |
12,053 |
11,005 |
23,058 |
| Taimaa |
1,035 |
2,057 |
3,092 |
30,354 |
28,796 |
59,150 |
31,389 |
30,853 |
62,242 |
| Waha |
10,023 |
10,739 |
20,762 |
11,058 |
8,719 |
19,777 |
21,081 |
19,458 |
40,539 |
| Al -Auyon |
11,499 |
11,785 |
23,284 |
10,401 |
7,997 |
18,398 |
21,900 |
19,782 |
41,682 |
| Sekrab -Reg |
0 |
0 |
0 |
156 |
0 |
156 |
156 |
0 |
156 |
| Jahraa Ind |
0 |
0 |
0 |
811 |
22 |
833 |
811 |
22 |
833 |
| Sulaibiya -Shabiya |
1,195 |
2,903 |
4,098 |
27,170 |
25,252 |
52,422 |
28,365 |
28,155 |
56,520 |
| Sulaibiya – Ind (1) |
0 |
0 |
0 |
1,418 |
22 |
1,440 |
1,418 |
22 |
1,440 |
| Sulaibiya – Ind (2) |
0 |
0 |
0 |
3,489 |
61 |
3,550 |
3,489 |
61 |
3,550 |
| Sulaibiya – Ind (3) |
0 |
0 |
0 |
6 |
0 |
6 |
6 |
0 |
6 |
| Sulaibiya – Agriculture |
0 |
0 |
0 |
3,365 |
115 |
3,480 |
3,365 |
115 |
3,480 |
| Abdelli |
0 |
0 |
0 |
8,237 |
81 |
8,318 |
8,237 |
81 |
8,318 |
| Amgara – Ind |
0 |
0 |
0 |
12,119 |
80 |
12,199 |
12,119 |
80 |
12,199 |
| Mitlaa |
0 |
0 |
0 |
15 |
12 |
27 |
15 |
12 |
27 |
| Kathma |
0 |
0 |
0 |
100 |
0 |
100 |
100 |
0 |
100 |
| Al – Rawadatain |
0 |
0 |
0 |
88 |
4 |
92 |
88 |
4 |
92 |
| Aum – Al -Ash |
0 |
0 |
0 |
26 |
0 |
26 |
26 |
0 |
26 |
| Al – Salmi |
0 |
0 |
0 |
599 |
13 |
612 |
599 |
13 |
612 |
| Kabad |
0 |
0 |
0 |
406 |
10 |
416 |
406 |
10 |
416 |
| Shegaya |
0 |
0 |
0 |
0 |
0 |
0 |
0 |
0 |
0 |
| Al – Sebiya |
0 |
0 |
0 |
36 |
2 |
38 |
36 |
2 |
38 |
| Jahra – Camp |
0 |
0 |
0 |
84 |
0 |
84 |
84 |
0 |
84 |
| Al – Atraaf |
0 |
0 |
0 |
0 |
0 |
0 |
0 |
0 |
0 |
| Warba Isl |
0 |
0 |
0 |
0 |
0 |
0 |
0 |
0 |
0 |
| Bubyan Isl |
0 |
0 |
0 |
0 |
0 |
0 |
0 |
0 |
0 |
| Jahara – Desert |
0 |
0 |
0 |
1,696 |
15 |
1,711 |
1,696 |
15 |
1,711 |
| Saad Al – Abdulla city |
27,330 |
26,913 |
54,243 |
15,938 |
13,301 |
29,239 |
43,268 |
40,214 |
83,482 |
| Qayrawan |
5,613 |
5,459 |
11,072 |
3,075 |
3,075 |
6,150 |
8,688 |
8,534 |
17,222 |
| Jahraa – Gawakheer |
0 |
0 |
0 |
3 |
0 |
3 |
3 |
0 |
3 |
| Kazma Resort |
0 |
0 |
0 |
0 |
0 |
0 |
0 |
0 |
0 |
| AlSubbiya Resort |
0 |
0 |
0 |
0 |
0 |
0 |
0 |
0 |
0 |
| Al – Behaith |
0 |
0 |
0 |
0 |
0 |
0 |
0 |
0 |
0 |
| Northwest Jahra |
0 |
0 |
0 |
85 |
10 |
95 |
85 |
10 |
95 |
| Jaber al-Ahmad |
1,942 |
1,961 |
3,903 |
1,002 |
885 |
1,887 |
2,944 |
2,846 |
5,790 |
| Neayem |
0 |
0 |
0 |
6 |
0 |
6 |
6 |
0 |
6 |
| Total Al-Jahra Governorate |
86,208 |
90,418 |
176,626 |
194,082 |
125,807 |
319,889 |
280,290 |
216,225 |
496,515 |
| Farwaniya |
3,439 |
3,546 |
6,985 |
179,554 |
59,354 |
238,908 |
182,993 |
62,900 |
245,893 |
| Surra – Park |
0 |
0 |
0 |
0 |
0 |
0 |
0 |
0 |
0 |
| Khitan |
6,853 |
7,202 |
14,055 |
106,858 |
35,337 |
142,195 |
113,711 |
42,539 |
156,250 |
| AlRaay |
0 |
0 |
0 |
6,220 |
87 |
6,307 |
6,220 |
87 |
6,307 |
| Omarya |
4,653 |
5,104 |
9,757 |
4,777 |
4,308 |
9,085 |
9,430 |
9,412 |
18,842 |
| Rabiya |
5,290 |
5,832 |
11,122 |
5,527 |
4,332 |
9,859 |
10,817 |
10,164 |
20,981 |
| Rihab |
5,642 |
5,800 |
11,442 |
2,961 |
2,980 |
5,941 |
8,603 |
8,780 |
17,383 |
| Jleeb Al – Shuyoukh |
2,795 |
2,709 |
5,504 |
245,197 |
54,877 |
300,074 |
247,992 |
57,586 |
305,578 |
| Reggae |
318 |
398 |
716 |
23,520 |
12,137 |
35,657 |
23,838 |
12,535 |
36,373 |
| Andalus |
11,731 |
12,235 |
23,966 |
12,767 |
11,292 |
24,059 |
24,498 |
23,527 |
48,025 |
| Ardiya |
16,838 |
17,794 |
34,632 |
12,172 |
10,717 |
22,889 |
29,010 |
28,511 |
57,521 |
| Sabah Alnasir |
12,554 |
13,186 |
25,740 |
8,540 |
6,923 |
15,463 |
21,094 |
20,109 |
41,203 |
| Ardiya(4) |
0 |
0 |
0 |
59 |
22 |
81 |
59 |
22 |
81 |
| Ishbiliya |
6,275 |
6,547 |
12,822 |
4,291 |
4,135 |
8,426 |
10,566 |
10,682 |
21,248 |
| Ardiya(6) |
0 |
0 |
0 |
566 |
28 |
594 |
566 |
28 |
594 |
| Fordus |
17,684 |
19,420 |
37,104 |
15,078 |
11,755 |
26,833 |
32,762 |
31,175 |
63,937 |
| Air Plan Noise Reg |
0 |
0 |
0 |
43 |
5 |
48 |
43 |
5 |
48 |
| International Air Port |
0 |
0 |
0 |
216 |
13 |
229 |
216 |
13 |
229 |
| Al – Nahda |
2,313 |
2,328 |
4,641 |
1,114 |
1,202 |
2,316 |
3,427 |
3,530 |
6,957 |
| Abdulla Mubarak AlSabah |
15,252 |
15,199 |
30,451 |
8,460 |
8,206 |
16,666 |
23,712 |
23,405 |
47,117 |
| Ardiya craft |
0 |
0 |
0 |
9 |
0 |
9 |
9 |
0 |
9 |
| Total Al-Farwaniya Governorate |
111,637 |
117,300 |
228,937 |
637,929 |
227,710 |
865,639 |
749,566 |
345,010 |
1,094,576 |
| Mubarak Kabeer |
13,591 |
13,134 |
26,725 |
5,810 |
6,681 |
12,491 |
19,401 |
19,815 |
39,216 |
| Qurain |
10,481 |
10,343 |
20,824 |
4,808 |
5,100 |
9,908 |
15,289 |
15,443 |
30,732 |
| Al-Adan |
10,946 |
10,913 |
21,859 |
5,243 |
5,840 |
11,083 |
16,189 |
16,753 |
32,942 |
| Qosoor |
12,284 |
12,381 |
24,665 |
5,487 |
6,044 |
11,531 |
17,771 |
18,425 |
36,196 |
| Misila |
103 |
124 |
227 |
997 |
524 |
1,521 |
1,100 |
648 |
1,748 |
| Al-Masayel |
33 |
36 |
69 |
18 |
12 |
30 |
51 |
48 |
99 |
| Subah Alsalim |
24,918 |
26,847 |
51,765 |
16,150 |
15,609 |
31,759 |
41,068 |
42,456 |
83,524 |
| Fanatees |
58 |
53 |
111 |
247 |
127 |
374 |
305 |
180 |
485 |
| Sabhan Ind |
0 |
0 |
0 |
5,256 |
58 |
5,314 |
5,256 |
58 |
5,314 |
| Abu – Fatira |
11 |
11 |
22 |
28 |
3 |
31 |
39 |
14 |
53 |
| Mid – Reg |
0 |
0 |
0 |
1,953 |
146 |
2,099 |
1,953 |
146 |
2,099 |
| West Abu Fateera Ind |
0 |
0 |
0 |
20 |
0 |
20 |
20 |
0 |
20 |
| Total Mubarak Al-Kabeer Governorate |
72,425 |
73,842 |
146,267 |
46,017 |
40,144 |
86,161 |
118,442 |
113,986 |
232,428 |
| Not Stated |
155 |
151 |
306 |
2,929 |
2,028 |
4,957 |
3,084 |
2,179 |
5,263 |
| Total |
626,256 |
649,601 |
1,275,857 |
1,855,279 |
960,857 |
2,816,136 |
2,481,535 |
1,610,458 |
4,091,993 |
Source: PACI
ANNEXED NOTE
1. Characteristics of data and definitions
The source of data used here is the Public Authority for Civil Information (PACI), an independant government body in charge of :
1- centralising all population and labour force data in order to manage a fully computerised population register
2- issuing mandatory civil identification cards to every resident of the country, regardless of age and nationality.
The other source of demographic and socioeconomic data on Kuwait is the Central Statistical Office (CSO), operating within the Planning Ministry. The CSO has conducted ten population and housing censuses since its inception in 1957.
Since 1995 a marked discrepancy was witnessed between PACI’ and CSO’ population figures. PACI’ database is connected electronically with other administrations and bodies registering demographic events and professional/ residency issues (births and death; departures and arrivals; end of service, residency and ID deliveries, etc.).
PACI’s records of residents’ movements is thus regularly updated, which limits the risk of population overcount. Therefore, it is more likely that residents were undercounted during CSO- Ministry of Planning’s census operations (see: Shah, N. Population of Kuwait. Structure and Dynamics, Kuwait: Kuwait University Academic Publication Council, 2010, chapter 1).
(a) Kuwaiti: the Kuwaiti nationality rests upon a document of Kuwaiti nationality or a certificate proving Kuwaiti nationality issued by the Ministry of Interior of Kuwait.
(b) Non-Kuwaiti: his/ her nationality is determined by the name of the State which issued the passport. The foreign national also entered Kuwait legally and has a stamp of residence.
This category includes the Bidoon, a category of stateless persons living in the Emirate. Kuwait’s Bidoon population originates from three broad categories:
1) those whose ancestors failed to apply for nationality or lacked necessary documentation at the time of Kuwait’s independence in 1961;
2) those recruited to work in Kuwait’s army or police force during the 1960s who permanently settled in Kuwait, along with their families;
3) children of Kuwaiti mothers and stateless or foreign fathers (see Human Rights Watch. Prisoners of the Past. Kuwaiti Bidun and the Burden of Statelessness, June 2011, p. 3).
(The children of Kuwaiti mothers and non-Kuwaiti fathers (with specific nationality) inherit the father’s nationality. They are stateless if the father is stateless).
(c) Nationality group: collected according to the nationality of the head of the household.
Nationalities are grouped according to specific features common to certain population subgroups: language, geographic origin, etc. or according to internationally recognized categories such as: (Arab / non-Arab Asian countries / non-Arab African countries; European countries … etc.).
2. Institution which provides data
The Public Authority for Civil Information (PACI)
3. Period of data coverage: 31 December 2014
The database is updated three times a year and the website presents only the most recent data.
4. Data availability
The statistics section of PACI’s website (http://www.paci.gov.kw/en/ (English); http://www.paci.gov.kw/ (Arabic)) provides population and socio-economic data broken down by nationality (Kuwaiti/ non-Kuwaiti). Some data are displayed by nationality groups.
Analytical tables and data crosstabulations are available for download in PDF, html, .png and Excel (.csv) formats.
The “publications” section also proposes a selection of data tables processed thematically in downloadable Excel and PDF format (English and Arabic):
http://www.paci.gov.kw/stat/en/index.php/component/content/article?id=99
http://www.paci.gov.kw/stat/index.php/component/content/article?id=194
The present data is in the “Population” file.
Date of access: May 2015
| Governorate |
Kuwaiti |
Non-Kuwaiti |
Total |
| Male |
Female |
Total |
Male |
Female |
Total |
Male |
Female |
Total |
| Capital Governorate |
114,750 |
120,955 |
235,705 |
181,262 |
121,086 |
302,348 |
296,012 |
242,041 |
538,053 |
| Hawalli Governorate |
107,516 |
110,791 |
218,307 |
385,137 |
294,957 |
680,094 |
492,653 |
405,748 |
898,401 |
| Al-Ahmadi Governorate |
133,565 |
136,144 |
269,709 |
407,923 |
149,125 |
557,048 |
541,488 |
285,269 |
826,757 |
| Al-Jahra Governorate |
86,208 |
90,418 |
176,626 |
194,082 |
125,807 |
319,889 |
280,290 |
216,225 |
496,515 |
| Al-Farwaniya Governorate |
111,637 |
117,300 |
228,937 |
637,929 |
227,710 |
865,639 |
749,566 |
345,010 |
1,094,576 |
| Mubarak Al-Kabeer Governorate |
72,425 |
73,842 |
146,267 |
46,017 |
40,144 |
86,161 |
118,442 |
113,986 |
232,428 |
| Not stated |
155 |
151 |
306 |
2,929 |
2,028 |
4,957 |
3,084 |
2,179 |
5,263 |
| Total |
626,256 |
649,601 |
1,275,857 |
1,855,279 |
960,857 |
2,816,136 |
2,481,535 |
1,610,458 |
4,091,993 |
Source: PACI
ANNEXED NOTE
1. Characteristics of data and definitions
The source of data used here is the Public Authority for Civil Information (PACI), an independant government body in charge of :
1- centralising all population and labour force data in order to manage a fully computerised population register
2- issuing mandatory civil identification cards to every resident of the country, regardless of age and nationality.
The other source of demographic and socioeconomic data on Kuwait is the Central Statistical Office (CSO), operating within the Planning Ministry. The CSO has conducted ten population and housing censuses since its inception in 1957.
(a) Kuwaiti: the Kuwaiti nationality rests upon a document of Kuwaiti nationality or a certificate proving Kuwaiti nationality issued by the Ministry of Interior of Kuwait.
(b) Non-Kuwaiti: his/ her nationality is determined by the name of the State having issued the passport. The foreign national also entered Kuwait legally and has a stamp of residence.
This category includes the Bidoon, a category of stateless persons living in the Emirate. Kuwait’s Bidoon population originates from three broad categories:
1) those whose ancestors failed to apply for nationality or lacked necessary documentation at the time of Kuwait’s independence in 1961;
2) those recruited to work in Kuwait’s army or police force during the 1960s who permanently settled in Kuwait, along with their families;
3) children of Kuwaiti mothers and stateless or foreign fathers (see Human Rights Watch. Prisoners of the Past. Kuwaiti Bidun and the Burden of Statelessness, June 2011, p. 3).
(c) Population in the labour force: population aged 15 years and above, included in the labour market, either employed (in the government or private sector, as itinerant worker, employed in the domestic sector), or unemployed.
(d) Population out of the labour force: population aged 15 years and above, not contributing to any economic activity and not included in the labour market, among which the students, the housewives, the retired persons or self-sufficients.
2. Institution which provides data
The Public Authority for Civil Information (PACI)
3. Period of data coverage: December 2014
The database is updated three times a year and the website presents only the most recent data.
4. Data availability
Analytical tables and data crosstabulations are available for download in PDF, html, .png and Excel (.csv) formats.
Date of access: May 2015
|
Arabs |
Asians |
Africans |
Europeans |
N. Americans |
S. Americans |
Australians / Oceanians |
Total |
|
Males |
Females |
Total |
Males |
Females |
Total |
Males |
Females |
Total |
Males |
Females |
Total |
Males |
Females |
Total |
Males |
Females |
Total |
Males |
Females |
Total |
Males |
Females |
Total |
| Less than 5 |
43,091 |
41,286 |
84,377 |
18,641 |
17,427 |
36,068 |
206 |
189 |
395 |
378 |
355 |
733 |
670 |
614 |
1,284 |
44 |
39 |
83 |
67 |
56 |
123 |
63,097 |
59,966 |
123,063 |
| 5-9 |
32,889 |
31,776 |
64,665 |
12,659 |
12,362 |
25,021 |
98 |
95 |
193 |
284 |
263 |
547 |
453 |
444 |
897 |
36 |
40 |
76 |
52 |
53 |
105 |
46,471 |
45,033 |
91,504 |
| 10-14 |
22,052 |
21,156 |
43,208 |
6,468 |
6,057 |
12,525 |
28 |
36 |
64 |
135 |
117 |
252 |
259 |
217 |
476 |
31 |
19 |
50 |
29 |
22 |
51 |
29,002 |
27,624 |
56,626 |
| 15-19 |
21,254 |
20,837 |
42,091 |
4,557 |
4,238 |
8,795 |
33 |
28 |
61 |
86 |
98 |
184 |
196 |
191 |
387 |
38 |
22 |
60 |
33 |
23 |
56 |
26,197 |
25,437 |
51,634 |
| 20-24 |
15,997 |
15,382 |
31,379 |
1,458 |
1,512 |
2,970 |
27 |
43 |
70 |
63 |
69 |
132 |
171 |
182 |
353 |
35 |
37 |
72 |
33 |
22 |
55 |
17,784 |
17,247 |
35,031 |
| 25-29 |
19,410 |
18,642 |
38,052 |
1,949 |
2,056 |
4,005 |
33 |
95 |
128 |
63 |
107 |
170 |
215 |
234 |
449 |
51 |
30 |
81 |
28 |
31 |
59 |
21,749 |
21,195 |
42,944 |
| 30-34 |
17,191 |
14,715 |
31,906 |
2,248 |
1,608 |
3,856 |
33 |
45 |
78 |
88 |
60 |
148 |
175 |
141 |
316 |
22 |
23 |
45 |
23 |
27 |
50 |
19,780 |
16,619 |
36,399 |
| 35-39 |
12,354 |
9,475 |
21,829 |
2,215 |
1,110 |
3,325 |
13 |
24 |
37 |
85 |
53 |
138 |
115 |
90 |
205 |
12 |
6 |
18 |
23 |
15 |
38 |
14,817 |
10,773 |
25,590 |
| 40-44 |
8,489 |
6,410 |
14,899 |
1,490 |
739 |
2,229 |
15 |
11 |
26 |
92 |
29 |
121 |
115 |
77 |
192 |
22 |
3 |
25 |
12 |
13 |
25 |
10,235 |
7,282 |
17,517 |
| 45-49 |
6,555 |
4,702 |
11,257 |
1,081 |
530 |
1,611 |
13 |
7 |
20 |
68 |
21 |
89 |
170 |
69 |
239 |
23 |
5 |
28 |
26 |
17 |
43 |
7,936 |
5,351 |
13,287 |
| > 50 |
7,661 |
3,499 |
11,160 |
1,084 |
439 |
1,523 |
20 |
4 |
24 |
66 |
23 |
89 |
255 |
76 |
331 |
43 |
8 |
51 |
37 |
13 |
50 |
9,166 |
4,062 |
13,228 |
| Total |
206,943 |
187,880 |
394,823 |
53,850 |
48,078 |
101,928 |
519 |
577 |
1,096 |
1,408 |
1,195 |
2,603 |
2,794 |
2,335 |
5,129 |
357 |
232 |
589 |
363 |
292 |
655 |
266,234 |
240,589 |
506,823 |
Source: PACI
ANNEXED NOTE
1. Characteristics of data and definitions
The source of data used here is the Public Authority for Civil Information (PACI), an independant government body in charge of :
1- centralising all population and labour force data in order to manage a fully computerised population register
2- issuing mandatory civil identification cards to every resident of the country, regardless of age and nationality.
The other source of demographic and socioeconomic data on Kuwait is the Central Statistical Office (CSO), operating within the Planning Ministry. The CSO has conducted ten population and housing censuses since its inception in 1957.
Since 1995 a marked discrepancy was witnessed between PACI’ and CSO’ population figures. PACI’ database is connected electronically with other administrations and bodies registering demographic events and professional/ residency issues (births and death; departures and arrivals; end of service, residency and ID deliveries, etc.).
PACI’s records of residents’ movements is thus regularly updated, which limits the risk of population overcount. Therefore, it is more likely that residents were undercounted during CSO- Ministry of Planning’s census operations (see: Shah, N. Population of Kuwait. Structure and Dynamics, Kuwait: Kuwait University Academic Publication Council, 2010, chapter 1).
(a) Kuwaiti: the Kuwaiti nationality rests upon a document of Kuwaiti nationality or a certificate proving Kuwaiti nationality issued by the Ministry of Interior of Kuwait.
(b) Non-Kuwaiti: his/ her nationality is determined by the name of the State which issued the passport. The foreign national also entered Kuwait legally and has a stamp of residence.
This category includes the Bidoon, a category of stateless persons living in the Emirate. Kuwait’s Bidoon population originates from three broad categories:
1) those whose ancestors failed to apply for nationality or lacked necessary documentation at the time of Kuwait’s independence in 1961;
2) those recruited to work in Kuwait’s army or police force during the 1960s who permanently settled in Kuwait, along with their families;
3) children of Kuwaiti mothers and stateless or foreign fathers (see Human Rights Watch. Prisoners of the Past. Kuwaiti Bidun and the Burden of Statelessness, June 2011, p. 3).
(The children of Kuwaiti mothers and non-Kuwaiti fathers (with specific nationality) inherit the father’s nationality. They are stateless if the father is stateless).
(c) Nationality group: collected according to the nationality of the head of the household.
Nationalities are grouped according to specific features common to certain population subgroups: language, geographic origin, etc. or according to internationally recognized categories such as: (Arab / non-Arab Asian countries / non-Arab African countries; European countries … etc.).
2. Institution which provides data
The Public Authority for Civil Information (PACI)
3. Period of data coverage: 31 December 2014
The database is updated three times a year and the website presents only the most recent data.
4. Data availability
The statistics section of PACI’s website (http://www.paci.gov.kw/en/ (English); http://www.paci.gov.kw/ (Arabic)) provides population and socio-economic data broken down by nationality (Kuwaiti/ non-Kuwaiti). Some data are displayed by nationality groups.
Analytical tables and data crosstabulations are available for download in PDF, html, .png and Excel (.csv) formats.
The “publications” section also proposes a selection of data tables processed thematically in downloadable Excel and PDF format (English and Arabic):
http://www.paci.gov.kw/stat/en/index.php/component/content/article?id=99
http://www.paci.gov.kw/stat/index.php/component/content/article?id=194
The present data is in the “Population” file.
Date of access: May 2015
|
|
Student |
Housekeeper |
Retired/ with means |
Total |
|
|
| |
males |
97,334 |
0 |
54,216 |
151,550 |
| Kuwaitis |
females |
114,837 |
69,672 |
29,317 |
213,826 |
| |
total |
212,171 |
69,672 |
83,533 |
365,376 |
| |
males |
77,949 |
0 |
749 |
78,698 |
| Non-Kuwaitis |
females |
83,111 |
192,659 |
41 |
275,811 |
| |
total |
161,060 |
192,659 |
790 |
354,509 |
| |
males |
175,283 |
0 |
54,965 |
230,248 |
| TOTAL |
females |
197,948 |
262,331 |
29,358 |
489,637 |
| |
total |
373,231 |
262,331 |
84,323 |
719,885 |
Source: PACI
ANNEXED NOTE
1. Characteristics of data and definitions
The source of data used here is the Public Authority for Civil Information (PACI), an independant government body in charge of :
1- centralising all population and labour force data in order to manage a fully computerised population register
2- issuing mandatory civil identification cards to every resident of the country, regardless of age and nationality.
The other source of demographic and socioeconomic data on Kuwait is the Central Statistical Office (CSO), operating within the Planning Ministry. The CSO has conducted ten population and housing censuses since its inception in 1957.
(a) Kuwaiti: the Kuwaiti nationality rests upon a document of Kuwaiti nationality or a certificate proving Kuwaiti nationality issued by the Ministry of Interior of Kuwait.
(b) Non-Kuwaiti: his/ her nationality is determined by the name of the State having issued the passport. The foreign national also entered Kuwait legally and has a stamp of residence.
This category includes the Bidoon, a category of stateless persons living in the Emirate. Kuwait’s Bidoon population originates from three broad categories:
1) those whose ancestors failed to apply for nationality or lacked necessary documentation at the time of Kuwait’s independence in 1961;
2) those recruited to work in Kuwait’s army or police force during the 1960s who permanently settled in Kuwait, along with their families;
3) children of Kuwaiti mothers and stateless or foreign fathers (see Human Rights Watch. Prisoners of the Past. Kuwaiti Bidun and the Burden of Statelessness, June 2011, p. 3).
(c) Population in the labour force: population aged 15 years and above, included in the labour market, either employed (in the government or private sector, as itinerant worker, employed in the domestic sector), or unemployed.
(d) Population out of the labour force: population aged 15 years and above, not contributing to any economic activity and not included in the labour market, among which the students, the housewives, the retired persons or self-sufficients.
2. Institution which provides data
The Public Authority for Civil Information (PACI)
3. Period of data coverage: December 2013
The database is updated three times a year and the website presents only the most recent data.
4. Data availability
Analytical tables and data crosstabulations are available for download in PDF, html, .png and Excel (.csv) formats.
Date of access: March 2014.
| Age groups |
Sex |
Kuwaitis |
Non-Kuwaitis |
Total |
| Student |
Housewife or Alike |
Retired / has income |
Total |
Student |
Housewife or Alike |
Retired / has income |
Total |
Student |
Housewife or Alike |
Retired / has income |
Total |
| 15-19 |
Males |
62,423 |
0 |
0 |
62,423 |
40,830 |
0 |
0 |
40,830 |
103,253 |
0 |
0 |
103,253 |
| Females |
62,140 |
1,644 |
0 |
63,784 |
36,986 |
3,787 |
0 |
40,773 |
99,126 |
5,431 |
0 |
104,557 |
| Total |
124,563 |
1,644 |
0 |
126,207 |
77,816 |
3,787 |
0 |
81,603 |
202,379 |
5,431 |
0 |
207,810 |
| 20-24 |
Males |
29,176 |
0 |
13 |
29,189 |
21,836 |
0 |
1 |
21,837 |
51,012 |
0 |
14 |
51,026 |
| Females |
39,436 |
2,666 |
5 |
42,107 |
24,392 |
13,536 |
5 |
37,933 |
63,828 |
16,202 |
10 |
80,040 |
| Total |
68,612 |
2,666 |
18 |
71,296 |
46,228 |
13,536 |
6 |
59,770 |
114,840 |
16,202 |
24 |
131,066 |
| 25-29 |
Males |
3,990 |
0 |
140 |
4,130 |
10,470 |
0 |
13 |
10,483 |
14,460 |
0 |
153 |
14,613 |
| Females |
6,232 |
2,657 |
26 |
8,915 |
14,479 |
37,088 |
6 |
51,573 |
20,711 |
39,745 |
32 |
60,488 |
| Total |
10,222 |
2,657 |
166 |
13,045 |
24,949 |
37,088 |
19 |
62,056 |
35,171 |
39,745 |
185 |
75,101 |
| 30-34 |
Males |
1,342 |
0 |
343 |
1,685 |
2,904 |
0 |
27 |
2,931 |
4,246 |
0 |
370 |
4,616 |
| Females |
2,281 |
2,799 |
141 |
5,221 |
4,964 |
38,177 |
6 |
43,147 |
7,245 |
40,976 |
147 |
48,368 |
| Total |
3,623 |
2,799 |
484 |
6,906 |
7,868 |
38,177 |
33 |
46,078 |
11,491 |
40,976 |
517 |
52,984 |
| 35-39 |
Males |
826 |
0 |
981 |
1,807 |
2,039 |
0 |
30 |
2,069 |
2,865 |
0 |
1,011 |
3,876 |
| Females |
2,106 |
3,258 |
476 |
5,840 |
2,890 |
28,312 |
2 |
31,204 |
4,996 |
31,570 |
478 |
37,044 |
| Total |
2,932 |
3,258 |
1,457 |
7,647 |
4,929 |
28,312 |
32 |
33,273 |
7,861 |
31,570 |
1,489 |
40,920 |
| 40-44 |
Males |
1,248 |
0 |
4,145 |
5,393 |
1,196 |
0 |
24 |
1,220 |
2,444 |
0 |
4,169 |
6,613 |
| Females |
3,123 |
3,964 |
2,686 |
9,773 |
1,532 |
21,121 |
5 |
22,658 |
4,655 |
25,085 |
2,691 |
32,431 |
| Total |
4,371 |
3,964 |
6,831 |
15,166 |
2,728 |
21,121 |
29 |
23,878 |
7,099 |
25,085 |
6,860 |
39,044 |
| 45-49 |
Males |
681 |
0 |
7,340 |
8,021 |
412 |
0 |
28 |
440 |
1,093 |
0 |
7,368 |
8,461 |
| Females |
1,999 |
7,568 |
6,183 |
15,750 |
498 |
17,609 |
2 |
18,109 |
2,497 |
25,177 |
6,185 |
33,859 |
| Total |
2,680 |
7,568 |
13,523 |
23,771 |
910 |
17,609 |
30 |
18,549 |
3,590 |
25,177 |
13,553 |
42,320 |
| 50-54 |
Males |
0 |
0 |
10,863 |
10,863 |
0 |
0 |
49 |
49 |
0 |
0 |
10,912 |
10,912 |
| Females |
0 |
9,533 |
7,284 |
16,817 |
0 |
13,344 |
5 |
13,349 |
0 |
22,877 |
7,289 |
30,166 |
| Total |
0 |
9,533 |
18,147 |
27,680 |
0 |
13,344 |
54 |
13,398 |
0 |
22,877 |
18,201 |
41,078 |
| 55-59 |
Males |
0 |
0 |
10,041 |
10,041 |
0 |
0 |
62 |
62 |
0 |
0 |
10,103 |
10,103 |
| Females |
0 |
9,579 |
6,829 |
16,408 |
0 |
8,866 |
2 |
8,868 |
0 |
18,445 |
6,831 |
25,276 |
| Total |
0 |
9,579 |
16,870 |
26,449 |
0 |
8,866 |
64 |
8,930 |
0 |
18,445 |
16,934 |
35,379 |
| 60-64 |
Males |
0 |
0 |
7,678 |
7,678 |
0 |
0 |
219 |
219 |
0 |
0 |
7,897 |
7,897 |
| Females |
0 |
8,806 |
4,001 |
12,807 |
0 |
5,827 |
3 |
5,830 |
0 |
14,633 |
4,004 |
18,637 |
| Total |
0 |
8,806 |
11,679 |
20,485 |
0 |
5,827 |
222 |
6,049 |
0 |
14,633 |
11,901 |
26,534 |
| > 64 |
Males |
0 |
0 |
14,936 |
14,936 |
0 |
0 |
355 |
355 |
0 |
0 |
15,291 |
15,291 |
| Females |
0 |
21,955 |
2,744 |
24,699 |
0 |
8,805 |
10 |
8,815 |
0 |
30,760 |
2,754 |
33,514 |
| Total |
0 |
21,955 |
17,680 |
39,635 |
0 |
8,805 |
365 |
9,170 |
0 |
30,760 |
18,045 |
48,805 |
| Total |
Males |
99,686 |
0 |
56,480 |
156,166 |
79,687 |
0 |
808 |
80,495 |
179,373 |
0 |
57,288 |
236,661 |
| Females |
117,317 |
74,429 |
30,375 |
222,121 |
85,741 |
196,472 |
46 |
282,259 |
203,058 |
270,901 |
30,421 |
504,380 |
| Total |
217,003 |
74,429 |
86,855 |
378,287 |
165,428 |
196,472 |
854 |
362,754 |
382,431 |
270,901 |
87,709 |
741,041 |
Source: PACI
ANNEXED NOTE
1. Characteristics of data and definitions
The source of data used here is the Public Authority for Civil Information (PACI), an independant government body in charge of :
1- centralising all population and labour force data in order to manage a fully computerised population register
2- issuing mandatory civil identification cards to every resident of the country, regardless of age and nationality.
The other source of demographic and socioeconomic data on Kuwait is the Central Statistical Office (CSO), operating within the Planning Ministry. The CSO has conducted ten population and housing censuses since its inception in 1957.
(a) Kuwaiti: the Kuwaiti nationality rests upon a document of Kuwaiti nationality or a certificate proving Kuwaiti nationality issued by the Ministry of Interior of Kuwait.
(b) Non-Kuwaiti: his/ her nationality is determined by the name of the State having issued the passport. The foreign national also entered Kuwait legally and has a stamp of residence.
This category includes the Bidoon, a category of stateless persons living in the Emirate. Kuwait’s Bidoon population originates from three broad categories:
1) those whose ancestors failed to apply for nationality or lacked necessary documentation at the time of Kuwait’s independence in 1961;
2) those recruited to work in Kuwait’s army or police force during the 1960s who permanently settled in Kuwait, along with their families;
3) children of Kuwaiti mothers and stateless or foreign fathers (see Human Rights Watch. Prisoners of the Past. Kuwaiti Bidun and the Burden of Statelessness, June 2011, p. 3).
(c) Population in the labour force: population aged 15 years and above, included in the labour market, either employed (in the government or private sector, as itinerant worker, employed in the domestic sector), or unemployed.
(d) Population out of the labour force: population aged 15 years and above, not contributing to any economic activity and not included in the labour market, among which the students, the housewives, the retired persons or self-sufficients.
2. Institution which provides data
The Public Authority for Civil Information (PACI)
3. Period of data coverage: December 2014
The database is updated three times a year and the website presents only the most recent data.
4. Data availability
Analytical tables and data crosstabulations are available for download in PDF, html, .png and Excel (.csv) formats.
Date of access: May 2015
|
|
Student |
Housewife |
Retired / has income |
Total |
| Kuwaitis |
Males |
99,686 |
0 |
56,480 |
156,166 |
| Females |
117,317 |
74,429 |
30,375 |
222,121 |
| Total |
217,003 |
74,429 |
86,855 |
378,287 |
| non-Kuwaitis |
Males |
79,687 |
0 |
808 |
80,495 |
| Females |
85,741 |
196,472 |
46 |
282,259 |
| Total |
165,428 |
196,472 |
854 |
362,754 |
| Total |
Males |
179,373 |
0 |
57,288 |
236,661 |
| Females |
203,058 |
270,901 |
30,421 |
504,380 |
| Total |
382,431 |
270,901 |
87,709 |
741,041 |
Source: PACI
ANNEXED NOTE
1. Characteristics of data and definitions
The source of data used here is the Public Authority for Civil Information (PACI), an independant government body in charge of :
1- centralising all population and labour force data in order to manage a fully computerised population register
2- issuing mandatory civil identification cards to every resident of the country, regardless of age and nationality.
The other source of demographic and socioeconomic data on Kuwait is the Central Statistical Office (CSO), operating within the Planning Ministry. The CSO has conducted ten population and housing censuses since its inception in 1957.
(a) Kuwaiti: the Kuwaiti nationality rests upon a document of Kuwaiti nationality or a certificate proving Kuwaiti nationality issued by the Ministry of Interior of Kuwait.
(b) Non-Kuwaiti: his/ her nationality is determined by the name of the State having issued the passport. The foreign national also entered Kuwait legally and has a stamp of residence.
This category includes the Bidoon, a category of stateless persons living in the Emirate. Kuwait’s Bidoon population originates from three broad categories:
1) those whose ancestors failed to apply for nationality or lacked necessary documentation at the time of Kuwait’s independence in 1961;
2) those recruited to work in Kuwait’s army or police force during the 1960s who permanently settled in Kuwait, along with their families;
3) children of Kuwaiti mothers and stateless or foreign fathers (see Human Rights Watch. Prisoners of the Past. Kuwaiti Bidun and the Burden of Statelessness, June 2011, p. 3).
(c) Population in the labour force: population aged 15 years and above, included in the labour market, either employed (in the government or private sector, as itinerant worker, employed in the domestic sector), or unemployed.
(d) Population out of the labour force: population aged 15 years and above, not contributing to any economic activity and not included in the labour market, among which the students, the housewives, the retired persons or self-sufficients.
2. Institution which provides data
The Public Authority for Civil Information (PACI)
3. Period of data coverage: December 2014
The database is updated three times a year and the website presents only the most recent data.
4. Data availability
Analytical tables and data crosstabulations are available for download in PDF, html, .png and Excel (.csv) formats.
Date of access: May 2015
|
Kuwaitis |
Non-Kuwaitis |
| Sector Age group |
Government sector |
Non-government sector |
Total |
Government sector |
Non-government sector |
Domestic sector |
Total |
| 15-19 |
599 |
3,143 |
3,742 |
63 |
136 |
44 |
243 |
| 20-24 |
24,871 |
18,353 |
43,224 |
1,385 |
61,680 |
35,102 |
98,167 |
| 25-29 |
67,740 |
20,943 |
88,683 |
11,265 |
217,280 |
115,753 |
344,298 |
| 30-34 |
64,530 |
15,231 |
79,761 |
22,765 |
263,459 |
113,822 |
400,046 |
| 35-39 |
56,758 |
11,186 |
67,944 |
23,690 |
235,682 |
111,121 |
370,493 |
| 40-44 |
43,526 |
8,448 |
51,974 |
19,578 |
185,149 |
87,043 |
291,770 |
| 45-49 |
30,166 |
4,883 |
35,049 |
15,988 |
144,571 |
60,690 |
221,249 |
| 50-54 |
16,649 |
2,672 |
19,321 |
13,589 |
94,304 |
26,661 |
134,554 |
| 55-59 |
7,460 |
2,282 |
9,742 |
12,104 |
58,189 |
10,092 |
80,385 |
| 60-64 |
4,063 |
1,791 |
5,854 |
7,973 |
27,641 |
3,207 |
38,821 |
| >64 |
3,778 |
2,250 |
6,028 |
5,486 |
17,937 |
1,267 |
24,690 |
| Total |
320,140 |
91,182 |
411,322 |
133,886 |
1,306,028 |
564,802 |
2,004,716 |
Source: PACI
ANNEXED NOTE
1. Characteristics of data and definitions
The source of data used here is the Public Authority for Civil Information (PACI), an independant government body in charge of :
1- centralising all population and labour force data in order to manage a fully computerised population register
2- issuing mandatory civil identification cards to every resident of the country, regardless of age and nationality.
The other source of demographic and socioeconomic data on Kuwait is the Central Statistical Office (CSO), operating within the Planning Ministry. The CSO has conducted ten population and housing censuses since its inception in 1957.
(a) Kuwaiti: the Kuwaiti nationality rests upon a document of Kuwaiti nationality or a certificate proving Kuwaiti nationality issued by the Ministry of Interior of Kuwait.
(b) Non-Kuwaiti: his/ her nationality is determined by the name of the State having issued the passport. The foreign national also entered Kuwait legally and has a stamp of residence.
This category includes the Bidoon, a category of stateless persons living in the Emirate. Kuwait’s Bidoon population originates from three broad categories:
1) those whose ancestors failed to apply for nationality or lacked necessary documentation at the time of Kuwait’s independence in 1961;
2) those recruited to work in Kuwait’s army or police force during the 1960s who permanently settled in Kuwait, along with their families;
3) children of Kuwaiti mothers and stateless or foreign fathers (see Human Rights Watch. Prisoners of the Past. Kuwaiti Bidun and the Burden of Statelessness, June 2011, p. 3).
(c) Employed population in the labour force: population aged 15 years and above, in paid employment in the government or private sector, as itinerant worker, or in the domestic sector.
(d) Government sector: any organization of the government (organizations, authority and departments), included within the state budget
(Ministries and government departments; authorities with attached budgets; authorities with independent budgets).
(e) Non-governmental sector: any part of the private sector (a company or an individual) or any authority of the non-governmental sector.
(f) Domestic services sector: the household/ family sector, where the work is associated with the residence and its inhabitants, their service and their comfort (including maids, nannies, cooks, drivers, etc.).
Note: figures of expatriates differ slightly between PACI’s various sources of data (database; tabulated data).
2. Institution which provides data
The Public Authority for Civil Information (PACI)
3. Period of data coverage: December 2014
The database is updated three times a year and the website presents only the most recent data.
4. Data availability
Analytical tables and data crosstabulations are available for download in PDF, html, .png and Excel (.csv) formats.
Date of access: April 2015.
|
Kuwaitis |
Non-Kuwaitis |
Total |
| Agriculture, hunting and forestry |
825 |
49,638 |
50,463 |
| Fishing |
1 |
0 |
1 |
| Mining and quarrying |
5,970 |
1,925 |
7,895 |
| Manufacturing |
9,329 |
134,827 |
144,156 |
| Electricity, gas and water supply |
14,686 |
1,840 |
16,526 |
| Construction |
23,072 |
318,875 |
341,947 |
| Wholesale and retail trade |
21,817 |
355,328 |
377,145 |
| Hotels and restaurants |
2,645 |
82,191 |
84,836 |
| Transport, storage and communications |
8,594 |
66,684 |
75,278 |
| Financial intermediation |
9,874 |
14,736 |
24,610 |
| Real estate, renting and business activities |
17,425 |
115,314 |
132,739 |
| Public administration and defence, compulsory social security |
239,158 |
83,558 |
322,716 |
| Education |
30,519 |
37,974 |
68,493 |
| Health and social work |
11,739 |
32,464 |
44,203 |
| Other community, social and personal service activities |
5,530 |
103,677 |
109,207 |
| Private households with employed persons |
142 |
554,151 |
554,293 |
| Extra-territorial organizations and bodies |
25 |
3,328 |
3,353 |
| Not Stated |
20,974 |
77,763 |
98,737 |
| Total |
422,325 |
2,034,273 |
2,456,598 |
Source: PACI
ANNEXED NOTE
1. Characteristics of data and definitions
The source of data used here is the Public Authority for Civil Information (PACI), an independant government body in charge of :
1- centralising all population and labour force data in order to manage a fully computerised population register
2- issuing mandatory civil identification cards to every resident of the country, regardless of age and nationality.
The other source of demographic and socioeconomic data on Kuwait is the Central Statistical Office (CSO), operating within the Planning Ministry. The CSO has conducted ten population and housing censuses since its inception in 1957.
(a) Kuwaiti: the Kuwaiti nationality rests upon a document of Kuwaiti nationality or a certificate proving Kuwaiti nationality issued by the Ministry of Interior of Kuwait.
(b) Non-Kuwaiti: his/ her nationality is determined by the name of the State having issued the passport. The foreign national also entered Kuwait legally and has a stamp of residence.
This category includes the Bidoon, a category of stateless persons living in the Emirate. Kuwait’s Bidoon population originates from three broad categories:
1) those whose ancestors failed to apply for nationality or lacked necessary documentation at the time of Kuwait’s independence in 1961;
2) those recruited to work in Kuwait’s army or police force during the 1960s who permanently settled in Kuwait, along with their families;
3) children of Kuwaiti mothers and stateless or foreign fathers (see Human Rights Watch. Prisoners of the Past. Kuwaiti Bidun and the Burden of Statelessness, June 2011, p. 3).
(c) Population in the labour force: population aged 15 years and above, included in the labour market, either employed (in the government or private sector, as itinerant worker, employed in the domestic sector), or unemployed.
(d) Government sector: any organization of the government (organizations, authority and departments), included within the state budget
(Ministries and government departments; authorities with attached budgets; authorities with independent budgets).
(e) Non-governmental sector: any part of the private sector (a company or an individual) or any authority of the non-governmental sector.
(f) Domestic services sector: the household/ family sector, where the work is associated with the residence and its inhabitants, their service and their comfort (including maids, nannies, cooks, drivers, etc.).
Note: figures of expatriates differ slightly between PACI’s various sources of data (database; tabulated data).
2. Institution which provides data
The Public Authority for Civil Information (PACI)
3. Period of data coverage: December 2014
The database is updated three times a year and the website presents only the most recent data.
4. Data availability
Analytical tables and data crosstabulations are available for download in PDF, html, .png and Excel (.csv) formats.
Date of access: April 2015.
|
Kuwaitis |
Arabs |
Asians |
Africans |
Europeans |
N. Americans |
S. Americans |
Oceanians |
Total |
| Agriculture, hunting and forestry |
825 |
18,072 |
30,800 |
704 |
35 |
23 |
1 |
3 |
50,463 |
| Fishing |
1 |
|
|
|
|
|
|
|
1 |
| Mining and quarrying |
5,970 |
1,181 |
594 |
4 |
17 |
116 |
8 |
5 |
7,895 |
| Manufacturing |
9,329 |
38,175 |
95,794 |
346 |
259 |
212 |
17 |
24 |
144,156 |
| Electricity, gas and water supply |
14,686 |
996 |
808 |
23 |
9 |
2 |
1 |
1 |
16,526 |
| Construction |
23,072 |
123,609 |
189,796 |
597 |
1,324 |
3,344 |
103 |
102 |
341,947 |
| Wholesale and retail trade |
21,817 |
143,040 |
207,963 |
1,097 |
1,394 |
1,555 |
127 |
152 |
377,145 |
| Hotels and restaurants |
2,645 |
27,111 |
53,854 |
726 |
317 |
136 |
29 |
18 |
84,836 |
| Transport, storage and communications |
8,594 |
24,189 |
41,873 |
150 |
231 |
207 |
18 |
16 |
75,278 |
| Financial intermediation |
9,874 |
6,994 |
7,227 |
76 |
188 |
216 |
12 |
23 |
24,610 |
| Real estate, renting and business activities |
17,425 |
51,401 |
60,739 |
584 |
1,131 |
1,266 |
101 |
92 |
132,739 |
| Public administration and defence, compulsory social security |
239,158 |
58,010 |
23,919 |
215 |
681 |
658 |
31 |
44 |
322,716 |
| Education |
30,519 |
26,789 |
7,780 |
363 |
1,383 |
1,483 |
37 |
139 |
68,493 |
| Health and social work |
11,739 |
11,757 |
20,036 |
58 |
449 |
134 |
17 |
13 |
44,203 |
| Other community, social and personal service activities |
5,530 |
23,916 |
76,524 |
1,565 |
444 |
1,115 |
94 |
19 |
109,207 |
| Private households with employed persons |
142 |
3,475 |
501,662 |
48,990 |
15 |
5 |
4 |
|
554,293 |
| Extra-territorial organizations and bodies |
25 |
1,292 |
1,540 |
175 |
258 |
34 |
28 |
1 |
3,353 |
| Not Stated |
20,974 |
35,889 |
37,966 |
2,950 |
519 |
326 |
72 |
41 |
98,737 |
| Total |
422,325 |
595,896 |
1,358,875 |
58,623 |
8,654 |
10,832 |
700 |
693 |
2,456,598 |
Source: PACI
ANNEXED NOTE
1. Characteristics of data and definitions
The source of data used here is the Public Authority for Civil Information (PACI), an independant government body in charge of :
1- centralising all population and labour force data in order to manage a fully computerised population register
2- issuing mandatory civil identification cards to every resident of the country, regardless of age and nationality.
The other source of demographic and socioeconomic data on Kuwait is the Central Statistical Office (CSO), operating within the Planning Ministry. The CSO has conducted ten population and housing censuses since its inception in 1957.
(a) Kuwaiti: the Kuwaiti nationality rests upon a document of Kuwaiti nationality or a certificate proving Kuwaiti nationality issued by the Ministry of Interior of Kuwait.
(b) Non-Kuwaiti: his/ her nationality is determined by the name of the State having issued the passport. The foreign national also entered Kuwait legally and has a stamp of residence.
This category includes the Bidoon, a category of stateless persons living in the Emirate. Kuwait’s Bidoon population originates from three broad categories:
1) those whose ancestors failed to apply for nationality or lacked necessary documentation at the time of Kuwait’s independence in 1961;
2) those recruited to work in Kuwait’s army or police force during the 1960s who permanently settled in Kuwait, along with their families;
3) children of Kuwaiti mothers and stateless or foreign fathers (see Human Rights Watch. Prisoners of the Past. Kuwaiti Bidun and the Burden of Statelessness, June 2011, p. 3).
(c) Population in the labour force: population aged 15 years and above, included in the labour market, either employed (in the government or private sector, as itinerant worker, employed in the domestic sector), or unemployed.
(d) Government sector: any organization of the government (organizations, authority and departments), included within the state budget
(Ministries and government departments; authorities with attached budgets; authorities with independent budgets).
(e) Non-governmental sector: any part of the private sector (a company or an individual) or any authority of the non-governmental sector.
(f) Domestic services sector: the household/ family sector, where the work is associated with the residence and its inhabitants, their service and their comfort (including maids, nannies, cooks, drivers, etc.).
Note: figures of expatriates differ slightly between PACI’s various sources of data (database; tabulated data).
2. Institution which provides data
The Public Authority for Civil Information (PACI)
3. Period of data coverage: December 2014
The database is updated three times a year and the website presents only the most recent data.
4. Data availability
Analytical tables and data crosstabulations are available for download in PDF, html, .png and Excel (.csv) formats.
Date of access: April 2015.
|
Kuwaiti |
Arab |
Asian |
African |
European |
N. American |
S. American |
Australian-Oceanian |
Total |
| Legislators, senior officials and managers |
10,887 |
32,148 |
20,643 |
264 |
1,347 |
1,375 |
115 |
127 |
66,906 |
| Professionals |
74,262 |
79,452 |
29,173 |
326 |
2,322 |
2,103 |
146 |
261 |
188,045 |
| Technicians and associate professionals |
81,287 |
22,841 |
49,034 |
161 |
736 |
2,189 |
63 |
38 |
156,349 |
| Clerks |
159,917 |
65,269 |
44,350 |
527 |
784 |
538 |
76 |
52 |
271,513 |
| Service workers and shop and market sales workers |
68,228 |
104,988 |
509,090 |
52,341 |
968 |
742 |
119 |
51 |
736,527 |
| Skilled agricultural and fishery workers |
126 |
5,191 |
11,776 |
266 |
2 |
0 |
0 |
0 |
17,361 |
| Craft and related trades workers |
10,133 |
55,248 |
129,904 |
264 |
368 |
458 |
39 |
19 |
196,433 |
| Production supervisors and foremen |
5,316 |
60,087 |
279,354 |
1,027 |
313 |
1,476 |
31 |
11 |
347,615 |
| Regular work professionals |
113 |
101,914 |
218,327 |
1,918 |
194 |
249 |
17 |
10 |
322,742 |
| Non-stated |
12,056 |
68,758 |
67,224 |
1,529 |
1,620 |
1,702 |
94 |
124 |
153,107 |
| Total |
422,325 |
595,896 |
1,358,875 |
58,623 |
8,654 |
10,832 |
700 |
693 |
2,456,598 |
Source: PACI
ANNEXED NOTE
1. Characteristics of data and definitions
The source of data used here is the Public Authority for Civil Information (PACI), an independant government body in charge of :
1- centralising all population and labour force data in order to manage a fully computerised population register
2- issuing mandatory civil identification cards to every resident of the country, regardless of age and nationality.
The other source of demographic and socioeconomic data on Kuwait is the Central Statistical Office (CSO), operating within the Planning Ministry. The CSO has conducted ten population and housing censuses since its inception in 1957.
(a) Kuwaiti: the Kuwaiti nationality rests upon a document of Kuwaiti nationality or a certificate proving Kuwaiti nationality issued by the Ministry of Interior of Kuwait.
(b) Non-Kuwaiti: his/ her nationality is determined by the name of the State having issued the passport. The foreign national also entered Kuwait legally and has a stamp of residence.
This category includes the Bidoon, a category of stateless persons living in the Emirate. Kuwait’s Bidoon population originates from three broad categories:
1) those whose ancestors failed to apply for nationality or lacked necessary documentation at the time of Kuwait’s independence in 1961;
2) those recruited to work in Kuwait’s army or police force during the 1960s who permanently settled in Kuwait, along with their families;
3) children of Kuwaiti mothers and stateless or foreign fathers (see Human Rights Watch. Prisoners of the Past. Kuwaiti Bidun and the Burden of Statelessness, June 2011, p. 3).
(c) Population in the labour force: population aged 15 years and above, included in the labour market, either employed (in the government or private sector, as itinerant worker, employed in the domestic sector), or unemployed.
Occupations are categorised according to (slightly adapted) ISCO 88 international classification of occupations (major (1-digit) group titles).
Note: figures of expatriates differ slightly between PACI’s various sources of data (database; tabulated data).
2. Institution which provides data
The Public Authority for Civil Information (PACI)
3. Period of data coverage: December 2014
The database is updated three times a year and the website presents only the most recent data.
4. Data availability
Analytical tables and data crosstabulations are available for download in PDF, html, .png and Excel (.csv) formats.
Date of access: April 2015.
|
Kuwaitis |
Non-Kuwaitis |
Total |
| Legislators, senior officials and managers |
10,887 |
56,019 |
66,906 |
| Professionals |
74,262 |
113,783 |
188,045 |
| Technicians and associate professionals |
81,287 |
75,062 |
156,349 |
| Clerks |
159,917 |
111,596 |
271,513 |
| Service workers and shop and market sales workers |
68,228 |
668,299 |
736,527 |
| Skilled agricultural and fishery workers |
126 |
17,235 |
17,361 |
| Craft and related trades workers |
10,133 |
186,300 |
196,433 |
| Production supervisors and foremen |
5,316 |
342,299 |
347,615 |
| Regular work professionals |
113 |
322,629 |
322,742 |
| Non-stated |
12,056 |
141,051 |
153,107 |
| Total |
422,325 |
2,034,273 |
2,456,598 |
Source: PACI
ANNEXED NOTE
1. Characteristics of data and definitions
The source of data used here is the Public Authority for Civil Information (PACI), an independant government body in charge of :
1- centralising all population and labour force data in order to manage a fully computerised population register
2- issuing mandatory civil identification cards to every resident of the country, regardless of age and nationality.
The other source of demographic and socioeconomic data on Kuwait is the Central Statistical Office (CSO), operating within the Planning Ministry. The CSO has conducted ten population and housing censuses since its inception in 1957.
(a) Kuwaiti: the Kuwaiti nationality rests upon a document of Kuwaiti nationality or a certificate proving Kuwaiti nationality issued by the Ministry of Interior of Kuwait.
(b) Non-Kuwaiti: his/ her nationality is determined by the name of the State having issued the passport. The foreign national also entered Kuwait legally and has a stamp of residence.
This category includes the Bidoon, a category of stateless persons living in the Emirate. Kuwait’s Bidoon population originates from three broad categories:
1) those whose ancestors failed to apply for nationality or lacked necessary documentation at the time of Kuwait’s independence in 1961;
2) those recruited to work in Kuwait’s army or police force during the 1960s who permanently settled in Kuwait, along with their families;
3) children of Kuwaiti mothers and stateless or foreign fathers (see Human Rights Watch. Prisoners of the Past. Kuwaiti Bidun and the Burden of Statelessness, June 2011, p. 3).
(c) Population in the labour force: population aged 15 years and above, included in the labour market, either employed (in the government or private sector, as itinerant worker, employed in the domestic sector), or unemployed.
Occupations are categorised according to (slightly adapted) ISCO 88 international classification of occupations (major (1-digit) group titles).
Note: figures of expatriates differ slightly between PACI’s various sources of data (database; tabulated data).
2. Institution which provides data
The Public Authority for Civil Information (PACI)
3. Period of data coverage: December 2014
The database is updated three times a year and the website presents only the most recent data.
4. Data availability
Analytical tables and data crosstabulations are available for download in PDF, html, .png and Excel (.csv) formats.
Date of access: April 2015.
|
males |
females |
total |
| Kuwaitis |
626,256 |
649,601 |
1,275,857 |
| Arabs |
743,393 |
399,271 |
1,142,664 |
| Asians |
1,081,193 |
488,274 |
1,569,467 |
| Africans |
8,092 |
56,022 |
64,114 |
| Europeans |
8,111 |
7,314 |
15,425 |
| North Americans |
12,684 |
8,580 |
21,264 |
| South Americans |
847 |
612 |
1,459 |
| Australians- Oceanians |
959 |
784 |
1,743 |
| Total non-Kuwaitis |
1,855,279 |
960,857 |
2,816,136 |
| Grand total |
2,481,535 |
1,610,458 |
4,091,993 |
Source: PACI
ANNEXED NOTE
1. Characteristics of data and definitions
The source of data used here is the Public Authority for Civil Information (PACI), an independant government body in charge of :
1- centralising all population and labour force data in order to manage a fully computerised population register
2- issuing mandatory civil identification cards to every resident of the country, regardless of age and nationality.
The other source of demographic and socioeconomic data on Kuwait is the Central Statistical Office (CSO), operating within the Planning Ministry. The CSO has conducted ten population and housing censuses since its inception in 1957.
Since 1995 a marked discrepancy was witnessed between PACI’ and CSO’ population figures. PACI’ database is connected electronically with other administrations and bodies registering demographic events and professional/ residency issues (births and death; departures and arrivals; end of service, residency and ID deliveries, etc.).
PACI’s records of residents’ movements is thus regularly updated, which limits the risk of population overcount. Therefore, it is more likely that residents were undercounted during CSO- Ministry of Planning’s census operations (see: Shah, N. Population of Kuwait. Structure and Dynamics, Kuwait: Kuwait University Academic Publication Council, 2010, chapter 1).
(a) Kuwaiti: the Kuwaiti nationality rests upon a document of Kuwaiti nationality or a certificate proving Kuwaiti nationality issued by the Ministry of Interior of Kuwait.
(b) Non-Kuwaiti: his/ her nationality is determined by the name of the State which issued the passport. The foreign national also entered Kuwait legally and has a stamp of residence.
This category includes the Bidoon, a category of stateless persons living in the Emirate. Kuwait’s Bidoon population originates from three broad categories:
1) those whose ancestors failed to apply for nationality or lacked necessary documentation at the time of Kuwait’s independence in 1961;
2) those recruited to work in Kuwait’s army or police force during the 1960s who permanently settled in Kuwait, along with their families;
3) children of Kuwaiti mothers and stateless or foreign fathers (see Human Rights Watch. Prisoners of the Past. Kuwaiti Bidun and the Burden of Statelessness, June 2011, p. 3).
(The children of Kuwaiti mothers and non-Kuwaiti fathers (with specific nationality) inherit the father’s nationality. They are stateless if the father is stateless).
(c) Nationality group: collected according to the nationality of the head of the household.
Nationalities are grouped according to specific features common to certain population subgroups: language, geographic origin, etc. or according to internationally recognized categories such as: (Arab / non-Arab Asian countries / non-Arab African countries; European countries … etc.).
2. Institution which provides data
The Public Authority for Civil Information (PACI)
3. Period of data coverage: 31 December 2014
The database is updated three times a year and the website presents only the most recent data.
4. Data availability
The statistics section of PACI’s website (http://www.paci.gov.kw/en/ (English); http://www.paci.gov.kw/ (Arabic)) provides population and socio-economic data broken down by nationality (Kuwaiti/ non-Kuwaiti). Some data are displayed by nationality groups.
Analytical tables and data crosstabulations are available for download in PDF, html, .png and Excel (.csv) formats.
Date of access: April 2015
|
KuwaitiS |
| Never Married |
Married |
Divorced |
Widowed |
Not Stated |
Total |
| Male |
Female |
Male |
Female |
Male |
Female |
Male |
Female |
Male |
Female |
Male |
Female |
| 15-19 |
66,955 |
60,432 |
347 |
3,718 |
35 |
241 |
0 |
4 |
85 |
83 |
67,422 |
64,478 |
| 20-24 |
48,290 |
35,111 |
10,739 |
20,504 |
901 |
2,461 |
1 |
33 |
32 |
20 |
59,963 |
58,129 |
| 25-29 |
19,874 |
14,346 |
29,662 |
33,555 |
2,755 |
4,862 |
11 |
114 |
35 |
25 |
52,337 |
52,902 |
| 30-34 |
6,626 |
7,368 |
34,496 |
33,972 |
2,873 |
5,003 |
26 |
294 |
72 |
32 |
44,093 |
46,669 |
| 35-39 |
2,954 |
4,598 |
31,211 |
30,915 |
2,462 |
4,703 |
72 |
523 |
68 |
38 |
36,767 |
40,777 |
| 40-44 |
1,851 |
3,622 |
27,824 |
27,313 |
2,083 |
4,369 |
86 |
924 |
49 |
33 |
31,893 |
36,261 |
| 45-49 |
1,201 |
2,578 |
24,407 |
23,811 |
1,840 |
4,085 |
113 |
1,460 |
39 |
36 |
27,600 |
31,970 |
| 50-54 |
826 |
1,879 |
19,375 |
18,511 |
1,419 |
3,374 |
159 |
2,097 |
18 |
56 |
21,797 |
25,917 |
| 55-59 |
423 |
1,239 |
14,018 |
14,265 |
908 |
2,326 |
248 |
3,152 |
20 |
39 |
15,617 |
21,021 |
| 60-64 |
240 |
763 |
10,174 |
9,244 |
577 |
1,437 |
266 |
4,091 |
10 |
29 |
11,267 |
15,564 |
| >64 |
306 |
713 |
17,109 |
10,666 |
911 |
1,929 |
1,543 |
12,899 |
26 |
62 |
19,895 |
26,269 |
| Total |
149,546 |
132,649 |
219,362 |
226,474 |
16,764 |
34,790 |
2,525 |
25,591 |
454 |
453 |
388,651 |
419,957 |
|
Non-Kuwaitis |
|
Never Married |
Married |
Divorced |
Widowed |
Not Stated |
Total |
|
males |
females |
males |
females |
males |
females |
males |
females |
males |
females |
males |
females |
| 15-19 |
38,886 |
33,751 |
508 |
2,440 |
5 |
84 |
1 |
2 |
5,368 |
5,134 |
44,768 |
41,411 |
| 20-24 |
66,394 |
30,883 |
29,851 |
24,402 |
145 |
685 |
11 |
34 |
5,538 |
3,938 |
101,939 |
59,942 |
| 25-29 |
145,543 |
53,828 |
119,632 |
89,132 |
645 |
1,751 |
56 |
125 |
1,897 |
1,126 |
267,773 |
145,962 |
| 30-34 |
158,023 |
39,745 |
152,104 |
102,115 |
1,313 |
2,273 |
79 |
233 |
624 |
88 |
312,143 |
144,454 |
| 35-39 |
124,538 |
29,503 |
158,070 |
92,879 |
1,532 |
2,103 |
99 |
362 |
1,316 |
160 |
285,555 |
125,007 |
| 40-44 |
92,318 |
21,585 |
131,097 |
70,477 |
1,578 |
1,787 |
115 |
540 |
798 |
142 |
225,906 |
94,531 |
| 45-49 |
60,638 |
13,381 |
111,383 |
52,756 |
1,699 |
1,522 |
124 |
660 |
423 |
93 |
174,267 |
68,412 |
| 50-54 |
29,655 |
6,015 |
78,979 |
31,050 |
1,294 |
1,175 |
113 |
847 |
162 |
43 |
110,203 |
39,130 |
| 55-59 |
11,743 |
2,187 |
56,038 |
17,238 |
937 |
734 |
137 |
984 |
83 |
25 |
68,938 |
21,168 |
| 60-64 |
2,660 |
844 |
30,251 |
9,339 |
583 |
396 |
143 |
1,067 |
34 |
6 |
33,671 |
11,652 |
| >64 |
842 |
556 |
20,788 |
7,847 |
517 |
433 |
613 |
3,574 |
9 |
17 |
22,769 |
12,427 |
| Total |
731,240 |
232,278 |
888,701 |
499,675 |
10,248 |
12,943 |
1,491 |
8,428 |
16,252 |
10,772 |
1,647,932 |
764,096 |
Source: PACI
ANNEXED NOTE
1. Characteristics of data and definitions
The source of data used here is the Public Authority for Civil Information (PACI), an independant government body in charge of :
1- centralising all population and labour force data in order to manage a fully computerised population register
2- issuing mandatory civil identification cards to every resident of the country, regardless of age and nationality.
The other source of demographic and socioeconomic data on Kuwait is the Central Statistical Office (CSO), operating within the Planning Ministry. The CSO has conducted ten population and housing censuses since its inception in 1957.
Since 1995 a marked discrepancy was witnessed between PACI’ and CSO’ population figures. PACI’ database is connected electronically with other administrations and bodies registering demographic events and professional/ residency issues (births and death; departures and arrivals; end of service, residency and ID deliveries, etc.).
PACI’s records of residents’ movements is thus regularly updated, which limits the risk of population overcount. Therefore, it is more likely that residents were undercounted during CSO- Ministry of Planning’s census operations (see: Shah, N. Population of Kuwait. Structure and Dynamics, Kuwait: Kuwait University Academic Publication Council, 2010, chapter 1).
(a) Kuwaiti: the Kuwaiti nationality rests upon a document of Kuwaiti nationality or a certificate proving Kuwaiti nationality issued by the Ministry of Interior of Kuwait.
(b) Non-Kuwaiti: his/ her nationality is determined by the name of the State which issued the passport. The foreign national also entered Kuwait legally and has a stamp of residence.
This category includes the Bidoon, a category of stateless persons living in the Emirate. Kuwait’s Bidoon population originates from three broad categories:
1) those whose ancestors failed to apply for nationality or lacked necessary documentation at the time of Kuwait’s independence in 1961;
2) those recruited to work in Kuwait’s army or police force during the 1960s who permanently settled in Kuwait, along with their families;
3) children of Kuwaiti mothers and stateless or foreign fathers (see Human Rights Watch. Prisoners of the Past. Kuwaiti Bidun and the Burden of Statelessness, June 2011, p. 3).
(The children of Kuwaiti mothers and non-Kuwaiti fathers (with specific nationality) inherit the father’s nationality. They are stateless if the father is stateless).
(c) Nationality group: collected according to the nationality of the head of the household.
Nationalities are grouped according to specific features common to certain population subgroups: language, geographic origin, etc. or according to internationally recognized categories such as: (Arab / non-Arab Asian countries / non-Arab African countries; European countries … etc.).
2. Institution which provides data
The Public Authority for Civil Information (PACI)
3. Period of data coverage: 31 December 2014
The database is updated three times a year and the website presents only the most recent data.
4. Data availability
The statistics section of PACI’s website (http://www.paci.gov.kw/en/ (English); http://www.paci.gov.kw/ (Arabic)) provides population and socio-economic data broken down by nationality (Kuwaiti/ non-Kuwaiti). Some data are displayed by nationality groups.
Analytical tables and data crosstabulations are available for download in PDF, html, .png and Excel (.csv) formats.
Date of access: April 2015
|
Kuwaitis |
Non-Kuwaitis |
|
Born in Kuwait |
Born out of Kuwait |
Total |
Born in Kuwait |
Born out of Kuwait |
Total |
| 0-4 |
161,835 |
3,962 |
165,797 |
123,063 |
35,801 |
158,864 |
| 5-9 |
156,802 |
4,489 |
161,291 |
91,504 |
50,903 |
142,407 |
| 10-14 |
135,002 |
5,159 |
140,161 |
56,626 |
46,211 |
102,837 |
| 15-19 |
126,629 |
5,271 |
131,900 |
51,634 |
34,545 |
86,179 |
| 20-24 |
108,057 |
10,035 |
118,092 |
35,031 |
126,850 |
161,881 |
| 25-29 |
101,814 |
3,425 |
105,239 |
42,944 |
370,791 |
413,735 |
| 30-34 |
86,857 |
3,905 |
90,762 |
36,399 |
420,198 |
456,597 |
| 35-39 |
73,570 |
3,974 |
77,544 |
25,590 |
384,972 |
410,562 |
| 40-44 |
64,389 |
3,765 |
68,154 |
17,517 |
302,920 |
320,437 |
| 45-49 |
56,008 |
3,562 |
59,570 |
13,287 |
229,392 |
242,679 |
| 50-54 |
44,649 |
3,065 |
47,714 |
6,906 |
142,427 |
149,333 |
| 55-59 |
33,378 |
3,260 |
36,638 |
2,934 |
87,172 |
90,106 |
| 60-64 |
23,798 |
3,033 |
26,831 |
1,586 |
43,737 |
45,323 |
| >64 |
40,713 |
5,451 |
46,164 |
1,802 |
33,394 |
35,196 |
| Total |
1,213,501 |
62,356 |
1,275,857 |
506,823 |
2,309,313 |
2,816,136 |
Source: PACI
ANNEXED NOTE
1. Characteristics of data and definitions
The source of data used here is the Public Authority for Civil Information (PACI), an independant government body in charge of :
1- centralising all population and labour force data in order to manage a fully computerised population register
2- issuing mandatory civil identification cards to every resident of the country, regardless of age and nationality.
The other source of demographic and socioeconomic data on Kuwait is the Central Statistical Office (CSO), operating within the Planning Ministry. The CSO has conducted ten population and housing censuses since its inception in 1957.
Since 1995 a marked discrepancy was witnessed between PACI’ and CSO’ population figures. PACI’ database is connected electronically with other administrations and bodies registering demographic events and professional/ residency issues (births and death; departures and arrivals; end of service, residency and ID deliveries, etc.).
PACI’s records of residents’ movements is thus regularly updated, which limits the risk of population overcount. Therefore, it is more likely that residents were undercounted during CSO- Ministry of Planning’s census operations (see: Shah, N. Population of Kuwait. Structure and Dynamics, Kuwait: Kuwait University Academic Publication Council, 2010, chapter 1).
(a) Kuwaiti: the Kuwaiti nationality rests upon a document of Kuwaiti nationality or a certificate proving Kuwaiti nationality issued by the Ministry of Interior of Kuwait.
(b) Non-Kuwaiti: his/ her nationality is determined by the name of the State which issued the passport. The foreign national also entered Kuwait legally and has a stamp of residence.
This category includes the Bidoon, a category of stateless persons living in the Emirate. Kuwait’s Bidoon population originates from three broad categories:
1) those whose ancestors failed to apply for nationality or lacked necessary documentation at the time of Kuwait’s independence in 1961;
2) those recruited to work in Kuwait’s army or police force during the 1960s who permanently settled in Kuwait, along with their families;
3) children of Kuwaiti mothers and stateless or foreign fathers (see Human Rights Watch. Prisoners of the Past. Kuwaiti Bidun and the Burden of Statelessness, June 2011, p. 3).
(The children of Kuwaiti mothers and non-Kuwaiti fathers (with specific nationality) inherit the father’s nationality. They are stateless if the father is stateless).
(c) Nationality group: collected according to the nationality of the head of the household.
Nationalities are grouped according to specific features common to certain population subgroups: language, geographic origin, etc. or according to internationally recognized categories such as: (Arab / non-Arab Asian countries / non-Arab African countries; European countries … etc.).
2. Institution which provides data
The Public Authority for Civil Information (PACI)
3. Period of data coverage: 31 December 2014
The database is updated three times a year and the website presents only the most recent data.
4. Data availability
The statistics section of PACI’s website (http://www.paci.gov.kw/en/ (English); http://www.paci.gov.kw/ (Arabic)) provides population and socio-economic data broken down by nationality (Kuwaiti/ non-Kuwaiti). Some data are displayed by nationality groups.
Analytical tables and data crosstabulations are available for download in PDF, html, .png and Excel (.csv) formats.
Date of access: April 2015
| Nationality group |
Total |
| Kuwaitis |
1,275,857 |
| Arabs |
1,142,664 |
| Asians |
1,569,467 |
| Africans |
64,114 |
| Europeans |
15,425 |
| North Americans |
21,264 |
| South Americans |
1,459 |
| Australians- Oceanians |
1,743 |
| Total non-Kuwaitis |
2,816,136 |
| Grand total |
4,091,993 |
Source: PACI
ANNEXED NOTE
1. Characteristics of data and definitions
The source of data used here is the Public Authority for Civil Information (PACI), an independant government body in charge of :
1- centralising all population and labour force data in order to manage a fully computerised population register
2- issuing mandatory civil identification cards to every resident of the country, regardless of age and nationality.
The other source of demographic and socioeconomic data on Kuwait is the Central Statistical Office (CSO), operating within the Planning Ministry. The CSO has conducted ten population and housing censuses since its inception in 1957.
Since 1995 a marked discrepancy was witnessed between PACI’ and CSO’ population figures. PACI’ database is connected electronically with other administrations and bodies registering demographic events and professional/ residency issues (births and death; departures and arrivals; end of service, residency and ID deliveries, etc.).
PACI’s records of residents’ movements is thus regularly updated, which limits the risk of population overcount. Therefore, it is more likely that residents were undercounted during CSO- Ministry of Planning’s census operations (see: Shah, N. Population of Kuwait. Structure and Dynamics, Kuwait: Kuwait University Academic Publication Council, 2010, chapter 1).
(a) Kuwaiti: the Kuwaiti nationality rests upon a document of Kuwaiti nationality or a certificate proving Kuwaiti nationality issued by the Ministry of Interior of Kuwait.
(b) Non-Kuwaiti: his/ her nationality is determined by the name of the State which issued the passport. The foreign national also entered Kuwait legally and has a stamp of residence.
This category includes the Bidoon, a category of stateless persons living in the Emirate. Kuwait’s Bidoon population originates from three broad categories:
1) those whose ancestors failed to apply for nationality or lacked necessary documentation at the time of Kuwait’s independence in 1961;
2) those recruited to work in Kuwait’s army or police force during the 1960s who permanently settled in Kuwait, along with their families;
3) children of Kuwaiti mothers and stateless or foreign fathers (see Human Rights Watch. Prisoners of the Past. Kuwaiti Bidun and the Burden of Statelessness, June 2011, p. 3).
(The children of Kuwaiti mothers and non-Kuwaiti fathers (with specific nationality) inherit the father’s nationality. They are stateless if the father is stateless).
(c) Nationality group: collected according to the nationality of the head of the household.
Nationalities are grouped according to specific features common to certain population subgroups: language, geographic origin, etc. or according to internationally recognized categories such as: (Arab / non-Arab Asian countries / non-Arab African countries; European countries … etc.).
2. Institution which provides data
The Public Authority for Civil Information (PACI)
3. Period of data coverage: 31 December 2014
The database is updated three times a year and the website presents only the most recent data.
4. Data availability
The statistics section of PACI’s website (http://www.paci.gov.kw/en/ (English); http://www.paci.gov.kw/ (Arabic)) provides population and socio-economic data broken down by nationality (Kuwaiti/ non-Kuwaiti). Some data are displayed by nationality groups.
Analytical tables and data crosstabulations are available for download in PDF, html, .png and Excel (.csv) formats.
Date of access: April 2015
|
Kuwaitis |
|
Illiterate |
Reads and writes |
Elementary |
Intermediate |
High school diploma |
Diploma |
University degree |
Postgraduate |
NA |
Total |
|
Male |
Female |
Male |
Female |
Male |
Female |
Male |
Female |
Male |
Female |
Male |
Female |
Male |
Female |
Male |
Female |
Male |
Female |
Male |
Female |
| 10-14 |
1 |
1 |
25 |
22 |
35,349 |
36,003 |
0 |
0 |
0 |
0 |
0 |
0 |
0 |
0 |
0 |
0 |
35,798 |
32,962 |
71,173 |
68,988 |
| 15-19 |
6 |
7 |
1 |
11 |
19,187 |
14,542 |
42,220 |
42,546 |
1,585 |
4,132 |
0 |
0 |
0 |
0 |
0 |
0 |
4,423 |
3,240 |
67,422 |
64,478 |
| 20-24 |
7 |
6 |
4 |
15 |
14,217 |
7,520 |
22,652 |
19,541 |
16,392 |
23,414 |
1,635 |
2,247 |
1,297 |
2,649 |
3 |
2 |
3,756 |
2,735 |
59,963 |
58,129 |
| 25-29 |
2 |
8 |
6 |
91 |
4,883 |
2,588 |
15,113 |
7,157 |
18,347 |
20,555 |
6,152 |
9,944 |
5,381 |
9,923 |
39 |
40 |
2,414 |
2,596 |
52,337 |
52,902 |
| 30-34 |
1 |
12 |
14 |
133 |
3,740 |
2,073 |
12,039 |
6,846 |
14,929 |
12,935 |
6,173 |
10,476 |
5,052 |
11,573 |
164 |
197 |
1,981 |
2,424 |
44,093 |
46,669 |
| 35-39 |
0 |
10 |
27 |
56 |
4,181 |
2,445 |
10,112 |
7,696 |
10,826 |
8,390 |
4,860 |
6,219 |
4,836 |
13,066 |
196 |
142 |
1,729 |
2,753 |
36,767 |
40,777 |
| 40-44 |
1 |
17 |
31 |
30 |
4,362 |
2,447 |
10,030 |
9,350 |
7,178 |
6,240 |
3,889 |
4,657 |
4,390 |
10,096 |
247 |
125 |
1,765 |
3,299 |
31,893 |
36,261 |
| 45-49 |
3 |
48 |
6 |
22 |
1,914 |
2,390 |
9,037 |
8,441 |
7,324 |
5,576 |
3,658 |
3,854 |
3,789 |
7,674 |
315 |
115 |
1,554 |
3,850 |
27,600 |
31,970 |
| 50-54 |
35 |
774 |
86 |
365 |
1,513 |
2,144 |
5,615 |
5,556 |
5,017 |
4,058 |
3,574 |
4,340 |
4,536 |
5,520 |
403 |
136 |
1,018 |
3,024 |
21,797 |
25,917 |
| 55-59 |
125 |
3,653 |
306 |
1,353 |
1,254 |
1,909 |
3,823 |
4,114 |
2,688 |
2,264 |
2,847 |
3,500 |
3,431 |
3,605 |
665 |
218 |
478 |
405 |
15,617 |
21,021 |
| 60-64 |
128 |
4,309 |
433 |
1,360 |
1,240 |
1,629 |
2,613 |
2,723 |
1,660 |
1,213 |
1,955 |
2,238 |
2,156 |
1,558 |
596 |
190 |
486 |
344 |
11,267 |
15,564 |
| >64 |
2,342 |
14,318 |
3,612 |
3,596 |
3,243 |
2,200 |
3,454 |
2,377 |
1,629 |
893 |
1,571 |
1,065 |
2,067 |
958 |
725 |
186 |
1,252 |
676 |
19,895 |
26,269 |
| Total |
2,651 |
23,163 |
4,551 |
7,054 |
95,083 |
77,890 |
136,708 |
116,347 |
87,575 |
89,670 |
36,314 |
48,540 |
36,935 |
66,622 |
3,353 |
1,351 |
56,654 |
58,308 |
459,824 |
488,945 |
|
|
|
|
|
|
|
|
|
|
|
|
|
|
|
|
|
|
|
|
|
|
Non-Kuwaitis |
|
Illiterate |
Reads and writes |
Elementary |
Intermediate |
High school diploma |
Diploma |
University degree |
Postgraduate |
NA |
Total |
|
Male |
Female |
Male |
Female |
Male |
Female |
Male |
Female |
Male |
Female |
Male |
Female |
Male |
Female |
Male |
Female |
Male |
Female |
Male |
Female |
| 10-14 |
232 |
220 |
7,002 |
6,022 |
17,799 |
16,433 |
0 |
0 |
0 |
0 |
0 |
0 |
0 |
0 |
0 |
0 |
28,342 |
26,787 |
53,375 |
49,462 |
| 15-19 |
100 |
116 |
3,020 |
3,120 |
13,828 |
12,271 |
18,016 |
17,507 |
848 |
1,169 |
0 |
0 |
0 |
0 |
0 |
0 |
8,956 |
7,228 |
44,768 |
41,411 |
| 20-24 |
1,833 |
1,414 |
39,388 |
18,683 |
10,962 |
8,020 |
33,120 |
19,757 |
8,748 |
7,528 |
1,611 |
733 |
1,259 |
1,416 |
9 |
5 |
5,009 |
2,386 |
101,939 |
59,942 |
| 25-29 |
6,427 |
5,122 |
119,811 |
63,420 |
10,689 |
7,296 |
80,282 |
38,108 |
25,347 |
16,624 |
5,629 |
2,932 |
10,411 |
8,755 |
86 |
94 |
9,091 |
3,611 |
267,773 |
145,962 |
| 30-34 |
8,055 |
4,766 |
117,831 |
58,976 |
10,847 |
6,462 |
82,239 |
33,474 |
31,080 |
18,790 |
6,882 |
3,424 |
13,635 |
10,231 |
544 |
303 |
41,030 |
8,028 |
312,143 |
144,454 |
| 35-39 |
7,166 |
4,737 |
95,410 |
49,052 |
12,157 |
6,751 |
65,906 |
28,979 |
25,860 |
13,334 |
6,395 |
2,887 |
11,600 |
7,388 |
653 |
271 |
60,408 |
11,608 |
285,555 |
125,007 |
| 40-44 |
9,424 |
5,039 |
75,066 |
35,094 |
11,006 |
4,600 |
53,172 |
21,526 |
23,947 |
10,534 |
5,676 |
2,381 |
9,515 |
5,357 |
534 |
198 |
37,566 |
9,802 |
225,906 |
94,531 |
| 45-49 |
11,330 |
5,445 |
53,630 |
23,711 |
11,313 |
3,283 |
38,134 |
14,168 |
21,842 |
8,681 |
5,210 |
2,068 |
9,121 |
4,014 |
426 |
132 |
23,261 |
6,910 |
174,267 |
68,412 |
| 50-54 |
9,758 |
4,424 |
30,171 |
10,902 |
9,602 |
1,998 |
21,737 |
6,558 |
14,781 |
6,224 |
3,465 |
1,574 |
8,580 |
3,378 |
471 |
138 |
11,638 |
3,934 |
110,203 |
39,130 |
| 55-59 |
6,159 |
3,159 |
16,805 |
4,673 |
6,938 |
1,211 |
12,866 |
3,011 |
10,696 |
3,605 |
2,473 |
1,253 |
6,669 |
2,425 |
497 |
134 |
5,835 |
1,697 |
68,938 |
21,168 |
| 60-64 |
3,345 |
2,276 |
7,023 |
2,120 |
3,488 |
733 |
5,155 |
1,472 |
5,230 |
1,934 |
1,544 |
830 |
5,081 |
1,511 |
449 |
89 |
2,356 |
687 |
33,671 |
11,652 |
| >64 |
3,239 |
4,489 |
4,098 |
2,057 |
2,418 |
744 |
2,826 |
1,355 |
2,878 |
1,415 |
947 |
528 |
3,930 |
813 |
716 |
97 |
1,717 |
929 |
22,769 |
12,427 |
| Total |
67,068 |
41,207 |
569,255 |
277,830 |
121,047 |
69,802 |
413,453 |
185,915 |
171,257 |
89,838 |
39,832 |
18,610 |
79,801 |
45,288 |
4,385 |
1,461 |
235,209 |
83,607 |
1,701,307 |
813,558 |
Source: PACI
ANNEXED NOTE
1. Characteristics of data and definitions
The source of data used here is the Public Authority for Civil Information (PACI), an independant government body in charge of :
1- centralising all population and labour force data in order to manage a fully computerised population register
2- issuing mandatory civil identification cards to every resident of the country, regardless of age and nationality.
The other source of demographic and socioeconomic data on Kuwait is the Central Statistical Office (CSO), operating within the Planning Ministry. The CSO has conducted ten population and housing censuses since its inception in 1957.
(a) Kuwaiti: the Kuwaiti nationality rests upon a document of Kuwaiti nationality or a certificate proving Kuwaiti nationality issued by the Ministry of Interior of Kuwait.
(b) Non-Kuwaiti: his/ her nationality is determined by the name of the State which issued the passport. The foreign national also entered Kuwait legally and has a stamp of residence.
This category includes the Bidoon, a category of stateless persons living in the Emirate. Kuwait’s Bidoon population originates from three broad categories:
1) those whose ancestors failed to apply for nationality or lacked necessary documentation at the time of Kuwait’s independence in 1961;
2) those recruited to work in Kuwait’s army or police force during the 1960s who permanently settled in Kuwait, along with their families;
3) children of Kuwaiti mothers and stateless or foreign fathers (see Human Rights Watch. Prisoners of the Past. Kuwaiti Bidun and the Burden of Statelessness, June 2011, p. 3).
(The children of Kuwaiti mothers and non-Kuwaiti fathers (with specific nationality) inherit the father’s nationality. They are stateless if the father is stateless).
(c) NA: education level is unclear or not reported.
2. Institution which provides data
The Public Authority for Civil Information (PACI)
3. Period of data coverage: December 2014
The database is updated three times a year and the website presents only the most recent data.
4. Data availability
Analytical tables and data crosstabulations are available for download in PDF, html, .png and Excel (.csv) formats.
Date of access: March 2015.
|
Kuwaitis |
Non-Kuwaitis |
|
males |
females |
Total |
males |
females |
Total |
| Illiterate |
2,651 |
23,163 |
25,814 |
67,068 |
41,207 |
108,275 |
| Reads and writes |
4,551 |
7,054 |
11,605 |
569,255 |
277,830 |
847,085 |
| Elementary |
95,083 |
77,890 |
172,973 |
121,047 |
69,802 |
190,849 |
| Intermediate |
136,708 |
116,347 |
253,055 |
413,453 |
185,915 |
599,368 |
| High school diploma |
87,575 |
89,670 |
177,245 |
171,257 |
89,838 |
261,095 |
| Diploma |
36,314 |
48,540 |
84,854 |
39,832 |
18,610 |
58,442 |
| University degree |
36,935 |
66,622 |
103,557 |
79,801 |
45,288 |
125,089 |
| Postgraduate |
3,353 |
1,351 |
4,704 |
4,385 |
1,461 |
5,846 |
| NA |
56,654 |
58,308 |
114,962 |
235,209 |
83,607 |
318,816 |
| Total |
459,824 |
488,945 |
948,769 |
1,701,307 |
813,558 |
2,514,865 |
Source: PACI
ANNEXED NOTE
1. Characteristics of data and definitions
The source of data used here is the Public Authority for Civil Information (PACI), an independant government body in charge of :
1- centralising all population and labour force data in order to manage a fully computerised population register
2- issuing mandatory civil identification cards to every resident of the country, regardless of age and nationality.
The other source of demographic and socioeconomic data on Kuwait is the Central Statistical Office (CSO), operating within the Planning Ministry. The CSO has conducted ten population and housing censuses since its inception in 1957.
(a) Kuwaiti: the Kuwaiti nationality rests upon a document of Kuwaiti nationality or a certificate proving Kuwaiti nationality issued by the Ministry of Interior of Kuwait.
(b) Non-Kuwaiti: his/ her nationality is determined by the name of the State which issued the passport. The foreign national also entered Kuwait legally and has a stamp of residence.
This category includes the Bidoon, a category of stateless persons living in the Emirate. Kuwait’s Bidoon population originates from three broad categories:
1) those whose ancestors failed to apply for nationality or lacked necessary documentation at the time of Kuwait’s independence in 1961;
2) those recruited to work in Kuwait’s army or police force during the 1960s who permanently settled in Kuwait, along with their families;
3) children of Kuwaiti mothers and stateless or foreign fathers (see Human Rights Watch. Prisoners of the Past. Kuwaiti Bidun and the Burden of Statelessness, June 2011, p. 3).
(The children of Kuwaiti mothers and non-Kuwaiti fathers (with specific nationality) inherit the father’s nationality. They are stateless if the father is stateless).
(c) NA: education level is unclear or not reported.
2. Institution which provides data
The Public Authority for Civil Information (PACI)
3. Period of data coverage: December 2014
The database is updated three times a year and the website presents only the most recent data.
4. Data availability
Analytical tables and data crosstabulations are available for download in PDF, html, .png and Excel (.csv) formats.
Date of access: March 2015.
|
Qatari |
Non-Qatari |
Total |
|
Males |
Females |
Total |
Males |
Females |
Total |
Males |
Females |
Total |
| 15 – 19 |
17 |
125 |
142 |
133 |
106 |
239 |
150 |
231 |
381 |
| 20 – 24 |
108 |
486 |
594 |
417 |
712 |
1,129 |
525 |
1,198 |
1,723 |
| 25 – 29 |
135 |
171 |
306 |
146 |
504 |
650 |
281 |
675 |
956 |
| 30 – 34 |
103 |
63 |
166 |
97 |
164 |
261 |
200 |
227 |
427 |
| 35 – 39 |
16 |
125 |
141 |
0 |
161 |
161 |
16 |
286 |
302 |
| 40 – 44 |
21 |
25 |
46 |
0 |
164 |
164 |
21 |
189 |
210 |
| 45 – 49 |
0 |
34 |
34 |
0 |
92 |
92 |
0 |
126 |
126 |
| Total |
400 |
1,029 |
1,429 |
793 |
1,903 |
2,696 |
1,193 |
2,932 |
4,125 |
Source: QSA, Ministry of Development Planning and Statistics
ANNEXED NOTE
1. Technical Notes and Definitions
The data is taken from 2013 Labour Force Survey (yearly synthesis)
Sampling frame of LFS 2013: Population Census 2010.
Sample size: 8,342 households and 55,771 individuals from: 1- Qatari households; 2- Non-Qatari regular (non-collective) households; 3- Non-Qatari small collective households (2 – 6 persons); 4- Non-Qatari large collective households (7 persons or more).
Data Collection: The sample was divided into equal parts to collect data monthly. Each month 1/3 of the quarterly data were collected during the first two weeks of the month.
Reference period for the labour force data: the week prior to data collection day.
Population of reference: all Qatari and non-Qatari households present in Qatar on the night of survey, living in normal and collective households.
The collective households are a group of persons not related to each other and sharing living conditions in a residential unit, I.e. labour camps, students living boarding schools, nurses in hospitals… etc. The survey covered the small collective households (includes less than 7 persons) and large collective households (includes 7 persons or more).
The survey did not cover short periods accommodation, i.e. hotels.
The data refers to the unemployed population, i.e.:
All persons aged 15 years and over who were, during the week preceding the survey, without employment, willing to work and looking seriously for a job.
a) First time unemployed: They are the persons who never worked previously, and were during the week preceding the survey looking actively for work.
b) Unemployed who previously worked: They are the persons with a work experience, who during the week preceding the survey were actively looking for a job
2. Institution which provides data
Qatar Statistics Authority (QSA), Ministry of Development Planning and Statistics
(http://www.qsa.gov.qa/eng/index.htm for website in English; http://www.qsa.gov.qa/Ar/index.htm for website in Arabic)
3. Data availability
The Statistics Authority conducted the first labour Force Sample Survey in 2001. Starting from 2006, the execution of these surveys came to be on annual basis. Quarterly publications of Labour Force Surveys’ data are also available since 2012.
Most Labour Force Surveys and publications related to the labour force are available on QSA’s website, in PDF format. LFS 2013 can be downloaded from:
https://www.mdps.gov.qa/en/statistics1/pages/topicslisting.aspx?parent=Social&child=LaborForce
See also Qatar Information Exchange for earlier Labour Force Surveys. QIX has also an interactive data base compiling data on the labour force taken from available surveys:
http://www.qix.gov.qa/portal/page/portal/qix/subject_area/Statistics?subject_area=183
|
Qatari |
Non-Qatari |
Total |
|
Males |
Females |
Total |
Males |
Females |
Total |
Males |
Females |
Total |
| Primary |
99 |
75 |
174 |
75 |
58 |
133 |
174 |
133 |
307 |
| Preparatory |
62 |
115 |
177 |
135 |
118 |
253 |
197 |
233 |
430 |
| Secondary |
171 |
593 |
764 |
247 |
566 |
813 |
418 |
1,159 |
1,577 |
| Diploma |
0 |
55 |
55 |
104 |
46 |
150 |
104 |
101 |
205 |
| University and above |
68 |
191 |
259 |
232 |
1,115 |
1,347 |
300 |
1,306 |
1,606 |
| Total |
400 |
1,029 |
1,429 |
793 |
1,903 |
2,696 |
1,193 |
2,932 |
4,125 |
Source: QSA, Ministry of Development Planning and Statistics
ANNEXED NOTE
1. Technical Notes and Definitions
The data is taken from 2013 Labour Force Survey (yearly synthesis)
Sampling frame of LFS 2013: Population Census 2010.
Sample size: 8,342 households and 55,771 individuals from: 1- Qatari households; 2- Non-Qatari regular (non-collective) households; 3- Non-Qatari small collective households (2 – 6 persons); 4- Non-Qatari large collective households (7 persons or more).
Data Collection: The sample was divided into equal parts to collect data monthly. Each month 1/3 of the quarterly data were collected during the first two weeks of the month.
Reference period for the labour force data: the week prior to data collection day.
Population of reference: all Qatari and non-Qatari households present in Qatar on the night of survey, living in normal and collective households.
The collective households are a group of persons not related to each other and sharing living conditions in a residential unit, I.e. labour camps, students living boarding schools, nurses in hospitals… etc. The survey covered the small collective households (includes less than 7 persons) and large collective households (includes 7 persons or more).
The survey did not cover short periods accommodation, i.e. hotels.
The data refers to the unemployed population, i.e.:
All persons aged 15 years and over who were, during the week preceding the survey, without employment, willing to work and looking seriously for a job.
a) First time unemployed: They are the persons who never worked previously, and were during the week preceding the survey looking actively for work.
b) Unemployed who previously worked: They are the persons with a work experience, who during the week preceding the survey were actively looking for a job
2. Institution which provides data
Qatar Statistics Authority (QSA), Ministry of Development Planning and Statistics
(http://www.qsa.gov.qa/eng/index.htm for website in English; http://www.qsa.gov.qa/Ar/index.htm for website in Arabic)
3. Data availability
The Statistics Authority conducted the first labour Force Sample Survey in 2001. Starting from 2006, the execution of these surveys came to be on annual basis. Quarterly publications of Labour Force Surveys’ data are also available since 2012.
Most Labour Force Surveys and publications related to the labour force are available on QSA’s website, in PDF format. LFS 2013 can be downloaded from:
https://www.mdps.gov.qa/en/statistics1/pages/topicslisting.aspx?parent=Social&child=LaborForce
See also Qatar Information Exchange for earlier Labour Force Surveys. QIX has also an interactive data base compiling data on the labour force taken from available surveys:
http://www.qix.gov.qa/portal/page/portal/qix/subject_area/Statistics?subject_area=183
|
|
Seeking work for first time |
Unemployed with previous employment |
Retired and looking for a job |
Total |
| Qatari |
Males |
365 |
35 |
0 |
400 |
| |
Females |
1,029 |
0 |
0 |
1,029 |
| |
Total |
1,394 |
35 |
0 |
1,429 |
| Non-Qatari |
Males |
639 |
154 |
0 |
793 |
| |
Females |
1,903 |
0 |
0 |
1,903 |
| |
Total |
2,542 |
154 |
0 |
2,696 |
| Total |
Males |
1,004 |
189 |
0 |
1,193 |
|
Females |
2,932 |
0 |
0 |
2,932 |
|
Total |
3,936 |
189 |
0 |
4,125 |
Source: QSA, Ministry of Development Planning and Statistics
ANNEXED NOTE
1. Technical Notes and Definitions
The data is taken from 2013 Labour Force Survey (yearly synthesis)
Sampling frame of LFS 2013: Population Census 2010.
Sample size: 8,342 households and 55,771 individuals from: 1- Qatari households; 2- Non-Qatari regular (non-collective) households; 3- Non-Qatari small collective households (2 – 6 persons); 4- Non-Qatari large collective households (7 persons or more).
Data Collection: The sample was divided into equal parts to collect data monthly. Each month 1/3 of the quarterly data were collected during the first two weeks of the month.
Reference period for the labour force data: the week prior to data collection day.
Population of reference: all Qatari and non-Qatari households present in Qatar on the night of survey, living in normal and collective households.
The collective households are a group of persons not related to each other and sharing living conditions in a residential unit, I.e. labour camps, students living boarding schools, nurses in hospitals… etc. The survey covered the small collective households (includes less than 7 persons) and large collective households (includes 7 persons or more).
The survey did not cover short periods accommodation, i.e. hotels.
The data refers to the unemployed population, i.e.:
All persons aged 15 years and over who were, during the week preceding the survey, without employment, willing to work and looking seriously for a job.
a) First time unemployed: They are the persons who never worked previously, and were during the week preceding the survey looking actively for work.
b) Unemployed who previously worked: They are the persons with a work experience, who during the week preceding the survey were actively looking for a job
2. Institution which provides data
Qatar Statistics Authority (QSA), Ministry of Development Planning and Statistics
(http://www.qsa.gov.qa/eng/index.htm for website in English; http://www.qsa.gov.qa/Ar/index.htm for website in Arabic)
3. Data availability
The Statistics Authority conducted the first labour Force Sample Survey in 2001. Starting from 2006, the execution of these surveys came to be on annual basis. Quarterly publications of Labour Force Surveys’ data are also available since 2012.
Most Labour Force Surveys and publications related to the labour force are available on QSA’s website, in PDF format. LFS 2013 can be downloaded from:
https://www.mdps.gov.qa/en/statistics1/pages/topicslisting.aspx?parent=Social&child=LaborForce
See also Qatar Information Exchange for earlier Labour Force Surveys. QIX has also an interactive data base compiling data on the labour force taken from available surveys:
http://www.qix.gov.qa/portal/page/portal/qix/subject_area/Statistics?subject_area=183
|
|
Housewife |
Student |
Disabled |
Retired |
Other |
Total |
| Qatari |
Males |
0 |
13,990 |
1,375 |
10,102 |
835 |
26,302 |
| Females |
26,947 |
21,757 |
2,067 |
6,380 |
1,651 |
58,802 |
| Total |
26,947 |
35,747 |
3,442 |
16,482 |
2,486 |
85,104 |
| Non-Qatari |
Males |
0 |
23,165 |
1,824 |
0 |
2,293 |
27,282 |
| Females |
86,580 |
23,268 |
1,105 |
0 |
3,670 |
114,623 |
| Total |
86,580 |
46,433 |
2,929 |
0 |
5,963 |
141,905 |
| Total |
Males |
0 |
37,155 |
3,199 |
10,102 |
3,128 |
53,584 |
| Females |
113,527 |
45,025 |
3,172 |
6,380 |
5,321 |
173,425 |
| Total |
113,527 |
82,180 |
6,371 |
16,482 |
8,449 |
227,009 |
Source: QSA, Ministry of Development Planning and Statistics
ANNEXED NOTE
1. Technical Notes and Definitions
The data is taken from 2013 Labour Force Survey (yearly synthesis)
Sampling frame of LFS 2013: Population Census 2010.
Sample size: 8,342 households and 55,771 individuals from: 1- Qatari households; 2- Non-Qatari regular (non-collective) households; 3- Non-Qatari small collective households (2 – 6 persons); 4- Non-Qatari large collective households (7 persons or more).
Data Collection: The sample was divided into equal parts to collect data monthly. Each month 1/3 of the quarterly data were collected during the first two weeks of the month.
Reference period for the labour force data: the week prior to data collection day.
Population of reference: all Qatari and non-Qatari households present in Qatar on the night of survey, living in normal and collective households.
The collective households are a group of persons not related to each other and sharing living conditions in a residential unit, I.e. labour camps, students living boarding schools, nurses in hospitals… etc. The survey covered the small collective households (includes less than 7 persons) and large collective households (includes 7 persons or more).
The survey did not cover short periods accommodation, i.e. hotels.
Outside the labour force = economically inactive (for persons aged 15 and above):
Full-time student: The person (15 years or older) enrolled in any educational institution as a full-time persistent student with purpose of attaining an academic degree, irrespective of whether the schooling hours are in the morning or evening. Any trainee enrolled in vocational training institutes is regarded as a full-time student.
Full-time housewife: The female (15 years or older) who is fully engaged in home management and family care, and does not practice any other work
Retired: The person who does not look for a job during the week preceding the survey and gets a fixed pension for work he/she had joined before
Disabled: The person (15 years or older) who is not capable of work due to illness, handicap or old age.
Others: Those able to work but not willing to, not enrolled in education, as well as any other cases encountered by the enumerator other than the above mentioned.
2. Institution which provides data
Qatar Statistics Authority (QSA), Ministry of Development Planning and Statistics
(https://www.mdps.gov.qa/en/Pages/default.aspx for website in English; https://www.mdps.gov.qa/ar/pages/default.aspxfor website in Arabic)
3. Data availability
The Statistics Authority conducted the first labour Force Sample Survey in 2001. Starting from 2006, the execution of these surveys came to be on annual basis. Quarterly publications of Labour Force Surveys’ data are also available since 2012.
Most Labour Force Surveys and publications related to the labour force are available on QSA’s website, in PDF format. LFS 2013 can be downloaded from:
https://www.mdps.gov.qa/en/statistics1/pages/topicslisting.aspx?parent=Social&child=LaborForce
See also Qatar Information Exchange for earlier Labour Force Surveys. QIX has also an interactive data base compiling data on the labour force taken from available surveys:
http://www.qix.gov.qa/portal/page/portal/qix/subject_area/Statistics?subject_area=183
|
Qataris |
Non-Qataris |
Total |
| |
Males |
Females |
Total |
Males |
Females |
Total |
Males |
Females |
Total |
| 2006 |
21,241 |
41,176 |
62,417 |
13,306 |
54,979 |
68,285 |
34,547 |
96,155 |
130,702 |
| 2007 |
22,410 |
42,604 |
65,014 |
16,387 |
63,704 |
80,091 |
38,797 |
106,308 |
145,105 |
| 2008 |
25,450 |
45,108 |
70,558 |
20,669 |
78,005 |
98,674 |
46,119 |
123,113 |
169,232 |
| 2009 |
27,202 |
46,814 |
74,016 |
19,784 |
83,417 |
103,201 |
46,986 |
130,231 |
177,217 |
| 2010* |
24,559 |
47,616 |
72,175 |
22,364 |
96,341 |
118,705 |
46,923 |
143,957 |
190,880 |
| 2011 |
28,675 |
52,857 |
81,532 |
21,332 |
92,446 |
113,778 |
50,007 |
145,303 |
195,310 |
| 2012 |
26,427 |
54,399 |
80,826 |
26,568 |
102,085 |
128,653 |
52,995 |
156,484 |
209,479 |
| 2013 |
26,302 |
58,802 |
85,104 |
27,282 |
114,623 |
141,905 |
53,584 |
173,425 |
227,009 |
Source: Labour Force Sample Surveys, 2006 to 2009 and 2011 to 2013; *: census 2010
ANNEXED NOTE
1. Technical Notes and Definitions
Census 2010:
Reference period for census 2010: the night of April 21st, 2010.
Implementation method: census is based on de jure method; i.e. registering people according to their usual place of residence at time of census.
Populations in transit or visiting Qatar as tourists, as well as residents of public housing or visitors staying in a household for less than two months after night of reference were excluded.
Populations away from usual residence in Qatar for reasons of duty, or on a visit abroad for less than two months, as well as individuals with no personal housing within Qatar staying with a household for more than two months, are counted in their usual/ present residence during census night.
Population of reference: all individuals (nationals and non-nationals) present within the State’s borders during time of reference, including in labour camps.
Labour force Sample Surveys:
The Statistics Authority conducted the first labor Force Sample Survey in 2001. Starting from 2006, the execution of these surveys came to be on annual basis. In 2013, the Survey was conducted on a quarterly basis.
| Labor Force |
Sampling |
Sample size |
Reference |
| Sample Surveys |
frame |
(households) |
individuals |
period |
| 2006 |
based on independent samples drawn from distinct frames of specially constructed PSUs |
5,492 |
31,439 |
March 2006 |
| 2007 |
nd |
5,492 |
31,439 |
October 2007 |
| 2008 |
nd |
6,104 |
nd |
December 2008 |
| 2009 |
nd |
6,109 |
35,839 |
October 2009 |
| 2011 |
nd |
6,920 |
35,839 |
March 2011 |
| 2012 |
Census 2010 |
6,895 |
37,629 |
April 2012 |
| 2013 |
Census 2010 |
8,342 |
55,771 |
Quarterly |
Reference period for the labor force data: the week prior to the reference date for data collection.
Population of reference: all Qatari and non-Qatari households of the following types: i. Qatari households; ii. Non-Qatari households; iii. Small labor gatherings; iv. Large labor gatherings, present in Qatar on the night of survey/ periods of reference
The collective households are a group of persons not related to each other and sharing living conditions in a residential unit, I.e. labor camps, students living boarding schools, nurses in hospitals… etc. The survey covered the small collective households (includes less than 7 persons) and large collective households (includes 7 persons or more).
The survey did not cover short periods accommodation, i.e. hotels.
Inactive population:
Full-time student: The person (15 years or older) enrolled in any educational institution as a full-time persistent student with purpose of attaining an academic degree, irrespective of whether the schooling hours are in the morning or evening. Any trainee enrolled in vocational training institutes is regarded as a full-time student.
Full-time housewife: The female (15 years or older) who is fully engaged in home management and family care, and does not practice any other work
Retired: The person who does not look for a job during the week preceding the survey and gets a fixed pension for work he/she had joined before
Disabled: The person (15 years or older) who is not capable of work due to illness, handicap or old age.
Others: Those able to work but not willing to, not enrolled in education, as well as any other cases encountered by the enumerator other than the above mentioned.
2. Institution which provides data
Qatar Statistics Authority (QSA)
(https://www.mdps.gov.qa/en/Pages/default.aspx for website in English; https://www.mdps.gov.qa/ar/pages/default.aspx for website in Arabic)
3. Data availability
Labour Force Surveys and publications related to the labour force are available on QSA’s website, in PDF format and can be downloaded from:
https://www.mdps.gov.qa/en/statistics1/pages/topicslisting.aspx?parent=General&child=StatisticalAbstract
Annual Bulletin of the Labour Force survey 2012 is available in PDf and Excel formats:
https://www.mdps.gov.qa/en/statistics1/pages/topicslisting.aspx?parent=General&child=StatisticalAbstract
https://www.mdps.gov.qa/en/statistics1/pages/topicslisting.aspx?parent=General&child=StatisticalAbstract
Labour Force survey 2013 is available in Excel format as part of the Annual Abstract 2014:
https://www.mdps.gov.qa/en/statistics1/pages/topicslisting.aspx?parent=General&child=StatisticalAbstract
See also Qatar Information Exchange, an interactive data base compiling data on the labour force taken from available surveys:
http://www.qix.gov.qa/portal/page/portal/qix/subject_area/Statistics?subject_area=183
Last date of access: June 2014
|
Qatari |
Non-Qatari |
Total |
|
Males |
Females |
Total |
Males |
Females |
Total |
Males |
Females |
Total |
| Illiterate |
293 |
46 |
339 |
32,164 |
1,537 |
33,701 |
32,457 |
1,583 |
34,040 |
| Read & Write |
1,960 |
468 |
2,428 |
195,353 |
19,742 |
215,095 |
197,313 |
20,210 |
217,523 |
| Primary |
3,630 |
334 |
3,964 |
188,147 |
33,252 |
221,399 |
191,777 |
33,586 |
225,363 |
| Preparatory |
9,168 |
840 |
10,008 |
341,700 |
35,331 |
377,031 |
350,868 |
36,171 |
387,039 |
| Secondary |
20,631 |
7,525 |
28,156 |
281,877 |
20,212 |
302,089 |
302,508 |
27,737 |
330,245 |
| Pre.U. Diploma |
2,343 |
626 |
2,969 |
58,262 |
4,931 |
63,193 |
60,605 |
5,557 |
66,162 |
| University |
19,917 |
18,884 |
38,801 |
169,334 |
45,007 |
214,341 |
189,251 |
63,891 |
253,142 |
| Higher Diploma |
719 |
578 |
1,297 |
6,175 |
823 |
6,998 |
6,894 |
1,401 |
8,295 |
| M.A / M.Sc. |
1,668 |
652 |
2,320 |
8,872 |
1,701 |
10,573 |
10,540 |
2,353 |
12,893 |
| Ph.D. |
583 |
303 |
886 |
3,108 |
633 |
3,741 |
3,691 |
936 |
4,627 |
| Total |
60,912 |
30,256 |
91,168 |
1,284,992 |
163,169 |
1,448,161 |
1,345,904 |
193,425 |
1,539,329 |
Source: QSA, Ministry of Development Planning and Statistics
ANNEXED NOTE
1. Technical Notes and Definitions
The data is taken from 2013 Labour Force Survey (yearly synthesis)
Sampling frame of LFS 2013: Population Census 2010.
Sample size: 8,342 households and 55,771 individuals from: 1- Qatari households; 2- Non-Qatari regular (non-collective) households; 3- Non-Qatari small collective households (2 – 6 persons); 4- Non-Qatari large collective households (7 persons or more).
Data Collection: The sample was divided into equal parts to collect data monthly. Each month 1/3 of the quarterly data were collected during the first two weeks of the month.
Reference period for the labour force data: the week prior to data collection day.
Population of reference: all Qatari and non-Qatari households present in Qatar on the night of survey, living in normal and collective households.
The collective households are a group of persons not related to each other and sharing living conditions in a residential unit, I.e. labour camps, students living boarding schools, nurses in hospitals… etc. The survey covered the small collective households (includes less than 7 persons) and large collective households (includes 7 persons or more).
The survey did not cover short periods accommodation, i.e. hotels.
The data refers to the economically active population, i.e., the employed and the unemployed
1) Employed.
All persons aged 15 years an above, who during the week preceding the survey:
a) Perform a work for a wage, salary, profits or household gains, whether it was in cash or in kind.
b) Are temporarily not employed, however, they still have an official relation with their work
2) Unemployed.
All persons aged 15 years and over who were, during the week preceding the survey, without employment, willing to work and looking seriously for a job.
There is a distinction between two kinds of unemployed persons:
a) First time unemployed: They are the persons who never worked previously, and were during the week preceding the survey looking actively for work.
b) Unemployed who previously worked: They are the persons with a work experience, who during the week preceding the survey were actively looking for a job
This table does not include persons seeking work for the first time
2. Institution which provides data
Qatar Statistics Authority (QSA), Ministry of Development Planning and Statistics
(http://www.qsa.gov.qa/eng/index.htm for website in English; http://www.qsa.gov.qa/Ar/index.htm for website in Arabic)
3. Data availability
The Statistics Authority conducted the first labour Force Sample Survey in 2001. Starting from 2006, the execution of these surveys came to be on annual basis. Quarterly publications of Labour Force Surveys’ data are also available since 2012.
Most Labour Force Surveys and publications related to the labour force are available on QSA’s website, in PDF format. LFS 2013 can be downloaded from:
https://www.mdps.gov.qa/en/statistics1/pages/topicslisting.aspx?parent=Social&child=LaborForce
See also Qatar Information Exchange for earlier Labour Force Surveys. QIX has also an interactive data base compiling data on the labour force taken from available surveys:
http://www.qix.gov.qa/portal/page/portal/qix/subject_area/Statistics?subject_area=183
|
Qatari |
Non-Qatari |
Total |
|
Males |
Females |
Total |
Males |
Females |
Total |
Males |
Females |
Total |
| 15 – 19 |
2,080 |
527 |
2,607 |
8,962 |
932 |
9,894 |
11,042 |
1,459 |
12,501 |
| 20 – 24 |
9,381 |
3,829 |
13,210 |
142,542 |
16,327 |
158,869 |
151,923 |
20,156 |
172,079 |
| 25 – 29 |
11,230 |
6,826 |
18,056 |
247,379 |
36,764 |
284,143 |
258,609 |
43,590 |
302,199 |
| 30 – 34 |
9,760 |
7,217 |
16,977 |
285,171 |
38,344 |
323,515 |
294,931 |
45,561 |
340,492 |
| 35 – 39 |
7,211 |
5,095 |
12,306 |
196,013 |
28,864 |
224,877 |
203,224 |
33,959 |
237,183 |
| 40 – 44 |
8,178 |
3,336 |
11,514 |
148,823 |
18,483 |
167,306 |
157,001 |
21,819 |
178,820 |
| 45 – 49 |
5,359 |
2,114 |
7,473 |
113,788 |
14,261 |
128,049 |
119,147 |
16,375 |
135,522 |
| 50 – 54 |
4,940 |
1,045 |
5,985 |
68,726 |
6,343 |
75,069 |
73,666 |
7,388 |
81,054 |
| 55 – 59 |
2,070 |
215 |
2,285 |
53,422 |
2,367 |
55,789 |
55,492 |
2,582 |
58,074 |
| 60 – 64 |
671 |
52 |
723 |
15,590 |
484 |
16,074 |
16,261 |
536 |
16,797 |
| 65 + |
32 |
0 |
32 |
4,576 |
0 |
4,576 |
4,608 |
0 |
4,608 |
| Total |
60,912 |
30,256 |
91,168 |
1,284,992 |
163,169 |
1,448,161 |
1,345,904 |
193,425 |
1,539,329 |
Source: QSA, Ministry of Development Planning and Statistics
ANNEXED NOTE
1. Technical Notes and Definitions
The data is taken from 2013 Labour Force Survey (yearly synthesis)
Sampling frame of LFS 2013: Population Census 2010.
Sample size: 8,342 households and 55,771 individuals from: 1- Qatari households; 2- Non-Qatari regular (non-collective) households; 3- Non-Qatari small collective households (2 – 6 persons); 4- Non-Qatari large collective households (7 persons or more).
Data Collection: The sample was divided into equal parts to collect data monthly. Each month 1/3 of the quarterly data were collected during the first two weeks of the month.
Reference period for the labour force data: the week prior to data collection day.
Population of reference: all Qatari and non-Qatari households present in Qatar on the night of survey, living in normal and collective households.
The collective households are a group of persons not related to each other and sharing living conditions in a residential unit, I.e. labour camps, students living boarding schools, nurses in hospitals… etc. The survey covered the small collective households (includes less than 7 persons) and large collective households (includes 7 persons or more).
The survey did not cover short periods accommodation, i.e. hotels.
The data refers to the economically active population, i.e., the employed and the unemployed
1) Employed.
All persons aged 15 years an above, who during the week preceding the survey:
a) Perform a work for a wage, salary, profits or household gains, whether it was in cash or in kind.
b) Are temporarily not employed, however, they still have an official relation with their work
2) Unemployed.
All persons aged 15 years and over who were, during the week preceding the survey, without employment, willing to work and looking seriously for a job.
There is a distinction between two kinds of unemployed persons:
a) First time unemployed: They are the persons who never worked previously, and were during the week preceding the survey looking actively for work.
b) Unemployed who previously worked: They are the persons with a work experience, who during the week preceding the survey were actively looking for a job
This table does not include persons seeking work for the first time
2. Institution which provides data
Qatar Statistics Authority (QSA), Ministry of Development Planning and Statistics
(http://www.qsa.gov.qa/eng/index.htm for website in English; http://www.qsa.gov.qa/Ar/index.htm for website in Arabic)
3. Data availability
The Statistics Authority conducted the first labour Force Sample Survey in 2001. Starting from 2006, the execution of these surveys came to be on annual basis. Quarterly publications of Labour Force Surveys’ data are also available since 2012.
Most Labour Force Surveys and publications related to the labour force are available on QSA’s website, in PDF format. LFS 2013 can be downloaded from:
https://www.mdps.gov.qa/en/statistics1/pages/topicslisting.aspx?parent=Social&child=LaborForce
See also Qatar Information Exchange for earlier Labour Force Surveys. QIX has also an interactive data base compiling data on the labour force taken from available surveys:
http://www.qix.gov.qa/portal/page/portal/qix/subject_area/Statistics?subject_area=183
|
Qatari |
Non-Qatari |
Total |
|
Males |
Females |
Total |
Males |
Females |
Total |
Males |
Females |
Total |
| Employer |
2,129 |
669 |
2,798 |
1,668 |
172 |
1,840 |
3,797 |
841 |
4,638 |
| Own Account Worker |
180 |
0 |
180 |
1,985 |
0 |
1,985 |
2,165 |
0 |
2,165 |
| Employee |
58,603 |
29,587 |
88,190 |
1,280,531 |
162,997 |
1,443,528 |
1,339,134 |
192,584 |
1,531,718 |
| Unpaid Family Worker |
0 |
0 |
0 |
808 |
0 |
808 |
808 |
0 |
808 |
| Total |
60,912 |
30,256 |
91,168 |
1,284,992 |
163,169 |
1,448,161 |
1,345,904 |
193,425 |
1,539,329 |
Source: QSA, Ministry of Development Planning and Statistics
ANNEXED NOTE
1. Technical Notes and Definitions
The data is taken from 2013 Labour Force Survey (yearly synthesis)
Sampling frame of LFS 2013: Population Census 2010.
Sample size: 8,342 households and 55,771 individuals from: 1- Qatari households; 2- Non-Qatari regular (non-collective) households; 3- Non-Qatari small collective households (2 – 6 persons); 4- Non-Qatari large collective households (7 persons or more).
Data Collection: The sample was divided into equal parts to collect data monthly. Each month 1/3 of the quarterly data were collected during the first two weeks of the month.
Reference period for the labour force data: the week prior to data collection day.
Population of reference: all Qatari and non-Qatari households present in Qatar on the night of survey, living in normal and collective households.
The collective households are a group of persons not related to each other and sharing living conditions in a residential unit, I.e. labour camps, students living boarding schools, nurses in hospitals… etc. The survey covered the small collective households (includes less than 7 persons) and large collective households (includes 7 persons or more).
The survey did not cover short periods accommodation, i.e. hotels.
The data refers to the economically active population, i.e., the employed and the unemployed
1) Employed.
All persons aged 15 years an above, who during the week preceding the survey:
a) Perform a work for a wage, salary, profits or household gains, whether it was in cash or in kind.
b) Are temporarily not employed, however, they still have an official relation with their work
2) Unemployed.
All persons aged 15 years and over who were, during the week preceding the survey, without employment, willing to work and looking seriously for a job.
There is a distinction between two kinds of unemployed persons:
a) First time unemployed: They are the persons who never worked previously, and were during the week preceding the survey looking actively for work.
b) Unemployed who previously worked: They are the persons with a work experience, who during the week preceding the survey were actively looking for a job
This table does not include persons seeking work for the first time
2. Institution which provides data
Qatar Statistics Authority (QSA), Ministry of Development Planning and Statistics
(http://www.qsa.gov.qa/eng/index.htm for website in English; http://www.qsa.gov.qa/Ar/index.htm for website in Arabic)
3. Data availability
The Statistics Authority conducted the first labour Force Sample Survey in 2001. Starting from 2006, the execution of these surveys came to be on annual basis. Quarterly publications of Labour Force Surveys’ data are also available since 2012.
Most Labour Force Surveys and publications related to the labour force are available on QSA’s website, in PDF format. LFS 2013 can be downloaded from:
https://www.mdps.gov.qa/en/statistics1/pages/topicslisting.aspx?parent=Social&child=LaborForce
See also Qatar Information Exchange for earlier Labour Force Surveys. QIX has also an interactive data base compiling data on the labour force taken from available surveys:
http://www.qix.gov.qa/portal/page/portal/qix/subject_area/Statistics?subject_area=183
|
Qatari |
Non-Qatari |
Total |
|
Males |
Females |
Total |
Males |
Females |
Total |
Males |
Females |
Total |
| Government Department |
41,444 |
20,635 |
62,079 |
50,477 |
12,535 |
63,012 |
91,921 |
33,170 |
125,091 |
| Government Company/ Corporation |
7,878 |
3,745 |
11,623 |
40,431 |
10,807 |
51,238 |
48,309 |
14,552 |
62,861 |
| Mixed |
4,872 |
1,429 |
6,301 |
38,319 |
5,086 |
43,405 |
43,191 |
6,515 |
49,706 |
| Private |
6,493 |
4,361 |
10,854 |
1,097,585 |
38,179 |
1,135,764 |
1,104,078 |
42,540 |
1,146,618 |
| Diplomatic/International/Regional |
25 |
9 |
34 |
1,295 |
420 |
1,715 |
1,320 |
429 |
1,749 |
| Non profit |
200 |
77 |
277 |
504 |
511 |
1,015 |
704 |
588 |
1,292 |
| Domestic |
0 |
0 |
0 |
56,381 |
95,631 |
152,012 |
56,381 |
95,631 |
152,012 |
| Total |
60,912 |
30,256 |
91,168 |
1,284,992 |
163,169 |
1,448,161 |
1,345,904 |
193,425 |
1,539,329 |
Source: QSA, Ministry of Development Planning and Statistics
ANNEXED NOTE
1. Technical Notes and Definitions
The data is taken from 2013 Labour Force Survey (yearly synthesis)
Sampling frame of LFS 2013: Population Census 2010.
Sample size: 8,342 households and 55,771 individuals from: 1- Qatari households; 2- Non-Qatari regular (non-collective) households; 3- Non-Qatari small collective households (2 – 6 persons); 4- Non-Qatari large collective households (7 persons or more).
Data Collection: The sample was divided into equal parts to collect data monthly. Each month 1/3 of the quarterly data were collected during the first two weeks of the month.
Reference period for the labour force data: the week prior to data collection day.
Population of reference: all Qatari and non-Qatari households present in Qatar on the night of survey, living in normal and collective households.
The collective households are a group of persons not related to each other and sharing living conditions in a residential unit, I.e. labour camps, students living boarding schools, nurses in hospitals… etc. The survey covered the small collective households (includes less than 7 persons) and large collective households (includes 7 persons or more).
The survey did not cover short periods accommodation, i.e. hotels.
The data refers to the economically active population, i.e., the employed and the unemployed
1) Employed.
All persons aged 15 years an above, who during the week preceding the survey:
a) Perform a work for a wage, salary, profits or household gains, whether it was in cash or in kind.
b) Are temporarily not employed, however, they still have an official relation with their work
2) Unemployed.
All persons aged 15 years and over who were, during the week preceding the survey, without employment, willing to work and looking seriously for a job.
There is a distinction between two kinds of unemployed persons:
a) First time unemployed: They are the persons who never worked previously, and were during the week preceding the survey looking actively for work.
b) Unemployed who previously worked: They are the persons with a work experience, who during the week preceding the survey were actively looking for a job
This table does not include persons seeking work for the first time
2. Institution which provides data
Qatar Statistics Authority (QSA), Ministry of Development Planning and Statistics
(http://www.qsa.gov.qa/eng/index.htm for website in English; http://www.qsa.gov.qa/Ar/index.htm for website in Arabic)
3. Data availability
The Statistics Authority conducted the first labour Force Sample Survey in 2001. Starting from 2006, the execution of these surveys came to be on annual basis. Quarterly publications of Labour Force Surveys’ data are also available since 2012.
Most Labour Force Surveys and publications related to the labour force are available on QSA’s website, in PDF format. LFS 2013 can be downloaded from:
https://www.mdps.gov.qa/en/statistics1/pages/topicslisting.aspx?parent=Social&child=LaborForce
See also Qatar Information Exchange for earlier Labour Force Surveys. QIX has also an interactive data base compiling data on the labour force taken from available surveys:
http://www.qix.gov.qa/portal/page/portal/qix/subject_area/Statistics?subject_area=183
|
Qatari |
Non-Qatari |
Total |
|
Males |
Females |
Total |
Males |
Females |
Total |
Males |
Females |
Total |
| Agriculture, forestry and fishing |
13 |
0 |
13 |
21,194 |
0 |
21,194 |
21,207 |
0 |
21,207 |
| Mining and quarrying |
7,557 |
1,054 |
8,611 |
84,620 |
2,177 |
86,797 |
92,177 |
3,231 |
95,408 |
| Manufacturing |
1,238 |
137 |
1,375 |
117,222 |
855 |
118,077 |
118,460 |
992 |
119,452 |
| Electricity, gas, steam and air conditioning supply |
1,191 |
272 |
1,463 |
6,865 |
434 |
7,299 |
8,056 |
706 |
8,762 |
| Water supply; sewerage, waste management and remediation activities |
221 |
101 |
322 |
2,410 |
86 |
2,496 |
2,631 |
187 |
2,818 |
| Construction |
1,026 |
288 |
1,314 |
564,312 |
3,050 |
567,362 |
565,338 |
3,338 |
568,676 |
| Wholesale and retail trade; repair of motor vehicles and motorcycles |
1,144 |
343 |
1,487 |
185,834 |
6,763 |
192,597 |
186,978 |
7,106 |
194,084 |
| Transportation and storage |
1,384 |
238 |
1,622 |
37,287 |
6,029 |
43,316 |
38,671 |
6,267 |
44,938 |
| Accommodation and food service activities |
444 |
326 |
770 |
34,769 |
3,369 |
38,138 |
35,213 |
3,695 |
38,908 |
| Information and communication |
1,945 |
761 |
2,706 |
7,435 |
2,406 |
9,841 |
9,380 |
3,167 |
12,547 |
| Financial and insurance activities |
1,433 |
1,694 |
3,127 |
7,262 |
2,086 |
9,348 |
8,695 |
3,780 |
12,475 |
| Real estate activities |
720 |
101 |
821 |
9,190 |
424 |
9,614 |
9,910 |
525 |
10,435 |
| Professional, scientific and technical activities |
277 |
189 |
466 |
26,495 |
1,598 |
28,093 |
26,772 |
1,787 |
28,559 |
| Administrative and support service activities |
333 |
643 |
976 |
43,619 |
3,341 |
46,960 |
43,952 |
3,984 |
47,936 |
| Public administration and defence; compulsory social security |
38,215 |
10,776 |
48,991 |
42,521 |
4,260 |
46,781 |
80,736 |
15,036 |
95,772 |
| Education |
1,779 |
9,347 |
11,126 |
11,644 |
16,920 |
28,564 |
13,423 |
26,267 |
39,690 |
| Human health and social work activities |
1,419 |
3,550 |
4,969 |
11,518 |
11,356 |
22,874 |
12,937 |
14,906 |
27,843 |
| Arts, entertainment and recreation |
470 |
351 |
821 |
7,320 |
935 |
8,255 |
7,790 |
1,286 |
9,076 |
| Other service activities |
78 |
76 |
154 |
5,799 |
1,029 |
6,828 |
5,877 |
1,105 |
6,982 |
| Activities of households as employers; undifferentiated goods- and services-producing activities of households for own use |
0 |
0 |
0 |
56,381 |
95,631 |
152,012 |
56,381 |
95,631 |
152,012 |
| Activities of extraterritorial organizations and bodies |
25 |
9 |
34 |
1,295 |
420 |
1,715 |
1,320 |
429 |
1,749 |
| Total |
60,912 |
30,256 |
91,168 |
1,284,992 |
163,169 |
1,448,161 |
1,345,904 |
193,425 |
1,539,329 |
Source: QSA, Ministry of Development Planning and Statistics
ANNEXED NOTE
1. Technical Notes and Definitions
The data is taken from 2013 Labour Force Survey (yearly synthesis)
Sampling frame of LFS 2013: Population Census 2010.
Sample size: 8,342 households and 55,771 individuals from: 1- Qatari households; 2- Non-Qatari regular (non-collective) households; 3- Non-Qatari small collective households (2 – 6 persons); 4- Non-Qatari large collective households (7 persons or more).
Data Collection: The sample was divided into equal parts to collect data monthly. Each month 1/3 of the quarterly data were collected during the first two weeks of the month.
Reference period for the labour force data: the week prior to data collection day.
Population of reference: all Qatari and non-Qatari households present in Qatar on the night of survey, living in normal and collective households.
The collective households are a group of persons not related to each other and sharing living conditions in a residential unit, I.e. labour camps, students living boarding schools, nurses in hospitals… etc. The survey covered the small collective households (includes less than 7 persons) and large collective households (includes 7 persons or more).
The survey did not cover short periods accommodation, i.e. hotels.
The data refers to the economically active population, i.e., the employed and the unemployed
1) Employed.
All persons aged 15 years an above, who during the week preceding the survey:
a) Perform a work for a wage, salary, profits or household gains, whether it was in cash or in kind.
b) Are temporarily not employed, however, they still have an official relation with their work
2) Unemployed.
All persons aged 15 years and over who were, during the week preceding the survey, without employment, willing to work and looking seriously for a job.
There is a distinction between two kinds of unemployed persons:
a) First time unemployed: They are the persons who never worked previously, and were during the week preceding the survey looking actively for work.
b) Unemployed who previously worked: They are the persons with a work experience, who during the week preceding the survey were actively looking for a job
This table does not include persons seeking work for the first time
2. Institution which provides data
Qatar Statistics Authority (QSA), Ministry of Development Planning and Statistics
(http://www.qsa.gov.qa/eng/index.htm for website in English; http://www.qsa.gov.qa/Ar/index.htm for website in Arabic)
3. Data availability
The Statistics Authority conducted the first labour Force Sample Survey in 2001. Starting from 2006, the execution of these surveys came to be on annual basis. Quarterly publications of Labour Force Surveys’ data are also available since 2012.
Most Labour Force Surveys and publications related to the labour force are available on QSA’s website, in PDF format. LFS 2013 can be downloaded from:
https://www.mdps.gov.qa/en/statistics1/pages/topicslisting.aspx?parent=Social&child=LaborForce
See also Qatar Information Exchange for earlier Labour Force Surveys. QIX has also an interactive data base compiling data on the labour force taken from available surveys:
http://www.qix.gov.qa/portal/page/portal/qix/subject_area/Statistics?subject_area=183
|
Qatari |
Non-Qatari |
Total |
|
Males |
Females |
Total |
Males |
Females |
Total |
Males |
Females |
Total |
| Legislators, Senior Officials And Managers |
6,622 |
1,704 |
8,326 |
29,327 |
3,402 |
32,729 |
35,949 |
5,106 |
41,055 |
| Professionals |
13,283 |
15,918 |
29,201 |
96,243 |
27,200 |
123,443 |
109,526 |
43,118 |
152,644 |
| Technicians And Associate Professionals |
10,553 |
4,040 |
14,593 |
64,310 |
9,632 |
73,942 |
74,863 |
13,672 |
88,535 |
| Clerks |
14,181 |
7,502 |
21,683 |
51,483 |
9,089 |
60,572 |
65,664 |
16,591 |
82,255 |
| Service Workers And Shop And Market Sales Workers |
4,692 |
809 |
5,501 |
84,500 |
20,967 |
105,467 |
89,192 |
21,776 |
110,968 |
| Skilled Agricultural And Fishery Workers |
0 |
0 |
0 |
12,419 |
0 |
12,419 |
12,419 |
0 |
12,419 |
| Craft And Related Trades Workers |
5,447 |
0 |
5,447 |
528,319 |
131 |
528,450 |
533,766 |
131 |
533,897 |
| Plant And Machine Operators And Assemblers |
1,225 |
0 |
1,225 |
171,193 |
261 |
171,454 |
172,418 |
261 |
172,679 |
| Elementary Occupations |
4,909 |
283 |
5,192 |
247,198 |
92,487 |
339,685 |
252,107 |
92,770 |
344,877 |
| Total |
60,912 |
30,256 |
91,168 |
1,284,992 |
163,169 |
1,448,161 |
1,345,904 |
193,425 |
1,539,329 |
Source: QSA, Ministry of Development Planning and Statistics
ANNEXED NOTE
1. Technical Notes and Definitions
The data is taken from 2013 Labour Force Survey (yearly synthesis)
Sampling frame of LFS 2013: Population Census 2010.
Sample size: 8,342 households and 55,771 individuals from: 1- Qatari households; 2- Non-Qatari regular (non-collective) households; 3- Non-Qatari small collective households (2 – 6 persons); 4- Non-Qatari large collective households (7 persons or more).
Data Collection: The sample was divided into equal parts to collect data monthly. Each month 1/3 of the quarterly data were collected during the first two weeks of the month.
Reference period for the labour force data: the week prior to data collection day.
Population of reference: all Qatari and non-Qatari households present in Qatar on the night of survey, living in normal and collective households.
The collective households are a group of persons not related to each other and sharing living conditions in a residential unit, I.e. labour camps, students living boarding schools, nurses in hospitals… etc. The survey covered the small collective households (includes less than 7 persons) and large collective households (includes 7 persons or more).
The survey did not cover short periods accommodation, i.e. hotels.
The data refers to the economically active population, i.e., the employed and the unemployed
1) Employed.
All persons aged 15 years an above, who during the week preceding the survey:
a) Perform a work for a wage, salary, profits or household gains, whether it was in cash or in kind.
b) Are temporarily not employed, however, they still have an official relation with their work
2) Unemployed.
All persons aged 15 years and over who were, during the week preceding the survey, without employment, willing to work and looking seriously for a job.
There is a distinction between two kinds of unemployed persons:
a) First time unemployed: They are the persons who never worked previously, and were during the week preceding the survey looking actively for work.
b) Unemployed who previously worked: They are the persons with a work experience, who during the week preceding the survey were actively looking for a job
This table does not include persons seeking work for the first time
2. Institution which provides data
Qatar Statistics Authority (QSA), Ministry of Development Planning and Statistics
(http://www.qsa.gov.qa/eng/index.htm for website in English; http://www.qsa.gov.qa/Ar/index.htm for website in Arabic)
3. Data availability
The Statistics Authority conducted the first labour Force Sample Survey in 2001. Starting from 2006, the execution of these surveys came to be on annual basis. Quarterly publications of Labour Force Surveys’ data are also available since 2012.
Most Labour Force Surveys and publications related to the labour force are available on QSA’s website, in PDF format. LFS 2013 can be downloaded from:
https://www.mdps.gov.qa/en/statistics1/pages/topicslisting.aspx?parent=Social&child=LaborForce
See also Qatar Information Exchange for earlier Labour Force Surveys. QIX has also an interactive data base compiling data on the labour force taken from available surveys:
http://www.qix.gov.qa/portal/page/portal/qix/subject_area/Statistics?subject_area=183
|
QATARI |
NON-QATARI |
Total |
|
Males |
Females |
Total |
Males |
Females |
Total |
Males |
Females |
Total |
| 2006 |
38,684 |
19,447 |
58,131 |
415,235 |
57,767 |
473,002 |
453,919 |
77,214 |
531,133 |
| 2007 |
40,322 |
21,223 |
61,545 |
686,430 |
79,608 |
766,038 |
726,752 |
100,831 |
827,583 |
| 2008 |
42,770 |
24,815 |
67,585 |
1,002,388 |
97,928 |
1,100,316 |
1,045,158 |
122,743 |
1,167,901 |
| 2009 |
45,242 |
25,402 |
70,644 |
1,092,844 |
97,983 |
1,190,827 |
1,138,086 |
123,385 |
1,261,471 |
| 2010* |
46,168 |
24,908 |
71,076 |
1,070,973 |
128,134 |
1,199,107 |
1,117,141 |
153,042 |
1,270,183 |
| 2011 |
49,228 |
25,145 |
74,373 |
1,068,083 |
127,789 |
1,195,872 |
1,117,311 |
152,934 |
1,270,245 |
| 2012 |
55,609 |
26,992 |
82,601 |
1,117,577 |
140,404 |
1,257,981 |
1,173,186 |
167,396 |
1,340,582 |
| 2013 |
60,912 |
30,256 |
91,168 |
1,284,992 |
163,169 |
1,448,161 |
1,345,904 |
193,425 |
1,539,329 |
Source: Labour Force Sample Surveys, 2006 to 2009 and 2011 to 2013; *: census 2010
ANNEXED NOTE
1. Technical Notes and Definitions
Census 2010:
Reference period for census 2010: the night of April 21st, 2010.
Implementation method: census is based on de jure method; i.e. registering people according to their usual place of residence at time of census.
Populations in transit or visiting Qatar as tourists, as well as residents of public housing or visitors staying in a household for less than two months after night of reference were excluded.
Populations away from usual residence in Qatar for reasons of duty, or on a visit abroad for less than two months, as well as individuals with no personal housing within Qatar staying with a household for more than two months, are counted in their usual/ present residence during census night.
Population of reference: all individuals (nationals and non-nationals) present within the State’s borders during time of reference, including in labour camps.
Labour force Sample Surveys:
The Statistics Authority conducted the first labor Force Sample Survey in 2001. Starting from 2006, the execution of these surveys came to be on annual basis. In 2013, the Survey was conducted on a quarterly basis.
| Labor Force |
Sampling |
Sample size |
Reference |
| Sample Surveys |
frame |
(households) |
individuals |
period |
| 2006 |
based on independent samples drawn from distinct frames of specially constructed PSUs |
5,492 |
31,439 |
March 2006 |
| 2007 |
nd |
5,492 |
31,439 |
October 2007 |
| 2008 |
nd |
6,104 |
nd |
December 2008 |
| 2009 |
nd |
6,109 |
35,839 |
October 2009 |
| 2011 |
nd |
6,920 |
35,839 |
March 2011 |
| 2012 |
Census 2010 |
6,895 |
37,629 |
April 2012 |
| 2013 |
Census 2010 |
8,342 |
55,771 |
Quarterly |
Reference period for the labor force data: the week prior to the reference date for data collection.
Population of reference: all Qatari and non-Qatari households of the following types: i. Qatari households; ii. Non-Qatari households; iii. Small labor gatherings; iv. Large labor gatherings, present in Qatar on the night of survey/ periods of reference
The collective households are a group of persons not related to each other and sharing living conditions in a residential unit, I.e. labor camps, students living boarding schools, nurses in hospitals… etc. The survey covered the small collective households (includes less than 7 persons) and large collective households (includes 7 persons or more).
The survey did not cover short periods accommodation, i.e. hotels.
Employed population:
Persons aged 15 years an above, who during the week preceding the survey:
a) Perform a work for a wage, salary, profits or household gains, whether it was in cash or in kind.
b) Are temporarily not employed, however, they still have an official relation with their work
2. Institution which provides data
Qatar Statistics Authority (QSA)
(http://www.qsa.gov.qa/eng/index.htm for website in English; http://www.qsa.gov.qa/Ar/index.htm for website in Arabic)
3. Data availability
Labour Force Surveys since 2006 and publications related to the labour force are available on QSA’s website, in PDF format and can be downloaded from:
http://www.qix.gov.qa/portal/page/portal/QIXPOC/Documents/QIX%20Knowledge%20Base/Publication/Labor%20Force%20Researches/labor%20force%20sample%20survey
Annual Bulletin of the Labour Force survey 2012 is available in PDf and Excel formats:
http://www.qix.gov.qa/portal/page/portal/QIXPOC/Documents/QIX%20Knowledge%20Base/Publication/Labor%20Force%20Researches/labor%20force%20sample%20survey/Source_QSA/Labour_Force_Statistics_QSA_Bu_AE_2012.pdf
https://www.mdps.gov.qa/en/statistics1/pages/topicslisting.aspx?parent=Social&child=LaborForce
Labour Force survey 2013 is available in Excel format as part of the Annual Abstract 2014:
https://www.mdps.gov.qa/en/statistics1/pages/topicslisting.aspx?parent=General&child=StatisticalAbstract
See also Qatar Information Exchange, an interactive data base compiling data on the labour force taken from available surveys:
http://www.qix.gov.qa/portal/page/portal/qix/subject_area/Statistics?subject_area=183
Last date of access: December 2014
|
Emiratis |
Non-Emiratis |
TOTAL |
|
Males |
Females |
Total |
Males |
Females |
Total |
Males |
Females |
Total |
| Arts & Design |
5 |
29 |
34 |
31 |
173 |
204 |
36 |
202 |
238 |
| Engineering |
227 |
191 |
418 |
798 |
396 |
1,194 |
1,025 |
587 |
1,612 |
| Information Technology |
124 |
109 |
233 |
172 |
138 |
310 |
296 |
247 |
543 |
| Business & Economics |
1,345 |
954 |
2,299 |
1,361 |
1,302 |
2,663 |
2,706 |
2,256 |
4,962 |
| Education |
95 |
253 |
348 |
93 |
1,128 |
1,221 |
188 |
1,381 |
1,569 |
| Foreign languages |
7 |
31 |
38 |
5 |
56 |
61 |
12 |
87 |
99 |
| Environment & Health Sciences |
7 |
168 |
175 |
58 |
536 |
594 |
65 |
704 |
769 |
| Medical Sciences |
28 |
116 |
144 |
138 |
312 |
450 |
166 |
428 |
594 |
| Communication & Media Sciences |
332 |
274 |
606 |
113 |
229 |
342 |
445 |
503 |
948 |
| Sciences |
1 |
8 |
9 |
1 |
12 |
13 |
2 |
20 |
22 |
| Sharia & Law |
907 |
368 |
1,275 |
249 |
136 |
385 |
1,156 |
504 |
1,660 |
| Human & Social Sciences |
114 |
186 |
300 |
110 |
365 |
475 |
224 |
551 |
775 |
| Total |
3,192 |
2,687 |
5,879 |
3,129 |
4,783 |
7,912 |
6,321 |
7,470 |
13,791 |
Source : Ministry of Higher Education and Scientific Research
ANNEXED NOTE
1. Characteristics of data, definitions
Higher education establishments refer to universities, colleges and institutes (76 private and 11 public), in the seven Emirates.
The reference period is the academic year 2012-2013.
2. Institution which provides data
Ministry of Higher Education and Scientific Research
3. Data availability
Data on higher education is available on NBS’ website, for the academic years 2012-2013 and 2013-2014
http://www.uaestatistics.gov.ae/EnglishHome/ReportDetailsEnglish/tabid/121/Default.aspx?ItemId=2400&PTID=104&MenuId=1
A selection of tables appear in Excel format
Last date of access: April 3, 2015.
|
Emiratis |
Non-Emiratis |
TOTAL |
|
Males |
Females |
Total |
Males |
Females |
Total |
Males |
Females |
Total |
| Arts & Design |
13 |
128 |
141 |
0 |
2 |
2 |
13 |
130 |
143 |
| Engineering |
834 |
315 |
1,149 |
58 |
28 |
86 |
892 |
343 |
1,235 |
| Information Technology |
349 |
775 |
1,124 |
2 |
9 |
11 |
351 |
784 |
1,135 |
| Business & Economics |
1,008 |
2,519 |
3,527 |
71 |
80 |
151 |
1,079 |
2,599 |
3,678 |
| Education |
29 |
320 |
349 |
7 |
18 |
25 |
36 |
338 |
374 |
| Foreign languages |
0 |
98 |
98 |
1 |
18 |
19 |
1 |
116 |
117 |
| Environment & Health Sciences |
41 |
239 |
280 |
7 |
23 |
30 |
48 |
262 |
310 |
| Medical Sciences |
10 |
36 |
46 |
1 |
2 |
3 |
11 |
38 |
49 |
| Communication & Media Sciences |
67 |
333 |
400 |
6 |
23 |
29 |
73 |
356 |
429 |
| Sciences |
11 |
81 |
92 |
10 |
40 |
50 |
21 |
121 |
142 |
| Sharia & Law |
22 |
27 |
49 |
4 |
5 |
9 |
26 |
32 |
58 |
| Human & Social Sciences |
50 |
336 |
386 |
10 |
30 |
40 |
|
|
|
| Food & Agriculture |
14 |
19 |
33 |
3 |
1 |
4 |
17 |
20 |
37 |
| Total |
2,448 |
5,226 |
7,674 |
180 |
279 |
459 |
2,568 |
5,139 |
7,707 |
Source : Ministry of Higher Education and Scientific Research
ANNEXED NOTE
1. Characteristics of data, definitions
Higher education establishments refer to universities, colleges and institutes (76 private and 11 public), in the seven Emirates.
The reference period is the academic year 2012-2013.
2. Institution which provides data
Ministry of Higher Education and Scientific Research
3. Data availability
Data on higher education is available on NBS’ website, for the academic years 2012-2013 and 2013-2014
http://www.uaestatistics.gov.ae/EnglishHome/ReportDetailsEnglish/tabid/121/Default.aspx?ItemId=2400&PTID=104&MenuId=1
A selection of tables appear in Excel format
Last date of access: April 3, 2015.
|
Emiratis |
Non-Emiratis |
TOTAL |
|
Males |
Females |
Total |
Males |
Females |
Total |
Males |
Females |
Total |
| Arts & Design |
16 |
229 |
245 |
276 |
1,196 |
1,472 |
292 |
1,425 |
1,717 |
| Engineering |
2,549 |
2,071 |
4,620 |
6,476 |
3,285 |
9,761 |
9,025 |
5,356 |
14,381 |
| Information Technology |
1,082 |
553 |
1,635 |
1,462 |
832 |
2,294 |
2,544 |
1,385 |
3,929 |
| Business & Economics |
6,609 |
4,230 |
10,839 |
7,582 |
6,515 |
14,097 |
14,191 |
10,745 |
24,936 |
| Education |
79 |
600 |
679 |
356 |
1,665 |
2,021 |
435 |
2,265 |
2,700 |
| Foreign languages |
84 |
171 |
255 |
28 |
245 |
273 |
112 |
416 |
528 |
| Environment & Health Sciences |
77 |
730 |
807 |
542 |
2,874 |
3,416 |
619 |
3,604 |
4,223 |
| Medical Sciences |
66 |
592 |
658 |
1,167 |
2,424 |
3,591 |
1,233 |
3,016 |
4,249 |
| Communication & Media Sciences |
2,780 |
1,767 |
4,547 |
886 |
1,618 |
2,504 |
3,666 |
3,385 |
7,051 |
| Sciences |
9 |
49 |
58 |
76 |
154 |
230 |
85 |
203 |
288 |
| Sharia & Law |
5,510 |
2,175 |
7,685 |
1,728 |
1,070 |
2,798 |
7,238 |
3,245 |
10,483 |
| Human & Social Sciences |
610 |
1,340 |
1,950 |
686 |
3,107 |
3,793 |
1,296 |
4,447 |
5,743 |
| Foundation course |
745 |
849 |
1,594 |
547 |
345 |
892 |
1,292 |
1,194 |
2,486 |
| Other |
65 |
55 |
120 |
27 |
33 |
60 |
92 |
88 |
180 |
| Total |
20,281 |
15,411 |
35,692 |
21,839 |
25,363 |
47,202 |
42,120 |
40,774 |
82,894 |
Source : Ministry of Higher Education and Scientific Research
ANNEXED NOTE
1. Characteristics of data, definitions
Higher education establishments refer to universities, colleges and institutes (76 private and 11 public), in the seven Emirates.
The reference period is the academic year 2013-2014.
2. Institution which provides data
Ministry of Higher Education and Scientific Research
3. Data availability
Data on higher education is available on NBS’ website, for the academic years 2012-2013 and 2013-2014
http://www.uaestatistics.gov.ae/EnglishHome/ReportDetailsEnglish/tabid/121/Default.aspx?ItemId=2400&PTID=104&MenuId=1
A selection of tables appear in Excel format
Last date of access: April 3, 2015.
|
Emiratis |
Non-Emiratis |
TOTAL |
|
Males |
Females |
Total |
Males |
Females |
Total |
Males |
Females |
Total |
| Arts & Design |
21 |
575 |
596 |
1 |
17 |
18 |
22 |
592 |
614 |
| Engineering |
3,272 |
1,520 |
4,792 |
218 |
177 |
395 |
3,490 |
1,697 |
5,187 |
| Information Technology |
1,046 |
2,405 |
3,451 |
41 |
48 |
89 |
1,087 |
2,453 |
3,540 |
| Business & Economics |
2,335 |
5,869 |
8,204 |
246 |
303 |
549 |
2,581 |
6,172 |
8,753 |
| Education |
15 |
1,615 |
1,630 |
15 |
97 |
112 |
30 |
1,712 |
1,742 |
| Foreign Languages |
0 |
260 |
260 |
1 |
89 |
90 |
1 |
349 |
350 |
| Environment & Health Sciences |
151 |
1,271 |
1,422 |
27 |
148 |
175 |
178 |
1,419 |
1,597 |
| Medical Sciences |
109 |
300 |
409 |
12 |
19 |
31 |
121 |
319 |
440 |
| Communication & Media Sciences |
350 |
1,894 |
2,244 |
30 |
78 |
108 |
380 |
1,972 |
2,352 |
| Sciences |
40 |
415 |
455 |
164 |
285 |
449 |
204 |
700 |
904 |
| Sharia & Law |
218 |
291 |
509 |
46 |
44 |
90 |
264 |
335 |
599 |
| Human & Social Sciences |
235 |
1,779 |
2,014 |
42 |
161 |
203 |
277 |
1,940 |
2,217 |
| Foundation courses |
4,041 |
11,604 |
15,645 |
492 |
858 |
1,350 |
4,533 |
12,462 |
16,995 |
| Food & Agriculture |
29 |
45 |
74 |
16 |
5 |
21 |
45 |
50 |
95 |
| Total |
11,862 |
29,843 |
41,705 |
1,351 |
2,329 |
3,680 |
13,213 |
32,172 |
45,385 |
Source : Ministry of Higher Education and Scientific Research
ANNEXED NOTE
1. Characteristics of data, definitions
Higher education establishments refer to universities, colleges and institutes (76 private and 11 public), in the seven Emirates.
The reference period is the academic year 2013-2014.
2. Institution which provides data
Ministry of Higher Education and Scientific Research
3. Data availability
Data on higher education is available on NBS’ website, for the academic years 2012-2013 and 2013-2014
http://www.uaestatistics.gov.ae/EnglishHome/ReportDetailsEnglish/tabid/121/Default.aspx?ItemId=2400&PTID=104&MenuId=1
A selection of tables appear in Excel format
Last date of access: April 3, 2015.
|
Emiratis |
Non-Emiratis |
Total |
| Males |
Females |
Total |
Males |
Females |
Total |
Males |
Females |
Total |
| Professor |
2 |
2 |
4 |
463 |
56 |
519 |
465 |
58 |
523 |
| Associate Professor |
7 |
0 |
7 |
646 |
132 |
778 |
653 |
132 |
785 |
| Assistant Professor |
34 |
8 |
42 |
1,028 |
391 |
1,419 |
1,062 |
399 |
1,461 |
| Lecturer |
1 |
7 |
8 |
448 |
392 |
840 |
449 |
399 |
848 |
| Total |
44 |
17 |
61 |
2,585 |
971 |
3,556 |
2,629 |
988 |
3,617 |
Source : Ministry of Higher Education and Scientific Research
ANNEXED NOTE
1. Characteristics of data, definitions
Higher education establishments refer to universities, colleges and institutes (76 private and 11 public), in the seven Emirates.
The reference period is the academic year 2013-2014.
2. Institution which provides data
Ministry of Higher Education and Scientific Research
3. Data availability
Data on higher education is available on NBS’ website, for the academic years 2012-2013 and 2013-2014
http://www.uaestatistics.gov.ae/EnglishHome/ReportDetailsEnglish/tabid/121/Default.aspx?ItemId=2400&PTID=104&MenuId=1
A selection of tables appear in Excel format
Last date of access: April 3, 2015.
| Professional Status |
Emiratis |
Non-Emiratis |
Total |
| Males |
Females |
Total |
Males |
Females |
Total |
Males |
Females |
Total |
| Professor |
7 |
0 |
7 |
152 |
22 |
174 |
159 |
22 |
181 |
| Associate Professor |
26 |
18 |
44 |
240 |
40 |
280 |
266 |
58 |
324 |
| Assistant Professor |
75 |
39 |
114 |
198 |
128 |
326 |
273 |
167 |
440 |
| Lecturer / Faculty |
4 |
33 |
37 |
859 |
633 |
1,492 |
863 |
666 |
1,529 |
| Total |
112 |
90 |
202 |
1,449 |
823 |
2,272 |
1,561 |
913 |
2,474 |
Source : Ministry of Higher Education and Scientific Research
ANNEXED NOTE
1. Characteristics of data, definitions
Higher education establishments refer to universities, colleges and institutes (76 private and 11 public), in the seven Emirates.
The reference period is the academic year 2013-2014.
2. Institution which provides data
Ministry of Higher Education and Scientific Research
3. Data availability
Data on higher education is available on NBS’ website, for the academic years 2012-2013 and 2013-2014
http://www.uaestatistics.gov.ae/EnglishHome/ReportDetailsEnglish/tabid/121/Default.aspx?ItemId=2400&PTID=104&MenuId=1
A selection of tables appear in Excel format
Last date of access: April 3, 2015.
| Age Group |
Kuwaiti |
Non Kuwaiti |
Total |
| 0-4 |
165,797 |
158,864 |
324,661 |
| 5-9 |
161,291 |
142,407 |
303,698 |
| 10-14 |
140,161 |
102,837 |
242,998 |
| 15-19 |
131,900 |
86,179 |
218,079 |
| 20-24 |
118,092 |
161,881 |
279,973 |
| 25-29 |
105,239 |
413,735 |
518,974 |
| 30-34 |
90,762 |
456,597 |
547,359 |
| 35-39 |
77,544 |
410,562 |
488,106 |
| 40-44 |
68,154 |
320,437 |
388,591 |
| 45-49 |
59,570 |
242,679 |
302,249 |
| 50-54 |
47,714 |
149,333 |
197,047 |
| 55-59 |
36,638 |
90,106 |
126,744 |
| 60-64 |
26,831 |
45,323 |
72,154 |
| >64 |
46,164 |
35,196 |
81,360 |
| Total |
1,275,857 |
2,816,136 |
4,091,993 |
Source: PACI
ANNEXED NOTE
1. Characteristics of data and definitions
The source of data used here is the Public Authority for Civil Information (PACI), an independant government body in charge of :
1- centralising all population and labour force data in order to manage a fully computerised population register
2- issuing mandatory civil identification cards to every resident of the country, regardless of age and nationality.
The other source of demographic and socioeconomic data on Kuwait is the Central Statistical Office (CSO), operating within the Planning Ministry. The CSO has conducted ten population and housing censuses since its inception in 1957.
Since 1995 a marked discrepancy was witnessed between PACI’ and CSO’ population figures. PACI’ database is connected electronically with other administrations and bodies registering demographic events and professional/ residency issues (births and death; departures and arrivals; end of service, residency and ID deliveries, etc.).
PACI’s records of residents’ movements is thus regularly updated, which limits the risk of population overcount. Therefore, it is more likely that residents were undercounted during CSO- Ministry of Planning’s census operations (see: Shah, N. Population of Kuwait. Structure and Dynamics, Kuwait: Kuwait University Academic Publication Council, 2010, chapter 1).
(a) Kuwaiti: the Kuwaiti nationality rests upon a document of Kuwaiti nationality or a certificate proving Kuwaiti nationality issued by the Ministry of Interior of Kuwait.
(b) Non-Kuwaiti: his/ her nationality is determined by the name of the State which issued the passport. The foreign national also entered Kuwait legally and has a stamp of residence.
This category includes the Bidoon, a category of stateless persons living in the Emirate. Kuwait’s Bidoon population originates from three broad categories:
1) those whose ancestors failed to apply for nationality or lacked necessary documentation at the time of Kuwait’s independence in 1961;
2) those recruited to work in Kuwait’s army or police force during the 1960s who permanently settled in Kuwait, along with their families;
3) children of Kuwaiti mothers and stateless or foreign fathers (see Human Rights Watch. Prisoners of the Past. Kuwaiti Bidun and the Burden of Statelessness, June 2011, p. 3).
(The children of Kuwaiti mothers and non-Kuwaiti fathers (with specific nationality) inherit the father’s nationality. They are stateless if the father is stateless).
2. Institution which provides data
The Public Authority for Civil Information (PACI)
3. Period of data coverage: 31 December 2014
The database is updated three times a year and the website presents only the most recent data.
4. Data availability
The statistics section of PACI’s website (http://www.paci.gov.kw/en/ (English); http://www.paci.gov.kw/ (Arabic)) provides population and socio-economic data broken down by nationality (Kuwaiti/ non-Kuwaiti). Some data are displayed by nationality groups.
Analytical tables and data crosstabulations are available for download in PDF, html, .png and Excel (.csv) formats.
Date of access: March 2015
|
|
Kuwaitis |
|
|
Non-Kuwaitis |
|
|
Total |
|
| Year |
Male |
Female |
Total |
Male |
Female |
Total |
Male |
Female |
Total |
| 1990 |
286,299 |
292,212 |
578,511 |
944,585 |
628,584 |
1,573,169 |
1,230,884 |
920,796 |
2,151,680 |
| 1993 |
325,892 |
331,601 |
657,493 |
682,161 |
305,973 |
988,134 |
1,008,053 |
637,574 |
1,645,627 |
| 1995 |
351,314 |
356,801 |
708,115 |
841,320 |
409,359 |
1,250,679 |
1,192,634 |
766,160 |
1,958,794 |
| 1996 |
363,476 |
368,927 |
732,403 |
914,327 |
447,159 |
1,361,486 |
1,277,803 |
816,086 |
2,093,889 |
| 1998 |
388,687 |
397,323 |
786,010 |
1,002,718 |
482,137 |
1,484,855 |
1,391,405 |
879,460 |
2,270,865 |
| 1999 |
401,433 |
410,822 |
812,255 |
970,865 |
471,834 |
1,442,699 |
1,372,298 |
882,656 |
2,254,954 |
| 2000 |
415,613 |
426,177 |
841,790 |
927,023 |
448,445 |
1,375,468 |
1,342,636 |
874,622 |
2,217,258 |
| 2001 |
429,209 |
441,074 |
870,283 |
960,390 |
478,429 |
1,438,819 |
1,389,599 |
919,503 |
2,309,102 |
| 2002 |
442,310 |
455,975 |
898,285 |
1,020,913 |
500,730 |
1,521,643 |
1,463,223 |
956,705 |
2,419,928 |
| 2003 |
456,226 |
471,460 |
927,686 |
1,098,878 |
520,120 |
1,618,998 |
1,555,104 |
991,580 |
2,546,684 |
| 2004 |
469,327 |
486,907 |
956,234 |
1,240,267 |
557,155 |
1,797,422 |
1,709,594 |
1,044,062 |
2,753,656 |
| 2005 |
486,089 |
506,128 |
992,217 |
1,391,322 |
607,650 |
1,998,972 |
1,877,411 |
1,113,778 |
2,991,189 |
| 2006 |
501,148 |
522,168 |
1,023,316 |
1,510,818 |
648,826 |
2,159,644 |
2,011,966 |
1,170,994 |
3,182,960 |
| 2007 |
516,631 |
537,966 |
1,054,597 |
1,615,273 |
729,767 |
2,345,040 |
2,131,904 |
1,267,733 |
3,399,637 |
| 2008 |
532,566 |
554,985 |
1,087,551 |
1,618,766 |
735,496 |
2,354,262 |
2,151,332 |
1,290,481 |
3,441,813 |
| 2009 |
548,290 |
570,620 |
1,118,910 |
1,591,935 |
774,036 |
2,365,971 |
2,140,225 |
1,344,656 |
3,484,881 |
| 2010 |
563,631 |
584,712 |
1,148,343 |
1,586,716 |
846,995 |
2,433,711 |
2,150,347 |
1,431,707 |
3,582,054 |
| 2011 |
580,558 |
602,616 |
1,183,174 |
1,641,135 |
872,983 |
2,514,118 |
2,221,693 |
1,475,599 |
3,697,292 |
| 2012 |
595,365 |
617,071 |
1,212,436 |
1,705,468 |
905,824 |
2,611,292 |
2,300,833 |
1,522,895 |
3,823,728 |
| 2013 |
610,545 |
631,954 |
1,242,499 |
1,772,413 |
950,232 |
2,722,645 |
2,382,958 |
1,582,186 |
3,965,144 |
| 2014 |
626,256 |
649,601 |
1,275,857 |
1,855,279 |
960,857 |
2,816,136 |
2,481,535 |
1,610,458 |
4,091,993 |
Source: PACI
ANNEXED NOTE
1. Characteristics of data and definitions
The source of data used here is the Public Authority for Civil Information (PACI), an independant government body in charge of :
1- centralising all population and labour force data in order to manage a fully computerised population register
2- issuing mandatory civil identification cards to every resident of the country, regardless of age and nationality.
The other source of demographic and socioeconomic data on Kuwait is the Central Statistical Office (CSO), operating within the Planning Ministry. The CSO has conducted ten population and housing censuses since its inception in 1957.
Since 1995 a marked discrepancy was witnessed between PACI’ and CSO’ population figures. PACI’ database is connected electronically with other administrations and bodies registering demographic events and professional/ residency issues (births and death; departures and arrivals; end of service, residency and ID deliveries, etc.).
PACI’s records of residents’ movements is thus regularly updated, which limits the risk of population overcount. Therefore, it is more likely that residents were undercounted during CSO- Ministry of Planning’s census operations (see: Shah, N. Population of Kuwait. Structure and Dynamics, Kuwait: Kuwait University Academic Publication Council, 2010, chapter 1).
(a) Kuwaiti: the Kuwaiti nationality rests upon a document of Kuwaiti nationality or a certificate proving Kuwaiti nationality issued by the Ministry of Interior of Kuwait.
(b) Non-Kuwaiti: his/ her nationality is determined by the name of the State which issued the passport. The foreign national also entered Kuwait legally and has a stamp of residence.
This category includes the Bidoon, a category of stateless persons living in the Emirate. Kuwait’s Bidoon population originates from three broad categories:
1) those whose ancestors failed to apply for nationality or lacked necessary documentation at the time of Kuwait’s independence in 1961;
2) those recruited to work in Kuwait’s army or police force during the 1960s who permanently settled in Kuwait, along with their families;
3) children of Kuwaiti mothers and stateless or foreign fathers (see Human Rights Watch. Prisoners of the Past. Kuwaiti Bidun and the Burden of Statelessness, June 2011, p. 3).
(The children of Kuwaiti mothers and non-Kuwaiti fathers (with specific nationality) inherit the father’s nationality. They are stateless if the father is stateless).
2. Institution which provides data
The Public Authority for Civil Information (PACI)
3. Period of data coverage: 31 December, given years
The database is updated three times a year and the website presents only the most recent data.
4. Data availability
The statistics section of PACI’s website (http://www.paci.gov.kw/en/ (English); http://www.paci.gov.kw/ (Arabic)) provides population and socio-economic data broken down by nationality (Kuwaiti/ non-Kuwaiti). Some data are displayed by nationality groups.
Analytical tables and data crosstabulations are available for download in PDF, html, .png and Excel (.csv) formats.
Date of access: March 2015
|
Kuwaitis |
Non-Kuwaitis |
|
TOTAL |
|
|
|
|
| Age group |
males |
females |
total |
males |
females |
total |
males |
females |
total |
| 0-4 |
84,390 |
81,407 |
165,797 |
81,280 |
77,584 |
158,864 |
165,670 |
158,991 |
324,661 |
| 5-9 |
82,042 |
79,249 |
161,291 |
72,692 |
69,715 |
142,407 |
154,734 |
148,964 |
303,698 |
| 10-14 |
71,173 |
68,988 |
140,161 |
53,375 |
49,462 |
102,837 |
124,548 |
118,450 |
242,998 |
| 15-19 |
67,422 |
64,478 |
131,900 |
44,768 |
41,411 |
86,179 |
112,190 |
105,889 |
218,079 |
| 20-24 |
59,963 |
58,129 |
118,092 |
101,939 |
59,942 |
161,881 |
161,902 |
118,071 |
279,973 |
| 25-29 |
52,337 |
52,902 |
105,239 |
267,773 |
145,962 |
413,735 |
320,110 |
198,864 |
518,974 |
| 30-34 |
44,093 |
46,669 |
90,762 |
312,143 |
144,454 |
456,597 |
356,236 |
191,123 |
547,359 |
| 35-39 |
36,767 |
40,777 |
77,544 |
285,555 |
125,007 |
410,562 |
322,322 |
165,784 |
488,106 |
| 40-44 |
31,893 |
36,261 |
68,154 |
225,906 |
94,531 |
320,437 |
257,799 |
130,792 |
388,591 |
| 45-49 |
27,600 |
31,970 |
59,570 |
174,267 |
68,412 |
242,679 |
201,867 |
100,382 |
302,249 |
| 50-54 |
21,797 |
25,917 |
47,714 |
110,203 |
39,130 |
149,333 |
132,000 |
65,047 |
197,047 |
| 55-59 |
15,617 |
21,021 |
36,638 |
68,938 |
21,168 |
90,106 |
84,555 |
42,189 |
126,744 |
| 60-64 |
11,267 |
15,564 |
26,831 |
33,671 |
11,652 |
45,323 |
44,938 |
27,216 |
72,154 |
| >64 |
19,895 |
26,269 |
46,164 |
22,769 |
12,427 |
35,196 |
42,664 |
38,696 |
81,360 |
| Total |
626,256 |
649,601 |
1,275,857 |
1,855,279 |
960,857 |
2,816,136 |
2,481,535 |
1,610,458 |
4,091,993 |
Source: PACI
ANNEXED NOTE
1. Characteristics of data and definitions
The source of data used here is the Public Authority for Civil Information (PACI), an independant government body in charge of :
1- centralising all population and labour force data in order to manage a fully computerised population register
2- issuing mandatory civil identification cards to every resident of the country, regardless of age and nationality.
The other source of demographic and socioeconomic data on Kuwait is the Central Statistical Office (CSO), operating within the Planning Ministry. The CSO has conducted ten population and housing censuses since its inception in 1957.
Since 1995 a marked discrepancy was witnessed between PACI’ and CSO’ population figures. PACI’ database is connected electronically with other administrations and bodies registering demographic events and professional/ residency issues (births and death; departures and arrivals; end of service, residency and ID deliveries, etc.).
PACI’s records of residents’ movements is thus regularly updated, which limits the risk of population overcount. Therefore, it is more likely that residents were undercounted during CSO- Ministry of Planning’s census operations (see: Shah, N. Population of Kuwait. Structure and Dynamics, Kuwait: Kuwait University Academic Publication Council, 2010, chapter 1).
(a) Kuwaiti: the Kuwaiti nationality rests upon a document of Kuwaiti nationality or a certificate proving Kuwaiti nationality issued by the Ministry of Interior of Kuwait.
(b) Non-Kuwaiti: his/ her nationality is determined by the name of the State which issued the passport. The foreign national also entered Kuwait legally and has a stamp of residence.
This category includes the Bidoon, a category of stateless persons living in the Emirate. Kuwait’s Bidoon population originates from three broad categories:
1) those whose ancestors failed to apply for nationality or lacked necessary documentation at the time of Kuwait’s independence in 1961;
2) those recruited to work in Kuwait’s army or police force during the 1960s who permanently settled in Kuwait, along with their families;
3) children of Kuwaiti mothers and stateless or foreign fathers (see Human Rights Watch. Prisoners of the Past. Kuwaiti Bidun and the Burden of Statelessness, June 2011, p. 3).
(The children of Kuwaiti mothers and non-Kuwaiti fathers (with specific nationality) inherit the father’s nationality. They are stateless if the father is stateless).
(c) Nationality group: collected according to the nationality of the head of the household.
Nationalities are grouped according to specific features common to certain population subgroups: language, geographic origin, etc. or according to internationally recognized categories such as: (Arab / non-Arab Asian countries / non-Arab African countries; European countries … etc.).
2. Institution which provides data
The Public Authority for Civil Information (PACI)
3. Period of data coverage: 31 December 2014
The database is updated three times a year and the website presents only the most recent data.
4. Data availability
The statistics section of PACI’s website (http://www.paci.gov.kw/en/ (English); http://www.paci.gov.kw/ (Arabic)) provides population and socio-economic data broken down by nationality (Kuwaiti/ non-Kuwaiti). Some data are displayed by nationality groups.
Analytical tables and data crosstabulations are available for download in PDF, html, .png and Excel (.csv) formats.
Date of access: March 2015
| Age Group |
Kuwaiti |
Arab |
Asian |
African |
European |
N.American |
S.American |
Australian |
TOTAL |
| 0-4 |
165,797 |
108,253 |
46,428 |
455 |
1,184 |
2,258 |
109 |
177 |
324,661 |
| 5-9 |
161,291 |
98,225 |
40,122 |
316 |
1,307 |
2,135 |
106 |
196 |
303,698 |
| 10-14 |
140,161 |
74,440 |
25,076 |
228 |
951 |
1,893 |
85 |
164 |
242,998 |
| 15-19 |
131,900 |
65,821 |
17,541 |
321 |
698 |
1,541 |
102 |
155 |
218,079 |
| 20-24 |
118,092 |
83,119 |
66,953 |
9,887 |
639 |
1,046 |
120 |
117 |
279,973 |
| 25-29 |
105,239 |
153,222 |
225,758 |
31,876 |
1,117 |
1,508 |
165 |
89 |
518,974 |
| 30-34 |
90,762 |
152,100 |
287,778 |
13,393 |
1,426 |
1,631 |
151 |
118 |
547,359 |
| 35-39 |
77,544 |
117,702 |
285,098 |
4,537 |
1,584 |
1,413 |
109 |
119 |
488,106 |
| 40-44 |
68,154 |
87,088 |
228,534 |
1,630 |
1,530 |
1,428 |
112 |
115 |
388,591 |
| 45-49 |
59,570 |
71,961 |
166,684 |
665 |
1,433 |
1,670 |
121 |
145 |
302,249 |
| 50-54 |
47,714 |
51,868 |
93,811 |
338 |
1,255 |
1,810 |
111 |
140 |
197,047 |
| 55-59 |
36,638 |
34,842 |
52,445 |
263 |
1,022 |
1,349 |
92 |
93 |
126,744 |
| 60-64 |
26,831 |
21,420 |
22,079 |
139 |
668 |
896 |
46 |
75 |
72,154 |
| >64 |
46,164 |
22,603 |
11,160 |
66 |
611 |
686 |
30 |
40 |
81,360 |
| Total |
1,275,857 |
1,142,664 |
1,569,467 |
64,114 |
15,425 |
21,264 |
1,459 |
1,743 |
4,091,993 |
Source: PACI
ANNEXED NOTE
1. Characteristics of data and definitions
The source of data used here is the Public Authority for Civil Information (PACI), an independant government body in charge of :
1- centralising all population and labour force data in order to manage a fully computerised population register
2- issuing mandatory civil identification cards to every resident of the country, regardless of age and nationality.
The other source of demographic and socioeconomic data on Kuwait is the Central Statistical Office (CSO), operating within the Planning Ministry. The CSO has conducted ten population and housing censuses since its inception in 1957.
Since 1995 a marked discrepancy was witnessed between PACI’ and CSO’ population figures. PACI’ database is connected electronically with other administrations and bodies registering demographic events and professional/ residency issues (births and death; departures and arrivals; end of service, residency and ID deliveries, etc.).
PACI’s records of residents’ movements is thus regularly updated, which limits the risk of population overcount. Therefore, it is more likely that residents were undercounted during CSO- Ministry of Planning’s census operations (see: Shah, N. Population of Kuwait. Structure and Dynamics, Kuwait: Kuwait University Academic Publication Council, 2010, chapter 1).
(a) Kuwaiti: the Kuwaiti nationality rests upon a document of Kuwaiti nationality or a certificate proving Kuwaiti nationality issued by the Ministry of Interior of Kuwait.
(b) Non-Kuwaiti: his/ her nationality is determined by the name of the State which issued the passport. The foreign national also entered Kuwait legally and has a stamp of residence.
This category includes the Bidoon, a category of stateless persons living in the Emirate. Kuwait’s Bidoon population originates from three broad categories:
1) those whose ancestors failed to apply for nationality or lacked necessary documentation at the time of Kuwait’s independence in 1961;
2) those recruited to work in Kuwait’s army or police force during the 1960s who permanently settled in Kuwait, along with their families;
3) children of Kuwaiti mothers and stateless or foreign fathers (see Human Rights Watch. Prisoners of the Past. Kuwaiti Bidun and the Burden of Statelessness, June 2011, p. 3).
(The children of Kuwaiti mothers and non-Kuwaiti fathers (with specific nationality) inherit the father’s nationality. They are stateless if the father is stateless).
(c) Nationality group: collected according to the nationality of the head of the household.
Nationalities are grouped according to specific features common to certain population subgroups: language, geographic origin, etc. or according to internationally recognized categories such as: (Arab / non-Arab Asian countries / non-Arab African countries; European countries … etc.).
2. Institution which provides data
The Public Authority for Civil Information (PACI)
3. Period of data coverage: 31 December 2014
The database is updated three times a year and the website presents only the most recent data.
4. Data availability
The statistics section of PACI’s website (http://www.paci.gov.kw/en/ (English); http://www.paci.gov.kw/ (Arabic)) provides population and socio-economic data broken down by nationality (Kuwaiti/ non-Kuwaiti). Some data are displayed by nationality groups.
Analytical tables and data crosstabulations are available for download in PDF, html, .png and Excel (.csv) formats.
Date of access: March 2015
|
Kuwaitis |
Non-Kuwaitis |
|
GRAND |
|
|
|
Arabs |
|
|
Asians |
|
|
Africans |
|
|
Europeans |
|
|
North Americans |
|
|
South Americans |
|
|
Australians- Oceanians |
|
|
TOTAL non-Kuwaitis |
|
|
TOTAL |
|
| Age group |
males |
females |
total |
males |
females |
total |
males |
females |
total |
males |
females |
total |
males |
females |
total |
males |
females |
total |
males |
females |
total |
males |
females |
total |
males |
females |
total |
males |
females |
total |
| 0-4 |
84,390 |
81,407 |
165,797 |
55,253 |
53,000 |
108,253 |
23,805 |
22,623 |
46,428 |
241 |
214 |
455 |
595 |
589 |
1,184 |
1,234 |
1,024 |
2,258 |
54 |
55 |
109 |
98 |
79 |
177 |
81,280 |
77,584 |
158,864 |
165,670 |
158,991 |
324,661 |
| 5-9 |
82,042 |
79,249 |
161,291 |
50,290 |
47,935 |
98,225 |
20,325 |
19,797 |
40,122 |
155 |
161 |
316 |
666 |
641 |
1,307 |
1,098 |
1,037 |
2,135 |
54 |
52 |
106 |
104 |
92 |
196 |
72,692 |
69,715 |
142,407 |
154,734 |
148,964 |
303,698 |
| 10-14 |
71,173 |
68,988 |
140,161 |
38,752 |
35,688 |
74,440 |
12,881 |
12,195 |
25,076 |
104 |
124 |
228 |
485 |
466 |
951 |
1,016 |
877 |
1,893 |
52 |
33 |
85 |
85 |
79 |
164 |
53,375 |
49,462 |
102,837 |
124,548 |
118,450 |
242,998 |
| 15-19 |
67,422 |
64,478 |
131,900 |
34,189 |
31,632 |
65,821 |
9,091 |
8,450 |
17,541 |
191 |
130 |
321 |
352 |
346 |
698 |
808 |
733 |
1,541 |
57 |
45 |
102 |
80 |
75 |
155 |
44,768 |
41,411 |
86,179 |
112,190 |
105,889 |
218,079 |
| 20-24 |
59,963 |
58,129 |
118,092 |
51,377 |
31,742 |
83,119 |
49,003 |
17,950 |
66,953 |
718 |
9,169 |
9,887 |
265 |
374 |
639 |
461 |
585 |
1,046 |
55 |
65 |
120 |
60 |
57 |
117 |
101,939 |
59,942 |
161,881 |
161,902 |
118,071 |
279,973 |
| 25-29 |
52,337 |
52,902 |
105,239 |
106,360 |
46,862 |
153,222 |
157,425 |
68,333 |
225,758 |
2,685 |
29,191 |
31,876 |
413 |
704 |
1,117 |
756 |
752 |
1,508 |
94 |
71 |
165 |
40 |
49 |
89 |
267,773 |
145,962 |
413,735 |
320,110 |
198,864 |
518,974 |
| 30-34 |
44,093 |
46,669 |
90,762 |
108,444 |
43,656 |
152,100 |
200,195 |
87,583 |
287,778 |
1,806 |
11,587 |
13,393 |
608 |
818 |
1,426 |
958 |
673 |
1,631 |
81 |
70 |
151 |
51 |
67 |
118 |
312,143 |
144,454 |
456,597 |
356,236 |
191,123 |
547,359 |
| 35-39 |
36,767 |
40,777 |
77,544 |
86,141 |
31,561 |
117,702 |
196,851 |
88,247 |
285,098 |
877 |
3,660 |
4,537 |
723 |
861 |
1,584 |
832 |
581 |
1,413 |
64 |
45 |
109 |
67 |
52 |
119 |
285,555 |
125,007 |
410,562 |
322,322 |
165,784 |
488,106 |
| 40-44 |
31,893 |
36,261 |
68,154 |
64,778 |
22,310 |
87,088 |
158,757 |
69,777 |
228,534 |
485 |
1,145 |
1,630 |
855 |
675 |
1,530 |
900 |
528 |
1,428 |
73 |
39 |
112 |
58 |
57 |
115 |
225,906 |
94,531 |
320,437 |
257,799 |
130,792 |
388,591 |
| 45-49 |
27,600 |
31,970 |
59,570 |
54,336 |
17,625 |
71,961 |
117,395 |
49,289 |
166,684 |
348 |
317 |
665 |
845 |
588 |
1,433 |
1,182 |
488 |
1,670 |
76 |
45 |
121 |
85 |
60 |
145 |
174,267 |
68,412 |
242,679 |
201,867 |
100,382 |
302,249 |
| 50-54 |
21,797 |
25,917 |
47,714 |
38,853 |
13,015 |
51,868 |
68,866 |
24,945 |
93,811 |
218 |
120 |
338 |
787 |
468 |
1,255 |
1,321 |
489 |
1,810 |
75 |
36 |
111 |
83 |
57 |
140 |
110,203 |
39,130 |
149,333 |
132,000 |
65,047 |
197,047 |
| 55-59 |
15,617 |
21,021 |
36,638 |
25,846 |
8,996 |
34,842 |
41,136 |
11,309 |
52,445 |
153 |
110 |
263 |
679 |
343 |
1,022 |
990 |
359 |
1,349 |
61 |
31 |
92 |
73 |
20 |
93 |
68,938 |
21,168 |
90,106 |
84,555 |
42,189 |
126,744 |
| 60-64 |
11,267 |
15,564 |
26,831 |
15,316 |
6,104 |
21,420 |
17,100 |
4,979 |
22,079 |
74 |
65 |
139 |
450 |
218 |
668 |
648 |
248 |
896 |
32 |
14 |
46 |
51 |
24 |
75 |
33,671 |
11,652 |
45,323 |
44,938 |
27,216 |
72,154 |
| >64 |
19,895 |
26,269 |
46,164 |
13,458 |
9,145 |
22,603 |
8,363 |
2,797 |
11,160 |
37 |
29 |
66 |
388 |
223 |
611 |
480 |
206 |
686 |
19 |
11 |
30 |
24 |
16 |
40 |
22,769 |
12,427 |
35,196 |
42,664 |
38,696 |
81,360 |
| Total |
626,256 |
649,601 |
1,275,857 |
743,393 |
399,271 |
1,142,664 |
1,081,193 |
488,274 |
1,569,467 |
8,092 |
56,022 |
64,114 |
8,111 |
7,314 |
15,425 |
12,684 |
8,580 |
21,264 |
847 |
612 |
1,459 |
959 |
784 |
1,743 |
1,855,279 |
960,857 |
2,816,136 |
2,481,535 |
1,610,458 |
4,091,993 |
Source: PACI
ANNEXED NOTE
1. Characteristics of data and definitions
The source of data used here is the Public Authority for Civil Information (PACI), an independant government body in charge of :
1- centralising all population and labour force data in order to manage a fully computerised population register
2- issuing mandatory civil identification cards to every resident of the country, regardless of age and nationality.
The other source of demographic and socioeconomic data on Kuwait is the Central Statistical Office (CSO), operating within the Planning Ministry. The CSO has conducted ten population and housing censuses since its inception in 1957.
Since 1995 a marked discrepancy was witnessed between PACI’ and CSO’ population figures. PACI’ database is connected electronically with other administrations and bodies registering demographic events and professional/ residency issues (births and death; departures and arrivals; end of service, residency and ID deliveries, etc.).
PACI’s records of residents’ movements is thus regularly updated, which limits the risk of population overcount. Therefore, it is more likely that residents were undercounted during CSO- Ministry of Planning’s census operations (see: Shah, N. Population of Kuwait. Structure and Dynamics, Kuwait: Kuwait University Academic Publication Council, 2010, chapter 1).
(a) Kuwaiti: the Kuwaiti nationality rests upon a document of Kuwaiti nationality or a certificate proving Kuwaiti nationality issued by the Ministry of Interior of Kuwait.
(b) Non-Kuwaiti: his/ her nationality is determined by the name of the State which issued the passport. The foreign national also entered Kuwait legally and has a stamp of residence.
This category includes the Bidoon, a category of stateless persons living in the Emirate. Kuwait’s Bidoon population originates from three broad categories:
1) those whose ancestors failed to apply for nationality or lacked necessary documentation at the time of Kuwait’s independence in 1961;
2) those recruited to work in Kuwait’s army or police force during the 1960s who permanently settled in Kuwait, along with their families;
3) children of Kuwaiti mothers and stateless or foreign fathers (see Human Rights Watch. Prisoners of the Past. Kuwaiti Bidun and the Burden of Statelessness, June 2011, p. 3).
(The children of Kuwaiti mothers and non-Kuwaiti fathers (with specific nationality) inherit the father’s nationality. They are stateless if the father is stateless).
(c) Nationality group: collected according to the nationality of the head of the household.
Nationalities are grouped according to specific features common to certain population subgroups: language, geographic origin, etc. or according to internationally recognized categories such as: (Arab / non-Arab Asian countries / non-Arab African countries; European countries … etc.).
2. Institution which provides data
The Public Authority for Civil Information (PACI)
3. Period of data coverage: 31 December 2014
The database is updated three times a year and the website presents only the most recent data.
4. Data availability
The statistics section of PACI’s website (http://www.paci.gov.kw/en/ (English); http://www.paci.gov.kw/ (Arabic)) provides population and socio-economic data broken down by nationality (Kuwaiti/ non-Kuwaiti). Some data are displayed by nationality groups.
Analytical tables and data crosstabulations are available for download in PDF, html, .png and Excel (.csv) formats.
Date of access: March 2015
| Country |
Population |
% of total population |
| India |
545,000 |
23.580 |
| Nepal |
400,000 |
17.300 |
| Qatar |
278,000 |
12.030 |
| Philippines |
200,000 |
8.650 |
| Egypt |
180,000 |
7.780 |
| Bangladesh |
150,000 |
6.490 |
| Sri Lanka |
100,000 |
4.330 |
| Pakistan |
90,000 |
3.890 |
| Sudan |
42,000 |
1.820 |
| Jordan |
40,000 |
1.720 |
| Indonesia |
39,000 |
1.680 |
| Iran |
30,000 |
1.300 |
| Lebanon |
25,000 |
1.080 |
| Ethiopia |
21,374 |
0.920 |
| Palestine |
20,500 |
0.890 |
| UK |
20,000 |
0.865 |
| USA |
15,000 |
0.650 |
| Tunisia |
15,000 |
0.650 |
| Kenya |
9,300 |
0.400 |
| Eritrea |
9,000 |
0.390 |
| Morocco |
9,000 |
0.390 |
| Iraq |
8,976 |
0.390 |
| Nigeria |
7,502 |
0.325 |
| Canada |
7,250 |
0.310 |
| China |
6,000 |
0.260 |
| Malaysia |
5,000 |
0.216 |
| Russia |
5,000 |
0.216 |
| South Africa |
5,000 |
0.216 |
| Turkey |
5,000 |
0.216 |
| Australia |
4,500 |
0.195 |
| France |
3,607 |
0.160 |
| Afghanistan |
3,500 |
0.150 |
| Thailand |
3,000 |
0.130 |
| Spain |
2,500 |
0.110 |
| South Korea |
2,000 |
0.086 |
| Germany |
1,700 |
0.070 |
| Greece |
1,504 |
0.065 |
| Netherlands |
1,350 |
0.058 |
| Japan |
1,000 |
0.044 |
| Macedonia |
1,000 |
0.044 |
| Romania |
1,000 |
0.044 |
| Italy |
900 |
0.039 |
| Brazil |
800 |
0.034 |
| Bulgaria |
600 |
0.025 |
| Austria |
500 |
0.021 |
| Belgium |
500 |
0.021 |
| Bosnia and Herzegovina |
500 |
0.021 |
| Croatia |
430 |
0.019 |
| Venezuela |
337 |
0.013 |
| Hungary |
300 |
0.013 |
| Singapore |
300 |
0.012 |
| Switzerland |
250 |
0.010 |
| Senegal |
200 |
0.008 |
| Gambia |
135 |
0.006 |
| Azerbaijan |
120 |
0.005 |
| Ecuador |
100 |
0.005 |
| Kazakhstan |
100 |
0.004 |
| El Salvador |
100 |
0.004 |
| Benin |
82 |
0.004 |
| Finland |
80 |
0.004 |
| Dominican Republic |
44 |
0.002 |
| Liberia |
40 |
0.002 |
| Brunei |
20 |
0.001 |
Source: Foreign embassies in Qatar and press quotes, in BQ Magazine
ANNEXED NOTE
1. Technical Notes and Definitions
The data has been compiled by BQ magazine. The present data was published by BQ on December 7, 2014.
Here are some excerpts of BQ’s article introducing the data and sources:
“The Ministry of Interior also does not provide these statistics to the public, it however does seem to make it available to the Embassies,
as some of them have told bq magazine the figures were given to them by the aforementioned Ministry.
To overcome the hurdle of acquiring this information, bq magazine has used an alternative way to gather information on Qatar´s population by nationality.
All the data comes from the Embassies of respective countries – either by the information given to us directly by them via email or telephone,
or alternatively by gathering the numbers from Ambassadors who have been quoted by various media disclosing the number of their nationals in Qatar.
The vast majority of data is from 2014.”
(…)
“There are a number of nationalities missing, some of which could potentially be present in significant numbers in Qatar.
Those of Syria, Somalia, Algeria and Yemen being some of the likely ones.
The reason for us not publishing the data is because not all Embassies were willing to disclose this information,
simply did not possess the information or in some cases were not possible to get in contact with.” (…)
2. Institution which provides data
BQ Magazine, a monthly business newspaper published in Doha, Qatar http://www.bqdoha.com/
3. Data availability
The data is taken from:
Snoj, Jure. “Population of Qatar by nationality”, BQ Magazine, Doha, December 2014.
http://www.bqdoha.com/2013/12/population-qatar
Date of access: March 2015.
| |
date/ period |
Total population |
Nationals |
Non-nationals |
% in total population |
| Country |
Nationals |
Non-nationals |
| Bahrain (1) |
mid-2014 |
1,314,562 |
630,744 |
683,818 |
48.0 |
52.0 |
| Kuwait (2) |
31 March 2015 |
4,161,404 |
1,283,726 |
2,877,678 |
30.8 |
69.2 |
| Oman (3) |
25 March 2015 |
4,149,917 |
2,324,327 |
1,825,590 |
56.0 |
44.0 |
| Qatar (4) |
April 2010 |
1,699,435 |
243,019 |
1,456,416 |
14.3 |
85.7 |
| Saudi Arabia (5) |
mid-2014 |
30,770,375 |
20,702,536 |
10,067,839 |
67.3 |
32.7 |
| United Arab Emirates (6) |
mid-2010 |
8,264,070 |
947,997 |
7,316,073 |
11.5 |
88.5 |
| Total* |
|
50,359,763 |
26,132,349 |
24,227,414 |
51.9 |
48.1 |
Sources: national institutes of statistics, latest year or period available as of 31 March 2015.
* Total provides the sum of population numbers at different dates between April 2010 and March 2015. It is not exactly the total population at any of these dates.
1- Definition:
Non-nationals are:
1- persons bearing nationality of a foreign State other than the GCC State of residence, or bearing no proof of nationality from any given state (stateless persons and holders of refugee status and travel document in a third country) ;
2- Holders of residence permit residing in the given GCC country at date of census, as per definition of residence used in each of the countries.
Figures for Bahrain, Saudi Arabia and the UAE are estimates.
2- Sources of data:
(1) Bahrain Central Informatics Organisation (CIO), CIO’s website, “Statistics” and “Population” sections http://www.data.gov.bh/en/ResourceCenter
(2) Kuwait Public Authority for Civil Information (PACI), Homepage as of 31 March 2015, http://www.paci.gov.kw/en/
(3) National Centre for Statistical Information (NCSI), homepage as of March 5, 2015, http://www.ncsi.gov.om/NCSI_website/N_default.aspx;
(4) Qatar Statistics Authority (QSA), Census 2010, http://gulfmigration.eu/population-by-nationality-qatari-non-qatari-census-1970-2010/;
(5) Saudi Arabia Central Department for Statistics and Information (CDSI), estimates. http://www.cdsi.gov.sa/
(6) UAE National Bureau of Statistics (NBS), estimates. http://www.uaestatistics.gov.ae/EnglishHome/ReportDetailsEnglish/tabid/121/Default.aspx?ItemId=1914&PTID=104&MenuId=1
|
|
|
% in total population |
| Country |
date/ period |
Total population |
Nationals |
Non-nationals |
| Bahrain (1) |
mid-2014 |
1,314,562 |
48.0 |
52.0 |
| Kuwait (2) |
31 March 2015 |
4,161,404 |
30.8 |
69.2 |
| Oman (3) |
25 March 2015 |
4,149,917 |
56.0 |
44.0 |
| Qatar (4) |
April 2010 |
1,699,435 |
14.3 |
85.7 |
| Saudi Arabia (5) |
mid-2014 |
30,770,375 |
67.3 |
32.7 |
| United Arab Emirates (6) |
mid-2010 |
8,264,070 |
11.5 |
88.5 |
| Total* |
|
50,359,763 |
51.9 |
48.1 |
Sources: national institutes of statistics, latest year or period available as of 31 March 2015.
* Total provides the sum of population numbers at different dates between April 2010 and March 2015. It is not exactly the total population at any of these dates.
1- Definition:
Non-nationals are:
1- persons bearing nationality of a foreign State other than the GCC State of residence, or bearing no proof of nationality from any given state (stateless persons and holders of refugee status and travel document in a third country) ;
2- Holders of residence permit residing in the given GCC country at date of census, as per definition of residence used in each of the countries.
Figures for Bahrain, Saudi Arabia and the UAE are estimates.
2- Sources of data:
(1) Bahrain Central Informatics Organisation (CIO), CIO’s website, “Statistics” and “Population” sections http://www.data.gov.bh/en/ResourceCenter
(2) Kuwait Public Authority for Civil Information (PACI), Homepage as of 31 March 2015, http://www.paci.gov.kw/en/
(3) National Centre for Statistical Information (NCSI), homepage as of March 5, 2015, http://www.ncsi.gov.om/NCSI_website/N_default.aspx;
(4) Qatar Statistics Authority (QSA), Census 2010, http://gulfmigration.eu/population-by-nationality-qatari-non-qatari-census-1970-2010/;
(5) Saudi Arabia Central Department for Statistics and Information (CDSI), estimates. http://www.cdsi.gov.sa/
(6) UAE National Bureau of Statistics (NBS), estimates. http://www.uaestatistics.gov.ae/EnglishHome/ReportDetailsEnglish/tabid/121/Default.aspx?ItemId=1914&PTID=104&MenuId=1
| |
Country of residence and year of reference |
| Country of |
Bahrain |
Kuwait |
Oman |
Qatar |
Saudi Arabia |
UAE |
| origin |
2014 |
end 2012 |
2010 |
2013-2014 |
2013 |
2013-2014 |
| Algeria |
n.d. |
845 |
n.d. |
n.d. |
n.d. |
10,000 (e) |
| Egypt |
20,000 |
482,692 |
29,877 |
18,0000 (b) |
1,370,000 (d) |
400,000 (e) |
| Iraq |
n.d. |
15,262 |
4,159 |
8,976 |
20,000 |
52,000 (e) |
| Jordan |
7,000 |
55,081 |
7,403 |
40,000 (b) |
250,000 |
200,000 (e) |
| Lebanon |
2,300 (a) |
42,586 |
n.d. |
25,000 (b) |
160,000 |
100,000 (e) |
| Mauritania |
n.d. |
142 |
n.d. |
n.d. |
n.d. |
5,000 (e) |
| Morocco |
800 (a) |
3,495 |
n.d. |
9,000 (b) |
20,000 (a) |
14,000 |
| Palestine |
5000 (a) |
8,072 |
n.d. |
20,500 (b) |
500,000 |
150,000 (e) |
| Sudan |
14000 (a) |
4,551 |
6,867 |
42,000 (b) |
500,000 |
75,000 (e) |
| Syria |
3,000 |
135,554 |
n.d. |
60,000 (c) |
1,000,000 (c) |
242,000 (c) |
| Tunisia |
500 (a) |
2,863 |
n.d. |
15,000 (b) |
12,000 (a) |
4,500 |
| Yemen |
4,700 |
10,762 |
n.d. |
40,000 (a) |
800,000 |
90,000 (e) |
Sources: GLMM and other sources (see below)
ANNEXED NOTE
Sources and Definitions
Figures of migrants in the GCC may be overestimated due to its comprising a large share of Gulf-born (second- and third- generation) non-nationals.
Palestinians are holders of travel documents.
Some of the figures quoted are unverifiable estimates. Therefore, they should be taken as indicative only and should not be used for statistical purposes.
Sources: unless stated otherwise, receiving countries’ estimates in relevant tables in the POP section of the GLMM database.
(a) UN/ DESA 2013 revision total migrants’ stocks by origin and destination countries
(b) Snoj, Jure. “Population of Qatar by nationality”, BQ Magazine, Doha, December 2014.
http://www.bqdoha.com/2013/12/population-qatar
http://gulfmigration.eu/qatar-estimates-of-foreign-nationals-residing-in-qatar-by-country-of-citizenship-selected-countries-2014/
(c) latest figures available as of October 2015, in: De Bel-Air, F. “A Note on Syrian Refugees in the Gulf: Attempting to Assess Data and Policies,” GLMM Explanatory Note, GLMM – EN – No. 11/2015 http://gulfmigration.eu/media/pubs/exno/GLMM_EN_2015_11.pdf
(d) Official estimate: Egyptian workers in Saudi Arabia number 968,000 (end of 2013).
https://www.middleeastmonitor.com/news/africa/14187-egyptians-represent-40-per-cent-of-saudi-arabias-total-expatriate-workforce
“Estimates of family dependents: in the absence of any indication of the ratio of worker to family
dependents in the UAE, we use data available for Kuwait in 2012:”
2.4 workers per family dependent.
Estimates of Egyptians (total): 968,000+(968,000/2.4)= 1,371,000
(e) Snoj, Jure. “UAE’s population- by nationality”, BQ Magazine, Doha, April 12, 2015.
http://www.bq-magazine.com/economy/socioeconomics/2015/04/uae-population-by-nationality
Table as of December 15, 2015.
|
2005 |
2006 |
2007 |
2008 |
2009 |
2010 |
2011 |
2012 |
2013 |
| Afghanistan |
|
|
|
|
|
|
|
|
|
| Albania |
|
|
|
|
|
|
|
|
|
| Algeria |
|
|
|
|
|
|
|
|
|
| American Samoa |
|
|
|
|
|
|
|
|
|
| Andorra |
|
|
|
|
|
|
|
|
|
| Angola |
|
|
|
|
|
|
|
|
|
| Anguilla |
|
|
|
|
|
|
|
|
|
| Antigua and Barbuda |
|
|
|
|
|
|
|
|
|
| Argentina |
|
|
|
|
|
|
|
|
|
| Armenia |
|
|
|
|
|
|
|
|
|
| Aruba |
|
|
|
|
|
|
|
|
|
| Australia |
944 |
1,002 |
1,120 |
1,184 |
1,342 |
1,433 |
1,313 |
1,133 |
|
| Austria |
|
|
|
3 |
3 |
2 |
1 |
1 |
|
| Azerbaijan |
|
|
|
|
|
|
|
|
|
| Bahamas |
|
|
|
|
|
|
|
|
|
| Bahrain |
|
5 |
|
|
|
|
29 |
12 |
|
| Bangladesh |
|
|
|
|
|
|
|
|
|
| Barbados |
|
|
|
|
|
|
|
|
|
| Belarus |
|
|
|
|
|
|
|
|
|
| Belgium |
3 |
2 |
2 |
|
7 |
|
1 |
2 |
|
| Belize |
|
|
|
|
|
|
|
|
|
| Benin |
|
|
|
|
|
|
|
|
|
| Bermuda |
|
|
|
|
|
|
|
|
|
| Bhutan |
|
|
|
|
|
|
|
|
|
| Bolivia (Plurinational State of) |
|
|
|
|
|
|
|
|
|
| Bosnia and Herzegovina |
|
|
|
|
|
|
|
|
|
| Botswana |
|
|
|
|
|
|
|
|
|
| Brazil |
|
|
|
|
3 |
1 |
|
|
|
| British Virgin Islands |
|
|
|
|
|
|
|
|
|
| Brunei Darussalam |
|
|
|
|
|
|
|
|
|
| Bulgaria |
2 |
|
|
1 |
3 |
6 |
4 |
3 |
|
| Burkina Faso |
|
|
|
|
|
|
|
|
|
| Burundi |
|
|
|
|
|
|
|
|
|
| Cambodia |
|
|
|
|
|
|
|
|
|
| Cameroon |
|
|
|
|
|
|
|
|
|
| Canada |
204 |
573 |
227 |
222 |
237 |
249 |
255 |
|
|
| Cabo Verde |
|
|
|
|
|
|
|
|
|
| Cayman Islands |
|
|
|
|
|
|
|
|
|
| Central African Republic |
|
|
|
|
|
|
|
|
|
| Chad |
|
|
|
|
|
|
|
|
|
| Chile |
|
|
|
|
|
|
|
|
|
| China |
|
|
|
|
|
|
|
|
|
| China, Hong Kong Special Administrative Region |
|
|
|
|
|
|
|
|
|
| China, Macao Special Administrative Region |
|
|
|
|
|
|
|
|
|
| Colombia |
|
|
|
|
|
|
|
|
|
| Comoros |
|
|
|
|
|
|
|
|
|
| Congo |
|
|
|
|
|
|
|
|
|
| Cook Islands |
|
|
|
|
|
|
|
|
|
| Costa Rica |
|
|
|
|
|
|
|
|
|
| Côte d’Ivoire |
|
|
|
|
|
|
|
|
|
| Croatia |
|
|
|
|
|
2 |
|
1 |
|
| Cuba |
|
|
|
|
|
|
|
|
|
| Curaçao |
|
|
|
|
|
|
|
|
|
| Cyprus |
|
4 |
5 |
1 |
1 |
|
|
|
|
| Czech Republic |
6 |
3 |
2 |
2 |
|
2 |
2 |
2 |
|
| Democratic People’s Republic of Korea |
|
|
|
|
|
|
|
|
|
| Democratic Republic of the Congo |
|
|
|
|
|
|
|
|
|
| Denmark |
3 |
4 |
6 |
|
2 |
2 |
5 |
4 |
|
| Djibouti |
|
|
|
|
|
|
|
|
|
| Dominica |
|
|
|
|
|
|
|
|
|
| Dominican Republic |
|
|
|
|
|
|
|
|
|
| Ecuador |
|
|
|
|
|
|
|
|
|
| Egypt |
|
|
|
|
|
|
|
|
|
| El Salvador |
|
|
1 |
|
|
|
|
|
|
| Equatorial Guinea |
|
|
|
|
|
|
|
|
|
| Eritrea |
|
|
|
|
|
|
|
|
|
| Estonia |
|
|
|
|
|
|
|
|
|
| Ethiopia |
|
|
|
|
|
|
|
|
|
| Faeroe Islands |
|
|
|
|
|
|
|
|
|
| Falkland Islands (Malvinas) |
|
|
|
|
|
|
|
|
|
| Fiji |
|
|
|
|
|
|
|
|
|
| Finland |
|
|
|
|
|
|
|
3 |
|
| France |
40 |
70 |
78 |
166 |
194 |
265 |
536 |
248 |
|
| French Guiana |
|
|
|
|
|
|
|
|
|
| French Polynesia |
|
|
|
|
|
|
|
|
|
| Gabon |
|
|
|
|
|
|
|
|
|
| Gambia |
|
|
|
|
|
|
|
|
|
| Georgia |
|
|
|
|
|
|
|
|
|
| Germany |
31 |
65 |
95 |
64 |
55 |
69 |
57 |
89 |
|
| Ghana |
|
|
|
|
|
|
|
|
|
| Gibraltar |
|
|
|
|
|
|
|
|
|
| Greece |
|
1 |
|
|
|
|
2 |
|
|
| Grenada |
|
|
|
|
|
|
|
|
|
| Guadeloupe |
|
|
|
|
|
|
|
|
|
| Guam |
|
|
|
|
|
|
|
|
|
| Guatemala |
|
|
|
|
|
|
|
|
|
| Guinea |
|
|
|
|
|
|
|
|
|
| Guinea-Bissau |
|
|
|
|
|
|
|
|
|
| Guyana |
|
|
|
|
|
|
|
|
|
| Haiti |
|
|
|
|
|
|
|
|
|
| Holy See |
|
|
|
|
|
|
|
|
|
| Honduras |
|
|
|
|
|
|
|
|
|
| Hungary |
3 |
1 |
6 |
3 |
13 |
4 |
7 |
3 |
|
| Iceland |
|
|
|
|
|
|
|
|
|
| India |
867 |
1,110 |
|
|
|
|
490 |
748 |
|
| Indonesia |
|
|
|
|
|
|
|
|
|
| Iran (Islamic Republic of) |
|
6 |
6 |
1 |
|
|
11 |
1 |
|
| Iraq |
|
|
|
|
|
|
|
|
|
| Ireland |
134 |
85 |
132 |
88 |
121 |
134 |
110 |
100 |
|
| Israel |
|
|
|
|
|
|
|
|
|
| Italy |
1 |
5 |
6 |
14 |
11 |
4 |
6 |
11 |
|
| Jamaica |
|
|
|
|
|
|
|
|
|
| Japan |
11 |
12 |
12 |
8 |
9 |
13 |
31 |
43 |
|
| Jordan |
89 |
96 |
74 |
195 |
87 |
81 |
59 |
58 |
|
| Kazakhstan |
|
|
1 |
|
|
|
|
|
|
| Kenya |
|
|
|
|
|
|
|
|
|
| Kiribati |
|
|
|
|
|
|
|
|
|
| Kuwait |
|
|
|
5 |
6 |
|
|
|
|
| Kyrgyzstan |
|
|
|
|
|
|
|
|
|
| Lao People’s Democratic Republic |
|
|
|
|
|
|
|
|
|
| Latvia |
|
|
|
|
|
|
|
|
|
| Lebanon |
|
|
|
|
|
|
|
|
|
| Lesotho |
|
|
|
|
|
|
|
|
|
| Liberia |
|
|
|
|
|
|
|
|
|
| Libya |
|
|
|
|
|
|
|
|
|
| Liechtenstein |
|
|
|
|
|
|
|
|
|
| Lithuania |
|
|
|
|
|
|
|
|
|
| Luxembourg |
|
|
|
|
|
|
|
|
|
| Madagascar |
|
|
|
|
|
|
|
|
|
| Malawi |
|
|
|
|
|
|
|
|
|
| Malaysia |
|
9 |
18 |
56 |
49 |
55 |
54 |
62 |
|
| Maldives |
|
|
|
|
|
|
|
|
|
| Mali |
|
|
|
|
|
|
|
|
|
| Malta |
1 |
|
|
|
|
|
|
|
|
| Marshall Islands |
|
|
|
|
|
|
|
|
|
| Martinique |
|
|
|
|
|
|
|
|
|
| Mauritania |
|
|
|
|
|
|
|
|
|
| Mauritius |
|
|
|
|
|
|
|
1 |
1 |
| Mexico |
|
|
|
|
|
|
|
|
|
| Micronesia (Federated States of) |
|
|
|
|
|
|
|
|
|
| Monaco |
|
|
|
|
|
|
|
|
|
| Mongolia |
|
|
|
|
|
|
|
|
|
| Montenegro |
|
|
|
|
|
|
|
|
|
| Montserrat |
|
|
|
|
|
|
|
|
|
| Morocco |
15 |
48 |
55 |
50 |
73 |
92 |
|
|
|
| Mozambique |
|
|
|
|
|
|
|
|
|
| Myanmar |
|
|
|
|
|
|
|
|
|
| Namibia |
|
|
|
|
|
|
|
|
|
| Nauru |
|
|
|
|
|
|
|
|
|
| Nepal |
|
|
|
|
|
|
|
|
|
| Netherlands |
2 |
2 |
1 |
|
|
|
|
|
|
| Nl Antilles |
|
|
|
|
|
|
|
|
|
| New Caledonia |
|
|
|
|
|
|
|
|
|
| New Zealand |
7 |
|
31 |
34 |
37 |
48 |
39 |
34 |
|
| Nicaragua |
|
|
|
|
|
|
|
|
|
| Niger |
|
|
|
|
|
|
|
|
|
| Nigeria |
|
|
|
|
|
|
|
|
|
| Niue |
|
|
|
|
|
|
|
|
|
| Norfolk Island |
|
|
|
|
|
|
|
|
|
| Norway |
|
|
|
|
|
|
|
|
|
| Oman |
|
7 |
7 |
145 |
|
155 |
179 |
|
216 |
| Pakistan |
|
|
|
|
|
|
|
|
|
| Palau |
|
|
|
|
|
|
|
|
|
| Palestine |
|
|
|
|
|
|
|
|
|
| Panama |
|
|
|
|
|
|
|
|
|
| Papua New Guinea |
|
|
|
|
|
|
|
|
|
| Paraguay |
|
|
|
|
|
|
|
|
|
| Peru |
|
|
|
|
|
|
|
|
|
| Philippines |
|
2 |
|
|
|
|
|
|
|
| Poland |
5 |
2 |
3 |
3 |
2 |
6 |
6 |
6 |
|
| Portugal |
|
|
|
|
|
|
|
2 |
|
| Puerto Rico |
|
|
|
|
|
|
|
|
|
| Qatar |
46 |
|
|
35 |
31 |
36 |
38 |
43 |
45 |
| Republic of Korea |
|
|
1 |
2 |
3 |
7 |
6 |
25 |
|
| Republic of Moldova |
|
|
|
1 |
|
|
2 |
3 |
2 |
| Réunion |
|
|
|
|
|
|
|
|
|
| Romania |
14 |
8 |
10 |
9 |
7 |
9 |
7 |
|
|
| Russian Federation |
|
|
|
|
11 |
|
1 |
|
|
| Rwanda |
|
|
|
|
|
|
|
|
|
| Saint Helena |
|
|
|
|
|
|
|
|
|
| Saint Kitts and Nevis |
|
|
|
|
|
|
|
|
|
| Saint Lucia |
|
|
|
|
|
|
|
|
|
| Saint Pierre and Miquelon |
|
|
|
|
|
|
|
|
|
| Saint Vincent and the Grenadines |
|
|
|
|
|
|
|
|
|
| Samoa |
|
|
|
|
|
|
|
|
|
| San Marino |
|
|
|
|
|
|
|
|
|
| Sao Tome and Principe |
|
|
|
|
|
|
|
|
|
| Saudi Arabia |
55 |
47 |
51 |
54 |
57 |
3 |
69 |
92 |
160 |
| Senegal |
|
|
|
|
|
|
|
|
|
| Serbia |
|
|
|
|
|
|
|
|
|
| Seychelles |
|
|
|
|
|
|
|
|
|
| Sierra Leone |
|
|
|
|
|
|
|
|
|
| Singapore |
|
|
|
|
|
|
|
|
|
| Sint Maarten (Dutch part) |
|
|
|
|
|
|
|
|
|
| Slovakia |
31 |
18 |
8 |
6 |
5 |
3 |
2 |
2 |
|
| Slovenia |
|
|
2 |
1 |
|
|
1 |
|
|
| Solomon Islands |
|
|
|
|
|
|
|
|
|
| Somalia |
|
|
|
|
|
|
|
|
|
| South Africa |
|
|
|
|
|
|
74 |
10 |
|
| South Sudan |
|
|
|
|
|
|
|
|
|
| Spain |
9 |
9 |
7 |
12 |
13 |
5 |
8 |
13 |
|
| Sri Lanka |
|
|
|
|
|
|
|
|
|
| Sudan |
|
|
|
|
|
|
|
|
|
| Sudan (pre-secession) |
|
|
|
|
|
|
|
|
|
| Suriname |
|
|
|
|
|
|
|
|
|
| Swaziland |
|
|
|
|
|
|
|
|
|
| Sweden |
|
|
|
1 |
4 |
2 |
4 |
2 |
|
| Switzerland |
4 |
13 |
11 |
13 |
16 |
23 |
30 |
33 |
|
| Syrian Arab Republic |
|
|
|
|
|
|
|
|
|
| Tajikistan |
|
|
1 |
|
2 |
|
|
|
|
| Thailand |
|
3 |
|
|
2 |
4 |
3 |
4 |
|
| The former Yugoslav Republic of Macedonia |
|
|
|
|
|
|
|
|
|
| Timor-Leste |
|
|
|
|
|
|
|
|
|
| Togo |
|
|
|
|
|
|
|
|
|
| Tokelau |
|
|
|
|
|
|
|
|
|
| Tonga |
|
|
|
|
|
|
|
|
|
| Trinidad and Tobago |
|
|
|
|
|
|
|
|
|
| Tunisia |
|
|
|
|
|
|
|
|
|
| Turkey |
|
|
|
1 |
4 |
9 |
15 |
7 |
|
| Turkmenistan |
|
|
|
|
|
|
|
|
|
| Turks and Caicos Islands |
|
|
|
|
|
|
|
|
|
| Tuvalu |
|
|
|
|
|
|
|
|
|
| Uganda |
|
|
|
|
|
|
|
|
|
| Ukraine |
|
|
|
|
|
|
|
|
|
| United Arab Emirates |
|
|
|
|
|
|
|
|
|
| United Kingdom of Great Britain and Northern Ireland |
1,803 |
2,074 |
2,218 |
2,309 |
2,696 |
2,975 |
2,995 |
3,089 |
|
| United Republic of Tanzania |
|
|
|
|
|
|
|
|
|
| United States of America |
1,209 |
1,013 |
905 |
984 |
1,198 |
1,638 |
1,835 |
2,031 |
|
| United States Virgin Islands |
|
|
|
|
|
|
|
|
|
| Uruguay |
|
|
|
|
|
|
|
|
|
| Uzbekistan |
|
|
|
|
|
|
|
|
|
| Vanuatu |
|
|
|
|
|
|
|
|
|
| Venezuela |
|
|
|
|
|
|
|
|
|
| Viet Nam |
|
|
|
|
|
|
|
|
|
| Western Sahara |
|
|
|
|
|
|
|
|
|
| Yemen |
|
|
|
|
|
|
|
|
|
| Zambia |
|
|
|
|
|
|
|
|
|
| Zimbabwe |
|
|
|
|
|
|
|
1 |
|
Source: UNESCO, UIS
ANNEXED NOTE
1. Technical Notes and Definitions
The table refers to students enrolled in tertiary education (ISCED: levels 5, 6 and beyond)
Education statistics are compiled by UNESCO on the basis of national administrative sources, reported by Ministries of Education or National Statistical Offices of receiving countries.
The number of students enrolled refers to the count of students studying in the reference period.
Students are classified as international students if they left their country of origin and moved to another country for the purpose of study. Figures of mobile students are therefore different from figures of foreign students, who may be studying in the country they were residing prior to enrolling in higher education.
Germany: Data for the years 2008 and beyond are UIS estimates.
Absence of any data for a given country most often reflects “nil or negligible values” pertaining to the mobile students’ nationality.
2. Institution which provides data
Unesco Institute of Statistics (UIS), UNESCO.
3. Data availability
The data was extracted from UIS database UIS.Stat
http://data.uis.unesco.org/
“Education”
“International student mobility in tertiary education”
Topic:”Inbound students”
Sub-topic: “Inbound internationally mobile students by country of origin”
Similar data are also available from OECD and Eurostats databases, for immigration countries relevant to both institutions (OECD countries, EU-28 countries).
Last date of access: March 2015
| Time |
2005 |
2006 |
2007 |
2008 |
2009 |
2010 |
2011 |
2012 |
2013 |
| Afghanistan |
|
|
|
|
|
|
|
|
|
| Albania |
|
|
|
|
|
|
|
|
|
| Algeria |
|
|
|
|
|
|
|
|
|
| American Samoa |
|
|
|
|
|
|
|
|
|
| Andorra |
|
|
|
|
|
|
|
|
|
| Angola |
|
|
|
|
|
|
|
|
|
| Anguilla |
|
|
|
|
|
|
|
|
|
| Antigua and Barbuda |
|
|
|
|
|
|
|
|
|
| Argentina |
|
|
|
|
|
|
|
|
|
| Armenia |
|
|
|
|
|
|
|
|
|
| Aruba |
|
|
|
|
|
|
|
|
|
| Australia |
439 |
782 |
1,244 |
1,929 |
3,676 |
5,403 |
5,886 |
5,392 |
|
| Austria |
|
16 |
15 |
33 |
35 |
30 |
37 |
22 |
|
| Azerbaijan |
|
2 |
1 |
2 |
|
|
|
1 |
|
| Bahamas |
|
|
|
|
|
|
|
|
|
| Bahrain |
9 |
226 |
|
|
|
|
1,073 |
494 |
|
| Bangladesh |
|
|
|
|
|
|
|
|
|
| Barbados |
|
|
|
|
|
|
|
|
|
| Belarus |
3 |
3 |
3 |
1 |
1 |
2 |
|
2 |
1 |
| Belgium |
3 |
3 |
1 |
|
1 |
3 |
3 |
4 |
|
| Belize |
|
|
|
|
|
|
|
|
|
| Benin |
|
|
|
|
|
|
|
|
|
| Bermuda |
|
|
|
|
|
|
|
|
|
| Bhutan |
|
|
|
|
|
|
|
|
|
| Bolivia (Plurinational State of) |
|
|
|
|
|
|
|
|
|
| Bosnia and Herzegovina |
|
|
|
|
|
|
|
|
3 |
| Botswana |
|
|
|
|
|
|
|
|
|
| Brazil |
|
|
|
|
2 |
3 |
2 |
2 |
|
| British Virgin Islands |
|
|
|
|
|
|
|
|
|
| Brunei Darussalam |
|
|
|
|
|
|
|
|
|
| Bulgaria |
|
|
|
|
|
|
|
2 |
|
| Burkina Faso |
|
|
|
|
|
|
|
|
|
| Burundi |
|
|
|
|
|
|
|
|
|
| Cambodia |
|
|
|
|
|
|
|
|
|
| Cameroon |
|
|
|
|
|
|
|
|
|
| Canada |
897 |
654 |
1,017 |
1,266 |
1,599 |
2,361 |
3,168 |
|
|
| Cabo Verde |
|
|
|
|
|
|
|
|
|
| Cayman Islands |
|
|
|
|
|
|
|
|
|
| Central African Republic |
|
|
|
|
|
|
|
|
|
| Chad |
|
|
|
|
|
|
|
|
|
| Chile |
|
|
|
|
|
|
|
|
|
| China |
|
|
|
|
|
|
|
|
|
| China, Hong Kong Special Administrative Region |
|
|
|
|
|
|
|
|
|
| China, Macao Special Administrative Region |
|
|
|
|
|
|
|
|
|
| Colombia |
|
|
|
|
|
|
|
|
|
| Comoros |
|
|
|
|
|
|
|
|
|
| Congo |
|
|
|
|
|
|
|
|
|
| Cook Islands |
|
|
|
|
|
|
|
|
|
| Costa Rica |
|
|
|
1 |
|
|
|
|
|
| Côte d’Ivoire |
|
|
|
|
|
|
|
|
|
| Croatia |
|
|
|
|
|
|
|
|
|
| Cuba |
|
|
|
|
1 |
1 |
1 |
1 |
|
| Curaçao |
|
|
|
|
|
|
|
|
|
| Cyprus |
3 |
6 |
5 |
2 |
4 |
5 |
3 |
1 |
|
| Czech Republic |
27 |
18 |
18 |
14 |
15 |
16 |
12 |
38 |
|
| Democratic People’s Republic of Korea |
|
|
|
|
|
|
|
|
|
| Democratic Republic of the Congo |
|
|
|
|
|
|
|
|
|
| Denmark |
6 |
4 |
3 |
|
1 |
2 |
|
1 |
|
| Djibouti |
|
|
|
|
|
|
|
|
|
| Dominica |
|
|
|
|
|
|
|
|
|
| Dominican Republic |
|
|
|
|
|
|
|
1 |
|
| Ecuador |
|
|
|
|
|
|
|
|
|
| Egypt |
|
|
|
|
|
|
|
|
|
| El Salvador |
|
|
|
|
|
|
|
1 |
|
| Equatorial Guinea |
|
|
|
|
|
|
|
|
|
| Eritrea |
|
|
|
|
|
|
|
|
|
| Estonia |
|
|
|
|
|
|
|
|
|
| Ethiopia |
|
|
|
|
|
|
|
|
|
| Faeroe Islands |
|
|
|
|
|
|
|
|
|
| Falkland Islands (Malvinas) |
|
|
|
|
|
|
|
|
|
| Fiji |
|
|
|
|
|
|
|
|
|
| Finland |
|
|
|
|
|
1 |
|
1 |
|
| France |
127 |
100 |
208 |
263 |
403 |
483 |
223 |
539 |
|
| French Guiana |
|
|
|
|
|
|
|
|
|
| French Polynesia |
|
|
|
|
|
|
|
|
|
| Gabon |
|
|
|
|
|
|
|
|
|
| Gambia |
|
|
|
|
|
|
|
|
|
| Georgia |
|
|
|
|
|
|
|
1 |
|
| Germany |
45 |
113 |
123 |
99 |
106 |
137 |
137 |
167 |
|
| Ghana |
|
|
|
|
|
|
|
|
|
| Gibraltar |
|
|
|
|
|
|
|
|
|
| Greece |
3 |
13 |
9 |
|
|
8 |
8 |
8 |
|
| Grenada |
|
|
|
|
1 |
|
|
|
|
| Guadeloupe |
|
|
|
|
|
|
|
|
|
| Guam |
|
|
|
|
|
|
|
|
|
| Guatemala |
|
|
|
|
|
|
|
|
|
| Guinea |
|
|
|
|
|
|
|
|
|
| Guinea-Bissau |
|
|
|
|
|
|
|
|
|
| Guyana |
|
|
|
|
|
|
|
|
|
| Haiti |
|
|
|
|
|
|
|
|
|
| Holy See |
|
|
|
|
|
|
|
|
|
| Honduras |
|
|
|
|
|
|
|
|
|
| Hungary |
4 |
5 |
8 |
15 |
48 |
150 |
195 |
218 |
|
| Iceland |
|
|
|
|
|
|
|
|
|
| India |
388 |
506 |
|
|
|
|
262 |
290 |
|
| Indonesia |
|
|
|
|
|
|
|
|
|
| Iran (Islamic Republic of) |
4 |
9 |
4 |
|
1 |
6 |
11 |
9 |
|
| Iraq |
|
|
|
|
|
|
|
|
|
| Ireland |
24 |
23 |
21 |
28 |
59 |
94 |
122 |
217 |
|
| Israel |
|
|
|
|
|
|
|
|
|
| Italy |
21 |
15 |
20 |
14 |
25 |
13 |
23 |
37 |
|
| Jamaica |
|
|
|
|
|
|
|
|
|
| Japan |
30 |
33 |
23 |
33 |
76 |
193 |
248 |
281 |
|
| Jordan |
2,314 |
2,435 |
2,524 |
3,008 |
2,572 |
4,350 |
2,900 |
3,295 |
|
| Kazakhstan |
1 |
1 |
1 |
|
|
|
|
|
|
| Kenya |
|
|
|
|
|
|
|
|
|
| Kiribati |
|
|
|
|
|
|
|
|
|
| Kuwait |
|
|
|
698 |
753 |
|
|
|
|
| Kyrgyzstan |
|
|
|
|
|
|
|
|
|
| Lao People’s Democratic Republic |
|
|
|
|
|
|
|
|
|
| Latvia |
|
|
|
|
|
|
|
|
|
| Lebanon |
|
|
|
|
|
|
|
|
|
| Lesotho |
|
|
|
|
|
|
|
|
|
| Liberia |
|
|
|
|
|
|
|
|
|
| Libya |
|
|
|
|
|
|
|
|
|
| Liechtenstein |
|
|
|
|
|
|
|
|
|
| Lithuania |
|
|
|
|
|
|
|
|
|
| Luxembourg |
|
|
|
|
|
|
|
|
|
| Madagascar |
|
|
|
|
|
|
|
|
|
| Malawi |
|
|
|
|
|
|
|
|
|
| Malaysia |
|
209 |
393 |
1,260 |
1,195 |
1,102 |
1,231 |
1,130 |
|
| Maldives |
|
|
|
|
|
|
|
|
|
| Mali |
|
|
|
|
|
|
|
|
|
| Malta |
|
|
|
|
|
|
|
1 |
|
| Marshall Islands |
|
|
|
|
|
|
|
|
|
| Martinique |
|
|
|
|
|
|
|
|
|
| Mauritania |
|
|
|
|
|
|
|
|
|
| Mauritius |
|
|
|
|
|
|
|
|
|
| Mexico |
|
|
|
|
|
|
|
|
|
| Micronesia (Federated States of) |
|
|
|
|
|
|
|
|
|
| Monaco |
|
|
|
|
|
|
|
|
|
| Mongolia |
|
|
|
|
|
|
|
|
|
| Montenegro |
|
|
|
|
|
|
|
|
|
| Montserrat |
|
|
|
|
|
|
|
|
|
| Morocco |
22 |
53 |
79 |
73 |
78 |
90 |
|
|
|
| Mozambique |
|
|
|
|
|
|
|
|
|
| Myanmar |
|
|
|
|
|
|
|
|
|
| Namibia |
|
|
|
|
|
|
|
|
|
| Nauru |
|
|
|
|
|
|
|
|
|
| Nepal |
|
|
|
|
|
|
|
|
|
| Netherlands |
|
|
|
|
1 |
2 |
2 |
32 |
|
| Nl Antilles |
|
|
|
|
|
|
|
|
|
| New Caledonia |
|
|
|
|
|
|
|
|
|
| New Zealand |
53 |
|
107 |
166 |
363 |
654 |
832 |
995 |
|
| Nicaragua |
|
|
|
|
|
|
|
|
|
| Niger |
|
|
|
|
|
|
|
|
|
| Nigeria |
|
|
|
|
|
|
|
|
|
| Niue |
|
|
|
|
|
|
|
|
|
| Norfolk Island |
|
|
|
|
|
|
|
|
|
| Norway |
|
|
|
|
|
|
1 |
2 |
|
| Oman |
|
10 |
8 |
30 |
26 |
55 |
70 |
|
60 |
| Pakistan |
|
|
|
|
|
|
|
|
|
| Palau |
|
|
|
|
|
|
|
|
|
| Palestine |
|
|
|
|
|
|
|
|
|
| Panama |
|
|
|
|
|
|
|
|
|
| Papua New Guinea |
|
|
|
|
|
|
|
|
|
| Paraguay |
|
|
|
|
|
|
|
|
|
| Peru |
|
|
|
|
|
|
|
|
|
| Philippines |
4 |
|
|
4 |
|
|
|
|
|
| Poland |
4 |
9 |
25 |
42 |
64 |
145 |
267 |
388 |
|
| Portugal |
|
|
|
|
2 |
4 |
4 |
1 |
|
| Puerto Rico |
|
|
|
|
|
|
|
|
|
| Qatar |
202 |
|
|
114 |
76 |
152 |
168 |
209 |
255 |
| Republic of Korea |
15 |
9 |
13 |
17 |
41 |
58 |
96 |
108 |
|
| Republic of Moldova |
|
|
2 |
|
|
|
|
|
|
| Réunion |
|
|
|
|
|
|
|
|
|
| Romania |
12 |
12 |
16 |
23 |
29 |
43 |
45 |
|
|
| Russian Federation |
|
|
|
21 |
14 |
|
27 |
|
|
| Rwanda |
|
|
|
|
|
|
|
|
|
| Saint Helena |
|
|
|
|
|
|
|
|
|
| Saint Kitts and Nevis |
|
|
|
|
|
|
|
|
|
| Saint Lucia |
|
|
|
|
|
|
|
|
2 |
| Saint Pierre and Miquelon |
|
|
|
|
|
|
|
|
|
| Saint Vincent and the Grenadines |
|
|
|
|
|
|
|
|
|
| Samoa |
|
|
|
|
|
|
|
|
|
| San Marino |
|
|
|
|
|
|
|
|
|
| Sao Tome and Principe |
|
|
|
|
|
|
|
|
|
| Saudi Arabia |
|
|
|
|
|
|
|
|
|
| Senegal |
|
|
|
|
|
|
|
|
|
| Serbia |
|
|
|
|
|
|
2 |
|
|
| Seychelles |
|
|
|
|
|
|
|
|
|
| Sierra Leone |
|
|
|
|
|
|
|
|
|
| Singapore |
|
|
|
|
|
|
|
|
|
| Sint Maarten (Dutch part) |
|
|
|
|
|
|
|
|
|
| Slovakia |
14 |
12 |
18 |
47 |
85 |
90 |
72 |
79 |
|
| Slovenia |
|
|
|
|
|
|
|
|
|
| Solomon Islands |
|
|
|
|
|
|
|
|
|
| Somalia |
|
|
|
|
|
|
|
|
|
| South Africa |
|
|
|
|
|
|
36 |
19 |
|
| South Sudan |
|
|
|
|
|
|
|
|
|
| Spain |
1 |
10 |
8 |
11 |
16 |
21 |
30 |
42 |
|
| Sri Lanka |
|
|
|
|
|
|
|
|
|
| Sudan |
|
|
|
|
|
|
|
|
|
| Sudan (pre-secession) |
|
|
|
|
|
|
|
|
|
| Suriname |
|
|
|
|
|
|
|
|
|
| Swaziland |
|
|
|
|
|
|
|
|
|
| Sweden |
|
|
|
12 |
16 |
23 |
25 |
24 |
|
| Switzerland |
5 |
12 |
11 |
7 |
10 |
14 |
17 |
23 |
|
| Syrian Arab Republic |
|
|
|
|
|
|
|
|
|
| Tajikistan |
|
|
|
3 |
|
3 |
4 |
6 |
|
| Thailand |
|
|
2 |
1 |
2 |
1 |
1 |
2 |
|
| The former Yugoslav Republic of Macedonia |
|
|
|
|
|
|
|
|
|
| Timor-Leste |
|
|
|
|
|
|
|
|
|
| Togo |
|
|
|
|
|
|
|
|
|
| Tokelau |
|
|
|
|
|
|
|
|
|
| Tonga |
|
|
|
|
|
|
|
|
|
| Trinidad and Tobago |
|
|
|
|
|
|
|
|
|
| Tunisia |
|
|
|
|
|
|
|
|
|
| Turkey |
11 |
16 |
15 |
16 |
22 |
17 |
26 |
36 |
|
| Turkmenistan |
|
|
|
|
|
|
|
|
|
| Turks and Caicos Islands |
|
|
|
|
|
|
|
|
|
| Tuvalu |
|
|
|
|
|
|
|
|
|
| Uganda |
|
|
|
|
|
|
|
|
|
| Ukraine |
|
|
|
|
|
|
|
|
|
| United Arab Emirates |
|
|
|
|
|
|
1,145 |
1,289 |
1,551 |
| United Kingdom of Great Britain and Northern Ireland |
2,438 |
2,753 |
3,249 |
3,535 |
5,203 |
8,055 |
10,115 |
9,773 |
|
| United Republic of Tanzania |
|
|
|
|
|
|
|
|
|
| United States of America |
3,170 |
3,570 |
8,060 |
9,884 |
12,453 |
15,670 |
22,270 |
33,066 |
|
| United States Virgin Islands |
|
|
|
|
|
|
|
|
|
| Uruguay |
|
|
|
|
|
|
|
|
|
| Uzbekistan |
|
|
|
|
|
|
|
|
|
| Vanuatu |
|
|
|
|
|
|
|
|
|
| Venezuela (Bolivarian Republic of) |
|
|
|
|
|
|
|
|
|
| Viet Nam |
|
|
|
|
|
|
|
|
|
| Western Sahara |
|
|
|
|
|
|
|
|
|
| Yemen |
|
|
|
|
|
|
|
|
|
| Zambia |
|
|
|
|
|
|
|
|
|
| Zimbabwe |
|
|
|
|
|
|
|
|
|
Source: UNESCO, UIS
ANNEXED NOTE
1. Technical Notes and Definitions
The table refers to students enrolled in tertiary education (ISCED: levels 5, 6 and beyond)
Education statistics are compiled by UNESCO on the basis of national administrative sources, reported by Ministries of Education or National Statistical Offices of receiving countries.
The number of students enrolled refers to the count of students studying in the reference period.
Students are classified as international students if they left their country of origin and moved to another country for the purpose of study. Figures of mobile students are therefore different from figures of foreign students, who may be studying in the country they were residing prior to enrolling in higher education.
Germany: Data for the years 2008 and beyond are UIS estimates.
Absence of any data for a given country most often reflects “nil or negligible values” pertaining to the mobile students’ nationality.
2. Institution which provides data
Unesco Institute of Statistics (UIS), UNESCO.
3. Data availability
The data was extracted from UIS database UIS.Stat
http://data.uis.unesco.org/
“Education”
“International student mobility in tertiary education”
Topic:”Inbound students”
Sub-topic: “Inbound internationally mobile students by country of origin”
Similar data are also available from OECD and Eurostats databases, for immigration countries relevant to both institutions (OECD countries, EU-28 countries).
Last date of access: March 2015
| Time |
2005 |
2006 |
2007 |
2008 |
2009 |
2010 |
2011 |
2012 |
2013 |
| Afghanistan |
|
|
|
|
|
|
|
|
|
| Albania |
|
|
|
|
|
|
|
|
|
| Algeria |
|
|
|
|
|
|
|
|
|
| American Samoa |
|
|
|
|
|
|
|
|
|
| Andorra |
|
|
|
|
|
|
|
|
|
| Angola |
|
|
|
|
|
|
|
|
|
| Anguilla |
|
|
|
|
|
|
|
|
|
| Antigua and Barbuda |
|
|
|
|
|
|
|
|
|
| Argentina |
|
|
|
|
|
|
|
|
|
| Armenia |
|
|
|
|
|
|
|
|
|
| Aruba |
|
|
|
|
|
|
|
|
|
| Australia |
149 |
169 |
167 |
122 |
117 |
126 |
111 |
93 |
|
| Austria |
|
|
|
3 |
3 |
2 |
1 |
1 |
|
| Azerbaijan |
|
|
|
|
|
|
|
|
|
| Bahamas |
|
|
|
|
|
|
|
|
|
| Bahrain |
5 |
11 |
|
|
|
|
95 |
15 |
|
| Bangladesh |
|
|
|
|
|
|
|
|
|
| Barbados |
|
|
|
|
|
|
|
|
|
| Belarus |
|
|
|
|
|
|
|
|
|
| Belgium |
|
|
|
|
|
|
|
|
|
| Belize |
|
|
|
|
|
|
|
|
|
| Benin |
|
|
|
|
|
|
|
|
|
| Bermuda |
|
|
|
|
|
|
|
|
|
| Bhutan |
|
|
|
|
|
|
|
|
|
| Bolivia (Plurinational State of) |
|
|
|
|
|
|
|
|
|
| Bosnia and Herzegovina |
|
|
|
|
|
|
|
|
1 |
| Botswana |
|
|
|
|
|
|
|
|
|
| Brazil |
|
|
|
|
1 |
1 |
1 |
|
|
| British Virgin Islands |
|
|
|
|
|
|
|
|
|
| Brunei Darussalam |
|
|
|
|
|
|
|
|
|
| Bulgaria |
|
|
|
|
|
|
|
|
|
| Burkina Faso |
|
|
|
|
|
|
|
|
|
| Burundi |
|
|
|
|
|
|
|
|
|
| Cambodia |
|
|
|
|
|
|
|
|
|
| Cameroon |
|
|
|
|
|
|
|
|
|
| Canada |
60 |
75 |
55 |
52 |
36 |
18 |
18 |
|
|
| Cabo Verde |
|
|
|
|
|
|
|
|
|
| Cayman Islands |
|
|
|
|
|
|
|
|
|
| Central African Republic |
|
|
|
|
|
|
|
|
|
| Chad |
|
|
|
|
|
|
|
|
|
| Chile |
|
|
|
|
|
|
|
|
|
| China |
|
|
|
|
|
|
|
|
|
| China, Hong Kong Special Administrative Region |
|
|
|
|
|
|
|
22 |
|
| China, Macao Special Administrative Region |
|
|
|
|
|
|
|
|
|
| Colombia |
|
|
|
|
|
|
|
|
|
| Comoros |
|
|
|
|
|
|
|
|
|
| Congo |
|
|
|
|
|
|
|
|
|
| Cook Islands |
|
|
|
|
|
|
|
|
|
| Costa Rica |
|
|
|
|
|
|
|
|
|
| Côte d’Ivoire |
|
|
|
|
|
|
|
|
|
| Croatia |
|
|
|
|
|
|
|
1 |
|
| Cuba |
|
|
|
|
|
|
|
|
|
| Curaçao |
|
|
|
|
|
|
|
|
|
| Cyprus |
|
|
|
|
|
2 |
2 |
2 |
|
| Czech Republic |
2 |
1 |
1 |
|
1 |
|
|
1 |
|
| Democratic People’s Republic of Korea |
|
|
|
|
|
|
|
|
|
| Democratic Republic of the Congo |
|
|
|
|
|
|
|
|
|
| Denmark |
3 |
4 |
3 |
|
|
1 |
|
1 |
|
| Djibouti |
|
|
|
|
|
|
|
|
|
| Dominica |
|
|
|
|
|
|
|
|
|
| Dominican Republic |
|
|
|
|
|
|
|
|
|
| Ecuador |
|
|
|
|
|
|
|
|
|
| Egypt |
|
|
|
|
|
|
|
|
|
| El Salvador |
|
|
|
|
|
|
|
|
|
| Equatorial Guinea |
|
|
|
|
|
|
|
|
|
| Eritrea |
|
|
|
|
|
|
|
|
|
| Estonia |
|
|
|
|
|
|
|
|
|
| Ethiopia |
|
|
|
|
|
|
|
|
|
| Faeroe Islands |
|
|
|
|
|
|
|
|
|
| Falkland Islands (Malvinas) |
|
|
|
|
|
|
|
|
|
| Fiji |
|
|
|
|
|
|
|
|
|
| Finland |
|
|
|
|
|
|
|
|
|
| France |
39 |
41 |
55 |
50 |
24 |
32 |
35 |
53 |
|
| French Guiana |
|
|
|
|
|
|
|
|
|
| French Polynesia |
|
|
|
|
|
|
|
|
|
| Gabon |
|
|
|
|
|
|
|
|
|
| Gambia |
|
|
|
|
|
|
|
|
|
| Georgia |
|
|
|
|
|
|
|
|
|
| Germany |
7 |
13 |
16 |
13 |
10 |
7 |
7 |
10 |
|
| Ghana |
|
|
|
|
|
|
|
|
|
| Gibraltar |
|
|
|
|
|
|
|
|
|
| Greece |
|
|
|
|
|
1 |
|
|
|
| Grenada |
|
|
|
|
|
|
|
|
|
| Guadeloupe |
|
|
|
|
|
|
|
|
|
| Guam |
|
|
|
|
|
|
|
|
|
| Guatemala |
|
|
|
|
|
|
|
|
|
| Guinea |
|
|
|
|
|
|
|
|
|
| Guinea-Bissau |
|
|
|
|
|
|
|
|
|
| Guyana |
|
|
|
|
|
|
|
|
|
| Haiti |
|
|
|
|
|
|
|
|
|
| Holy See |
|
|
|
|
|
|
|
|
|
| Honduras |
|
|
|
|
|
|
|
|
|
| Hungary |
|
1 |
1 |
1 |
|
|
2 |
1 |
|
| Iceland |
|
|
|
|
|
|
|
|
|
| India |
244 |
231 |
|
|
|
|
64 |
214 |
|
| Indonesia |
|
|
|
|
|
|
|
|
|
| Iran (Islamic Republic of) |
4 |
2 |
1 |
|
|
|
20 |
|
|
| Iraq |
|
|
|
|
|
|
|
|
|
| Ireland |
33 |
21 |
24 |
10 |
8 |
13 |
13 |
3 |
|
| Israel |
|
|
|
|
|
|
|
|
|
| Italy |
1 |
2 |
2 |
3 |
3 |
3 |
4 |
9 |
|
| Jamaica |
|
|
|
|
|
|
|
|
|
| Japan |
1 |
|
|
|
|
|
2 |
2 |
|
| Jordan |
143 |
140 |
206 |
267 |
225 |
247 |
209 |
219 |
|
| Kazakhstan |
|
|
|
|
|
|
|
|
|
| Kenya |
|
|
|
|
|
|
|
|
|
| Kiribati |
|
|
|
|
|
|
|
|
|
| Kuwait |
|
|
|
5 |
4 |
|
|
|
|
| Kyrgyzstan |
|
|
|
|
|
|
|
|
|
| Lao People’s Democratic Republic |
|
|
|
|
|
|
|
|
|
| Latvia |
|
|
|
|
|
|
|
|
|
| Lebanon |
|
|
|
|
|
|
|
|
|
| Lesotho |
|
|
|
|
|
|
|
|
|
| Liberia |
|
|
|
|
|
|
|
|
|
| Libya |
|
|
|
|
|
|
|
|
|
| Liechtenstein |
|
|
|
|
|
|
|
|
|
| Lithuania |
|
|
|
|
|
|
|
|
|
| Luxembourg |
|
|
|
|
|
|
|
|
|
| Madagascar |
|
|
|
|
|
|
|
|
|
| Malawi |
|
|
|
|
|
|
|
|
|
| Malaysia |
|
5 |
7 |
8 |
10 |
17 |
19 |
24 |
|
| Maldives |
|
|
|
|
|
|
|
|
|
| Mali |
|
|
|
|
|
|
|
|
|
| Malta |
|
|
|
|
|
|
|
|
|
| Marshall Islands |
|
|
|
|
|
|
|
|
|
| Martinique |
|
|
|
|
|
|
|
|
|
| Mauritania |
|
|
|
|
|
|
|
|
|
| Mauritius |
|
|
|
|
|
|
|
1 |
|
| Mexico |
|
|
|
|
|
|
|
|
|
| Micronesia (Federated States of) |
|
|
|
|
|
|
|
|
|
| Monaco |
|
|
|
|
|
|
|
|
|
| Mongolia |
|
|
|
|
|
|
|
|
|
| Montenegro |
|
|
|
|
|
|
|
|
|
| Montserrat |
|
|
|
|
|
|
|
|
|
| Morocco |
3 |
5 |
4 |
4 |
8 |
5 |
|
|
|
| Mozambique |
|
|
|
|
|
|
|
|
|
| Myanmar |
|
|
|
|
|
|
|
|
|
| Namibia |
|
|
|
|
|
|
|
|
|
| Nauru |
|
|
|
|
|
|
|
|
|
| Nepal |
|
|
|
|
|
|
|
|
|
| Netherlands |
|
|
|
|
|
|
|
|
|
| Nl Antilles |
|
|
|
|
|
|
|
|
|
| New Caledonia |
|
|
|
|
|
|
|
|
|
| New Zealand |
|
|
|
|
|
|
|
|
|
| Nicaragua |
|
|
|
|
|
|
|
|
|
| Niger |
|
|
|
|
|
|
|
|
|
| Nigeria |
|
|
|
|
|
|
|
|
|
| Niue |
|
|
|
|
|
|
|
|
|
| Norfolk Island |
|
|
|
|
|
|
|
|
|
| Norway |
|
|
|
|
|
|
|
|
|
| Oman |
|
|
2 |
27 |
21 |
19 |
33 |
|
32 |
| Pakistan |
|
|
|
|
|
|
|
|
|
| Palau |
|
|
|
|
|
|
|
|
|
| Palestine |
|
|
|
|
|
|
|
|
|
| Panama |
|
|
|
|
|
|
|
|
|
| Papua New Guinea |
|
|
|
|
|
|
|
|
|
| Paraguay |
|
|
|
|
|
|
|
|
|
| Peru |
|
|
|
|
|
|
|
|
|
| Philippines |
|
|
|
|
|
|
|
|
|
| Poland |
|
|
|
|
|
|
|
|
|
| Portugal |
1 |
1 |
1 |
|
1 |
4 |
9 |
2 |
|
| Puerto Rico |
|
|
|
|
|
|
|
|
|
| Qatar |
|
|
|
|
|
|
|
|
|
| Republic of Korea |
|
|
2 |
9 |
6 |
6 |
6 |
|
|
| Republic of Moldova |
|
|
|
|
|
|
|
|
|
| Réunion |
|
|
|
|
|
|
|
|
|
| Romania |
9 |
6 |
4 |
4 |
2 |
4 |
7 |
|
|
| Russian Federation |
|
|
|
|
|
|
|
|
|
| Rwanda |
|
|
|
|
|
|
|
|
|
| Saint Helena |
|
|
|
|
|
|
|
|
|
| Saint Kitts and Nevis |
|
|
|
|
|
|
|
|
|
| Saint Lucia |
|
|
|
|
|
|
|
|
|
| Saint Pierre and Miquelon |
|
|
|
|
|
|
|
|
|
| Saint Vincent and the Grenadines |
|
|
|
|
|
|
|
|
|
| Samoa |
|
|
|
|
|
|
|
|
|
| San Marino |
|
|
|
|
|
|
|
|
|
| Sao Tome and Principe |
|
|
|
|
|
|
|
|
|
| Saudi Arabia |
61 |
49 |
68 |
72 |
76 |
156 |
94 |
125 |
218 |
| Senegal |
|
|
|
|
|
|
|
|
|
| Serbia |
|
|
|
|
|
|
|
|
|
| Seychelles |
|
|
|
|
|
|
|
|
|
| Sierra Leone |
|
|
|
|
|
|
|
|
|
| Singapore |
|
|
|
|
|
|
|
|
|
| Sint Maarten (Dutch part) |
|
|
|
|
|
|
|
|
|
| Slovakia |
|
|
1 |
1 |
|
|
2 |
|
|
| Slovenia |
|
|
|
|
|
|
|
|
|
| Solomon Islands |
|
|
|
|
|
|
|
|
|
| Somalia |
|
|
|
|
|
|
|
|
|
| South Africa |
|
|
|
|
|
|
10 |
2 |
|
| South Sudan |
|
|
|
|
|
|
|
|
|
| Spain |
1 |
|
2 |
3 |
4 |
2 |
1 |
3 |
|
| Sri Lanka |
|
|
|
|
|
|
|
|
|
| Sudan |
|
|
|
|
|
|
|
|
|
| Sudan (pre-secession) |
|
|
|
|
|
|
|
|
|
| Suriname |
|
|
|
|
|
|
|
|
|
| Swaziland |
|
|
|
|
|
|
|
|
|
| Sweden |
|
|
|
3 |
2 |
2 |
2 |
3 |
|
| Switzerland |
|
1 |
3 |
3 |
3 |
4 |
3 |
2 |
|
| Syrian Arab Republic |
|
|
|
|
|
|
|
|
|
| Tajikistan |
|
|
|
|
|
|
|
|
|
| Thailand |
|
|
|
|
15 |
2 |
2 |
|
|
| The former Yugoslav Republic of Macedonia |
|
|
|
|
|
|
|
|
|
| Timor-Leste |
|
|
|
|
|
|
|
|
|
| Togo |
|
|
|
|
|
|
|
|
|
| Tokelau |
|
|
|
|
|
|
|
|
|
| Tonga |
|
|
|
|
|
|
|
|
|
| Trinidad and Tobago |
|
|
|
|
|
|
|
|
|
| Tunisia |
|
|
|
|
|
|
|
|
|
| Turkey |
|
|
|
|
|
|
|
|
|
| Turkmenistan |
|
|
|
|
|
|
|
|
|
| Turks and Caicos Islands |
|
|
|
|
|
|
|
|
|
| Tuvalu |
|
|
|
|
|
|
|
|
|
| Uganda |
|
|
|
|
|
|
|
|
|
| Ukraine |
|
|
|
|
|
|
|
|
|
| United Arab Emirates |
|
|
|
|
|
|
247 |
330 |
434 |
| United Kingdom of Great Britain and Northern Ireland |
509 |
514 |
599 |
704 |
951 |
1,059 |
1,127 |
1,252 |
|
| United Republic of Tanzania |
|
|
|
|
|
|
|
|
|
| United States of America |
303 |
263 |
303 |
345 |
455 |
657 |
702 |
948 |
|
| United States Virgin Islands |
|
|
|
|
|
|
|
|
|
| Uruguay |
|
|
|
|
|
|
|
|
|
| Uzbekistan |
|
|
|
|
|
|
|
|
|
| Vanuatu |
|
|
|
|
|
|
|
|
|
| Venezuela (Bolivarian Republic of) |
|
|
|
|
|
|
|
|
|
| Viet Nam |
|
|
|
|
|
|
|
|
|
| Western Sahara |
|
|
|
|
|
|
|
|
|
| Yemen |
|
|
|
|
|
|
|
|
|
| Zambia |
|
|
|
|
|
|
|
|
|
| Zimbabwe |
|
|
|
|
|
|
|
|
|
Source: UNESCO, UIS
ANNEXED NOTE
1. Technical Notes and Definitions
The table refers to students enrolled in tertiary education (ISCED: levels 5, 6 and beyond)
Education statistics are compiled by UNESCO on the basis of national administrative sources, reported by Ministries of Education or National Statistical Offices of receiving countries.
The number of students enrolled refers to the count of students studying in the reference period.
Students are classified as international students if they left their country of origin and moved to another country for the purpose of study. Figures of mobile students are therefore different from figures of foreign students, who may be studying in the country they were residing prior to enrolling in higher education.
Germany: Data for the years 2008 and beyond are UIS estimates.
Absence of any data for a given country most often reflects “nil or negligible values” pertaining to the mobile students’ nationality.
2. Institution which provides data
Unesco Institute of Statistics (UIS), UNESCO.
3. Data availability
The data was extracted from UIS database UIS.Stat
http://data.uis.unesco.org/
“Education”
“International student mobility in tertiary education”
Topic:”Inbound students”
Sub-topic: “Inbound internationally mobile students by country of origin”
Similar data are also available from OECD and Eurostats databases, for immigration countries relevant to both institutions (OECD countries, EU-28 countries).
Last date of access: March 2015
| Time |
2005 |
2006 |
2007 |
2008 |
2009 |
2010 |
2011 |
2012 |
2013 |
| Afghanistan |
|
|
|
|
|
|
|
|
|
| Albania |
|
|
|
|
|
|
|
|
|
| Algeria |
|
|
|
|
|
|
|
|
|
| American Samoa |
|
|
|
|
|
|
|
|
|
| Andorra |
|
|
|
|
|
|
|
|
|
| Angola |
|
|
|
|
|
|
|
|
|
| Anguilla |
|
|
|
|
|
|
|
|
|
| Antigua and Barbuda |
|
|
|
|
|
|
|
|
|
| Argentina |
|
|
|
|
|
|
|
|
|
| Armenia |
|
|
|
|
|
|
|
|
|
| Aruba |
|
|
|
|
|
|
|
|
|
| Australia |
479 |
491 |
559 |
522 |
546 |
517 |
476 |
486 |
|
| Austria |
|
3 |
2 |
2 |
3 |
2 |
2 |
|
|
| Azerbaijan |
|
|
1 |
1 |
1 |
1 |
1 |
1 |
|
| Bahamas |
|
|
|
|
|
|
|
|
|
| Bahrain |
|
40 |
|
|
|
|
67 |
18 |
|
| Bangladesh |
|
|
|
|
|
|
|
|
|
| Barbados |
|
|
|
|
|
|
|
|
|
| Belarus |
|
|
|
|
|
|
|
|
|
| Belgium |
|
|
|
|
|
1 |
1 |
1 |
|
| Belize |
|
|
|
|
|
|
|
|
|
| Benin |
|
|
|
|
|
|
|
|
|
| Bermuda |
|
|
|
|
|
|
|
|
|
| Bhutan |
|
|
|
|
|
|
|
|
|
| Bolivia (Plurinational State of) |
|
|
|
|
|
|
|
|
|
| Bosnia and Herzegovina |
|
|
|
|
|
|
|
|
|
| Botswana |
|
|
|
|
|
|
|
|
|
| Brazil |
|
|
|
|
|
2 |
|
|
|
| British Virgin Islands |
|
|
|
|
|
|
|
|
|
| Brunei Darussalam |
|
|
2 |
1 |
|
|
2 |
5 |
|
| Bulgaria |
|
|
|
1 |
|
|
|
|
|
| Burkina Faso |
|
|
|
|
|
|
|
|
|
| Burundi |
|
|
|
|
|
|
|
|
|
| Cambodia |
|
|
|
|
|
|
|
|
|
| Cameroon |
|
|
|
|
|
|
|
|
|
| Canada |
150 |
126 |
167 |
150 |
141 |
129 |
87 |
|
|
| Cabo Verde |
|
|
|
|
|
|
|
|
|
| Cayman Islands |
|
|
|
|
|
|
|
|
|
| Central African Republic |
|
|
|
|
|
|
|
|
|
| Chad |
|
|
|
|
|
|
|
|
|
| Chile |
|
|
|
|
|
|
|
|
|
| China |
|
|
|
|
|
|
|
|
|
| China, Hong Kong Special Administrative Region |
|
|
|
|
|
|
|
|
|
| China, Macao Special Administrative Region |
|
|
|
|
|
|
|
|
|
| Colombia |
|
|
|
|
|
|
|
|
|
| Comoros |
|
|
|
|
|
|
|
|
|
| Congo |
|
|
|
|
|
|
|
|
|
| Cook Islands |
|
|
|
|
|
|
|
|
|
| Costa Rica |
|
|
|
|
|
|
|
|
|
| Côte d’Ivoire |
|
|
|
|
|
|
|
|
|
| Croatia |
|
|
|
|
|
|
|
|
|
| Cuba |
|
|
|
|
|
1 |
1 |
1 |
|
| Curaçao |
|
|
|
|
|
|
|
|
|
| Cyprus |
|
|
|
1 |
1 |
2 |
2 |
1 |
|
| Czech Republic |
|
|
|
|
1 |
1 |
|
1 |
|
| Democratic People’s Republic of Korea |
|
|
|
|
|
|
|
|
|
| Democratic Republic of the Congo |
|
|
|
|
|
|
|
|
|
| Denmark |
|
1 |
1 |
|
|
|
2 |
2 |
|
| Djibouti |
|
|
|
|
|
|
|
|
|
| Dominica |
|
|
|
|
|
|
|
|
|
| Dominican Republic |
|
|
|
|
|
|
|
|
|
| Ecuador |
|
|
|
|
|
|
|
|
|
| Egypt |
|
|
|
|
|
|
|
|
|
| El Salvador |
|
|
|
|
|
|
|
|
|
| Equatorial Guinea |
|
|
|
|
|
|
|
|
|
| Eritrea |
|
|
|
|
|
|
|
|
|
| Estonia |
|
|
|
|
|
|
|
|
|
| Ethiopia |
|
|
|
|
|
|
|
|
|
| Faeroe Islands |
|
|
|
|
|
|
|
|
|
| Falkland Islands (Malvinas) |
|
|
|
|
|
|
|
|
|
| Fiji |
|
|
|
|
|
|
|
|
|
| Finland |
|
|
|
|
|
|
1 |
1 |
|
| France |
19 |
19 |
24 |
27 |
31 |
40 |
31 |
27 |
|
| French Guiana |
|
|
|
|
|
|
|
|
|
| French Polynesia |
|
|
|
|
|
|
|
|
|
| Gabon |
|
|
|
|
|
|
|
|
|
| Gambia |
|
|
|
|
|
|
|
|
|
| Georgia |
|
|
|
|
|
|
|
|
|
| Germany |
16 |
16 |
14 |
15 |
16 |
16 |
18 |
23 |
|
| Ghana |
|
|
|
|
|
|
|
|
|
| Gibraltar |
|
|
|
|
|
|
|
|
|
| Greece |
|
|
|
|
|
|
|
|
|
| Grenada |
|
|
|
|
|
|
|
|
|
| Guadeloupe |
|
|
|
|
|
|
|
|
|
| Guam |
|
|
|
|
|
|
|
|
|
| Guatemala |
|
|
|
|
|
|
|
|
|
| Guinea |
|
|
|
|
|
|
|
|
|
| Guinea-Bissau |
|
|
|
|
|
|
|
|
|
| Guyana |
|
|
|
|
|
|
|
|
|
| Haiti |
|
|
|
|
|
|
|
|
|
| Holy See |
|
|
|
|
|
|
|
|
|
| Honduras |
|
|
|
|
|
|
|
|
|
| Hungary |
1 |
1 |
|
1 |
2 |
|
|
2 |
|
| Iceland |
|
|
|
|
|
|
|
|
|
| India |
406 |
432 |
|
|
|
|
277 |
232 |
|
| Indonesia |
|
|
|
|
|
|
|
|
|
| Iran (Islamic Republic of) |
5 |
4 |
4 |
3 |
4 |
1 |
1 |
3 |
|
| Iraq |
|
|
|
|
|
|
|
|
|
| Ireland |
27 |
13 |
21 |
18 |
22 |
26 |
20 |
12 |
|
| Israel |
|
|
|
|
|
|
|
|
|
| Italy |
2 |
3 |
5 |
3 |
3 |
|
4 |
4 |
|
| Jamaica |
|
|
|
|
|
|
|
|
|
| Japan |
9 |
26 |
10 |
9 |
12 |
6 |
6 |
8 |
|
| Jordan |
1,310 |
1,581 |
1,012 |
1,217 |
1,237 |
1,051 |
946 |
1,079 |
|
| Kazakhstan |
|
|
|
|
|
|
|
|
|
| Kenya |
|
|
|
|
|
|
|
|
|
| Kiribati |
|
|
|
|
|
|
|
|
|
| Kuwait |
|
|
|
109 |
112 |
|
|
|
|
| Kyrgyzstan |
|
|
|
|
|
|
|
|
|
| Lao People’s Democratic Republic |
|
|
|
|
|
|
|
|
|
| Latvia |
|
|
|
|
|
|
|
|
|
| Lebanon |
|
|
|
|
|
|
|
|
|
| Lesotho |
|
|
|
|
|
|
|
|
|
| Liberia |
|
|
|
|
|
|
|
|
|
| Libya |
|
|
|
|
|
|
|
|
|
| Liechtenstein |
|
|
|
|
|
|
|
|
|
| Lithuania |
|
|
|
|
|
|
|
|
|
| Luxembourg |
|
|
|
|
|
|
|
|
|
| Madagascar |
|
|
|
|
|
|
|
|
|
| Malawi |
|
|
|
|
|
|
|
|
|
| Malaysia |
|
441 |
456 |
123 |
228 |
263 |
259 |
306 |
|
| Maldives |
|
|
|
|
|
|
|
|
|
| Mali |
|
|
|
|
|
|
|
|
|
| Malta |
1 |
|
|
|
|
|
|
|
|
| Marshall Islands |
|
|
|
|
|
|
|
|
|
| Martinique |
|
|
|
|
|
|
|
|
|
| Mauritania |
|
|
|
|
|
|
|
|
|
| Mauritius |
|
|
|
|
|
|
|
|
|
| Mexico |
|
|
|
|
|
|
|
|
|
| Micronesia (Federated States of) |
|
|
|
|
|
|
|
|
|
| Monaco |
|
|
|
|
|
|
|
|
|
| Mongolia |
|
|
|
|
|
|
|
|
|
| Montenegro |
|
|
|
|
|
|
|
|
|
| Montserrat |
|
|
|
|
|
|
|
|
|
| Morocco |
30 |
59 |
68 |
93 |
140 |
181 |
|
|
|
| Mozambique |
|
|
|
|
|
|
|
|
|
| Myanmar |
|
|
|
|
|
|
|
|
|
| Namibia |
|
|
|
|
|
|
|
|
|
| Nauru |
|
|
|
|
|
|
|
|
|
| Nepal |
|
|
|
|
|
|
|
|
|
| Netherlands |
4 |
1 |
|
|
1 |
5 |
4 |
10 |
|
| Nl Antilles |
|
|
|
|
|
|
|
|
|
| New Caledonia |
|
|
|
|
|
|
|
|
|
| New Zealand |
49 |
|
123 |
152 |
156 |
136 |
120 |
110 |
|
| Nicaragua |
|
|
|
|
|
|
|
|
|
| Niger |
|
|
|
|
|
|
|
|
|
| Nigeria |
|
|
|
|
|
|
|
|
|
| Niue |
|
|
|
|
|
|
|
|
|
| Norfolk Island |
|
|
|
|
|
|
|
|
|
| Norway |
|
|
|
|
|
|
|
|
|
| Oman |
|
|
|
|
|
|
|
|
|
| Pakistan |
|
|
|
|
|
|
|
|
|
| Palau |
|
|
|
|
|
|
|
|
|
| Palestine |
|
|
|
|
|
|
|
|
|
| Panama |
|
|
|
|
|
|
|
|
|
| Papua New Guinea |
|
|
|
|
|
|
|
|
|
| Paraguay |
|
|
|
|
|
|
|
|
|
| Peru |
|
|
|
|
|
|
|
|
|
| Philippines |
|
|
|
|
|
|
|
|
|
| Poland |
1 |
|
|
|
|
|
|
|
|
| Portugal |
78 |
1 |
1 |
|
|
1 |
|
|
|
| Puerto Rico |
|
|
|
|
|
|
|
|
|
| Qatar |
197 |
|
|
180 |
155 |
217 |
245 |
223 |
223 |
| Republic of Korea |
|
|
2 |
2 |
|
|
|
|
|
| Republic of Moldova |
|
|
|
|
|
|
|
|
|
| Réunion |
|
|
|
|
|
|
|
|
|
| Romania |
2 |
|
|
|
1 |
2 |
1 |
|
|
| Russian Federation |
|
|
|
41 |
33 |
|
35 |
|
|
| Rwanda |
|
|
|
|
|
|
|
|
|
| Saint Helena |
|
|
|
|
|
|
|
|
|
| Saint Kitts and Nevis |
|
|
|
|
|
|
|
|
|
| Saint Lucia |
|
|
|
|
|
|
|
|
|
| Saint Pierre and Miquelon |
|
|
|
|
|
|
|
|
|
| Saint Vincent and the Grenadines |
|
|
|
|
|
|
|
|
|
| Samoa |
|
|
|
|
|
|
|
|
|
| San Marino |
|
|
|
|
|
|
|
|
|
| Sao Tome and Principe |
|
|
|
|
|
|
|
|
|
| Saudi Arabia |
107 |
116 |
115 |
122 |
129 |
173 |
144 |
192 |
333 |
| Senegal |
|
|
|
|
|
|
|
|
|
| Serbia |
|
|
|
|
|
|
|
|
|
| Seychelles |
|
|
|
|
|
|
|
|
|
| Sierra Leone |
|
|
|
|
|
|
|
|
|
| Singapore |
|
|
|
|
|
|
|
|
|
| Sint Maarten (Dutch part) |
|
|
|
|
|
|
|
|
|
| Slovakia |
3 |
4 |
3 |
2 |
|
|
|
|
|
| Slovenia |
|
|
|
|
1 |
|
|
|
|
| Solomon Islands |
|
|
|
|
|
|
|
|
|
| Somalia |
|
|
|
|
|
|
|
|
|
| South Africa |
|
|
|
|
|
|
2 |
|
|
| South Sudan |
|
|
|
|
|
|
|
|
|
| Spain |
1 |
3 |
21 |
1 |
10 |
2 |
2 |
3 |
|
| Sri Lanka |
|
|
|
|
|
|
|
|
|
| Sudan |
|
|
|
|
|
|
|
|
|
| Sudan (pre-secession) |
|
|
|
|
|
|
|
|
|
| Suriname |
|
|
|
|
|
|
|
|
|
| Swaziland |
|
|
|
|
|
|
|
|
|
| Sweden |
|
|
|
4 |
6 |
6 |
4 |
10 |
|
| Switzerland |
3 |
6 |
3 |
3 |
2 |
2 |
3 |
2 |
|
| Syrian Arab Republic |
|
|
|
|
|
|
|
|
|
| Tajikistan |
|
|
|
|
|
|
|
|
|
| Thailand |
|
|
|
|
1 |
2 |
4 |
3 |
|
| The former Yugoslav Republic of Macedonia |
|
|
|
|
|
|
|
|
|
| Timor-Leste |
|
|
|
|
|
|
|
|
|
| Togo |
|
|
|
|
|
|
|
|
|
| Tokelau |
|
|
|
|
|
|
|
|
|
| Tonga |
|
|
|
|
|
|
|
|
|
| Trinidad and Tobago |
|
|
|
|
|
|
|
|
|
| Tunisia |
|
|
|
|
|
|
|
|
|
| Turkey |
4 |
4 |
2 |
2 |
2 |
2 |
1 |
2 |
|
| Turkmenistan |
|
|
|
|
|
|
|
|
|
| Turks and Caicos Islands |
|
|
|
|
|
|
|
|
|
| Tuvalu |
|
|
|
|
|
|
|
|
|
| Uganda |
|
|
|
|
|
|
|
|
|
| Ukraine |
|
|
|
|
|
|
|
|
|
| United Arab Emirates |
|
|
|
|
|
|
5,265 |
5,186 |
5,258 |
| United Kingdom of Great Britain and Northern Ireland |
1,152 |
1,136 |
1,324 |
1,762 |
1,211 |
1,212 |
1,172 |
1,202 |
|
| United Republic of Tanzania |
|
|
|
|
|
|
|
|
|
| United States of America |
370 |
349 |
260 |
361 |
267 |
283 |
307 |
521 |
|
| United States Virgin Islands |
|
|
|
|
|
|
|
|
|
| Uruguay |
|
|
|
|
|
|
|
|
|
| Uzbekistan |
|
|
|
|
|
|
|
|
|
| Vanuatu |
|
|
|
|
|
|
|
|
|
| Venezuela (Bolivarian Republic of) |
|
|
|
|
|
|
|
|
|
| Viet Nam |
|
|
|
|
|
|
|
|
|
| Western Sahara |
|
|
|
|
|
|
|
|
|
| Yemen |
|
|
|
|
|
|
|
|
|
| Zambia |
|
|
|
|
|
|
|
|
|
| Zimbabwe |
|
|
|
|
|
|
|
|
|
Source: UNESCO, UIS
ANNEXED NOTE
1. Technical Notes and Definitions
The table refers to students enrolled in tertiary education (ISCED: levels 5, 6 and beyond)
Education statistics are compiled by UNESCO on the basis of national administrative sources, reported by Ministries of Education or National Statistical Offices of receiving countries.
The number of students enrolled refers to the count of students studying in the reference period.
Students are classified as international students if they left their country of origin and moved to another country for the purpose of study. Figures of mobile students are therefore different from figures of foreign students, who may be studying in the country they were residing prior to enrolling in higher education.
Germany: Data for the years 2008 and beyond are UIS estimates.
Absence of any data for a given country most often reflects “nil or negligible values” pertaining to the mobile students’ nationality.
2. Institution which provides data
Unesco Institute of Statistics (UIS), UNESCO.
3. Data availability
The data was extracted from UIS database UIS.Stat
http://data.uis.unesco.org/
“Education”
“International student mobility in tertiary education”
Topic:”Inbound students”
Sub-topic: “Inbound internationally mobile students by country of origin”
Similar data are also available from OECD and Eurostats databases, for immigration countries relevant to both institutions (OECD countries, EU-28 countries).
Last date of access: March 2015
| Time |
2005 |
2006 |
2007 |
2008 |
2009 |
2010 |
2011 |
2012 |
2013 |
| Afghanistan |
|
|
|
|
|
|
|
|
|
| Albania |
|
|
|
|
|
|
|
|
|
| Algeria |
|
|
|
|
|
|
|
|
|
| American Samoa |
|
|
|
|
|
|
|
|
|
| Andorra |
|
|
|
|
|
|
|
|
|
| Angola |
|
|
|
|
|
|
|
|
|
| Anguilla |
|
|
|
|
|
|
|
|
|
| Antigua and Barbuda |
|
|
|
|
|
|
|
|
|
| Argentina |
|
|
|
|
|
|
|
|
|
| Armenia |
|
|
1 |
2 |
1 |
|
|
|
|
| Aruba |
|
|
|
|
|
|
|
|
|
| Australia |
147 |
191 |
232 |
240 |
264 |
268 |
322 |
494 |
|
| Austria |
|
|
|
1 |
1 |
1 |
2 |
|
|
| Azerbaijan |
|
|
|
|
|
|
|
|
|
| Bahamas |
|
|
|
|
|
|
|
|
|
| Bahrain |
29 |
54 |
|
|
|
|
2,159 |
504 |
|
| Bangladesh |
|
|
|
|
|
|
|
|
|
| Barbados |
|
|
|
|
|
|
|
|
|
| Belarus |
5 |
5 |
5 |
|
|
|
|
|
1 |
| Belgium |
|
|
|
|
1 |
|
|
1 |
|
| Belize |
|
|
|
|
|
|
|
|
|
| Benin |
|
|
|
|
|
|
|
|
|
| Bermuda |
|
|
|
|
|
|
|
|
|
| Bhutan |
|
|
|
|
|
|
|
|
|
| Bolivia (Plurinational State of) |
|
|
|
|
|
|
|
|
|
| Bosnia and Herzegovina |
|
|
|
|
|
|
|
|
|
| Botswana |
|
|
|
|
|
|
|
|
|
| Brazil |
|
|
|
|
4 |
2 |
1 |
1 |
|
| British Virgin Islands |
|
|
|
|
|
|
|
|
|
| Brunei Darussalam |
1 |
1 |
1 |
|
|
|
|
|
|
| Bulgaria |
10 |
7 |
4 |
1 |
10 |
4 |
9 |
2 |
|
| Burkina Faso |
|
|
|
|
|
|
|
|
|
| Burundi |
|
|
|
|
|
|
|
|
|
| Cambodia |
|
|
|
|
|
|
|
|
|
| Cameroon |
|
|
|
|
|
|
|
|
|
| Canada |
186 |
192 |
228 |
215 |
204 |
198 |
165 |
|
|
| Cabo Verde |
|
|
|
|
|
|
|
|
|
| Cayman Islands |
|
|
|
|
|
|
|
|
|
| Central African Republic |
|
|
|
|
|
|
|
|
|
| Chad |
|
|
|
|
|
|
|
|
|
| Chile |
|
|
|
|
|
|
|
|
|
| China |
|
|
|
|
|
|
|
|
|
| China, Hong Kong Special Administrative Region |
|
|
|
|
|
|
|
|
|
| China, Macao Special Administrative Region |
|
|
|
|
|
|
|
|
|
| Colombia |
|
|
|
|
|
|
|
|
|
| Comoros |
|
|
|
|
|
|
|
|
|
| Congo |
|
|
|
|
|
|
|
|
|
| Cook Islands |
|
|
|
|
|
|
|
|
|
| Costa Rica |
|
|
|
|
|
|
|
|
|
| Côte d’Ivoire |
|
|
|
|
|
|
|
|
|
| Croatia |
|
|
|
|
|
|
|
|
|
| Cuba |
|
|
|
|
|
|
|
|
|
| Curaçao |
|
|
|
|
|
|
|
|
|
| Cyprus |
1 |
7 |
9 |
6 |
|
5 |
|
|
|
| Czech Republic |
53 |
34 |
29 |
20 |
16 |
10 |
8 |
7 |
|
| Democratic People’s Republic of Korea |
|
|
|
|
|
|
|
|
|
| Democratic Republic of the Congo |
|
|
|
|
|
|
|
|
|
| Denmark |
1 |
|
2 |
|
|
|
|
|
|
| Djibouti |
|
|
|
|
|
|
|
|
|
| Dominica |
|
|
|
|
|
|
|
|
|
| Dominican Republic |
|
|
|
|
|
|
|
|
|
| Ecuador |
|
|
|
|
|
|
|
|
|
| Egypt |
|
|
|
|
|
|
|
|
|
| El Salvador |
|
|
|
|
|
|
|
|
|
| Equatorial Guinea |
|
|
|
|
|
|
|
|
|
| Eritrea |
|
|
|
|
|
|
|
|
|
| Estonia |
|
|
|
|
|
|
|
|
|
| Ethiopia |
|
|
|
|
|
|
|
|
|
| Faeroe Islands |
|
|
|
|
|
|
|
|
|
| Falkland Islands (Malvinas) |
|
|
|
|
|
|
|
|
|
| Fiji |
|
|
|
|
|
|
|
|
|
| Finland |
|
|
|
1 |
1 |
2 |
1 |
1 |
|
| France |
74 |
82 |
74 |
84 |
87 |
98 |
91 |
96 |
|
| French Guiana |
|
|
|
|
|
|
|
|
|
| French Polynesia |
|
|
|
|
|
|
|
|
|
| Gabon |
|
|
|
|
|
|
|
|
|
| Gambia |
|
|
|
|
|
|
|
|
|
| Georgia |
|
|
|
|
|
|
|
|
1 |
| Germany |
10 |
26 |
20 |
22 |
18 |
22 |
18 |
20 |
|
| Ghana |
|
|
|
|
|
|
|
|
|
| Gibraltar |
|
|
|
|
|
|
|
|
|
| Greece |
1 |
4 |
1 |
|
|
1 |
1 |
2 |
|
| Grenada |
|
|
|
|
1 |
|
|
|
|
| Guadeloupe |
|
|
|
|
|
|
|
|
|
| Guam |
|
|
|
|
|
|
|
|
|
| Guatemala |
|
|
|
|
|
|
|
|
|
| Guinea |
|
|
|
|
|
|
|
|
|
| Guinea-Bissau |
|
|
|
|
|
|
|
|
|
| Guyana |
|
|
|
|
|
|
|
|
|
| Haiti |
|
|
|
|
|
|
|
|
|
| Holy See |
|
|
|
|
|
|
|
|
|
| Honduras |
|
|
|
|
|
|
|
|
|
| Hungary |
3 |
2 |
3 |
3 |
3 |
1 |
|
|
|
| Iceland |
|
|
|
|
|
|
|
|
|
| India |
258 |
235 |
|
|
|
|
107 |
244 |
|
| Indonesia |
|
|
|
|
|
|
|
|
|
| Iran (Islamic Republic of) |
2 |
7 |
8 |
6 |
1 |
5 |
9 |
3 |
|
| Iraq |
|
|
|
|
|
|
|
|
|
| Ireland |
244 |
254 |
229 |
152 |
175 |
91 |
67 |
55 |
|
| Israel |
|
|
|
|
|
|
|
|
|
| Italy |
9 |
4 |
5 |
6 |
7 |
1 |
5 |
4 |
|
| Jamaica |
|
|
|
|
|
|
|
|
|
| Japan |
11 |
6 |
7 |
7 |
7 |
7 |
8 |
9 |
|
| Jordan |
1,507 |
1,520 |
1,543 |
1,954 |
2,133 |
1,661 |
1,734 |
1,722 |
|
| Kazakhstan |
1 |
|
|
|
|
|
|
|
|
| Kenya |
|
|
|
|
|
|
|
|
|
| Kiribati |
|
|
|
|
|
|
|
|
|
| Kuwait |
|
|
|
|
|
|
|
|
|
| Kyrgyzstan |
|
|
|
|
|
|
|
|
|
| Lao People’s Democratic Republic |
|
|
|
|
|
|
|
|
|
| Latvia |
|
|
|
|
|
|
|
|
|
| Lebanon |
|
|
|
|
|
|
|
|
|
| Lesotho |
|
|
|
|
|
|
|
|
|
| Liberia |
|
|
|
|
|
|
|
|
|
| Libya |
|
|
|
|
|
|
|
|
|
| Liechtenstein |
|
|
|
|
|
|
|
|
|
| Lithuania |
|
|
|
|
|
|
|
1 |
|
| Luxembourg |
|
|
|
|
|
|
|
|
|
| Madagascar |
|
|
|
|
|
|
|
|
|
| Malawi |
|
|
|
|
|
|
|
|
|
| Malaysia |
|
4 |
7 |
9 |
165 |
156 |
67 |
164 |
|
| Maldives |
|
|
|
|
|
|
|
|
|
| Mali |
|
|
|
|
|
|
|
|
|
| Malta |
12 |
28 |
|
21 |
39 |
|
58 |
77 |
|
| Marshall Islands |
|
|
|
|
|
|
|
|
|
| Martinique |
|
|
|
|
|
|
|
|
|
| Mauritania |
|
|
|
|
|
|
|
|
|
| Mauritius |
|
|
|
|
|
|
|
|
|
| Mexico |
|
|
|
|
|
|
|
|
|
| Micronesia (Federated States of) |
|
|
|
|
|
|
|
|
|
| Monaco |
|
|
|
|
|
|
|
|
|
| Mongolia |
|
|
|
|
|
|
|
|
|
| Montenegro |
|
|
|
|
|
|
|
|
|
| Montserrat |
|
|
|
|
|
|
|
|
|
| Morocco |
8 |
13 |
12 |
14 |
12 |
13 |
|
|
|
| Mozambique |
|
|
|
|
|
|
|
|
|
| Myanmar |
|
|
|
|
|
|
|
|
|
| Namibia |
|
|
|
|
|
|
|
|
|
| Nauru |
|
|
|
|
|
|
|
|
|
| Nepal |
|
|
|
|
|
|
|
|
|
| Netherlands |
|
1 |
1 |
|
|
|
|
|
|
| Nl Antilles |
|
|
|
|
|
|
|
|
|
| New Caledonia |
|
|
|
|
|
|
|
|
|
| New Zealand |
|
|
2 |
2 |
2 |
2 |
4 |
21 |
|
| Nicaragua |
|
|
|
|
|
|
|
|
|
| Niger |
|
|
|
|
|
|
|
|
|
| Nigeria |
|
|
|
|
|
|
|
|
|
| Niue |
|
|
|
|
|
|
|
|
|
| Norfolk Island |
|
|
|
|
|
|
|
|
|
| Norway |
|
|
|
|
1 |
|
|
|
|
| Oman |
|
14 |
12 |
124 |
130 |
134 |
132 |
|
18 |
| Pakistan |
|
|
|
|
|
|
|
|
|
| Palau |
|
|
|
|
|
|
|
|
|
| Palestine |
|
|
|
|
|
|
|
|
|
| Panama |
|
|
|
|
|
|
|
|
|
| Papua New Guinea |
|
|
|
|
|
|
|
|
|
| Paraguay |
|
|
|
|
|
|
|
|
|
| Peru |
|
|
|
|
|
|
|
|
|
| Philippines |
67 |
|
|
8 |
|
|
|
|
|
| Poland |
2 |
4 |
1 |
4 |
2 |
1 |
2 |
3 |
|
| Portugal |
|
|
|
|
|
|
|
|
|
| Puerto Rico |
|
|
|
|
|
|
|
|
|
| Qatar |
66 |
|
|
24 |
17 |
26 |
21 |
27 |
29 |
| Republic of Korea |
|
|
|
|
|
4 |
4 |
2 |
|
| Republic of Moldova |
|
|
|
|
|
|
|
|
|
| Réunion |
|
|
|
|
|
|
|
|
|
| Romania |
16 |
6 |
9 |
7 |
12 |
10 |
31 |
|
|
| Russian Federation |
|
|
|
2 |
2 |
|
73 |
|
|
| Rwanda |
|
|
|
|
|
|
|
|
|
| Saint Helena |
|
|
|
|
|
|
|
|
|
| Saint Kitts and Nevis |
|
|
|
|
|
|
|
|
|
| Saint Lucia |
|
|
|
|
|
|
|
|
|
| Saint Pierre and Miquelon |
|
|
|
|
|
|
|
|
|
| Saint Vincent and the Grenadines |
|
|
|
|
|
|
|
|
|
| Samoa |
|
|
|
|
|
|
|
|
|
| San Marino |
|
|
|
|
|
|
|
|
|
| Sao Tome and Principe |
|
|
|
|
|
|
|
|
|
| Saudi Arabia |
130 |
125 |
142 |
151 |
160 |
216 |
290 |
387 |
671 |
| Senegal |
|
|
|
|
|
|
|
|
|
| Serbia |
|
|
|
|
|
|
|
|
|
| Seychelles |
|
|
|
|
|
|
|
|
|
| Sierra Leone |
|
|
|
|
|
|
|
|
|
| Singapore |
|
|
|
|
|
|
|
|
|
| Sint Maarten (Dutch part) |
|
|
|
|
|
|
|
|
|
| Slovakia |
22 |
24 |
43 |
413 |
254 |
214 |
166 |
101 |
|
| Slovenia |
1 |
|
|
|
|
|
|
1 |
|
| Solomon Islands |
|
|
|
|
|
|
|
|
|
| Somalia |
|
|
|
|
|
|
|
|
|
| South Africa |
|
|
|
|
|
|
2 |
1 |
|
| South Sudan |
|
|
|
|
|
|
|
|
|
| Spain |
1 |
2 |
6 |
4 |
6 |
10 |
9 |
13 |
|
| Sri Lanka |
|
|
|
|
|
|
|
|
|
| Sudan |
|
|
|
|
|
|
|
|
|
| Sudan (pre-secession) |
|
|
|
|
|
|
|
|
|
| Suriname |
|
|
|
|
|
|
|
|
|
| Swaziland |
|
|
|
|
|
|
|
|
|
| Sweden |
|
|
|
|
1 |
1 |
1 |
2 |
|
| Switzerland |
3 |
2 |
6 |
6 |
6 |
6 |
6 |
9 |
|
| Syrian Arab Republic |
|
|
|
|
|
|
|
|
|
| Tajikistan |
|
|
|
|
|
|
|
|
|
| Thailand |
2 |
1 |
1 |
|
|
|
|
|
|
| The former Yugoslav Republic of Macedonia |
|
|
|
|
|
|
|
|
|
| Timor-Leste |
|
|
|
|
|
|
|
|
|
| Togo |
|
|
|
|
|
|
|
|
|
| Tokelau |
|
|
|
|
|
|
|
|
|
| Tonga |
|
|
|
|
|
|
|
|
|
| Trinidad and Tobago |
|
|
|
|
|
|
|
|
|
| Tunisia |
|
|
|
|
|
|
|
|
|
| Turkey |
4 |
4 |
3 |
3 |
2 |
1 |
1 |
1 |
|
| Turkmenistan |
|
|
|
|
|
|
|
|
|
| Turks and Caicos Islands |
|
|
|
|
|
|
|
|
|
| Tuvalu |
|
|
|
|
|
|
|
|
|
| Uganda |
|
|
|
|
|
|
|
|
|
| Ukraine |
|
|
|
|
|
|
|
|
|
| United Arab Emirates |
|
|
|
|
|
|
770 |
963 |
1,053 |
| United Kingdom of Great Britain and Northern Ireland |
885 |
976 |
1,163 |
1,265 |
1,546 |
1,643 |
1,692 |
1,816 |
|
| United Republic of Tanzania |
|
|
|
|
|
|
|
|
|
| United States of America |
1,796 |
1,763 |
1,669 |
1,825 |
1,998 |
2,420 |
2,941 |
3,605 |
|
| United States Virgin Islands |
|
|
|
|
|
|
|
|
|
| Uruguay |
|
|
|
|
|
|
|
|
|
| Uzbekistan |
|
|
|
|
|
|
|
|
|
| Vanuatu |
|
|
|
|
|
|
|
|
|
| Venezuela (Bolivarian Republic of) |
|
|
|
|
|
|
|
|
|
| Viet Nam |
|
|
|
|
|
|
|
|
|
| Western Sahara |
|
|
|
|
|
|
|
|
|
| Yemen |
|
|
|
|
|
|
|
|
|
| Zambia |
|
|
|
|
|
|
|
|
|
| Zimbabwe |
|
|
|
|
|
|
|
|
|
Source: UNESCO, UIS
ANNEXED NOTE
1. Technical Notes and Definitions
The table refers to students enrolled in tertiary education (ISCED: levels 5, 6 and beyond)
Education statistics are compiled by UNESCO on the basis of national administrative sources, reported by Ministries of Education or National Statistical Offices of receiving countries.
The number of students enrolled refers to the count of students studying in the reference period.
Students are classified as international students if they left their country of origin and moved to another country for the purpose of study. Figures of mobile students are therefore different from figures of foreign students, who may be studying in the country they were residing prior to enrolling in higher education.
Germany: Data for the years 2008 and beyond are UIS estimates.
Absence of any data for a given country most often reflects “nil or negligible values” pertaining to the mobile students’ nationality.
2. Institution which provides data
Unesco Institute of Statistics (UIS), UNESCO.
3. Data availability
The data was extracted from UIS database UIS.Stat
http://data.uis.unesco.org/
“Education”
“International student mobility in tertiary education”
Topic:”Inbound students”
Sub-topic: “Inbound internationally mobile students by country of origin”
Similar data are also available from OECD and Eurostats databases, for immigration countries relevant to both institutions (OECD countries, EU-28 countries).
Last date of access: March 2015
| Time |
2005 |
2006 |
2007 |
2008 |
2009 |
2010 |
2011 |
2012 |
2013 |
| Afghanistan |
|
|
|
|
|
|
|
|
|
| Albania |
|
|
|
|
|
|
|
|
|
| Algeria |
|
|
|
|
|
|
|
|
|
| American Samoa |
|
|
|
|
|
|
|
|
|
| Andorra |
|
|
|
|
|
|
|
|
|
| Angola |
|
|
|
|
|
|
|
|
|
| Anguilla |
|
|
|
|
|
|
|
|
|
| Antigua and Barbuda |
|
|
|
|
|
|
|
|
|
| Argentina |
|
|
|
|
|
|
|
|
|
| Armenia |
|
|
|
|
|
|
|
|
|
| Aruba |
|
|
|
|
|
|
|
|
|
| Australia |
183 |
210 |
256 |
253 |
234 |
213 |
192 |
148 |
|
| Austria |
|
|
|
1 |
1 |
2 |
1 |
|
|
| Azerbaijan |
|
|
|
|
|
|
|
|
|
| Bahamas |
|
|
|
|
|
|
|
|
|
| Bahrain |
|
|
|
|
|
|
|
|
|
| Bangladesh |
|
|
|
|
|
|
|
|
|
| Barbados |
|
|
|
|
|
|
|
|
|
| Belarus |
|
|
|
|
|
1 |
1 |
2 |
1 |
| Belgium |
|
|
|
|
|
|
|
|
|
| Belize |
|
|
|
|
|
|
|
|
|
| Benin |
|
|
|
|
|
|
|
|
|
| Bermuda |
|
|
|
|
|
|
|
|
|
| Bhutan |
|
|
|
|
|
|
|
|
|
| Bolivia (Plurinational State of) |
|
|
|
|
|
|
|
|
|
| Bosnia and Herzegovina |
|
|
|
|
|
|
|
|
|
| Botswana |
|
|
|
|
|
|
|
|
|
| Brazil |
|
|
|
|
|
6 |
2 |
3 |
|
| British Virgin Islands |
|
|
|
|
|
|
|
|
|
| Brunei Darussalam |
|
|
|
|
|
|
|
|
|
| Bulgaria |
1 |
1 |
1 |
|
1 |
1 |
|
|
|
| Burkina Faso |
|
|
|
|
|
|
|
|
|
| Burundi |
|
|
|
|
|
|
|
|
|
| Cambodia |
|
|
|
|
|
|
|
|
|
| Cameroon |
|
|
|
|
|
|
|
|
|
| Canada |
96 |
105 |
99 |
99 |
87 |
84 |
78 |
|
|
| Cabo Verde |
|
|
|
|
|
|
|
|
|
| Cayman Islands |
|
|
|
|
|
|
|
|
|
| Central African Republic |
|
|
|
|
|
|
|
|
|
| Chad |
|
|
|
|
|
|
|
|
|
| Chile |
|
|
|
|
|
|
|
|
|
| China |
|
|
|
|
|
|
|
|
|
| China, Hong Kong Special Administrative Region |
|
|
|
|
|
|
|
|
|
| China, Macao Special Administrative Region |
|
|
|
|
|
|
|
|
|
| Colombia |
|
|
|
|
|
|
|
|
|
| Comoros |
|
|
|
|
|
|
|
|
|
| Congo |
|
|
|
|
|
|
|
|
|
| Cook Islands |
|
|
|
|
|
|
|
|
|
| Costa Rica |
|
|
|
|
|
|
|
|
|
| Côte d’Ivoire |
|
|
|
|
|
|
|
|
|
| Croatia |
|
|
|
|
|
|
|
|
|
| Cuba |
|
2 |
1 |
1 |
1 |
1 |
1 |
|
|
| Curaçao |
|
|
|
|
|
|
|
|
|
| Cyprus |
|
|
|
1 |
|
|
|
|
|
| Czech Republic |
32 |
21 |
19 |
18 |
7 |
4 |
5 |
4 |
|
| Democratic People’s Republic of Korea |
|
|
|
|
|
|
|
|
|
| Democratic Republic of the Congo |
|
|
|
|
|
|
|
|
|
| Denmark |
1 |
3 |
2 |
|
|
|
|
|
|
| Djibouti |
|
|
|
|
|
|
|
|
|
| Dominica |
|
|
|
|
|
|
|
|
|
| Dominican Republic |
|
|
|
|
|
|
|
|
|
| Ecuador |
|
|
|
|
|
|
|
|
|
| Egypt |
|
|
|
|
|
|
|
|
|
| El Salvador |
|
|
|
|
|
|
|
|
|
| Equatorial Guinea |
|
|
|
|
|
|
|
|
|
| Eritrea |
|
|
|
|
|
|
|
|
|
| Estonia |
|
|
|
|
|
|
|
|
|
| Ethiopia |
|
|
|
|
|
|
|
|
|
| Faeroe Islands |
|
|
|
|
|
|
|
|
|
| Falkland Islands (Malvinas) |
|
|
|
|
|
|
|
|
|
| Fiji |
|
|
|
|
|
|
|
|
|
| Finland |
1 |
|
1 |
|
|
|
1 |
1 |
|
| France |
13 |
17 |
29 |
41 |
50 |
42 |
36 |
34 |
|
| French Guiana |
|
|
|
|
|
|
|
|
|
| French Polynesia |
|
|
|
|
|
|
|
|
|
| Gabon |
|
|
|
|
|
|
|
|
|
| Gambia |
|
|
|
|
|
|
|
|
|
| Georgia |
|
|
|
|
|
|
|
|
|
| Germany |
5 |
6 |
7 |
7 |
5 |
8 |
4 |
7 |
|
| Ghana |
|
|
|
|
|
|
|
|
|
| Gibraltar |
|
|
|
|
|
|
|
|
|
| Greece |
|
|
|
|
|
|
|
|
|
| Grenada |
|
|
|
|
|
|
|
|
|
| Guadeloupe |
|
|
|
|
|
|
|
|
|
| Guam |
|
|
|
|
|
|
|
|
|
| Guatemala |
|
|
|
|
|
|
|
|
|
| Guinea |
|
|
|
|
|
|
|
|
|
| Guinea-Bissau |
|
|
|
|
|
|
|
|
|
| Guyana |
|
|
|
|
|
|
|
|
|
| Haiti |
|
|
|
|
|
|
|
|
|
| Holy See |
|
|
|
|
|
|
|
|
|
| Honduras |
|
|
|
|
|
|
|
|
|
| Hungary |
2 |
1 |
|
|
|
|
|
|
|
| Iceland |
|
|
|
|
|
|
|
|
|
| India |
368 |
435 |
|
|
|
|
270 |
228 |
|
| Indonesia |
|
|
|
|
|
|
|
|
|
| Iran (Islamic Republic of) |
1 |
3 |
3 |
3 |
1 |
1 |
3 |
1 |
|
| Iraq |
|
|
|
|
|
|
|
|
|
| Ireland |
23 |
23 |
18 |
17 |
64 |
30 |
25 |
16 |
|
| Israel |
|
|
|
|
|
|
|
|
|
| Italy |
4 |
2 |
2 |
4 |
3 |
|
|
6 |
|
| Jamaica |
|
|
|
|
|
|
|
|
|
| Japan |
4 |
4 |
5 |
6 |
7 |
6 |
9 |
6 |
|
| Jordan |
371 |
349 |
501 |
634 |
621 |
739 |
664 |
673 |
|
| Kazakhstan |
|
|
|
|
|
|
|
|
|
| Kenya |
|
|
|
|
|
|
|
|
|
| Kiribati |
|
|
|
|
|
|
|
|
|
| Kuwait |
|
|
|
102 |
87 |
|
|
|
|
| Kyrgyzstan |
|
|
|
|
|
|
|
|
|
| Lao People’s Democratic Republic |
|
|
|
|
|
|
|
|
|
| Latvia |
|
|
|
|
|
|
|
|
|
| Lebanon |
|
|
|
|
|
|
|
|
|
| Lesotho |
|
|
|
|
|
|
|
|
|
| Liberia |
|
|
|
|
|
|
|
|
|
| Libya |
|
|
|
|
|
|
|
|
|
| Liechtenstein |
|
|
|
|
|
|
|
|
|
| Lithuania |
|
|
|
|
|
|
|
|
|
| Luxembourg |
|
|
|
|
|
|
|
|
|
| Madagascar |
|
|
|
|
|
|
|
|
|
| Malawi |
|
|
|
|
|
|
|
|
|
| Malaysia |
|
2 |
2 |
80 |
128 |
115 |
167 |
166 |
|
| Maldives |
|
|
|
|
|
|
|
|
|
| Mali |
|
|
|
|
|
|
|
|
|
| Malta |
|
|
|
|
|
|
|
|
|
| Marshall Islands |
|
|
|
|
|
|
|
|
|
| Martinique |
|
|
|
|
|
|
|
|
|
| Mauritania |
|
|
|
|
|
|
|
|
|
| Mauritius |
|
|
|
|
|
|
|
|
|
| Mexico |
|
|
|
|
|
|
|
|
|
| Micronesia (Federated States of) |
|
|
|
|
|
|
|
|
|
| Monaco |
|
|
|
|
|
|
|
|
|
| Mongolia |
|
|
|
|
|
|
|
|
|
| Montenegro |
|
|
|
|
|
|
|
|
|
| Montserrat |
|
|
|
|
|
|
|
|
|
| Morocco |
|
16 |
19 |
16 |
11 |
10 |
|
|
|
| Mozambique |
|
|
|
|
|
|
|
|
|
| Myanmar |
|
|
|
|
|
|
|
|
|
| Namibia |
|
|
|
|
|
|
|
|
|
| Nauru |
|
|
|
|
|
|
|
|
|
| Nepal |
|
|
|
|
|
|
|
|
|
| Netherlands |
|
|
|
|
|
|
|
|
|
| Nl Antilles |
|
|
|
|
|
|
|
|
|
| New Caledonia |
|
|
|
|
|
|
|
|
|
| New Zealand |
16 |
|
29 |
51 |
74 |
84 |
75 |
42 |
|
| Nicaragua |
|
|
|
|
|
|
|
|
|
| Niger |
|
|
|
|
|
|
|
|
|
| Nigeria |
|
|
|
|
|
|
|
|
|
| Niue |
|
|
|
|
|
|
|
|
|
| Norfolk Island |
|
|
|
|
|
|
|
|
|
| Norway |
|
|
|
|
|
|
|
|
|
| Oman |
|
29 |
24 |
70 |
68 |
62 |
70 |
|
31 |
| Pakistan |
|
|
|
|
|
|
|
|
|
| Palau |
|
|
|
|
|
|
|
|
|
| Palestine |
|
|
|
|
|
|
|
|
|
| Panama |
|
|
|
|
|
|
|
|
|
| Papua New Guinea |
|
|
|
|
|
|
|
|
|
| Paraguay |
|
|
|
|
|
|
|
|
|
| Peru |
|
|
|
|
|
|
|
|
|
| Philippines |
3 |
3 |
|
1 |
|
|
|
|
|
| Poland |
|
|
1 |
1 |
1 |
1 |
1 |
1 |
|
| Portugal |
|
|
|
|
2 |
1 |
1 |
|
|
| Puerto Rico |
|
|
|
|
|
|
|
|
|
| Qatar |
112 |
|
|
107 |
108 |
159 |
176 |
217 |
231 |
| Republic of Korea |
1 |
|
|
2 |
3 |
2 |
1 |
|
|
| Republic of Moldova |
|
|
|
|
|
|
|
|
|
| Réunion |
|
|
|
|
|
|
|
|
|
| Romania |
1 |
|
|
1 |
3 |
4 |
3 |
|
|
| Russian Federation |
|
|
|
|
2 |
|
2 |
|
|
| Rwanda |
|
|
|
|
|
|
|
|
|
| Saint Helena |
|
|
|
|
|
|
|
|
|
| Saint Kitts and Nevis |
|
|
|
|
|
|
|
|
|
| Saint Lucia |
|
|
|
|
|
|
|
|
|
| Saint Pierre and Miquelon |
|
|
|
|
|
|
|
|
|
| Saint Vincent and the Grenadines |
|
|
|
|
|
|
|
|
|
| Samoa |
|
|
|
|
|
|
|
|
|
| San Marino |
|
|
|
|
|
|
|
|
|
| Sao Tome and Principe |
|
|
|
|
|
|
|
|
|
| Saudi Arabia |
158 |
154 |
164 |
174 |
184 |
248 |
202 |
269 |
468 |
| Senegal |
|
|
|
|
|
|
|
|
|
| Serbia |
|
|
|
|
|
|
|
|
|
| Seychelles |
|
|
|
|
|
|
|
|
|
| Sierra Leone |
|
|
|
|
|
|
|
|
|
| Singapore |
|
|
|
|
|
|
|
|
|
| Sint Maarten (Dutch part) |
|
|
|
|
|
|
|
|
|
| Slovakia |
11 |
4 |
2 |
2 |
2 |
1 |
1 |
|
|
| Slovenia |
|
|
|
|
|
3 |
|
|
|
| Solomon Islands |
|
|
|
|
|
|
|
|
|
| Somalia |
|
|
|
|
|
|
|
|
|
| South Africa |
|
|
|
|
|
|
|
3 |
|
| South Sudan |
|
|
|
|
|
|
|
|
|
| Spain |
6 |
|
|
|
|
1 |
2 |
4 |
|
| Sri Lanka |
|
|
|
|
|
|
|
|
|
| Sudan |
|
|
|
|
|
|
|
|
|
| Sudan (pre-secession) |
|
|
|
|
|
|
|
|
|
| Suriname |
|
|
|
|
|
|
|
|
|
| Swaziland |
|
|
|
|
|
|
|
|
|
| Sweden |
|
|
|
|
2 |
2 |
1 |
4 |
|
| Switzerland |
|
|
1 |
3 |
4 |
6 |
6 |
3 |
|
| Syrian Arab Republic |
|
|
|
|
|
|
|
|
|
| Tajikistan |
|
|
|
|
|
|
|
|
|
| Thailand |
|
|
1 |
|
2 |
1 |
1 |
4 |
|
| The former Yugoslav Republic of Macedonia |
|
|
|
|
|
|
|
|
|
| Timor-Leste |
|
|
|
|
|
|
|
|
|
| Togo |
|
|
|
|
|
|
|
|
|
| Tokelau |
|
|
|
|
|
|
|
|
|
| Tonga |
|
|
|
|
|
|
|
|
|
| Trinidad and Tobago |
|
|
|
|
|
|
|
|
|
| Tunisia |
|
|
|
|
|
|
|
|
|
| Turkey |
|
1 |
1 |
2 |
2 |
2 |
2 |
2 |
|
| Turkmenistan |
|
|
|
|
|
|
|
|
|
| Turks and Caicos Islands |
|
|
|
|
|
|
|
|
|
| Tuvalu |
|
|
|
|
|
|
|
|
|
| Uganda |
|
|
|
|
|
|
|
|
|
| Ukraine |
|
|
|
|
|
|
|
|
|
| United Arab Emirates |
|
|
|
|
|
|
404 |
467 |
535 |
| United Kingdom of Great Britain and Northern Ireland |
964 |
988 |
953 |
980 |
989 |
1,042 |
1,041 |
1,112 |
|
| United Republic of Tanzania |
|
|
|
|
|
|
|
|
|
| United States of America |
394 |
386 |
401 |
394 |
424 |
411 |
401 |
424 |
|
| United States Virgin Islands |
|
|
|
|
|
|
|
|
|
| Uruguay |
|
|
|
|
|
|
|
|
|
| Uzbekistan |
|
|
|
|
|
|
|
|
|
| Vanuatu |
|
|
|
|
|
|
|
|
|
| Venezuela (Bolivarian Republic of) |
|
|
|
|
|
|
|
|
|
| Viet Nam |
|
|
|
|
|
|
|
|
|
| Western Sahara |
|
|
|
|
|
|
|
|
|
| Yemen |
|
|
|
|
|
|
|
|
|
| Zambia |
|
|
|
|
|
|
|
|
|
| Zimbabwe |
|
|
|
|
|
|
|
|
|
Source: UNESCO, UIS
ANNEXED NOTE
1. Technical Notes and Definitions
The table refers to students enrolled in tertiary education (ISCED: levels 5, 6 and beyond)
Education statistics are compiled by UNESCO on the basis of national administrative sources, reported by Ministries of Education or National Statistical Offices of receiving countries.
The number of students enrolled refers to the count of students studying in the reference period.
Students are classified as international students if they left their country of origin and moved to another country for the purpose of study. Figures of mobile students are therefore different from figures of foreign students, who may be studying in the country they were residing prior to enrolling in higher education.
Germany: Data for the years 2008 and beyond are UIS estimates.
Absence of any data for a given country most often reflects “nil or negligible values” pertaining to the mobile students’ nationality.
2. Institution which provides data
Unesco Institute of Statistics (UIS), UNESCO.
3. Data availability
The data was extracted from UIS database UIS.Stat
http://data.uis.unesco.org/
“Education”
“International student mobility in tertiary education”
Topic:”Inbound students”
Sub-topic: “Inbound internationally mobile students by country of origin”
Similar data are also available from OECD and Eurostats databases, for immigration countries relevant to both institutions (OECD countries, EU-28 countries).
Last date of access: March 2015
|
2005 |
2006 |
2007 |
| Arab countries |
84,134 |
92,629 |
139,991 |
| India |
300,190 |
371,453 |
566,853 |
| Pakistan |
92,238 |
124,297 |
191,736 |
| Bangladesh |
58,614 |
103,840 |
215,113 |
| Philippines |
35,145 |
47,753 |
72,609 |
| Nepal |
21,521 |
23,289 |
37,403 |
| Sri Lanka |
14,627 |
13,090 |
15,797 |
| Afghanistan |
4,025 |
5,198 |
10,336 |
| Iran |
368 |
691 |
3,435 |
| Other Asian countries |
13,951 |
19,754 |
38,740 |
| Africa |
3,410 |
4,401 |
6,507 |
| Europe |
10,639 |
11,092 |
15,579 |
| America |
2,018 |
2,565 |
3,312 |
| Oceania |
709 |
1,082 |
1,704 |
| Total |
641,599 |
821,134 |
1,319,115 |
Source: Statistical Yearbook 2008, Ministry of Labour, UAE.
ANNEXED NOTE
1. Characteristics of data, definitions
The population taken into account is the private sector employees.
2. Institution which provides data
Ministry of Labour, UAE
3. Data availability
The data has been taken from Arab Labour Organisation’s Statistical Yearbook 2010, Chapter “Migration”
http://www.alolabor.org/final/index.php?option=com_jdownloads&Itemid=110&view=view.download&catid=31&cid=95&lang=en
http://www.alolabor.org/final/index.php?option=com_jdownloads&Itemid=110&view=viewcategory&catid=31&lang=ar
Last date of access: March 3, 2015.
| Country or group of countries of nationality |
Normal Hours of Work |
Wages
AED |
Actual Hours of Work |
Earnings
AED |
| United Arab Emirates |
175 |
14,674 |
173 |
15,064 |
| GCC Countries |
194 |
8,892 |
193 |
10,283 |
| Other Arab Countries |
203 |
7,068 |
199 |
7,209 |
| Non Arab Asian countries |
215 |
3,150 |
215 |
3,215 |
| Non Arab African Countries |
205 |
6,026 |
201 |
6,077 |
| European Countries |
198 |
14,408 |
193 |
14,516 |
| North American Countries |
190 |
20,272 |
188 |
20,471 |
| Central American and Caribbean Countries |
222 |
7,977 |
221 |
7,997 |
| South American Countries |
196 |
15,255 |
192 |
15,546 |
| Oceania |
202 |
20,583 |
185 |
20,689 |
| Not Stated |
201 |
5,471 |
200 |
5,533 |
| Total |
212 |
4,242 |
211 |
4,332 |
Source: Employment, Wages, and Hours of Work Survey (October 2008).
ANNEXED NOTE
1. Characteristics of data, definitions
The Employment, Wages and Hours of Work Survey 2008 was conducted on a representative sample of all the establishments employing one worker or more in every Emirate,
excluding the establishments linked to the Armed forces, to the Security sector as well as international and regional corporations.
Sample of survey: all governmental and joint sector establishments; 6,215 non-governmental establishments.
Period of reference: October 2008.
Normal Hours of Work during October 2008
Refers to the total number of hours that the employee normally spends in working in the establishment in accordance with the contract signed between the employee and the establishment, whether he or she is working now or temporarily absent.
Actual Hours of Work during October 2008
Refers to the total number of hours that the employee actually spent in working in the establishment including preparation of work place, repair and maintenance works, waiting for required materials.
The actual hours does NOT include the following:
Paid hours in which the employee did NOT work, such as the public holidays, the employee’s annual leave, and sick leaves; Lunch breaks; The time of transportation from the employee’s residence to the workplace and back.
Wages and salaries in cash
Refers to the wages and salaries paid by the employer to the employee or the worker directly and in cash. The wages and salaries should be paid on regular basis stipulated on the set of regulations agreed upon by both parties (the employer and the employee).
Such regulations include: Basic Salary or wage; Family allowances and supplementary allowances; Educational level or degree allowances; Any other allowances related to profession such as work difficulties and work hazards etc.
1 AED= 0.27 US$ (constant).
2. Institution which provides data
National Bureau of Statistics (NBS).
3. Data availability
The results and metadata of the Survey are available (in English and in Arabic) in the following PDF publication:
http://www.uaestatistics.gov.ae/ReportPDF/P_DSS_SS_%D9%86%D8%B4%D8%B1%D8%A9%20%D9%85%D8%B3%D8%AD%20%D8%A7%D9%84%D8%AA%D9%88%D8%B8%D9%81%20%D9%88%D8%A7%D9%84%D8%A3%D8%AC%D9%88%D8%B1%20%D9%88%D8%B3%D8%A7%D8%B9%D8%A7%D8%AA%20%D8%A7%D9%84%D8%B9%D9%85%D9%84_160912.pdf
A selection of tables appear in Excel format on NBS’s website:
http://www.uaestatistics.gov.ae/EnglishHome/ReportDetailsEnglish/tabid/121/Default.aspx?ItemId=1901&PTID=104&MenuId=1
Last date of access: March 3, 2015.
| Country or group of countries of nationality |
Illiterate |
Read and Write |
Primary |
Preparatory |
Secondary |
Above secondary & below University |
University |
Above University Diploma |
Master |
Doctorate |
Total |
| United Arab Emirates |
245 |
998 |
1,999 |
7,245 |
45,842 |
12,799 |
45,547 |
1,270 |
922 |
155 |
117,022 |
| GCC Countries |
54 |
175 |
321 |
734 |
3,766 |
238 |
681 |
39 |
36 |
7 |
6,051 |
| Other Arab Countries |
3,032 |
20,945 |
15,905 |
34,922 |
101,152 |
34,001 |
116,776 |
4,976 |
4,913 |
1,169 |
337,791 |
| Asian Countries (Non Arab) |
242,792 |
358,894 |
376,507 |
458,988 |
682,446 |
105,206 |
246,990 |
16,583 |
18,526 |
860 |
2,507,792 |
| African Countries (Non Arab) |
162 |
444 |
2,057 |
2,409 |
7,754 |
1,158 |
2,960 |
247 |
174 |
6 |
17,371 |
| European Countries |
0 |
0 |
0 |
0 |
8,149 |
3,455 |
17,347 |
1,458 |
1,517 |
367 |
32,293 |
| North American Countries |
0 |
0 |
0 |
0 |
998 |
328 |
4,446 |
367 |
583 |
74 |
6,796 |
| Central American and Caribbean Countries |
0 |
0 |
0 |
0 |
275 |
7 |
362 |
1 |
6 |
0 |
651 |
| South American Countries |
0 |
0 |
0 |
0 |
100 |
41 |
164 |
172 |
25 |
5 |
507 |
| Oceania |
0 |
0 |
0 |
0 |
637 |
141 |
1,624 |
250 |
841 |
26 |
3,519 |
| Not Stated |
55 |
130 |
214 |
523 |
701 |
249 |
836 |
1 |
3 |
0 |
2,712 |
| Total |
246,340 |
381,586 |
397,003 |
504,821 |
851,820 |
157,623 |
437,733 |
25,364 |
27,546 |
2,669 |
3,032,505 |
Source: Employment, Wages, and Hours of Work Survey ( October 2008 ).
ANNEXED NOTE
1. Characteristics of data, definitions
The Employment, Wages and Hours of Work Survey 2008 was conducted on a representative sample of all the establishments employing one worker or more in every Emirate,
excluding the establishments linked to the Armed forces, to the Security sector as well as international and regional corporations.
Sample of survey: all governmental and joint sector establishments; 6,215 non-governmental establishments.
Period of reference: October 2008.
2. Institution which provides data
National Bureau of Statistics (NBS).
3. Data availability
The results and metadata of the Survey are available (in English and in Arabic) in the following PDF publication:
http://www.uaestatistics.gov.ae/ReportPDF/P_DSS_SS_%D9%86%D8%B4%D8%B1%D8%A9%20%D9%85%D8%B3%D8%AD%20%D8%A7%D9%84%D8%AA%D9%88%D8%B8%D9%81%20%D9%88%D8%A7%D9%84%D8%A3%D8%AC%D9%88%D8%B1%20%D9%88%D8%B3%D8%A7%D8%B9%D8%A7%D8%AA%20%D8%A7%D9%84%D8%B9%D9%85%D9%84_160912.pdf
A selection of tables appear in Excel format on NBS’s website:
http://www.uaestatistics.gov.ae/EnglishHome/ReportDetailsEnglish/tabid/121/Default.aspx?ItemId=1901&PTID=104&MenuId=1
Last date of access: March 3, 2015.
|
United Arab Emirates |
GCC Countries |
Other Arab Countries |
Asian Countries (Non Arab) |
African Countries (Non Arab) |
European Countries |
North American Countries |
Central American and Caribbean Countries |
South American Countries |
Oceania |
Not Stated |
Total |
| 15 – 19 |
1,703 |
55 |
2,394 |
18,505 |
48 |
131 |
18 |
3 |
1 |
4 |
23 |
22,885 |
| 20 – 24 |
17,638 |
670 |
32,660 |
468,726 |
1,362 |
1,942 |
256 |
18 |
17 |
102 |
268 |
523,659 |
| 25 – 29 |
25,605 |
1,468 |
90,330 |
621,096 |
3,597 |
5,332 |
833 |
376 |
95 |
415 |
463 |
749,610 |
| 30 – 34 |
21,568 |
1,547 |
62,721 |
451,622 |
4,375 |
4,891 |
815 |
51 |
175 |
607 |
453 |
548,825 |
| 35 – 39 |
16,328 |
706 |
51,297 |
366,036 |
2,473 |
4,894 |
892 |
22 |
41 |
431 |
284 |
443,404 |
| 40 – 44 |
8,922 |
436 |
30,572 |
202,994 |
1,907 |
5,156 |
1,311 |
10 |
53 |
390 |
204 |
251,955 |
| 45 – 49 |
7,139 |
441 |
23,761 |
126,807 |
1,165 |
4,189 |
1,085 |
15 |
57 |
413 |
824 |
165,896 |
| 50 – 54 |
4,707 |
217 |
16,978 |
88,195 |
495 |
2,389 |
538 |
117 |
12 |
185 |
40 |
113,873 |
| 55 – 59 |
10,106 |
467 |
21,932 |
150,312 |
1,823 |
2,352 |
800 |
38 |
42 |
359 |
143 |
188,374 |
| 60 – 64 |
1,547 |
37 |
4,201 |
9,848 |
99 |
857 |
238 |
1 |
14 |
613 |
7 |
17,462 |
| 65 + |
1,759 |
7 |
945 |
3,651 |
27 |
160 |
10 |
0 |
0 |
0 |
3 |
6,562 |
| Total |
117,022 |
6,051 |
337,791 |
2,507,792 |
17,371 |
32,293 |
6,796 |
651 |
507 |
3,519 |
2,712 |
3,032,505 |
Source: Employment, Wages, and Hours of Work Survey ( October 2008 ).
ANNEXED NOTE
1. Characteristics of data, definitions
The Employment, Wages and Hours of Work Survey 2008 was conducted on a representative sample of all the establishments employing one worker or more in every Emirate,
excluding the establishments linked to the Armed forces, to the Security sector as well as international and regional corporations.
Sample of survey: all governmental and joint sector establishments; 6,215 non-governmental establishments.
Period of reference: October 2008.
2. Institution which provides data
National Bureau of Statistics (NBS).
3. Data availability
The results and metadata of the Survey are available (in English and in Arabic) in the following PDF publication:
http://www.uaestatistics.gov.ae/ReportPDF/P_DSS_SS_%D9%86%D8%B4%D8%B1%D8%A9%20%D9%85%D8%B3%D8%AD%20%D8%A7%D9%84%D8%AA%D9%88%D8%B8%D9%81%20%D9%88%D8%A7%D9%84%D8%A3%D8%AC%D9%88%D8%B1%20%D9%88%D8%B3%D8%A7%D8%B9%D8%A7%D8%AA%20%D8%A7%D9%84%D8%B9%D9%85%D9%84_160912.pdf
A selection of tables appear in Excel format on NBS’s website:
http://www.uaestatistics.gov.ae/EnglishHome/ReportDetailsEnglish/tabid/121/Default.aspx?ItemId=1901&PTID=104&MenuId=1
Last date of access: March 3, 2015.
|
United Arab Emirates |
GCC Countries |
Other Arab Countries |
Asian Countries (Non Arab) |
African Countries (Non Arab) |
European Countries |
North American Countries |
Central American and Caribbean Countries |
South American Countries |
Oceania |
Not Stated |
Total |
| Agriculture, Hunting and Forestry |
10 |
9 |
771 |
5,138 |
209 |
4 |
0 |
0 |
0 |
0 |
0 |
6,141 |
| Mining and Quarrying |
3,956 |
123 |
7,758 |
44,377 |
325 |
1,887 |
367 |
22 |
60 |
45 |
139 |
59,059 |
| Manufacturing |
2,805 |
748 |
30,392 |
364,057 |
740 |
2,010 |
385 |
64 |
14 |
140 |
532 |
401,887 |
| Electricity, Gas and Water Supply |
1,576 |
78 |
2,240 |
8,178 |
13 |
119 |
56 |
0 |
1 |
13 |
2 |
12,276 |
| Construction |
3,219 |
149 |
65,194 |
925,565 |
3,220 |
4,834 |
428 |
341 |
10 |
377 |
25 |
1,003,362 |
| Wholesale and Retail Trade, Repair of Vehicles, Motorcycles and Personal and Household Goods |
6,035 |
188 |
67,082 |
435,490 |
3,284 |
6,015 |
1,391 |
67 |
52 |
922 |
860 |
521,386 |
| Hotels and Restaurants |
668 |
109 |
26,040 |
126,374 |
3,474 |
2,659 |
511 |
16 |
54 |
210 |
6 |
160,121 |
| Transport, Storage and Communications |
12,066 |
625 |
20,749 |
244,434 |
2,642 |
3,703 |
628 |
86 |
37 |
373 |
71 |
285,414 |
| Financial Intermediation |
10,856 |
317 |
12,141 |
34,827 |
276 |
1,551 |
679 |
34 |
12 |
339 |
34 |
61,066 |
| Real Estate, Renting and Business Activities |
4,234 |
443 |
33,428 |
174,579 |
1,822 |
6,061 |
1,012 |
3 |
158 |
596 |
29 |
222,365 |
| Public Administration, Defence and Compulsory Social Security |
70,171 |
3,019 |
40,623 |
52,532 |
406 |
1,483 |
439 |
3 |
66 |
222 |
927 |
169,891 |
| Education |
453 |
146 |
17,723 |
29,491 |
456 |
1,091 |
670 |
12 |
18 |
214 |
23 |
50,297 |
| Health and Social Work |
215 |
40 |
4,842 |
18,812 |
238 |
541 |
168 |
3 |
12 |
30 |
16 |
24,917 |
| Other Community, Social and Personal Service Activities |
758 |
57 |
8,808 |
43,938 |
266 |
335 |
62 |
0 |
13 |
38 |
48 |
54,323 |
| Total |
117,022 |
6,051 |
337,791 |
2,507,792 |
17,371 |
32,293 |
6,796 |
651 |
507 |
3,519 |
2,712 |
3,032,505 |
Source: Employment, Wages, and Hours of Work Survey ( October 2008 ).
ANNEXED NOTE
1. Characteristics of data, definitions
The Employment, Wages and Hours of Work Survey 2008 was conducted on a representative sample of all the establishments employing one worker or more in every Emirate,
excluding the establishments linked to the Armed forces, to the Security sector as well as international and regional corporations.
Sample of survey: all governmental and joint sector establishments; 6,215 non-governmental establishments.
Period of reference: October 2008.
2. Institution which provides data
National Bureau of Statistics (NBS).
3. Data availability
The results and metadata of the Survey are available (in English and in Arabic) in the following PDF publication:
http://www.uaestatistics.gov.ae/ReportPDF/P_DSS_SS_%D9%86%D8%B4%D8%B1%D8%A9%20%D9%85%D8%B3%D8%AD%20%D8%A7%D9%84%D8%AA%D9%88%D8%B8%D9%81%20%D9%88%D8%A7%D9%84%D8%A3%D8%AC%D9%88%D8%B1%20%D9%88%D8%B3%D8%A7%D8%B9%D8%A7%D8%AA%20%D8%A7%D9%84%D8%B9%D9%85%D9%84_160912.pdf
A selection of tables appear in Excel format on NBS’s website:
http://www.uaestatistics.gov.ae/EnglishHome/ReportDetailsEnglish/tabid/121/Default.aspx?ItemId=1901&PTID=104&MenuId=1
Last date of access: March 3, 2015.
|
2005 |
2006 |
2007 |
|
Males |
Females |
Total |
Males |
Females |
Total |
Males |
Females |
Total |
| Agriculture, Hunting and Forestry |
8,471 |
131 |
8,602 |
9,844 |
158 |
10,002 |
12,791 |
247 |
13,038 |
| Fishing |
10,102 |
14 |
10,116 |
10,430 |
10 |
10,440 |
9,751 |
13 |
9,764 |
| Mining and Quarrying |
15,088 |
528 |
15,616 |
15,551 |
617 |
16,168 |
16,380 |
743 |
17,123 |
| Manufacturing |
278,182 |
10,673 |
288,855 |
315,841 |
10,355 |
326,196 |
365,683 |
11,038 |
376,721 |
| Electricity, Gas and Water Supply |
845 |
16 |
861 |
1,025 |
28 |
1,053 |
2,371 |
67 |
2,438 |
| Construction |
909,932 |
6,377 |
916,309 |
1,081,870 |
8,643 |
1,090,513 |
1,361,804 |
12,762 |
1,374,566 |
| Wholesale and Retail Trade; Repair of Motor Vehicles, Motorcycles and Personal and Household Goods |
480,001 |
36,060 |
516,061 |
521,298 |
42,361 |
563,659 |
600,702 |
53,369 |
654,071 |
| Hotels and Restaurants |
82,080 |
7,696 |
89,776 |
85,419 |
8,172 |
93,591 |
96,402 |
9,156 |
105,558 |
| Transport, Storage and Communications |
149,176 |
5,551 |
154,727 |
164,005 |
6,275 |
170,280 |
188,678 |
7,633 |
196,311 |
| Financial Intermediation |
18,263 |
4,669 |
22,932 |
20,985 |
5,854 |
26,839 |
23,582 |
7,620 |
31,202 |
| Real Estate, Renting and Business Activities |
111,865 |
15,190 |
127,055 |
135,906 |
19,088 |
154,994 |
187,368 |
26,956 |
214,324 |
| Education |
16,824 |
12,938 |
29,762 |
18,041 |
15,302 |
33,343 |
18,956 |
21,435 |
40,391 |
| Health and Social Work |
7,972 |
6,961 |
14,933 |
8,147 |
7,635 |
15,782 |
9,771 |
10,383 |
20,154 |
| Other Community, Social and Personal Service Activities |
38,858 |
7,913 |
46,771 |
44,911 |
9,578 |
54,489 |
45,922 |
11,439 |
57,361 |
| Total |
2,127,659 |
114,717 |
2,242,376 |
2,433,263 |
134,086 |
2,567,349 |
2,940,161 |
172,861 |
3,113,022 |
Source: Statistical Yearbook 2008, Ministry of Labour, UAE.
ANNEXED NOTE
1. Characteristics of data, definitions
Classification used is ISIC, Rev. 3. and the population taken into account is the private sector employees.
The categories “Public Administration and Defence; Compulsory Social Security” and “Private Households with Employed Persons” (domestic workers) are not included.
2. Institution which provides data
Ministry of Labour, UAE
3. Data availability
The data has been taken from Arab Labour Organisation’s Statistical Yearbook 2010, Chapter “Migration”
http://www.alolabor.org/final/index.php?option=com_jdownloads&Itemid=110&view=view.download&catid=31&cid=95&lang=en
http://www.alolabor.org/final/index.php?option=com_jdownloads&Itemid=110&view=viewcategory&catid=31&lang=ar
Last date of access: March 3, 2015.
|
United Arab Emirates |
GCC Countries |
Other Arab Countries |
Asian Countries (Non Arab) |
African Countries (Non Arab) |
European Countries |
North American Countries |
Central American and Caribbean Countries |
South American Countries |
Oceania |
Not Stated |
Total |
| Legislators, Senior Officials and Managers |
19,398 |
342 |
38,558 |
102,224 |
2,876 |
12,907 |
2,212 |
38 |
204 |
1,869 |
714 |
181,342 |
| Professionals |
33,006 |
299 |
71,190 |
122,280 |
1,296 |
7,352 |
1,984 |
356 |
142 |
868 |
238 |
239,011 |
| Technicians and Associate Professionals |
33,596 |
1,886 |
58,971 |
202,882 |
2,536 |
6,472 |
1,556 |
83 |
111 |
445 |
423 |
308,961 |
| Clerks |
17,132 |
860 |
27,943 |
141,652 |
1,421 |
1,935 |
823 |
23 |
19 |
163 |
221 |
192,192 |
| Service Workers and Shop and Market Sales Workers |
4,866 |
1,019 |
46,343 |
314,973 |
3,280 |
1,798 |
52 |
3 |
21 |
86 |
68 |
372,509 |
| Skilled Agricultural and Fishery Workers |
70 |
3 |
466 |
5,747 |
2 |
59 |
0 |
0 |
0 |
0 |
0 |
6,347 |
| Craft and Related Trades Workers |
2,128 |
170 |
47,661 |
788,823 |
1,151 |
962 |
105 |
143 |
5 |
43 |
84 |
841,275 |
| Plant and Machine Operators and Assemblers |
3,806 |
955 |
25,567 |
452,748 |
1,567 |
770 |
51 |
4 |
4 |
38 |
628 |
486,138 |
| Elementary Occupations |
2,971 |
502 |
19,454 |
364,017 |
3,105 |
0 |
0 |
0 |
0 |
0 |
305 |
390,354 |
| Not Stated |
49 |
15 |
1,638 |
12,446 |
137 |
38 |
13 |
1 |
1 |
7 |
31 |
14,376 |
| Total |
117,022 |
6,051 |
337,791 |
2,507,792 |
17,371 |
32,293 |
6,796 |
651 |
507 |
3,519 |
2,712 |
3,032,505 |
Source: Employment, Wages, and Hours of Work Survey ( October 2008 ).
ANNEXED NOTE
1. Characteristics of data, definitions
The Employment, Wages and Hours of Work Survey 2008 was conducted on a representative sample of all the establishments employing one worker or more in every Emirate,
excluding the establishments linked to the Armed forces, to the Security sector as well as international and regional corporations.
Sample of survey: all governmental and joint sector establishments; 6,215 non-governmental establishments.
Period of reference: October 2008.
2. Institution which provides data
National Bureau of Statistics (NBS).
3. Data availability
The results and metadata of the Survey are available (in English and in Arabic) in the following PDF publication:
http://www.uaestatistics.gov.ae/ReportPDF/P_DSS_SS_%D9%86%D8%B4%D8%B1%D8%A9%20%D9%85%D8%B3%D8%AD%20%D8%A7%D9%84%D8%AA%D9%88%D8%B8%D9%81%20%D9%88%D8%A7%D9%84%D8%A3%D8%AC%D9%88%D8%B1%20%D9%88%D8%B3%D8%A7%D8%B9%D8%A7%D8%AA%20%D8%A7%D9%84%D8%B9%D9%85%D9%84_160912.pdf
A selection of tables appear in Excel format on NBS’s website:
http://www.uaestatistics.gov.ae/EnglishHome/ReportDetailsEnglish/tabid/121/Default.aspx?ItemId=1901&PTID=104&MenuId=1
Last date of access: March 3, 2015.
|
2005 |
2006 |
2007 |
| Occupation group |
Males |
Females |
Total |
Males |
Females |
Total |
Males |
Females |
Total |
| Managers |
53,222 |
4,090 |
57,312 |
54,395 |
4,714 |
59,109 |
58,167 |
6,167 |
64,334 |
| Specialists |
119,941 |
12,707 |
132,648 |
125,677 |
14,923 |
140,600 |
143,262 |
20,458 |
163,720 |
| Technicians |
76,547 |
26,506 |
103,053 |
69,854 |
16,577 |
86,431 |
66,100 |
20,574 |
86,674 |
| Clerical workers |
91,764 |
19,580 |
111,344 |
108,702 |
36,638 |
145,340 |
132,686 |
49,348 |
182,034 |
| Sales workers |
229,973 |
22,575 |
252,548 |
250,404 |
28,480 |
278,884 |
283,453 |
37,258 |
320,711 |
| Services workers |
204,568 |
20,795 |
225,363 |
232,075 |
24,984 |
257,059 |
285,093 |
31,298 |
316,391 |
| Agriculture, Animal Husbandry and Fishing |
11,881 |
16 |
11,897 |
13,392 |
20 |
13,412 |
16,857 |
17 |
16,874 |
| Industrial, Chemical and Food Industries |
130,692 |
7,083 |
137,775 |
143,141 |
6,283 |
149,424 |
161,186 |
5,941 |
167,127 |
| Engineering Support |
876,485 |
517 |
877,002 |
1,039,755 |
621 |
1,040,376 |
1,307,475 |
770 |
1,308,245 |
| Regular Workers |
330,043 |
701 |
330,744 |
395,196 |
811 |
396,007 |
495,379 |
1,007 |
496,386 |
| Partner/ Investor |
1,678 |
87 |
1,765 |
5 |
2 |
7 |
4 |
1 |
5 |
| Not stated |
875 |
50 |
925 |
667 |
33 |
700 |
499 |
22 |
521 |
| Total |
2,127,659 |
114,717 |
2,242,376 |
2,433,263 |
134,086 |
2,567,349 |
2,940,161 |
172,861 |
3,113,022 |
Source: Statistical Yearbook 2008, Ministry of Labour, UAE.
ANNEXED NOTE
1. Characteristics of data, definitions
Classification used is adapted from ISCO 1988 and the population taken into account is the private sector employees.
2. Institution which provides data
Ministry of Labour, UAE
3. Data availability
The data has been taken from Arab Labour Organisation’s Statistical Yearbook 2010, Chapter “Migration”
http://www.alolabor.org/final/index.php?option=com_jdownloads&Itemid=110&view=view.download&catid=31&cid=95&lang=en
http://www.alolabor.org/final/index.php?option=com_jdownloads&Itemid=110&view=viewcategory&catid=31&lang=ar
Last date of access: March 3, 2015.
|
2005 |
2006 |
2007 |
|
Males |
Females |
Total |
Males |
Females |
Total |
Males |
Females |
Total |
| Egypt |
85,025 |
3,925 |
88,950 |
102,612 |
4,565 |
107,177 |
128,210 |
6,517 |
134,727 |
| Syria |
48,868 |
2,982 |
51,850 |
50,613 |
3,327 |
53,940 |
55,255 |
4,395 |
59,650 |
| Jordan |
23,866 |
2,969 |
26,835 |
23,916 |
3,197 |
27,113 |
25,493 |
4,550 |
30,043 |
| Lebanon |
15,036 |
3,121 |
18,157 |
16,207 |
3,640 |
19,847 |
18,656 |
4,713 |
23,369 |
| Palestine |
12,013 |
1,685 |
13,698 |
13,252 |
1,872 |
15,124 |
15,261 |
2,663 |
17,924 |
| Iraq |
11,911 |
1,458 |
13,369 |
10,881 |
1,463 |
12,344 |
11,183 |
1,964 |
13,147 |
| Sudan |
10,195 |
1,161 |
11,356 |
9,881 |
1,217 |
11,098 |
10,544 |
1,472 |
12,016 |
| Yemen |
9,688 |
326 |
10,014 |
9,431 |
344 |
9,775 |
9,730 |
507 |
10,237 |
| Morocco |
2,690 |
3,082 |
5,772 |
2,939 |
3,396 |
6,335 |
3,340 |
3,911 |
7,251 |
| Somalia |
2,921 |
236 |
3,157 |
2,554 |
243 |
2,797 |
2,414 |
392 |
2,806 |
| Tunisia |
1,089 |
436 |
1,525 |
1,520 |
629 |
2,149 |
1,906 |
891 |
2,797 |
| Algeria |
1,154 |
303 |
1,457 |
1,283 |
338 |
1,621 |
1,412 |
436 |
1,848 |
| Other Arab countries |
711 |
43 |
754 |
671 |
45 |
716 |
740 |
59 |
799 |
| Total Arab countries |
225,170 |
21,724 |
246,894 |
245,760 |
24,276 |
270,036 |
284,144 |
32,470 |
316,614 |
Source: Statistical Yearbook 2008, Ministry of Labour, UAE.
ANNEXED NOTE
1. Characteristics of data, definitions
The population taken into account is the private sector employees.
Arab countries are the Arab League member countries.
2. Institution which provides data
Ministry of Labour, UAE
3. Data availability
The data has been taken from Arab Labour Organisation’s Statistical Yearbook 2010, Chapter “Migration”
http://www.alolabor.org/final/index.php?option=com_jdownloads&Itemid=110&view=view.download&catid=31&cid=95&lang=en
http://www.alolabor.org/final/index.php?option=com_jdownloads&Itemid=110&view=viewcategory&catid=31&lang=ar
Last date of access: March 3, 2015.
|
2005 |
2006 |
2007 |
|
Males |
Females |
Total |
Males |
Females |
Total |
Males |
Females |
Total |
| Arab countries |
225,169 |
21,724 |
246,893 |
245,760 |
24,276 |
270,036 |
284,144 |
32,470 |
316,614 |
| India |
1,123,418 |
28,054 |
1,151,472 |
1,267,843 |
31,560 |
1,299,403 |
1,483,835 |
39,637 |
1,523,472 |
| Pakistan |
365,439 |
2,423 |
367,862 |
409,034 |
2,705 |
411,739 |
483,130 |
3,479 |
486,609 |
| Bangladesh |
202,416 |
1,201 |
203,617 |
261,985 |
1,248 |
263,233 |
375,697 |
1,520 |
377,217 |
| Philippines |
41,641 |
34,093 |
75,734 |
54,914 |
45,083 |
99,997 |
74,654 |
61,074 |
135,728 |
| Nepal |
52,587 |
485,421 |
538,008 |
64,006 |
549 |
64,555 |
80,240 |
822 |
81,062 |
| Sri Lanka |
32,547 |
8,778 |
41,325 |
33,510 |
8,006 |
41,516 |
35,999 |
7,709 |
43,708 |
| Afghanistan |
19,840 |
35 |
19,875 |
22,186 |
33 |
22,219 |
27,215 |
39 |
27,254 |
| Iran |
17,791 |
717 |
18,508 |
16,370 |
857 |
17,227 |
17,093 |
1,359 |
18,452 |
| Other Asian countries |
17,114 |
6,615 |
23,729 |
24,299 |
7,114 |
31,413 |
38,555 |
8,470 |
47,025 |
| Africa |
5,379 |
2,407 |
7,786 |
6,598 |
3,022 |
9,620 |
8,121 |
4,233 |
12,354 |
| Europe |
18,356 |
6,713 |
25,069 |
19,790 |
7,694 |
27,484 |
23,286 |
9,272 |
32,558 |
| America |
4,706 |
1,142 |
5,848 |
5,320 |
1,391 |
6,711 |
6,102 |
1,916 |
8,018 |
| Oceania |
1,176 |
389 |
1,565 |
1,562 |
544 |
2,106 |
2,090 |
861 |
2,951 |
| Non stated |
80 |
5 |
85 |
86 |
4 |
90 |
0 |
0 |
0 |
| Total |
2,127,659 |
114,717 |
2,242,376 |
2,433,263 |
134,086 |
2,567,349 |
2,940,161 |
172,861 |
3,113,022 |
Source: Statistical Yearbook 2008, Ministry of Labour, UAE.
ANNEXED NOTE
1. Characteristics of data, definitions
The population taken into account is the private sector employees.
2. Institution which provides data
Ministry of Labour, UAE
3. Data availability
The data has been taken from Arab Labour Organisation’s Statistical Yearbook 2010, Chapter “Migration”
http://www.alolabor.org/final/index.php?option=com_jdownloads&Itemid=110&view=view.download&catid=31&cid=95&lang=en
http://www.alolabor.org/final/index.php?option=com_jdownloads&Itemid=110&view=viewcategory&catid=31&lang=ar
Last date of access: March 3, 2015.
| Nationality |
Age groups |
Total |
| 15 – 19 |
20 – 24 |
25 – 29 |
30 – 34 |
35 – 39 |
40 – 44 |
45 – 49 |
50 – 54 |
55 – 59 |
60 – 64 |
65+ |
| Emirati |
– |
997 |
1,654 |
1,68 |
1,991 |
2,552 |
3,581 |
2,662 |
1,585 |
1,504 |
– |
18,206 |
| Non Emirati |
1,170 |
18,243 |
37,609 |
27,623 |
38,980 |
32,719 |
20,226 |
9,582 |
7,529 |
3,456 |
– |
197,137 |
| Total |
1,170 |
19,240 |
39,263 |
29,303 |
40,971 |
35,271 |
23,807 |
12,244 |
9,114 |
4,960 |
– |
215,343 |
Source: Labour Force Survey 2011
ANNEXED NOTE
1. Characteristics of data, definitions
DSC has conducted Labour Force Surveys on Dubai Emirate in 2008, 2009, 2011 and 2012.
Sample of LFS 2011: 2303 households (1010 Emirati households, 999 foreign households and 294 collective households) and 500 workers from labour gatherings.
Date of reference: ? 2011.
The time reference of the survey is:
Visit day is the time reference for the family personal data.
The week ended on the visit day is the time reference for the employment status (employed / unemployed).
Month ended on the visit day is the time reference for job search.
The two years ended on the visit day represent the time reference for training of people who are unemployed and seeking a job.
Economically active population: Adult individuals, 15 years old or older, who are either employed or unemployed.
Economically inactive population: Individuals who are below 15 years old and individuals who are 15 years old or older but the definitions of employed and unemployed person are not applicable to them.
2. Institution which provides data
Dubai Statistics Centre (DSC).
3. Data availability
The results of Dubai Labour Force Surveys are available (in English and in Arabic) at:
https://www.dsc.gov.ae/en-us/Themes/Pages/Labour.aspx?Theme=41&year=2011#DSC_Tab1
A selection of tables and analysis from 2011′ Labour Force Survey appear in a publication available on DSC’s website (PDF format, in Arabic only):
https://www.dsc.gov.ae/Publication/%D9%86%D8%B4%D8%B1%D8%A9%20%D9%85%D8%B3%D8%AD%20%D8%A7%D9%84%D9%82%D9%88%D9%89%20%D8%A7%D9%84%D8%B9%D8%A7%D9%85%D9%84%D8%A9%202011.pdf
Some tables (in PDF format), definition of concepts and partial methodological indications are available in the LFS’ project page on DSC’s website:
https://www.dsc.gov.ae/en-us/Programs-Statistical-Surveys/Pages/Statistical-Project-details.aspx?ProjectId=21#DSC_Tab1
Last date of access: February 3, 2015.
In case the links to the primary data source are broken, please refer to the new
DSC website until links to publications are restored.
|
|
Housewife |
Full Time Student |
Not willing
to work |
Has income |
Unable to work |
Retired, less than
65 years old |
Temporarily
disabled |
65 years
and over |
Prisoner |
Total |
| Emiratis |
Male |
– |
13,520 |
434 |
384 |
1,305 |
4,576 |
467 |
4,428 |
10 |
25,124 |
| Female |
18,206 |
12,833 |
5,571 |
41 |
522 |
1,188 |
164 |
4,057 |
36 |
42,618 |
| Total |
18,206 |
26,353 |
6,005 |
425 |
1,827 |
5,764 |
631 |
8,485 |
46 |
67,742 |
| Non – Emiratis |
Male |
– |
31,395 |
1,026 |
86 |
– |
– |
737 |
2,837 |
– |
36,081 |
| Female |
197,137 |
27,009 |
12,180 |
– |
– |
– |
1,340 |
2,836 |
– |
240,502 |
| Total |
197,137 |
58,404 |
13,206 |
86 |
– |
– |
2,077 |
5,673 |
– |
276,583 |
| Total |
Male |
– |
44,915 |
1,460 |
470 |
1,305 |
4,576 |
1,204 |
7,265 |
10 |
61,205 |
| Female |
215,343 |
39,842 |
17,751 |
41 |
522 |
1,188 |
1,504 |
6,893 |
36 |
283,120 |
| Total |
215,343 |
84,757 |
19,211 |
511 |
1,827 |
5,764 |
2,708 |
14,158 |
46 |
344,325 |
Source: Labour Force Survey 2011
ANNEXED NOTE
1. Characteristics of data, definitions
DSC has conducted Labour Force Surveys on Dubai Emirate in 2008, 2009, 2011 and 2012.
Sample of LFS 2011: 2303 households (1010 Emirati households, 999 foreign households and 294 collective households) and 500 workers from labour gatherings.
Date of reference: ? 2011.
The time reference of the survey is:
Visit day is the time reference for the family personal data.
The week ended on the visit day is the time reference for the employment status (employed / unemployed).
Month ended on the visit day is the time reference for job search.
The two years ended on the visit day represent the time reference for training of people who are unemployed and seeking a job.
Economically active population: Adult individuals, 15 years old or older, who are either employed or unemployed.
Economically inactive population: Individuals who are below 15 years old and individuals who are 15 years old or older but the definitions of employed and unemployed person are not applicable to them.
2. Institution which provides data
Dubai Statistics Centre (DSC).
3. Data availability
The results of Dubai Labour Force Surveys are available (in English and in Arabic) at:
https://www.dsc.gov.ae/en-us/Themes/Pages/Labour.aspx?Theme=41&year=2011#DSC_Tab1
A selection of tables and analysis from 2011′ Labour Force Survey appear in a publication available on DSC’s website (PDF format, in Arabic only):
https://www.dsc.gov.ae/Publication/%D9%86%D8%B4%D8%B1%D8%A9%20%D9%85%D8%B3%D8%AD%20%D8%A7%D9%84%D9%82%D9%88%D9%89%20%D8%A7%D9%84%D8%B9%D8%A7%D9%85%D9%84%D8%A9%202011.pdf
Some tables (in PDF format), definition of concepts and partial methodological indications are available in the LFS’ project page on DSC’s website:
https://www.dsc.gov.ae/en-us/Programs-Statistical-Surveys/Pages/Statistical-Project-details.aspx?ProjectId=21#DSC_Tab1
Last date of access: February 3, 2015.
In case the links to the primary data source are broken, please refer to the new
DSC website until links to publications are restored.
|
Educational Status |
| Illiterate |
Read & Write |
Primary |
Preparatory |
Secondary |
Below University |
University |
Above University |
Master |
Doctorate |
Total |
| |
Male |
98 |
169 |
1,765 |
5,203 |
15,237 |
2,921 |
8,032 |
468 |
993 |
226 |
35,112 |
| Emiratis |
Female |
0 |
114 |
99 |
626 |
6,756 |
2,480 |
6,732 |
220 |
555 |
89 |
17,671 |
| |
Total |
98 |
283 |
1,864 |
5,829 |
21,993 |
5,401 |
14,764 |
688 |
1,548 |
315 |
52,783 |
| |
Male |
26,223 |
102,249 |
199,093 |
300,527 |
230,292 |
31,899 |
208,923 |
15,966 |
19,088 |
897 |
1,135,157 |
| Non-Emiratis |
Female |
6,621 |
20,441 |
12,336 |
9,567 |
26,797 |
7,708 |
46,904 |
1,332 |
6,303 |
0 |
138,009 |
| |
Total |
32,844 |
122,690 |
211,429 |
310,094 |
257,089 |
39,607 |
255,827 |
17,298 |
25,391 |
897 |
1,273,166 |
| |
Male |
26,321 |
102,418 |
200,858 |
305,73 |
245,529 |
34,82 |
216,955 |
16,434 |
20,081 |
1,123 |
1,170,269 |
| Total |
Female |
6,621 |
20,555 |
12,435 |
10,193 |
33,553 |
10,188 |
53,636 |
1,552 |
6,858 |
89 |
155,68 |
| |
Total |
32,942 |
122,973 |
213,293 |
315,923 |
279,082 |
45,008 |
270,591 |
17,986 |
26,939 |
1,212 |
1,325,949 |
Source: Labour Force Survey 2011
ANNEXED NOTE
1. Characteristics of data, definitions
DSC has been conducting Labour Force Surveys on Dubai Emirate in 2008, 2009, 2011 and 2012.
Sample of LFS 2011: 2303 households (1010 Emirati households, 999 foreign households and 294 collective households) and 500 workers from labour gatherings.
Date of reference: ? 2011.
The time reference of the survey is:
Visit day is the time reference for the family personal data.
The week ended on the visit day is the time reference for the employment status (employed / unemployed).
Month ended on the visit day is the time reference for job search.
The two years ended on the visit day represent the time reference for training of people who are unemployed and seeking a job.
2. Institution which provides data
Dubai Statistics Centre (DSC).
3. Data availability
The results of Dubai Labour Force Surveys are available (in English and in Arabic) at:
https://www.dsc.gov.ae/en-us/Programs-Statistical-Surveys/Pages/Statistical-Project-details.aspx?ProjectId=21#DSC_Tab1
A selection of tables and analysis from 2011′ Labour Force Survey appear in a publication available on DSC’s website (PDF format, in Arabic only):
https://www.dsc.gov.ae/Publication/%D9%86%D8%B4%D8%B1%D8%A9%20%D9%85%D8%B3%D8%AD%20%D8%A7%D9%84%D9%82%D9%88%D9%89%20%D8%A7%D9%84%D8%B9%D8%A7%D9%85%D9%84%D8%A9%202011.pdf
Some tables (in PDF format), definition of concepts and partial methodological indications are available in the LFS’ project page on DSC’s website:
https://www.dsc.gov.ae/en-us/Programs-Statistical-Surveys/Pages/Statistical-Project-details.aspx?ProjectId=2
Last date of access: February 3, 2015.
| |
Income in 1000 AED |
Number of employed |
| Nationality groups |
Annual income |
Annual income |
Monthly income |
Monthly income |
| (average) |
(average) |
| U.A.E |
312 |
16,443,600 |
26 |
1,370,300 |
52,783 |
| AGCC countries |
461 |
144,648 |
38 |
12,054 |
314 |
| Other Arab countries |
127 |
9,561,936 |
11 |
796,828 |
75,28 |
| Non Arab Asian countries |
54 |
62,709,828 |
5 |
5,225,819 |
1,152,366 |
| Non Arab African countries |
36 |
836,448 |
3 |
69,704 |
23,125 |
| European countries |
521 |
8,834,256 |
43 |
736,188 |
16,951 |
| North American countries |
456 |
1,607,916 |
38 |
133,993 |
3,524 |
| Caribbean & Central American countries |
180 |
68,568 |
15 |
5,714 |
381 |
| South American countries |
664 |
251,640 |
55 |
20,970 |
379 |
| Oceania (Australia, New Zealand, etc.) |
388 |
328,62 |
32 |
27,385 |
846 |
| Grand total |
76 |
100,787,460 |
6 |
8,398,955 |
1,325,949 |
Source: Labour Force Survey 2011
ANNEXED NOTE
1. Characteristics of data, definitions
DSC has been conducting Labour Force Surveys on Dubai Emirate in 2008, 2009, 2011 and 2012.
Sample of LFS 2011: 2303 households (1010 Emirati households, 999 foreign households and 294 collective households) and 500 workers from labour gatherings.
Date of reference: ? 2011.
The time reference of the survey is:
Visit day is the time reference for the family personal data.
The week ended on the visit day is the time reference for the employment status (employed / unemployed).
Month ended on the visit day is the time reference for job search.
The two years ended on the visit day represent the time reference for training of people who are unemployed and seeking a job.
1000 AED as of March 3, 2015: 244 Euros or 272 US$.
2. Institution which provides data
Dubai Statistics Centre (DSC).
3. Data availability
The results of Dubai Labour Force Surveys are available (in English and in Arabic) at:
https://www.dsc.gov.ae/en-us/Themes/Pages/Labour.aspx?Theme=41&year=2011#DSC_Tab1
A selection of tables and analysis from 2011′ Labour Force Survey appear in a publication available on DSC’s website (PDF format, in Arabic only):
https://www.dsc.gov.ae/Publication/%D9%86%D8%B4%D8%B1%D8%A9%20%D9%85%D8%B3%D8%AD%20%D8%A7%D9%84%D9%82%D9%88%D9%89%20%D8%A7%D9%84%D8%B9%D8%A7%D9%85%D9%84%D8%A9%202011.pdf
Some tables (in PDF format), definition of concepts and partial methodological indications are available in the LFS’ project page on DSC’s website:
https://www.dsc.gov.ae/en-us/Programs-Statistical-Surveys/Pages/Statistical-Project-details.aspx?ProjectId=21#DSC_Tab1
Last date of access: February 3, 2015.
In case the links to the primary data source are broken, please refer to the new
DSC website until links to publications are restored.
| |
|
Legislators and senior officials |
Professionals |
Technicians |
Clerks |
Services
and sales |
Craft and related workers |
Plant and machine operators |
Elementary occupations |
Skilled agriculture and fishery workers |
Armed Forces |
Total |
| Emiratis |
Male |
2,883 |
5,792 |
10,694 |
4,123 |
5,787 |
132 |
168 |
130 |
54 |
5,349 |
35,112 |
| Female |
1,339 |
4,099 |
4,683 |
6,633 |
814 |
0 |
0 |
48 |
0 |
55 |
17,671 |
| Total |
4,222 |
9,891 |
15,377 |
10,756 |
6,601 |
132 |
168 |
178 |
54 |
5,404 |
52,783 |
| Non – Emiratis |
Male |
59,882 |
127,524 |
88,939 |
49,027 |
77,034 |
367,093 |
178,891 |
180,759 |
5,982 |
26 |
1,135,157 |
| Female |
5,153 |
27,764 |
22,584 |
13,625 |
66,179 |
432 |
1,536 |
514 |
222 |
0 |
138,009 |
| Total |
65,035 |
155,288 |
111,523 |
62,652 |
143,213 |
367,525 |
180,427 |
181,273 |
6,204 |
26 |
1,273,166 |
| Total |
Male |
62,765 |
133,316 |
99,633 |
53,15 |
82,821 |
367,225 |
179,059 |
180,889 |
6,036 |
5,375 |
1,170,269 |
| Female |
6,492 |
31,863 |
27,267 |
20,258 |
66,993 |
432 |
1,536 |
562 |
222 |
55 |
155,68 |
| Total |
69,257 |
165,179 |
126,9 |
73,408 |
149,814 |
367,657 |
180,595 |
181,451 |
6,258 |
5,43 |
1,325,949 |
Source: Labour Force Survey 2011
ANNEXED NOTE
1. Characteristics of data, definitions
DSC has conducted Labour Force Surveys on Dubai Emirate in 2008, 2009, 2011 and 2012.
Sample of LFS 2011: 2303 households (1010 Emirati households, 999 foreign households and 294 collective households) and 500 workers from labour gatherings.
Date of reference: ? 2011.
The time reference of the survey is:
Visit day is the time reference for the family personal data.
The week ended on the visit day is the time reference for the employment status (employed / unemployed).
Month ended on the visit day is the time reference for job search.
The two years ended on the visit day represent the time reference for training of people who are unemployed and seeking a job.
2. Institution which provides data
Dubai Statistics Centre (DSC).
3. Data availability
The results of Dubai Labour Force Surveys are available (in English and in Arabic) at:
https://www.dsc.gov.ae/en-us/Themes/Pages/Labour.aspx?Theme=41&year=2011#DSC_Tab1
A selection of tables and analysis from 2011′ Labour Force Survey appear in a publication available on DSC’s website (PDF format, in Arabic only):
https://www.dsc.gov.ae/Publication/%D9%86%D8%B4%D8%B1%D8%A9%20%D9%85%D8%B3%D8%AD%20%D8%A7%D9%84%D9%82%D9%88%D9%89%20%D8%A7%D9%84%D8%B9%D8%A7%D9%85%D9%84%D8%A9%202011.pdf
Some tables (in PDF format), definition of concepts and partial methodological indications are available in the LFS’ project page on DSC’s website:
https://www.dsc.gov.ae/en-us/Programs-Statistical-Surveys/Pages/Statistical-Project-details.aspx?ProjectId=21#DSC_Tab1
Last date of access: February 3, 2015.
In case the links to the primary data source are broken, please refer to the new
DSC website until links to publications are restored.
| Nationality |
Sex |
Work status |
| |
|
Employer |
Self Employed |
Salaried |
Work for no wage |
Total |
| Emiratis |
Male |
2,417 |
428 |
32,267 |
– |
35,112 |
| Female |
74 |
65 |
17,532 |
– |
17,671 |
| Total |
2,491 |
493 |
49,799 |
– |
52,783 |
| Non – Emiratis |
Male |
36,371 |
8,472 |
1,090,314 |
– |
1,135,157 |
| Female |
3,168 |
160 |
134,681 |
– |
138,009 |
| Total |
39,539 |
8,632 |
1,224,995 |
– |
1,273,166 |
| Total |
Male |
38,788 |
8,9 |
1,122,581 |
– |
1,170,269 |
| Female |
3,242 |
225 |
152,213 |
– |
155,68 |
| Total |
42,03 |
9,125 |
1,274,794 |
– |
1,325,949 |
Source: Labour Force Survey 2011
ANNEXED NOTE
1. Characteristics of data, definitions
DSC has conducted Labour Force Surveys on Dubai Emirate in 2008, 2009, 2011 and 2012.
Sample of LFS 2011: 2303 households (1010 Emirati households, 999 foreign households and 294 collective households) and 500 workers from labour gatherings.
Date of reference: ? 2011.
The time reference of the survey is:
Visit day is the time reference for the family personal data.
The week ended on the visit day is the time reference for the employment status (employed / unemployed).
Month ended on the visit day is the time reference for job search.
The two years ended on the visit day represent the time reference for training of people who are unemployed and seeking a job.
2. Institution which provides data
Dubai Statistics Centre (DSC).
3. Data availability
The results of Dubai Labour Force Surveys are available (in English and in Arabic) at:
https://www.dsc.gov.ae/en-us/Themes/Pages/Labour.aspx?Theme=41&year=2011#DSC_Tab1
A selection of tables and analysis from 2011′ Labour Force Survey appear in a publication available on DSC’s website (PDF format, in Arabic only):
https://www.dsc.gov.ae/Publication/%D9%86%D8%B4%D8%B1%D8%A9%20%D9%85%D8%B3%D8%AD%20%D8%A7%D9%84%D9%82%D9%88%D9%89%20%D8%A7%D9%84%D8%B9%D8%A7%D9%85%D9%84%D8%A9%202011.pdf
Some tables (in PDF format), definition of concepts and partial methodological indications are available in the LFS’ project page on DSC’s website:
https://www.dsc.gov.ae/en-us/Programs-Statistical-Surveys/Pages/Statistical-Project-details.aspx?ProjectId=21#DSC_Tab1
Last date of access: February 3, 2015.
In case the links to the primary data source are broken, please refer to the new
DSC website until links to publications are restored.
| |
Occupation |
| Nationality groups |
Legislators and senior officials |
Professionals |
Technicians |
Clerks |
Services
and sales |
Craft and related workers |
Plant and machine operators |
Elementary occupations |
Skilled agriculture and fishery workers |
Armed Forces |
Total |
| U.A.E |
4,222 |
9,891 |
15,377 |
10,756 |
6,601 |
132 |
168 |
178 |
54 |
5,404 |
52,783 |
| AGCC countries |
134 |
64 |
12 |
78 |
– |
– |
– |
– |
– |
26 |
314 |
| Other Arab countries |
7,121 |
25,446 |
11,858 |
4,632 |
5,961 |
6,021 |
5,118 |
8,190 |
933 |
– |
75,280 |
| Non Arab Asian countries |
49,571 |
120,918 |
93,337 |
56,903 |
119,361 |
361,307 |
175,206 |
170,492 |
5,271 |
– |
1,152,366 |
| Non Arab African countries |
834 |
552 |
1,214 |
230 |
17,404 |
197 |
103 |
2,591 |
– |
– |
23,125 |
| European countries |
5,670 |
6,341 |
3,644 |
809 |
487 |
– |
– |
– |
– |
– |
16,951 |
| North American countries |
1,113 |
1,467 |
944 |
– |
– |
– |
– |
– |
– |
– |
3,524 |
| Caribbean & Central American countries |
381 |
– |
– |
– |
– |
– |
– |
– |
– |
– |
381 |
| South American countries |
– |
– |
379 |
– |
– |
– |
– |
– |
– |
– |
379 |
| Oceania (Australia, New Zealand, etc.) |
211 |
500 |
135 |
– |
– |
– |
– |
– |
– |
– |
846 |
| Total non-Emiratis |
65,035 |
155,288 |
111,523 |
62,652 |
143,213 |
367,525 |
180,427 |
181,273 |
6,204 |
26 |
1,273,166 |
| Grand total |
69,257 |
165,179 |
126,900 |
73,408 |
149,814 |
367,657 |
180,595 |
181,451 |
6,258 |
5,430 |
1,325,949 |
Source: Labour Force Survey 2011
ANNEXED NOTE
1. Characteristics of data, definitions
DSC has been conducting Labour Force Surveys on Dubai Emirate in 2008, 2009, 2011 and 2012.
Sample of LFS 2011: 2303 households (1010 Emirati households, 999 foreign households and 294 collective households) and 500 workers from labour gatherings.
Date of reference: ? 2011.
The time reference of the survey is:
Visit day is the time reference for the family personal data.
The week ended on the visit day is the time reference for the employment status (employed / unemployed).
Month ended on the visit day is the time reference for job search.
The two years ended on the visit day represent the time reference for training of people who are unemployed and seeking a job.
2. Institution which provides data
Dubai Statistics Centre (DSC).
3. Data availability
The results of Dubai Labour Force Surveys are available (in English and in Arabic) at:
https://www.dsc.gov.ae/en-us/Themes/Pages/Labour.aspx?Theme=41&year=2011#DSC_Tab1
A selection of tables and analysis from 2011′ Labour Force Survey appear in a publication available on DSC’s website (PDF format, in Arabic only):
https://www.dsc.gov.ae/Publication/%D9%86%D8%B4%D8%B1%D8%A9%20%D9%85%D8%B3%D8%AD%20%D8%A7%D9%84%D9%82%D9%88%D9%89%20%D8%A7%D9%84%D8%B9%D8%A7%D9%85%D9%84%D8%A9%202011.pdf
Some tables (in PDF format), definition of concepts and partial methodological indications are available in the LFS’ project page on DSC’s website:
https://www.dsc.gov.ae/en-us/Programs-Statistical-Surveys/Pages/Statistical-Project-details.aspx?ProjectId=21#DSC_Tab1
Last date of access: February 3, 2015.
In case the links to the primary data source are broken, please refer to the new
DSC website until links to publications are restored.
| |
|
Legislators and senior officials |
Professionals |
Technicians |
Clerks |
Services
and sales |
Craft and related workers |
Plant and machine operators |
Elementary occupations |
Skilled agriculture and fishery workers |
Armed Forces |
Total |
| Emiratis |
Male |
2,883 |
5,792 |
10,694 |
4,123 |
5,787 |
132 |
168 |
130 |
54 |
5,349 |
35,112 |
| Female |
1,339 |
4,099 |
4,683 |
6,633 |
814 |
0 |
0 |
48 |
0 |
55 |
17,671 |
| Total |
4,222 |
9,891 |
15,377 |
10,756 |
6,601 |
132 |
168 |
178 |
54 |
5,404 |
52,783 |
| Non – Emiratis |
Male |
59,882 |
127,524 |
88,939 |
49,027 |
77,034 |
367,093 |
178,891 |
180,759 |
5,982 |
26 |
1,135,157 |
| Female |
5,153 |
27,764 |
22,584 |
13,625 |
66,179 |
432 |
1,536 |
514 |
222 |
0 |
138,009 |
| Total |
65,035 |
155,288 |
111,523 |
62,652 |
143,213 |
367,525 |
180,427 |
181,273 |
6,204 |
26 |
1,273,166 |
| Total |
Male |
62,765 |
133,316 |
99,633 |
53,15 |
82,821 |
367,225 |
179,059 |
180,889 |
6,036 |
5,375 |
1,170,269 |
| Female |
6,492 |
31,863 |
27,267 |
20,258 |
66,993 |
432 |
1,536 |
562 |
222 |
55 |
155,68 |
| Total |
69,257 |
165,179 |
126,9 |
73,408 |
149,814 |
367,657 |
180,595 |
181,451 |
6,258 |
5,43 |
1,325,949 |
Source: Labour Force Survey 2011
ANNEXED NOTE
1. Characteristics of data, definitions
DSC has conducted Labour Force Surveys on Dubai Emirate in 2008, 2009, 2011 and 2012.
Sample of LFS 2011: 2303 households (1010 Emirati households, 999 foreign households and 294 collective households) and 500 workers from labour gatherings.
Date of reference: ? 2011.
The time reference of the survey is:
Visit day is the time reference for the family personal data.
The week ended on the visit day is the time reference for the employment status (employed / unemployed).
Month ended on the visit day is the time reference for job search.
The two years ended on the visit day represent the time reference for training of people who are unemployed and seeking a job.
2. Institution which provides data
Dubai Statistics Centre (DSC).
3. Data availability
The results of Dubai Labour Force Surveys are available (in English and in Arabic) at:
https://www.dsc.gov.ae/en-us/Themes/Pages/Labour.aspx?Theme=41&year=2011#DSC_Tab1
A selection of tables and analysis from 2011′ Labour Force Survey appear in a publication available on DSC’s website (PDF format, in Arabic only):
https://www.dsc.gov.ae/Publication/%D9%86%D8%B4%D8%B1%D8%A9%20%D9%85%D8%B3%D8%AD%20%D8%A7%D9%84%D9%82%D9%88%D9%89%20%D8%A7%D9%84%D8%B9%D8%A7%D9%85%D9%84%D8%A9%202011.pdf
Some tables (in PDF format), definition of concepts and partial methodological indications are available in the LFS’ project page on DSC’s website:
https://www.dsc.gov.ae/en-us/Programs-Statistical-Surveys/Pages/Statistical-Project-details.aspx?ProjectId=21#DSC_Tab1
Last date of access: February 3, 2015.
In case the links to the primary data source are broken, please refer to the new
DSC website until links to publications are restored.
| Nationality |
Sex |
Economic Activity Status |
Total Population (15 years and over ) |
% |
| Non-Economically Active |
Economically Active |
| Housewife |
Full time student |
Other |
Total |
% |
Employed |
Unemployed |
Total |
% |
| Emiratis |
Male |
0 |
13,520 |
11,604 |
25,124 |
40.8 |
35,112 |
1,364 |
36,476 |
59.2 |
61,600 |
100 |
| Female |
18,206 |
12,833 |
11,579 |
42,618 |
68.6 |
17,671 |
1,806 |
19,477 |
31.4 |
62,095 |
100 |
| Total |
18,206 |
26,353 |
23,183 |
67,742 |
54.8 |
52,783 |
3,170 |
55,953 |
45.2 |
123,695 |
100 |
| Non – Emiratis |
Male |
0 |
31,395 |
4,686 |
36,081 |
3.1 |
1,135,157 |
560 |
1,135,717 |
96.9 |
1,171,798 |
100 |
| Female |
197,137 |
27,009 |
16,356 |
240,502 |
63.2 |
138,009 |
1,902 |
139,911 |
36.8 |
380,413 |
100 |
| Total |
197,137 |
58,404 |
21,042 |
276,583 |
17.8 |
1,273,166 |
2,462 |
1,275,628 |
82.2 |
1,552,211 |
100 |
| Total |
Male |
0 |
44,915 |
16,290 |
61,205 |
5.0 |
1,170,269 |
1,924 |
1,172,193 |
95.0 |
1,233,398 |
100 |
| Female |
215,343 |
39,842 |
27,935 |
283,120 |
64.0 |
155,680 |
3,708 |
159,388 |
36.0 |
442,508 |
100 |
| Total |
215,343 |
84,757 |
44,225 |
344,325 |
20.5 |
1,325,949 |
5,632 |
1,331,581 |
79.5 |
1,675,906 |
100 |
Source: Labour Force Survey 2011
ANNEXED NOTE
1. Characteristics of data, definitions
DSC has been conducting Labour Force Surveys on Dubai Emirate in 2008, 2009, 2011 and 2012.
Sample of LFS 2011: 2303 households (1010 Emirati households, 999 foreign households and 294 collective households) and 500 workers from labour gatherings.
Date of reference: ? 2011.
The time reference of the survey is:
Visit day is the time reference for the family personal data.
The week ended on the visit day is the time reference for the employment status (employed / unemployed).
Month ended on the visit day is the time reference for job search.
The two years ended on the visit day represent the time reference for training of people who are unemployed and seeking a job.
Economically active population: Adult individuals, 15 years old or older, who are either employed or unemployed.
Economically inactive population: Individuals who are below 15 years old and individuals who are 15 years old or older but the definitions of employed and unemployed person are not applicable to them.
2. Institution which provides data
Dubai Statistics Centre (DSC).
3. Data availability
The results of Dubai Labour Force Surveys are available (in English and in Arabic) at:
https://www.dsc.gov.ae/en-us/Themes/Pages/Labour.aspx?Theme=41&year=2011#DSC_Tab1
A selection of tables and analysis from 2011′ Labour Force Survey appear in a publication available on DSC’s website (PDF format, in Arabic only):
https://www.dsc.gov.ae/Publication/%D9%86%D8%B4%D8%B1%D8%A9%20%D9%85%D8%B3%D8%AD%20%D8%A7%D9%84%D9%82%D9%88%D9%89%20%D8%A7%D9%84%D8%B9%D8%A7%D9%85%D9%84%D8%A9%202011.pdf
Some tables (in PDF format), definition of concepts and partial methodological indications are available in the LFS’ project page on DSC’s website:
https://www.dsc.gov.ae/en-us/Programs-Statistical-Surveys/Pages/Statistical-Project-details.aspx?ProjectId=21#DSC_Tab1
Last date of access: February 3, 2015.
In case the links to the primary data source are broken, please refer to the new
DSC website until links to publications are restored.
| Nationality groups |
Males |
Females |
Total |
| U.A.E |
35,112 |
17,671 |
52,783 |
| AGCC countries |
181 |
133 |
314 |
| Other Arab countries |
65,684 |
9,596 |
75,28 |
| Non Arab Asian countries |
1,047,334 |
105,032 |
1,152,366 |
| Non Arab African countries |
5,303 |
17,822 |
23,125 |
| European countries |
13,145 |
3,806 |
16,951 |
| North American countries |
2,285 |
1,239 |
3,524 |
| Caribbean & Central American countries |
0 |
381 |
381 |
| South American countries |
379 |
0 |
379 |
| Oceania (Australia, New Zealand, etc.) |
846 |
0 |
846 |
| Total non-Emiratis |
1,135,157 |
138,009 |
1,197,886 |
| Grand total |
1,170,269 |
155,680 |
1,325,949 |
Source: Labour Force Survey 2011
ANNEXED NOTE
1. Characteristics of data, definitions
DSC has been conducting Labour Force Surveys on Dubai Emirate in 2008, 2009, 2011 and 2012.
Sample of LFS 2011: 2303 households (1010 Emirati households, 999 foreign households and 294 collective households) and 500 workers from labour gatherings.
Date of reference: ? 2011.
The time reference of the survey is:
Visit day is the time reference for the family personal data.
The week ended on the visit day is the time reference for the employment status (employed / unemployed).
Month ended on the visit day is the time reference for job search.
The two years ended on the visit day represent the time reference for training of people who are unemployed and seeking a job.
2. Institution which provides data
Dubai Statistics Centre (DSC).
3. Data availability
The results of Dubai Labour Force Surveys are available (in English and in Arabic) at:
https://www.dsc.gov.ae/en-us/Themes/Pages/Labour.aspx?Theme=41&year=2011#DSC_Tab1
A selection of tables and analysis from 2011′ Labour Force Survey appear in a publication available on DSC’s website (PDF format, in Arabic only):
https://www.dsc.gov.ae/Publication/%D9%86%D8%B4%D8%B1%D8%A9%20%D9%85%D8%B3%D8%AD%20%D8%A7%D9%84%D9%82%D9%88%D9%89%20%D8%A7%D9%84%D8%B9%D8%A7%D9%85%D9%84%D8%A9%202011.pdf
Some tables (in PDF format), definition of concepts and partial methodological indications are available in the LFS’ project page on DSC’s website:
https://www.dsc.gov.ae/en-us/Programs-Statistical-Surveys/Pages/Statistical-Project-details.aspx?ProjectId=21#DSC_Tab1
Last date of access: February 3, 2015.
In case the links to the primary data source are broken, please refer to the new
DSC website until links to publications are restored.
| |
1993 |
|
|
2000 |
2005 |
*2012 |
*2013 |
| Age groups |
Male |
Female |
Total |
Male |
Female |
Total |
Male |
Female |
Total |
Male |
Female |
Total |
Male |
Female |
Total |
| 0 – 4 |
26,561 |
24,058 |
50,619 |
25,112 |
23,242 |
48,354 |
28,070 |
26,623 |
54,693 |
42,059 |
36,154 |
78,213 |
44,058 |
38,489 |
82,547 |
| 5 – 9 |
30,998 |
27,389 |
58,387 |
28,316 |
25,023 |
53,339 |
29,239 |
27,083 |
56,322 |
44,470 |
36,567 |
81,037 |
46,580 |
38,931 |
85,511 |
| 10 – 14 |
25,992 |
23,122 |
49,114 |
26,803 |
23,794 |
50,597 |
25,604 |
23,316 |
48,920 |
43,935 |
36,904 |
80,839 |
46,017 |
39,293 |
85,310 |
| 15 – 19 |
17,197 |
15,232 |
32,429 |
21,913 |
20,291 |
42,204 |
23,077 |
20,540 |
43,617 |
40,971 |
37,049 |
78,020 |
42,915 |
39,457 |
82,372 |
| 20 – 24 |
29,483 |
17,729 |
47,212 |
47,243 |
23,683 |
70,926 |
94,354 |
40,914 |
135,268 |
153,176 |
61,413 |
214,589 |
160,291 |
65,536 |
225,827 |
| 25 – 29 |
55,152 |
25,249 |
80,401 |
102,706 |
33,916 |
136,622 |
205,183 |
51,201 |
256,384 |
332,761 |
77,844 |
410,605 |
348,152 |
83,140 |
431,292 |
| 30 – 34 |
61,409 |
24,562 |
85,971 |
106,880 |
32,226 |
139,106 |
208,510 |
48,128 |
256,638 |
338,273 |
73,965 |
412,238 |
353,911 |
79,013 |
432,924 |
| 35 – 39 |
60,009 |
19,936 |
79,945 |
98,759 |
27,731 |
126,490 |
160,150 |
35,837 |
195,987 |
259,820 |
54,527 |
314,347 |
271,834 |
58,237 |
330,071 |
| 40 – 44 |
46,518 |
11,849 |
58,367 |
69,626 |
17,096 |
86,722 |
98,178 |
24,312 |
122,490 |
159,123 |
37,029 |
196,152 |
166,485 |
39,539 |
206,024 |
| 45 – 49 |
26,794 |
6,848 |
33,642 |
45,754 |
11,211 |
56,965 |
57,920 |
14,810 |
72,730 |
93,856 |
22,477 |
116,333 |
98,203 |
23,985 |
122,188 |
| 50 – 54 |
13,896 |
3,501 |
17,397 |
23,083 |
5,944 |
29,027 |
34,141 |
9,451 |
43,592 |
55,334 |
14,291 |
69,625 |
57,900 |
15,241 |
73,141 |
| 55 – 59 |
6,282 |
1,900 |
8,182 |
8,527 |
2,711 |
11,238 |
15,072 |
4,524 |
19,596 |
24,196 |
6,786 |
30,982 |
25,321 |
7,227 |
32,548 |
| 60 – 64 |
2,912 |
1,298 |
4,210 |
3,717 |
1,456 |
5,173 |
5,301 |
2,339 |
7,640 |
8,112 |
3,348 |
11,460 |
8,494 |
3,557 |
12,051 |
| 65 – 69 |
1,380 |
873 |
2,253 |
1,784 |
1,001 |
2,785 |
1,938 |
1,224 |
3,162 |
3,010 |
1,908 |
4,918 |
3,155 |
2,023 |
5,178 |
| 70 – 74 |
808 |
721 |
1,529 |
829 |
648 |
1,477 |
1,184 |
912 |
2,096 |
1,755 |
1,328 |
3,083 |
1,840 |
1,407 |
3,247 |
| 75 + |
737 |
531 |
1,268 |
747 |
615 |
1,362 |
1,384 |
934 |
2,318 |
2,074 |
1,360 |
3,434 |
2,174 |
1,440 |
3,614 |
| Total |
406,128 |
204,798 |
610,926 |
611,799 |
250,588 |
862,387 |
989,305 |
332,148 |
1,321,453 |
1,602,925 |
502,950 |
2,105,875 |
1,677,330 |
536,515 |
2,213,845 |
Source : Dubai Statistics Center
ANNEXED NOTE
1. Characteristics of data, definitions and population counting operations in the UAE
* 2012 and 2013 figures are estimates for the end of the given year.
Figures presented concern the total population (Emiratis and foreign nationals) residing in the Emirate of Dubai at the given date.
The first population census was conducted in 1968 by the Council of Developing Trucial States.
After Independence in 1971, a population census of the Emirate of Abu Dhabi was conducted that same year.
The first general population and establishments census in the UAE was conducted in 1975. It was the first census in the region following scientific standards and international recommendations. The other federal censuses were conducted in 1980, 1985, 1995 and 2005.
Reference days for UAE censuses: 30/12/1975; 15/12/1980, 16/12/1985, 16/12/1995; 29/10/2001; 06/12/2005.
Implementation method: the census was carried out according to de jure methodology, i.e. counting persons using their usual place of residence
Population of reference: Emirati nationals usually residing in the country+all foreign residents holding a valid residence permit+resident GCC nationals (nationals of other GCC states don’t need a permit to stay in the UAE)
2. Institution which provides data
Dubai Statistics Centre (DSC).
3. Data availability
The data is retrieved from Dubai Statistical Yearbook 2012, chapter “Population and Vital Statistics”.
Data is presented in Excel format.
https://www.dsc.gov.ae/en-us/Themes/Pages/Population-and-Vital-Statistics.aspx?Theme=42
Dubai SYBs are available online back to 2001 SYB.
https://www.dsc.gov.ae/En/Publications/Pages/Publications.aspx
The estimate for 2013 is taken from the Population Bulletin of the Emirate of Dubai, published annually by DSC.
The Bulletin is available online in PDF format. It presents no data disagregated by nationality.
https://www.dsc.gov.ae/Publication/%d9%86%d8%b4%d8%b1%d8%a9%20%d8%a7%d9%84%d8%b3%d9%83%d8%a7%d9%86%202013%20En.pdf
Last date of access: February 3, 2015.
In case the links to the primary data source are broken, please refer to the new
DSC website until links to publications are restored.
| Years |
Male |
Female |
Total |
| 1953 |
… |
… |
50,000 |
| 1968 |
… |
… |
59,000 |
| 1975 |
128,821 |
54,366 |
183,187 |
| 1980 |
187,714 |
88,587 |
276,301 |
| 1985 |
247,179 |
123,609 |
370,788 |
| 1993 |
406,128 |
204,798 |
610,926 |
| 1995 |
478,209 |
211,211 |
689,420 |
| 2000 |
611,799 |
250,588 |
862,387 |
| 2005 |
989,305 |
332,148 |
1,321,453 |
| 2006* |
1,073,485 |
348,327 |
1,421,812 |
| 2007* |
1,164,576 |
365,216 |
1,529,792 |
| 2008* |
1,263,130 |
382,843 |
1,645,973 |
| 2009* |
1,369,740 |
401,238 |
1,770,978 |
| 2010* |
1,485,046 |
420,430 |
1,905,476 |
| 2011* |
1,536,380 |
466,790 |
2,003,170 |
| 2012* |
1,602,925 |
502,950 |
2,105,875 |
| 2013* |
1,677,330 |
536,515 |
2,213,845 |
Sources: Dubai Statistics Center (Censuses of 1993, 2000, 2005 and estimates 2006-2013)
Ministry of Economy (previously Planning) (Censuses of 1968, 1975, 1980, 1985, 1995)
Kuwait Mission Knowledge Report 1953.
ANNEXED NOTE
1. Characteristics of data, definitions and population counting operations in the UAE
* 2012 and 2013 figures are estimates for the end of the given year.
Figures presented concern the total population (Emiratis and foreign nationals) residing in the Emirate of Dubai at the given date.
The first population census was conducted in 1968 by the Council of Developing Trucial States.
After Independence in 1971, a population census of the Emirate of Abu Dhabi was conducted that same year.
The first general population and establishments census in the UAE was conducted in 1975. It was the first census in the region following scientific standards and international recommendations. The other federal censuses were conducted in 1980, 1985, 1995 and 2005.
Reference days for UAE censuses: 30/12/1975; 15/12/1980, 16/12/1985, 16/12/1995; 29/10/2001; 06/12/2005.
Implementation method: the census was carried out according to de jure methodology, i.e. counting persons using their usual place of residence
Population of reference: Emirati nationals usually residing in the country+all foreign residents holding a valid residence permit+resident GCC nationals (nationals of other GCC states don’t need a permit to stay in the UAE)
2. Institution which provides data
Dubai Statistics Centre (DSC).
3. Data availability
The data is retrieved from Dubai Statistical Yearbook 2012, chapter “Population and Vital Statistics”.
Data is presented in Excel format.
https://www.dsc.gov.ae/en-us/Themes/Pages/Population-and-Vital-Statistics.aspx?Theme=42
Dubai SYBs are available online back to 2001 SYB.
https://www.dsc.gov.ae/En/Publications/Pages/Publications.aspx
The estimate for 2013 is taken from the Population Bulletin of the Emirate of Dubai, published annually by DSC.
The Bulletin is available online in PDF format. It presents no data disagregated by nationality.
https://www.dsc.gov.ae/Publication/%d9%86%d8%b4%d8%b1%d8%a9%20%d8%a7%d9%84%d8%b3%d9%83%d8%a7%d9%86%202013%20En.pdf
Last date of access: February 3, 2015.
In case the links to the primary data source are broken, please refer to the new
DSC website until links to publications are restored.
| Year |
Nationals |
Non-nationals |
Total |
% of non-nationals in total resident population |
| 1960 |
11,064 |
8,844 |
19,908 |
44.4 |
| 1961 |
12,584 |
11,507 |
24,091 |
47.8 |
| 1962 |
14,104 |
14,170 |
28,274 |
50.1 |
| 1963 |
14,921 |
15,529 |
30,450 |
51.0 |
| 1964 |
15,786 |
17,027 |
32,813 |
51.9 |
| 1965 |
16,701 |
18,681 |
35,382 |
52.8 |
| 1966 |
17,669 |
20,510 |
38,179 |
53.7 |
| 1967 |
18,694 |
22,534 |
41,228 |
54.7 |
| 1968 |
19,778 |
24,774 |
44,552 |
55.6 |
| 1969 |
22,707 |
31,708 |
54,415 |
58.3 |
| 1970 |
26,071 |
40,642 |
66,713 |
66.1 |
| 1971 |
29,935 |
52,176 |
82,111 |
69.0 |
| 1972 |
34,373 |
67,101 |
101,474 |
70.9 |
| 1973 |
39,471 |
86,462 |
125,933 |
72.1 |
| 1974 |
45,327 |
111,644 |
156,971 |
71.1 |
| 1975 |
52,054 |
144,485 |
196,539 |
73.5 |
| 1976 |
57,659 |
170,786 |
228,445 |
74.8 |
| 1977 |
63,868 |
201,890 |
265,758 |
76.0 |
| 1978 |
70,745 |
238,677 |
309,422 |
77.1 |
| 1979 |
78,362 |
282,187 |
360,549 |
78.3 |
| 1980 |
86,799 |
333,656 |
420,455 |
79.4 |
| 1981 |
94,159 |
349,393 |
443,552 |
78.8 |
| 1982 |
102,146 |
366,133 |
468,279 |
78.2 |
| 1983 |
110,814 |
383,958 |
494,772 |
77.6 |
| 1984 |
120,222 |
402,959 |
523,181 |
77.0 |
| 1985 |
130,433 |
423,235 |
553,668 |
76.4 |
| 1986 |
137,291 |
445,204 |
582,495 |
76.4 |
| 1987 |
144,510 |
468,321 |
612,831 |
76.4 |
| 1988 |
152,108 |
492,646 |
644,754 |
76.4 |
| 1989 |
160,106 |
518,242 |
678,348 |
76.4 |
| 1990 |
168,525 |
545,177 |
713,702 |
76.4 |
| 1991 |
177,387 |
573,521 |
750,908 |
76.4 |
| 1992 |
186,715 |
603,347 |
790,062 |
76.4 |
| 1993 |
196,534 |
634,734 |
831,268 |
76.4 |
| 1994 |
206,870 |
667,763 |
874,633 |
76.3 |
| 1995 |
217,748 |
702,523 |
920,271 |
76.3 |
| 1996 |
228,583 |
727,213 |
955,796 |
76.1 |
| 1997 |
239,958 |
752,785 |
992,743 |
75.8 |
| 1998 |
251,901 |
779,270 |
1,031,171 |
75.6 |
| 1999 |
264,439 |
806,702 |
1,071,141 |
75.3 |
| 2000 |
277,602 |
835,114 |
1,112,716 |
75.1 |
| 2001 |
291,421 |
864,542 |
1,155,963 |
74.8 |
| 2002 |
303,792 |
902,893 |
1,206,685 |
74.8 |
| 2003 |
316,688 |
943,032 |
1,259,720 |
74.9 |
| 2004 |
330,132 |
985,047 |
1,315,179 |
74.9 |
| 2005 |
344,350 |
1,029,819 |
1,374,169 |
74.9 |
| 2006 |
360,177 |
1,101,301 |
1,461,479 |
75.4 |
| 2007 |
377,646 |
1,196,635 |
1,574,280 |
76.0 |
| 2008 |
395,729 |
1,300,059 |
1,695,788 |
76.7 |
| 2009 |
414,441 |
1,412,232 |
1,826,673 |
77.3 |
| 2010 |
433,788 |
1,533,871 |
1,967,659 |
78.0 |
Source: SCAD, Abu Dhabi
ANNEXED NOTE
1. Characteristics of data, definitions and population counting operations in the UAE
Population estimates are drawn using interpolation techniques.
The first population census was conducted in 1968 by the Council of Developing Trucial States.
After Independence in 1971, a population census of the Emirate of Abu Dhabi was conducted that same year.
The first general population and establishments census in the UAE was conducted in 1975. It was the first census in the region following scientific standards and international recommendations. The other federal censuses were conducted in 1980, 1985, 1995 and 2005.
Reference days for UAE censuses: 30/12/1975; 15/12/1980, 16/12/1985, 16/12/1995; 29/10/2001; 06/12/2005.
Implementation method: the census was carried out according to de jure methodology, i.e. counting persons using their usual place of residence
Population of reference: Emirati nationals usually residing in the country+all foreign residents holding a valid residence permit+resident GCC nationals (nationals of other GCC states don’t need a permit to stay in the UAE)
In October 2011, SCAD conducted its first census of population and households.
2. Institution which provides data
Statistics centre of Abu Dhabi (SCAD), Abu Dhabi
3. Data availability
The data only concerns the Abu Dhabi resident population (nationals and foreign residents).
The SCAD provides thematic volumes with time series for various indicators related to development (population, demography, labour, etc.) since 1960. The present series has been published in December 2012.
Data is available under various formats (PDF, Excel, html).
http://www.scad.ae/en/statistics/Pages/Statistics.aspx?ThemeID=7&TopicID=48&SubTopicID=163&PublicationID=315
Date of access: January 2015.
| YEAR |
Nationals |
Non-nationals |
TOTAL |
| Males |
Females |
Total |
Males |
Females |
Total |
Males |
Females |
Total |
| 1977 |
205 |
129 |
334 |
520 |
141 |
661 |
725 |
270 |
995 |
| 1978 |
213 |
121 |
334 |
559 |
155 |
714 |
772 |
276 |
1,048 |
| 1979 |
237 |
155 |
392 |
595 |
157 |
752 |
832 |
312 |
1,144 |
| 1980 |
253 |
126 |
379 |
627 |
210 |
837 |
880 |
336 |
1,216 |
| 1981 |
278 |
151 |
429 |
763 |
214 |
977 |
1,042 |
365 |
1,407 |
| 1982 |
326 |
190 |
516 |
736 |
216 |
952 |
1,067 |
409 |
1,476 |
| 1983 |
347 |
191 |
538 |
787 |
228 |
1,015 |
1,145 |
423 |
1,568 |
| 1984 |
371 |
207 |
578 |
595 |
201 |
796 |
976 |
410 |
1,386 |
| 1985 |
333 |
187 |
520 |
563 |
192 |
755 |
900 |
379 |
1,279 |
| 1986 |
319 |
173 |
492 |
648 |
216 |
864 |
967 |
389 |
1,356 |
| 1987 |
335 |
196 |
531 |
683 |
223 |
906 |
1,018 |
419 |
1,437 |
| 1988 |
372 |
213 |
585 |
692 |
253 |
945 |
1,064 |
466 |
1,530 |
| 1989 |
365 |
237 |
602 |
747 |
260 |
1,007 |
1,112 |
497 |
1,609 |
| 1990 |
377 |
218 |
595 |
796 |
271 |
1,067 |
1,173 |
489 |
1,662 |
| 1991 |
400 |
231 |
631 |
864 |
296 |
1,160 |
1,264 |
527 |
1,791 |
| 1992 |
435 |
244 |
679 |
903 |
286 |
1,189 |
1,338 |
530 |
1,868 |
| 1993 |
423 |
237 |
660 |
948 |
319 |
1,267 |
1,371 |
556 |
1,927 |
| 1994 |
391 |
227 |
618 |
1,065 |
293 |
1,358 |
1,456 |
520 |
1,976 |
| 1995 |
455 |
266 |
721 |
1,166 |
276 |
1,442 |
1,621 |
542 |
2,163 |
| 1996 |
454 |
268 |
722 |
1,058 |
264 |
1,322 |
1,512 |
532 |
2,044 |
| 1997 |
429 |
267 |
696 |
1,110 |
289 |
1,399 |
1,539 |
556 |
2,095 |
| 1998 |
495 |
262 |
757 |
1,124 |
302 |
1,426 |
1,619 |
564 |
2,183 |
| 1999 |
497 |
315 |
812 |
1,165 |
318 |
1,483 |
1,662 |
633 |
2,295 |
| 2000 |
534 |
327 |
861 |
1,192 |
322 |
1,514 |
1,726 |
649 |
2,375 |
| 2001 |
574 |
354 |
928 |
1,269 |
377 |
1,646 |
1,843 |
731 |
2,574 |
| 2002 |
523 |
330 |
853 |
1,385 |
374 |
1,759 |
1,908 |
704 |
2,612 |
| 2003 |
570 |
343 |
913 |
1,217 |
363 |
1,580 |
1,787 |
706 |
2,493 |
| 2004 |
540 |
346 |
886 |
1,232 |
371 |
1,603 |
1,772 |
717 |
2,489 |
| 2005 |
494 |
325 |
819 |
1,243 |
381 |
1,624 |
1,737 |
706 |
2,443 |
| 2006 |
509 |
311 |
821 |
1,179 |
374 |
1,559 |
1,690 |
690 |
2,380 |
| 2007 |
613 |
377 |
990 |
1,373 |
387 |
1,760 |
1,986 |
764 |
2,750 |
| 2008 |
626 |
355 |
981 |
1,515 |
431 |
1,947 |
2,154 |
792 |
2,949 |
| 2009 |
617 |
366 |
983 |
1,616 |
388 |
2,005 |
2,233 |
754 |
2,988 |
| 2010 |
572 |
393 |
967 |
1,462 |
426 |
1,888 |
2,051 |
826 |
2,879 |
Sources:
National Bureau of Statistics (Deaths 1977-1980)
Ministry of Health (1981-2005)
Health Authority – Abu Dhabi (2006 – 2010)
ANNEXED NOTE
1. Characteristics of data, definitions
Number of deaths by gender for the year 1990 and 1991 are estimates.
The Department of Preventive Medicine under the Ministry of Health is responsible for the registration of births and deaths.
Both births and deaths are to be reported to the nearest health center and the information will be forwarded to the Ministry of Health for registration and for entering into a database.
The information extracted from this database is then passed on to the Central Statistics Department (Ministry of Economy) for statistical purposes.
For death reporting, the age, sex and occupation of the deceased, the month death occurred, and the cause of death are included.
http://unstats.un.org/unsd/vitalstatkb/Attachment206.aspx
2. Institution which provides data
Statistics centre of Abu Dhabi (SCAD), Abu Dhabi
3. Data availability
The SCAD provides thematic volumes with time series for various indicators related to development (population, demography, labour, etc.) since 1960. The present series has been published in December 2012.
Data is available under various formats (PDF, Excel, html).
http://www.scad.ae/en/statistics/Pages/Statistics.aspx?ThemeID=7&TopicID=48&SubTopicID=163&PublicationID=315
Date of access: January 2015.
| Year |
Nationals |
Non-nationals |
| Males |
Females |
Total |
Males |
Females |
Total |
| 1977 |
2,101 |
2,027 |
4,128 |
2,742 |
2,654 |
5,396 |
| 1978 |
2,117 |
2,060 |
4,177 |
3,447 |
3,165 |
6,612 |
| 1979 |
2,552 |
2,414 |
4,966 |
4,216 |
3,863 |
8,079 |
| 1980 |
2,678 |
2,603 |
5,281 |
4,831 |
4,646 |
9,477 |
| 1981 |
2,851 |
2,808 |
5,659 |
5,512 |
5,333 |
10,845 |
| 1982 |
3,039 |
2,875 |
5,914 |
6,059 |
5,751 |
11,810 |
| 1983 |
3,166 |
2,971 |
6,137 |
6,401 |
6,162 |
12,563 |
| 1984 |
3,461 |
3,251 |
6,712 |
6,255 |
5,803 |
12,058 |
| 1985 |
3,388 |
3,295 |
6,683 |
6,481 |
5,931 |
12,412 |
| 1986 |
3,185 |
3,143 |
6,328 |
6,797 |
6,575 |
13,372 |
| 1987 |
3,617 |
3,283 |
6,900 |
7,194 |
6,970 |
14,164 |
| 1988 |
3,653 |
3,442 |
7,095 |
7,860 |
7,460 |
15,320 |
| 1989 |
3,602 |
3,419 |
7,021 |
7,589 |
7,319 |
14,908 |
| 1990 |
3,620 |
3,411 |
7,031 |
7,613 |
7,362 |
14,975 |
| 1991 |
3,783 |
3,536 |
7,319 |
6,792 |
6,592 |
13,384 |
| 1992 |
3,951 |
3,766 |
7,717 |
6,875 |
6,831 |
13,706 |
| 1993 |
4,024 |
3,932 |
7,956 |
6,495 |
6,223 |
12,718 |
| 1994 |
4,281 |
4,057 |
8,338 |
6,988 |
6,422 |
13,410 |
| 1995 |
4,488 |
4,271 |
8,759 |
6,226 |
6,098 |
12,324 |
| 1996 |
4,527 |
4,332 |
8,859 |
5,769 |
5,621 |
11,390 |
| 1997 |
4,770 |
4,276 |
9,046 |
5,724 |
5,401 |
11,125 |
| 1998 |
4,807 |
4,474 |
9,281 |
6,122 |
5,891 |
12,013 |
| 1999 |
4,908 |
4,752 |
9,660 |
6,429 |
6,087 |
12,516 |
| 2000 |
5,213 |
4,953 |
10,166 |
6,791 |
6,548 |
13,339 |
| 2001 |
5,329 |
5,053 |
10,382 |
6,900 |
6,692 |
13,592 |
| 2002 |
5,408 |
5,339 |
10,747 |
6,852 |
6,701 |
13,553 |
| 2003 |
5,794 |
5,485 |
11,279 |
6,968 |
6,743 |
13,711 |
| 2004 |
6,090 |
5,976 |
12,066 |
7,205 |
6,990 |
14,195 |
| 2005 |
6,304 |
5,993 |
12,297 |
7,667 |
7,149 |
14,816 |
| 2006 |
6,182 |
5,983 |
12,165 |
6,990 |
6,583 |
13,573 |
| 2007 |
6,461 |
6,396 |
12,857 |
7,273 |
6,850 |
14,123 |
| 2008 |
6,623 |
6,417 |
13,040 |
7,997 |
7,407 |
15,404 |
| 2009 |
6,974 |
6,526 |
13,503 |
7,968 |
7,590 |
15,565 |
| 2010 |
6,987 |
6,510 |
13,498 |
8,260 |
7,560 |
15,820 |
Sources:
National Bureau of Statistics (Births 1977-1978)
Ministry of Health (1979-2005)
Health Authority – Abu Dhabi (2006 – 2010)
ANNEXED NOTE
1. Characteristics of data, definitions
Dual nationality is not recognized under UAE law. Children of UAE fathers automatically acquire UAE citizenship at birth, regardless of where the child was born. In certain circumstances, UAE mothers can also transmit citizenship. UAE citizens must enter and exit the country on UAE passports.
The Department of Preventive Medicine under the Ministry of Health is responsible for the registration of births and deaths.
Both births and deaths are to be reported to the nearest health center and the information will be forwarded to the Ministry of Health for registration and for entering into a database.
The information extracted from this database is then passed on to the Central Statistics Department (Ministry of Economy) for statistical purposes.
The information collected on the birth reporting form includes sex of the child, the citizenship and the month of birth. The characteristics such as age, citizenship and occupation of the parents are also included on the form.
http://unstats.un.org/unsd/vitalstatkb/Attachment206.aspx
2. Institution which provides data
Statistics centre of Abu Dhabi (SCAD), Abu Dhabi
3. Data availability
The SCAD provides thematic volumes with time series for various indicators related to development (population, demography, labour, etc.) since 1960. The present series has been published in December 2012.
Data is available under various formats (PDF, Excel, html).
http://www.scad.ae/en/statistics/Pages/Statistics.aspx?ThemeID=7&TopicID=48&SubTopicID=163&PublicationID=315
Date of access: January 2015.
| Year |
Work |
Residence |
Visit |
Total |
| 1974 |
41,491 |
9,035 |
– |
50,526 |
| 1975 |
46,439 |
10,700 |
– |
57,139 |
| 1976 |
42,383 |
9,273 |
– |
51,656 |
| 1977 |
77,646 |
11,146 |
– |
88,792 |
| 1978 |
132,059 |
17,198 |
– |
149,257 |
| 1979 |
112,539 |
22,395 |
– |
134,934 |
| 1980 |
105,700 |
19,091 |
– |
124,791 |
| 1981 |
122,874 |
24,081 |
– |
146,955 |
| 1982 |
147,746 |
30,426 |
– |
178,172 |
| 1983 |
115,563 |
25,278 |
– |
140,841 |
| 1984 |
86,031 |
22,205 |
– |
108,236 |
| 1985 |
141,810 |
33,934 |
– |
175,744 |
| 1986 |
142,595 |
37,427 |
– |
180,022 |
| 1987 |
140,771 |
38,655 |
– |
179,426 |
| 1988 |
143,642 |
38,135 |
– |
181,777 |
| 1989 |
105,794 |
31,631 |
62,773 |
200,198 |
| 1990 |
89,485 |
22,980 |
33,303 |
145,768 |
| 1991 |
144,202 |
37,037 |
48,531 |
229,770 |
| 1992 |
123,454 |
33,264 |
50,755 |
207,473 |
| 1993 |
63,840 |
18,177 |
37,609 |
119,626 |
| 1994 |
54,323 |
15,668 |
40,784 |
110,775 |
| 1995 |
80,036 |
12,063 |
56,044 |
148,143 |
| 1996 |
82,992 |
14,882 |
53,073 |
150,947 |
| 1997 |
145,457 |
19,445 |
56,751 |
221,653 |
| 1998 |
149,996 |
21,993 |
87,373 |
259,362 |
| 1999 |
125,711 |
19,578 |
93,728 |
239,017 |
| 2000 |
126,944 |
24,385 |
121,162 |
272,491 |
| 2001 |
100,898 |
23,646 |
119,722 |
244,266 |
| 2002 |
146,228 |
24,530 |
116,923 |
287,681 |
| 2003 |
178,652 |
25,528 |
118,301 |
322,481 |
| 2004 |
201,604 |
30,228 |
156,273 |
388,105 |
| 2005 |
236,456 |
36,773 |
152,088 |
425,317 |
| 2006 |
294,911 |
41,501 |
197,362 |
533,774 |
| 2007 |
434,341 |
51,141 |
813,568 |
1,299,050 |
| 2008 |
677,930 |
63,031 |
756,808 |
1,497,769 |
| 2009 |
585,983 |
69,663 |
687,003 |
1,342,649 |
| 2010 |
535,827 |
75,744 |
103,658 |
715,229 |
Source: Ministry of Interior
ANNEXED NOTE
1. Characteristics of data, definitions
After finding a job and negotiating a job contract, expats must provide their employer with the official documents needed to start the recruitment procedure.
The entry permit is then issued, which allows the worker/ family dependant to come to Abu Dhabi and the UAE.
For a worker, the delivery of the labour permit is conditional to a medical exam passed after arrival.
The duration of the labour permit is three years.
2. Institution which provides data
Statistics centre of Abu Dhabi (SCAD), Abu Dhabi
3. Data availability
The data only concerns the Abu Dhabi resident population (nationals and foreign residents).
The SCAD provides thematic volumes with time series for various indicators related to development (population, demography, labour, etc.) since 1960. The present series has been published in December 2012.
Data is available under various formats (PDF, Excel, html).
http://www.scad.ae/en/statistics/Pages/Statistics.aspx?ThemeID=7&TopicID=48&SubTopicID=163&PublicationID=315
Date of access: January 2015.
| YEAR |
Arrivals |
Departures |
| by Air |
by Land |
by Sea |
Total |
by Air |
by Land |
by Sea |
Total |
| 1976 |
252,849 |
14,703 |
1,679 |
269,231 |
196,248 |
14,638 |
1,402 |
212,288 |
| 1977 |
257,154 |
30,139 |
796 |
288,089 |
251,900 |
31,434 |
739 |
284,073 |
| 1978 |
370,436 |
64,059 |
658 |
435,153 |
311,390 |
69,822 |
429 |
381,641 |
| 1979 |
398,193 |
85,348 |
1,316 |
484,857 |
390,013 |
98,900 |
1,048 |
489,961 |
| 1980 |
552,631 |
111,865 |
1,220 |
665,716 |
486,456 |
122,452 |
777 |
609,685 |
| 1981 |
743,663 |
133,819 |
2,067 |
879,549 |
844,939 |
139,963 |
1,694 |
986,596 |
| 1982 |
662,587 |
138,466 |
1,205 |
802,258 |
640,591 |
148,387 |
932 |
789,910 |
| 1983 |
463,583 |
144,692 |
1,847 |
610,122 |
472,451 |
160,759 |
1,580 |
634,790 |
| 1984 |
434,535 |
169,144 |
1,422 |
605,101 |
421,011 |
173,398 |
1,563 |
595,972 |
| 1985 |
393,887 |
140,515 |
2,287 |
536,689 |
394,530 |
132,237 |
2,092 |
528,859 |
| 1986 |
386,822 |
192,622 |
1,584 |
581,028 |
381,357 |
198,179 |
1,389 |
580,925 |
| 1987 |
438,312 |
229,518 |
47,481 |
715,311 |
430,419 |
238,505 |
46,761 |
715,685 |
| 1988 |
571,311 |
240,721 |
46,860 |
858,892 |
577,045 |
250,805 |
45,901 |
873,751 |
| 1989 |
550,974 |
256,974 |
49,193 |
857,141 |
566,506 |
266,365 |
48,896 |
881,767 |
| 1990 |
815,389 |
285,444 |
50,315 |
1,151,148 |
846,869 |
280,581 |
48,165 |
1,175,615 |
| 1991 |
928,648 |
320,393 |
53,948 |
1,302,989 |
913,924 |
344,994 |
52,536 |
1,311,454 |
| 1992 |
412,037 |
585,826 |
69,643 |
1,067,506 |
448,857 |
603,239 |
64,264 |
1,116,360 |
| 1993 |
473,582 |
482,420 |
140,069 |
1,096,071 |
451,800 |
514,719 |
72,123 |
1,038,642 |
| 1994 |
614,895 |
583,206 |
59,695 |
1,257,796 |
590,646 |
588,955 |
55,550 |
1,235,151 |
| 1995 |
1,374,880 |
331,239 |
3,797 |
1,709,916 |
1,370,838 |
300,999 |
3,570 |
1,675,407 |
| 1996 |
499,175 |
511,677 |
4,848 |
1,015,700 |
492,219 |
536,054 |
5,175 |
1,033,448 |
| 1997 |
393,149 |
648,085 |
5,389 |
1,046,623 |
374,165 |
643,305 |
4,929 |
1,022,399 |
| 1998 |
387,117 |
792,647 |
4,474 |
1,184,238 |
387,076 |
816,538 |
4,614 |
1,208,228 |
| 1999 |
413,948 |
1,039,328 |
27,004 |
1,480,280 |
322,198 |
1,061,880 |
26,242 |
1,410,320 |
| 2000 |
1,486,004 |
894,276 |
48,243 |
2,428,523 |
1,510,794 |
925,861 |
50,608 |
2,487,263 |
| 2001 |
1,443,635 |
1,129,569 |
44,132 |
2,617,336 |
1,487,336 |
1,234,606 |
44,249 |
2,766,191 |
| 2002 |
733,033 |
959,696 |
3,677 |
1,696,406 |
670,848 |
949,032 |
3,226 |
1,623,106 |
| 2003 |
889,502 |
1,075,794 |
47,366 |
2,012,662 |
804,599 |
1,066,843 |
44,537 |
1,915,979 |
| 2004 |
1,194,264 |
1,144,036 |
42,847 |
2,381,147 |
1,116,185 |
1,135,185 |
55,335 |
2,306,705 |
| 2005 |
1,356,562 |
1,355,186 |
40,686 |
2,752,434 |
1,303,580 |
1,372,825 |
40,837 |
2,717,242 |
| 2006 |
1,420,920 |
1,417,352 |
5,513 |
2,843,785 |
1,336,720 |
1,426,947 |
8,142 |
2,771,809 |
| 2007 |
1,951,203 |
2,099,568 |
11,471 |
4,062,242 |
1,829,995 |
2,083,122 |
19,956 |
3,933,073 |
| 2008 |
2,249,163 |
2,135,340 |
18,870 |
4,403,373 |
1,982,919 |
2,114,874 |
26,322 |
4,124,115 |
| 2009 |
2,419,605 |
2,334,638 |
16,478 |
4,770,721 |
2,338,482 |
2,290,051 |
15,442 |
4,643,975 |
| 2010 |
2,714,818 |
2,574,827 |
29,198 |
5,318,843 |
2,651,254 |
2,588,913 |
27,467 |
5,267,634 |
Source: Ministry of Interior
1. Characteristics of data, definitions
2. Institution which provides data
Statistics centre of Abu Dhabi (SCAD), Abu Dhabi
3. Data availability
The SCAD provides thematic volumes with time series for various indicators related to development (population, demography, labour, etc.) since 1960. The present series has been published in December 2012.
Data is available under various formats (PDF, Excel, html).
http://www.scad.ae/en/statistics/Pages/Statistics.aspx?ThemeID=7&TopicID=48&SubTopicID=163&PublicationID=315
Date of access: January 2015.
| Year |
Nationals |
Non-nationals |
Total |
| 1977 |
2,795 |
10,680 |
13,475 |
| 1978 |
3,147 |
12,975 |
16,122 |
| 1979 |
3,431 |
15,204 |
18,635 |
| 1980 |
3,739 |
17,548 |
21,287 |
| 1981 |
3,922 |
19,466 |
23,388 |
| 1982 |
4,105 |
21,239 |
25,344 |
| 1983 |
4,507 |
21,662 |
26,169 |
| 1984 |
4,974 |
21,955 |
26,929 |
| 1985 |
5,198 |
23,350 |
28,548 |
| 1986 |
5,518 |
23,932 |
29,450 |
| 1987 |
5,385 |
23,471 |
28,856 |
| 1988 |
5,405 |
23,722 |
29,127 |
| 1989 |
5,697 |
24,680 |
30,377 |
| 1990 |
5,970 |
25,410 |
31,380 |
| 1991 |
6,138 |
26,106 |
32,244 |
| 1992 |
6,118 |
26,840 |
32,958 |
| 1993 |
6,291 |
28,231 |
34,522 |
| 1994 |
6,639 |
30,332 |
36,971 |
| 1995 |
6,887 |
32,321 |
39,208 |
| 1996 |
6,875 |
33,528 |
40,403 |
| 1997 |
6,891 |
34,342 |
41,233 |
| 1998 |
7,089 |
34,636 |
41,725 |
| 1999 |
5,734 |
27,445 |
33,179 |
| 2000 |
6,186 |
28,081 |
34,267 |
| 2001 |
6,926 |
28,702 |
35,628 |
| 2002 |
7,657 |
28,619 |
36,276 |
| 2003 |
7,976 |
24,586 |
32,562 |
| 2004 |
7,920 |
20,630 |
28,550 |
| 2005 |
7,907 |
18,165 |
26,072 |
Sources:
Department of Organisation and Administration (1977-2001)
Department of Civil service; Department of Finance (2002-2005)
ANNEXED NOTE
1. Characteristics of data, definitions
After finding a job and negotiating a job contract, expats must provide their employer with the official documents needed to start the recruitment procedure.
The entry permit is then issued, which allows the worker/ family dependant to come to Abu Dhabi and the UAE.
For a worker, the delivery of the labour permit is conditional to a medical exam passed after arrival.
The duration of the labour permit is three years.
Employed person: An individual, 15 years old or older, who works for a salary during the week of the time reference, either working for others or self-employed,
as well as those who have a job but are not on duty during the week of the time reference (for being on vacation or are delegated for training courses or work programs by their employers and those who work for a family without wage).
2. Institution which provides data
Statistics centre of Abu Dhabi (SCAD), Abu Dhabi
3. Data availability
The SCAD provides thematic volumes with time series for various indicators related to development (population, demography, labour, etc.) since 1960. The present series has been published in December 2012.
Data is available under various formats (PDF, Excel, html).
http://www.scad.ae/en/statistics/Pages/Statistics.aspx?ThemeID=7&TopicID=48&SubTopicID=163&PublicationID=315
Date of access: January 2015.
| |
|
Nationals |
|
|
Non-nationals |
TOTAL |
| Year |
Males |
Females |
Total |
Males |
Females |
Total |
Males |
Females |
Total |
| 1960 – 1961 |
13.4 |
14.2 |
13.7 |
27.7 |
127.8 |
30.1 |
21.7 |
18.9 |
21.0 |
| 1961 – 1962 |
11.8 |
12.4 |
12.1 |
21.7 |
56.1 |
23.1 |
17.9 |
15.9 |
17.4 |
| 1962 – 1963 |
5.8 |
5.8 |
5.8 |
9.0 |
20.6 |
9.6 |
7.8 |
7.4 |
7.7 |
| 1963 – 1964 |
5.8 |
5.8 |
5.8 |
9.0 |
20.5 |
9.6 |
7.8 |
7.6 |
7.8 |
| 1964 – 1965 |
5.8 |
5.8 |
5.8 |
9.0 |
20.6 |
9.7 |
7.8 |
7.8 |
7.8 |
| 1965 – 1966 |
5.8 |
5.8 |
5.8 |
9.0 |
20.6 |
9.8 |
7.9 |
8.0 |
7.9 |
| 1966 – 1967 |
5.8 |
5.8 |
5.8 |
9.0 |
20.6 |
9.9 |
7.9 |
8.3 |
8.0 |
| 1967 – 1968 |
5.8 |
5.8 |
5.8 |
9.0 |
20.5 |
9.9 |
7.9 |
8.5 |
8.1 |
| 1968 – 1969 |
14.1 |
15.7 |
14.8 |
26.4 |
43.3 |
28.0 |
22.4 |
21.4 |
22.1 |
| 1969 – 1970 |
14.1 |
15.7 |
14.8 |
26.4 |
43.3 |
28.2 |
22.6 |
22.5 |
22.6 |
| 1970 – 1971 |
14.1 |
15.7 |
14.8 |
26.4 |
43.3 |
28.4 |
22.9 |
23.6 |
23.1 |
| 1971 – 1972 |
14.1 |
15.7 |
14.8 |
26.4 |
43.3 |
28.6 |
23.2 |
24.9 |
23.6 |
| 1972 – 1973 |
14.1 |
15.7 |
14.8 |
26.4 |
43.3 |
28.9 |
23.4 |
26.2 |
24.1 |
| 1973 – 1974 |
14.1 |
15.7 |
14.8 |
26.4 |
43.3 |
29.1 |
23.6 |
27.6 |
24.6 |
| 1974 – 1975 |
14.1 |
15.7 |
14.8 |
26.4 |
43.3 |
29.4 |
23.8 |
29.1 |
25.2 |
| 1975 – 1976 |
10.6 |
11.0 |
10.8 |
17.7 |
20.3 |
18.2 |
16.3 |
16.0 |
16.2 |
| 1976 – 1977 |
10.6 |
11.0 |
10.8 |
17.7 |
20.3 |
18.2 |
16.4 |
16.1 |
16.3 |
| 1977 – 1978 |
10.6 |
11.0 |
10.8 |
17.7 |
20.3 |
18.2 |
16.5 |
16.3 |
16.4 |
| 1978 – 1979 |
10.6 |
11.0 |
10.8 |
17.7 |
20.3 |
18.2 |
16.5 |
16.5 |
16.5 |
| 1979 – 1980 |
10.6 |
11.0 |
10.8 |
17.7 |
20.3 |
18.2 |
16.6 |
16.7 |
16.6 |
| 1980 – 1981 |
7.9 |
9.1 |
8.5 |
3.3 |
10.1 |
4.7 |
4.0 |
9.7 |
5.5 |
| 1981 – 1982 |
7.9 |
9.1 |
8.5 |
3.3 |
10.1 |
4.8 |
4.0 |
9.7 |
5.6 |
| 1982 – 1983 |
7.9 |
9.1 |
8.5 |
3.3 |
10.1 |
4.9 |
4.0 |
9.7 |
5.7 |
| 1983 – 1984 |
7.9 |
9.1 |
8.5 |
3.3 |
10.1 |
4.9 |
4.0 |
9.7 |
5.7 |
| 1984 – 1985 |
7.9 |
9.1 |
8.5 |
3.3 |
10.1 |
5.0 |
4.1 |
9.7 |
5.8 |
| 1985 – 1986 |
5.1 |
5.4 |
5.3 |
5.4 |
4.5 |
5.2 |
5.4 |
4.8 |
5.2 |
| 1986 – 1987 |
5.1 |
5.4 |
5.3 |
5.4 |
4.5 |
5.2 |
5.4 |
4.8 |
5.2 |
| 1987 – 1988 |
5.1 |
5.4 |
5.3 |
5.4 |
4.5 |
5.2 |
5.4 |
4.8 |
5.2 |
| 1988 – 1989 |
5.1 |
5.4 |
5.3 |
5.4 |
4.5 |
5.2 |
5.4 |
4.8 |
5.2 |
| 1989 – 1990 |
5.1 |
5.4 |
5.3 |
5.4 |
4.5 |
5.2 |
5.4 |
4.8 |
5.2 |
| 1990 – 1991 |
5.1 |
5.4 |
5.3 |
5.4 |
4.5 |
5.2 |
5.4 |
4.8 |
5.2 |
| 1991 – 1992 |
5.1 |
5.4 |
5.3 |
5.4 |
4.5 |
5.2 |
5.4 |
4.8 |
5.2 |
| 1992 – 1993 |
5.1 |
5.4 |
5.3 |
5.4 |
4.5 |
5.2 |
5.4 |
4.8 |
5.2 |
| 1993 – 1994 |
5.1 |
5.4 |
5.3 |
5.4 |
4.5 |
5.2 |
5.4 |
4.8 |
5.2 |
| 1994 – 1995 |
5.1 |
5.4 |
5.3 |
5.4 |
4.5 |
5.2 |
5.4 |
4.8 |
5.2 |
| 1995 – 1996 |
4.8 |
5.2 |
5.0 |
3.3 |
4.3 |
3.5 |
3.5 |
4.6 |
3.9 |
| 1996 – 1997 |
4.8 |
5.2 |
5.0 |
3.3 |
4.3 |
3.5 |
3.5 |
4.6 |
3.9 |
| 1997 – 1998 |
4.8 |
5.2 |
5.0 |
3.3 |
4.3 |
3.5 |
3.5 |
4.6 |
3.9 |
| 1998 – 1999 |
4.8 |
5.2 |
5.0 |
3.3 |
4.3 |
3.5 |
3.5 |
4.6 |
3.9 |
| 1999 – 2000 |
4.8 |
5.2 |
5.0 |
3.3 |
4.3 |
3.5 |
3.5 |
4.6 |
3.9 |
| 2000 – 2001 |
4.8 |
5.2 |
5.0 |
3.3 |
4.3 |
3.5 |
3.5 |
4.6 |
3.9 |
| 2001 – 2002 |
4.3 |
4.2 |
4.2 |
3.8 |
6.1 |
4.4 |
3.9 |
5.4 |
4.4 |
| 2002 – 2203 |
4.3 |
4.2 |
4.2 |
3.8 |
6.1 |
4.4 |
3.9 |
5.4 |
4.4 |
| 2003 – 2004 |
4.3 |
4.2 |
4.2 |
3.8 |
6.1 |
4.5 |
3.9 |
5.4 |
4.4 |
| 2004 – 2005 |
4.4 |
4.2 |
4.3 |
3.9 |
6.2 |
4.5 |
4.0 |
5.5 |
4.5 |
| 2005 – 2006 |
4.6 |
4.6 |
4.6 |
7.5 |
5.5 |
6.9 |
6.9 |
5.2 |
6.4 |
| 2006 – 2007 |
4.7 |
5.0 |
4.8 |
10.1 |
4.9 |
8.7 |
9.1 |
5.0 |
7.7 |
| 2007 – 2008 |
4.7 |
4.9 |
4.8 |
10.0 |
4.9 |
8.6 |
9.1 |
4.9 |
7.7 |
| 2008 – 2009 |
4.6 |
4.9 |
4.7 |
10.0 |
4.8 |
8.6 |
9.0 |
4.8 |
7.7 |
| 2009 – 2010 |
4.5 |
4.8 |
4.7 |
9.9 |
4.8 |
8.6 |
9.0 |
4.8 |
7.7 |
Source: SCAD, Abu Dhabi
ANNEXED NOTE
1. Characteristics of data, definitions and population counting operations in the UAE
Calculations are based on mid-year estimates at census years. Average annual growth rates are calculated as geometric growth compounded annually.
The first population census was conducted in 1968 by the Council of Developing Trucial States.
After Independence in 1971, a population census of the Emirate of Abu Dhabi was conducted that same year.
The first general population and establishments census in the UAE was conducted in 1975. It was the first census in the region following scientific standards and international recommendations. The other federal censuses were conducted in 1980, 1985, 1995 and 2005.
Reference days for UAE censuses: 30/12/1975; 15/12/1980, 16/12/1985, 16/12/1995; 29/10/2001; 06/12/2005.
Implementation method: the census was carried out according to de jure methodology, i.e. counting persons using their usual place of residence
Population of reference: Emirati nationals usually residing in the country+all foreign residents holding a valid residence permit+resident GCC nationals (nationals of other GCC states don’t need a permit to stay in the UAE)
In October 2011, SCAD conducted its first census of population and households.
2. Institution which provides data
Statistics centre of Abu Dhabi (SCAD), Abu Dhabi
3. Data availability
The data only concerns the Abu Dhabi resident population (nationals and foreign residents).
The SCAD provides thematic volumes with time series for various indicators related to development (population, demography, labour, etc.) since 1960. The present series has been published in December 2012.
Data is available under various formats (PDF, Excel, html).
http://www.scad.ae/en/statistics/Pages/Statistics.aspx?ThemeID=7&TopicID=48&SubTopicID=163&PublicationID=315
Date of access: January 2015.
| |
|
Nationals |
|
|
Non-nationals |
TOTAL |
| Year |
Males |
Females |
Total |
Males |
Females |
Total |
Males |
Females |
Total |
| 1960 |
6,211 |
4,853 |
11,064 |
8,635 |
209 |
8,844 |
14,846 |
5,062 |
19,908 |
| 1961 |
7,041 |
5,543 |
12,584 |
11,031 |
476 |
11,507 |
18,072 |
6,019 |
24,091 |
| 1962 |
7,871 |
6,233 |
14,104 |
13,427 |
743 |
14,170 |
21,298 |
6,976 |
28,274 |
| 1963 |
8,327 |
6,594 |
14,921 |
14,633 |
896 |
15,529 |
22,960 |
7,490 |
30,450 |
| 1964 |
8,810 |
6,976 |
15,786 |
15,947 |
1,080 |
17,027 |
24,757 |
8,056 |
32,813 |
| 1965 |
9,321 |
7,380 |
16,701 |
17,379 |
1,302 |
18,681 |
26,700 |
8,682 |
35,382 |
| 1966 |
9,861 |
7,808 |
17,669 |
18,940 |
1,570 |
20,510 |
28,801 |
9,378 |
38,179 |
| 1967 |
10,433 |
8,261 |
18,694 |
20,641 |
1,893 |
22,534 |
31,074 |
10,154 |
41,228 |
| 1968 |
11,038 |
8,740 |
19,778 |
22,493 |
2,281 |
24,774 |
33,531 |
11,021 |
44,552 |
| 1969 |
12,592 |
10,115 |
22,707 |
28,439 |
3,269 |
31,708 |
41,031 |
13,384 |
54,415 |
| 1970 |
14,364 |
11,707 |
26,071 |
35,957 |
4,685 |
40,642 |
50,321 |
16,392 |
66,713 |
| 1971 |
16,386 |
13,549 |
29,935 |
45,462 |
6,714 |
52,176 |
61,848 |
20,263 |
82,111 |
| 1972 |
18,692 |
15,681 |
34,373 |
57,480 |
9,621 |
67,101 |
76,172 |
25,302 |
101,474 |
| 1973 |
21,323 |
18,148 |
39,471 |
72,675 |
13,787 |
86,462 |
93,998 |
31,935 |
125,933 |
| 1974 |
24,324 |
21,003 |
45,327 |
91,887 |
19,757 |
111,644 |
116,211 |
40,760 |
156,971 |
| 1975 |
27,746 |
24,308 |
52,054 |
116,176 |
28,309 |
144,485 |
143,922 |
52,617 |
196,539 |
| 1976 |
30,688 |
26,971 |
57,659 |
136,742 |
34,044 |
170,786 |
167,430 |
61,015 |
228,445 |
| 1977 |
33,942 |
29,926 |
63,868 |
160,949 |
40,941 |
201,890 |
194,891 |
70,867 |
265,758 |
| 1978 |
37,541 |
33,204 |
70,745 |
189,441 |
49,236 |
238,677 |
226,982 |
82,440 |
309,422 |
| 1979 |
41,521 |
36,841 |
78,362 |
222,976 |
59,211 |
282,187 |
264,497 |
96,052 |
360,549 |
| 1980 |
45,922 |
40,877 |
86,799 |
262,447 |
71,209 |
333,656 |
308,369 |
112,086 |
420,455 |
| 1981 |
49,564 |
44,595 |
94,159 |
271,003 |
78,390 |
349,393 |
320,567 |
122,985 |
443,552 |
| 1982 |
53,495 |
48,651 |
102,146 |
279,838 |
86,295 |
366,133 |
333,333 |
134,946 |
468,279 |
| 1983 |
57,738 |
53,076 |
110,814 |
288,961 |
94,997 |
383,958 |
346,699 |
148,073 |
494,772 |
| 1984 |
62,318 |
57,904 |
120,222 |
298,382 |
104,577 |
402,959 |
360,700 |
162,481 |
523,181 |
| 1985 |
67,262 |
63,171 |
130,433 |
308,111 |
115,124 |
423,235 |
375,373 |
178,295 |
553,668 |
| 1986 |
70,713 |
66,578 |
137,291 |
324,884 |
120,320 |
445,204 |
395,597 |
186,898 |
582,495 |
| 1987 |
74,341 |
70,169 |
144,510 |
342,570 |
125,751 |
468,321 |
416,911 |
195,920 |
612,831 |
| 1988 |
78,155 |
73,953 |
152,108 |
361,219 |
131,427 |
492,646 |
439,374 |
205,380 |
644,754 |
| 1989 |
82,165 |
77,941 |
160,106 |
380,883 |
137,359 |
518,242 |
463,048 |
215,300 |
678,348 |
| 1990 |
86,381 |
82,144 |
168,525 |
401,618 |
143,559 |
545,177 |
487,999 |
225,703 |
713,702 |
| 1991 |
90,813 |
86,574 |
177,387 |
423,482 |
150,039 |
573,521 |
514,295 |
236,613 |
750,908 |
| 1992 |
95,472 |
91,243 |
186,715 |
446,536 |
156,811 |
603,347 |
542,008 |
248,054 |
790,062 |
| 1993 |
100,370 |
96,164 |
196,534 |
470,845 |
163,889 |
634,734 |
571,215 |
260,053 |
831,268 |
| 1994 |
105,520 |
101,350 |
206,870 |
496,477 |
171,286 |
667,763 |
601,997 |
272,636 |
874,633 |
| 1995 |
110,933 |
106,815 |
217,748 |
523,507 |
179,016 |
702,523 |
634,440 |
285,831 |
920,271 |
| 1996 |
116,223 |
112,360 |
228,583 |
540,556 |
186,657 |
727,213 |
656,779 |
299,017 |
955,796 |
| 1997 |
121,765 |
118,193 |
239,958 |
558,161 |
194,624 |
752,785 |
679,926 |
312,817 |
992,743 |
| 1998 |
127,572 |
124,329 |
251,901 |
576,339 |
202,931 |
779,270 |
703,911 |
327,260 |
1,031,171 |
| 1999 |
133,656 |
130,783 |
264,439 |
595,109 |
211,593 |
806,702 |
728,765 |
342,376 |
1,071,141 |
| 2000 |
140,030 |
137,572 |
277,602 |
614,490 |
220,624 |
835,114 |
754,520 |
358,196 |
1,112,716 |
| 2001 |
146,707 |
144,714 |
291,421 |
634,502 |
230,040 |
864,542 |
781,209 |
374,754 |
1,155,963 |
| 2002 |
153,047 |
150,745 |
303,792 |
658,813 |
244,080 |
902,893 |
811,860 |
394,825 |
1,206,685 |
| 2003 |
159,661 |
157,027 |
316,688 |
684,055 |
258,977 |
943,032 |
843,716 |
416,004 |
1,259,720 |
| 2004 |
166,561 |
163,571 |
330,132 |
710,264 |
274,783 |
985,047 |
876,825 |
438,354 |
1,315,179 |
| 2005 |
173,861 |
170,489 |
344,350 |
738,003 |
291,816 |
1,029,819 |
911,864 |
462,305 |
1,374,169 |
| 2006 |
181,793 |
178,385 |
360,177 |
793,371 |
307,930 |
1,101,301 |
975,164 |
486,315 |
1,461,478 |
| 2007 |
190,369 |
187,277 |
377,646 |
873,504 |
323,131 |
1,196,635 |
1,063,873 |
510,408 |
1,574,281 |
| 2008 |
199,232 |
196,497 |
395,729 |
961,173 |
338,886 |
1,300,059 |
1,160,405 |
535,383 |
1,695,788 |
| 2009 |
208,387 |
206,054 |
414,441 |
1,057,029 |
355,203 |
1,412,232 |
1,265,416 |
561,257 |
1,826,674 |
| 2010 |
217,839 |
215,949 |
433,788 |
1,161,779 |
372,092 |
1,533,871 |
1,379,618 |
588,041 |
1,967,659 |
Source: SCAD, Abu Dhabi
ANNEXED NOTE
1. Characteristics of data, definitions and population counting operations in the UAE
Population estimates are drawn using interpolation techniques.
The first population census was conducted in 1968 by the Council of Developing Trucial States.
After Independence in 1971, a population census of the Emirate of Abu Dhabi was conducted that same year.
The first general population and establishments census in the UAE was conducted in 1975. It was the first census in the region following scientific standards and international recommendations. The other federal censuses were conducted in 1980, 1985, 1995 and 2005.
Reference days for UAE censuses: 30/12/1975; 15/12/1980, 16/12/1985, 16/12/1995; 29/10/2001; 06/12/2005.
Implementation method: the census was carried out according to de jure methodology, i.e. counting persons using their usual place of residence
Population of reference: Emirati nationals usually residing in the country+all foreign residents holding a valid residence permit+resident GCC nationals (nationals of other GCC states don’t need a permit to stay in the UAE)
In October 2011, SCAD conducted its first census of population and households.
2. Institution which provides data
Statistics centre of Abu Dhabi (SCAD), Abu Dhabi
3. Data availability
The data only concerns the Abu Dhabi resident population (nationals and foreign residents).
The SCAD provides thematic volumes with time series for various indicators related to development (population, demography, labour, etc.) since 1960. The present series has been published in December 2012.
Data is available under various formats (PDF, Excel, html).
http://www.scad.ae/en/statistics/Pages/Statistics.aspx?ThemeID=7&TopicID=48&SubTopicID=163&PublicationID=315
Date of access: January 2015.
| Age Group |
Nationals |
Non-nationals |
TOTAL |
| Males |
Females |
Total |
Males |
Females |
Total |
Males |
Females |
Total |
| 0-4 |
37,485 |
35,618 |
73,103 |
41,728 |
38,370 |
80,098 |
79,213 |
73,988 |
153,201 |
| 5-9 |
33,521 |
31,545 |
65,066 |
40,415 |
36,987 |
77,402 |
73,936 |
68,532 |
142,468 |
| 10-14 |
27,275 |
24,878 |
52,153 |
34,000 |
30,475 |
64,475 |
61,275 |
55,353 |
116,628 |
| 15-19 |
25,698 |
24,237 |
49,935 |
33,282 |
27,990 |
61,272 |
58,980 |
52,227 |
111,207 |
| 20-24 |
24,991 |
24,162 |
49,153 |
182,647 |
54,987 |
237,634 |
207,638 |
79,149 |
286,787 |
| 25-29 |
25,756 |
24,493 |
50,249 |
338,667 |
76,587 |
415,254 |
364,423 |
101,080 |
465,503 |
| 30-34 |
24,115 |
21,342 |
45,457 |
273,317 |
64,342 |
337,659 |
297,432 |
85,684 |
383,116 |
| 35-39 |
16,495 |
15,524 |
32,019 |
199,197 |
48,186 |
247,383 |
215,692 |
63,710 |
279,402 |
| 40-44 |
11,186 |
10,700 |
21,886 |
139,523 |
33,161 |
172,684 |
150,709 |
43,861 |
194,570 |
| 45-49 |
8,106 |
7,904 |
16,010 |
91,271 |
22,503 |
113,774 |
99,377 |
30,407 |
129,784 |
| 50-54 |
5,996 |
6,583 |
12,579 |
62,702 |
14,705 |
77,407 |
68,698 |
21,288 |
89,986 |
| 55-59 |
4,759 |
4,922 |
9,681 |
35,338 |
8,327 |
43,665 |
40,097 |
13,249 |
53,346 |
| 60-64 |
3,843 |
3,263 |
7,106 |
13,320 |
4,037 |
17,357 |
17,163 |
7,300 |
24,463 |
| 65-69 |
2,382 |
1,940 |
4,322 |
4,253 |
1,947 |
6,200 |
6,635 |
3,887 |
10,522 |
| 70-74 |
1,802 |
1,530 |
3,332 |
1,673 |
1,076 |
2,749 |
3,475 |
2,606 |
6,081 |
| 75-79 |
1,005 |
843 |
1,848 |
659 |
597 |
1,256 |
1,664 |
1,440 |
3,104 |
| 80+ |
836 |
633 |
1,469 |
590 |
869 |
1,459 |
1,426 |
1,502 |
2,928 |
| Total |
255,251 |
240,117 |
495,368 |
1,492,582 |
465,146 |
1,957,728 |
1,747,833 |
705,263 |
2,453,096 |
Source: Statistics Centre – Abu Dhabi
ANNEXED NOTE
1. Characteristics of data, definitions
Since 2011, Islands were merged with Abu Dhabi Region and Al Gharbia
All numbers are rounded to the nearest 1000 persons, therefore, numbers may not add to totals.
The population data in the Statistical Yearbook includes Census data up to
2005 and mid-year estimates of the usual resident population from 2006.
The population estimates include people who are usual residents, temporary
absents and Emirati citizens away from the Emirate, who are legally entitled
to live in UAE. The mid-year 2013 population estimate is preliminary and
subject to revision.
2. Institution which provides data
Statistics centre of Abu Dhabi (SCAD), Abu Dhabi
3. Data availability
The data is taken from 2014 Statistical Yearbook (dat of publication: Nov. 2014; reference period: 2013)
Data is available under various formats (PDF, Excel, html).
http://www.scad.ae/en/statistics/Pages/Statistics.aspx?ThemeID=4&TopicID=14&SubTopicID=56&PublicationID=542
http://www.scad.ae/SCADDocuments/SYB%202014%20-%20Population%20-%20En.pdf
Date of access: January 2015.
| Nationality /sex/region |
2005 |
2010 |
2012 |
2013 |
| Nationals |
177.6 |
228.2 |
253.7 |
263.2 |
| Males |
91.4 |
114.4 |
130.5 |
135.3 |
| Females |
86.3 |
113.8 |
123.2 |
127.9 |
| Non-nationals |
631.4 |
969.1 |
1,164.5 |
1,235.3 |
| Males |
432.1 |
716.4 |
867.9 |
924.4 |
| Females |
199.3 |
252.7 |
296.6 |
310.9 |
| Abu Dhabi Region |
809.0 |
1,197.3 |
1,418.2 |
1,498.5 |
| Nationals |
143.9 |
177.1 |
194.2 |
202.3 |
| Males |
70.3 |
87.7 |
98.7 |
102.3 |
| Females |
73.6 |
89.5 |
95.5 |
100.0 |
| Non-nationals |
300.7 |
391.1 |
436.8 |
450.9 |
| Males |
222.6 |
290.0 |
310.7 |
317.0 |
| Females |
78.1 |
101.1 |
126.1 |
133.9 |
| Al Ain Region |
444.7 |
568.2 |
631.0 |
653.2 |
| Nationals |
20.2 |
25.2 |
28.8 |
29.9 |
| Males |
10.6 |
13.8 |
17.2 |
17.7 |
| Females |
9.6 |
11.4 |
11.6 |
12.2 |
| Non-nationals |
88.3 |
159.3 |
256.5 |
271.5 |
| Males |
74.5 |
141.8 |
237.0 |
251.2 |
| Females |
13.8 |
17.5 |
19.5 |
20.4 |
| Al Gharbia |
108.6 |
184.5 |
285.4 |
301.4 |
| Nationals |
2.5 |
3.2 |
– |
– |
| Males |
1.5 |
1.9 |
– |
– |
| Females |
1.0 |
1.3 |
– |
– |
| Non-nationals |
9.4 |
14.4 |
– |
– |
| Males |
8.7 |
13.6 |
– |
– |
| Females |
0.6 |
0.8 |
– |
– |
| Islands * |
11.9 |
17.6 |
– |
– |
| Abu Dhabi Emirate |
1,374.2 |
1,967.7 |
2,334.6 |
2,453.1 |
Source: Statistics Centre – Abu Dhabi
(Thousand Persons)
ANNEXED NOTE
1. Characteristics of data, definitions
Since 2011, Islands were merged with Abu Dhabi Region and Al Gharbia
All numbers are rounded to the nearest 1000 persons, therefore, numbers may not add to totals.
The population data in the Statistical Yearbook includes Census data up to
2005 and mid-year estimates of the usual resident population from 2006.
The population estimates include people who are usual residents, temporary
absents and Emirati citizens away from the Emirate, who are legally entitled
to live in UAE. The mid-year 2013 population estimate is preliminary and
subject to revision.
2. Institution which provides data
Statistics centre of Abu Dhabi (SCAD), Abu Dhabi
3. Data availability
The data is taken from 2014 Statistical Yearbook (dat of publication: Nov. 2014; reference period: 2013)
Data is available under various formats (PDF, Excel, html).
http://www.scad.ae/en/statistics/Pages/Statistics.aspx?ThemeID=4&TopicID=14&SubTopicID=56&PublicationID=542
http://www.scad.ae/SCADDocuments/SYB%202014%20-%20Population%20-%20En.pdf
Date of access: January 2015.
| Emirate |
Unemployment category |
Emiratis |
Non-Emiratis |
Total |
| Abu Dhabi |
Worked before |
6,074 |
5,316 |
11,390 |
| Never worked before |
4,246 |
12,937 |
17,183 |
| Dubai |
Worked before |
3,162 |
3,236 |
6,398 |
| Never worked before |
3,131 |
7,793 |
10,924 |
| Sharjah |
Worked before |
2,117 |
2,564 |
4,681 |
| Never worked before |
2,465 |
10,687 |
13,152 |
| Ajman |
Worked before |
548 |
773 |
1,321 |
| Never worked before |
541 |
2,945 |
3,486 |
| Umm Al Quwain |
Worked before |
299 |
193 |
492 |
| Never worked before |
333 |
674 |
1,007 |
| Ras AL Khaima |
Worked before |
1,722 |
588 |
2,310 |
| Never worked before |
1,879 |
2,463 |
4,342 |
| Al Fujairah |
Worked before |
787 |
250 |
1,037 |
| Never worked before |
1,356 |
709 |
2,065 |
| Total UAE |
Worked before |
14,709 |
12,920 |
27,629 |
| Never worked before |
13,951 |
38,208 |
52,159 |
Source: NBS, Ministry of Economy.
ANNEXED NOTE
1. Characteristics of data, definitions and population counting operations in the UAE
The first population census was conducted in 1968 by the Council of Developing Trucial States.
After Independence in 1971, a population census of the Emirate of Abu Dhabi was conducted that same year.
The first general population and establishments census in the UAE was conducted in 1975. It was the first census in the region following scientific standards and international recommendations. The other federal censuses were conducted in 1980, 1985, 1995 and 2005.
Reference days for UAE censuses: 30/12/1975; 15/12/1980, 16/12/1985, 16/12/1995; 29/10/2001; 06/12/2005.
Implementation method: the census was carried out according to de jure methodology, i.e. counting persons using their usual place of residence
Population of reference: Emirati nationals usually residing in the country+all foreign residents holding a valid residence permit+resident GCC nationals (nationals of other GCC states don’t need a permit to stay in the UAE)
Unemployment refers to persons aged 15 years and over who during the reference period: Are without work, available to work and actively seeking work.
Unemployed persons are available to start work in the two weeks following the interview and who had either looked for work in the four weeks prior to the interview or were waiting to start a job they had already found.
The unemployed are divided into two categories: the unemployed who have worked before and the unemployed who have never worked before (the new unemployed).
2010′ federal census was eventually cancelled but the Emirates Identity Authority (EIDA), an independent federal authority established in 2004, is currently in charge of recording all UAE residents, national and expatriates in order to set up a Population Register and an ID card program. The process is stil ongoing.
2. Institution which provides data
National Bureau of Statistics (NBS)
3. Data availability
Population statistics are available on NBS’s website:
http://www.uaestatistics.gov.ae/EnglishHome/tabid/96/Default.aspx
http://www.uaestatistics.gov.ae/Home/tabid/38/Default.aspx
Data are classified by subject and statistical publications are available on PDF or Excel format. Population data disagregated by nationality (Emirati/ non-Emirati) are scarce.
2005′ census data is available at:
http://www.uaestatistics.gov.ae/EnglishHome/ReportsByDepartmentEnglish/tabid/104/Default.aspx?MenuId=1&NDId=365
The present data is taken from:
http://www.uaestatistics.gov.ae/EnglishHome/ReportDetailsEnglish/tabid/121/Default.aspx?ItemId=1869&PTID=104&MenuId=1
Date of access: January 2015.
| Emirate |
Unemployment category |
Emiratis |
Non-Emiratis |
Total |
| Males |
Females |
Total |
Males |
Females |
Total |
| Abu Dhabi |
Worked before |
5,668 |
406 |
6,074 |
4,158 |
1,158 |
5,316 |
11,390 |
| Never worked before |
1,972 |
2,274 |
4,246 |
7,796 |
5,141 |
12,937 |
17,183 |
| Dubai |
Worked before |
2,609 |
553 |
3,162 |
2,048 |
1,188 |
3,236 |
6,398 |
| Never worked before |
1,549 |
1,582 |
3,131 |
4,280 |
3,513 |
7,793 |
10,924 |
| Sharjah |
Worked before |
1,928 |
189 |
2,117 |
2,154 |
410 |
2,564 |
4,681 |
| Never worked before |
1,218 |
1,247 |
2,465 |
8,009 |
2,678 |
10,687 |
13,152 |
| Ajman |
Worked before |
505 |
43 |
548 |
686 |
87 |
773 |
1,321 |
| Never worked before |
349 |
192 |
541 |
2,400 |
545 |
2,945 |
3,486 |
| Umm Al Quwain |
Worked before |
260 |
39 |
299 |
167 |
26 |
193 |
492 |
| Never worked before |
162 |
171 |
333 |
484 |
190 |
674 |
1,007 |
| Ras AL Khaima |
Worked before |
1,615 |
107 |
1,722 |
541 |
47 |
588 |
2,310 |
| Never worked before |
767 |
1,112 |
1,879 |
2,079 |
384 |
2,463 |
4,342 |
| Al Fujairah |
Worked before |
748 |
39 |
787 |
222 |
28 |
250 |
1,037 |
| Never worked before |
535 |
821 |
1,356 |
513 |
196 |
709 |
2,065 |
| |
Worked before |
13,333 |
1,376 |
14,709 |
9,976 |
2,944 |
12,920 |
27,629 |
| Never worked before |
6,552 |
7,399 |
13,951 |
25,561 |
12,647 |
38,208 |
52,159 |
Source: NBS, Ministry of Economy.
ANNEXED NOTE
1. Characteristics of data, definitions and population counting operations in the UAE
The first population census was conducted in 1968 by the Council of Developing Trucial States.
After Independence in 1971, a population census of the Emirate of Abu Dhabi was conducted that same year.
The first general population and establishments census in the UAE was conducted in 1975. It was the first census in the region following scientific standards and international recommendations. The other federal censuses were conducted in 1980, 1985, 1995 and 2005.
Reference days for UAE censuses: 30/12/1975; 15/12/1980, 16/12/1985, 16/12/1995; 29/10/2001; 06/12/2005.
Implementation method: the census was carried out according to de jure methodology, i.e. counting persons using their usual place of residence
Population of reference: Emirati nationals usually residing in the country+all foreign residents holding a valid residence permit+resident GCC nationals (nationals of other GCC states don’t need a permit to stay in the UAE)
Unemployment refers to persons aged 15 years and over who during the reference period: Are without work, available to work and actively seeking work.
Unemployed persons are available to start work in the two weeks following the interview and who had either looked for work in the four weeks prior to the interview or were waiting to start a job they had already found.
The unemployed are divided into two categories: the unemployed who have worked before and the unemployed who have never worked before (the new unemployed).
2010′ federal census was eventually cancelled but the Emirates Identity Authority (EIDA), an independent federal authority established in 2004, is currently in charge of recording all UAE residents, national and expatriates in order to set up a Population Register and an ID card program. The process is stil ongoing.
2. Institution which provides data
National Bureau of Statistics (NBS)
3. Data availability
Population statistics are available on NBS’s website:
http://www.uaestatistics.gov.ae/EnglishHome/tabid/96/Default.aspx
http://www.uaestatistics.gov.ae/Home/tabid/38/Default.aspx
Data are classified by subject and statistical publications are available on PDF or Excel format. Population data disagregated by nationality (Emirati/ non-Emirati) are scarce.
2005′ census data is available at:
http://www.uaestatistics.gov.ae/EnglishHome/ReportsByDepartmentEnglish/tabid/104/Default.aspx?MenuId=1&NDId=365
The present data is taken from:
http://www.uaestatistics.gov.ae/EnglishHome/ReportDetailsEnglish/tabid/121/Default.aspx?ItemId=1869&PTID=104&MenuId=1
Date of access: January 2015.
| Unemployment Status |
Worked before |
Never Worked Before |
| Abu Dhabi |
|
Age groups |
15 – 19 |
20 – 24 |
25 – 29 |
30 – 34 |
35 – 39 |
40 – 44 |
45 – 49 |
50 – 54 |
55 – 59 |
60 – 64 |
Total |
15 – 19 |
20 – 24 |
25 – 29 |
30 – 34 |
35 – 39 |
40 – 44 |
45 – 49 |
50 – 54 |
55 – 59 |
60 – 64 |
Total |
| |
Emiratis |
Males |
36 |
276 |
430 |
345 |
400 |
569 |
873 |
1,026 |
913 |
800 |
5,668 |
391 |
839 |
386 |
129 |
65 |
43 |
32 |
24 |
28 |
35 |
1,972 |
| |
|
Females |
… |
31 |
81 |
70 |
80 |
64 |
30 |
30 |
13 |
7 |
406 |
145 |
1,098 |
777 |
164 |
61 |
11 |
11 |
2 |
2 |
3 |
2,274 |
| |
|
Emiratis total |
36 |
307 |
511 |
415 |
480 |
633 |
903 |
1,056 |
926 |
807 |
6,074 |
536 |
1,937 |
1,163 |
293 |
126 |
54 |
43 |
26 |
30 |
38 |
4,246 |
| |
|
Males |
19 |
280 |
588 |
561 |
505 |
463 |
429 |
492 |
407 |
414 |
4,158 |
1,008 |
2,653 |
1,760 |
869 |
552 |
349 |
252 |
168 |
106 |
79 |
7,796 |
| |
Non-Emiratis |
Females |
3 |
96 |
215 |
210 |
190 |
125 |
141 |
88 |
58 |
32 |
1,158 |
579 |
1,845 |
1,200 |
618 |
380 |
253 |
124 |
69 |
46 |
27 |
5,141 |
| |
|
Non-Emiratis total |
22 |
376 |
803 |
771 |
695 |
588 |
570 |
580 |
465 |
446 |
5,316 |
1,587 |
4,498 |
2,960 |
1,487 |
932 |
602 |
376 |
237 |
152 |
106 |
12,937 |
| |
Abu Dhabi Total |
|
58 |
683 |
1,314 |
1,186 |
1,175 |
1,221 |
1,473 |
1,636 |
1,391 |
1,253 |
11,390 |
2,123 |
6,435 |
4,123 |
1,780 |
1,058 |
656 |
419 |
263 |
182 |
144 |
17,183 |
| Dubai |
Emiratis |
Males |
22 |
143 |
238 |
249 |
240 |
305 |
375 |
440 |
336 |
261 |
2,609 |
287 |
593 |
345 |
141 |
60 |
45 |
21 |
21 |
21 |
15 |
1,549 |
| |
|
Females |
7 |
49 |
96 |
80 |
99 |
89 |
56 |
38 |
17 |
22 |
553 |
148 |
615 |
410 |
190 |
109 |
41 |
28 |
21 |
11 |
9 |
1,582 |
| |
|
Emiratis total |
29 |
192 |
334 |
329 |
339 |
394 |
431 |
478 |
353 |
283 |
3,162 |
435 |
1,208 |
755 |
331 |
169 |
86 |
49 |
42 |
32 |
24 |
3,131 |
| |
|
Males |
41 |
216 |
409 |
378 |
305 |
226 |
158 |
126 |
113 |
76 |
2,048 |
316 |
999 |
951 |
704 |
538 |
354 |
200 |
119 |
73 |
26 |
4,280 |
| |
Non-Emiratis |
Females |
30 |
154 |
284 |
232 |
178 |
126 |
71 |
51 |
41 |
21 |
1,188 |
190 |
973 |
938 |
499 |
374 |
252 |
129 |
88 |
53 |
17 |
3,513 |
| |
|
Non-Emiratis total |
71 |
370 |
693 |
610 |
483 |
352 |
229 |
177 |
154 |
97 |
3,236 |
506 |
1,972 |
1,889 |
1,203 |
912 |
606 |
329 |
207 |
126 |
43 |
7,793 |
| |
Dubai Total |
|
100 |
562 |
1,027 |
939 |
822 |
746 |
660 |
655 |
507 |
380 |
6,398 |
941 |
3,180 |
2,644 |
1,534 |
1,081 |
692 |
378 |
249 |
158 |
67 |
10,924 |
| Sharjah |
Emiratis |
Males |
9 |
117 |
128 |
106 |
130 |
203 |
256 |
369 |
376 |
234 |
1,928 |
281 |
494 |
258 |
77 |
40 |
19 |
12 |
10 |
19 |
8 |
1,218 |
| |
|
Females |
2 |
10 |
22 |
21 |
34 |
49 |
33 |
12 |
5 |
1 |
189 |
85 |
597 |
408 |
107 |
32 |
11 |
5 |
… |
2 |
… |
1,247 |
| |
|
Emiratis total |
11 |
127 |
150 |
127 |
164 |
252 |
289 |
381 |
381 |
235 |
2,117 |
366 |
1,091 |
666 |
184 |
72 |
30 |
17 |
10 |
21 |
8 |
2,465 |
| |
|
Males |
14 |
211 |
398 |
407 |
303 |
223 |
186 |
146 |
141 |
125 |
2,154 |
746 |
2,628 |
1,972 |
1,264 |
569 |
393 |
196 |
115 |
72 |
54 |
8,009 |
| |
Non-Emiratis |
Females |
5 |
43 |
101 |
72 |
71 |
52 |
18 |
26 |
8 |
14 |
410 |
285 |
857 |
680 |
411 |
231 |
97 |
56 |
31 |
19 |
11 |
2,678 |
| |
|
Non-Emiratis total |
19 |
254 |
499 |
479 |
374 |
275 |
204 |
172 |
149 |
139 |
2,564 |
1,031 |
3,485 |
2,652 |
1,675 |
800 |
490 |
252 |
146 |
91 |
65 |
10,687 |
| |
Sharjah Total |
|
30 |
381 |
649 |
606 |
538 |
527 |
493 |
553 |
530 |
374 |
4,681 |
1,397 |
4,576 |
3,318 |
1,859 |
872 |
520 |
269 |
156 |
112 |
73 |
13,152 |
| Ajman |
Emiratis |
Males |
4 |
34 |
40 |
30 |
30 |
55 |
86 |
102 |
68 |
56 |
505 |
73 |
126 |
106 |
14 |
9 |
6 |
6 |
5 |
2 |
2 |
349 |
| |
|
Females |
… |
3 |
5 |
5 |
12 |
11 |
4 |
2 |
1 |
… |
43 |
14 |
106 |
61 |
9 |
1 |
… |
… |
1 |
… |
… |
192 |
| |
|
Emiratis total |
4 |
37 |
45 |
35 |
42 |
66 |
90 |
104 |
69 |
56 |
548 |
87 |
232 |
167 |
23 |
10 |
6 |
6 |
6 |
2 |
2 |
541 |
| |
|
Males |
4 |
51 |
90 |
103 |
74 |
73 |
79 |
79 |
59 |
74 |
686 |
313 |
784 |
493 |
312 |
196 |
127 |
97 |
44 |
22 |
12 |
2,400 |
| |
Non-Emiratis |
Females |
3 |
7 |
21 |
17 |
10 |
8 |
6 |
6 |
8 |
1 |
87 |
76 |
216 |
128 |
62 |
25 |
19 |
12 |
5 |
1 |
1 |
545 |
| |
|
Non-Emiratis total |
7 |
58 |
111 |
120 |
84 |
81 |
85 |
85 |
67 |
75 |
773 |
389 |
1,000 |
621 |
374 |
221 |
146 |
109 |
49 |
23 |
13 |
2,945 |
| |
Ajman Total |
|
11 |
95 |
156 |
155 |
126 |
147 |
175 |
189 |
136 |
131 |
1,321 |
476 |
1,232 |
788 |
397 |
231 |
152 |
115 |
55 |
25 |
15 |
3,486 |
| Umm Al Quwain |
Emiratis |
Males |
3 |
16 |
25 |
10 |
13 |
31 |
36 |
54 |
46 |
26 |
260 |
56 |
68 |
19 |
8 |
3 |
3 |
3 |
… |
2 |
… |
162 |
| |
|
Females |
… |
1 |
… |
5 |
17 |
11 |
3 |
1 |
1 |
… |
39 |
10 |
100 |
45 |
12 |
… |
1 |
1 |
2 |
… |
… |
171 |
| |
|
Emiratis total |
3 |
17 |
25 |
15 |
30 |
42 |
39 |
55 |
47 |
26 |
299 |
66 |
168 |
64 |
20 |
3 |
4 |
4 |
2 |
2 |
… |
333 |
| |
|
Males |
… |
9 |
19 |
23 |
19 |
27 |
30 |
20 |
11 |
9 |
167 |
108 |
172 |
98 |
49 |
21 |
13 |
12 |
2 |
8 |
1 |
484 |
| |
Non-Emiratis |
Females |
… |
4 |
6 |
2 |
5 |
1 |
3 |
5 |
… |
… |
26 |
38 |
82 |
34 |
18 |
7 |
5 |
1 |
2 |
3 |
… |
190 |
| |
|
Non-Emiratis total |
… |
13 |
25 |
25 |
24 |
28 |
33 |
25 |
11 |
9 |
193 |
146 |
254 |
132 |
67 |
28 |
18 |
13 |
4 |
11 |
1 |
674 |
| |
Umm Al Quwain Total |
3 |
30 |
50 |
40 |
54 |
70 |
72 |
80 |
58 |
35 |
492 |
212 |
422 |
196 |
87 |
31 |
22 |
17 |
6 |
13 |
1 |
1,007 |
| Ras al-Khaima |
Emiratis |
Males |
9 |
61 |
99 |
81 |
81 |
149 |
297 |
364 |
273 |
201 |
1,615 |
249 |
306 |
123 |
24 |
13 |
10 |
7 |
13 |
15 |
7 |
767 |
| |
|
Females |
… |
7 |
16 |
19 |
31 |
22 |
9 |
2 |
1 |
… |
107 |
65 |
572 |
375 |
80 |
18 |
2 |
… |
… |
… |
… |
1,112 |
| |
|
Emiratis total |
9 |
68 |
115 |
100 |
112 |
171 |
306 |
366 |
274 |
201 |
1,722 |
314 |
878 |
498 |
104 |
31 |
12 |
7 |
13 |
15 |
7 |
1,879 |
| |
|
Males |
2 |
39 |
79 |
84 |
82 |
60 |
54 |
57 |
43 |
41 |
541 |
191 |
611 |
393 |
488 |
131 |
98 |
56 |
51 |
34 |
26 |
2,079 |
| |
Non-Emiratis |
Females |
… |
3 |
7 |
6 |
4 |
6 |
6 |
8 |
3 |
4 |
47 |
55 |
189 |
75 |
37 |
11 |
7 |
4 |
3 |
2 |
1 |
384 |
| |
|
Non-Emiratis total |
2 |
42 |
86 |
90 |
86 |
66 |
60 |
65 |
46 |
45 |
588 |
246 |
800 |
468 |
525 |
142 |
105 |
60 |
54 |
36 |
27 |
2,463 |
| |
Ras al-Khaima Total |
|
11 |
110 |
201 |
190 |
198 |
237 |
366 |
431 |
320 |
246 |
2,310 |
560 |
1,678 |
966 |
629 |
173 |
117 |
67 |
67 |
51 |
34 |
4,342 |
| Al Fujairah |
Emiratis |
Males |
10 |
57 |
59 |
26 |
37 |
74 |
127 |
154 |
117 |
87 |
748 |
220 |
201 |
70 |
17 |
4 |
… |
1 |
7 |
10 |
5 |
535 |
| |
|
Females |
1 |
10 |
7 |
13 |
4 |
2 |
… |
1 |
… |
1 |
39 |
49 |
433 |
279 |
50 |
8 |
2 |
… |
… |
… |
… |
821 |
| |
|
Emiratis total |
11 |
67 |
66 |
39 |
41 |
76 |
127 |
155 |
117 |
88 |
787 |
269 |
634 |
349 |
67 |
12 |
2 |
1 |
7 |
10 |
5 |
1,356 |
| |
Non-Emiratis |
Males |
2 |
26 |
43 |
45 |
30 |
28 |
20 |
11 |
12 |
5 |
222 |
50 |
161 |
136 |
53 |
44 |
28 |
16 |
16 |
5 |
4 |
513 |
| |
|
Females |
… |
3 |
1 |
6 |
2 |
9 |
2 |
2 |
3 |
… |
28 |
22 |
84 |
52 |
17 |
11 |
4 |
3 |
… |
… |
3 |
196 |
| |
|
Non-Emiratis total |
2 |
29 |
44 |
51 |
32 |
37 |
22 |
13 |
15 |
5 |
250 |
72 |
245 |
188 |
70 |
55 |
32 |
19 |
16 |
5 |
7 |
709 |
| |
Al Fujairah Total |
|
13 |
96 |
110 |
90 |
73 |
113 |
149 |
168 |
132 |
93 |
1,037 |
341 |
879 |
537 |
137 |
67 |
34 |
20 |
23 |
15 |
12 |
2,065 |
Source: NBS, Ministry of Economy.
ANNEXED NOTE
1. Characteristics of data, definitions and population counting operations in the UAE
The first population census was conducted in 1968 by the Council of Developing Trucial States.
After Independence in 1971, a population census of the Emirate of Abu Dhabi was conducted that same year.
The first general population and establishments census in the UAE was conducted in 1975. It was the first census in the region following scientific standards and international recommendations. The other federal censuses were conducted in 1980, 1985, 1995 and 2005.
Reference days for UAE censuses: 30/12/1975; 15/12/1980, 16/12/1985, 16/12/1995; 29/10/2001; 06/12/2005.
Implementation method: the census was carried out according to de jure methodology, i.e. counting persons using their usual place of residence
Population of reference: Emirati nationals usually residing in the country+all foreign residents holding a valid residence permit+resident GCC nationals (nationals of other GCC states don’t need a permit to stay in the UAE)
Unemployment refers to persons aged 15 years and over who during the reference period: Are without work, available to work and actively seeking work.
Unemployed persons are available to start work in the two weeks following the interview and who had either looked for work in the four weeks prior to the interview or were waiting to start a job they had already found.
The unemployed are divided into two categories: the unemployed who have worked before and the unemployed who have never worked before (the new unemployed).
2010′ federal census was eventually cancelled but the Emirates Identity Authority (EIDA), an independent federal authority established in 2004, is currently in charge of recording all UAE residents, national and expatriates in order to set up a Population Register and an ID card program. The process is stil ongoing.
2. Institution which provides data
National Bureau of Statistics (NBS)
3. Data availability
Population statistics are available on NBS’s website:
http://www.uaestatistics.gov.ae/EnglishHome/tabid/96/Default.aspx
http://www.uaestatistics.gov.ae/Home/tabid/38/Default.aspx
Data are classified by subject and statistical publications are available on PDF or Excel format. Population data disagregated by nationality (Emirati/ non-Emirati) are scarce.
2005′ census data is available at:
http://www.uaestatistics.gov.ae/EnglishHome/ReportsByDepartmentEnglish/tabid/104/Default.aspx?MenuId=1&NDId=365
The present data is taken from:
http://www.uaestatistics.gov.ae/EnglishHome/ReportDetailsEnglish/tabid/121/Default.aspx?ItemId=1869&PTID=104&MenuId=1
Date of access: January 2015.
| Age groups |
Sex |
Duration of residence (years) |
| Less than 1 |
1 – 4 |
5 – 9 |
10 – 14 |
15 – 19 |
20 – 24 |
25 – 29 |
+ 30 |
Not Stated |
Total |
| 15 – 19 |
Male |
1,245 |
4,804 |
518 |
263 |
852 |
0 |
0 |
0 |
0 |
7,682 |
| |
Female |
615 |
2,977 |
213 |
60 |
282 |
0 |
0 |
0 |
0 |
4,147 |
| |
Total |
1,860 |
7,781 |
731 |
323 |
1,134 |
0 |
0 |
0 |
0 |
11,829 |
| 20 – 24 |
Male |
22,073 |
143,866 |
15,060 |
2,701 |
1,591 |
8,094 |
0 |
0 |
8 |
193,393 |
| |
Female |
4,907 |
43,588 |
2,877 |
608 |
471 |
3,429 |
0 |
0 |
0 |
55,880 |
| |
Total |
26,980 |
187,454 |
17,937 |
3,309 |
2,062 |
11,523 |
0 |
0 |
8 |
249,273 |
| 25 – 29 |
Male |
25,185 |
288,921 |
92,568 |
11,219 |
2,874 |
2,658 |
10,073 |
0 |
23 |
433,521 |
| |
Female |
5,161 |
52,358 |
9,510 |
1,065 |
490 |
695 |
3,426 |
0 |
0 |
72,705 |
| |
Total |
30,346 |
341,279 |
102,078 |
12,284 |
3,364 |
3,353 |
13,499 |
0 |
23 |
506,226 |
| 30 – 34 |
Male |
16,582 |
223,137 |
156,189 |
44,196 |
7,232 |
2,806 |
1,928 |
5,299 |
17 |
457,386 |
| |
Female |
3,342 |
34,942 |
15,519 |
3,479 |
689 |
443 |
538 |
1,243 |
0 |
60,195 |
| |
Total |
19,924 |
258,079 |
171,708 |
47,675 |
7,921 |
3,249 |
2,466 |
6,542 |
17 |
517,581 |
| 35 – 39 |
Male |
10,318 |
123,834 |
126,454 |
67,392 |
22,970 |
5,659 |
1,931 |
3,878 |
18 |
362,454 |
| |
Female |
2,061 |
18,984 |
10,081 |
5,535 |
2,020 |
543 |
323 |
684 |
0 |
40,231 |
| |
Total |
12,379 |
142,818 |
136,535 |
72,927 |
24,990 |
6,202 |
2,254 |
4,562 |
18 |
402,685 |
| 40 – 44 |
Male |
5,567 |
60,149 |
64,560 |
56,495 |
31,727 |
17,540 |
5,463 |
3,546 |
12 |
245,059 |
| |
Female |
961 |
9,210 |
5,207 |
4,038 |
3,183 |
1,537 |
485 |
424 |
0 |
25,045 |
| |
Total |
6,528 |
69,359 |
69,767 |
60,533 |
34,910 |
19,077 |
5,948 |
3,970 |
12 |
270,104 |
| 45 – 49 |
Male |
2,934 |
28,574 |
32,923 |
30,536 |
23,875 |
20,360 |
14,269 |
6,308 |
4 |
159,783 |
| |
Female |
347 |
3,627 |
2,498 |
2,102 |
1,971 |
1,879 |
1,121 |
318 |
0 |
13,863 |
| |
Total |
3,281 |
32,201 |
35,421 |
32,638 |
25,846 |
22,239 |
15,390 |
6,626 |
4 |
173,646 |
| 50 – 54 |
Male |
1,127 |
12,566 |
13,617 |
13,718 |
12,023 |
14,566 |
16,160 |
11,308 |
4 |
95,089 |
| |
Female |
116 |
1,415 |
1,028 |
920 |
925 |
1,137 |
1,352 |
517 |
0 |
7,410 |
| |
Total |
1,243 |
13,981 |
14,645 |
14,638 |
12,948 |
15,703 |
17,512 |
11,825 |
4 |
102,499 |
| 55 – 59 |
Male |
437 |
4,575 |
4,525 |
4,706 |
4,490 |
5,667 |
8,469 |
8,912 |
1 |
41,782 |
| |
Female |
38 |
476 |
316 |
244 |
285 |
330 |
490 |
368 |
0 |
2,547 |
| |
Total |
475 |
5,051 |
4,841 |
4,950 |
4,775 |
5,997 |
8,959 |
9,280 |
1 |
44,329 |
| 60 – 64 |
Male |
101 |
1,216 |
1,100 |
1,031 |
991 |
1,217 |
1,806 |
3,418 |
0 |
10,880 |
| |
Female |
15 |
117 |
88 |
63 |
69 |
81 |
70 |
116 |
0 |
619 |
| |
Total |
116 |
1,333 |
1,188 |
1,094 |
1,060 |
1,298 |
1,876 |
3,534 |
0 |
11,499 |
| 65 + |
Male |
48 |
644 |
450 |
287 |
296 |
317 |
521 |
1,302 |
0 |
3,865 |
| |
Female |
8 |
86 |
36 |
31 |
17 |
20 |
25 |
56 |
0 |
279 |
| |
Total |
56 |
730 |
486 |
318 |
313 |
337 |
546 |
1,358 |
0 |
4,144 |
| Not Stated |
Male |
0 |
0 |
0 |
0 |
0 |
0 |
0 |
0 |
143 |
143 |
| |
Female |
1 |
0 |
0 |
0 |
0 |
0 |
0 |
0 |
261 |
262 |
| |
Total |
1 |
0 |
0 |
0 |
0 |
0 |
0 |
0 |
404 |
405 |
| |
Male |
85,617 |
892,286 |
507,964 |
232,544 |
108,921 |
78,884 |
60,620 |
43,971 |
230 |
2,011,037 |
| Total |
Female |
17,572 |
167,780 |
47,373 |
18,145 |
10,402 |
10,094 |
7,830 |
3,726 |
261 |
283,183 |
| |
Total |
103,189 |
1,060,066 |
555,337 |
250,689 |
119,323 |
88,978 |
68,450 |
47,697 |
491 |
2,294,220 |
Source: NBS, Ministry of Economy.
ANNEXED NOTE
1. Characteristics of data, definitions and population counting operations in the UAE
The first population census was conducted in 1968 by the Council of Developing Trucial States.
After Independence in 1971, a population census of the Emirate of Abu Dhabi was conducted that same year.
The first general population and establishments census in the UAE was conducted in 1975. It was the first census in the region following scientific standards and international recommendations. The other federal censuses were conducted in 1980, 1985, 1995 and 2005.
Reference days for UAE censuses: 30/12/1975; 15/12/1980, 16/12/1985, 16/12/1995; 29/10/2001; 06/12/2005.
Implementation method: the census was carried out according to de jure methodology, i.e. counting persons using their usual place of residence
Population of reference: Emirati nationals usually residing in the country+all foreign residents holding a valid residence permit+resident GCC nationals (nationals of other GCC states don’t need a permit to stay in the UAE)
Employed person: An individual, 15 years old or older, who works for a salary during the week of the time reference, either working for others or self-employed, as well as those who have a job but are not on duty during the week of the time reference (for being on vacation or are delegated for training courses or work programs by their employers and those who work for a family without wage).
2010′ federal census was eventually cancelled but the Emirates Identity Authority (EIDA), an independent federal authority established in 2004, is currently in charge of recording all UAE residents, national and expatriates in order to set up a Population Register and an ID card program. The process is stil ongoing.
2. Institution which provides data
National Bureau of Statistics (NBS)
3. Data availability
Population statistics are available on NBS’s website:
http://fcsa.gov.ae/en-us/statistics/population-data-estimates
http://fcsa.gov.ae/en-us/Pages/Statistics/Statistics-by-Subject.aspx#report-tvDetails
Data are classified by subject and statistical publications are available on PDF or Excel format. Population data disagregated by nationality (Emirati/ non-Emirati) are scarce.
2005′ census data is available at:
http://fcsa.gov.ae/en-us/Pages/Statistics/Statistics-by-Subject.aspx
The present data is taken from:
http://fcsa.gov.ae/en-us/Pages/Statistics/Statistics-by-Subject.aspx#report-tvDetails
Date of access: November 2014.
|
Emiratis |
Non-Emiratis |
Total |
|
Males |
Females |
Total |
Males |
Females |
Total |
| Abu Dhabi |
60,911 |
14,607 |
75,518 |
617,039 |
94,181 |
711,220 |
786,738 |
| Dubai |
27,146 |
9,742 |
36,888 |
837,827 |
107,581 |
945,408 |
982,296 |
| Sharjah |
24,538 |
6,204 |
30,742 |
347,361 |
46,014 |
393,375 |
424,117 |
| Ajman |
7,181 |
1,561 |
8,742 |
79,668 |
9,567 |
89,235 |
97,977 |
| Umm Al Quwain |
2,761 |
899 |
3,660 |
17,174 |
3,750 |
20,924 |
24,584 |
| Ras AL Khaima |
15,755 |
3,161 |
18,916 |
68,695 |
14,267 |
82,962 |
101,878 |
| Al Fujairah |
9,337 |
1,857 |
11,194 |
43,273 |
7,823 |
51,096 |
62,290 |
| Total |
147,629 |
38,031 |
185,660 |
2,011,037 |
283,183 |
2,294,220 |
2,479,880 |
Source: NBS, Ministry of Economy.
ANNEXED NOTE
1. Characteristics of data, definitions and population counting operations in the UAE
The first population census was conducted in 1968 by the Council of Developing Trucial States.
After Independence in 1971, a population census of the Emirate of Abu Dhabi was conducted that same year.
The first general population and establishments census in the UAE was conducted in 1975. It was the first census in the region following scientific standards and international recommendations. The other federal censuses were conducted in 1980, 1985, 1995 and 2005.
Reference days for UAE censuses: 30/12/1975; 15/12/1980, 16/12/1985, 16/12/1995; 29/10/2001; 06/12/2005.
Implementation method: the census was carried out according to de jure methodology, i.e. counting persons using their usual place of residence
Population of reference: Emirati nationals usually residing in the country+all foreign residents holding a valid residence permit+resident GCC nationals (nationals of other GCC states don’t need a permit to stay in the UAE)
Employed person: An individual, 15 years old or older, who works for a salary during the week of the time reference, either working for others or self-employed, as well as those who have a job but are not on duty during the week of the time reference (for being on vacation or are delegated for training courses or work programs by their employers and those who work for a family without wage).
2010′ federal census was eventually cancelled but the Emirates Identity Authority (EIDA), an independent federal authority established in 2004, is currently in charge of recording all UAE residents, national and expatriates in order to set up a Population Register and an ID card program. The process is stil ongoing.
2. Institution which provides data
National Bureau of Statistics (NBS)
3. Data availability
Population statistics are available on NBS’s website:
http://www.uaestatistics.gov.ae/EnglishHome/tabid/96/Default.aspx
http://www.uaestatistics.gov.ae/Home/tabid/38/Default.aspx
Data are classified by subject and statistical publications are available on PDF or Excel format. Population data disagregated by nationality (Emirati/ non-Emirati) are scarce.
2005′ census data is available at:
http://www.uaestatistics.gov.ae/EnglishHome/ReportsByDepartmentEnglish/tabid/104/Default.aspx?MenuId=1&NDId=365
The present data is taken from:
http://www.uaestatistics.gov.ae/EnglishHome/ReportDetailsEnglish/tabid/121/Default.aspx?ItemId=1869&PTID=104&MenuId=1
Date of access: November 2014.
| Abu Dhabi |
|
Age groups |
15 – 19 |
20 – 24 |
25 – 29 |
30 – 34 |
35 – 39 |
40 – 44 |
45 – 49 |
50 – 54 |
55 – 59 |
60 – 64 |
65 – 69 |
70 – 74 |
75 – 79 |
80 – 84 |
85+ |
Total |
| Emiratis |
Males |
2,357 |
13,154 |
14,985 |
10,230 |
7,367 |
4,712 |
3,313 |
2,193 |
1,479 |
733 |
241 |
90 |
35 |
5 |
2 |
60,911 |
| Females |
120 |
2,308 |
5,408 |
3,451 |
1,903 |
813 |
359 |
124 |
72 |
23 |
5 |
4 |
1 |
0 |
0 |
14,607 |
| Emiratis total |
2,477 |
15,462 |
20,393 |
13,681 |
9,270 |
5,525 |
3,672 |
2,317 |
1,551 |
756 |
246 |
94 |
36 |
5 |
2 |
75,518 |
| |
Males |
2,285 |
51,833 |
114,389 |
128,374 |
109,550 |
85,470 |
63,148 |
38,971 |
17,681 |
4,046 |
809 |
254 |
70 |
13 |
3 |
617,039 |
| Non-Emiratis |
Females |
1,571 |
16,577 |
22,816 |
19,956 |
14,198 |
9,087 |
5,451 |
2,958 |
999 |
229 |
42 |
33 |
2 |
0 |
0 |
94,181 |
| |
Non-Emiratis total |
3,856 |
68,410 |
137,205 |
148,330 |
123,748 |
94,557 |
68,599 |
41,929 |
18,680 |
4,275 |
851 |
287 |
72 |
13 |
3 |
711,220 |
| Abu Dhabi Total |
6,333 |
83,872 |
157,598 |
162,011 |
133,018 |
100,082 |
72,271 |
44,246 |
20,231 |
5,031 |
1,097 |
381 |
108 |
18 |
5 |
786,738 |
| Dubai |
Emiratis |
Males |
606 |
3,774 |
5,362 |
4,633 |
3,947 |
2,970 |
2,177 |
1,444 |
969 |
640 |
286 |
159 |
110 |
45 |
24 |
27,146 |
| Females |
217 |
1,998 |
2,829 |
2,004 |
1,426 |
659 |
311 |
129 |
59 |
27 |
24 |
27 |
9 |
13 |
10 |
9,742 |
| Emiratis total |
823 |
5,772 |
8,191 |
6,637 |
5,373 |
3,629 |
2,488 |
1,573 |
1,028 |
667 |
310 |
186 |
119 |
58 |
34 |
36,888 |
| |
Males |
2,461 |
82,032 |
197,032 |
202,132 |
154,950 |
94,164 |
54,819 |
31,737 |
13,216 |
3,660 |
835 |
298 |
318 |
74 |
99 |
837,827 |
| Non-Emiratis |
Females |
840 |
22,682 |
28,151 |
23,358 |
14,711 |
9,140 |
4,788 |
2,642 |
868 |
253 |
58 |
39 |
17 |
15 |
19 |
107,581 |
| |
Non-Emiratis total |
3,301 |
104,714 |
225,183 |
225,490 |
169,661 |
103,304 |
59,607 |
34,379 |
14,084 |
3,913 |
893 |
337 |
335 |
89 |
118 |
945,408 |
| Dubai Total |
4,124 |
110,486 |
233,374 |
232,127 |
175,034 |
106,933 |
62,095 |
35,952 |
15,112 |
4,580 |
1,203 |
523 |
454 |
147 |
152 |
982,296 |
| Sharjah |
Emiratis |
Males |
833 |
5,017 |
5,557 |
3,731 |
3,275 |
2,257 |
1,659 |
1,000 |
643 |
341 |
140 |
51 |
22 |
7 |
5 |
24,538 |
| Females |
71 |
1,083 |
2,110 |
1,410 |
890 |
386 |
171 |
52 |
18 |
6 |
5 |
2 |
0 |
0 |
0 |
6,204 |
| Emiratis total |
904 |
6,100 |
7,667 |
5,141 |
4,165 |
2,643 |
1,830 |
1,052 |
661 |
347 |
145 |
53 |
22 |
7 |
5 |
30,742 |
| |
Males |
1,556 |
36,190 |
76,890 |
81,929 |
62,223 |
39,966 |
24,821 |
14,483 |
6,537 |
2,037 |
486 |
156 |
38 |
30 |
19 |
347,361 |
| Non-Emiratis |
Females |
756 |
8,859 |
12,344 |
9,778 |
6,577 |
4,016 |
2,100 |
1,051 |
415 |
89 |
16 |
8 |
2 |
1 |
2 |
46,014 |
| |
Non-Emiratis total |
2,312 |
45,049 |
89,234 |
91,707 |
68,800 |
43,982 |
26,921 |
15,534 |
6,952 |
2,126 |
502 |
164 |
40 |
31 |
21 |
393,375 |
| Sharjah Total |
3,216 |
51,149 |
96,901 |
96,848 |
72,965 |
46,625 |
28,751 |
16,586 |
7,613 |
2,473 |
647 |
217 |
62 |
38 |
26 |
424,117 |
| Ajman |
Emiratis |
Males |
279 |
1,591 |
1,688 |
1,095 |
893 |
570 |
492 |
272 |
154 |
83 |
27 |
24 |
6 |
2 |
5 |
7,181 |
| Females |
21 |
359 |
584 |
298 |
163 |
91 |
34 |
6 |
1 |
3 |
0 |
0 |
1 |
0 |
0 |
1,561 |
| Emiratis total |
300 |
1,950 |
2,272 |
1,393 |
1,056 |
661 |
526 |
278 |
155 |
86 |
27 |
24 |
7 |
2 |
5 |
8,742 |
| |
Males |
487 |
9,259 |
18,106 |
17,504 |
13,511 |
9,327 |
5,984 |
3,377 |
1,542 |
449 |
88 |
19 |
7 |
3 |
5 |
79,668 |
| Non-Emiratis |
Females |
234 |
2,039 |
2,608 |
1,878 |
1,255 |
770 |
466 |
203 |
92 |
15 |
3 |
3 |
0 |
1 |
0 |
9,567 |
| |
Non-Emiratis total |
721 |
11,298 |
20,714 |
19,382 |
14,766 |
10,097 |
6,450 |
3,580 |
1,634 |
464 |
91 |
22 |
7 |
4 |
5 |
89,235 |
| Ajman Total |
1,021 |
13,248 |
22,986 |
20,775 |
15,822 |
10,758 |
6,976 |
3,858 |
1,789 |
550 |
118 |
46 |
14 |
6 |
10 |
97,977 |
| Umm Al Quwain |
Emiratis |
Males |
107 |
623 |
672 |
385 |
326 |
221 |
189 |
119 |
65 |
25 |
21 |
6 |
1 |
1 |
0 |
2,761 |
| Females |
9 |
168 |
323 |
196 |
117 |
54 |
27 |
2 |
2 |
1 |
0 |
0 |
0 |
0 |
0 |
899 |
| Emiratis total |
116 |
791 |
995 |
581 |
443 |
275 |
216 |
121 |
67 |
26 |
21 |
6 |
1 |
1 |
0 |
3,660 |
| |
Males |
148 |
2,230 |
3,681 |
3,592 |
2,670 |
1,969 |
1,462 |
874 |
416 |
98 |
20 |
4 |
3 |
2 |
5 |
17,174 |
| Non-Emiratis |
Females |
111 |
844 |
912 |
733 |
527 |
339 |
150 |
84 |
42 |
5 |
1 |
0 |
0 |
1 |
1 |
3,750 |
| |
Non-Emiratis total |
259 |
3,074 |
4,593 |
4,325 |
3,197 |
2,308 |
1,612 |
958 |
458 |
103 |
21 |
4 |
3 |
3 |
6 |
20,924 |
| Umm Al Quwain Total |
375 |
3,865 |
5,588 |
4,906 |
3,640 |
2,583 |
1,828 |
1,079 |
525 |
129 |
42 |
10 |
4 |
4 |
6 |
24,584 |
| Ras al-Khaima |
Emiratis |
Males |
655 |
3,827 |
3,874 |
2,428 |
1,693 |
1,092 |
833 |
579 |
361 |
238 |
107 |
44 |
13 |
7 |
4 |
15,755 |
| Females |
17 |
520 |
1,196 |
702 |
461 |
174 |
60 |
18 |
9 |
3 |
1 |
|
|
|
|
3,161 |
| Emiratis total |
672 |
4,347 |
5,070 |
3,130 |
2,154 |
1,266 |
893 |
597 |
370 |
241 |
108 |
44 |
13 |
7 |
4 |
18,916 |
| |
Males |
507 |
7,422 |
14,136 |
14,562 |
12,092 |
8,699 |
5,797 |
3,443 |
1,528 |
377 |
93 |
25 |
3 |
7 |
4 |
68,695 |
| Non-Emiratis |
Females |
398 |
3,139 |
3,804 |
2,903 |
1,986 |
1,061 |
568 |
308 |
80 |
12 |
1 |
2 |
3 |
2 |
|
14,267 |
| |
Non-Emiratis total |
905 |
10,561 |
17,940 |
17,465 |
14,078 |
9,760 |
6,365 |
3,751 |
1,608 |
389 |
94 |
27 |
6 |
9 |
4 |
82,962 |
| Ras al-Khaima Total |
1,577 |
14,908 |
23,010 |
20,595 |
16,232 |
11,026 |
7,258 |
4,348 |
1,978 |
630 |
202 |
71 |
19 |
16 |
8 |
101,878 |
| Al Fujairah |
Emiratis |
Males |
692 |
2,940 |
2,271 |
1,026 |
836 |
531 |
426 |
274 |
183 |
97 |
37 |
17 |
6 |
1 |
0 |
9,337 |
| Females |
27 |
425 |
757 |
352 |
187 |
68 |
22 |
7 |
5 |
4 |
1 |
1 |
1 |
0 |
0 |
1,857 |
| Emiratis total |
719 |
3,365 |
3,028 |
1,378 |
1,023 |
599 |
448 |
281 |
188 |
101 |
38 |
18 |
7 |
1 |
|
11,194 |
| Non-Emiratis |
Males |
238 |
4,427 |
9,287 |
9,293 |
7,458 |
5,464 |
3,752 |
2,204 |
862 |
213 |
52 |
16 |
4 |
2 |
1 |
43,273 |
| Females |
237 |
1,740 |
2,070 |
1,589 |
977 |
632 |
340 |
164 |
51 |
16 |
3 |
4 |
0 |
0 |
0 |
7,823 |
| Non-Emiratis total |
475 |
6,167 |
11,357 |
10,882 |
8,435 |
6,096 |
4,092 |
2,368 |
913 |
229 |
55 |
20 |
4 |
2 |
1 |
51,096 |
| Al Fujairah Total |
1,194 |
9,532 |
14,385 |
12,260 |
9,458 |
6,695 |
4,540 |
2,649 |
1,101 |
330 |
93 |
38 |
11 |
3 |
1 |
62,290 |
Source: NBS, Ministry of Economy.
ANNEXED NOTE
1. Characteristics of data, definitions and population counting operations in the UAE
The first population census was conducted in 1968 by the Council of Developing Trucial States.
After Independence in 1971, a population census of the Emirate of Abu Dhabi was conducted that same year.
The first general population and establishments census in the UAE was conducted in 1975. It was the first census in the region following scientific standards and international recommendations. The other federal censuses were conducted in 1980, 1985, 1995 and 2005.
Reference days for UAE censuses: 30/12/1975; 15/12/1980, 16/12/1985, 16/12/1995; 29/10/2001; 06/12/2005.
Implementation method: the census was carried out according to de jure methodology, i.e. counting persons using their usual place of residence
Population of reference: Emirati nationals usually residing in the country+all foreign residents holding a valid residence permit+resident GCC nationals (nationals of other GCC states don’t need a permit to stay in the UAE)
Employed person: An individual, 15 years old or older, who works for a salary during the week of the time reference, either working for others or self-employed, as well as those who have a job but are not on duty during the week of the time reference (for being on vacation or are delegated for training courses or work programs by their employers and those who work for a family without wage).
2010′ federal census was eventually cancelled but the Emirates Identity Authority (EIDA), an independent federal authority established in 2004, is currently in charge of recording all UAE residents, national and expatriates in order to set up a Population Register and an ID card program. The process is stil ongoing.
2. Institution which provides data
National Bureau of Statistics (NBS)
3. Data availability
Population statistics are available on NBS’s website:
http://www.uaestatistics.gov.ae/EnglishHome/tabid/96/Default.aspx
http://www.uaestatistics.gov.ae/Home/tabid/38/Default.aspx
Data are classified by subject and statistical publications are available on PDF or Excel format. Population data disagregated by nationality (Emirati/ non-Emirati) are scarce.
2005′ census data is available at:
http://www.uaestatistics.gov.ae/EnglishHome/ReportsByDepartmentEnglish/tabid/104/Default.aspx?MenuId=1&NDId=365
The present data is taken from:
http://www.uaestatistics.gov.ae/EnglishHome/ReportDetailsEnglish/tabid/121/Default.aspx?ItemId=1869&PTID=104&MenuId=1
Date of access: January 2015.
| Emirate |
Emiratis |
Non-Emiratis |
Total |
| Males |
Females |
Total |
Males |
Females |
Total |
Males |
Females |
Total |
| Abu Dhabi |
11,685 |
261 |
11,946 |
106,099 |
3,368 |
109,467 |
117,784 |
3,629 |
121,413 |
| Dubai |
10,348 |
391 |
10,739 |
86,188 |
3,210 |
89,398 |
96,536 |
3,601 |
100,137 |
| Al Sharjah |
8,374 |
265 |
8,639 |
25,392 |
897 |
26,289 |
33,766 |
1,162 |
34,928 |
| Ajman |
1,602 |
41 |
1,643 |
4,941 |
182 |
5,123 |
6,543 |
223 |
6,766 |
| Umm Al – Quwain |
957 |
30 |
987 |
1,743 |
114 |
1,857 |
2,700 |
144 |
2,844 |
| Ras Al Khaima |
5,658 |
63 |
5,721 |
9,703 |
459 |
10,162 |
15,361 |
522 |
15,883 |
| Al Fujairah |
3,073 |
14 |
3,087 |
2,926 |
67 |
2,993 |
5,999 |
81 |
6,080 |
| Grand Total |
41,697 |
1,065 |
42,762 |
236,992 |
8,297 |
245,289 |
278,689 |
9,362 |
288,051 |
NBS, Ministry of Economy.
ANNEXED NOTE
1. Characteristics of data, definitions and population counting operations in the UAE
The first population census was conducted in 1968 by the Council of Developing Trucial States.
After Independence in 1971, a population census of the Emirate of Abu Dhabi was conducted that same year.
The first general population and establishments census in the UAE was conducted in 1975. It was the first census in the region following scientific standards and international recommendations. The other federal censuses were conducted in 1980, 1985, 1995 and 2005.
Reference days for UAE censuses: 30/12/1975; 15/12/1980, 16/12/1985, 16/12/1995; 29/10/2001; 06/12/2005.
Implementation method: the census was carried out according to de jure methodology, i.e. counting persons using their usual place of residence
Population of reference: Emirati nationals usually residing in the country+all foreign residents holding a valid residence permit+resident GCC nationals (nationals of other GCC states don’t need a permit to stay in the UAE)
2010′ federal census was eventually cancelled but the Emirates Identity Authority (EIDA), an independent federal authority established in 2004, is currently in charge of recording all UAE residents, national and expatriates in order to set up a Population Register and an ID card program. The process is stil ongoing.
2. Institution which provides data
National Bureau of Statistics (NBS)
3. Data availability
Population statistics are available on NBS’s website:
http://www.uaestatistics.gov.ae/EnglishHome/tabid/96/Default.aspx
http://www.uaestatistics.gov.ae/Home/tabid/38/Default.aspx
Data are classified by subject and statistical publications are available on PDF or Excel format. Population data disagregated by nationality (Emirati/ non-Emirati) are scarce.
2005′ census data is available at:
http://www.uaestatistics.gov.ae/EnglishHome/ReportsByDepartmentEnglish/tabid/104/Default.aspx?MenuId=1&NDId=365
The present data is taken from:
http://www.uaestatistics.gov.ae/EnglishHome/ReportDetailsEnglish/tabid/121/Default.aspx?ItemId=1869&PTID=104&MenuId=1
Date of access: November 2014.
|
Emiratis |
Non-Emiratis |
Total |
| Abu Dhabi |
75,518 |
711,220 |
786,738 |
| Dubai |
36,888 |
945,408 |
982,296 |
| Sharjah |
30,742 |
393,375 |
424,117 |
| Ajman |
8,742 |
89,235 |
97,977 |
| Umm Al Quwain |
3,660 |
20,924 |
24,584 |
| Ras AL Khaima |
18,916 |
82,962 |
101,878 |
| Al Fujairah |
11,194 |
51,096 |
62,290 |
| Total |
185,660 |
2,294,220 |
2,479,880 |
Source: NBS, Ministry of Economy.
ANNEXED NOTE
1. Characteristics of data, definitions and population counting operations in the UAE
The first population census was conducted in 1968 by the Council of Developing Trucial States.
After Independence in 1971, a population census of the Emirate of Abu Dhabi was conducted that same year.
The first general population and establishments census in the UAE was conducted in 1975. It was the first census in the region following scientific standards and international recommendations. The other federal censuses were conducted in 1980, 1985, 1995 and 2005.
Reference days for UAE censuses: 30/12/1975; 15/12/1980, 16/12/1985, 16/12/1995; 29/10/2001; 06/12/2005.
Implementation method: the census was carried out according to de jure methodology, i.e. counting persons using their usual place of residence
Population of reference: Emirati nationals usually residing in the country+all foreign residents holding a valid residence permit+resident GCC nationals (nationals of other GCC states don’t need a permit to stay in the UAE)
Employed person: An individual, 15 years old or older, who works for a salary during the week of the time reference, either working for others or self-employed, as well as those who have a job but are not on duty during the week of the time reference (for being on vacation or are delegated for training courses or work programs by their employers and those who work for a family without wage).
2010′ federal census was eventually cancelled but the Emirates Identity Authority (EIDA), an independent federal authority established in 2004, is currently in charge of recording all UAE residents, national and expatriates in order to set up a Population Register and an ID card program. The process is stil ongoing.
2. Institution which provides data
National Bureau of Statistics (NBS)
3. Data availability
Population statistics are available on NBS’s website:
http://www.uaestatistics.gov.ae/EnglishHome/tabid/96/Default.aspx
http://www.uaestatistics.gov.ae/Home/tabid/38/Default.aspx
Data are classified by subject and statistical publications are available on PDF or Excel format. Population data disagregated by nationality (Emirati/ non-Emirati) are scarce.
2005′ census data is available at:
http://www.uaestatistics.gov.ae/EnglishHome/ReportsByDepartmentEnglish/tabid/104/Default.aspx?MenuId=1&NDId=365
The present data is taken from:
http://www.uaestatistics.gov.ae/EnglishHome/ReportDetailsEnglish/tabid/121/Default.aspx?ItemId=1869&PTID=104&MenuId=1
Date of access: November 2014.
| Emirate |
Emiratis |
Non-Emiratis |
Total |
| Abu Dhabi |
11,946 |
109,467 |
121,413 |
| Dubai |
10,739 |
89,398 |
100,137 |
| Al Sharjah |
8,639 |
26,289 |
34,928 |
| Ajman |
1,643 |
5,123 |
6,766 |
| Umm Al – Quwain |
987 |
1,857 |
2,844 |
| Ras Al Khaima |
5,721 |
10,162 |
15,883 |
| Al Fujairah |
3,087 |
2,993 |
6,080 |
| Grand Total |
42,762 |
245,289 |
288,051 |
NBS, Ministry of Economy.
ANNEXED NOTE
1. Characteristics of data, definitions and population counting operations in the UAE
The first population census was conducted in 1968 by the Council of Developing Trucial States.
After Independence in 1971, a population census of the Emirate of Abu Dhabi was conducted that same year.
The first general population and establishments census in the UAE was conducted in 1975. It was the first census in the region following scientific standards and international recommendations. The other federal censuses were conducted in 1980, 1985, 1995 and 2005.
Reference days for UAE censuses: 30/12/1975; 15/12/1980, 16/12/1985, 16/12/1995; 29/10/2001; 06/12/2005.
Reference day for 2005′ census: 6 December 2005
Implementation method: the census was carried out according to de jure methodology, i.e. counting persons using their usual place of residence
Population of reference: Emirati nationals usually residing in the country+all foreign residents holding a valid residence permit+resident GCC nationals (nationals of other GCC states don’t need a permit to stay in the UAE)
2010′ federal census was eventually cancelled but the Emirates Identity Authority (EIDA), an independent federal authority established in 2004, is currently in charge of recording all UAE residents, national and expatriates in order to set up a Population Register and an ID card program. The process is stil ongoing.
2. Institution which provides data
National Bureau of Statistics (NBS)
3. Data availability
Population statistics are available on NBS’s website:
http://www.uaestatistics.gov.ae/EnglishHome/tabid/96/Default.aspx
http://www.uaestatistics.gov.ae/Home/tabid/38/Default.aspx
Data are classified by subject and statistical publications are available on PDF or Excel format. Population data disagregated by nationality (Emirati/ non-Emirati) are scarce.
2005′ census data is available at:
http://www.uaestatistics.gov.ae/EnglishHome/ReportsByDepartmentEnglish/tabid/104/Default.aspx?MenuId=1&NDId=365
The present data is taken from:
http://www.uaestatistics.gov.ae/EnglishHome/ReportDetailsEnglish/tabid/121/Default.aspx?ItemId=1869&PTID=104&MenuId=1
Date of access: November 2014.
| Type/purpose of permit |
2009 |
| Employment (without family) |
150,506 |
| Employment (with family) |
478 |
| Family Joining (family reunion) |
2,616 |
| Domestic Servant |
31,916 |
| Business |
0 |
| Total |
185,516 |
Source: Royal Oman Police
ANNEXED NOTE
1. Technical Notes and Definitions
The Directorate General of Civil Status of the Royal Oman Police is responsible for delivering residence cards (Iqama) to foreign residents in the following categories:
-employed foreign nationals,
-wife and children (below age 21) of employed foreign nationals,
-brothers and sisters of employed foreign nationals (below age 18)
-foreign wife of an Omani national
Nationals of other GCC countries are exempted from the obligation to hold a residence permit.
2. Institution which provides data
National Center for Statistics and Information (NCSI)
3. Data availability
The present data is published in 2011′ Statistical Yearbook, section “Social Services and Security”, available online on NSCI’s website. Each thematic section is presented in PDF format.
The “Social Services” section is available at:
http://www.ncsi.gov.om/NCSI_website/book/SYB2011/20-SocialServices.pdf
2011′ SYB is available at:
http://www.ncsi.gov.om/NCSI_website/book/SYB2011/index.htm
Date of access: December 2014.
| Type/ purpose of visa |
2009 |
|
Public |
Private |
Total |
| Employment visa |
10,309 |
313,066 |
323,375 |
| without family |
6,370 |
264,992 |
271,362 |
| with family |
1 |
51 |
52 |
| Family joining reunion) |
1,184 |
3,852 |
5,036 |
| Domestic servant |
2,754 |
44,171 |
46,925 |
| Visit visas |
12,142 |
80,862 |
93,004 |
| Family |
5,303 |
54,365 |
59,668 |
| Business Visa |
7 |
5,722 |
5,729 |
| Tourist |
3 |
20,747 |
20,750 |
| Government |
6,829 |
28 |
6,857 |
| Business visas |
12 |
191 |
203 |
Source: Royal Oman Police
ANNEXED NOTE
1. Technical Notes and Definitions
The Directorate General of Passports and Residence of the Royal Oman Police is responsible for issuing passports for Omanis and granting visas to foreigners wishing to enter the Sultanate. It is also involved in regulating and monitoring the entry and exit of people to and from Oman at border checkpoints.
The office also monitors the number of expatriates living in the country in accordance with policies set by the state.
Visas are granted at the request of an Omani sponsor and on his responsibility.
The employment visa is granted at the request of a local sponsor and on his responsibility to the foreigner coming to Oman for employment and whose age is not below 21.
The family joining Visa is granted to the wife of the foreigner, who is resident in Oman, and as well to his children who are below 21 years. It is also granted to the foreign wife of an Omani national at his request, and subject to a certificate from the concerned authority (Ministry of Interior) confirming the status of the marriage.
The family Visa is granted by the concerned authority at its discretion, and at the request of a local sponsor and on his responsibility, to the relatives of the Omani national and the relatives of the foreigner who are not included in the categories eligible for Family Joining Visa.
Employment visas are valid for 2 years.
Visit visas are valid for 3 months.
2. Institution which provides data
National Center for Statistics and Information (NCSI)
3. Data availability
The present data is published in 2011′ Statistical Yearbook, section “Social Services and Security”, available online on NSCI’s website. Each thematic section is presented in PDF format.
The “Social Services” section is available at:
http://www.ncsi.gov.om/NCSI_website/book/SYB2011/20-SocialServices.pdf
2011′ SYB is available at:
http://www.ncsi.gov.om/NCSI_website/book/SYB2011/index.htm
Date of access: December 2014.
| Type/purpose of permit |
2008 |
| Employment (without family) |
120,289 |
| Employment (with family) |
616 |
| Family Joining (family reunion) |
3,060 |
| Domestic Servant |
27,789 |
| Business |
0 |
| Total |
151,754 |
Source: Royal Oman Police
ANNEXED NOTE
1. Technical Notes and Definitions
The Directorate General of Civil Status of the Royal Oman Police is responsible for delivering residence cards (Iqama) to foreign residents in the following categories:
-employed foreign nationals,
-wife and children (below age 21) of employed foreign nationals,
-brothers and sisters of employed foreign nationals (below age 18)
-foreign wife of an Omani national
Nationals of other GCC countries are exempted from the obligation to hold a residence permit.
2. Institution which provides data
National Center for Statistics and Information (NCSI)
3. Data availability
The present data is published in 2009′ Statistical Yearbook, section “Social Services and Security”, available online on NSCI’s website. Each thematic section is presented in PDF format.
The “Social Services” section is available at:
http://www.ncsi.gov.om/NCSI_website/book/syb2009cd/fscommand/english/index.htm
2009′ SYB is available at:
http://www.ncsi.gov.om/NCSI_website/book/syb2009cd/fscommand/tables/Social_Services/13_14-20.pdf
Date of access: December 2014.
| Type/ purpose of visa |
2008 |
|
Public |
Private |
Total |
| Employment visa |
58,928 |
415,458 |
474,386 |
| without family |
5,961 |
316,890 |
322,851 |
| with family |
56 |
196 |
252 |
| Family joining reunion) |
7,951 |
53,412 |
61,363 |
| Domestic servant |
44,960 |
44,960 |
89,920 |
| Visit visas |
13,834 |
154,613 |
168,447 |
| Family |
4,432 |
53,694 |
58,126 |
| Business Visa |
9 |
6,697 |
6,706 |
| Tourist |
ـــ |
94,188 |
94,188 |
| Government |
9,393 |
34 |
9,427 |
| Business visas |
13 |
1,457 |
1,470 |
Source: Royal Oman Police
ANNEXED NOTE
1. Technical Notes and Definitions
The Directorate General of Passports and Residence of the Royal Oman Police is responsible for issuing passports for Omanis and granting visas to foreigners wishing to enter the Sultanate. It is also involved in regulating and monitoring the entry and exit of people to and from Oman at border checkpoints.
The office also monitors the number of expatriates living in the country in accordance with policies set by the state.
Visas are granted at the request of an Omani sponsor and on his responsibility.
The employment visa is granted at the request of a local sponsor and on his responsibility to the foreigner coming to Oman for employment and whose age is not below 21.
The family joining Visa is granted to the wife of the foreigner, who is resident in Oman, and as well to his children who are below 21 years. It is also granted to the foreign wife of an Omani national at his request, and subject to a certificate from the concerned authority (Ministry of Interior) confirming the status of the marriage.
The family Visa is granted by the concerned authority at its discretion, and at the request of a local sponsor and on his responsibility, to the relatives of the Omani national and the relatives of the foreigner who are not included in the categories eligible for Family Joining Visa.
Employment visas are valid for 2 years.
Visit visas are valid for 3 months.
2. Institution which provides data
National Center for Statistics and Information (NCSI)
3. Data availability
The present data is published in 2011′ Statistical Yearbook, section “Social Services and Security”, available online on NSCI’s website. Each thematic section is presented in PDF format.
The “Social Services” section is available at:
http://www.ncsi.gov.om/NCSI_website/book/SYB2011/20-SocialServices.pdf
2011′ SYB is available at:
http://www.ncsi.gov.om/NCSI_website/book/SYB2011/index.htm
Date of access: December 2014.
| Type/purpose of permit |
2007 |
| Employment (without family) |
90,383 |
| Employment (with family) |
613 |
| Family Joining (family reunion) |
3,078 |
| Domestic Servant |
23,119 |
| Business |
0 |
| Total |
117,193 |
Source: Royal Oman Police
ANNEXED NOTE
1. Technical Notes and Definitions
The Directorate General of Civil Status of the Royal Oman Police is responsible for delivering residence cards (Iqama) to foreign residents in the following categories:
-employed foreign nationals,
-wife and children (below age 21) of employed foreign nationals,
-brothers and sisters of employed foreign nationals (below age 18)
-foreign wife of an Omani national
Nationals of other GCC countries are exempted from the obligation to hold a residence permit.
2. Institution which provides data
National Center for Statistics and Information (NCSI)
3. Data availability
The present data is published in 2009′ Statistical Yearbook, section “Social Services and Security”, available online on NSCI’s website. Each thematic section is presented in PDF format.
The “Social Services” section is available at:
http://www.ncsi.gov.om/NCSI_website/book/syb2009cd/fscommand/english/index.htm
2009′ SYB is available at:
http://www.ncsi.gov.om/NCSI_website/book/syb2009cd/fscommand/tables/Social_Services/13_14-20.pdf
Date of access: December 2014.
| Type/ purpose of visa |
2007 |
|
Public |
Private |
Total |
| Employment visa |
15,834 |
363,508 |
379,342 |
| without family |
6,611 |
280,488 |
287,099 |
| with family |
86 |
243 |
329 |
| Family joining reunion) |
6,717 |
45,036 |
51,753 |
| Domestic servant |
2,420 |
37,741 |
40,161 |
| Visit visas |
11,840 |
68,566 |
80,406 |
| Family |
4,265 |
43,557 |
47,822 |
| Business Visa |
3 |
10,458 |
10,461 |
| Tourist |
ـــ |
14,426 |
14,426 |
| Government |
7,572 |
125 |
7,697 |
| Business visas |
18 |
421 |
439 |
Source: Royal Oman Police
ANNEXED NOTE
1. Technical Notes and Definitions
The Directorate General of Passports and Residence of the Royal Oman Police is responsible for issuing passports for Omanis and granting visas to foreigners wishing to enter the Sultanate. It is also involved in regulating and monitoring the entry and exit of people to and from Oman at border checkpoints.
The office also monitors the number of expatriates living in the country in accordance with policies set by the state.
Visas are granted at the request of an Omani sponsor and on his responsibility.
The employment visa is granted at the request of a local sponsor and on his responsibility to the foreigner coming to Oman for employment and whose age is not below 21.
The family joining Visa is granted to the wife of the foreigner, who is resident in Oman, and as well to his children who are below 21 years. It is also granted to the foreign wife of an Omani national at his request, and subject to a certificate from the concerned authority (Ministry of Interior) confirming the status of the marriage.
The family Visa is granted by the concerned authority at its discretion, and at the request of a local sponsor and on his responsibility, to the relatives of the Omani national and the relatives of the foreigner who are not included in the categories eligible for Family Joining Visa.
Employment visas are valid for 2 years.
Visit visas are valid for 3 months.
2. Institution which provides data
National Center for Statistics and Information (NCSI)
3. Data availability
The present data is published in 2009′ Statistical Yearbook, section “Social Services and Security”, available online on NSCI’s website. Each thematic section is presented in PDF format.
The “Social Services” section is available at:
http://www.ncsi.gov.om/NCSI_website/book/syb2009cd/fscommand/english/index.htm
2009′ SYB is available at:
http://www.ncsi.gov.om/NCSI_website/book/syb2009cd/fscommand/tables/Social_Services/13_14-20.pdf
Date of access: December 2014.
| Type/purpose of permit |
2010 |
| Employment (without family) |
222,506 |
| Employment (with family) |
477 |
| Family Joining (family reunion) |
2,678 |
| Domestic Servant |
37,584 |
| Business |
0 |
| Total |
263,245 |
Source: Royal Oman Police
ANNEXED NOTE
1. Technical Notes and Definitions
The Directorate General of Civil Status of the Royal Oman Police is responsible for delivering residence cards (Iqama) to foreign residents in the following categories:
-employed foreign nationals,
-wife and children (below age 21) of employed foreign nationals,
-brothers and sisters of employed foreign nationals (below age 18)
-foreign wife of an Omani national
Nationals of other GCC countries are exempted from the obligation to hold a residence permit.
2. Institution which provides data
National Center for Statistics and Information (NCSI)
3. Data availability
The present data is published in 2011′ Statistical Yearbook, section “Social Services and Security”, available online on NSCI’s website. Each thematic section is presented in PDF format.
The “Social Services” section is available at:
http://www.ncsi.gov.om/NCSI_website/book/SYB2011/20-SocialServices.pdf
2011′ SYB is available at:
http://www.ncsi.gov.om/NCSI_website/book/SYB2011/index.htm
Date of access: December 2014.
| Type/purpose of permit |
2011 |
| Employment |
200,896 |
| Family Joining (family reunion) |
2,165 |
| Domestic Servant |
41,705 |
| Business |
0 |
| Total |
244,766 |
Source: Royal Oman Police
ANNEXED NOTE
1. Technical Notes and Definitions
The Directorate General of Civil Status of the Royal Oman Police is responsible for delivering residence cards (Iqama) to foreign residents in the following categories:
-employed foreign nationals,
-wife and children (below age 21) of employed foreign nationals,
-brothers and sisters of employed foreign nationals (below age 18)
-foreign wife of an Omani national
Nationals of other GCC countries are exempted from the obligation to hold a residence permit.
2. Institution which provides data
National Center for Statistics and Information (NCSI)
3. Data availability
The present data is published in 2013′ Statistical Yearbook, section “Social Services and Security”, available online on NSCI’s website. Each thematic section is presented in PDF format.
The “Social Services” section is available at:
http://www.ncsi.gov.om/NCSI_website/book/SYB2013/20-SocialServices.pdf
2013′ SYB is available at:
http://www.ncsi.gov.om/NCSI_website/book/SYB2013/index.htm
Date of access: December 2014.
| Type/purpose of permit |
2012 |
| Employment |
229,765 |
| Family Joining (family reunion) |
2,308 |
| Domestic Servant |
50,167 |
| Business |
0 |
| Total |
282,240 |
Source: Royal Oman Police
ANNEXED NOTE
1. Technical Notes and Definitions
The Directorate General of Civil Status of the Royal Oman Police is responsible for delivering residence cards (Iqama) to foreign residents in the following categories:
-employed foreign nationals,
-wife and children (below age 21) of employed foreign nationals,
-brothers and sisters of employed foreign nationals (below age 18)
-foreign wife of an Omani national
Nationals of other GCC countries are exempted from the obligation to hold a residence permit.
2. Institution which provides data
National Center for Statistics and Information (NCSI)
3. Data availability
The present data is published in 2013′ Statistical Yearbook, section “Social Services and Security”, available online on NSCI’s website. Each thematic section is presented in PDF format.
The “Social Services” section is available at:
http://www.ncsi.gov.om/NCSI_website/book/SYB2013/20-SocialServices.pdf
2013′ SYB is available at:
http://www.ncsi.gov.om/NCSI_website/book/SYB2013/index.htm
Date of access: December 2014.
| Type/purpose of permit |
2013 |
| Employment |
234,635 |
| Family Joining (family reunion) |
1,789 |
| Domestic Servant |
58,188 |
| Business |
0 |
| Total |
294,612 |
Source: Royal Oman Police
ANNEXED NOTE
1. Technical Notes and Definitions
The Directorate General of Civil Status of the Royal Oman Police is responsible for delivering residence cards (Iqama) to foreign residents in the following categories:
-employed foreign nationals,
-wife and children (below age 21) of employed foreign nationals,
-brothers and sisters of employed foreign nationals (below age 18)
-foreign wife of an Omani national
Nationals of other GCC countries are exempted from the obligation to hold a residence permit.
2. Institution which provides data
National Center for Statistics and Information (NCSI)
3. Data availability
The present data is published in 2014′ Statistical Yearbook, section “Social Services and Security”, available online on NSCI’s website. Each thematic section is presented in PDF format.
The “Social Services” section is available at:
http://www.ncsi.gov.om/NCSI_website/book/SYB2014/20-Social.pdf
2014′ SYB is available at:
http://www.ncsi.gov.om/NCSI_website/book/SYB2014/index.htm
Date of access: December 2014.
| Type/ purpose of visa |
2010 |
|
Public |
Private |
Total |
| Employment visa |
17,801 |
469,777 |
487,578 |
| without family |
6,950 |
369,015 |
375,965 |
| with family |
ـــ |
6 |
6 |
| Family joining reunion) |
7,985 |
50,884 |
58,869 |
| Domestic servant |
2,866 |
49,872 |
52,738 |
| Visit visas |
18,071 |
77,899 |
95,970 |
| Family |
4,800 |
60,759 |
65,559 |
| Business Visa |
45 |
7,677 |
7,722 |
| Tourist |
6 |
9,438 |
9,444 |
| Government |
13,220 |
25 |
13,245 |
| Business visas |
25 |
147 |
172 |
Source: Royal Oman Police
ANNEXED NOTE
1. Technical Notes and Definitions
The Directorate General of Passports and Residence of the Royal Oman Police is responsible for issuing passports for Omanis and granting visas to foreigners wishing to enter the Sultanate. It is also involved in regulating and monitoring the entry and exit of people to and from Oman at border checkpoints.
The office also monitors the number of expatriates living in the country in accordance with policies set by the state.
Visas are granted at the request of an Omani sponsor and on his responsibility.
The employment visa is granted at the request of a local sponsor and on his responsibility to the foreigner coming to Oman for employment and whose age is not below 21.
The family joining Visa is granted to the wife of the foreigner, who is resident in Oman, and as well to his children who are below 21 years. It is also granted to the foreign wife of an Omani national at his request, and subject to a certificate from the concerned authority (Ministry of Interior) confirming the status of the marriage.
The family Visa is granted by the concerned authority at its discretion, and at the request of a local sponsor and on his responsibility, to the relatives of the Omani national and the relatives of the foreigner who are not included in the categories eligible for Family Joining Visa.
2. Institution which provides data
National Center for Statistics and Information (NCSI)
3. Data availability
The present data is published in 2011′ Statistical Yearbook, section “Social Services and Security”, available online on NSCI’s website. Each thematic section is presented in PDF format.
The “Social Services” section is available at:
http://www.ncsi.gov.om/NCSI_website/book/SYB2011/20-SocialServices.pdf
2011′ SYB is available at:
http://www.ncsi.gov.om/NCSI_website/book/SYB2011/index.htm
Date of access: December 2014.
| Type/ purpose of visa |
2011 |
|
Public |
Private |
Total |
| Residence Visas |
17,975 |
596,539 |
614,514 |
| Employment |
7,453 |
466,384 |
473,837 |
| Family joining (family reunion) |
6,894 |
50,621 |
57,515 |
| Domestic servant |
2,932 |
69,178 |
72,110 |
| Short work |
24 |
6,183 |
6,207 |
| Family |
672 |
4,173 |
4,845 |
| Visit Visas |
19,201 |
192,942 |
212,143 |
| Family |
6,499 |
74,413 |
80,912 |
| Tourist |
3 |
11,146 |
11,149 |
| Official |
11,651 |
8 |
11,659 |
| Band |
15 |
2,630 |
2,645 |
| Sea crew |
52 |
7,206 |
7,258 |
| Express |
762 |
79,944 |
80,706 |
| Others(1) |
219 |
17,595 |
17,814 |
| Business visas(2) |
5 |
26 |
31 |
Source: Royal Oman Police
1- Includes Road Transit Visa, Festivals Visa and Employment Contracting Visa
2- the Business Visa was cancelled in 2012 and merged with Express Visa
ANNEXED NOTE
1. Technical Notes and Definitions
The Directorate General of Passports and Residence of the Royal Oman Police is responsible for issuing passports for Omanis and granting visas to foreigners wishing to enter the Sultanate. It is also involved in regulating and monitoring the entry and exit of people to and from Oman at border checkpoints.
The office also monitors the number of expatriates living in the country in accordance with policies set by the state.
Visas are granted at the request of an Omani sponsor and on his responsibility.
The employment visa is granted at the request of a local sponsor and on his responsibility to the foreigner coming to Oman for employment and whose age is not below 21.
The family joining Visa is granted to the wife of the foreigner, who is resident in Oman, and as well to his children who are below 21 years. It is also granted to the foreign wife of an Omani national at his request, and subject to a certificate from the concerned authority (Ministry of Interior) confirming the status of the marriage.
The family Visa is granted by the concerned authority at its discretion, and at the request of a local sponsor and on his responsibility, to the relatives of the Omani national and the relatives of the foreigner who are not included in the categories eligible for Family Joining Visa.
2. Institution which provides data
National Center for Statistics and Information (NCSI)
3. Data availability
The present data is published in 2014′ Statistical Yearbook, section “Social Services and Security”, available online on NSCI’s website. Each thematic section is presented in PDF format.
The “Social Services” section is available at:
http://www.ncsi.gov.om/NCSI_website/book/SYB2014/20-Social.pdf
2014′ SYB is available at:
http://www.ncsi.gov.om/NCSI_website/book/SYB2014/index.htm
Date of access: December 2014.
| Type/ purpose of visa |
2012 |
| Public |
Private |
Total |
| Residence Visas |
20,366 |
675,664 |
696,03 |
| Employment |
8,956 |
524,673 |
533,629 |
| Family joining (family reunion) |
7,508 |
54,143 |
61,651 |
| Domestic servant |
3,218 |
83,544 |
86,762 |
| Short work |
11 |
8,361 |
8,372 |
| Family |
673 |
4,943 |
5,616 |
| Visit Visas |
22,703 |
223,412 |
246,115 |
| Family |
7,03 |
88,784 |
95,814 |
| Tourist |
0 |
19,028 |
19,028 |
| Official |
14,163 |
0 |
14,163 |
| Band |
2 |
3,028 |
3,030 |
| Sea crew |
0 |
7,662 |
7,662 |
| Express(1) |
1,227 |
85,680 |
86,907 |
| Others(2) |
281 |
19,230 |
19,511 |
Source: Royal Oman Police
1- Includes business visas
2- Includes Road Transit Visa, Festivals Visa and Employment Contracting Visa
ANNEXED NOTE
1. Technical Notes and Definitions
The Directorate General of Passports and Residence of the Royal Oman Police is responsible for issuing passports for Omanis and granting visas to foreigners wishing to enter the Sultanate. It is also involved in regulating and monitoring the entry and exit of people to and from Oman at border checkpoints.
The office also monitors the number of expatriates living in the country in accordance with policies set by the state.
Visas are granted at the request of an Omani sponsor and on his responsibility.
The employment visa is granted at the request of a local sponsor and on his responsibility to the foreigner coming to Oman for employment and whose age is not below 21.
The family joining Visa is granted to the wife of the foreigner, who is resident in Oman, and as well to his children who are below 21 years. It is also granted to the foreign wife of an Omani national at his request, and subject to a certificate from the concerned authority (Ministry of Interior) confirming the status of the marriage.
The family Visa is granted by the concerned authority at its discretion, and at the request of a local sponsor and on his responsibility, to the relatives of the Omani national and the relatives of the foreigner who are not included in the categories eligible for Family Joining Visa.
2. Institution which provides data
National Center for Statistics and Information (NCSI)
3. Data availability
The present data is published in 2014′ Statistical Yearbook, section “Social Services and Security”, available online on NSCI’s website. Each thematic section is presented in PDF format.
The “Social Services” section is available at:
http://www.ncsi.gov.om/NCSI_website/book/SYB2014/20-Social.pdf
2014′ SYB is available at:
http://www.ncsi.gov.om/NCSI_website/book/SYB2014/index.htm
Date of access: December 2014.
| Type/ purpose of visa |
2013 |
2012 |
2011 |
| Public |
Private |
Total |
Public |
Private |
Total |
Public |
Private |
Total |
| Residence Visas |
24,566 |
553,647 |
578,213 |
20,366 |
675,664 |
696,03 |
17,975 |
596,539 |
614,514 |
| Employment |
12,577 |
402,328 |
414,905 |
8,956 |
524,673 |
533,629 |
7,453 |
466,384 |
473,837 |
| Family joining (family reunion) |
7,947 |
48,793 |
56,740 |
7,508 |
54,143 |
61,651 |
6,894 |
50,621 |
57,515 |
| Domestic servant |
3,406 |
88,033 |
91,439 |
3,218 |
83,544 |
86,762 |
2,932 |
69,178 |
72,110 |
| Short work |
8 |
10,675 |
10,683 |
11 |
8,361 |
8,372 |
24 |
6,183 |
6,207 |
| Family |
628 |
3,818 |
4,446 |
673 |
4,943 |
5,616 |
672 |
4,173 |
4,845 |
| Visit Visas |
24,443 |
231,786 |
256,229 |
22,703 |
223,412 |
246,115 |
19,201 |
192,942 |
212,143 |
| Family |
8,161 |
95,073 |
103,234 |
7,03 |
88,784 |
95,814 |
6,499 |
74,413 |
80,912 |
| Tourist |
3 |
21,501 |
21,504 |
0 |
19,028 |
19,028 |
3 |
11,146 |
11,149 |
| Official |
15,062 |
0 |
15,062 |
14,163 |
0 |
14,163 |
11,651 |
8 |
11,659 |
| Band |
0 |
1,308 |
1,308 |
2 |
3,028 |
3,030 |
15 |
2,630 |
2,645 |
| Sea crew |
1 |
8,472 |
8,473 |
0 |
7,662 |
7,662 |
52 |
7,206 |
7,258 |
| Express(1) |
1,209 |
86,703 |
87,912 |
1,227 |
85,680 |
86,907 |
762 |
79,944 |
80,706 |
| Others(2) |
7 |
18,729 |
18,736 |
281 |
19,230 |
19,511 |
219 |
17,595 |
17,814 |
Source: Royal Oman Police
1- Includes business visas
2- Includes Road Transit Visa, Festivals Visa and Employment Contracting Visa
ANNEXED NOTE
1. Technical Notes and Definitions
The Directorate General of Passports and Residence of the Royal Oman Police is responsible for issuing passports for Omanis and granting visas to foreigners wishing to enter the Sultanate. It is also involved in regulating and monitoring the entry and exit of people to and from Oman at border checkpoints.
The office also monitors the number of expatriates living in the country in accordance with policies set by the state.
Visas are granted at the request of an Omani sponsor and on his responsibility.
The employment visa is granted at the request of a local sponsor and on his responsibility to the foreigner coming to Oman for employment and whose age is not below 21.
The family joining Visa is granted to the wife of the foreigner, who is resident in Oman, and as well to his children who are below 21 years. It is also granted to the foreign wife of an Omani national at his request, and subject to a certificate from the concerned authority (Ministry of Interior) confirming the status of the marriage.
The family Visa is granted by the concerned authority at its discretion, and at the request of a local sponsor and on his responsibility, to the relatives of the Omani national and the relatives of the foreigner who are not included in the categories eligible for Family Joining Visa.
2. Institution which provides data
National Center for Statistics and Information (NCSI)
3. Data availability
The present data is published in 2014′ Statistical Yearbook, section “Social Services and Security”, available online on NSCI’s website. Each thematic section is presented in PDF format.
The “Social Services” section is available at:
http://www.ncsi.gov.om/NCSI_website/book/SYB2014/20-Social.pdf
2014′ SYB is available at:
http://www.ncsi.gov.om/NCSI_website/book/SYB2014/index.htm
Date of access: December 2014.
| |
2013 |
| Category of issuance of permit |
First Time |
Renewal |
Transfer of Sponsorship |
| Type/purpose of permit |
| Employment |
330,002 |
361,203 |
399 |
| Family Joining (family reunion) |
2,314 |
86,151 |
28 |
| Domestic Servant |
57,090 |
17,603 |
124 |
| Business |
408 |
1,937 |
0 |
| Total |
389,814 |
466,894 |
551 |
Source: Royal Oman Police
ANNEXED NOTE
1. Technical Notes and Definitions
The Directorate General of Civil Status of the Royal Oman Police is responsible for delivering residence cards (Iqama) to foreign residents in the following categories:
-employed foreign nationals,
-wife and children (below age 21) of employed foreign nationals,
-brothers and sisters of employed foreign nationals (below age 18)
-foreign wife of an Omani national
Nationals of other GCC countries are exempted from the obligation to hold a residence permit.
2. Institution which provides data
National Center for Statistics and Information (NCSI)
3. Data availability
The present data is published in 2014′ Statistical Yearbook, section “Social Services and Security”, available online on NSCI’s website. Each thematic section is presented in PDF format.
The “Social Services” section is available at:
http://www.ncsi.gov.om/NCSI_website/book/SYB2014/20-Social.pdf
2014′ SYB is available at:
http://www.ncsi.gov.om/NCSI_website/book/SYB2014/index.htm
Date of access: December 2014.
| Type/purpose of permit |
2007 |
2008 |
2009 |
2010 |
2011 |
2012 |
2013 |
| Employment |
399,070 |
490,883 |
495,649 |
625,495 |
621,907 |
764,872 |
691,604 |
| Family Joining (family reunion) |
97,485 |
113,005 |
16,696 |
84,542 |
74,606 |
78,178 |
88,493 |
| Domestic Servant |
43,968 |
54,962 |
56,466 |
62,360 |
66,196 |
73,537 |
74,817 |
| Business |
1,049 |
1,785 |
2,210 |
3,556 |
2,071 |
2,727 |
2,345 |
| Total |
541,572 |
660,635 |
571,021 |
775,953 |
764,780 |
919,314 |
857,259 |
Source: Royal Oman Police
ANNEXED NOTE
1. Technical Notes and Definitions
The present data is the sum of the figures of residency permits delivered each given year under the following categories: “First issuance”, “Renewal” and “Transfer of sponsorship”, as published in NCSI’s Statistical Yearbooks in section “Social Services and Security”.
The Directorate General of Civil Status of the Royal Oman Police is responsible for delivering residence cards (Iqama) to foreign residents in the following categories:
-employed foreign nationals,
-wife and children (below age 21) of employed foreign nationals,
-brothers and sisters of employed foreign nationals (below age 18)
-foreign wife of an Omani national
Nationals of other GCC countries are exempted from the obligation to hold a residence permit.
Employment and family reunion residency permits are valid for 2 years.
2. Institution which provides data
National Center for Statistics and Information (NCSI)
3. Data availability
The present data is taken from 2009 to 2014 Statistical Yearbooks, section “Social Services and Security”, available online on NSCI’s website. Each thematic section is presented in PDF format.
2009′ to 2014′ SYB are available at:
http://www.ncsi.gov.om/NCSI_website/N_ListPublications.aspx?view=21
Date of access: December 2014.
| |
2011 |
| Category of issuance of permit |
First Time |
Renewal |
Transfer of Sponsorship |
| Type/purpose of permit |
| Employment (without family) |
347,195 |
266,198 |
8,514 |
| Family Joining (family reunion) |
2,269 |
71,899 |
438 |
| Domestic Servant |
49,101 |
14,209 |
2,886 |
| Business |
672 |
1,399 |
0 |
| Total |
399,237 |
353,705 |
11,838 |
Source: Royal Oman Police
ANNEXED NOTE
1. Technical Notes and Definitions
The Directorate General of Civil Status of the Royal Oman Police is responsible for delivering residence cards (Iqama) to foreign residents in the following categories:
-employed foreign nationals,
-wife and children (below age 21) of employed foreign nationals,
-brothers and sisters of employed foreign nationals (below age 18)
-foreign wife of an Omani national
Nationals of other GCC countries are exempted from the obligation to hold a residence permit.
Employment and family reunion residency permits are valid for 2 years.
2. Institution which provides data
National Center for Statistics and Information (NCSI)
3. Data availability
The present data is published in 2013′ Statistical Yearbook, section “Social Services and Security”, available online on NSCI’s website. Each thematic section is presented in PDF format.
The “Social Services” section is available at:
http://www.ncsi.gov.om/NCSI_website/book/SYB2013/20-SocialServices.pdf
2013′ SYB is available at:
http://www.ncsi.gov.om/NCSI_website/book/SYB2013/index.htm
Date of access: December 2014.
| |
2012 |
| Category of issuance of permit |
First Time |
Renewal |
Transfer of Sponsorship |
| Type/purpose of permit |
| Employment (without family) |
417,334 |
344,583 |
2,955 |
| Family Joining (family reunion) |
2,712 |
75,311 |
155 |
| Domestic Servant |
57,337 |
15,079 |
1,121 |
| Business |
662 |
2,065 |
0 |
| Total |
478,045 |
437,038 |
4,231 |
Source: Royal Oman Police
ANNEXED NOTE
1. Technical Notes and Definitions
The Directorate General of Civil Status of the Royal Oman Police is responsible for delivering residence cards (Iqama) to foreign residents in the following categories:
-employed foreign nationals,
-wife and children (below age 21) of employed foreign nationals,
-brothers and sisters of employed foreign nationals (below age 18)
-foreign wife of an Omani national
Nationals of other GCC countries are exempted from the obligation to hold a residence permit.
2. Institution which provides data
National Center for Statistics and Information (NCSI)
3. Data availability
The present data is published in 2013′ Statistical Yearbook, section “Social Services and Security”, available online on NSCI’s website. Each thematic section is presented in PDF format.
The “Social Services” section is available at:
http://www.ncsi.gov.om/NCSI_website/book/SYB2013/20-SocialServices.pdf
2013′ SYB is available at:
http://www.ncsi.gov.om/NCSI_website/book/SYB2013/index.htm
Date of access: December 2014.
| |
2010 |
| Category of issuance of permit |
First Time |
Renewal |
Transfer of Sponsorship |
| Type/purpose of permit |
| Employment (without family) |
250,055 |
336,321 |
37,433 |
| Employment (with family) |
0 |
1,683 |
3 |
| Family Joining (family reunion) |
1,910 |
81,970 |
662 |
| Domestic Servant |
35,628 |
22,602 |
4,130 |
| Business |
608 |
2,948 |
0 |
| Total |
288,201 |
445,524 |
42,228 |
Source: Royal Oman Police
ANNEXED NOTE
1. Technical Notes and Definitions
The Directorate General of Civil Status of the Royal Oman Police is responsible for delivering residence cards (Iqama) to foreign residents in the following categories:
-employed foreign nationals,
-wife and children (below age 21) of employed foreign nationals,
-brothers and sisters of employed foreign nationals (below age 18)
-foreign wife of an Omani national
Nationals of other GCC countries are exempted from the obligation to hold a residence permit.
Employment and family reunion residency permits are valid for 2 years.
2. Institution which provides data
National Center for Statistics and Information (NCSI)
3. Data availability
The present data is published in 2011′ Statistical Yearbook, section “Social Services and Security”, available online on NSCI’s website. Each thematic section is presented in PDF format.
The “Social Services” section is available at:
http://www.ncsi.gov.om/NCSI_website/book/SYB2011/20-SocialServices.pdf
2011′ SYB is available at:
http://www.ncsi.gov.om/NCSI_website/book/SYB2011/index.htm
Date of access: December 2014.
|
2009 |
| Category of issuance of permit |
First Time |
Renewal |
Transfer of Sponsorship |
| Type/purpose of permit |
| Employment (without family) |
211,142 |
272,668 |
10,256 |
| Employment (with family) |
29 |
1,545 |
9 |
| Family Joining (family reunion) |
2,619 |
13,529 |
548 |
| Domestic Servant |
32,652 |
20,564 |
3,250 |
| Business |
479 |
1,731 |
0 |
| Total |
246,921 |
310,037 |
14,063 |
Source: Royal Oman Police
ANNEXED NOTE
1. Technical Notes and Definitions
The Directorate General of Civil Status of the Royal Oman Police is responsible for delivering residence cards (Iqama) to foreign residents in the following categories:
-employed foreign nationals,
-wife and children (below age 21) of employed foreign nationals,
-brothers and sisters of employed foreign nationals (below age 18)
-foreign wife of an Omani national
Nationals of other GCC countries are exempted from the obligation to hold a residence permit.
Employment and family reunion residency permits are valid for 2 years.
2. Institution which provides data
National Center for Statistics and Information (NCSI)
3. Data availability
The present data is published in 2011′ Statistical Yearbook, section “Social Services and Security”, available online on NSCI’s website. Each thematic section is presented in PDF format.
The “Social Services” section is available at:
http://www.ncsi.gov.om/NCSI_website/book/SYB2011/20-SocialServices.pdf
2011′ SYB is available at:
http://www.ncsi.gov.om/NCSI_website/book/SYB2011/index.htm
Date of access: December 2014.
|
2008 |
| Category of issuance of permit |
First Time |
Renewal |
Transfer of Sponsorship |
| Type/purpose of permit |
| Employment (without family) |
247,449 |
228,688 |
12,235 |
| Employment (with family) |
169 |
2,269 |
73 |
| Family Joining (family reunion) |
39,819 |
72,568 |
618 |
| Domestic Servant |
32,472 |
19,536 |
2,954 |
| Business |
267 |
1,518 |
0 |
| Total |
320,176 |
324,579 |
15,880 |
Source: Royal Oman Police
ANNEXED NOTE
1. Technical Notes and Definitions
The Directorate General of Civil Status of the Royal Oman Police is responsible for delivering residence cards (Iqama) to foreign residents in the following categories:
-employed foreign nationals,
-wife and children (below age 21) of employed foreign nationals,
-brothers and sisters of employed foreign nationals (below age 18)
-foreign wife of an Omani national
Nationals of other GCC countries are exempted from the obligation to hold a residence permit.
Employment and family reunion residency permits are valid for 2 years.
2. Institution which provides data
National Center for Statistics and Information (NCSI)
3. Data availability
The present data is published in 2009′ Statistical Yearbook, section “Social Services and Security”, available online on NSCI’s website. Each thematic section is presented in PDF format.
The “Social Services” section is available at:
http://www.ncsi.gov.om/NCSI_website/book/syb2009cd/fscommand/english/index.htm
2009′ SYB is available at:
http://www.ncsi.gov.om/NCSI_website/book/syb2009cd/fscommand/tables/Social_Services/13_14-20.pdf
Date of access: December 2014.
|
2007 |
| Category of issuance of permit |
First Time |
Renewal |
Transfer of Sponsorship |
| Type/purpose of permit |
| Employment (without family) |
205,413 |
181,522 |
9,940 |
| Employment (with family) |
212 |
1,875 |
108 |
| Family Joining (family reunion) |
36,103 |
61,100 |
282 |
| Domestic Servant |
25,839 |
15,652 |
2,477 |
| Business |
110 |
939 |
0 |
| Total |
267,677 |
261,088 |
12,807 |
Source: Royal Oman Police
ANNEXED NOTE
1. Technical Notes and Definitions
The Directorate General of Civil Status of the Royal Oman Police is responsible for delivering residence cards (Iqama) to foreign residents in the following categories:
-employed foreign nationals,
-wife and children (below age 21) of employed foreign nationals,
-brothers and sisters of employed foreign nationals (below age 18)
-foreign wife of an Omani national
Nationals of other GCC countries are exempted from the obligation to hold a residence permit.
Employment and family reunion residency permits are valid for 2 years.
2. Institution which provides data
National Center for Statistics and Information (NCSI)
3. Data availability
The present data is published in 2009′ Statistical Yearbook, section “Social Services and Security”, available online on NSCI’s website. Each thematic section is presented in PDF format.
The “Social Services” section is available at:
http://www.ncsi.gov.om/NCSI_website/book/syb2009cd/fscommand/english/index.htm
2009′ SYB is available at:
http://www.ncsi.gov.om/NCSI_website/book/syb2009cd/fscommand/tables/Social_Services/13_14-20.pdf
Date of access: December 2014.
|
Changes of sponsorship |
| 2009 |
57,168 |
| 2010 |
72,328 |
| 2011 |
197,115 |
| 2012 |
402,895 |
| 2013 |
2,952,572 |
Source: Ministry of Labour
1. Definition
All foreign residents in Saudi Arabia are under the responsibility of a local “sponsor”, usually the employer. Only certain categories of investors are spared the obligation.
The Saudi Labour Law has provisions allowing the worker to change sponsor. However, the procedure was conditionned to obtaining a Non-Objection Certificate from the first sponsor.
Since the onset of the Nitaqat (“ranges”, “zones”) campaign of Saudisation of the work force in September 2011, which classifies private sector companies by “range” based on the
Saudisation performance, changes of sponsor have been made easier for the workers in companies displaying the poorest rates of Saudisation (classified in “red” and “yellow” categories).
Workers in these categories can now freely join sponsors whose companies are in highest saudisation performance’ categories (“Green” and “Premium” or “Excellent”), without NOC from previous sponsor.
Since September 2014, the obligation for a worker to stay a minimum of two years with a sponsor before applying for sponsorship’ change was repealed.
2013′ figure is notably higher than previous ones as a result of the “correction campaign” or amnesty period run by the government from April 3 to November 3, 2013.
Ahead of a crackdown on irregular workers/ sojourners planned for November 4, 2013, the amnesty was meant to allow workers to sort out their administrative situation:
renew expired documents; register their current employer as their sponsor; register changes in profession and in activity sector, etc., or leave without paying a penalty.
2. Institution which provides data
Ministry of Labour
3. Data availability
The figures are published in the Ministry of Labour’s 2013 Statistical Yearbook (in Arabic).
http://portal.mol.gov.sa/ar/Statistics/Documents/%D8%A7%D9%84%D9%83%D8%AA%D8%A7%D8%A8%20%D8%A7%D9%84%D8%A7%D8%AD%D8%B5%D8%A7%D8%A6%D9%8A%202013.pdf
Last date of access: 15 December 2014.
| Occupation group |
Transfers of services |
| Managers and Business Managers |
12,852 |
| Specialists in Scientific, Technical and Humanities Fields |
229,670 |
| Technicians in Scientific, Technical and Humanities Fields |
196,373 |
| Clerical Workers |
18,637 |
| Sales Persons |
200,515 |
| Service Persons |
882,600 |
| Agriculture, Animal Husbandry and Fishing |
89,664 |
| Industrial, Chemical and Food Industries |
88,139 |
| Engineering Support |
1,231,094 |
| TOTAL |
2,952,572 |
Source: Ministry of Labour
1. Definition
The Saudi Labour Law has provisions allowing the worker to change sponsor. However, the procedure was conditionned to obtaining a Non-Objection Certificate from the first sponsor.
Since the onset of the Nitaqat (“ranges”, “zones”) campaign of Saudisation of the work force in September 2011, which classifies private sector companies by “range” based on the
Saudisation performance, changes of sponsor have been made easier for the workers in companies displaying the poorest rates of Saudisation (classified in “red” and “yellow” categories).
Workers in these categories can now freely join sponsors whose companies are in highest saudisation performance’ categories (“Green” and “Premium” or “Excellent”), without NOC from previous sponsor.
Since September 2014, the obligation for a worker to stay a minimum of two years with a sponsor before applying for sponsorship’ change was repealed.
2013′ figure is notably higher than previous ones as a result of the “correction campaign” or amnesty period run by the government from April 3 to November 3, 2013.
Ahead of a crackdown on irregular workers/ sojourners planned for November 4, 2013, the amnesty was meant to allow workers to sort out their administrative situation:
renew expired documents; register their current employer as their sponsor; register changes in profession and in activity sector, etc., or leave without paying a penalty.
2. Institution which provides data
Ministry of Labour
3. Data availability
The figures are published in the Ministry of Labour’s 2013 Statistical Yearbook (in Arabic).
http://portal.mol.gov.sa/ar/Statistics/Documents/%D8%A7%D9%84%D9%83%D8%AA%D8%A7%D8%A8%20%D8%A7%D9%84%D8%A7%D8%AD%D8%B5%D8%A7%D8%A6%D9%8A%202013.pdf
Last date of access: 15 December 2014.
|
Changes of profession |
| 2009 |
21,892 |
| 2010 |
16,238 |
| 2011 |
59,514 |
| 2012 |
358,004 |
| 2013 |
2,676,752 |
Source: Ministry of Labour
1. Definition
To the exception of certain categories of investors, all foreign residents in Saudi Arabia are under the responsibility of a local “sponsor”, usually the employer.
The sponsor receives the agreement to bring a foreign employee upon certification that he / she will employ the labourer in a specific profession. The “Iqama” (residency card”) mentions the profession of the worker, which also conditions certain rights (family reunion for instance).
The Saudi Labour Law has provisions allowing the worker to change profession/ sponsor. However, the procedure was conditionned to obtaining a Non-Objection Certificate from the first sponsor.
Since the onset of the Nitaqat (“ranges”, “zones”) campaign of Saudisation of the work force in September 2011, which classifies private sector companies by “range” based on the
Saudisation performance, changes of profession/ sponsor have been made easier for the workers in companies displaying the highest saudisation performance’ categories (“Green” and “Premium” or “Excellent”).
Those in companies with poorest rates of Saudisation (classified in “red” and “yellow” categories) cannot change profession.
2013′ figure is notably higher than previous ones as a result of the “correction campaign” or amnesty period run by the government from April 3 to November 3, 2013.
Ahead of a crackdown on irregular workers/ sojourners planned for November 4, 2013, the amnesty was meant to allow workers to sort out their administrative situation:
renew expired documents; register their current employer as their sponsor; register changes in profession and in activity sector, etc., or leave without paying a penalty.
2. Institution which provides data
Ministry of Labour
3. Data availability
The figures are published in the Ministry of Labour’s 2013 Statistical Yearbook (in Arabic).
http://portal.mol.gov.sa/ar/Statistics/Documents/%D8%A7%D9%84%D9%83%D8%AA%D8%A7%D8%A8%20%D8%A7%D9%84%D8%A7%D8%AD%D8%B5%D8%A7%D8%A6%D9%8A%202013.pdf
Last date of access: 15 December 2014.
| Occupation group |
Changes of profession |
| Managers and Business Managers |
34,227 |
| Specialists in Scientific, Technical and Humanities Fields |
260,470 |
| Technicians in Scientific, Technical and Humanities Fields |
269,076 |
| Clerical Workers |
52,878 |
| Sales Persons |
306,020 |
| Service Persons |
690,074 |
| Agriculture, Animal Husbandry and Fishing |
32,634 |
| Industrial, Chemical and Food Industries |
88,660 |
| Engineering Support |
940,821 |
| Armed forces |
1,892 |
| TOTAL |
2,676,752 |
Source: Ministry of Labour
1. Definition
To the exception of certain categories of investors, all foreign residents in Saudi Arabia are under the responsibility of a local “sponsor”, usually the employer.
The sponsor receives the agreement to bring a foreign employee upon certification that he / she will employ the labourer in a specific profession. The “Iqama” (residency card”) mentions the profession of the worker, which also conditions certain rights (family reunion for instance).
The Saudi Labour Law has provisions allowing the worker to change profession/ sponsor. However, the procedure was conditionned to obtaining a Non-Objection Certificate from the first sponsor.
Since the onset of the Nitaqat (“ranges”, “zones”) campaign of Saudisation of the work force in September 2011, which classifies private sector companies by “range” based on the
Saudisation performance, changes of profession/ sponsor have been made easier for the workers in companies displaying the highest saudisation performance’ categories (“Green” and “Premium” or “Excellent”).
Those in companies with poorest rates of Saudisation (classified in “red” and “yellow” categories) cannot change profession.
2013′ figure is notably higher than previous ones as a result of the “correction campaign” or amnesty period run by the government from April 3 to November 3, 2013.
Ahead of a crackdown on irregular workers/ sojourners planned for November 4, 2013, the amnesty was meant to allow workers to sort out their administrative situation:
renew expired documents; register their current employer as their sponsor; register changes in profession and in activity sector, etc., or leave without paying a penalty.
2. Institution which provides data
Ministry of Labour
3. Data availability
The figures are published in the Ministry of Labour’s 2013 Statistical Yearbook (in Arabic).
http://portal.mol.gov.sa/ar/Statistics/Documents/%D8%A7%D9%84%D9%83%D8%AA%D8%A7%D8%A8%20%D8%A7%D9%84%D8%A7%D8%AD%D8%B5%D8%A7%D8%A6%D9%8A%202013.pdf
Last date of access: 15 December 2014.
|
Monthly figures |
Cumulated figures |
| 3/2011 |
33,323 |
33,323 |
| 4/2011 |
34,311 |
67,634 |
| 5/2011 |
30,504 |
98,138 |
| 6/2011 |
38,703 |
136,841 |
| 7/2011 |
29,724 |
166,565 |
| 8/2011 |
30,751 |
197,316 |
| 9/2011 |
43,704 |
241,020 |
| 10/2011 |
36,087 |
277,107 |
| 11/2011 |
53,014 |
330,121 |
| 12/2011 |
54,384 |
384,505 |
| Total 3 to 12/ 2011 |
384,505 |
|
| 1/2012 |
47,473 |
431,978 |
| 2/2012 |
48,826 |
480,804 |
| 3/2012 |
46,413 |
527,217 |
| 4/2012 |
49,296 |
576,513 |
| 5/2012 |
50,734 |
627,247 |
| 6/2012 |
53,851 |
681,098 |
| 7/2012 |
44,693 |
725,791 |
| 8/2012 |
60,972 |
786,763 |
| 9/2012 |
51,963 |
838,726 |
| 10/2012 |
41,944 |
880,670 |
| 11/2012 |
51,049 |
931,719 |
| 12/2012 |
47,288 |
979,007 |
| Total 2012 |
594,502 |
|
| 1/2013 |
46,579 |
1,025,586 |
| 2/2013 |
51,009 |
1,076,595 |
| 3/2013 |
52,322 |
1,128,917 |
| 4/2013 |
53,713 |
1,182,630 |
| 5/2013 |
61,203 |
1,243,833 |
| 6/2013 |
50,157 |
1,293,990 |
| 7/2013 |
30,585 |
1,324,575 |
| 8/2013 |
29,395 |
1,353,970 |
| 9/2013 |
34,266 |
1,388,236 |
| 10/2013 |
32,300 |
1,420,536 |
| 11/2013 |
137,569 |
1,558,105 |
| 12/2013 |
96,854 |
1,654,959 |
| Total 2013 |
675,952 |
|
| 01/2014 |
55,062 |
1,710,021 |
| 02/2014 |
52,290 |
1,762,311 |
| 03/2014 |
46,628 |
1,808,939 |
| 04/2014 |
46,628 |
1,855,566 |
| 05/2014 |
49,437 |
1,905,003 |
| 06/2014 |
50,543 |
1,955,546 |
| 07/2014 |
44,396 |
1,999,942 |
| 08/2014 |
43,728 |
2,043,670 |
| 09/2014 |
56,700 |
2,100,370 |
| 10/2014 |
43,002 |
2,143,372 |
| 11/2014 |
46,246 |
2,189,618 |
| Total 1 to 11/ 2014 |
534,659 |
|
Source: Ministry of Interior.
1. Definition
Saudi Arabia for years has been routinely performing deportations of illegal workers, during amnesty periods and rounding up operations of various scales.
Nitaqat, a massive program of saudization of the work force, was formally launched by the Saudi Ministry of Labour in September 2011 (Ministerial Resolution n°4040, dated 12/10/1432 H.).
The regulation establishes minimum shares reserved for Saudi citizens in a company’s labor force, depending on the size and on the activity sector of the business. Based on their level of compliance to Saudization quotas, the program classifies the private firms into four categories: Premium, Green, Yellow and Red.
Premium and Green categories include the companies with highest Saudization rates, while Yellow and Red include the ones with low rates.
Within this process, ahead of a crackdown on irregular workers/ sojourners, an amnesty period and mandatory regularization campaign were decided, starting April 3rd, 2013. The amnesty allows workers to try to sort out their administrative situation (renew expired documents; register their current employer as their sponsor; register changes in profession and in activity sector, etc.), or leave without paying a penalty.
Workers deported during the amnesty were the ones unable to regularise (for lack of documents, using forged ones, having a criminal record, having absconded, etc.), as well as workers found to redundant under newly established regulations for hiring foreign labourers in compliance with Nitaqat quotas.
The amnesty period expired on November 3rd, 2013. Since then, systematic country-wide raid operations are conducted by Ministry of Labour (in work sites) and by Ministry of Interior (in locations inhabited by aliens).
Deported workersare barred from coming back.
2. Institution which provides data
Ministry of interior
3. Data availability
Monthly figures for irregulars’ arrests and deportation were put online on the Ministry of Interior’s website (chapter “Security News”), until July 2015. Figures were computed by Hijrah months, in Arabic only.
As of 21 September 2015, deportation and arrests’ records are still unavailable online.
Date of access: 21 September 2015
| Regularisation operation/ document/ Worker’s final status |
Private sector |
Public sector |
Domestic sector |
All sectors |
| Change of profession |
2,417,273 |
322 |
6,184 |
2,423,779 |
| Transfer of services |
2,512,041 |
2 |
103,237 |
2,615,280 |
| Recruitment visas granted |
570,242 |
26,691 |
338,508 |
935,441 |
| Labour permits granted |
3,890,916 |
|
|
3,890,916 |
| Workers registered as runaway |
1,034,265 |
538 |
51,790 |
1,086,593 |
| Final exits |
437,314 |
17,069 |
259,141 |
713,524 |
Sources: Ministry of Labour and Ministry of Interior
* These figures indicate the number of administrative operations performed, not of persons concerned (one worker may have changed profession and also transferred sponsorship, for instance).
1. Definition
Ahead of a crackdown on irregular workers/ sojourners, an amnesty period was decided, starting April 3rd, 2013 and expired on November 3rd, 2013. The amnesty was meant to allow workers to sort out their administrative situation .
(renew expired documents; register their current employer as their sponsor; register changes in profession and in activity sector, etc.), or leave without paying a penalty
Foreigners who came for Haj, Umrah or visit before 3/7/2008 and stayed on irregularly since then could also rectify their status at the passport department.
The regularization campaign was decided within the process of undertaking a massive program of saudization of the work force, called ‘Nitaqat’.
Nitaqat (“ranges” or “zones”) was formally launched by the Saudi Ministry of Labour in September 2011 (Ministerial Resolution n°4040, dated 12/10/1432 H.). The regulation establishes minimum shares reserved for Saudi citizens in a
company’s labor force, depending on the size and on the activity sector of the business.
The companies with less than 10 employees are exempt from the program, but still need to employ at least one Saudi citizen.
Based on their level of compliance to Saudization quotas, the program classifies the private firms into four categories: Premium, Green, Yellow and Red. Premium and Green categories include the companies with highest Saudization rates, while Yellow and Red include the ones with low rates.
Color/ category of company is henceforth bound to the company’s ability to secure or renew its employees’ work permits, as well as registering any new branch of activity with the Labor ministry. Nitaqat
Nitaqat’ is ongoing and new measures are being added to the program’s tasks.
Workers classified as “runaway” are persons who 1- absconded from their workplace but are still in the country; or 2- left on a “leave-and-return” visa but did not return.
2. Institution which provides data
Ministry of Labour
3. Data availability
The figures are published in the Ministry of Labour’s 2013 Statistical Yearbook, pp. 84-86 (in Arabic).
http://portal.mol.gov.sa/ar/Statistics/Documents/%D8%A7%D9%84%D9%83%D8%AA%D8%A7%D8%A8%20%D8%A7%D9%84%D8%A7%D8%AD%D8%B5%D8%A7%D8%A6%D9%8A%202013.pdf
Last date of access: 15 December 2014.
|
Duration of stay (in years) |
|
| Age group |
|
< 1 year |
1-4 |
5-9 |
10-14 |
15-19 |
20-24 |
25-29 |
30 years and more |
Not stated |
Total |
| 0 – 4 |
Male |
11,173 |
79,308 |
0 |
0 |
0 |
0 |
0 |
0 |
0 |
90,481 |
| Female |
10,319 |
73,909 |
0 |
0 |
0 |
0 |
0 |
0 |
0 |
84,228 |
| Total |
21,492 |
153,217 |
0 |
0 |
0 |
0 |
0 |
0 |
0 |
174,709 |
| 5 – 9 |
Male |
1,453 |
20,753 |
65,352 |
0 |
0 |
0 |
0 |
0 |
0 |
87,558 |
| Female |
1,401 |
18,549 |
59,799 |
0 |
0 |
0 |
0 |
0 |
0 |
79,749 |
| Total |
2,854 |
39,302 |
125,151 |
0 |
0 |
0 |
0 |
0 |
0 |
167,307 |
| 10 – 14 |
Male |
1,000 |
13,628 |
15,504 |
46,661 |
0 |
0 |
0 |
0 |
0 |
76,793 |
| Female |
850 |
11,590 |
13,368 |
42,089 |
0 |
0 |
0 |
0 |
0 |
67,897 |
| Total |
1,850 |
25,218 |
28,872 |
88,750 |
0 |
0 |
0 |
0 |
0 |
144,690 |
| 15 – 19 |
Male |
2,046 |
13,106 |
8,946 |
7,493 |
34,222 |
0 |
0 |
0 |
0 |
65,813 |
| Female |
1,677 |
11,559 |
7,486 |
6,299 |
31,281 |
0 |
0 |
0 |
0 |
58,302 |
| Total |
3,723 |
24,665 |
16,432 |
13,792 |
65,503 |
0 |
0 |
0 |
0 |
124,115 |
| 20 – 24 |
Male |
23,983 |
150,349 |
17,976 |
4,589 |
3,764 |
20,694 |
0 |
0 |
8 |
221,363 |
| Female |
7,498 |
66,257 |
9,372 |
3,349 |
3,068 |
19,222 |
0 |
0 |
0 |
108,766 |
| Total |
31,481 |
216,606 |
27,348 |
7,938 |
6,832 |
39,916 |
0 |
0 |
8 |
330,129 |
| 25 – 29 |
Male |
26,697 |
293,115 |
93,883 |
11,709 |
3,271 |
3,166 |
12,397 |
0 |
23 |
444,261 |
| Female |
7,939 |
85,396 |
26,071 |
4,651 |
1,856 |
1,954 |
9,149 |
0 |
0 |
137,016 |
| Total |
34,636 |
378,511 |
119,954 |
16,360 |
5,127 |
5,120 |
21,546 |
0 |
23 |
581,277 |
| 30 – 34 |
Male |
17,480 |
226,239 |
157,423 |
44,719 |
7,375 |
2,965 |
2,041 |
5,774 |
17 |
464,033 |
| Female |
5,106 |
58,695 |
37,509 |
12,558 |
3,561 |
1,751 |
1,363 |
3,442 |
0 |
123,985 |
| Total |
22,586 |
284,934 |
194,932 |
57,277 |
10,936 |
4,716 |
3,404 |
9,216 |
17 |
588,018 |
| 35 – 39 |
Male |
10,869 |
125,334 |
127,357 |
67,874 |
23,218 |
5,791 |
2,001 |
4,110 |
18 |
366,572 |
| Female |
3,322 |
32,310 |
24,637 |
16,122 |
8,701 |
3,519 |
1,337 |
2,343 |
0 |
92,291 |
| Total |
14,191 |
157,644 |
151,994 |
83,996 |
31,919 |
9,310 |
3,338 |
6,453 |
18 |
458,863 |
| 40 – 44 |
Male |
5,910 |
61,099 |
65,099 |
56,939 |
31,958 |
17,775 |
5,554 |
3,740 |
12 |
248,086 |
| Female |
1,722 |
16,339 |
11,957 |
10,202 |
9,559 |
7,268 |
2,996 |
2,133 |
0 |
62,176 |
| Total |
7,632 |
77,438 |
77,056 |
67,141 |
41,517 |
25,043 |
8,550 |
5,873 |
12 |
310,262 |
| 45 – 49 |
Male |
3,129 |
29,103 |
33,264 |
30,798 |
24,102 |
20,595 |
14,462 |
6,569 |
4 |
162,026 |
| Female |
752 |
7,431 |
5,586 |
4,948 |
5,173 |
6,155 |
4,814 |
2,595 |
0 |
37,454 |
| Total |
3,881 |
36,534 |
38,850 |
35,746 |
29,275 |
26,750 |
19,276 |
9,164 |
4 |
199,480 |
| 50 – 54 |
Male |
1,242 |
12,906 |
13,830 |
13,903 |
12,194 |
14,807 |
16,433 |
11,774 |
4 |
97,093 |
| Female |
374 |
3,707 |
2,670 |
2,251 |
2,261 |
3,070 |
4,120 |
3,139 |
0 |
21,592 |
| Total |
1,616 |
16,613 |
16,500 |
16,154 |
14,455 |
17,877 |
20,553 |
14,913 |
4 |
118,685 |
| 55 – 59 |
Male |
500 |
4,818 |
4,682 |
4,799 |
4,616 |
5,823 |
8,712 |
9,459 |
1 |
43,410 |
| Female |
246 |
1,766 |
1,166 |
745 |
806 |
1,009 |
1,601 |
2,124 |
0 |
9,463 |
| Total |
746 |
6,584 |
5,848 |
5,544 |
5,422 |
6,832 |
10,313 |
11,583 |
1 |
52,873 |
| 60 – 64 |
Male |
158 |
1,432 |
1,252 |
1,101 |
1,082 |
1,354 |
2,042 |
4,223 |
0 |
12,644 |
| Female |
130 |
960 |
518 |
308 |
268 |
327 |
440 |
1,027 |
0 |
3,978 |
| Total |
288 |
2,392 |
1,770 |
1,409 |
1,350 |
1,681 |
2,482 |
5,250 |
0 |
16,622 |
| 65 – 69 |
Male |
77 |
497 |
366 |
270 |
243 |
314 |
580 |
1,490 |
0 |
3,837 |
| Female |
77 |
561 |
276 |
168 |
143 |
143 |
160 |
474 |
0 |
2,002 |
| Total |
154 |
1,058 |
642 |
438 |
386 |
457 |
740 |
1,964 |
0 |
5,839 |
| 70 – 74 |
Male |
64 |
292 |
181 |
97 |
95 |
134 |
161 |
710 |
0 |
1,734 |
| Female |
68 |
363 |
184 |
132 |
100 |
85 |
85 |
297 |
0 |
1,314 |
| Total |
132 |
655 |
365 |
229 |
195 |
219 |
246 |
1,007 |
0 |
3,048 |
| 75 – 79 |
Male |
23 |
275 |
111 |
38 |
36 |
45 |
42 |
230 |
0 |
800 |
| Female |
17 |
175 |
85 |
52 |
42 |
69 |
50 |
140 |
0 |
630 |
| Total |
40 |
450 |
196 |
90 |
78 |
114 |
92 |
370 |
0 |
1,430 |
| 80 – 84 |
Male |
7 |
87 |
52 |
34 |
19 |
32 |
21 |
125 |
0 |
377 |
| Female |
11 |
125 |
62 |
51 |
36 |
45 |
39 |
110 |
0 |
479 |
| Total |
18 |
212 |
114 |
85 |
55 |
77 |
60 |
235 |
0 |
856 |
| 85 and more |
Male |
10 |
74 |
47 |
26 |
25 |
23 |
16 |
71 |
0 |
292 |
| Female |
13 |
63 |
49 |
27 |
20 |
41 |
35 |
88 |
0 |
336 |
| Total |
23 |
137 |
96 |
53 |
45 |
64 |
51 |
159 |
0 |
628 |
| Not Stated |
Male |
0 |
0 |
0 |
0 |
0 |
0 |
0 |
0 |
1,051 |
1,051 |
| Female |
2 |
0 |
0 |
0 |
0 |
0 |
0 |
1 |
1,047 |
1,050 |
| Total |
2 |
0 |
0 |
0 |
0 |
0 |
0 |
1 |
2,098 |
2,101 |
| |
Male |
105,821 |
1,032,415 |
605,325 |
291,050 |
146,220 |
93,518 |
64,462 |
48,275 |
1,138 |
2,388,224 |
| Total |
Female |
41,524 |
389,755 |
200,795 |
103,952 |
66,875 |
44,658 |
26,189 |
17,913 |
1,047 |
892,708 |
| |
Total |
147,345 |
1,422,170 |
806,120 |
395,002 |
213,095 |
138,176 |
90,651 |
66,188 |
2,185 |
3,280,932 |
Source: Ministry of Economy.
ANNEXED NOTE
1. Characteristics of data
The first population census was conducted in 1968 by the Council of Developing Trucial States.
After Independence in 1971, a population census of the Emirate of Abu Dhabi was conducted that same year.
The first general population and establishments census in the UAE was conducted in 1975. It was the first census in the region following scientific standards and international recommendations. The other federal censuses were conducted in 1980, 1985, 1995 and 2005.
Reference day for 2005′ census: 6 December 2005
Implementation method: the census was carried out according to de jure methodology, i.e. counting persons using their usual place of residence
Population of reference: Emirati nationals usually residing in the country+all foreign residents holding a valid residence permit+resident GCC nationals (nationals of other GCC states don’t need a permit to stay in the UAE)
2. Institution which provides data
National Bureau of Statistics (NBS)
3. Data availability
Population statistics are available on NBS’s website:
http://www.uaestatistics.gov.ae/EnglishHome/tabid/96/Default.aspx
http://www.uaestatistics.gov.ae/Home/tabid/38/Default.aspx
Data are classified by subject and statistical publications are available on PDF or Excel format. Population data disagregated by nationality (Emirati/ non-Emirati) are scarce.
2005′ census data is available at:
http://www.uaestatistics.gov.ae/EnglishHome/ReportsByDepartmentEnglish/tabid/104/Default.aspx?MenuId=1&NDId=365
The present data is taken from:
http://www.uaestatistics.gov.ae/EnglishHome/ReportDetailsEnglish/tabid/121/Default.aspx?ItemId=1868&PTID=104&MenuId=1
Date of access: November 2014.
|
Emiratis |
Non-Emiratis |
Total |
| Educational Status |
Males |
Females |
Total |
Males |
Females |
Total |
Males |
Females |
Total |
| Illiterate |
18,468 |
35,794 |
54,262 |
233,811 |
43,275 |
277,086 |
252,279 |
79,069 |
331,348 |
| Read and Write |
28,360 |
30,370 |
58,730 |
349,940 |
84,432 |
434,372 |
378,300 |
114,802 |
493,102 |
| Primary |
53,403 |
46,365 |
99,768 |
331,534 |
88,845 |
420,379 |
384,937 |
135,210 |
520,147 |
| Preparatory |
70,813 |
53,920 |
124,733 |
400,771 |
106,736 |
507,507 |
471,584 |
160,656 |
632,240 |
| Secondary |
99,005 |
96,259 |
195,264 |
510,411 |
216,175 |
726,586 |
609,416 |
312,434 |
921,850 |
| Under University |
8,250 |
8,276 |
16,526 |
85,725 |
40,285 |
126,010 |
93,975 |
48,561 |
142,536 |
| University |
27,421 |
31,929 |
59,350 |
262,288 |
133,572 |
395,860 |
289,709 |
165,501 |
455,210 |
| Over University |
4,133 |
2,032 |
6,165 |
34,162 |
14,424 |
48,586 |
38,295 |
16,456 |
54,751 |
| Not Stated |
573 |
619 |
1,192 |
1,543 |
987 |
2,530 |
2,116 |
1,606 |
3,722 |
| Total |
310,426 |
305,564 |
615,990 |
2,210,185 |
728,731 |
2,938,916 |
2,520,611 |
1,034,295 |
3,554,906 |
Source: Ministry of Economy.
ANNEXED NOTE
1. Characteristics of data
The first population census was conducted in 1968 by the Council of Developing Trucial States.
After Independence in 1971, a population census of the Emirate of Abu Dhabi was conducted that same year.
The first general population and establishments census in the UAE was conducted in 1975. It was the first census in the region following scientific standards and international recommendations. The other federal censuses were conducted in 1980, 1985, 1995 and 2005.
Reference day for 2005′ census: 6 December 2005
Implementation method: the census was carried out according to de jure methodology, i.e. counting persons using their usual place of residence
Population of reference: Population aged 10 and above.
Emirati nationals usually residing in the country+all foreign residents holding a valid residence permit+resident GCC nationals (nationals of other GCC states don’t need a permit to stay in the UAE)
2. Institution which provides data
National Bureau of Statistics (NBS)
3. Data availability
Population statistics are available on NBS’s website:
http://www.uaestatistics.gov.ae/EnglishHome/tabid/96/Default.aspx
http://www.uaestatistics.gov.ae/Home/tabid/38/Default.aspx
Data are classified by subject and statistical publications are available on PDF or Excel format. Population data disagregated by nationality (Emirati/ non-Emirati) are scarce.
2005′ census data is available at:
http://www.uaestatistics.gov.ae/EnglishHome/ReportsByDepartmentEnglish/tabid/104/Default.aspx?MenuId=1&NDId=365
The present data is taken from:
http://www.uaestatistics.gov.ae/EnglishHome/ReportDetailsEnglish/tabid/121/Default.aspx?ItemId=1869&PTID=104&MenuId=1
Date of access: November 2014.
|
|
Emiratis |
Non-Emiratis |
Total |
| Emirate |
Educational Status |
Males |
Females |
Total |
Males |
Females |
Total |
Males |
Females |
Total |
| |
Illiterate |
6,427 |
14,542 |
20,969 |
109,735 |
18,961 |
128,696 |
116,162 |
33,503 |
149,665 |
| |
Read and Write |
11,131 |
11,995 |
23,126 |
127,960 |
34,027 |
161,987 |
139,091 |
46,022 |
185,113 |
| |
Primary |
22,383 |
19,682 |
42,065 |
99,971 |
31,761 |
131,732 |
122,354 |
51,443 |
173,797 |
| |
Preparatory |
28,967 |
22,161 |
51,128 |
108,219 |
33,398 |
141,617 |
137,186 |
55,559 |
192,745 |
| |
Secondary |
40,091 |
41,394 |
81,485 |
128,395 |
62,985 |
191,380 |
168,486 |
104,379 |
272,865 |
| Abu Dhabi |
Under University |
4,530 |
3,625 |
8,155 |
27,007 |
14,887 |
41,894 |
31,537 |
18,512 |
50,049 |
| |
University |
11,973 |
12,252 |
24,225 |
74,235 |
40,008 |
114,243 |
86,208 |
52,260 |
138,468 |
| |
Over University |
2,121 |
892 |
3,013 |
12,234 |
5,183 |
17,417 |
14,355 |
6,075 |
20,430 |
| |
Not Stated |
573 |
619 |
1,192 |
1,543 |
987 |
2,530 |
2,116 |
1,606 |
3,722 |
| |
Total Abu Dhabi |
128,196 |
127,162 |
255,358 |
689,299 |
242,197 |
931,496 |
817,495 |
369,359 |
1,186,854 |
| |
Illiterate |
2,380 |
4,647 |
7,027 |
58,750 |
5,497 |
64,247 |
61,130 |
10,144 |
71,274 |
| |
Read and Write |
5,363 |
6,276 |
11,639 |
119,935 |
20,580 |
140,515 |
125,298 |
26,856 |
152,154 |
| |
Primary |
7,984 |
7,076 |
15,060 |
120,830 |
20,262 |
141,092 |
128,814 |
27,338 |
156,152 |
| |
Preparatory |
10,984 |
9,655 |
20,639 |
176,834 |
31,787 |
208,621 |
187,818 |
41,442 |
229,260 |
| Dubai |
Secondary |
16,729 |
16,918 |
33,647 |
248,449 |
72,763 |
321,212 |
265,178 |
89,681 |
354,859 |
| |
Under University |
1,413 |
1,508 |
2,921 |
34,228 |
12,849 |
47,077 |
35,641 |
14,357 |
49,998 |
| |
University |
7,453 |
7,109 |
14,562 |
107,779 |
55,961 |
163,740 |
115,232 |
63,070 |
178,302 |
| |
Over University |
931 |
441 |
1,372 |
11,954 |
5,113 |
17,067 |
12,885 |
5,554 |
18,439 |
| |
Total Dubai |
53,237 |
53,630 |
106,867 |
878,759 |
224,812 |
1,103,571 |
931,996 |
278,442 |
1,210,438 |
| |
Illiterate |
3,285 |
5,939 |
9,224 |
38,127 |
8,651 |
46,778 |
41,412 |
14,590 |
56,002 |
| |
Read and Write |
3,918 |
4,168 |
8,086 |
53,990 |
13,636 |
67,626 |
57,908 |
17,804 |
75,712 |
| |
Primary |
9,414 |
8,186 |
17,600 |
66,648 |
20,735 |
87,383 |
76,062 |
28,921 |
104,983 |
| |
Preparatory |
12,339 |
8,939 |
21,278 |
68,780 |
25,326 |
94,106 |
81,119 |
34,265 |
115,384 |
| Sharjah |
Secondary |
19,020 |
16,214 |
35,234 |
86,480 |
53,328 |
139,808 |
105,500 |
69,542 |
175,042 |
| |
Under University |
1,042 |
1,289 |
2,331 |
17,492 |
8,846 |
26,338 |
18,534 |
10,135 |
28,669 |
| |
University |
4,218 |
5,616 |
9,834 |
59,869 |
28,119 |
87,988 |
64,087 |
33,735 |
97,822 |
| |
Over University |
575 |
315 |
890 |
7,431 |
3,156 |
10,587 |
8,006 |
3,471 |
11,477 |
| |
Total Sharjah |
53,811 |
50,666 |
104,477 |
398,817 |
161,797 |
560,614 |
452,628 |
212,463 |
665,091 |
| |
Illiterate |
891 |
1,753 |
2,644 |
6,750 |
3,710 |
10,460 |
7,641 |
5,463 |
13,104 |
| |
Read and Write |
1,244 |
1,350 |
2,594 |
17,767 |
5,764 |
23,531 |
19,011 |
7,114 |
26,125 |
| |
Primary |
2,687 |
2,316 |
5,003 |
19,184 |
7,070 |
26,254 |
21,871 |
9,386 |
31,257 |
| |
Preparatory |
3,861 |
2,591 |
6,452 |
18,246 |
7,027 |
25,273 |
22,107 |
9,618 |
31,725 |
| Ajman |
Secondary |
5,044 |
4,487 |
9,531 |
21,284 |
13,886 |
35,170 |
26,328 |
18,373 |
44,701 |
| |
Under University |
316 |
432 |
748 |
3,564 |
1,743 |
5,307 |
3,880 |
2,175 |
6,055 |
| |
University |
889 |
1,305 |
2,194 |
9,651 |
4,249 |
13,900 |
10,540 |
5,554 |
16,094 |
| |
Over University |
138 |
83 |
221 |
1,204 |
437 |
1,641 |
1,342 |
520 |
1,862 |
| |
Total Ajman |
15,070 |
14,317 |
29,387 |
97,650 |
43,886 |
141,536 |
112,720 |
58,203 |
170,923 |
| |
Illiterate |
489 |
854 |
1,343 |
3,014 |
1,207 |
4,221 |
3,503 |
2,061 |
5,564 |
| |
Read and Write |
359 |
382 |
741 |
2,880 |
1,070 |
3,950 |
3,239 |
1,452 |
4,691 |
| |
Primary |
1,255 |
1,034 |
2,289 |
4,311 |
1,763 |
6,074 |
5,566 |
2,797 |
8,363 |
| |
Preparatory |
1,335 |
1,001 |
2,336 |
3,821 |
1,802 |
5,623 |
5,156 |
2,803 |
7,959 |
| Umm Al – Quwain |
Secondary |
1,925 |
1,764 |
3,689 |
3,991 |
2,109 |
6,100 |
5,916 |
3,873 |
9,789 |
| |
Under University |
171 |
305 |
476 |
503 |
334 |
837 |
674 |
639 |
1,313 |
| |
University |
384 |
709 |
1,093 |
1,358 |
754 |
2,112 |
1,742 |
1,463 |
3,205 |
| |
Over University |
36 |
50 |
86 |
152 |
65 |
217 |
188 |
115 |
303 |
| |
Total Umm Al-Quwain |
5,954 |
6,099 |
12,053 |
20,030 |
9,104 |
29,134 |
25,984 |
15,203 |
41,187 |
| |
Illiterate |
3,074 |
4,978 |
8,052 |
10,121 |
3,553 |
13,674 |
13,195 |
8,531 |
21,726 |
| |
Read and Write |
3,898 |
3,809 |
7,707 |
17,786 |
6,358 |
24,144 |
21,684 |
10,167 |
31,851 |
| |
Primary |
5,822 |
4,873 |
10,695 |
13,090 |
4,904 |
17,994 |
18,912 |
9,777 |
28,689 |
| |
Preparatory |
8,153 |
5,755 |
13,908 |
15,686 |
5,139 |
20,825 |
23,839 |
10,894 |
34,733 |
| Ras Al – Khaima |
Secondary |
10,006 |
9,598 |
19,604 |
13,892 |
6,862 |
20,754 |
23,898 |
16,460 |
40,358 |
| |
Under University |
576 |
773 |
1,349 |
1,662 |
1,067 |
2,729 |
2,238 |
1,840 |
4,078 |
| |
University |
1,739 |
3,208 |
4,947 |
5,750 |
2,690 |
8,440 |
7,489 |
5,898 |
13,387 |
| |
Over University |
242 |
197 |
439 |
584 |
240 |
824 |
826 |
437 |
1,263 |
| |
Total Ras Al – Khaima |
33,510 |
33,191 |
66,701 |
78,571 |
30,813 |
109,384 |
112,081 |
64,004 |
176,085 |
| |
Illiterate |
1,922 |
3,081 |
5,003 |
7,314 |
1,696 |
9,010 |
9,236 |
4,777 |
14,013 |
| |
Read and Write |
2,447 |
2,390 |
4,837 |
9,622 |
2,997 |
12,619 |
12,069 |
5,387 |
17,456 |
| |
Primary |
3,858 |
3,198 |
7,056 |
7,500 |
2,350 |
9,850 |
11,358 |
5,548 |
16,906 |
| |
Preparatory |
5,174 |
3,818 |
8,992 |
9,185 |
2,257 |
11,442 |
14,359 |
6,075 |
20,434 |
| Fujairah |
Secondary |
6,190 |
5,884 |
12,074 |
7,920 |
4,242 |
12,162 |
14,110 |
10,126 |
24,236 |
| |
Under University |
202 |
344 |
546 |
1,269 |
559 |
1,828 |
1,471 |
903 |
2,374 |
| |
University |
765 |
1,730 |
2,495 |
3,646 |
1,791 |
5,437 |
4,411 |
3,521 |
7,932 |
| |
Over University |
90 |
54 |
144 |
603 |
230 |
833 |
693 |
284 |
977 |
| |
Total Fujairah |
20,648 |
20,499 |
41,147 |
47,059 |
16,122 |
63,181 |
67,707 |
36,621 |
104,328 |
| Total |
310,426 |
305,564 |
615,990 |
2,210,185 |
728,731 |
2,938,916 |
2,520,611 |
1,034,295 |
3,554,906 |
NBS, Ministry of Economy.
ANNEXED NOTE
1. Characteristics of data, definitions and population counting operations in the UAE
The first population census was conducted in 1968 by the Council of Developing Trucial States.
After Independence in 1971, a population census of the Emirate of Abu Dhabi was conducted that same year.
The first general population and establishments census in the UAE was conducted in 1975. It was the first census in the region following scientific standards and international recommendations. The other federal censuses were conducted in 1980, 1985, 1995 and 2005.
Reference day for 2005′ census: 6 December 2005
Implementation method: the census was carried out according to de jure methodology, i.e. counting persons using their usual place of residence
Population of reference: Population aged 10 and above.
Emirati nationals usually residing in the country+all foreign residents holding a valid residence permit+resident GCC nationals (nationals of other GCC states don’t need a permit to stay in the UAE)
2. Institution which provides data
National Bureau of Statistics (NBS)
3. Data availability
Population statistics are available on NBS’s website:
http://www.uaestatistics.gov.ae/EnglishHome/tabid/96/Default.aspx
http://www.uaestatistics.gov.ae/Home/tabid/38/Default.aspx
Data are classified by subject and statistical publications are available on PDF or Excel format. Population data disagregated by nationality (Emirati/ non-Emirati) are scarce.
2005′ census data is available at:
http://www.uaestatistics.gov.ae/EnglishHome/ReportsByDepartmentEnglish/tabid/104/Default.aspx?MenuId=1&NDId=365
The present data is taken from:
http://www.uaestatistics.gov.ae/EnglishHome/ReportDetailsEnglish/tabid/121/Default.aspx?ItemId=1869&PTID=104&MenuId=1
Date of access: November 2014.
|
Emiratis |
Non-Emiratis |
Total |
| Age Groups |
Males |
Females |
Total |
Males |
Females |
Total |
Males |
Females |
Total |
| 0 – 4 |
55,120 |
52,310 |
107,430 |
90,497 |
84,217 |
174,714 |
145,617 |
136,527 |
282,144 |
| 5 – 9 |
52,371 |
49,704 |
102,075 |
87,567 |
79,754 |
167,321 |
139,938 |
129,458 |
269,396 |
| 10 – 14 |
53,985 |
50,382 |
104,367 |
76,777 |
67,887 |
144,664 |
130,762 |
118,269 |
249,031 |
| 15 – 19 |
55,575 |
52,536 |
108,111 |
65,823 |
58,304 |
124,127 |
121,398 |
110,840 |
232,238 |
| 20 – 24 |
50,673 |
52,764 |
103,437 |
221,350 |
108,756 |
330,106 |
272,023 |
161,520 |
433,543 |
| 25 – 29 |
39,396 |
41,121 |
80,517 |
444,220 |
137,028 |
581,248 |
483,616 |
178,149 |
661,765 |
| 30 – 34 |
25,846 |
26,497 |
52,343 |
464,072 |
123,994 |
588,066 |
489,918 |
150,491 |
640,409 |
| 35 – 39 |
20,189 |
21,554 |
41,743 |
366,565 |
92,265 |
458,830 |
386,754 |
113,819 |
500,573 |
| 40 – 44 |
14,633 |
16,366 |
30,999 |
248,093 |
62,190 |
310,283 |
262,726 |
78,556 |
341,282 |
| 45 – 49 |
12,433 |
13,857 |
26,290 |
162,043 |
37,458 |
199,501 |
174,476 |
51,315 |
225,791 |
| 50 – 54 |
10,246 |
9,947 |
20,193 |
97,081 |
21,592 |
118,673 |
107,327 |
31,539 |
138,866 |
| 55 – 59 |
7,893 |
6,341 |
14,234 |
43,410 |
9,467 |
52,877 |
51,303 |
15,808 |
67,111 |
| 60 – 64 |
6,176 |
4,549 |
10,725 |
12,632 |
3,971 |
16,603 |
18,808 |
8,520 |
27,328 |
| 65 – 69 |
5,335 |
3,283 |
8,618 |
3,840 |
2,001 |
5,841 |
9,175 |
5,284 |
14,459 |
| 70 – 74 |
3,657 |
2,699 |
6,356 |
1,746 |
1,319 |
3,065 |
5,403 |
4,018 |
9,421 |
| 75 – 79 |
1,621 |
1,205 |
2,826 |
576 |
622 |
1,198 |
2,197 |
1,827 |
4,024 |
| 80 – 84 |
1,160 |
960 |
2,120 |
370 |
479 |
849 |
1,530 |
1,439 |
2,969 |
| 85+ |
958 |
830 |
1,788 |
304 |
339 |
643 |
1,262 |
1,169 |
2,431 |
| Not Stated |
650 |
673 |
1,323 |
1,269 |
1,054 |
2,323 |
1,919 |
1,727 |
3,646 |
| Total |
417,917 |
407,578 |
825,495 |
2,388,235 |
892,697 |
3,280,932 |
2,806,152 |
1,300,275 |
4,106,427 |
Source: Ministry of Economy.
ANNEXED NOTE
1. Characteristics of data, definitions and population counting operations in the UAE
The first population census was conducted in 1968 by the Council of Developing Trucial States.
After Independence in 1971, a population census of the Emirate of Abu Dhabi was conducted that same year.
The first general population and establishments census in the UAE was conducted in 1975. It was the first census in the region following scientific standards and international recommendations. The other federal censuses were conducted in 1980, 1985, 1995 and 2005.
Reference day for 1975, 1980, 1985, 1995′ censuses: unknown
Reference day for 2005′ census: 6 December 2005
Implementation method: the census was carried out according to de jure methodology, i.e. counting persons using their usual place of residence
Population of reference: Emirati nationals usually residing in the country+all foreign residents holding a valid residence permit+resident GCC nationals (nationals of other GCC states don’t need a permit to stay in the UAE)
2010′ federal census was eventually cancelled but the Emirates Identity Authority (EIDA), an independent federal authority established in 2004, is currently in charge of recording all UAE residents, national and expatriates in order to set up a Population Register and an ID card program. The process is stil ongoing.
2. Institution which provides data
National Bureau of Statistics (NBS)
3. Data availability
Population statistics are available on NBS’s website:
http://www.uaestatistics.gov.ae/EnglishHome/tabid/96/Default.aspx
http://www.uaestatistics.gov.ae/Home/tabid/38/Default.aspx
Data are classified by subject and statistical publications are available on PDF or Excel format. Population data disagregated by nationality (Emirati/ non-Emirati) are scarce.
2005′ census data is available at:
http://www.uaestatistics.gov.ae/EnglishHome/ReportsByDepartmentEnglish/tabid/104/Default.aspx?MenuId=1&NDId=365
The present data is taken from:
http://www.uaestatistics.gov.ae/EnglishHome/ReportDetailsEnglish/tabid/121/Default.aspx?ItemId=1868&PTID=104&MenuId=1
Date of access: November 2014.
|
Emiratis |
Non-Emiratis |
Total |
| Age Groups |
Males |
Females |
Total |
Males |
Females |
Total |
Males |
Females |
Total |
| 0 – 4 |
44,663 |
42,488 |
87,151 |
64,861 |
61,037 |
125,898 |
109,524 |
103,525 |
213,049 |
| 5 – 9 |
45,450 |
43,461 |
88,911 |
67,534 |
62,846 |
130,380 |
112,984 |
106,307 |
219,291 |
| 10 – 14 |
46,845 |
44,628 |
91,473 |
58,040 |
52,541 |
110,581 |
104,885 |
97,169 |
202,054 |
| 15 – 19 |
42,871 |
40,778 |
83,649 |
40,567 |
34,693 |
75,260 |
83,438 |
75,471 |
158,909 |
| 20 – 24 |
28,255 |
29,043 |
57,298 |
111,613 |
48,839 |
160,452 |
139,868 |
77,882 |
217,750 |
| 25 – 29 |
19,836 |
20,159 |
39,995 |
218,268 |
68,250 |
286,518 |
238,104 |
88,409 |
326,513 |
| 30 – 34 |
13,262 |
14,836 |
28,098 |
215,804 |
65,377 |
281,181 |
229,066 |
80,213 |
309,279 |
| 35 – 39 |
11,904 |
15,044 |
26,948 |
208,057 |
53,696 |
261,753 |
219,961 |
68,740 |
288,701 |
| 40 – 44 |
8,976 |
9,964 |
18,940 |
152,607 |
31,682 |
184,289 |
161,583 |
41,646 |
203,229 |
| 45 – 49 |
8,815 |
8,445 |
17,260 |
97,351 |
17,405 |
114,756 |
106,166 |
25,850 |
132,016 |
| 50 – 54 |
6,676 |
6,036 |
12,712 |
44,979 |
7,658 |
52,637 |
51,655 |
13,694 |
65,349 |
| 55 – 59 |
5,866 |
4,490 |
10,356 |
19,180 |
3,854 |
23,034 |
25,046 |
8,344 |
33,390 |
| 60 – 64 |
4,182 |
3,372 |
7,554 |
6,225 |
2,181 |
8,406 |
10,407 |
5,553 |
15,960 |
| 65 – 69 |
3,940 |
2,870 |
6,810 |
2,552 |
1,727 |
4,279 |
6,492 |
4,597 |
11,089 |
| 70 – 74 |
2,578 |
2,099 |
4,677 |
1,073 |
1,081 |
2,154 |
3,651 |
3,180 |
6,831 |
| 75 – 79 |
1,202 |
923 |
2,125 |
447 |
537 |
984 |
1,649 |
1,460 |
3,109 |
| 80 – 84 |
1,021 |
924 |
1,945 |
248 |
319 |
567 |
1,269 |
1,243 |
2,512 |
| 85+ |
707 |
702 |
1,409 |
218 |
218 |
436 |
925 |
920 |
1,845 |
| Not Stated |
11 |
8 |
19 |
120 |
26 |
146 |
131 |
34 |
165 |
| Total |
297,060 |
290,270 |
587,330 |
1,309,744 |
513,967 |
1,823,711 |
1,606,804 |
804,237 |
2,411,041 |
Source: Ministry of Economy.
ANNEXED NOTE
1. Characteristics of data, definitions and population counting operations in the UAE
The first population census was conducted in 1968 by the Council of Developing Trucial States.
After Independence in 1971, a population census of the Emirate of Abu Dhabi was conducted that same year.
The first general population and establishments census in the UAE was conducted in 1975. It was the first census in the region following scientific standards and international recommendations. The other federal censuses were conducted in 1980, 1985, 1995 and 2005.
Reference day for 1975, 1980, 1985, 1995′ censuses: unknown
Reference day for 2005′ census: 6 December 2005
Implementation method: the census was carried out according to de jure methodology, i.e. counting persons using their usual place of residence
Population of reference: Emirati nationals usually residing in the country+all foreign residents holding a valid residence permit+resident GCC nationals (nationals of other GCC states don’t need a permit to stay in the UAE)
2010′ federal census was eventually cancelled but the Emirates Identity Authority (EIDA), an independent federal authority established in 2004, is currently in charge of recording all UAE residents, national and expatriates in order to set up a Population Register and an ID card program. The process is stil ongoing.
2. Institution which provides data
National Bureau of Statistics (NBS)
3. Data availability
Population statistics are available on NBS’s website:
http://www.uaestatistics.gov.ae/EnglishHome/tabid/96/Default.aspx
http://www.uaestatistics.gov.ae/Home/tabid/38/Default.aspx
Data are classified by subject and statistical publications are available on PDF or Excel format. Population data disagregated by nationality (Emirati/ non-Emirati) are scarce.
2005′ census data is available at:
http://www.uaestatistics.gov.ae/EnglishHome/ReportsByDepartmentEnglish/tabid/104/Default.aspx?MenuId=1&NDId=365
The present data is taken from:
http://www.uaestatistics.gov.ae/EnglishHome/ReportDetailsEnglish/tabid/121/Default.aspx?ItemId=1868&PTID=104&MenuId=1
Date of access: November 2014.
|
Emiratis |
Non-Emiratis |
Total |
| Age Groups |
Males |
Females |
Total |
Males |
Females |
Total |
Males |
Females |
Total |
| 0 – 4 |
40,598 |
38,975 |
79,573 |
56,083 |
53,489 |
109,572 |
96,681 |
92,464 |
189,145 |
| 5 – 9 |
37,610 |
36,286 |
73,896 |
42,058 |
38,896 |
80,954 |
79,668 |
75,182 |
154,850 |
| 10 – 14 |
26,722 |
25,205 |
51,927 |
23,717 |
21,036 |
44,753 |
50,439 |
46,241 |
96,680 |
| 15 – 19 |
20,886 |
19,291 |
40,177 |
17,876 |
15,223 |
33,099 |
38,762 |
34,514 |
73,276 |
| 20 – 24 |
15,181 |
14,865 |
30,046 |
60,486 |
32,460 |
92,946 |
75,667 |
47,325 |
122,992 |
| 25 – 29 |
11,351 |
13,366 |
24,717 |
133,197 |
44,812 |
178,009 |
144,548 |
58,178 |
202,726 |
| 30 – 34 |
8,235 |
9,402 |
17,637 |
132,966 |
35,257 |
168,223 |
141,201 |
44,659 |
185,860 |
| 35 – 39 |
8,399 |
8,599 |
16,998 |
103,535 |
22,861 |
126,396 |
111,934 |
31,460 |
143,394 |
| 40 – 44 |
6,488 |
6,298 |
12,786 |
59,958 |
10,759 |
70,717 |
66,446 |
17,057 |
83,503 |
| 45 – 49 |
7,090 |
5,907 |
12,997 |
35,889 |
5,961 |
41,850 |
42,979 |
11,868 |
54,847 |
| 50 – 54 |
5,549 |
4,468 |
10,017 |
16,402 |
3,343 |
19,745 |
21,951 |
7,811 |
29,762 |
| 55 – 59 |
3,911 |
3,000 |
6,911 |
6,646 |
1,952 |
8,598 |
10,557 |
4,952 |
15,509 |
| 60 – 64 |
3,128 |
2,616 |
5,744 |
2,414 |
1,467 |
3,881 |
5,542 |
4,083 |
9,625 |
| 65 – 69 |
2,733 |
1,988 |
4,721 |
985 |
1,000 |
1,985 |
3,718 |
2,988 |
6,706 |
| 70 – 74 |
2,132 |
1,705 |
3,837 |
546 |
600 |
1,146 |
2,678 |
2,305 |
4,983 |
| 75 – 79 |
938 |
722 |
1,660 |
211 |
273 |
484 |
1,149 |
995 |
2,144 |
| 80 – 84 |
672 |
705 |
1,377 |
131 |
167 |
298 |
803 |
872 |
1,675 |
| 85+ |
521 |
554 |
1,075 |
116 |
104 |
220 |
637 |
658 |
1,295 |
| Not Stated |
13 |
5 |
18 |
227 |
86 |
313 |
240 |
91 |
331 |
| Total |
202,157 |
193,957 |
396,114 |
693,443 |
289,746 |
983,189 |
895,600 |
483,703 |
1,379,303 |
Source: Ministry of Economy.
ANNEXED NOTE
1. Characteristics of data, definitions and population counting operations in the UAE
The first population census was conducted in 1968 by the Council of Developing Trucial States.
After Independence in 1971, a population census of the Emirate of Abu Dhabi was conducted that same year.
The first general population and establishments census in the UAE was conducted in 1975. It was the first census in the region following scientific standards and international recommendations. The other federal censuses were conducted in 1980, 1985, 1995 and 2005.
Reference day for 1975, 1980, 1985, 1995′ censuses: unknown
Reference day for 2005′ census: 6 December 2005
Implementation method: the census was carried out according to de jure methodology, i.e. counting persons using their usual place of residence
Population of reference: Emirati nationals usually residing in the country+all foreign residents holding a valid residence permit+resident GCC nationals (nationals of other GCC states don’t need a permit to stay in the UAE)
2010′ federal census was eventually cancelled but the Emirates Identity Authority (EIDA), an independent federal authority established in 2004, is currently in charge of recording all UAE residents, national and expatriates in order to set up a Population Register and an ID card program. The process is stil ongoing.
2. Institution which provides data
National Bureau of Statistics (NBS)
3. Data availability
Population statistics are available on NBS’s website:
http://www.uaestatistics.gov.ae/EnglishHome/tabid/96/Default.aspx
http://www.uaestatistics.gov.ae/Home/tabid/38/Default.aspx
Data are classified by subject and statistical publications are available on PDF or Excel format. Population data disagregated by nationality (Emirati/ non-Emirati) are scarce.
2005′ census data is available at:
http://www.uaestatistics.gov.ae/EnglishHome/ReportsByDepartmentEnglish/tabid/104/Default.aspx?MenuId=1&NDId=365
The present data is taken from:
http://www.uaestatistics.gov.ae/EnglishHome/ReportDetailsEnglish/tabid/121/Default.aspx?ItemId=1868&PTID=104&MenuId=1
Date of access: November 2014.
|
Emiratis |
Non-Emiratis |
Total |
| Age Groups |
Males |
Females |
Total |
Males |
Females |
Total |
Males |
Females |
Total |
| 0 – 4 |
18,646 |
18,279 |
36,925 |
15,652 |
14,717 |
30,369 |
34,298 |
32,996 |
67,294 |
| 5 – 9 |
15,942 |
15,646 |
31,588 |
11,339 |
9,958 |
21,297 |
27,281 |
25,604 |
52,885 |
| 10 – 14 |
12,132 |
10,772 |
22,904 |
8,369 |
5,778 |
14,147 |
20,501 |
16,550 |
37,051 |
| 15 – 19 |
9,905 |
8,857 |
18,762 |
16,030 |
5,926 |
21,956 |
25,935 |
14,783 |
40,718 |
| 20 – 24 |
7,405 |
6,363 |
13,768 |
50,158 |
9,266 |
59,424 |
57,563 |
15,629 |
73,192 |
| 25 – 29 |
6,605 |
6,473 |
13,078 |
64,718 |
10,531 |
75,249 |
71,323 |
17,004 |
88,327 |
| 30 – 34 |
5,078 |
4,892 |
9,970 |
43,007 |
6,555 |
49,562 |
48,085 |
11,447 |
59,532 |
| 35 – 39 |
5,686 |
5,647 |
11,333 |
30,887 |
4,473 |
35,360 |
36,573 |
10,120 |
46,693 |
| 40 – 44 |
4,808 |
4,113 |
8,921 |
18,860 |
2,501 |
21,361 |
23,668 |
6,614 |
30,282 |
| 45 – 49 |
4,127 |
3,490 |
7,617 |
10,822 |
1,638 |
12,460 |
14,949 |
5,128 |
20,077 |
| 50 – 54 |
3,958 |
3,473 |
7,431 |
6,172 |
1,391 |
7,563 |
10,130 |
4,864 |
14,994 |
| 55 – 59 |
2,219 |
1,877 |
4,096 |
2,336 |
708 |
3,044 |
4,555 |
2,585 |
7,140 |
| 60 – 64 |
3,308 |
2,419 |
5,727 |
1,496 |
672 |
2,168 |
4,804 |
3,091 |
7,895 |
| 65 – 69 |
2,047 |
1,199 |
3,246 |
519 |
339 |
858 |
2,566 |
1,538 |
4,104 |
| 70 – 74 |
1,652 |
1,460 |
3,112 |
355 |
269 |
624 |
2,007 |
1,729 |
3,736 |
| 75 – 79 |
606 |
544 |
1,150 |
99 |
86 |
185 |
705 |
630 |
1,335 |
| 80 – 84 |
512 |
586 |
1,098 |
101 |
57 |
158 |
613 |
643 |
1,256 |
| 85+ |
366 |
401 |
767 |
48 |
44 |
92 |
414 |
445 |
859 |
| Not Stated |
30 |
21 |
51 |
427 |
39 |
466 |
457 |
60 |
517 |
| Total |
105,032 |
96,512 |
201,544 |
281,395 |
74,948 |
356,343 |
386,427 |
171,460 |
557,887 |
NBS, Ministry of Economy.
ANNEXED NOTE
1. Characteristics of data, definitions and population counting operations in the UAE
The first population census was conducted in 1968 by the Council of Developing Trucial States.
After Independence in 1971, a population census of the Emirate of Abu Dhabi was conducted that same year.
The first general population and establishments census in the UAE was conducted in 1975. It was the first census in the region following scientific standards and international recommendations. The other federal censuses were conducted in 1980, 1985, 1995 and 2005.
Reference day for 1975, 1980, 1985, 1995′ censuses: unknown
Reference day for 2005′ census: 6 December 2005
Implementation method: the census was carried out according to de jure methodology, i.e. counting persons using their usual place of residence
Population of reference: Emirati nationals usually residing in the country+all foreign residents holding a valid residence permit+resident GCC nationals (nationals of other GCC states don’t need a permit to stay in the UAE)
2010′ federal census was eventually cancelled but the Emirates Identity Authority (EIDA), an independent federal authority established in 2004, is currently in charge of recording all UAE residents, national and expatriates in order to set up a Population Register and an ID card program. The process is stil ongoing.
2. Institution which provides data
National Bureau of Statistics (NBS)
3. Data availability
Population statistics are available on NBS’s website:
http://www.uaestatistics.gov.ae/EnglishHome/tabid/96/Default.aspx
http://www.uaestatistics.gov.ae/Home/tabid/38/Default.aspx
Data are classified by subject and statistical publications are available on PDF or Excel format. Population data disagregated by nationality (Emirati/ non-Emirati) are scarce.
2005′ census data is available at:
http://www.uaestatistics.gov.ae/EnglishHome/ReportsByDepartmentEnglish/tabid/104/Default.aspx?MenuId=1&NDId=365
The present data is taken from:
http://www.uaestatistics.gov.ae/EnglishHome/ReportDetailsEnglish/tabid/121/Default.aspx?ItemId=1868&PTID=104&MenuId=1
Date of access: November 2014.
|
Emiratis |
Non-Emiratis |
Total |
| Age Groups |
Males |
Females |
Total |
Males |
Females |
Total |
Males |
Females |
Total |
| 0 – 4 |
31,359 |
30,319 |
61,678 |
39,789 |
37,070 |
76,859 |
71,148 |
67,389 |
138,537 |
| 5 – 9 |
24,727 |
24,015 |
48,742 |
25,049 |
23,062 |
48,111 |
49,776 |
47,077 |
96,853 |
| 10 – 14 |
18,502 |
16,742 |
35,244 |
14,736 |
12,563 |
27,299 |
33,238 |
29,305 |
62,543 |
| 15 – 19 |
15,105 |
13,411 |
28,516 |
16,901 |
11,942 |
28,843 |
32,006 |
25,353 |
57,359 |
| 20 – 24 |
11,112 |
10,797 |
21,909 |
79,984 |
24,407 |
104,391 |
91,096 |
35,204 |
126,300 |
| 25 – 29 |
8,716 |
9,318 |
18,034 |
135,155 |
28,659 |
163,814 |
143,871 |
37,977 |
181,848 |
| 30 – 34 |
6,671 |
6,533 |
13,204 |
105,945 |
18,739 |
124,684 |
112,616 |
25,272 |
137,888 |
| 35 – 39 |
6,702 |
6,873 |
13,575 |
67,731 |
10,851 |
78,582 |
74,433 |
17,724 |
92,157 |
| 40 – 44 |
6,061 |
5,087 |
11,148 |
42,268 |
5,787 |
48,055 |
48,329 |
10,874 |
59,203 |
| 45 – 49 |
5,518 |
4,427 |
9,945 |
22,405 |
3,329 |
25,734 |
27,923 |
7,756 |
35,679 |
| 50 – 54 |
4,917 |
3,778 |
8,695 |
11,223 |
2,441 |
13,664 |
16,140 |
6,219 |
22,359 |
| 55 – 59 |
2,733 |
2,077 |
4,810 |
4,381 |
1,250 |
5,631 |
7,114 |
3,327 |
10,441 |
| 60 – 64 |
2,711 |
2,227 |
4,938 |
1,988 |
962 |
2,950 |
4,699 |
3,189 |
7,888 |
| 65 – 69 |
2,362 |
1,540 |
3,902 |
805 |
619 |
1,424 |
3,167 |
2,159 |
5,326 |
| 70 – 74 |
1,821 |
1,357 |
3,178 |
399 |
405 |
804 |
2,220 |
1,762 |
3,982 |
| 75 – 79 |
664 |
501 |
1,165 |
171 |
164 |
335 |
835 |
665 |
1,500 |
| 80 – 84 |
508 |
558 |
1,066 |
96 |
99 |
195 |
604 |
657 |
1,261 |
| 85+ |
380 |
408 |
788 |
77 |
63 |
140 |
457 |
471 |
928 |
| Not Stated |
4 |
3 |
7 |
36 |
4 |
40 |
40 |
7 |
47 |
| Total |
150,573 |
139,971 |
290,544 |
569,139 |
182,416 |
751,555 |
719,712 |
322,387 |
1,042,099 |
Source: Ministry of Economy.
ANNEXED NOTE
1. Characteristics of data, definitions and population counting operations in the UAE
The first population census was conducted in 1968 by the Council of Developing Trucial States.
After Independence in 1971, a population census of the Emirate of Abu Dhabi was conducted that same year.
The first general population and establishments census in the UAE was conducted in 1975. It was the first census in the region following scientific standards and international recommendations. The other federal censuses were conducted in 1980, 1985, 1995 and 2005.
Reference day for 1975, 1980, 1985, 1995′ censuses: unknown
Reference day for 2005′ census: 6 December 2005
Implementation method: the census was carried out according to de jure methodology, i.e. counting persons using their usual place of residence
Population of reference: Emirati nationals usually residing in the country+all foreign residents holding a valid residence permit+resident GCC nationals (nationals of other GCC states don’t need a permit to stay in the UAE)
2010′ federal census was eventually cancelled but the Emirates Identity Authority (EIDA), an independent federal authority established in 2004, is currently in charge of recording all UAE residents, national and expatriates in order to set up a Population Register and an ID card program. The process is stil ongoing.
2. Institution which provides data
National Bureau of Statistics (NBS)
3. Data availability
Population statistics are available on NBS’s website:
http://www.uaestatistics.gov.ae/EnglishHome/tabid/96/Default.aspx
http://www.uaestatistics.gov.ae/Home/tabid/38/Default.aspx
Data are classified by subject and statistical publications are available on PDF or Excel format. Population data disagregated by nationality (Emirati/ non-Emirati) are scarce.
2005′ census data is available at:
http://www.uaestatistics.gov.ae/EnglishHome/ReportsByDepartmentEnglish/tabid/104/Default.aspx?MenuId=1&NDId=365
The present data is taken from:
http://www.uaestatistics.gov.ae/EnglishHome/ReportDetailsEnglish/tabid/121/Default.aspx?ItemId=1868&PTID=104&MenuId=1
Date of access: November 2014.
|
2003 |
2010 |
|
Omanis |
Expatriates |
Omanis |
Expatriates |
| Muscat Governorate |
53,630 |
46,602 |
62,299 |
58,693 |
| Al Batinah Region |
66,882 |
22,543 |
76,539 |
29,360 |
| Musandam Governorate |
3,079 |
1,462 |
3,216 |
1,493 |
| *Adh Dhahirah Region |
17,312 |
12,302 |
14,386 |
5,593 |
| Ad Dakhliyah Region |
29,393 |
7,188 |
34,619 |
9,502 |
| Ash Sharqiyah Region |
36,928 |
10,073 |
42,500 |
12,249 |
| Al Wusta Region |
2,284 |
694 |
2,696 |
1,264 |
| Dhofar Governorate |
16,056 |
11,151 |
17,926 |
15,074 |
| *Al Buraymi Governorate |
na |
na |
5,939 |
5,926 |
| Sultanate |
225,564 |
112,015 |
260,120 |
139,154 |
Source: Ministry of National Economy
ANNEXED NOTE
1. Technical Notes and Definitions
* Al Buraymi Governorate was institued in 2008 separate from Adh Dhahirah Region.
The table refers to the population recorded during census 2010.
The Ministry of National Economy of Oman has conducted three censuses in 1993, 2003 and 2010.
The date of reference for census 2003 is the night of December 7 to 8, 2003.
The date of reference for census 2010 is the night of December 12 to 13, 2010. Period of implemention: December 12 to 21, 2010. The Sultanate uses the de jure and the de facto approach in the enumeration.
For information on technical means and definitions of categories used in Oman’s censuses, please see:
http://www.omaninfo.com/people-and-society/oman-s-2003-census.asp
http://unstats.un.org/unsd/demographic/meetings/Conferences/Korea/2012/docs/s07-5-1-Oman.pdf
A household is defined as “an individual or a group of individuals, blood-related or not blood-related, who together occupy a housing unit and share living equipments, and who were staying under the same roof the census’ night of reference”.
(Definition taken from Census 2010′ Book n°10 (Housing and Household)).
2. Institution which provides data
National Center for Statistics and Information (NCSI)
3. Data availability
The National Center for Statistics and Information (NCSI) processes and disseminates all statistical data of use to the public and to government action.
1993′ and 2003’s census results are not available online. However, they are quoted in recent publications released by NCSI (Annual Statistical Yearbooks, survey results, studies).
2010’s census results are available in PDF format in the “publications” section of NCSI’s website, in several thematic publications.
http://www.ncsi.gov.om/NCSI_website/N_publications_ar.aspx
http://www.ncsi.gov.om/NCSI_website/N_publications.aspx
The present data was retrieved from the “Final results” volume of 2010′ census publication, available at:
http://www.ncsi.gov.om/NCSI_website/documents/Census_2010.pdf
|
Omanis |
Expatriates |
|
never married |
married |
divorced |
widowed |
Total |
never married |
married |
divorced |
widowed |
Total |
| Muscat |
120,959 |
137,652 |
5,747 |
9,305 |
273,663 |
74,357 |
243,853 |
3,247 |
3,247 |
324,705 |
| Dhofar |
50,058 |
52,030 |
3,396 |
4,162 |
109,647 |
19,564 |
55,495 |
533 |
533 |
76,125 |
| Musandam |
7,001 |
7,303 |
151 |
650 |
15,106 |
2,386 |
5,860 |
67 |
110 |
8,424 |
| Al – Buraymi |
13,221 |
13,529 |
447 |
755 |
27,952 |
6,662 |
17,724 |
224 |
249 |
24,858 |
| Ad -Dakhliyah |
70,778 |
87,344 |
2,343 |
7,028 |
167,492 |
14,537 |
38,730 |
54 |
488 |
53,809 |
| Al – Batinah North |
115,699 |
124,560 |
3,291 |
9,620 |
253,171 |
23,868 |
63,588 |
802 |
712 |
88,970 |
| Al-Batinah South |
68,035 |
73,418 |
2,093 |
5,981 |
149,528 |
12,698 |
37,381 |
459 |
459 |
50,997 |
| Ash – Sharqiyah North |
40,659 |
49,082 |
3,001 |
4,066 |
96,808 |
7,636 |
19,849 |
309 |
309 |
28,103 |
| Ash – Sharqiyah South |
35,394 |
42,439 |
2,265 |
3,774 |
83,872 |
7,559 |
16,596 |
271 |
197 |
24,623 |
| Adh-Dhahira |
35,894 |
37,996 |
856 |
3,192 |
77,939 |
7,728 |
22,998 |
249 |
187 |
31,162 |
| Al – Wusta |
4,766 |
6,040 |
507 |
484 |
11,797 |
5,341 |
17,228 |
91 |
68 |
22,728 |
| Total |
562,466 |
631,394 |
24,098 |
49,017 |
1,266,975 |
182,338 |
539,301 |
6,306 |
6,559 |
734,504 |
Source: Ministry of National Economy
ANNEXED NOTE
1. Technical Notes and Definitions
The table refers to the population recorded during census 2010.
The Ministry of National Economy of Oman has conducted three censuses in 1993, 2003 and 2010.
The date of reference for census 2010 is December 12, 2010. Period of implemention: December 12 to 21, 2010. The Sultanate uses the de jure and the de facto approach in the enumeration.
For information on technical means used in Oman’s censuses, please see:
http://unstats.un.org/unsd/demographic/meetings/Conferences/Korea/2012/docs/s07-5-1-Oman.pdf
Some minor discrepancies in totals between tables may occur, due to recalculation of data which is presented as percentages in the original source.
2. Institution which provides data
National Center for Statistics and Information (NCSI)
3. Data availability
The National Center for Statistics and Information (NCSI) processes and disseminates all statistical data of use to the public and to government action.
1993′ and 2003’s census results are not available online. However, they are quoted in recent publications released by NCSI (Annual Statistical Yearbooks, survey results, studies).
2010’s census results are available on NCSI’s website, in several thematic publications, in the “publications” section
http://www.ncsi.gov.om/NCSI_website/N_publications_ar.aspx
http://www.ncsi.gov.om/NCSI_website/N_publications.aspx
The present results have been retrieved from “Oman’s Demographic and Social Atlas” published November 2013. The Atlas maps a selection of 2010′ census results by region (governorates, or mohafazat) and subregion (wilaya).
Data tabulated in the Atlas are presented as percentages. Data presented here were recalculated from these percentages.
http://www.ncsi.gov.om/NCSI_website/publicationattachment/national%20center%20text%20ctp.pdf
Last date of access: October 2014.
|
Omanis |
Expatriates |
|
Illiterate |
Reads and writes |
Diploma below University |
Bachelor and above |
Total |
Illiterate |
Reads and writes |
Diploma below University |
Bachelor and above |
Total |
| Muscat |
25,451 |
14,778 |
175,692 |
57,743 |
273,663 |
24,353 |
66,889 |
149,040 |
84,423 |
324,705 |
| Dhofar |
12,378 |
8,544 |
73,609 |
14,897 |
109,537 |
6,623 |
23,599 |
33,876 |
12,028 |
76,125 |
| Musandam |
3,251 |
862 |
9,330 |
1,678 |
15,121 |
1,256 |
1,771 |
4,250 |
1,155 |
8,432 |
| Al – Buraymi |
3,242 |
1,733 |
19,231 |
3,774 |
27,952 |
5,245 |
7,532 |
8,352 |
3,729 |
24,858 |
| Ad -Dakhliyah |
25,099 |
13,051 |
106,586 |
22,756 |
167,325 |
7,214 |
16,924 |
24,084 |
5,967 |
54,189 |
| Al – Batinah North |
38,482 |
16,203 |
169,878 |
28,608 |
253,171 |
15,051 |
29,835 |
33,486 |
10,687 |
89,059 |
| Al-Batinah South |
22,429 |
11,065 |
100,034 |
15,850 |
149,528 |
8,109 |
17,339 |
21,215 |
4,335 |
50,997 |
| Ash – Sharqiyah North |
17,813 |
7,745 |
60,021 |
11,327 |
96,808 |
4,071 |
11,118 |
10,163 |
2,695 |
28,047 |
| Ash – Sharqiyah South |
15,516 |
8,219 |
50,659 |
9,478 |
83,872 |
4,211 |
7,978 |
10,145 |
2,290 |
24,623 |
| Adh-Dhahira |
10,901 |
5,528 |
50,610 |
10,745 |
77,861 |
4,020 |
10,377 |
13,774 |
2,992 |
31,162 |
| Al – Wusta |
4,212 |
1,522 |
5,568 |
495 |
11,797 |
2,364 |
5,387 |
12,250 |
2,727 |
22,728 |
| Total |
178,773 |
89,250 |
821,217 |
177,351 |
1,266,635 |
82,516 |
198,747 |
320,634 |
133,028 |
734,925 |
Source: Ministry of National Economy
ANNEXED NOTE
1. Technical Notes and Definitions
The table refers to the population recorded during census 2010.
The Ministry of National Economy of Oman has conducted three censuses in 1993, 2003 and 2010.
The date of reference for census 2010 is December 12, 2010. Period of implemention: December 12 to 21, 2010. The Sultanate uses the de jure and the de facto approach in the enumeration.
For information on technical means used in Oman’s censuses, please see:
http://unstats.un.org/unsd/demographic/meetings/Conferences/Korea/2012/docs/s07-5-1-Oman.pdf
Some minor discrepancies in totals between tables may occur, due to recalculation of data presented as percentages in the source used.
2. Institution which provides data
National Center for Statistics and Information (NCSI)
3. Data availability
The National Center for Statistics and Information (NCSI) processes and disseminates all statistical data of use to the public and to government action.
1993′ and 2003’s census results are not available online. However, they are quoted in recent publications released by NCSI (Annual Statistical Yearbooks, survey results, studies).
2010’s census results are available on NCSI’s website, in several thematic publications, in the “publications” section
http://www.ncsi.gov.om/NCSI_website/N_publications_ar.aspx
http://www.ncsi.gov.om/NCSI_website/N_publications.aspx
The present results have been retrieved from “Oman’s Demographic and Social Atlas” published November 2013. The Atlas maps a selection of 2010′ census results by region (governorates, or mohafazat) and subregion (wilaya).
Data tabulated in the Atlas are presented as percentages. Data presented here were recalculated from these percentages.
http://www.ncsi.gov.om/NCSI_website/publicationattachment/national%20center%20text%20ctp.pdf
Last date of access: October 2014.
|
Muscat |
Al-Batinah |
Musandam |
Adh – Dhahirah |
Ad -Dakhliyah |
Ash – Sharqiyah |
Al – Wusta |
Dhofar |
Al-Buraymi |
Total
Total |
|
Males |
Females |
Males |
Females |
Males |
Females |
Males |
Females |
Males |
Females |
Males |
Females |
Males |
Females |
Males |
Females |
Males |
Females |
Males |
Females |
Total |
| 0 – 4 |
26,338 |
25,356 |
42,282 |
40,969 |
1,356 |
1,285 |
7,726 |
7,411 |
20,239 |
19,046 |
21,795 |
21,093 |
1,332 |
1,254 |
10,565 |
9,882 |
2,908 |
2,692 |
134,541 |
128,988 |
263,529 |
| 5 – 9 |
21,484 |
20,732 |
33,073 |
32,164 |
1,034 |
1,042 |
6,512 |
6,196 |
16,272 |
15,930 |
17,965 |
17,440 |
1,180 |
1,101 |
8,798 |
8,230 |
2,419 |
2,289 |
108,737 |
105,124 |
213,861 |
| 10 – 14 |
20,133 |
19,300 |
35,541 |
34,222 |
1,071 |
989 |
6,642 |
6,529 |
15,545 |
14,712 |
17,631 |
16,790 |
1,223 |
1,156 |
8,780 |
8,281 |
2,423 |
2,343 |
108,989 |
104,322 |
213,311 |
| 15 – 19 |
23,968 |
21,946 |
42,341 |
40,709 |
1,325 |
1,223 |
7,792 |
7,221 |
17,012 |
16,743 |
18,751 |
17,946 |
1,303 |
1,266 |
9,777 |
9,225 |
2,855 |
2,545 |
125,124 |
118,824 |
243,948 |
| 20 – 24 |
27,340 |
23,741 |
40,360 |
38,439 |
1,418 |
1,320 |
7,178 |
6,924 |
15,672 |
16,265 |
16,420 |
16,693 |
1,229 |
1,213 |
10,717 |
10,126 |
2,887 |
2,550 |
123,221 |
117,271 |
240,492 |
| 25 – 29 |
22,989 |
21,598 |
33,033 |
32,682 |
1,401 |
1,243 |
6,357 |
6,460 |
13,168 |
13,667 |
13,622 |
14,424 |
891 |
837 |
9,607 |
9,504 |
2,434 |
2,264 |
103,502 |
102,679 |
206,181 |
| 30 – 34 |
18,128 |
17,381 |
22,982 |
23,246 |
988 |
861 |
4,606 |
5,057 |
9,950 |
10,361 |
9,889 |
10,788 |
502 |
520 |
7,248 |
6,824 |
1,812 |
1,699 |
76,105 |
76,737 |
152,842 |
| 35 – 39 |
13,081 |
12,663 |
15,226 |
14,901 |
563 |
548 |
3,059 |
3,002 |
6,812 |
6,479 |
6,654 |
7,110 |
344 |
383 |
4,499 |
3,928 |
1,127 |
1,054 |
51,365 |
50,068 |
101,433 |
| 40 – 44 |
9,953 |
9,551 |
10,444 |
10,535 |
425 |
368 |
2,187 |
2,125 |
4,223 |
4,584 |
4,941 |
5,128 |
337 |
359 |
3,137 |
3,067 |
900 |
750 |
36,547 |
36,467 |
73,014 |
| 45 – 49 |
7,838 |
7,230 |
8,342 |
9,120 |
317 |
302 |
1,600 |
1,533 |
3,483 |
3,933 |
3,931 |
4,369 |
255 |
266 |
2,834 |
2,689 |
626 |
640 |
29,226 |
30,082 |
59,308 |
| 50 – 54 |
5,805 |
5,785 |
7,304 |
8,679 |
287 |
314 |
1,499 |
1,796 |
2,880 |
3,481 |
3,397 |
4,138 |
264 |
249 |
2,589 |
2,528 |
555 |
569 |
24,580 |
27,539 |
52,119 |
| 55 – 59 |
3,752 |
3,836 |
5,120 |
6,025 |
295 |
291 |
1,095 |
1,222 |
2,209 |
2,499 |
2,518 |
2,971 |
198 |
151 |
1,523 |
1,592 |
466 |
390 |
17,176 |
18,977 |
36,153 |
| 60 – 64 |
3,141 |
2,993 |
5,159 |
4,997 |
290 |
251 |
1,034 |
1,170 |
2,229 |
2,287 |
2,593 |
2,618 |
201 |
173 |
1,336 |
1,348 |
362 |
282 |
16,345 |
16,119 |
32,464 |
| 65 – 69 |
1,960 |
2,013 |
3,800 |
3,544 |
246 |
171 |
788 |
833 |
1,567 |
1,465 |
1,911 |
1,760 |
157 |
105 |
1,019 |
963 |
231 |
196 |
11,679 |
11,050 |
22,729 |
| 70 – 74 |
1,646 |
1,710 |
3,861 |
3,068 |
200 |
133 |
794 |
701 |
1,518 |
1,270 |
2,082 |
1,624 |
167 |
105 |
755 |
829 |
197 |
160 |
11,220 |
9,600 |
20,820 |
| 75 – 79 |
754 |
865 |
2,044 |
1,576 |
99 |
80 |
378 |
365 |
725 |
686 |
933 |
762 |
63 |
49 |
354 |
416 |
92 |
86 |
5,442 |
4,885 |
10,327 |
| 80 – 84 |
439 |
700 |
1,405 |
1,364 |
60 |
41 |
255 |
318 |
535 |
631 |
725 |
731 |
68 |
59 |
251 |
344 |
68 |
52 |
3,806 |
4,240 |
8,046 |
| 85+ |
313 |
544 |
1,087 |
1,306 |
33 |
28 |
214 |
298 |
409 |
582 |
605 |
646 |
39 |
44 |
232 |
276 |
53 |
50 |
2,985 |
3,774 |
6,759 |
| Total |
209,062 |
197,944 |
313,404 |
307,546 |
11,408 |
10,490 |
59,716 |
59,161 |
134,448 |
134,621 |
146,363 |
147,031 |
9,753 |
9,290 |
84,021 |
80,052 |
22,415 |
20,611 |
990,590 |
966,746 |
1,957,336 |
Source: Ministry of National Economy
ANNEXED NOTE
1. Technical Notes and Definitions
The table refers to the population recorded during census 2010.
The Ministry of National Economy of Oman has conducted three censuses in 1993, 2003 and 2010.
The date of reference for census 2010 is December 12, 2010. Period of implemention: December 12 to 21, 2010. The Sultanate uses the de jure and the de facto approach in the enumeration.
For information on technical means used in Oman’s censuses, please see:
http://unstats.un.org/unsd/demographic/meetings/Conferences/Korea/2012/docs/s07-5-1-Oman.pdf
2. Institution which provides data
National Center for Statistics and Information (NCSI)
3. Data availability
The National Center for Statistics and Information (NCSI) processes and disseminates all statistical data of use to the public and to government action.
1993′ and 2003’s census results are not available online. However, they are quoted in recent publications released by NCSI (Annual Statistical Yearbooks, survey results, studies).
2010’s census results are available on NCSI’s website, in several thematic publications, in the “publications” section
http://www.ncsi.gov.om/NCSI_website/N_publications_ar.aspx
http://www.ncsi.gov.om/NCSI_website/N_publications.aspx
The present data is published in 2011′ Statistical Yearbook, available online on NSCI’s website. Each thematic section is presented in PDF format.
The “population” section is available at:
http://www.ncsi.gov.om/NCSI_website/book/SYB2011/2-population.pdf
Date of access: October 2014.
| |
Omanis |
Expatriates |
Total |
| Muscat Governorate |
381,612 |
250,461 |
632,073 |
| Al Batinah Region |
564,407 |
89,098 |
653,505 |
| Musandam Governorate |
20,324 |
8,054 |
28,378 |
| Adh Dhahirah Region |
147,689 |
59,326 |
207,015 |
| Ad Dakhliyah Region |
235,337 |
31,803 |
267,140 |
| Ash Sharqiyah Region |
264,369 |
49,392 |
313,761 |
| Al Wusta Region |
16,861 |
6,122 |
22,983 |
| Dhofar Governorate |
150,959 |
65,001 |
215,960 |
| Total |
1,781,558 |
559,257 |
2,340,815 |
Source: Ministry of National Economy
ANNEXED NOTE
1. Technical Notes and Definitions
The table refers to the population recorded during census 2003.
The Ministry of National Economy of Oman has conducted three censuses in 1993, 2003 and 2010.
The date of reference for census 2003 is the night of December 7-8, 2003.
For information on technical means and definitions of categories used in Oman’s censuses, please see:
http://www.omaninfo.com/people-and-society/oman-s-2003-census.asp
http://unstats.un.org/unsd/demographic/meetings/Conferences/Korea/2012/docs/s07-5-1-Oman.pdf
2. Institution which provides data
National Center for Statistics and Information (NCSI)
3. Data availability
The National Center for Statistics and Information (NCSI) processes and disseminates all statistical data of use to the public and to government action.
1993′ and 2003’s census results are not available online. However, they are quoted in recent publications released by NCSI (Annual Statistical Yearbooks, survey results, studies).
2010’s census results are available in PDF format in the “publications” section of NCSI’s website, in several thematic publications.
http://www.ncsi.gov.om/NCSI_website/N_publications_ar.aspx
http://www.ncsi.gov.om/NCSI_website/N_publications.aspx
The present data was retrieved from the “Final results” volume of 2010′ census publication, available at:
http://www.ncsi.gov.om/NCSI_website/documents/Census_2010.pdf
Last date of access: October 2014.
|
Omanis |
Expatriates |
Total |
| Never married |
562,466 |
182,338 |
744,804 |
| Married |
631,394 |
539,301 |
1,170,695 |
| Divorced |
24,098 |
6,306 |
30,403 |
| Widowed |
49,017 |
6,559 |
55,576 |
| Total |
1,266,975 |
734,504 |
2,001,478 |
Source: Ministry of National Economy
ANNEXED NOTE
1. Technical Notes and Definitions
The table refers to the population recorded during census 2010.
The Ministry of National Economy of Oman has conducted three censuses in 1993, 2003 and 2010.
The date of reference for census 2010 is December 12, 2010. Period of implemention: December 12 to 21, 2010. The Sultanate uses the de jure and the de facto approach in the enumeration.
For information on technical means used in Oman’s censuses, please see:
http://unstats.un.org/unsd/demographic/meetings/Conferences/Korea/2012/docs/s07-5-1-Oman.pdf
Some minor discrepancies in totals between tables may occur, due to recalculation of data which is presented as percentages in the original source.
2. Institution which provides data
National Center for Statistics and Information (NCSI)
3. Data availability
The National Center for Statistics and Information (NCSI) processes and disseminates all statistical data of use to the public and to government action.
1993′ and 2003’s census results are not available online. However, they are quoted in recent publications released by NCSI (Annual Statistical Yearbooks, survey results, studies).
2010’s census results are available on NCSI’s website, in several thematic publications, in the “publications” section
http://www.ncsi.gov.om/NCSI_website/N_publications_ar.aspx
http://www.ncsi.gov.om/NCSI_website/N_publications.aspx
The present results have been retrieved from “Oman’s Demographic and Social Atlas” published November 2013. The Atlas maps a selection of 2010′ census results by region (governorates, or mohafazat) and subregion (wilaya).
Data tabulated in the Atlas are presented as percentages. Data presented here were recalculated from these percentages.
http://www.ncsi.gov.om/NCSI_website/publicationattachment/national%20center%20text%20ctp.pdf
Last date of access: October 2014.
|
Omanis |
Expatriates |
Total |
| Illiterate |
178,773 |
82,516 |
261,289 |
| Reads and writes |
89,250 |
198,747 |
287,997 |
| Diploma below University |
821,217 |
320,634 |
1,141,851 |
| Bachelor and above |
177,351 |
133,028 |
310,378 |
| Total |
1,266,635 |
734,925 |
2,001,560 |
Source: Ministry of National Economy
ANNEXED NOTE
1. Technical Notes and Definitions
The table refers to the population recorded during census 2010.
The Ministry of National Economy of Oman has conducted three censuses in 1993, 2003 and 2010.
The date of reference for census 2010 is December 12, 2010. Period of implemention: December 12 to 21, 2010. The Sultanate uses the de jure and the de facto approach in the enumeration.
For information on technical means used in Oman’s censuses, please see:
http://unstats.un.org/unsd/demographic/meetings/Conferences/Korea/2012/docs/s07-5-1-Oman.pdf
Some minor discrepancies in totals between tables may occur, due to recalculation of data presented as percentages in the source used.
2. Institution which provides data
National Center for Statistics and Information (NCSI)
3. Data availability
The National Center for Statistics and Information (NCSI) processes and disseminates all statistical data of use to the public and to government action.
1993′ and 2003’s census results are not available online. However, they are quoted in recent publications released by NCSI (Annual Statistical Yearbooks, survey results, studies).
2010’s census results are available on NCSI’s website, in several thematic publications, in the “publications” section
http://www.ncsi.gov.om/NCSI_website/N_publications_ar.aspx
http://www.ncsi.gov.om/NCSI_website/N_publications.aspx
The present results have been retrieved from “Oman’s Demographic and Social Atlas” published November 2013. The Atlas maps a selection of 2010′ census results by region (governorates, or mohafazat) and subregion (wilaya).
Data tabulated in the Atlas are presented as percentages. Data presented here were recalculated from these percentages.
http://www.ncsi.gov.om/NCSI_website/publicationattachment/national%20center%20text%20ctp.pdf
Last date of access: October 2014.
|
Omanis |
Expatriates |
Total |
|
males |
females |
total |
males |
females |
total |
males |
females |
total |
| 0 – 4 |
148,368 |
143,073 |
291,441 |
16,038 |
15,362 |
31,400 |
164,406 |
158,435 |
322,841 |
| 5 – 9 |
114,540 |
110,523 |
225,063 |
17,929 |
16,712 |
34,641 |
132,469 |
127,235 |
259,704 |
| 10 – 14 |
96,711 |
91,941 |
188,652 |
14,576 |
13,360 |
27,936 |
111,287 |
105,301 |
216,588 |
| 15 – 19 |
118,754 |
111,452 |
230,206 |
9,557 |
8,423 |
17,980 |
128,311 |
119,875 |
248,186 |
| 20 – 24 |
126,158 |
121,668 |
247,826 |
136,043 |
25,817 |
161,860 |
262,201 |
147,485 |
409,686 |
| 25 – 29 |
115,848 |
112,934 |
228,782 |
322,785 |
47,838 |
370,623 |
438,633 |
160,772 |
599,405 |
| 30 – 34 |
90,210 |
89,228 |
179,438 |
244,894 |
42,013 |
286,907 |
335,104 |
131,241 |
466,345 |
| 35 – 39 |
61,793 |
59,876 |
121,669 |
172,550 |
36,436 |
208,986 |
234,343 |
96,312 |
330,655 |
| 40 – 44 |
42,124 |
39,785 |
81,909 |
135,047 |
23,516 |
158,563 |
177,171 |
63,301 |
240,472 |
| 45 – 49 |
32,906 |
33,021 |
65,927 |
89,668 |
14,220 |
103,888 |
122,574 |
47,241 |
169,815 |
| 50 – 54 |
28,884 |
30,846 |
59,730 |
61,033 |
8,756 |
69,789 |
89,917 |
39,602 |
129,519 |
| 55 – 59 |
20,744 |
24,068 |
44,812 |
35,704 |
4,312 |
40,016 |
56,448 |
28,380 |
84,828 |
| 60 – 64 |
17,732 |
18,666 |
36,398 |
10,606 |
1,963 |
12,569 |
28,338 |
20,629 |
48,967 |
| 65 – 69 |
14,804 |
14,653 |
29,457 |
2,395 |
908 |
3,303 |
17,199 |
15,561 |
32,760 |
| 70 – 74 |
13,342 |
11,951 |
25,293 |
583 |
488 |
1,071 |
13,925 |
12,439 |
26,364 |
| 75 – 79 |
9,238 |
7,085 |
16,323 |
237 |
288 |
525 |
9,475 |
7,373 |
16,848 |
| 80 and above |
10,758 |
8853 |
19,611 |
124 |
260 |
384 |
10,882 |
9,113 |
19,995 |
| non stated |
4 |
19 |
23 |
|
|
|
4 |
19 |
23 |
| Total |
1,062,918 |
1,029,642 |
2,092,560 |
1,269,769 |
260,672 |
1,530,441 |
2,332,687 |
1,290,314 |
3,623,001 |
Source: General Directorate of Civil Status
ANNEXED NOTE
1. Technical Notes and Definitions
The table refers to the population registered in the Sultanate as of mid-2014.
The civil status system in Oman was created by Royal Decree No. 66/99, which established the General Directorate of Civil Status as part of the Royal Oman Police.
This civil database served as a basis for creating a comprehensive civil register (National Registration System (NRS)), an integrated computer system linking all 12 civil status directorates throughout the Sultanate and maintained by the D.G of civil Status.
The DGCS is entrusted with the following responsibilities:
1- Registration of births, deaths, marriages, divorces of Omani nationals
2- Registration of births and deaths of resident expatriates; registration of foreign marriages and divorces if one party is a Omani national
3- Issuance of birth and death certificates; as well as identity cards for Omanis and residence cards to foreign residents
4- Assessment of documents provided by Omani nationals requesting to marry a foreign national and certification of such marriages
5- Assessment of documents provided by applicants to recognition and restoration of Omani citizenship, as well as to naturalisation.
The National Registration System thus includes data on births, deaths, marriages and divorces in the Sultanate. It also includes data on identity cards for Omanis and residence cards for residents.
Registration in the civil register is mandatory for Omanis and residents of the Sultanate. The civil register records the name, gender, age, marital status, nationality, address, telephone numbers, civil number, educational level and occupation.
http://www.civilstatus.gov.om/english/system.asp#register
http://www.civilstatus.gov.om/download.asp?filename=stats2004-2009.pdf
2. Institution which provides data
National Center for Statistics and Information (NCSI)
3. Data availability
The National Center for Statistics and Information (NCSI) processes and disseminates all statistical data of use to the public and to government action.
The present data is published in 2013′ Statistical Yearbook, available online on NSCI’s website. Each thematic section is presented in PDF format.
The “population” section is available at:
http://www.ncsi.gov.om/NCSI_Website/book/SYB2013/2-population.pdf
Date of access: October 2014.
|
Omanis |
Expatriates |
Total |
| |
males |
females |
total |
males |
females |
total |
males |
females |
total |
| 0 – 4 |
134,541 |
128,988 |
263,529 |
16,130 |
15,486 |
31,616 |
150,671 |
144,474 |
295,145 |
| 5 – 9 |
108,737 |
105,124 |
213,861 |
14,625 |
13,509 |
28,134 |
123,362 |
118,633 |
241,995 |
| 10 – 14 |
108,989 |
104,322 |
213,311 |
11,329 |
10,057 |
21,386 |
120,318 |
114,379 |
234,697 |
| 15 – 19 |
125,124 |
118,824 |
243,948 |
7,282 |
6,392 |
13,674 |
132,406 |
125,216 |
257,622 |
| 20 – 24 |
123,221 |
117,271 |
240,492 |
66,738 |
16,165 |
82,903 |
189,959 |
133,436 |
323,395 |
| 25 – 29 |
103,502 |
102,679 |
206,181 |
137,291 |
29,462 |
166,753 |
240,793 |
132,141 |
372,934 |
| 30 – 34 |
76,105 |
76,737 |
152,842 |
108,729 |
32,241 |
140,970 |
184,834 |
108,978 |
293,812 |
| 35 – 39 |
51,365 |
50,068 |
101,433 |
89,294 |
27,808 |
117,102 |
140,659 |
77,876 |
218,535 |
| 40 – 44 |
36,547 |
36,467 |
73,014 |
69,186 |
18,285 |
87,471 |
105,733 |
54,752 |
160,485 |
| 45 – 49 |
29,226 |
30,082 |
59,308 |
44,602 |
11,108 |
55,710 |
73,828 |
41,190 |
115,018 |
| 50 – 54 |
24,580 |
27,539 |
52,119 |
32,554 |
6,634 |
39,188 |
57,134 |
34,173 |
91,307 |
| 55 – 59 |
17,176 |
18,977 |
36,153 |
15,448 |
3,312 |
18,760 |
32,624 |
22,289 |
54,913 |
| 60 – 64 |
16,345 |
16,119 |
32,464 |
5,532 |
1,812 |
7,344 |
21,877 |
17,931 |
39,808 |
| 65 – 69 |
11,679 |
11,050 |
22,729 |
1,651 |
899 |
2,550 |
13,330 |
11,949 |
25,279 |
| 70 – 74 |
11,220 |
9,600 |
20,820 |
753 |
558 |
1,311 |
11,973 |
10,158 |
22,131 |
| 75 – 79 |
5,442 |
4,885 |
10,327 |
310 |
309 |
619 |
5,752 |
5,194 |
10,946 |
| 80 and above |
6,791 |
8,014 |
14,805 |
364 |
288 |
652 |
7,155 |
8,302 |
15,457 |
| Total |
990,590 |
966,746 |
1,957,336 |
621,818 |
194,325 |
816,143 |
1,612,408 |
1,161,071 |
2,773,479 |
Source: Ministry of National Economy
ANNEXED NOTE
1. Technical Notes and Definitions
The table refers to the population recorded during census 2010.
The Ministry of National Economy of Oman has conducted three censuses in 1993, 2003 and 2010.
The date of reference for census 2010 is December 12, 2010. Period of implemention: December 12 to 21, 2010. The Sultanate uses the de jure and the de facto approach in the enumeration.
For information on technical means used in Oman’s censuses, please see:
http://unstats.un.org/unsd/demographic/meetings/Conferences/Korea/2012/docs/s07-5-1-Oman.pdf
2. Institution which provides data
National Center for Statistics and Information (NCSI)
3. Data availability
The National Center for Statistics and Information (NCSI) processes and disseminates all statistical data of use to the public and to government action.
1993′ and 2003’s census results are not available online. However, they are quoted in recent publications released by NCSI (Annual Statistical Yearbooks, survey results, studies).
2010’s census results are available on NCSI’s website, in several thematic publications, in the “publications” section
http://www.ncsi.gov.om/NCSI_website/N_publications_ar.aspx
http://www.ncsi.gov.om/NCSI_website/N_publications.aspx
The present data is published in 2011′ Statistical Yearbook, available online on NSCI’s website. Each thematic section is presented in PDF format.
The “population” section is available at:
http://www.ncsi.gov.om/NCSI_website/book/SYB2011/2-population.pdf
Date of access: October 2014.
|
Males |
Females |
Total |
Sex ratio (males/100 females) |
Growth rates |
| 1970 |
|
|
248,000 |
|
|
| 1971 |
|
|
287,000 |
|
14.6 |
| 1972 |
|
|
332,000 |
|
14.6 |
| 1973 |
|
|
385,000 |
|
14.8 |
| 1974 |
|
|
446,000 |
|
14.7 |
| 1975 |
386,308 |
171,692 |
557,887 |
225 |
22.4 |
| 1976 |
410,691 |
183,309 |
594,000 |
224 |
6.3 |
| 1977 |
467,082 |
205,918 |
673,000 |
227 |
12.5 |
| 1978 |
528,549 |
233,451 |
762,000 |
226 |
12.4 |
| 1979 |
598,852 |
265,148 |
864,000 |
226 |
12.6 |
| 1980 |
719,399 |
322,601 |
1,042,099 |
223 |
18.7 |
| 1981 |
734,315 |
337,685 |
1,072,000 |
217 |
2.8 |
| 1982 |
769,357 |
364,643 |
1,134,000 |
211 |
5.6 |
| 1983 |
803,340 |
395,660 |
1,199,000 |
203 |
5.6 |
| 1984 |
838,322 |
429,678 |
1,268,000 |
195 |
5.6 |
| 1985 |
895,403 |
483,597 |
1,379,303 |
185 |
8.4 |
| 1986 |
922,301 |
495,699 |
1,418,000 |
186 |
2.8 |
| 1987 |
975,952 |
524,048 |
1,500,000 |
186 |
5.6 |
| 1988 |
1,099,145 |
486,855 |
1,586,000 |
226 |
5.6 |
| 1989 |
1,099,623 |
577,377 |
1,677,000 |
190 |
5.6 |
| 1990 |
1,128,176 |
644,824 |
1,773,000 |
175 |
5.6 |
| 1991 |
1,235,294 |
639,706 |
1,875,000 |
193 |
5.6 |
| 1992 |
1,309,301 |
673,699 |
1,983,000 |
194 |
5.6 |
| 1993 |
1,388,310 |
708,690 |
2,097,000 |
196 |
5.6 |
| 1994 |
1,471,992 |
745,008 |
2,217,000 |
198 |
5.6 |
| 1995 |
1,606,777 |
804,223 |
2,411,041 |
200 |
8.4 |
| 1996 |
1,648,327 |
821,673 |
2,470,000 |
201 |
2.4 |
| 1997 |
1,733,239 |
856,761 |
2,590,000 |
202 |
4.7 |
| 1998 |
1,820,126 |
896,874 |
2,717,000 |
203 |
4.8 |
| 1999 |
1,917,870 |
937,130 |
2,855,000 |
205 |
5.0 |
| 2000 |
2,015,515 |
979,485 |
2,995,000 |
206 |
4.8 |
| 2001 |
2,138,132 |
1,028,868 |
3,167,000 |
208 |
5.6 |
| 2002 |
2,263,508 |
1,085,492 |
3,349,000 |
209 |
5.6 |
| 2003 |
2,406,132 |
1,144,868 |
3,551,000 |
210 |
5.9 |
| 2004 |
2,553,060 |
1,207,940 |
3,761,000 |
211 |
5.7 |
| 2005 |
2,805,849 |
1,300,151 |
4,106,427 |
216 |
8.8 |
| 2006 |
3,533,293 |
1,478,707 |
5,012,834 |
239 |
19.9 |
| 2007 |
4,533,277 |
1,685,723 |
6,219,000 |
269 |
21.6 |
| 2008 |
6,040,251 |
2,033,749 |
8,074,000 |
297 |
26.1 |
| 2009 |
6,120,888 |
2,079,112 |
8,200,000 |
294 |
1.5 |
| 2010 |
6,161,768 |
2,102,232 |
8,264,070 |
293 |
1.6 |
Source: National Bureau of Statistics, Ministry of Economy
ANNEXED NOTE
1. Characteristics of data, definitions and population counting operations in the UAE
The estimates by sex were calculated on the basis of agregated population and sex ratios’ times series available since 1975.
The first population census was conducted in 1968 by the Council of Developing Trucial States.
After Independence in 1971, a population census of the Emirate of Abu Dhabi was conducted that same year.
The first general population and establishments census in the UAE was conducted in 1975. It was the first census in the region following scientific standards and international recommendations. The other federal censuses were conducted in 1980, 1985, 1995 and 2005.
Reference day for 2005′ census: 6 December 2005
Implementation method: the census was carried out according to de jure methodology, i.e. counting persons using their usual place of residence
Population of reference: Emirati nationals usually residing in the country+all foreign residents holding a valid residence permit+resident GCC nationals (nationals of other GCC states don’t need a permit to stay in the UAE)
Period of reference for estimates: end of year estimates, except census years (census’ reference period) and 2010: mid-year estimate
2010′ federal census was due to take place in April but finally cancelled. It was only conducted in Abu Dhabi Emirate which includes Al-Ain.
NBS estimated UAE’s resident population (nationals and non-nationals) on the basis of administrative records, using the component method: addition of natural increase and net migration since the last census year (2005).
The net migration was calculated as follows:
Net migration = (residence permits issued for the first time- residence permits that have been cancelled and not renewed)+(arrivals of GCC nationals-departures of GCC nationals), on the basis of Ministry of Interior’s records.
The Emirates Identity Authority (EIDA), an independent federal authority established in 2004, is currently in charge of recording all UAE residents, national and expatriates in order to set up a Population Register and an ID card program. The process is stil ongoing.
2. Institution which provides data
National Bureau of Statistics (NBS)
3. Data availability
Population statistics are available on NBS’s website:
http://www.uaestatistics.gov.ae/EnglishHome/tabid/96/Default.aspx
http://www.uaestatistics.gov.ae/Home/tabid/38/Default.aspx
Data are classified by subject and statistical publications are available on PDF or Excel format. Population data disagregated by nationality (Emirati/ non-Emirati) are scarce.
For population estimates for 2006-2010 and methodology of estimates see:
http://www.uaestatistics.gov.ae/ReportPDF/Population%20Estimates%202006%20-%202010.pdf
Agregated data (total population, 1970-2010) were taken from NBS’s data portal
http://dataportal.nbs.gov.ae/en/
Date of access: November 2014.
| Emirate |
Nationals |
Non-nationals |
Total |
| Males |
Females |
Total |
Males |
Females |
Total |
Males |
Females |
Total |
| Abu Dhabi |
176,926 |
173,351 |
350,277 |
749,893 |
299,314 |
1,049,207 |
926,819 |
472,665 |
1,399,484 |
| Dubai |
68,995 |
68,578 |
137,573 |
920,310 |
263,570 |
1,183,880 |
989,305 |
332,148 |
1,321,453 |
| Al Sharjah |
71,307 |
66,965 |
138,272 |
448,927 |
206,374 |
655,301 |
520,234 |
273,339 |
793,573 |
| Ajman |
20,155 |
19,076 |
39,231 |
111,529 |
56,237 |
167,766 |
131,684 |
75,313 |
206,997 |
| Umm Al – Quwain |
7,914 |
7,959 |
15,873 |
22,170 |
11,116 |
33,286 |
30,084 |
19,075 |
49,159 |
| Ras Al Khaima |
44,299 |
43,549 |
87,848 |
85,143 |
37,072 |
122,215 |
129,442 |
80,621 |
210,063 |
| Al Fujairah |
28,321 |
28,100 |
56,421 |
50,263 |
19,014 |
69,277 |
78,584 |
47,114 |
125,698 |
| Grand Total |
417,917 |
407,578 |
825,495 |
2,388,235 |
892,697 |
3,280,932 |
2,806,152 |
1,300,275 |
4,106,427 |
NBS, Ministry of Economy.
ANNEXED NOTE
1. Characteristics of data, definitions and population counting operations in the UAE
The first population census was conducted in 1968 by the Council of Developing Trucial States.
After Independence in 1971, a population census of the Emirate of Abu Dhabi was conducted that same year.
The first general population and establishments census in the UAE was conducted in 1975. It was the first census in the region following scientific standards and international recommendations. The other federal censuses were conducted in 1980, 1985, 1995 and 2005.
Reference day for 2005′ census: 6 December 2005
Implementation method: the census was carried out according to de jure methodology, i.e. counting persons using their usual place of residence
Population of reference: Emirati nationals usually residing in the country+all foreign residents holding a valid residence permit+resident GCC nationals (nationals of other GCC states don’t need a permit to stay in the UAE)
2010′ federal census was eventually cancelled but the Emirates Identity Authority (EIDA), an independent federal authority established in 2004, is currently in charge of recording all UAE residents, national and expatriates in order to set up a Population Register and an ID card program. The process is stil ongoing.
2. Institution which provides data
National Bureau of Statistics (NBS)
3. Data availability
Population statistics are available on NBS’s website:
http://www.uaestatistics.gov.ae/EnglishHome/tabid/96/Default.aspx
http://www.uaestatistics.gov.ae/Home/tabid/38/Default.aspx
Data are classified by subject and statistical publications are available on PDF or Excel format. Population data disagregated by nationality (Emirati/ non-Emirati) are scarce.
2005′ census data is available at:
http://www.uaestatistics.gov.ae/EnglishHome/ReportsByDepartmentEnglish/tabid/104/Default.aspx?MenuId=1&NDId=365
The present data is taken from:
http://www.uaestatistics.gov.ae/EnglishHome/ReportDetailsEnglish/tabid/121/Default.aspx?ItemId=1869&PTID=104&MenuId=1
Date of access: November 2014.
| Emirate |
Nationals |
Non-nationals |
Total |
| Males |
Females |
Total |
Males |
Females |
Total |
Males |
Females |
Total |
| Abu Dhabi |
113,365 |
109,262 |
222,627 |
537,379 |
182,457 |
719,836 |
650,744 |
291,719 |
942,463 |
| Dubai |
54,330 |
53,411 |
107,741 |
423,879 |
157,800 |
581,679 |
478,209 |
211,211 |
689,420 |
| Al Sharjah |
53,945 |
52,976 |
106,921 |
200,369 |
95,502 |
295,871 |
254,314 |
148,478 |
402,792 |
| Ajman |
14,855 |
13,977 |
28,832 |
57,977 |
34,682 |
92,659 |
72,832 |
48,659 |
121,491 |
| Umm Al – Quwain |
6,464 |
6,568 |
13,032 |
14,483 |
7,846 |
22,329 |
20,947 |
14,414 |
35,361 |
| Ras Al Khaima |
33,556 |
33,820 |
67,376 |
50,436 |
25,522 |
75,958 |
83,992 |
59,342 |
143,334 |
| Al Fujairah |
20,545 |
20,256 |
40,801 |
25,221 |
10,158 |
35,379 |
45,766 |
30,414 |
76,180 |
| Grand Total |
297,060 |
290,270 |
587,330 |
1,309,744 |
513,967 |
1,823,711 |
1,606,804 |
804,237 |
2,411,041 |
NBS, Ministry of Economy.
ANNEXED NOTE
1. Characteristics of data, definitions and population counting operations in the UAE
The first population census was conducted in 1968 by the Council of Developing Trucial States.
After Independence in 1971, a population census of the Emirate of Abu Dhabi was conducted that same year.
The first general population and establishments census in the UAE was conducted in 1975. It was the first census in the region following scientific standards and international recommendations. The other federal censuses were conducted in 1980, 1985, 1995 and 2005.
Reference day for 1975, 1980, 1985, 1995′ censuses: unknown
Reference day for 2005′ census: 6 December 2005
Implementation method: the census was carried out according to de jure methodology, i.e. counting persons using their usual place of residence
Population of reference: Emirati nationals usually residing in the country+all foreign residents holding a valid residence permit+resident GCC nationals (nationals of other GCC states don’t need a permit to stay in the UAE)
2010′ federal census was eventually cancelled but the Emirates Identity Authority (EIDA), an independent federal authority established in 2004, is currently in charge of recording all UAE residents, national and expatriates in order to set up a Population Register and an ID card program. The process is stil ongoing.
2. Institution which provides data
National Bureau of Statistics (NBS)
3. Data availability
Population statistics are available on NBS’s website:
http://www.uaestatistics.gov.ae/EnglishHome/tabid/96/Default.aspx
http://www.uaestatistics.gov.ae/Home/tabid/38/Default.aspx
Data are classified by subject and statistical publications are available on PDF or Excel format. Population data disagregated by nationality (Emirati/ non-Emirati) are scarce.
2005′ census data is available at:
http://www.uaestatistics.gov.ae/EnglishHome/ReportsByDepartmentEnglish/tabid/104/Default.aspx?MenuId=1&NDId=365
The present data is taken from:
http://www.uaestatistics.gov.ae/EnglishHome/ReportDetailsEnglish/tabid/121/Default.aspx?ItemId=1869&PTID=104&MenuId=1
Date of access: November 2014.
| Emirate |
Nationals |
Non-nationals |
Total |
| Males |
Females |
Total |
Males |
Females |
Total |
Males |
Females |
Total |
| Abu Dhabi |
69,975 |
66,007 |
135,982 |
310,278 |
119,776 |
430,054 |
380,253 |
185,783 |
566,036 |
| Dubai |
39,221 |
37,471 |
76,692 |
207,958 |
86,138 |
294,096 |
247,179 |
123,609 |
370,788 |
| Al Sharjah |
40,333 |
39,070 |
79,403 |
101,518 |
47,396 |
148,914 |
141,851 |
86,466 |
228,317 |
| Ajman |
9,827 |
9,426 |
19,253 |
23,008 |
12,285 |
35,293 |
32,835 |
21,711 |
54,546 |
| Umm Al – Quwain |
4,430 |
4,411 |
8,841 |
7,229 |
3,215 |
10,444 |
11,659 |
7,626 |
19,285 |
| Ras Al Khaima |
24,835 |
24,482 |
49,317 |
31,578 |
15,683 |
47,261 |
56,413 |
40,165 |
96,578 |
| Al Fujairah |
13,536 |
13,090 |
26,626 |
11,874 |
5,253 |
17,127 |
25,410 |
18,343 |
43,753 |
| Grand Total |
202,157 |
193,957 |
396,114 |
693,443 |
289,746 |
983,189 |
895,600 |
483,703 |
1,379,303 |
NBS, Ministry of Economy.
ANNEXED NOTE
1. Characteristics of data, definitions and population counting operations in the UAE
The first population census was conducted in 1968 by the Council of Developing Trucial States.
After Independence in 1971, a population census of the Emirate of Abu Dhabi was conducted that same year.
The first general population and establishments census in the UAE was conducted in 1975. It was the first census in the region following scientific standards and international recommendations. The other federal censuses were conducted in 1980, 1985, 1995 and 2005.
Reference day for 1975, 1980, 1985, 1995′ censuses: unknown
Reference day for 2005′ census: 6 December 2005
Implementation method: the census was carried out according to de jure methodology, i.e. counting persons using their usual place of residence
Population of reference: Emirati nationals usually residing in the country+all foreign residents holding a valid residence permit+resident GCC nationals (nationals of other GCC states don’t need a permit to stay in the UAE)
2010′ federal census was eventually cancelled but the Emirates Identity Authority (EIDA), an independent federal authority established in 2004, is currently in charge of recording all UAE residents, national and expatriates in order to set up a Population Register and an ID card program. The process is stil ongoing.
2. Institution which provides data
National Bureau of Statistics (NBS)
3. Data availability
Population statistics are available on NBS’s website:
http://www.uaestatistics.gov.ae/EnglishHome/tabid/96/Default.aspx
http://www.uaestatistics.gov.ae/Home/tabid/38/Default.aspx
Data are classified by subject and statistical publications are available on PDF or Excel format. Population data disagregated by nationality (Emirati/ non-Emirati) are scarce.
2005′ census data is available at:
http://www.uaestatistics.gov.ae/EnglishHome/ReportsByDepartmentEnglish/tabid/104/Default.aspx?MenuId=1&NDId=365
The present data is taken from:
http://www.uaestatistics.gov.ae/EnglishHome/ReportDetailsEnglish/tabid/121/Default.aspx?ItemId=1869&PTID=104&MenuId=1
Date of access: November 2014.
| Emirate |
Nationals |
Non-nationals |
Total |
| Males |
Females |
Total |
Males |
Females |
Total |
Males |
Females |
Total |
| Abu Dhabi |
47,993 |
42,799 |
90,792 |
283,695 |
77,361 |
361,056 |
331,688 |
120,160 |
451,848 |
| Dubai |
32,213 |
30,303 |
62,516 |
155,501 |
58,284 |
213,785 |
187,714 |
88,587 |
276,301 |
| Al Sharjah |
30,945 |
29,550 |
60,495 |
71,840 |
26,982 |
98,822 |
102,785 |
56,532 |
159,317 |
| Ajman |
6,866 |
6,510 |
13,376 |
15,378 |
7,346 |
22,724 |
22,244 |
13,856 |
36,100 |
| Umm Al – Quwain |
2,956 |
2,889 |
5,845 |
5,004 |
1,577 |
6,581 |
7,960 |
4,466 |
12,426 |
| Ras Al Khaima |
20,116 |
19,032 |
39,148 |
26,409 |
8,361 |
34,770 |
46,525 |
27,393 |
73,918 |
| Al Fujairah |
9,484 |
8,888 |
18,372 |
11,312 |
2,505 |
13,817 |
20,796 |
11,393 |
32,189 |
| Grand Total |
150,573 |
139,971 |
290,544 |
569,139 |
182,416 |
751,555 |
719,712 |
322,387 |
1,042,099 |
NBS, Ministry of Economy.
ANNEXED NOTE
1. Characteristics of data, definitions and population counting operations in the UAE
The first population census was conducted in 1968 by the Council of Developing Trucial States.
After Independence in 1971, a population census of the Emirate of Abu Dhabi was conducted that same year.
The first general population and establishments census in the UAE was conducted in 1975. It was the first census in the region following scientific standards and international recommendations. The other federal censuses were conducted in 1980, 1985, 1995 and 2005.
Reference day for 1975, 1980, 1985, 1995′ censuses: unknown
Reference day for 2005′ census: 6 December 2005
Implementation method: the census was carried out according to de jure methodology, i.e. counting persons using their usual place of residence
Population of reference: Emirati nationals usually residing in the country+all foreign residents holding a valid residence permit+resident GCC nationals (nationals of other GCC states don’t need a permit to stay in the UAE)
2010′ federal census was eventually cancelled but the Emirates Identity Authority (EIDA), an independent federal authority established in 2004, is currently in charge of recording all UAE residents, national and expatriates in order to set up a Population Register and an ID card program. The process is stil ongoing.
2. Institution which provides data
National Bureau of Statistics (NBS)
3. Data availability
Population statistics are available on NBS’s website:
http://www.uaestatistics.gov.ae/EnglishHome/tabid/96/Default.aspx
http://www.uaestatistics.gov.ae/Home/tabid/38/Default.aspx
Data are classified by subject and statistical publications are available on PDF or Excel format. Population data disagregated by nationality (Emirati/ non-Emirati) are scarce.
2005′ census data is available at:
http://www.uaestatistics.gov.ae/EnglishHome/ReportsByDepartmentEnglish/tabid/104/Default.aspx?MenuId=1&NDId=365
The present data is taken from:
http://www.uaestatistics.gov.ae/EnglishHome/ReportDetailsEnglish/tabid/121/Default.aspx?ItemId=1869&PTID=104&MenuId=1
Date of access: November 2014.
| Emirate |
Nationals |
Non-nationals |
Total |
| Males |
Females |
Total |
Males |
Females |
Total |
Males |
Females |
Total |
| Abu Dhabi |
29,238 |
25,648 |
54,886 |
125,820 |
31,106 |
156,926 |
155,058 |
56,754 |
211,812 |
| Dubai |
26,096 |
24,720 |
50,816 |
102,725 |
29,646 |
132,371 |
128,821 |
54,366 |
183,187 |
| Al Sharjah |
21,318 |
19,909 |
41,227 |
29,937 |
7,626 |
37,563 |
51,255 |
27,535 |
78,790 |
| Ajman |
3,933 |
3,509 |
7,442 |
6,587 |
2,661 |
9,248 |
10,520 |
6,170 |
16,690 |
| Umm Al – Quwain |
2,301 |
2,157 |
4,458 |
1,962 |
488 |
2,450 |
4,263 |
2,645 |
6,908 |
| Ras Al Khaima |
15,277 |
14,336 |
29,613 |
11,261 |
2,971 |
14,232 |
26,538 |
17,307 |
43,845 |
| Al Fujairah |
6,869 |
6,233 |
13,102 |
3,103 |
450 |
3,553 |
9,972 |
6,683 |
16,655 |
| Grand Total |
105,032 |
96,512 |
201,544 |
281,395 |
74,948 |
356,343 |
386,427 |
171,460 |
557,887 |
NBS, Ministry of Economy.
ANNEXED NOTE
1. Characteristics of data, definitions and population counting operations in the UAE
The first population census was conducted in 1968 by the Council of Developing Trucial States.
After Independence in 1971, a population census of the Emirate of Abu Dhabi was conducted that same year.
The first general population and establishments census in the UAE was conducted in 1975. It was the first census in the region following scientific standards and international recommendations. The other federal censuses were conducted in 1980, 1985, 1995 and 2005.
Reference day for 1975, 1980, 1985, 1995′ censuses: unknown
Reference day for 2005′ census: 6 December 2005
Implementation method: the census was carried out according to de jure methodology, i.e. counting persons using their usual place of residence
Population of reference: Emirati nationals usually residing in the country+all foreign residents holding a valid residence permit+resident GCC nationals (nationals of other GCC states don’t need a permit to stay in the UAE)
2010′ federal census was eventually cancelled but the Emirates Identity Authority (EIDA), an independent federal authority established in 2004, is currently in charge of recording all UAE residents, national and expatriates in order to set up a Population Register and an ID card program. The process is stil ongoing.
2. Institution which provides data
National Bureau of Statistics (NBS)
3. Data availability
Population statistics are available on NBS’s website:
http://www.uaestatistics.gov.ae/EnglishHome/tabid/96/Default.aspx
http://www.uaestatistics.gov.ae/Home/tabid/38/Default.aspx
Data are classified by subject and statistical publications are available on PDF or Excel format. Population data disagregated by nationality (Emirati/ non-Emirati) are scarce.
2005′ census data is available at:
http://www.uaestatistics.gov.ae/EnglishHome/ReportsByDepartmentEnglish/tabid/104/Default.aspx?MenuId=1&NDId=365
The present data is taken from:
http://www.uaestatistics.gov.ae/EnglishHome/ReportDetailsEnglish/tabid/121/Default.aspx?ItemId=1869&PTID=104&MenuId=1
Date of access: November 2014.
|
Nationals |
Non-nationals |
Total |
|
Male |
Female |
Total |
Male |
Female |
Total |
Male |
Female |
Total |
| 1975 |
105,032 |
96,512 |
201,544 |
281,395 |
74,948 |
356,343 |
386,427 |
171,460 |
557,887 |
| 1980 |
150,573 |
139,971 |
290,544 |
569,139 |
182,416 |
751,555 |
719,712 |
322,387 |
1,042,099 |
| 1985 |
202,157 |
193,957 |
396,114 |
693,443 |
289,746 |
983,189 |
895,600 |
483,703 |
1,379,303 |
| 1995 |
297,060 |
290,270 |
587,330 |
1,309,744 |
513,967 |
1,823,711 |
1,606,804 |
804,237 |
2,411,041 |
| 2005 |
417,917 |
407,578 |
825,495 |
2,388,235 |
892,697 |
3,280,932 |
2,806,152 |
1,300,275 |
4,106,427 |
| 2010* |
479,109 |
468,888 |
947,997* |
5,682,711 |
1,633,362 |
7,316,073* |
6,161,820 |
2,102,250 |
8,264,070* |
Source: National Bureau of Statistics, Ministry of Economy
* Mid-year estimate
ANNEXED NOTE
1. Characteristics of data, definitions and population counting operations in the UAE
The first population census was conducted in 1968 by the Council of Developing Trucial States.
After Independence in 1971, a population census of the Emirate of Abu Dhabi was conducted that same year.
The first general population and establishments census in the UAE was conducted in 1975. It was the first census in the region following scientific standards and international recommendations. The other federal censuses were conducted in 1980, 1985, 1995 and 2005.
Reference day for 1975, 1980, 1985, 1995′ censuses: unknown
Reference day for 2005′ census: 6 December 2005
Implementation method: the census was carried out according to de jure methodology, i.e. counting persons using their usual place of residence
Population of reference: Emirati nationals usually residing in the country+all foreign residents holding a valid residence permit+resident GCC nationals (nationals of other GCC states don’t need a permit to stay in the UAE)
2010′ federal census was due to take place in April but finally cancelled. It was only conducted in Abu Dhabi Emirate which includes Al-Ain.
NBS estimated UAE’s resident population (nationals and non-nationals) on the basis of administrative records, using the component method: addition of natural increase and net migration since the last census year (2005).
The net migration was calculated as follows:
Net migration = (residence permits issued for the first time- residence permits that have been cancelled and not renewed)+(arrivals of GCC nationals-departures of GCC nationals), on the basis of Ministry of Interior’s records.
Period of reference for 2010′ estimate: mid-year
The Emirates Identity Authority (EIDA), an independent federal authority established in 2004, is currently in charge of recording all UAE residents, national and expatriates in order to set up a Population Register and an ID card program. The process is stil ongoing.
2. Institution which provides data
National Bureau of Statistics (NBS)
3. Data availability
Population statistics are available on NBS’s website:
http://www.uaestatistics.gov.ae/EnglishHome/tabid/96/Default.aspx
http://www.uaestatistics.gov.ae/Home/tabid/38/Default.aspx
Data are classified by subject and statistical publications are available on PDF or Excel format. Population data disagregated by nationality (Emirati/ non-Emirati) are scarce.
2005′ census data is available at:
http://www.uaestatistics.gov.ae/EnglishHome/ReportsByDepartmentEnglish/tabid/104/Default.aspx?MenuId=1&NDId=365
census data is taken from:
http://www.uaestatistics.gov.ae/EnglishHome/ReportDetailsEnglish/tabid/121/Default.aspx?ItemId=1869&PTID=104&MenuId=1
Estimate for 2010 and methodology of estimate are taken from:
http://www.uaestatistics.gov.ae/ReportPDF/Population%20Estimates%202006%20-%202010.pdf
Date of access: November 2014.
| Nationality |
Male |
Female |
Total |
| Nationals |
479,109 |
468,888 |
947,997
7,316,073 |
| Non-nationals |
5,682,711 |
1,633,362 |
7,316,073 |
| Total |
6,161,820 |
2,102,250 |
8,264,070 |
Source: National Bureau of Statistics
ANNEXED NOTE
1. Characteristics of data, definitions and population counting operations in the UAE
The first population census was conducted in 1968 by the Council of Developing Trucial States.
After Independence in 1971, a population census of the Emirate of Abu Dhabi was conducted that same year.
The first general population and establishments census in the UAE was conducted in 1975. It was the first census in the region following scientific standards and international recommendations. The other federal censuses were conducted in 1980, 1985, 1995 and 2005.
2010′ federal census due to take place in April was finally cancelled. It was only conducted in Abu Dhabi Emirate which includes Al-Ain.
NBS estimated UAE’s resident population (nationals and non-nationals) on the basis of administrative records, using the component method: addition of natural increase and net migration since the last census year (2005).
The net migration was calculated as follows:
Net migration = (residence permits issued for the first time- residence permits that have been cancelled and not renewed)+(arrivals of GCC nationals-departures of GCC nationals), on the basis of Ministry of Interior’s records.
Population of reference: Emirati nationals usually residing in the country+all foreign residents holding a valid residence permit+resident GCC nationals (nationals of other GCC states don’t need a permit to stay in the UAE)
Period of reference for 2010′ estimate: mid-year
The Emirates Identity Authority (EIDA), an independent federal authority established in 2004, is currently in charge of recording all UAE residents, national and expatriates in order to set up a Population Register and an ID card program. The process is stil ongoing.
2. Institution which provides data
National Bureau of Statistics (NBS)
3. Data availability
Population statistics are available on NBS’s website:
http://www.uaestatistics.gov.ae/EnglishHome/tabid/96/Default.aspx
http://www.uaestatistics.gov.ae/Home/tabid/38/Default.aspx
Data are classified by subject and statistical publications are available on PDF or Excel format. Population data disagregated by nationality (Emirati/ non-Emirati) are scarce.
Population estimates for 2006-2010, methodology of estimates and current data are taken from:
http://www.uaestatistics.gov.ae/ReportPDF/Population%20Estimates%202006%20-%202010.pdf
Date of access: November 2014.
| Emirate |
Nationals |
Non-nationals |
Total |
| Abu Dhabi |
350,277 |
1,049,207 |
1,399,484 |
| Dubai |
137,573 |
1,183,880 |
1,321,453 |
| Al Sharjah |
138,272 |
655,301 |
793,573 |
| Ajman |
39,231 |
167,766 |
206,997 |
| Umm Al – Quwain |
15,873 |
33,286 |
49,159 |
| Ras Al Khaima |
87,848 |
122,215 |
210,063 |
| Al Fujairah |
56,421 |
69,277 |
125,698 |
| Grand Total |
825,495 |
3,280,932 |
4,106,427 |
NBS, Ministry of Economy.
ANNEXED NOTE
1. Characteristics of data, definitions and population counting operations in the UAE
The first population census was conducted in 1968 by the Council of Developing Trucial States.
After Independence in 1971, a population census of the Emirate of Abu Dhabi was conducted that same year.
The first general population and establishments census in the UAE was conducted in 1975. It was the first census in the region following scientific standards and international recommendations. The other federal censuses were conducted in 1980, 1985, 1995 and 2005.
Reference day for 2005′ census: 6 December 2005
Implementation method: the census was carried out according to de jure methodology, i.e. counting persons using their usual place of residence
Population of reference: Emirati nationals usually residing in the country+all foreign residents holding a valid residence permit+resident GCC nationals (nationals of other GCC states don’t need a permit to stay in the UAE)
2010′ federal census was eventually cancelled but the Emirates Identity Authority (EIDA), an independent federal authority established in 2004, is currently in charge of recording all UAE residents, national and expatriates in order to set up a Population Register and an ID card program. The process is stil ongoing.
2. Institution which provides data
National Bureau of Statistics (NBS)
3. Data availability
Population statistics are available on NBS’s website:
http://www.uaestatistics.gov.ae/EnglishHome/tabid/96/Default.aspx
http://www.uaestatistics.gov.ae/Home/tabid/38/Default.aspx
Data are classified by subject and statistical publications are available on PDF or Excel format. Population data disagregated by nationality (Emirati/ non-Emirati) are scarce.
2005′ census data is available at:
http://www.uaestatistics.gov.ae/EnglishHome/ReportsByDepartmentEnglish/tabid/104/Default.aspx?MenuId=1&NDId=365
The present data is taken from:
http://www.uaestatistics.gov.ae/EnglishHome/ReportDetailsEnglish/tabid/121/Default.aspx?ItemId=1869&PTID=104&MenuId=1
Date of access: November 2014.
| Emirate |
Nationals |
Non-nationals |
Total |
| Abu Dhabi |
222,627 |
719,836 |
942,463 |
| Dubai |
107,741 |
581,679 |
689,420 |
| Al Sharjah |
106,921 |
295,871 |
402,792 |
| Ajman |
28,832 |
92,659 |
121,491 |
| Umm Al – Quwain |
13,032 |
22,329 |
35,361 |
| Ras Al Khaima |
67,376 |
75,958 |
143,334 |
| Al Fujairah |
40,801 |
35,379 |
76,180 |
| Grand Total |
587,330 |
1,823,711 |
2,411,041 |
NBS, Ministry of Economy.
ANNEXED NOTE
1. Characteristics of data, definitions and population counting operations in the UAE
The first population census was conducted in 1968 by the Council of Developing Trucial States.
After Independence in 1971, a population census of the Emirate of Abu Dhabi was conducted that same year.
The first general population and establishments census in the UAE was conducted in 1975. It was the first census in the region following scientific standards and international recommendations. The other federal censuses were conducted in 1980, 1985, 1995 and 2005.
Reference day for 1975, 1980, 1985, 1995′ censuses: unknown
Reference day for 2005′ census: 6 December 2005
Implementation method: the census was carried out according to de jure methodology, i.e. counting persons using their usual place of residence
Population of reference: Emirati nationals usually residing in the country+all foreign residents holding a valid residence permit+resident GCC nationals (nationals of other GCC states don’t need a permit to stay in the UAE)
2010′ federal census was eventually cancelled but the Emirates Identity Authority (EIDA), an independent federal authority established in 2004, is currently in charge of recording all UAE residents, national and expatriates in order to set up a Population Register and an ID card program. The process is stil ongoing.
2. Institution which provides data
National Bureau of Statistics (NBS)
3. Data availability
Population statistics are available on NBS’s website:
http://www.uaestatistics.gov.ae/EnglishHome/tabid/96/Default.aspx
http://www.uaestatistics.gov.ae/Home/tabid/38/Default.aspx
Data are classified by subject and statistical publications are available on PDF or Excel format. Population data disagregated by nationality (Emirati/ non-Emirati) are scarce.
2005′ census data is available at:
http://www.uaestatistics.gov.ae/EnglishHome/ReportsByDepartmentEnglish/tabid/104/Default.aspx?MenuId=1&NDId=365
The present data is taken from:
http://www.uaestatistics.gov.ae/EnglishHome/ReportDetailsEnglish/tabid/121/Default.aspx?ItemId=1869&PTID=104&MenuId=1
Date of access: November 2014.
|
Nationals |
Non-nationals |
Total |
| 1975 |
201,544 |
356,343 |
557,887 |
| 1980 |
290,544 |
751,555 |
1,042,099 |
| 1985 |
396,114 |
983,189 |
1,379,303 |
| 1995 |
587,330 |
1,823,711 |
2,411,041 |
| 2005 |
825,495 |
3,280,932 |
4,106,427 |
| 2010* |
947,997* |
7,316,073* |
8,264,070* |
Source: National Bureau of Statistics, Ministry of Economy
* Mid-year estimate
ANNEXED NOTE
1. Characteristics of data, definitions and population counting operations in the UAE
The first population census was conducted in 1968 by the Council of Developing Trucial States.
After Independence in 1971, a population census of the Emirate of Abu Dhabi was conducted that same year.
The first general population and establishments census in the UAE was conducted in 1975. It was the first census in the region following scientific standards and international recommendations. The other federal censuses were conducted in 1980, 1985, 1995 and 2005.
Reference day for 1975, 1980, 1985, 1995′ censuses: unknown
Reference day for 2005′ census: 6 December 2005
Implementation method: the census was carried out according to de jure methodology, i.e. counting persons using their usual place of residence
Population of reference: Emirati nationals usually residing in the country+all foreign residents holding a valid residence permit+resident GCC nationals (nationals of other GCC states don’t need a permit to stay in the UAE)
2010′ federal census was due to take place in April but finally cancelled. It was only conducted in Abu Dhabi Emirate which includes Al-Ain.
NBS estimated UAE’s resident population (nationals and non-nationals) on the basis of administrative records, using the component method: addition of natural increase and net migration since the last census year (2005).
The net migration was calculated as follows:
Net migration = (residence permits issued for the first time- residence permits that have been cancelled and not renewed)+(arrivals of GCC nationals-departures of GCC nationals), on the basis of Ministry of Interior’s records.
Period of reference for 2010′ estimate: mid-year
The Emirates Identity Authority (EIDA), an independent federal authority established in 2004, is currently in charge of recording all UAE residents, national and expatriates in order to set up a Population Register and an ID card program. The process is stil ongoing.
2. Institution which provides data
National Bureau of Statistics (NBS)
3. Data availability
Population statistics are available on NBS’s website:
http://www.uaestatistics.gov.ae/EnglishHome/tabid/96/Default.aspx
http://www.uaestatistics.gov.ae/Home/tabid/38/Default.aspx
Data are classified by subject and statistical publications are available on PDF or Excel format. Population data disagregated by nationality (Emirati/ non-Emirati) are scarce.
2005′ census data is available at:
http://www.uaestatistics.gov.ae/EnglishHome/ReportsByDepartmentEnglish/tabid/104/Default.aspx?MenuId=1&NDId=365
census data is taken from:
http://www.uaestatistics.gov.ae/EnglishHome/ReportDetailsEnglish/tabid/121/Default.aspx?ItemId=1869&PTID=104&MenuId=1
Estimate for 2010 and methodology of estimate are taken from:
http://www.uaestatistics.gov.ae/ReportPDF/Population%20Estimates%202006%20-%202010.pdf
Date of access: November 2014.
| Emirate |
Nationals |
Non-nationals |
Total |
| Abu Dhabi |
135,982 |
430,054 |
566,036 |
| Dubai |
76,692 |
294,096 |
370,788 |
| Al Sharjah |
79,403 |
148,914 |
228,317 |
| Ajman |
19,253 |
35,293 |
54,546 |
| Umm Al – Quwain |
8,841 |
10,444 |
19,285 |
| Ras Al Khaima |
49,317 |
47,261 |
96,578 |
| Al Fujairah |
26,626 |
17,127 |
43,753 |
| Grand Total |
396,114 |
983,189 |
1,379,303 |
NBS, Ministry of Economy.
ANNEXED NOTE
1. Characteristics of data, definitions and population counting operations in the UAE
The first population census was conducted in 1968 by the Council of Developing Trucial States.
After Independence in 1971, a population census of the Emirate of Abu Dhabi was conducted that same year.
The first general population and establishments census in the UAE was conducted in 1975. It was the first census in the region following scientific standards and international recommendations. The other federal censuses were conducted in 1980, 1985, 1995 and 2005.
Reference day for 1975, 1980, 1985, 1995′ censuses: unknown
Reference day for 2005′ census: 6 December 2005
Implementation method: the census was carried out according to de jure methodology, i.e. counting persons using their usual place of residence
Population of reference: Emirati nationals usually residing in the country+all foreign residents holding a valid residence permit+resident GCC nationals (nationals of other GCC states don’t need a permit to stay in the UAE)
2010′ federal census was eventually cancelled but the Emirates Identity Authority (EIDA), an independent federal authority established in 2004, is currently in charge of recording all UAE residents, national and expatriates in order to set up a Population Register and an ID card program. The process is stil ongoing.
2. Institution which provides data
National Bureau of Statistics (NBS)
3. Data availability
Population statistics are available on NBS’s website:
http://www.uaestatistics.gov.ae/EnglishHome/tabid/96/Default.aspx
http://www.uaestatistics.gov.ae/Home/tabid/38/Default.aspx
Data are classified by subject and statistical publications are available on PDF or Excel format. Population data disagregated by nationality (Emirati/ non-Emirati) are scarce.
2005′ census data is available at:
http://www.uaestatistics.gov.ae/EnglishHome/ReportsByDepartmentEnglish/tabid/104/Default.aspx?MenuId=1&NDId=365
The present data is taken from:
http://www.uaestatistics.gov.ae/EnglishHome/ReportDetailsEnglish/tabid/121/Default.aspx?ItemId=1869&PTID=104&MenuId=1
Date of access: November 2014.
| Emirate |
Nationals |
Non-nationals |
Total |
| Abu Dhabi |
90,792 |
361,056 |
451,848 |
| Dubai |
62,516 |
213,785 |
276,301 |
| Al Sharjah |
60,495 |
98,822 |
159,317 |
| Ajman |
13,376 |
22,724 |
36,100 |
| Umm Al – Quwain |
5,845 |
6,581 |
12,426 |
| Ras Al Khaima |
39,148 |
34,770 |
73,918 |
| Al Fujairah |
18,372 |
13,817 |
32,189 |
| Grand Total |
290,544 |
751,555 |
1,042,099 |
NBS, Ministry of Economy.
ANNEXED NOTE
1. Characteristics of data, definitions and population counting operations in the UAE
The first population census was conducted in 1968 by the Council of Developing Trucial States.
After Independence in 1971, a population census of the Emirate of Abu Dhabi was conducted that same year.
The first general population and establishments census in the UAE was conducted in 1975. It was the first census in the region following scientific standards and international recommendations. The other federal censuses were conducted in 1980, 1985, 1995 and 2005.
Reference day for 1975, 1980, 1985, 1995′ censuses: unknown
Reference day for 2005′ census: 6 December 2005
Implementation method: the census was carried out according to de jure methodology, i.e. counting persons using their usual place of residence
Population of reference: Emirati nationals usually residing in the country+all foreign residents holding a valid residence permit+resident GCC nationals (nationals of other GCC states don’t need a permit to stay in the UAE)
2010′ federal census was eventually cancelled but the Emirates Identity Authority (EIDA), an independent federal authority established in 2004, is currently in charge of recording all UAE residents, national and expatriates in order to set up a Population Register and an ID card program. The process is stil ongoing.
2. Institution which provides data
National Bureau of Statistics (NBS)
3. Data availability
Population statistics are available on NBS’s website:
http://www.uaestatistics.gov.ae/EnglishHome/tabid/96/Default.aspx
http://www.uaestatistics.gov.ae/Home/tabid/38/Default.aspx
Data are classified by subject and statistical publications are available on PDF or Excel format. Population data disagregated by nationality (Emirati/ non-Emirati) are scarce.
2005′ census data is available at:
http://www.uaestatistics.gov.ae/EnglishHome/ReportsByDepartmentEnglish/tabid/104/Default.aspx?MenuId=1&NDId=365
The present data is taken from:
http://www.uaestatistics.gov.ae/EnglishHome/ReportDetailsEnglish/tabid/121/Default.aspx?ItemId=1869&PTID=104&MenuId=1
Date of access: November 2014.
| Emirate |
Nationals |
Non-nationals |
Total |
| Abu Dhabi |
54,886 |
156,926 |
211,812 |
| Dubai |
50,816 |
132,371 |
183,187 |
| Al Sharjah |
41,227 |
37,563 |
78,790 |
| Ajman |
7,442 |
9,248 |
16,690 |
| Umm Al – Quwain |
4,458 |
2,450 |
6,908 |
| Ras Al Khaima |
29,613 |
14,232 |
43,845 |
| Al Fujairah |
13,102 |
3,553 |
16,655 |
| Grand Total |
201,544 |
356,343 |
557,887 |
NBS, Ministry of Economy.
ANNEXED NOTE
1. Characteristics of data, definitions and population counting operations in the UAE
The first population census was conducted in 1968 by the Council of Developing Trucial States.
After Independence in 1971, a population census of the Emirate of Abu Dhabi was conducted that same year.
The first general population and establishments census in the UAE was conducted in 1975. It was the first census in the region following scientific standards and international recommendations. The other federal censuses were conducted in 1980, 1985, 1995 and 2005.
Reference day for 1975, 1980, 1985, 1995′ censuses: unknown
Reference day for 2005′ census: 6 December 2005
Implementation method: the census was carried out according to de jure methodology, i.e. counting persons using their usual place of residence
Population of reference: Emirati nationals usually residing in the country+all foreign residents holding a valid residence permit+resident GCC nationals (nationals of other GCC states don’t need a permit to stay in the UAE)
2010′ federal census was eventually cancelled but the Emirates Identity Authority (EIDA), an independent federal authority established in 2004, is currently in charge of recording all UAE residents, national and expatriates in order to set up a Population Register and an ID card program. The process is stil ongoing.
2. Institution which provides data
National Bureau of Statistics (NBS)
3. Data availability
Population statistics are available on NBS’s website:
http://www.uaestatistics.gov.ae/EnglishHome/tabid/96/Default.aspx
http://www.uaestatistics.gov.ae/Home/tabid/38/Default.aspx
Data are classified by subject and statistical publications are available on PDF or Excel format. Population data disagregated by nationality (Emirati/ non-Emirati) are scarce.
2005′ census data is available at:
http://www.uaestatistics.gov.ae/EnglishHome/ReportsByDepartmentEnglish/tabid/104/Default.aspx?MenuId=1&NDId=365
The present data is taken from:
http://www.uaestatistics.gov.ae/EnglishHome/ReportDetailsEnglish/tabid/121/Default.aspx?ItemId=1869&PTID=104&MenuId=1
Date of access: November 2014.
|
July 2014 |
|
Male |
Female |
Total |
| Illiterate |
19,887 |
2,100 |
21,987 |
| Read & Writes |
369,272 |
45,722 |
414,994 |
| Primary |
124,724 |
19,617 |
144,341 |
| Preparatory |
499,393 |
60,310 |
559,703 |
| Secondary |
210,810 |
16,027 |
226,837 |
| Diploma |
42,902 |
8,698 |
51,600 |
| University |
72,291 |
14,108 |
86,399 |
| Higher Diploma |
4,008 |
742 |
4,750 |
| Masters Degree |
4,696 |
1,029 |
5,725 |
| Ph.D |
2,035 |
566 |
2,601 |
| Not Stated |
19,177 |
6,552 |
25,729 |
| Total Workers |
1,369,195 |
175,471 |
1,544,666 |
Source: General Directorate of Civil Status
ANNEXED NOTE
1. Technical Notes and Definitions
The table refers to the employed population registered in the Sultanate as of mid-2014, employed in the government, private and household sectors.
The civil status system in Oman was created by Royal Decree No. 66/99, which established the General Directorate of Civil Status as part of the Royal Oman Police.
This civil database served as a basis for creating a comprehensive civil register (National Registration System (NRS)), an integrated computer system linking all 12 civil status directorates throughout the Sultanate and maintained by the D.G of civil Status.
The DGCS is entrusted with the following responsibilities:
1- Registration of births, deaths, marriages, divorces of Omani nationals
2- Registration of births and deaths of resident expatriates; registration of foreign marriages and divorces if one party is a Omani national
3- Issuance of birth and death certificates; as well as identity cards for Omanis and residence cards to foreign residents
4- Assessment of documents provided by Omani nationals requesting to marry a foreign national and certification of such marriages
5- Assessment of documents provided by applicants to recognition and restoration of Omani citizenship, as well as to naturalisation.
The National Registration System thus includes data on births, deaths, marriages and divorces in the Sultanate. It also includes data on identity cards for Omanis and residence cards for residents.
Registration in the civil register is mandatory for Omanis and residents of the Sultanate. The civil register records the name, gender, age, marital status, nationality, address, telephone numbers, civil number, educational level and occupation.
http://www.civilstatus.gov.om/english/system.asp#register
http://www.civilstatus.gov.om/download.asp?filename=stats2004-2009.pdf
2. Institution which provides data
National Center for Statistics and Information (NCSI)
3. Data availability
The National Center for Statistics and Information (NCSI) processes and disseminates all statistical data of use to the public and to government action.
NCSI publishes a monthly bulletin processing most recent economic and social data, in PDF and Excel formats.
September 2014 issue:
http://www.ncsi.gov.om/NCSI_website/book/mb/sep2014/Monthly_Bulletin_Sep2014.pdf
Monthly figures of expatriate workers by certain socio-economic characteristics can be found here (September 2014 issue):
http://www.ncsi.gov.om/NCSI_website/book/mb/sep2014/T15_T16.pdf
Date of access: October 2014.
| |
Males |
Females |
Total |
% |
| Indians |
570,923 |
32,542 |
603,465 |
40.3 |
| Bangladeshis |
459,515 |
14,364 |
473,879 |
31.6 |
| Pakistanis |
222,048 |
966 |
223,014 |
14.9 |
| Ethiopians |
495 |
41,847 |
42,342 |
2.8 |
| Indonesians |
683 |
26,926 |
27,609 |
1.8 |
| Filipinos |
9,308 |
18,289 |
27,597 |
1.8 |
| Nepalese |
9,577 |
3,546 |
13,123 |
0.9 |
| Sri Lankans |
6,525 |
5,852 |
12,377 |
0.8 |
| Arab Nationals |
39,543 |
10,252 |
49,795 |
3.3 |
| Other Nationalities |
16,816 |
8,260 |
25,076 |
1.7 |
| Total |
1,335,433 |
162,844 |
1,498,277 |
100 |
Source: General Directorate of Civil Status
ANNEXED NOTE
1. Technical Notes and Definitions
The table refers to the employed population registered in the Sultanate as of mid-2013, employed in the government, private and household sectors.
The civil status system in Oman was created by Royal Decree No. 66/99, which established the General Directorate of Civil Status as part of the Royal Oman Police.
This civil database served as a basis for creating a comprehensive civil register (National Registration System (NRS)), an integrated computer system linking all 12 civil status directorates throughout the Sultanate and maintained by the D.G of civil Status.
The DGCS is entrusted with the following responsibilities:
1- Registration of births, deaths, marriages, divorces of Omani nationals
2- Registration of births and deaths of resident expatriates; registration of foreign marriages and divorces if one party is a Omani national
3- Issuance of birth and death certificates; as well as identity cards for Omanis and residence cards to foreign residents
4- Assessment of documents provided by Omani nationals requesting to marry a foreign national and certification of such marriages
5- Assessment of documents provided by applicants to recognition and restoration of Omani citizenship, as well as to naturalisation.
The National Registration System thus includes data on births, deaths, marriages and divorces in the Sultanate. It also includes data on identity cards for Omanis and residence cards for residents.
Registration in the civil register is mandatory for Omanis and residents of the Sultanate. The civil register records the name, gender, age, marital status, nationality, address, telephone numbers, civil number, educational level and occupation.
http://www.civilstatus.gov.om/english/system.asp#register
http://www.civilstatus.gov.om/download.asp?filename=stats2004-2009.pdf
2. Institution which provides data
National Center for Statistics and Information (NCSI)
3. Data availability
The National Center for Statistics and Information (NCSI) processes and disseminates all statistical data of use to the public and to government action.
The present data is taken from a survey processing latest data on expatriates “Characteristics of expatriates in the Sultanate of Oman” 2014 (p.13)
the survey is available online in PDF format (Arabic version only):
http://www.ncsi.gov.om/NCSI_website/PublicationAttachment/Characteristics_of_expatriates_in_Oman.pdf
Date of access: October 2014.
|
July 2014 |
|
Males |
Females |
Total |
| Indians |
32,433 |
566,103 |
598,536 |
| Bangladeshis |
19,653 |
502,999 |
522,652 |
| Pakistanis |
1,012 |
216,440 |
217,452 |
| Ethiopians |
38,427 |
389 |
38,816 |
| Indonesians |
33,387 |
603 |
33,990 |
| Filipinos |
20,148 |
9,999 |
30,147 |
| Egyptians |
4,228 |
18,230 |
22,458 |
| Nepalese |
3,763 |
9,432 |
13,195 |
| Sri Lankans |
6,412 |
6,737 |
13,149 |
| Other Nationalities |
16,008 |
38,263 |
54,271 |
| Total |
175,471 |
1,369,195 |
1,544,666 |
Source: General Directorate of Civil Status
ANNEXED NOTE
1. Technical Notes and Definitions
The table refers to the employed population registered in the Sultanate as of mid-2014, employed in the government, private and household sectors.
The civil status system in Oman was created by Royal Decree No. 66/99, which established the General Directorate of Civil Status as part of the Royal Oman Police.
This civil database served as a basis for creating a comprehensive civil register (National Registration System (NRS)), an integrated computer system linking all 12 civil status directorates throughout the Sultanate and maintained by the D.G of civil Status.
The DGCS is entrusted with the following responsibilities:
1- Registration of births, deaths, marriages, divorces of Omani nationals
2- Registration of births and deaths of resident expatriates; registration of foreign marriages and divorces if one party is a Omani national
3- Issuance of birth and death certificates; as well as identity cards for Omanis and residence cards to foreign residents
4- Assessment of documents provided by Omani nationals requesting to marry a foreign national and certification of such marriages
5- Assessment of documents provided by applicants to recognition and restoration of Omani citizenship, as well as to naturalisation.
The National Registration System thus includes data on births, deaths, marriages and divorces in the Sultanate. It also includes data on identity cards for Omanis and residence cards for residents.
Registration in the civil register is mandatory for Omanis and residents of the Sultanate. The civil register records the name, gender, age, marital status, nationality, address, telephone numbers, civil number, educational level and occupation.
http://www.civilstatus.gov.om/english/system.asp#register
http://www.civilstatus.gov.om/download.asp?filename=stats2004-2009.pdf
2. Institution which provides data
National Center for Statistics and Information (NCSI)
3. Data availability
The National Center for Statistics and Information (NCSI) processes and disseminates all statistical data of use to the public and to government action.
NCSI publishes a monthly bulletin processing most recent economic and social data, in PDF and Excel formats.
September 2014 issue:
http://www.ncsi.gov.om/NCSI_website/book/mb/sep2014/Monthly_Bulletin_Sep2014.pdf
Monthly figures of expatriate workers by country of citizenship can be found here (September 2014 issue):
http://www.ncsi.gov.om/NCSI_website/book/mb/sep2014/T15_T16.pdf
Date of access: October 2014.
| Nationality |
|
In the labour force |
Outside the labour force |
Grand Total |
| |
Employed |
Unemployed |
Total in labour force |
Housewife |
Student |
Disabled |
Retired |
Other |
Total |
| |
Seeking work for 1st time |
Unpd. with previous employment |
| Qatari |
Males |
60,877 |
365 |
35 |
61,277 |
0 |
13,990 |
1,375 |
10,102 |
835 |
26,302 |
87,579 |
| |
Females |
30,256 |
1,029 |
0 |
31,285 |
26,947 |
21,757 |
2,067 |
6,380 |
1,651 |
58,802 |
90,087 |
| |
Total |
91,133 |
1,394 |
35 |
92,562 |
26,947 |
35,747 |
3,442 |
16,482 |
2,486 |
85,104 |
177,666 |
| Non-Qatari |
Males |
1,284,838 |
639 |
154 |
1,285,631 |
0 |
23,165 |
1,824 |
0 |
2,293 |
27,282 |
1,312,913 |
| |
Females |
163,169 |
1,903 |
0 |
165,072 |
86,580 |
23,268 |
1,105 |
0 |
3,670 |
114,623 |
279,695 |
| |
Total |
1,448,007 |
2,542 |
154 |
1,450,703 |
86,580 |
46,433 |
2,929 |
0 |
5,963 |
141,905 |
1,592,608 |
| Total |
Males |
1,345,715 |
1,004 |
189 |
1,346,908 |
0 |
37,155 |
3,199 |
10,102 |
3,128 |
53,584 |
1,400,492 |
| |
Females |
193,425 |
2,932 |
0 |
196,357 |
113,527 |
45,025 |
3,172 |
6,380 |
5,321 |
173,425 |
369,782 |
| |
Total |
1,539,140 |
3,936 |
189 |
1,543,265 |
113,527 |
82,180 |
6,371 |
16,482 |
8,449 |
227,009 |
1,770,274 |
Source: QSA, Ministry of Development Planning and Statistics
ANNEXED NOTE
1. Technical Notes and Definitions
The data is taken from 2013 Labour Force Survey (yearly synthesis)
Sampling frame of LFS 2013: Population Census 2010.
Sample size: 8,342 households and 55,771 individuals from: 1- Qatari households; 2- Non-Qatari regular (non-collective) households; 3- Non-Qatari small collective households (2 – 6 persons); 4- Non-Qatari large collective households (7 persons or more).
Data Collection: The sample was divided into equal parts to collect data monthly. Each month 1/3 of the quarterly data were collected during the first two weeks of the month.
Reference period for the labour force data: the week prior to data collection day.
Population of reference: all Qatari and non-Qatari households present in Qatar on the night of survey, living in normal and collective households.
The collective households are a group of persons not related to each other and sharing living conditions in a residential unit, I.e. labour camps, students living boarding schools, nurses in hospitals… etc. The survey covered the small collective households (includes less than 7 persons) and large collective households (includes 7 persons or more).
The survey did not cover short periods accommodation, i.e. hotels.
Relation to labour force (for persons aged 15 and above)
In the labour force (= economically active).
1) Employed.
All persons aged 15 years an above, who during the week preceding the survey:
a) Perform a work for a wage, salary, profits or household gains, whether it was in cash or in kind.
b) Are temporarily not employed, however, they still have an official relation with their work
2) Unemployed.
All persons aged 15 years and over who were, during the week preceding the survey, without employment, willing to work and looking seriously for a job.
There is a distinction between two kinds of unemployed persons:
a) First time unemployed: They are the persons who never worked previously, and were during the week preceding the survey looking actively for work.
b) Unemployed who previously worked: They are the persons with a work experience, who during the week preceding the survey were actively looking for a job
Outside the labour force (=economically inactive):
Full-time student: The person (15 years or older) enrolled in any educational institution as a full-time persistent student with purpose of attaining an academic degree, irrespective of whether the schooling hours are in the morning or evening. Any trainee enrolled in vocational training institutes is regarded as a full-time student.
Full-time housewife: The female (15 years or older) who is fully engaged in home management and family care, and does not practice any other work
Retired: The person who does not look for a job during the week preceding the survey and gets a fixed pension for work he/she had joined before
Disabled: The person (15 years or older) who is not capable of work due to illness, handicap or old age.
Others: Those able to work but not willing to, not enrolled in education, as well as any other cases encountered by the enumerator other than the above mentioned.
2. Institution which provides data
Qatar Statistics Authority (QSA), Ministry of Development Planning and Statistics
(http://www.qsa.gov.qa/eng/index.htm for website in English; http://www.qsa.gov.qa/Ar/index.htm for website in Arabic)
3. Data availability
The Statistics Authority conducted the first labour Force Sample Survey in 2001. Starting from 2006, the execution of these surveys came to be on annual basis. Quarterly publications of Labour Force Surveys’ data are also available since 2012.
Most Labour Force Surveys and publications related to the labour force are available on QSA’s website, in PDF format. LFS 2013 can be downloaded from:
https://www.mdps.gov.qa/en/statistics1/pages/topicslisting.aspx?parent=Social&child=LaborForce
See also Qatar Information Exchange for earlier Labour Force Surveys. QIX has also an interactive data base compiling data on the labour force taken from available surveys:
http://www.qix.gov.qa/portal/page/portal/qix/subject_area/Statistics?subject_area=183
|
2010 |
2012 |
| Males |
Females |
|
| (%) |
(%) |
|
| Sex |
9 |
91 |
|
| Country of citizenship |
India |
46 |
29 |
|
| Indonesia |
2 |
35 |
|
| Bangladesh |
34 |
5 |
|
| Philippines |
2 |
12 |
|
| Other countries |
16 |
19 |
|
| |
Total |
100 |
100 |
|
| Age group |
15-29 |
26.7 |
33.8 |
|
| 30-44 |
46.9 |
55.5 |
|
| 45-59 |
24.4 |
5.6 |
|
| 60 and above |
2 |
4.3 |
|
| Total |
100 |
100 |
|
| Educational level |
Illiterate |
22.3 |
|
| Reads and writes |
48.4 |
|
| Below high-school diploma |
18.7 |
|
| High-school diploma |
9.5 |
|
| Post high-school diploma |
0.8 |
|
| Bachelor and above |
0.3 |
|
| Total |
100 |
|
| Marital status |
Never married |
22.9 |
|
| Married |
67.8 |
|
| Divorced |
5.6 |
|
| Widowed |
4.3 |
|
| Total |
100 |
|
| Total (number) |
179,501 |
224,006 |
Source: Ministry of National Economy / NCSI
ANNEXED NOTE
1. Technical Notes and Definitions
The table refers to the domestic workers’ population recorded during census 2010, with update for 2012 based on labour permits’ statistics.
Professions classified as domestic workers are the domestic helpers, cooks, nannies, personal drivers, gardeners, etc. working for private persons/ households.
The Ministry of National Economy of Oman has conducted three censuses in 1993, 2003 and 2010.
The date of reference for census 2010 is December 12, 2010. Period of implemention: December 12 to 21, 2010. The Sultanate uses the de jure and the de facto approach in the enumeration.
For information on technical means used in Oman’s censuses, please see:
http://unstats.un.org/unsd/demographic/meetings/Conferences/Korea/2012/docs/s07-5-1-Oman.pdf
2. Institution which provides data
National Center for Statistics and Information (NCSI)
3. Data availability
The National Center for Statistics and Information (NCSI) processes and disseminates all statistical data of use to the public and to government action.
2010’s census results are available on NCSI’s website, in several general thematic publications, in the “publications” section
http://www.ncsi.gov.om/NCSI_website/N_publications_ar.aspx
http://www.ncsi.gov.om/NCSI_website/N_publications.aspx
The present data is taken from a statistical digest series which processes and disseminates census and other data by topic: Data Report n°3, September 2013. “The Domestic Workers” (in Arabic)
http://www.ncsi.gov.om/NCSI_website/PublicationAttachment/domestic%20Workers2013.pdf
Last date of access: 4 November 2014.
|
Muscat |
Dhofar |
Musandam |
Al – Buraymi |
Ad -Dakhliyah |
Al – Batinah North |
Al-Batinah South |
Ash – Sharqiyah North |
Ash – Sharqiyah South |
Adh-Dhahira |
Al – Wusta |
Total |
|
Males |
Females |
Males |
Females |
Males |
Females |
Males |
Females |
Males |
Females |
Males |
Females |
Males |
Females |
Males |
Females |
Males |
Females |
Males |
Females |
Males |
Females |
Males |
Females |
Total |
| 0 – 4 |
35,360 |
33,025 |
14,211 |
13,356 |
1,930 |
1,750 |
3,791 |
3,439 |
22,740 |
22,460 |
33,139 |
31,800 |
19,868 |
19,511 |
11,420 |
11,444 |
13,335 |
13,087 |
10,100 |
9,871 |
1,649 |
1,550 |
167,543 |
161,293 |
328,836 |
| 5 – 9 |
27,558 |
25,718 |
11,075 |
10,401 |
1,504 |
1,363 |
2,955 |
2,678 |
17,722 |
17,491 |
25,827 |
24,764 |
15,484 |
15,194 |
8,900 |
8,912 |
10,392 |
10,191 |
7,872 |
7,687 |
1,287 |
1,207 |
130,576 |
125,606 |
256,182 |
| 10 – 14 |
22,424 |
21,015 |
9,012 |
8,499 |
1,223 |
1,114 |
2,404 |
2,188 |
14,421 |
14,293 |
21,016 |
20,236 |
12,600 |
12,416 |
7,242 |
7,282 |
8,456 |
8,328 |
6,405 |
6,281 |
1,046 |
988 |
106,249 |
102,640 |
208,889 |
| 15 – 19 |
23,897 |
22,143 |
9,604 |
8,955 |
1,304 |
1,173 |
2,562 |
2,306 |
15,368 |
15,060 |
22,396 |
21,322 |
13,427 |
13,083 |
7,718 |
7,673 |
9,012 |
8,775 |
6,826 |
6,618 |
1,114 |
1,040 |
113,228 |
108,148 |
221,376 |
| 20 – 24 |
26,863 |
25,236 |
10,796 |
10,206 |
1,466 |
1,337 |
2,880 |
2,628 |
17,275 |
17,163 |
25,176 |
24,300 |
15,094 |
14,910 |
8,676 |
8,745 |
10,131 |
10,001 |
7,673 |
7,543 |
1,253 |
1,184 |
127,283 |
123,253 |
250,536 |
| 25 – 29 |
25,497 |
24,106 |
10,247 |
9,749 |
1,391 |
1,278 |
2,734 |
2,510 |
16,397 |
16,395 |
23,896 |
23,212 |
14,326 |
14,242 |
8,236 |
8,353 |
9,615 |
9,552 |
7,283 |
7,205 |
1,189 |
1,129 |
120,811 |
117,731 |
238,542 |
| 30 – 34 |
21,128 |
20,153 |
8,491 |
8,150 |
1,153 |
1,068 |
2,265 |
2,098 |
13,587 |
13,706 |
19,801 |
19,405 |
11,871 |
11,906 |
6,824 |
6,983 |
7,968 |
7,986 |
6,035 |
6,023 |
985 |
947 |
100,108 |
98,425 |
198,533 |
| 35 – 39 |
15,563 |
15,009 |
6,255 |
6,070 |
849 |
795 |
1,669 |
1,563 |
10,009 |
10,208 |
14,586 |
14,453 |
8,745 |
8,868 |
5,026 |
5,201 |
5,869 |
5,948 |
4,445 |
4,486 |
726 |
704 |
73,742 |
73,305 |
147,047 |
| 40 – 44 |
10,283 |
9,358 |
4,133 |
3,784 |
561 |
496 |
1,103 |
974 |
6,613 |
6,364 |
9,637 |
9,011 |
5,778 |
5,528 |
3,321 |
3,243 |
3,878 |
3,708 |
2,937 |
2,797 |
480 |
439 |
48,724 |
45,702 |
94,426 |
| 45 – 49 |
7,291 |
7,174 |
2,930 |
2,901 |
398 |
380 |
782 |
747 |
4,689 |
4,879 |
6,833 |
6,908 |
4,097 |
4,238 |
2,355 |
2,486 |
2,750 |
2,843 |
2,083 |
2,144 |
338 |
336 |
34,546 |
35,036 |
69,582 |
| 50 – 54 |
6,553 |
6,665 |
2,634 |
2,696 |
358 |
353 |
703 |
694 |
4,214 |
4,533 |
6,141 |
6,418 |
3,682 |
3,938 |
2,116 |
2,310 |
2,471 |
2,641 |
1,872 |
1,992 |
305 |
314 |
31,049 |
32,554 |
63,603 |
| 55 – 59 |
4,826 |
5,397 |
1,939 |
2,183 |
263 |
286 |
517 |
562 |
3,103 |
3,670 |
4,523 |
5,196 |
2,712 |
3,188 |
1,559 |
1,870 |
1,820 |
2,139 |
1,378 |
1,613 |
226 |
253 |
22,866 |
26,357 |
49,223 |
| 60 – 64 |
3,869 |
4,267 |
1,555 |
1,726 |
211 |
226 |
415 |
444 |
2,488 |
2,902 |
3,626 |
4,109 |
2,174 |
2,521 |
1,250 |
1,479 |
1,459 |
1,691 |
1,105 |
1,275 |
182 |
201 |
18,334 |
20,841 |
39,175 |
| 65 – 69 |
3,091 |
3,069 |
1,242 |
1,241 |
169 |
163 |
331 |
320 |
1,988 |
2,087 |
2,897 |
2,955 |
1,737 |
1,813 |
998 |
1,063 |
1,166 |
1,216 |
883 |
917 |
143 |
143 |
14,645 |
14,987 |
29,632 |
| 70 – 74 |
2,817 |
2,767 |
1,132 |
1,119 |
154 |
147 |
302 |
288 |
1,812 |
1,882 |
2,640 |
2,665 |
1,583 |
1,635 |
910 |
959 |
1,062 |
1,097 |
805 |
827 |
132 |
130 |
13,349 |
13,516 |
26,865 |
| 75 – 79 |
1,968 |
1,523 |
791 |
616 |
107 |
81 |
211 |
159 |
1,266 |
1,036 |
1,845 |
1,466 |
1,106 |
900 |
636 |
528 |
742 |
604 |
562 |
455 |
92 |
70 |
9,326 |
7,438 |
16,764 |
| +80 |
2,364 |
2,108 |
950 |
852 |
129 |
112 |
253 |
219 |
1,520 |
1,433 |
2,215 |
2,030 |
1,328 |
1,245 |
763 |
730 |
891 |
835 |
675 |
630 |
112 |
100 |
11,200 |
10,294 |
21,494 |
| Total |
226,194 |
220,250 |
241,352 |
228,733 |
68,939 |
68,364 |
96,997 |
92,504 |
25,877 |
23,817 |
135,612 |
135,136 |
13,170 |
12,122 |
77,950 |
79,261 |
91,017 |
90,642 |
155,212 |
155,562 |
11,259 |
10,735 |
1,143,579 |
1,117,126 |
2,260,705 |
Source: General Directorate of Civil Status
ANNEXED NOTE
1. Technical Notes and Definitions
The table refers to the population registered in the Sultanate as of mid-2014.
The civil status system in Oman was created by Royal Decree No. 66/99, which established the General Directorate of Civil Status as part of the Royal Oman Police.
This civil database served as a basis for creating a comprehensive civil register (National Registration System (NRS)), an integrated computer system linking all 12 civil status directorates throughout the Sultanate and maintained by the D.G of civil Status.
The DGCS is entrusted with the following responsibilities:
1- Registration of births, deaths, marriages, divorces of Omani nationals
2- Registration of births and deaths of resident expatriates; registration of foreign marriages and divorces if one party is a Omani national
3- Issuance of birth and death certificates; as well as identity cards for Omanis and residence cards to foreign residents
4- Assessment of documents provided by Omani nationals requesting to marry a foreign national and certification of such marriages
5- Assessment of documents provided by applicants to recognition and restoration of Omani citizenship, as well as to naturalisation.
The National Registration System thus includes data on births, deaths, marriages and divorces in the Sultanate. It also includes data on identity cards for Omanis and residence cards for residents.
Registration in the civil register is mandatory for Omanis and residents of the Sultanate. The civil register records the name, gender, age, marital status, nationality, address, telephone numbers, civil number, educational level and occupation.
http://www.civilstatus.gov.om/english/system.asp#register
http://www.civilstatus.gov.om/download.asp?filename=stats2004-2009.pdf
2. Institution which provides data
National Center for Statistics and Information (NCSI)
3. Data availability
The National Center for Statistics and Information (NCSI) processes and disseminates all statistical data of use to the public and to government action.
Since 2010 the NCSI publishes annually a “Population Statistics Bulletin”, presenting data pertaining to registered Omani and expatriates population by sex, nationality and age group by administrative divisions
(governorates and wilayat), as of the mid of the given year.
The publication is bilingual (English and Arabic) and is available in PDF format. It can be dowloaded from NCSI’s website:
http://www.ncsi.gov.om/NCSI_website/N_viewPublications_Ar.aspx?id=2343
Date of access: October 2014.
|
Muscat |
Dhofar |
Musandam |
Al – Buraymi |
Ad -Dakhliyah |
Al – Batinah North |
Al-Batinah South |
Ash – Sharqiyah North |
Ash – Sharqiyah South |
Adh-Dhahira |
Al – Wusta |
Not stated |
Total |
|
Males |
Females |
Males |
Females |
Males |
Females |
Males |
Females |
Males |
Females |
Males |
Females |
Males |
Females |
Males |
Females |
Males |
Females |
Males |
Females |
Males |
Females |
Males |
Females |
Males |
Females |
Total |
| 0 – 4 |
3,200 |
3,050 |
630 |
604 |
26 |
36 |
162 |
152 |
206 |
205 |
538 |
452 |
228 |
217 |
149 |
130 |
163 |
145 |
89 |
101 |
16 |
13 |
11,457 |
10,990 |
16,864 |
16,095 |
32,959 |
| 5 – 9 |
1,017 |
1,139 |
171 |
167 |
4 |
3 |
69 |
65 |
115 |
117 |
203 |
249 |
86 |
66 |
35 |
17 |
25 |
14 |
64 |
41 |
9 |
3 |
14,623 |
13,807 |
16,421 |
15,688 |
32,109 |
| 10 – 14 |
970 |
980 |
74 |
64 |
4 |
2 |
34 |
26 |
16 |
18 |
76 |
52 |
36 |
31 |
7 |
10 |
11 |
11 |
7 |
6 |
0 |
2 |
12,257 |
11,014 |
13,492 |
12,216 |
25,708 |
| 15 – 19 |
3,579 |
3,315 |
673 |
562 |
35 |
30 |
253 |
200 |
166 |
145 |
411 |
332 |
174 |
176 |
84 |
72 |
134 |
97 |
61 |
69 |
16 |
11 |
3,861 |
3,388 |
9,447 |
8,397 |
17,844 |
| 20 – 24 |
42,025 |
8,615 |
13,238 |
1,987 |
1,101 |
204 |
3,764 |
1,148 |
7,226 |
1,464 |
17,441 |
3,724 |
7,422 |
1,464 |
7,520 |
925 |
6,362 |
1,549 |
3,655 |
882 |
1,561 |
62 |
5,638 |
2,356 |
116,953 |
24,380 |
141,333 |
| 25 – 29 |
154,140 |
24,680 |
46,740 |
5,247 |
3,098 |
538 |
11,024 |
3,049 |
22,840 |
4,935 |
54,379 |
10,877 |
22,576 |
4,745 |
25,003 |
3,066 |
22,002 |
4,665 |
11,988 |
2,711 |
5,778 |
341 |
6,263 |
2,689 |
385,831 |
67,543 |
453,374 |
| 30 – 34 |
129,676 |
23,216 |
37,593 |
4,368 |
2,658 |
375 |
8,817 |
1,718 |
17,540 |
3,058 |
39,342 |
6,024 |
16,088 |
2,931 |
18,284 |
1,646 |
16,877 |
2,411 |
9,305 |
1,568 |
4,310 |
232 |
3,665 |
1,774 |
304,155 |
49,321 |
353,476 |
| 35 – 39 |
94,795 |
20,168 |
22,361 |
3,791 |
1,915 |
265 |
5,627 |
1,220 |
10,847 |
2,160 |
23,633 |
4,415 |
10,005 |
2,152 |
10,242 |
1,332 |
10,043 |
1,890 |
5,881 |
1,070 |
2,582 |
158 |
1,975 |
1,046 |
199,906 |
39,667 |
239,573 |
| 40 – 44 |
72,230 |
14,685 |
16,877 |
2,714 |
1,616 |
126 |
4,458 |
749 |
7,897 |
1,232 |
17,395 |
2,561 |
7,563 |
1,278 |
6,863 |
747 |
7,222 |
1,183 |
4,104 |
560 |
1,766 |
100 |
1,154 |
476 |
149,145 |
26,411 |
175,556 |
| 45 – 49 |
49,572 |
9,762 |
11,590 |
1,612 |
1,096 |
69 |
3,102 |
409 |
5,360 |
537 |
11,995 |
1,303 |
5,247 |
616 |
4,190 |
337 |
4,794 |
542 |
2,768 |
212 |
1,106 |
42 |
545 |
230 |
101,365 |
15,671 |
117,036 |
| 50 – 54 |
31,516 |
6,604 |
7,363 |
966 |
653 |
51 |
1,763 |
260 |
3,193 |
303 |
7,134 |
786 |
3,299 |
345 |
2,260 |
210 |
2,769 |
358 |
1,688 |
107 |
526 |
14 |
265 |
137 |
62,429 |
10,141 |
72,570 |
| 55 – 59 |
23,503 |
3,854 |
5,505 |
522 |
431 |
24 |
1,309 |
136 |
1,880 |
127 |
4,216 |
384 |
2,199 |
157 |
1,297 |
90 |
1,714 |
142 |
992 |
56 |
226 |
9 |
129 |
44 |
43,401 |
5,545 |
48,946 |
| 60 – 64 |
7,666 |
1,868 |
1,731 |
217 |
104 |
18 |
352 |
68 |
428 |
46 |
1,003 |
131 |
463 |
58 |
289 |
34 |
377 |
51 |
215 |
26 |
47 |
6 |
19 |
17 |
12,694 |
2,540 |
15,234 |
| 65 – 69 |
2,020 |
825 |
364 |
91 |
18 |
11 |
106 |
35 |
90 |
24 |
198 |
62 |
70 |
29 |
42 |
12 |
56 |
17 |
36 |
10 |
3 |
0 |
9 |
10 |
3,012 |
1,126 |
4,138 |
| 70 – 74 |
494 |
430 |
63 |
48 |
4 |
3 |
31 |
14 |
23 |
17 |
44 |
31 |
20 |
12 |
7 |
10 |
8 |
12 |
10 |
4 |
0 |
0 |
6 |
8 |
710 |
589 |
1,299 |
| 75 – 79 |
192 |
249 |
21 |
27 |
0 |
2 |
3 |
5 |
4 |
5 |
10 |
13 |
3 |
9 |
2 |
2 |
7 |
6 |
3 |
3 |
0 |
1 |
1 |
6 |
246 |
328 |
574 |
| +80 |
111 |
249 |
11 |
13 |
1 |
0 |
6 |
8 |
7 |
7 |
8 |
7 |
7 |
1 |
4 |
2 |
4 |
2 |
0 |
1 |
1 |
1 |
1 |
7 |
161 |
298 |
459 |
| Total |
616,706 |
123,689 |
165,005 |
23,000 |
12,764 |
1,757 |
40,880 |
9,262 |
77,838 |
14,400 |
178,026 |
31,403 |
75,486 |
14,287 |
76,278 |
8,642 |
72,568 |
13,095 |
40,866 |
7,427 |
17,947 |
995 |
61,868 |
47,999 |
1,436,232 |
295,956 |
1,732,188 |
Source: General Directorate of Civil Status
ANNEXED NOTE
1. Technical Notes and Definitions
The table refers to the population registered in the Sultanate as of mid-2014.
The civil status system in Oman was created by Royal Decree No. 66/99, which established the General Directorate of Civil Status as part of the Royal Oman Police.
This civil database served as a basis for creating a comprehensive civil register (National Registration System (NRS)), an integrated computer system linking all 12 civil status directorates throughout the Sultanate and maintained by the D.G of civil Status.
The DGCS is entrusted with the following responsibilities:
1- Registration of births, deaths, marriages, divorces of Omani nationals
2- Registration of births and deaths of resident expatriates; registration of foreign marriages and divorces if one party is a Omani national
3- Issuance of birth and death certificates; issuance of identity cards for Omanis and residence cards to foreign residents
4- Assessment of documents provided by Omani nationals requesting to marry a foreign national and certification of such marriages
5- Assessment of documents provided by applicants to recognition and restoration of Omani citizenship, as well as to naturalisation.
The National Registration System thus includes data on births, deaths, marriages and divorces in the Sultanate. It also includes data on identity cards for Omanis and residence cards for residents.
Registration in the civil register is mandatory for Omanis and residents of the Sultanate. The civil register records the name, gender, age, marital status, nationality, address, telephone numbers, civil number, educational level and occupation.
http://www.civilstatus.gov.om/english/system.asp#register
http://www.civilstatus.gov.om/download.asp?filename=stats2004-2009.pdf
2. Institution which provides data
National Center for Statistics and Information (NCSI)
3. Data availability
The National Center for Statistics and Information (NCSI) processes and disseminates all statistical data of use to the public and to government action.
Since 2010 the NCSI publishes annually a “Population Statistics Bulletin”, presenting data pertaining to registered Omani and expatriates population by sex, nationality and age group by administrative divisions
(governorates and wilayat), as of the mid of the given year.
The publication is bilingual (English and Arabic) and is available in PDF format. It can be dowloaded from NCSI’s website:
http://www.ncsi.gov.om/NCSI_website/N_viewPublications_Ar.aspx?id=2343
Date of access: October 2014.
|
Omani |
Expatriate |
Total |
|
Males |
Females |
Total |
Males |
Females |
Total |
Males |
Females |
Total |
| 0 – 4 |
167,543 |
161,293 |
328,836 |
16,864 |
16,095 |
32,959 |
184,407 |
177,388 |
361,795 |
| 5 – 9 |
130,576 |
125,606 |
256,182 |
16,421 |
15,688 |
32,109 |
146,997 |
141,294 |
288,291 |
| 10 – 14 |
106,249 |
102,640 |
208,889 |
13,492 |
12,216 |
25,708 |
119,741 |
114,856 |
234,597 |
| 15 – 19 |
113,228 |
108,148 |
221,376 |
9,447 |
8,397 |
17,844 |
122,675 |
116,545 |
239,220 |
| 20 – 24 |
127,283 |
123,253 |
250,536 |
116,953 |
24,380 |
141,333 |
244,236 |
147,633 |
391,869 |
| 25 – 29 |
120,811 |
117,731 |
238,542 |
385,831 |
67,543 |
453,374 |
506,642 |
185,274 |
691,916 |
| 30 – 34 |
100,108 |
98,425 |
198,533 |
304,155 |
49,321 |
353,476 |
404,263 |
147,746 |
552,009 |
| 35 – 39 |
73,742 |
73,305 |
147,047 |
199,906 |
39,667 |
239,573 |
273,648 |
112,972 |
386,620 |
| 40 – 44 |
48,724 |
45,702 |
94,426 |
149,145 |
26,411 |
175,556 |
197,869 |
72,113 |
269,982 |
| 45 – 49 |
34,546 |
35,036 |
69,582 |
101,365 |
15,671 |
117,036 |
135,911 |
50,707 |
186,618 |
| 50 – 54 |
31,049 |
32,554 |
63,603 |
62,429 |
10,141 |
72,570 |
93,478 |
42,695 |
136,173 |
| 55 – 59 |
22,866 |
26,357 |
49,223 |
43,401 |
5,545 |
48,946 |
66,267 |
31,902 |
98,169 |
| 60 – 64 |
18,334 |
20,841 |
39,175 |
12,694 |
2,540 |
15,234 |
31,028 |
23,381 |
54,409 |
| 65 – 69 |
14,645 |
14,987 |
29,632 |
3,012 |
1,126 |
4,138 |
17,657 |
16,113 |
33,770 |
| 70 – 74 |
13,349 |
13,516 |
26,865 |
710 |
589 |
1,299 |
14,059 |
14,105 |
28,164 |
| 75 – 79 |
9,326 |
7,438 |
16,764 |
246 |
328 |
574 |
9,572 |
7,766 |
17,338 |
| +80 |
11,200 |
10,294 |
21,494 |
161 |
298 |
459 |
11,361 |
10,592 |
21,953 |
| Total |
1,143,579 |
1,117,126 |
2,260,705 |
1,436,232 |
295,956 |
1,732,188 |
2,579,811 |
1,413,082 |
3,992,893 |
Source: General Directorate of Civil Status
ANNEXED NOTE
1. Technical Notes and Definitions
The table refers to the population registered in the Sultanate as of mid-2014.
The civil status system in Oman was created by Royal Decree No. 66/99, which established the General Directorate of Civil Status as part of the Royal Oman Police.
This civil database served as a basis for creating a comprehensive civil register (National Registration System (NRS)), an integrated computer system linking all 12 civil status directorates throughout the Sultanate and maintained by the D.G of civil Status.
The DGCS is entrusted with the following responsibilities:
1- Registration of births, deaths, marriages, divorces of Omani nationals
2- Registration of births and deaths of resident expatriates; registration of foreign marriages and divorces if one party is a Omani national
3- Issuance of birth and death certificates; as well as identity cards for Omanis and residence cards to foreign residents
4- Assessment of documents provided by Omani nationals requesting to marry a foreign national and certification of such marriages
5- Assessment of documents provided by applicants to recognition and restoration of Omani citizenship, as well as to naturalisation.
The National Registration System thus includes data on births, deaths, marriages and divorces in the Sultanate. It also includes data on identity cards for Omanis and residence cards for residents.
Registration in the civil register is mandatory for Omanis and residents of the Sultanate. The civil register records the name, gender, age, marital status, nationality, address, telephone numbers, civil number, educational level and occupation.
http://www.civilstatus.gov.om/english/system.asp#register
http://www.civilstatus.gov.om/download.asp?filename=stats2004-2009.pdf
2. Institution which provides data
National Center for Statistics and Information (NCSI)
3. Data availability
The National Center for Statistics and Information (NCSI) processes and disseminates all statistical data of use to the public and to government action.
Since 2010 the NCSI publishes annually a “Population Statistics Bulletin”, presenting data pertaining to registered Omani and expatriates population by sex, nationality and age group by administrative divisions
(governorates and wilayat), as of the mid of the given year.
The publication is bilingual (English and Arabic) and is available in PDF format. It can be dowloaded from NCSI’s website:
http://www.ncsi.gov.om/NCSI_website/N_viewPublications_Ar.aspx?id=2343
Date of access: October 2014.
|
Omani |
Expatriate |
Total |
| Male |
Female |
Total |
Male |
Female |
Total |
Male |
Female |
Total |
| Muscat Governorate |
209,062 |
197,944 |
407,006 |
266,084 |
102,788 |
368,872 |
475,146 |
300,732 |
775,878 |
| Al Batinah Region |
313,404 |
307,546 |
620,950 |
120,629 |
31,011 |
151,640 |
434,033 |
338,557 |
772,590 |
| Musandam Governorate |
11,408 |
10,490 |
21,898 |
7,057 |
2,470 |
9,527 |
18,465 |
12,960 |
31,425 |
| Adh Dhahirah Region |
59,716 |
59,161 |
118,877 |
27,728 |
5,059 |
32,787 |
87,444 |
64,220 |
151,664 |
| Ad Dakhliyah Region |
134,448 |
134,621 |
269,069 |
47,507 |
10,075 |
57,582 |
181,955 |
144,696 |
326,651 |
| Ash Sharqiyah Region |
146,363 |
147,031 |
293,394 |
43,436 |
13,684 |
57,120 |
189,799 |
160,715 |
350,514 |
| Al Wusta Region |
9,753 |
9,290 |
19,043 |
22,241 |
827 |
23,068 |
31,994 |
10,117 |
42,111 |
| Dhofar Governorate |
84,021 |
80,052 |
164,073 |
66,350 |
19,306 |
85,656 |
150,371 |
99,358 |
249,729 |
| Al Buraymi Governorate |
22,415 |
20,611 |
43,026 |
20,789 |
9,102 |
29,891 |
43,204 |
29,713 |
72,917 |
| Total |
990,590 |
966,746 |
1,957,336 |
621,821 |
194,322 |
816,143 |
1,612,411 |
1,161,068 |
2,773,479 |
Source: Ministry of National Economy
ANNEXED NOTE
1. Technical Notes and Definitions
The table refers to the population recorded during census 2010.
The Ministry of National Economy of Oman has conducted three censuses in 1993, 2003 and 2010.
“The date of reference for census 2010 is December 12, 2010. Period of implemention: December 12 to 21, 2010. The Sultanate uses the de jure and the de facto approach in the enumeration.”
For information on technical means used in Oman’s censuses, please see:
http://unstats.un.org/unsd/demographic/meetings/Conferences/Korea/2012/docs/s07-5-1-Oman.pdf
2. Institution which provides data
National Center for Statistics and Information (NCSI)
3. Data availability
The National Center for Statistics and Information (NCSI) processes and disseminates all statistical data of use to the public and to government action.
1993′ and 2003’s census results are not available online. However, they are quoted in recent publications released by NCSI (Annual Statistical Yearbooks, survey results, studies).
2010’s census results are available in PDF format in the “publications” section of NCSI’s website, in several thematic publications.
http://www.ncsi.gov.om/NCSI_website/N_publications_ar.aspx
http://www.ncsi.gov.om/NCSI_website/N_publications.aspx
The present data was retrieved from the “Final results” volume of 2010′ census publication, available at:
http://www.ncsi.gov.om/NCSI_website/documents/Census_2010.pdf
Some results are also available in the Ministry of National Economy’s database dedicated to 2010′ census:
http://85.154.248.117/MONE2010/#
Last date of access: October 2014.
|
0 – 14 |
15 – 64 |
65 and above |
Total |
| Oman |
690,701 |
1,197,954 |
68,681 |
1,957,336 |
| U. A. E. |
2,188 |
3,917 |
321 |
6,426 |
| Bahrain |
62 |
312 |
14 |
388 |
| Saudi Arabia |
188 |
514 |
23 |
725 |
| Qatar |
33 |
132 |
3 |
168 |
| Kuwait |
30 |
252 |
8 |
290 |
| GCC countries |
2,501 |
5,127 |
369 |
7,997 |
| Egypt |
10,181 |
19,523 |
173 |
29,877 |
| Sudan |
2,493 |
4,247 |
127 |
6,867 |
| Jordan |
2,857 |
4,481 |
65 |
7,403 |
| Iraq |
1,404 |
2,618 |
137 |
4,159 |
| Other Arab countries |
3,102 |
9,420 |
161 |
12,683 |
| Non-GCC Arab countries |
20,037 |
40,289 |
663 |
60,989 |
| India |
38,185 |
425,085 |
2,390 |
465,660 |
| Bangladesh |
5,655 |
101,281 |
189 |
107,125 |
| Pakistan |
8,523 |
75,586 |
549 |
84,658 |
| Indonesia |
158 |
25,106 |
36 |
25,300 |
| Sri Lanka |
818 |
9,274 |
86 |
10,178 |
| Philippines |
689 |
14,877 |
85 |
15,651 |
| Other Asian countries |
774 |
12,093 |
72 |
12,939 |
| Asian countries |
54,802 |
663,302 |
3,407 |
721,511 |
| Britain |
848 |
3,029 |
177 |
4,054 |
| Other European countries |
836 |
3,490 |
161 |
4,487 |
| U.S. |
382 |
1,089 |
69 |
1,540 |
| Other countries |
1,730 |
13,549 |
286 |
15,565 |
| Rest of the world |
3,796 |
21,157 |
693 |
25,646 |
| Total expatriates |
81,136 |
729,875 |
5,132 |
816,143 |
| Total population |
771,837 |
1,927,829 |
73,813 |
2,773,479 |
Source: Ministry of National Economy
ANNEXED NOTE
1. Technical Notes and Definitions
The table refers to the population recorded during census 2010.
The Ministry of National Economy of Oman has conducted three censuses in 1993, 2003 and 2010.
“The date of reference for census 2010 is December 12, 2010. Period of implemention: December 12 to 21, 2010. The Sultanate uses the de jure and the de facto approach in the enumeration.”
For information on technical means used in Oman’s censuses, please see:
http://unstats.un.org/unsd/demographic/meetings/Conferences/Korea/2012/docs/s07-5-1-Oman.pdf
2. Institution which provides data
National Center for Statistics and Information (NCSI)
3. Data availability
The National Center for Statistics and Information (NCSI) processes and disseminates all statistical data of use to the public and to government action.
1993′ and 2003’s census results are not available online. However, they are quoted in recent publications released by NCSI (Annual Statistical Yearbooks, survey results, studies).
2010’s census results are available on NCSI’s website, in several thematic publications, in the “publications” section
http://www.ncsi.gov.om/NCSI_website/N_publications_ar.aspx
http://www.ncsi.gov.om/NCSI_website/N_publications.aspx
Some results are also available in the Ministry of National Economy’s database dedicated to 2010′ census:
http://85.154.248.117/MONE2010/#
The present results have been retrieved from MONE database.
Last date of access: October 2014.
|
0 – 4 |
5 – 9 |
10 – 14 |
15 – 19 |
20 – 24 |
25 – 29 |
30 – 34 |
35 – 39 |
40 – 44 |
45 – 49 |
50 – 54 |
55 – 59 |
60 – 64 |
65 – 69 |
70 – 74 |
75 – 79 |
80 – 84 |
85 – 89 |
90 – 94 |
95 – 99 |
100+ |
Total |
| Oman |
263,529 |
213,861 |
213,311 |
243,948 |
240,492 |
206,181 |
152,842 |
101,433 |
73,014 |
59,308 |
52,119 |
36,153 |
32,464 |
22,729 |
20,820 |
10,327 |
8,046 |
3,303 |
2,272 |
786 |
398 |
1,957,336 |
| U. A. E. |
942 |
712 |
534 |
453 |
604 |
678 |
692 |
452 |
325 |
218 |
200 |
153 |
142 |
117 |
97 |
48 |
36 |
13 |
3 |
6 |
1 |
6,426 |
| Bahrain |
31 |
17 |
14 |
28 |
57 |
42 |
31 |
36 |
27 |
30 |
23 |
28 |
10 |
6 |
4 |
2 |
2 |
0 |
0 |
0 |
0 |
388 |
| Saudi Arabia |
82 |
55 |
51 |
49 |
65 |
103 |
85 |
53 |
57 |
41 |
31 |
18 |
12 |
11 |
8 |
2 |
1 |
0 |
0 |
1 |
0 |
725 |
| Qatar |
26 |
3 |
4 |
25 |
31 |
21 |
15 |
13 |
10 |
7 |
6 |
3 |
1 |
1 |
0 |
0 |
1 |
1 |
0 |
0 |
0 |
168 |
| Kuwait |
12 |
11 |
7 |
16 |
90 |
23 |
23 |
12 |
24 |
16 |
21 |
14 |
13 |
3 |
4 |
1 |
0 |
0 |
0 |
0 |
0 |
290 |
| Egypt |
3,580 |
3,598 |
3,003 |
1,448 |
1,233 |
2,887 |
3,420 |
3,431 |
2,867 |
2,205 |
1,188 |
573 |
271 |
88 |
46 |
27 |
7 |
3 |
1 |
0 |
1 |
29,877 |
| Sudan |
922 |
831 |
740 |
439 |
257 |
366 |
469 |
614 |
546 |
588 |
524 |
283 |
161 |
67 |
33 |
13 |
7 |
5 |
2 |
0 |
0 |
6,867 |
| Jordan |
1,042 |
985 |
830 |
544 |
379 |
581 |
687 |
626 |
631 |
440 |
302 |
178 |
113 |
40 |
13 |
6 |
6 |
0 |
0 |
0 |
0 |
7,403 |
| Iraq |
513 |
492 |
399 |
322 |
235 |
247 |
335 |
432 |
366 |
252 |
165 |
138 |
126 |
65 |
34 |
21 |
12 |
3 |
1 |
0 |
1 |
4,159 |
| Other Arab countries |
1,385 |
949 |
768 |
632 |
1,080 |
2,164 |
1,908 |
1,294 |
875 |
659 |
402 |
265 |
141 |
78 |
46 |
16 |
11 |
7 |
2 |
1 |
0 |
12,683 |
| India |
14,996 |
13,248 |
9,941 |
5,326 |
44,907 |
93,264 |
84,358 |
72,702 |
53,242 |
32,779 |
23,473 |
11,244 |
3,790 |
1,203 |
571 |
295 |
178 |
87 |
28 |
9 |
19 |
465,660 |
| Bangladesh |
2,364 |
2,119 |
1,172 |
827 |
12,078 |
29,319 |
19,310 |
14,212 |
11,730 |
7,558 |
4,390 |
1,451 |
406 |
91 |
52 |
18 |
20 |
4 |
4 |
0 |
0 |
107,125 |
| Pakistan |
3,402 |
2,892 |
2,229 |
1,902 |
11,426 |
19,150 |
13,831 |
9,671 |
7,510 |
5,067 |
4,160 |
1,968 |
901 |
259 |
145 |
77 |
42 |
17 |
3 |
2 |
4 |
84,658 |
| Indonesia |
67 |
55 |
36 |
290 |
4,200 |
6,810 |
5,885 |
5,023 |
2,059 |
522 |
226 |
60 |
31 |
13 |
8 |
9 |
3 |
1 |
1 |
1 |
0 |
25,300 |
| Sri Lanka |
335 |
294 |
189 |
146 |
528 |
1,276 |
1,455 |
1,484 |
1,487 |
1,369 |
939 |
415 |
175 |
51 |
20 |
7 |
6 |
2 |
0 |
0 |
0 |
10,178 |
| Philippines |
243 |
240 |
206 |
115 |
1,112 |
3,158 |
3,231 |
2,521 |
2,020 |
1,259 |
883 |
416 |
162 |
44 |
29 |
6 |
2 |
2 |
0 |
1 |
1 |
15,651 |
| Other Asian countries |
279 |
271 |
224 |
288 |
2,052 |
3,079 |
2,132 |
1,690 |
1,211 |
754 |
551 |
232 |
104 |
35 |
19 |
6 |
8 |
3 |
0 |
0 |
1 |
12,939 |
| Britain |
258 |
332 |
258 |
152 |
73 |
156 |
223 |
366 |
471 |
423 |
480 |
416 |
269 |
108 |
44 |
14 |
4 |
5 |
0 |
0 |
2 |
4,054 |
| Other European countries |
303 |
300 |
233 |
145 |
187 |
376 |
442 |
502 |
497 |
428 |
406 |
313 |
194 |
99 |
47 |
8 |
6 |
1 |
0 |
0 |
0 |
4,487 |
| U.S. |
127 |
135 |
120 |
60 |
48 |
71 |
106 |
154 |
143 |
146 |
143 |
141 |
77 |
36 |
18 |
9 |
6 |
0 |
0 |
0 |
0 |
1,540 |
| Other countries |
707 |
595 |
428 |
467 |
2,261 |
2,982 |
2,332 |
1,814 |
1,373 |
949 |
675 |
451 |
245 |
135 |
73 |
34 |
25 |
6 |
10 |
2 |
1 |
15,565 |
| Total expatriates |
31,616 |
28,134 |
21,386 |
13,674 |
82,903 |
166,753 |
140,970 |
117,102 |
87,471 |
55,710 |
39,188 |
18,760 |
7,344 |
2,550 |
1,311 |
619 |
383 |
160 |
55 |
23 |
31 |
816,143 |
| Total population |
295,145 |
241,995 |
234,697 |
257,622 |
323,395 |
372,934 |
293,812 |
218,535 |
160,485 |
115,018 |
91,307 |
54,913 |
39,808 |
25,279 |
22,131 |
10,946 |
8,429 |
3,463 |
2,327 |
809 |
429 |
2,773,479 |
Source: Ministry of National Economy
ANNEXED NOTE
1. Technical Notes and Definitions
The table refers to the population recorded during census 2010.
The Ministry of National Economy of Oman has conducted three censuses in 1993, 2003 and 2010.
“The date of reference for census 2010 is December 12, 2010. Period of implemention: December 12 to 21, 2010. The Sultanate uses the de jure and the de facto approach in the enumeration.”
For information on technical means used in Oman’s censuses, please see:
http://unstats.un.org/unsd/demographic/meetings/Conferences/Korea/2012/docs/s07-5-1-Oman.pdf
2. Institution which provides data
National Center for Statistics and Information (NCSI)
3. Data availability
The National Center for Statistics and Information (NCSI) processes and disseminates all statistical data of use to the public and to government action.
1993′ and 2003’s census results are not available online. However, they are quoted in recent publications released by NCSI (Annual Statistical Yearbooks, survey results, studies).
2010’s census results are available on NCSI’s website, in several thematic publications, in the “publications” section
http://www.ncsi.gov.om/NCSI_website/N_publications_ar.aspx
http://www.ncsi.gov.om/NCSI_website/N_publications.aspx
Some results are also available in the Ministry of National Economy’s database dedicated to 2010′ census:
http://85.154.248.117/MONE2010/#
The present results have been retrieved from MONE database.
Last date of access: October 2014.
|
Omanis |
Expatriates |
Total |
| 0 – 4 |
263,529 |
31,616 |
295,145 |
| 5 – 9 |
213,861 |
28,134 |
241,995 |
| 10 – 14 |
213,311 |
21,386 |
234,697 |
| 15 – 19 |
243,948 |
13,674 |
257,622 |
| 20 – 24 |
240,492 |
82,903 |
323,395 |
| 25 – 29 |
206,181 |
166,753 |
372,934 |
| 30 – 34 |
152,842 |
140,970 |
293,812 |
| 35 – 39 |
101,433 |
117,102 |
218,535 |
| 40 – 44 |
73,014 |
87,471 |
160,485 |
| 45 – 49 |
59,308 |
55,710 |
115,018 |
| 50 – 54 |
52,119 |
39,188 |
91,307 |
| 55 – 59 |
36,153 |
18,760 |
54,913 |
| 60 – 64 |
32,464 |
7,344 |
39,808 |
| 65 – 69 |
22,729 |
2,550 |
25,279 |
| 70 – 74 |
20,820 |
1,311 |
22,131 |
| 75 – 79 |
10,327 |
619 |
10,946 |
| 80 – 84 |
8,046 |
383 |
8,429 |
| 85 – 89 |
3,303 |
160 |
3,463 |
| 90 – 94 |
2,272 |
55 |
2,327 |
| 95 – 99 |
786 |
23 |
809 |
| 100+ |
398 |
31 |
429 |
| Total |
1,957,336 |
816,143 |
2,773,479 |
Source: Ministry of National Economy
ANNEXED NOTE
1. Technical Notes and Definitions
The table refers to the population recorded during census 2010.
The Ministry of National Economy of Oman has conducted three censuses in 1993, 2003 and 2010.
“The date of reference for census 2010 is December 12, 2010. Period of implemention: December 12 to 21, 2010. The Sultanate uses the de jure and the de facto approach in the enumeration.”
For information on technical means used in Oman’s censuses, please see:
http://unstats.un.org/unsd/demographic/meetings/Conferences/Korea/2012/docs/s07-5-1-Oman.pdf
2. Institution which provides data
National Center for Statistics and Information (NCSI)
3. Data availability
The National Center for Statistics and Information (NCSI) processes and disseminates all statistical data of use to the public and to government action.
1993′ and 2003’s census results are not available online. However, they are quoted in recent publications released by NCSI (Annual Statistical Yearbooks, survey results, studies).
2010’s census results are available on NCSI’s website, in several thematic publications, in the “publications” section
http://www.ncsi.gov.om/NCSI_website/N_publications_ar.aspx
http://www.ncsi.gov.om/NCSI_website/N_publications.aspx
Some results are also available in the Ministry of National Economy’s database dedicated to 2010′ census:
http://85.154.248.117/MONE2010/#
The present results have been retrieved from MONE database.
Last date of access: October 2014.
|
Population by country of citizenship |
| males |
females |
Total |
| Oman |
990,590 |
966,476 |
1,957,336 |
| U. A. E. |
3,055 |
3,371 |
6,426 |
| Bahrain |
179 |
209 |
388 |
| Saudi Arabia |
473 |
252 |
725 |
| Qatar |
126 |
42 |
168 |
| Kuwait |
220 |
70 |
290 |
| GCC countries |
4,053 |
3,944 |
7,997 |
| Egypt |
17,230 |
12,647 |
29,877 |
| Sudan |
3,629 |
3,238 |
6,867 |
| Jordan |
4,095 |
3,308 |
7,403 |
| Iraq |
2,160 |
1,999 |
4,159 |
| Other Arab countries |
7,088 |
5,595 |
12,683 |
| Non-GCC Arab countries |
34,202 |
26,787 |
60,989 |
| India |
382,315 |
83,345 |
465,660 |
| Bangladesh |
97,377 |
9,748 |
107,125 |
| Pakistan |
73,121 |
11,537 |
84,658 |
| Indonesia |
3,726 |
21,574 |
25,300 |
| Sri Lanka |
835 |
9,343 |
10,178 |
| Philippines |
4,418 |
11,233 |
15,651 |
| Other Asian countries |
8,131 |
4,808 |
12,939 |
| Asian countries |
569,923 |
151,588 |
721,511 |
| Britain |
2,455 |
1,599 |
4,054 |
| Other European countries |
2,695 |
1,792 |
4,487 |
| U.S. |
902 |
638 |
1,540 |
| Other countries |
7,588 |
7,977 |
15,565 |
| Rest of the world |
13,640 |
12,006 |
25,646 |
| Total expatriates |
621,818 |
194,325 |
816,143 |
| Total population |
1,612,408 |
1,160,801 |
2,773,479 |
Source: Ministry of National Economy
ANNEXED NOTE
1. Technical Notes and Definitions
The table refers to the population recorded during census 2010.
The Ministry of National Economy of Oman has conducted three censuses in 1993, 2003 and 2010.
“The date of reference for census 2010 is December 12, 2010. Period of implemention: December 12 to 21, 2010. The Sultanate uses the de jure and the de facto approach in the enumeration.”
For information on technical means used in Oman’s censuses, please see:
http://unstats.un.org/unsd/demographic/meetings/Conferences/Korea/2012/docs/s07-5-1-Oman.pdf
2. Institution which provides data
National Center for Statistics and Information (NCSI)
3. Data availability
The National Center for Statistics and Information (NCSI) processes and disseminates all statistical data of use to the public and to government action.
1993′ and 2003’s census results are not available online. However, they are quoted in recent publications released by NCSI (Annual Statistical Yearbooks, survey results, studies).
2010’s census results are available on NCSI’s website, in several thematic publications, in the “publications” section
http://www.ncsi.gov.om/NCSI_website/N_publications_ar.aspx
http://www.ncsi.gov.om/NCSI_website/N_publications.aspx
Some results are also available in the Ministry of National Economy’s database dedicated to 2010′ census:
http://85.154.248.117/MONE2010/#
The present results have been retrieved from MONE database.
Last date of access: October 2014.
|
Arrivals |
|
2000 |
2001 |
2002 |
2003 |
2004 |
2005 |
2006 |
2007 |
2008 |
2009 |
2010 |
2011 |
2012 |
| Bahraini |
1,178,978 |
1,262,821 |
1,352,057 |
1,459,975 |
1,636,579 |
1,809,064 |
1,961,819 |
2,086,625 |
2,453,067 |
2,423,580 |
2,016,121 |
231,898 |
2,830,248 |
| GCC |
2,925,025 |
3,259,061 |
3,402,725 |
3,293,952 |
3,803,040 |
4,476,501 |
4,768,562 |
4,740,942 |
5,340,339 |
5,242,003 |
4,320,348 |
331,071 |
4,705,901 |
| Kuwaiti |
170,734 |
188,851 |
218,570 |
180,711 |
213,821 |
259,043 |
298,616 |
288,528 |
394,837 |
418,687 |
286,872 |
25,463 |
282,396 |
| Omani |
20,740 |
23,827 |
25,820 |
25,593 |
29,089 |
33,865 |
38,347 |
43,607 |
51,222 |
49,613 |
37,870 |
3,698 |
47,292 |
| Qatari |
82,923 |
88,239 |
89,939 |
86,680 |
103,172 |
137,251 |
154,285 |
155,430 |
161,211 |
152,084 |
113,845 |
8,420 |
115,823 |
| Saudi Arabian |
2,617,406 |
2,922,333 |
3,030,039 |
2,963,641 |
3,415,008 |
4,000,627 |
4,225,623 |
4,195,531 |
4,646,294 |
4,538,023 |
3,825,320 |
288,272 |
4,213,412 |
| Emirate |
33,222 |
35,811 |
38,357 |
37,327 |
41,950 |
45,715 |
51,691 |
57,846 |
86,775 |
83,596 |
56,441 |
5,218 |
46,978 |
| Other Arab |
156,952 |
212,599 |
266,352 |
299,496 |
380,699 |
428,114 |
496,927 |
516,368 |
645,695 |
697,398 |
509,295 |
44,476 |
696,326 |
| Egyptian |
33,060 |
42,141 |
53,719 |
60,651 |
79,913 |
92,269 |
106,470 |
106,875 |
128,586 |
140,154 |
108,941 |
11,606 |
159,770 |
| Iraqi |
1,478 |
2,289 |
3,472 |
3,600 |
6,506 |
10,301 |
10,906 |
11,358 |
13,826 |
15,339 |
12,058 |
569 |
7,868 |
| Jordanian |
33,997 |
48,484 |
67,301 |
74,362 |
90,365 |
100,469 |
112,894 |
115,871 |
136,305 |
141,172 |
106,250 |
12,194 |
159,581 |
| Lebanese |
25,330 |
34,640 |
46,871 |
52,285 |
68,549 |
73,213 |
87,301 |
89,283 |
111,720 |
110,860 |
81,116 |
6,988 |
78,482 |
| Palestinian |
9,052 |
13,874 |
14,265 |
8,897 |
13,666 |
15,131 |
19,385 |
21,078 |
37,381 |
41,299 |
32,154 |
3,192 |
44,937 |
| Sudanese |
11,999 |
14,011 |
15,390 |
20,646 |
25,395 |
29,257 |
34,608 |
36,420 |
48,184 |
57,952 |
37,486 |
3,144 |
41,088 |
| Syrian |
16,953 |
22,399 |
28,346 |
35,178 |
42,670 |
47,239 |
57,332 |
62,957 |
81,236 |
90,651 |
64,762 |
6,783 |
95,514 |
| Other Arabs |
25,083 |
34,761 |
36,988 |
43,877 |
53,635 |
60,235 |
68,031 |
72,526 |
88,457 |
99,971 |
66,528 |
0 |
109,086 |
| Asia |
435,953 |
521,685 |
699,210 |
759,602 |
895,541 |
1,184,599 |
1,288,606 |
1,304,894 |
1,704,021 |
2,010,766 |
1,290,772 |
131,485 |
1,735,920 |
| Bangladeshi |
29,726 |
30,393 |
46,847 |
43,171 |
47,975 |
54,276 |
78,854 |
90,843 |
91,928 |
92,404 |
62,227 |
6,559 |
80,261 |
| Ceylonese |
17,974 |
17,677 |
21,702 |
21,591 |
23,061 |
24,205 |
26,916 |
25,130 |
29,326 |
31,483 |
26,660 |
2,950 |
33,459 |
| Indian |
213,509 |
247,358 |
312,975 |
350,986 |
418,767 |
487,503 |
590,198 |
655,768 |
876,595 |
944,884 |
682,297 |
75,716 |
963,194 |
| Iranian |
2,632 |
3,392 |
10,880 |
16,161 |
20,304 |
22,591 |
27,640 |
8,158 |
9,228 |
8,788 |
5,976 |
186 |
2,792 |
| Japanese |
11,509 |
10,727 |
13,482 |
12,430 |
12,749 |
14,852 |
17,050 |
16,385 |
18,870 |
18,131 |
14,229 |
1,996 |
21,543 |
| Korean ( North ) |
3,604 |
3,630 |
4,128 |
4,227 |
5,429 |
5,833 |
8,767 |
12,738 |
20,506 |
27,632 |
22,302 |
2,281 |
33,686 |
| Korean ( South ) |
10 |
32 |
69 |
115 |
221 |
102 |
45 |
31 |
35 |
46 |
26 |
1 |
43 |
| Malaysian |
1,340 |
2,416 |
4,335 |
4,672 |
8,071 |
9,456 |
12,621 |
17,385 |
26,725 |
23,588 |
14,704 |
1,759 |
12,832 |
| Nepalese |
11,404 |
20,305 |
30,887 |
21,104 |
12,971 |
18,580 |
44,417 |
54,014 |
69,705 |
81,251 |
46,160 |
4,217 |
49,199 |
| Pakistani |
56,473 |
72,531 |
98,345 |
107,723 |
124,522 |
143,991 |
172,258 |
179,444 |
221,303 |
229,958 |
166,715 |
19,356 |
250,523 |
| Philippines |
49,982 |
67,140 |
101,875 |
109,730 |
134,369 |
150,145 |
198,331 |
205,209 |
234,589 |
236,628 |
156,680 |
15,567 |
196,797 |
| Singaporean |
1,472 |
1,461 |
1,432 |
1,459 |
2,921 |
3,069 |
3,847 |
3,854 |
4,543 |
5,082 |
3,967 |
350 |
3,638 |
| Thai |
2,346 |
3,439 |
5,425 |
13,194 |
18,270 |
24,490 |
28,517 |
10,805 |
14,431 |
16,619 |
7,199 |
547 |
9,406 |
| Other Asians |
33,972 |
41,184 |
46,828 |
53,039 |
65,911 |
225,506 |
79,145 |
25,130 |
86,237 |
294,272 |
81,630 |
0 |
78,547 |
| African |
10,679 |
14,316 |
19,484 |
25,349 |
33,200 |
1,602,128 |
43,117 |
42,177 |
54,842 |
52,648 |
33,531 |
1,956 |
44,895 |
| America |
120,796 |
139,544 |
177,097 |
192,215 |
200,473 |
198,767 |
234,463 |
244,184 |
289,495 |
300,413 |
247,047 |
6,110 |
325,755 |
| American |
96,948 |
109,858 |
139,327 |
149,569 |
149,321 |
143,904 |
168,366 |
170,671 |
195,274 |
200,656 |
168,213 |
0 |
238,844 |
| Canadian |
21,559 |
26,405 |
33,419 |
37,307 |
45,008 |
46,969 |
54,267 |
56,290 |
67,958 |
70,778 |
56,980 |
6,110 |
66,321 |
| Other American |
2,289 |
3,281 |
4,351 |
5,339 |
6,144 |
7,894 |
11,830 |
17,223 |
26,263 |
28,979 |
21,854 |
0 |
20,590 |
| Europe |
201,588 |
219,454 |
242,398 |
247,744 |
317,805 |
358,792 |
410,594 |
448,215 |
551,388 |
564,557 |
467,904 |
41,249 |
518,429 |
| Austrian |
1,490 |
1,360 |
1,514 |
1,969 |
3,341 |
3,389 |
4,419 |
6,553 |
7,001 |
7,447 |
7,017 |
558 |
6,125 |
| British |
132,836 |
145,136 |
157,557 |
159,888 |
191,003 |
220,489 |
245,074 |
240,562 |
276,218 |
278,938 |
223,284 |
23,009 |
262,591 |
| Dutch (Netherlands) |
7,638 |
7,433 |
8,415 |
9,158 |
13,262 |
13,955 |
17,249 |
17,579 |
19,252 |
20,094 |
15,707 |
1,370 |
19,746 |
| Finn (Finland) |
614 |
484 |
720 |
786 |
883 |
1,053 |
1,004 |
1,715 |
1,982 |
2,328 |
1,777 |
209 |
2,278 |
| French |
10,959 |
12,089 |
16,372 |
16,979 |
21,277 |
22,946 |
27,516 |
35,484 |
51,797 |
45,239 |
39,367 |
3,089 |
36,812 |
| German |
11,360 |
12,275 |
13,393 |
14,251 |
24,930 |
27,987 |
34,775 |
51,456 |
70,892 |
78,332 |
68,277 |
8,877 |
70,895 |
| Irish |
9,317 |
10,416 |
10,692 |
10,714 |
13,314 |
13,961 |
15,903 |
15,237 |
16,988 |
19,096 |
14,234 |
1,584 |
19,675 |
| Italian |
5,920 |
7,259 |
7,907 |
7,886 |
10,837 |
12,071 |
14,078 |
23,650 |
32,997 |
35,419 |
30,980 |
1,952 |
24,177 |
| Sweden |
2,189 |
2,351 |
2,724 |
3,271 |
3,922 |
3,832 |
4,251 |
4,326 |
5,209 |
5,348 |
4,001 |
305 |
3,880 |
| Swiss |
1,645 |
1,498 |
1,954 |
2,043 |
2,978 |
3,155 |
4,724 |
4,825 |
5,966 |
5,811 |
4,569 |
296 |
4,105 |
| Other Europeans |
17,620 |
19,153 |
21,150 |
20,799 |
32,058 |
35,954 |
41,601 |
46,828 |
63,086 |
66,505 |
58,691 |
0 |
68,145 |
| Oceania |
17,687 |
21,097 |
23,547 |
26,037 |
35,944 |
42,919 |
46,330 |
39,933 |
44,996 |
43,779 |
33,568 |
3,130 |
36,240 |
| Australian |
14,170 |
16,723 |
18,099 |
19,990 |
28,293 |
35,485 |
38,188 |
32,653 |
36,046 |
34,388 |
25,546 |
2,430 |
28,429 |
| New Zealander |
3,517 |
4,374 |
5,448 |
6,047 |
7,651 |
7,434 |
8,142 |
7,280 |
8,950 |
9,391 |
8,022 |
700 |
7,811 |
| Other Nationalities |
58 |
190 |
127 |
102 |
631 |
58,883 |
106 |
83 |
149 |
286 |
426 |
7 |
504 |
| Total |
5,047,716 |
5,650,767 |
6,182,997 |
6,304,472 |
7,303,912 |
10,159,767 |
9,250,524 |
9,423,421 |
11,083,992 |
11,335,430 |
8,919,012 |
791,382 |
10,894,218 |
Source: Central Informatics Organization (CIO), taken from the Ministry of Interior (Immigration Directorate)
ANNEXED NOTE
1. Technical Notes and Definitions
This table shows the flow of arrivals by nationality.
Arrivals are captured and often distinguished by air, sea ports and the King Fahad causeway (land).
Nationality of the person is defined by the passport used to enter the country. A Non-Bahrainis is considered as such depending on the passport used to enter the country (or obtain the visa).
2. Institution which provides data
Ministry of Interior (Immigration Directorate)
Central Informatics Organization, known prior to 2001 as the “Central Statistics Organisation” under the Ministry of Cabinet Affairs.
3. Data availability
Figures and results reported here are available on the Central Informatics Organisation (CIO) website: (http://www.cio.gov.bh)
Figures and results are often reported in tables in both PDF and Excel formats.
Data for 2000 can be found: (http://www.cio.gov.bh/cio_ara/English/Publications/Statistical%20Abstract/2000/2000-CH15%20Transport%20and%20Communications.pdf)
Data for 2001 can be found: (http://www.cio.gov.bh/cio_ara/English/Publications/Statistical%20Abstract/2001/2001-CH15%20Transport%20and%20Communications.pdf)
Data for 2002 can be found: (http://www.cio.gov.bh/cio_ara/English/Publications/Statistical%20Abstract/2002/Ch15%20%202002.pdf)
Data for 2003 can be found: (http://www.cio.gov.bh/cio_ara/English/Publications/Statistical%20Abstract/2003/Ch15%20%202003.pdf)
Data for 2004 can be found: (http://www.cio.gov.bh/cio_ara/English/Publications/Statistical%20Abstract/2004/CH15.pdf)
Data for 2005 can be found: (http://www.cio.gov.bh/cio_ara/English/Publications/Statistical%20Abstract/2005/2005-CH15%20Transport%20and%20Communications.pdf)
Data for 2006 can be found: (http://www.cio.gov.bh/cio_ara/English/Publications/Statistical%20Abstract/2006/PDF/2006-CH15%20Transport%20and%20Communications.pdf)
Data for 2007 can be found: (http://www.cio.gov.bh/cio_ara/English/Publications/Statistical%20Abstract/ABS2007/2007-CH15TransportCommunications.pdf)
Data for 2008 can be found: (http://www.cio.gov.bh/cio_ara/English/Publications/Statistical%20Abstract/ABS2008/Ch15/13.pdf)
Data for 2009 can be found: (http://www.cio.gov.bh/cio_ara/English/Publications/Statistical%20Abstract/ABS2009/Ch15/13.pdf)
Data for 2010 can be found: (http://www.cio.gov.bh/cio_ara/English/Publications/Statistical%20Abstract/ABS2010/Ch15/13.pdf)
Data for 2011 can be found: (http://www.cio.gov.bh/cio_ara/English/Publications/Statistical%20Abstract/ABS2011/15-Transport/12.pdf)
Data for 2012 can be found: (http://www.cio.gov.bh/cio_ara/English/Publications/Statistical%20Abstract/ABS2012/15-Transport/11.pdf)
This information (2000-2011) can also be found in the Statistical Abstracts, Transport & Communication sections.
Date of access: August 2014
|
|
Sector / Number of Employees |
|
|
Commercial |
Government |
Non Commercial Non Government |
|
|
0 -5 |
6 – 9 |
10 – 19 |
20 – 99 |
100 – 499 |
500+ |
Total |
0 -5 |
6 – 9 |
10 – 19 |
20 – 99 |
100 – 499 |
500+ |
Total |
0 -5 |
6 – 9 |
10 – 19 |
20 – 99 |
100 – 499 |
Total |
|
|
Employment |
Dependent |
Employment |
Dependent |
Employment |
Dependent |
Employment |
Dependent |
Employment |
Dependent |
Employment |
Dependent |
Employment |
Dependent |
Employment |
Dependent |
Employment |
Dependent |
Employment |
Dependent |
Employment |
Dependent |
Employment |
Dependent |
Employment |
Dependent |
Employment |
Dependent |
Employment |
Dependent |
Employment |
Dependent |
Employment |
Dependent |
Employment |
Dependent |
Employment |
Dependent |
Employment |
Dependent |
| 2009 |
Q3 |
4,217 |
968 |
1,950 |
356 |
2,314 |
446 |
5,514 |
1,241 |
5,418 |
1,027 |
5,158 |
609 |
24,571 |
4,647 |
3 |
9 |
6 |
10 |
5 |
4 |
60 |
71 |
128 |
146 |
337 |
154 |
539 |
394 |
409 |
25 |
95 |
7 |
42 |
11 |
57 |
29 |
52 |
39 |
655 |
111 |
| Q4 |
4,801 |
1,049 |
2,416 |
463 |
2,974 |
545 |
7,323 |
1,605 |
7,020 |
1,298 |
5,738 |
760 |
30,272 |
5,720 |
4 |
2 |
1 |
2 |
8 |
3 |
111 |
111 |
208 |
259 |
427 |
732 |
759 |
1,109 |
436 |
28 |
76 |
5 |
70 |
14 |
84 |
33 |
101 |
64 |
767 |
144 |
| 2010 |
Q1 |
4,947 |
1,366 |
2,791 |
850 |
3,764 |
884 |
9,293 |
2,287 |
8,205 |
2,055 |
7,156 |
1,105 |
36,156 |
8,547 |
0 |
4 |
2 |
0 |
11 |
25 |
102 |
107 |
121 |
227 |
144 |
1,001 |
380 |
1,364 |
455 |
25 |
142 |
21 |
63 |
29 |
125 |
46 |
149 |
105 |
934 |
226 |
| Q2 |
3,973 |
1,326 |
1,903 |
579 |
2,568 |
784 |
6,037 |
1,990 |
5,517 |
1,719 |
6,106 |
953 |
26,104 |
7,351 |
4 |
5 |
2 |
3 |
9 |
18 |
53 |
94 |
74 |
138 |
196 |
460 |
338 |
718 |
391 |
39 |
78 |
15 |
53 |
13 |
134 |
86 |
229 |
155 |
885 |
308 |
| Q3 |
2,505 |
746 |
1,242 |
319 |
1,684 |
374 |
3,835 |
904 |
4,664 |
668 |
3,655 |
562 |
17,585 |
3,573 |
0 |
1 |
1 |
0 |
3 |
3 |
27 |
42 |
27 |
47 |
45 |
216 |
103 |
309 |
236 |
6 |
35 |
10 |
26 |
2 |
50 |
23 |
57 |
41 |
404 |
82 |
| Q4 |
4,115 |
1,144 |
1,851 |
467 |
2,165 |
576 |
5,741 |
1,384 |
4,676 |
1,195 |
4,609 |
610 |
23,157 |
5,376 |
3 |
0 |
2 |
0 |
9 |
13 |
48 |
61 |
232 |
226 |
541 |
1,121 |
835 |
1,421 |
285 |
18 |
90 |
25 |
32 |
9 |
82 |
47 |
84 |
85 |
573 |
184 |
| 2011 |
Q1 |
4,967 |
1,689 |
2,251 |
757 |
3,066 |
893 |
7,334 |
2,150 |
6,119 |
1,756 |
4,850 |
1,082 |
28,587 |
8,327 |
5 |
7 |
4 |
1 |
45 |
75 |
98 |
134 |
205 |
213 |
758 |
1,267 |
1,115 |
1,697 |
412 |
38 |
100 |
26 |
70 |
25 |
151 |
68 |
97 |
114 |
830 |
271 |
| Q2 |
5,625 |
1,662 |
2,302 |
670 |
2,837 |
789 |
6,087 |
2,028 |
5,221 |
1,763 |
4,129 |
922 |
26,201 |
7,834 |
5 |
8 |
4 |
5 |
18 |
18 |
85 |
106 |
225 |
283 |
375 |
592 |
712 |
1,012 |
500 |
47 |
88 |
18 |
57 |
21 |
136 |
83 |
186 |
184 |
967 |
353 |
| Q3 |
4,908 |
1,218 |
1,916 |
465 |
2,268 |
593 |
4,953 |
1,136 |
3,985 |
1,122 |
3,670 |
560 |
21,700 |
5,094 |
3 |
4 |
2 |
3 |
14 |
10 |
62 |
74 |
201 |
199 |
282 |
368 |
564 |
658 |
443 |
23 |
76 |
12 |
50 |
17 |
80 |
38 |
55 |
64 |
704 |
154 |
| Q4 |
5,094 |
1,400 |
2,404 |
621 |
2,772 |
669 |
6,176 |
1,658 |
5,450 |
1,273 |
4,812 |
773 |
26,708 |
6,394 |
5 |
3 |
5 |
8 |
10 |
10 |
81 |
84 |
180 |
196 |
340 |
453 |
621 |
754 |
476 |
35 |
88 |
12 |
41 |
21 |
96 |
30 |
111 |
73 |
812 |
171 |
| 2012 |
Q1 |
5,634 |
1,820 |
2,806 |
882 |
3,292 |
787 |
7,049 |
2,183 |
6,554 |
1,693 |
5,552 |
924 |
30,887 |
8,289 |
5 |
8 |
10 |
11 |
17 |
22 |
133 |
148 |
164 |
163 |
755 |
1,065 |
1,084 |
1,417 |
520 |
30 |
128 |
10 |
67 |
37 |
106 |
50 |
134 |
120 |
955 |
247 |
| Q2 |
5,148 |
1,721 |
2,256 |
689 |
2,694 |
842 |
5,999 |
2,291 |
5,489 |
1,708 |
4,956 |
1,042 |
26,542 |
8,293 |
5 |
6 |
3 |
6 |
19 |
23 |
90 |
95 |
221 |
269 |
578 |
844 |
916 |
1,243 |
594 |
68 |
137 |
26 |
56 |
15 |
150 |
61 |
218 |
218 |
1,155 |
388 |
| Q3 |
4,753 |
1,278 |
2,106 |
531 |
2,412 |
646 |
5,296 |
1,482 |
5,524 |
1,266 |
4,498 |
736 |
24,589 |
5,939 |
3 |
1 |
9 |
15 |
15 |
14 |
98 |
101 |
188 |
172 |
520 |
681 |
833 |
984 |
584 |
23 |
120 |
16 |
49 |
10 |
105 |
27 |
101 |
58 |
959 |
134 |
| Q4 |
4,958 |
1,531 |
2,222 |
672 |
2,563 |
661 |
5,855 |
1,653 |
5,691 |
1,385 |
4,421 |
787 |
25,710 |
6,689 |
3 |
|
5 |
3 |
11 |
16 |
68 |
86 |
127 |
107 |
518 |
860 |
732 |
1,072 |
526 |
40 |
105 |
8 |
48 |
19 |
124 |
55 |
112 |
87 |
915 |
209 |
| 2013 |
Q1 |
5,055 |
1,779 |
2,228 |
734 |
2,768 |
936 |
6,411 |
2,091 |
6,016 |
1,825 |
4,122 |
1,025 |
26,600 |
8,390 |
5 |
6 |
9 |
17 |
29 |
39 |
87 |
103 |
237 |
229 |
677 |
1,080 |
1,044 |
1,474 |
492 |
52 |
137 |
24 |
47 |
30 |
142 |
83 |
127 |
97 |
945 |
286 |
| Q2 |
5,320 |
2,105 |
2,374 |
827 |
2,712 |
970 |
5,818 |
2,211 |
5,518 |
1,776 |
4,275 |
1,094 |
26,017 |
8,983 |
4 |
16 |
12 |
16 |
25 |
40 |
90 |
123 |
235 |
254 |
844 |
1,263 |
1,210 |
1,712 |
475 |
51 |
126 |
34 |
40 |
29 |
143 |
83 |
199 |
164 |
983 |
361 |
| Q3 |
5,313 |
1,585 |
2,262 |
604 |
2,716 |
651 |
5,511 |
1,545 |
5,552 |
1,353 |
4,861 |
745 |
26,215 |
6,483 |
3 |
6 |
7 |
6 |
9 |
6 |
59 |
84 |
145 |
132 |
525 |
466 |
748 |
700 |
536 |
25 |
116 |
27 |
47 |
21 |
120 |
64 |
73 |
55 |
892 |
192 |
| Q4 |
5,829 |
1,821 |
2,579 |
785 |
2,992 |
832 |
6,343 |
1,823 |
6,405 |
1,583 |
5,454 |
958 |
29,602 |
7,802 |
2 |
4 |
2 |
2 |
9 |
9 |
121 |
97 |
171 |
151 |
586 |
454 |
891 |
717 |
590 |
57 |
131 |
15 |
51 |
21 |
110 |
47 |
105 |
87 |
987 |
227 |
| 2014 |
Q1 |
6,594 |
2,264 |
3,196 |
881 |
3,586 |
1,043 |
7,677 |
2,279 |
7,518 |
1,859 |
5,966 |
1,105 |
34,537 |
9,431 |
3 |
9 |
12 |
15 |
13 |
19 |
113 |
136 |
226 |
211 |
1,006 |
1,512 |
1,373 |
1,902 |
623 |
50 |
132 |
15 |
69 |
29 |
123 |
40 |
155 |
128 |
1,102 |
262 |
| Q2 |
6,421 |
2,308 |
2,856 |
827 |
3,300 |
981 |
6,509 |
2,470 |
6,895 |
1,940 |
5,212 |
1,099 |
31,193 |
9,625 |
5 |
0 |
10 |
14 |
9 |
13 |
117 |
127 |
322 |
352 |
771 |
1,214 |
1,234 |
1,720 |
632 |
56 |
152 |
31 |
56 |
19 |
156 |
90 |
242 |
237 |
1,238 |
433 |
Source: Labour Market Regulatory Authority (LMRA), Expatriate Management System (EMS)
ANNEXED NOTE
1. Technical Notes and Definitions
This table shows the flow of renewed permits (or visas) that are given to foreign regular workers and dependents by the LMRA by the size of establishment.
The LMRA Expatriate Management System (EMS) stores information and past history of sponsors and workers, and their dependents, within the scope of Law No. 19/2006 on regulating the labour market. The scope of the system covers regular, temporary and investor work visas for foreign workers, their dependents, in the commercial sector, the government sector and the non-commercial, non-government sector. It presently excludes domestic workers, and work visas for artists and certain other categories of workers in non-civilian organizations. It distinguishes four types of visas for operational purposes: regular work visas for workers with 24-month validity; temporary work visas issued for workers with 6-month validity; investor work visas issued for investors investing up to BD 100,000; and dependent visas issued for dependent members of eligible foreign workers.The system tracks visa applications, renewals, mobility of workers between employers and from one occupation to another as well as notification of termination and runaway workers, and in general all operations of LMRA including inspection and offence management. The system is updated continuously and linked with other labour-related databases of the Kingdom, including CIO, GDNPR, GOSI, PFC, CSB, Ministry of Labour (MoL), and Ministry of Industry and Commerce (MOIC).
Work Visa is a legal certificate to allow a foreign worker to enter the country for working purposes for a period of two years with the possibility of renewal.
Worker is a generic term that refers to an employed person in general, or to an employee, a self-employed, or a particular category of worker, such as full-time or part-time worker, depending on the context in which the term is used. Four major categories of workers in terms of their status in employment are employees, employers, own-account workers, and unpaid family workers.
Size of establishment is the number of persons engaged in an establishment at a given period, including, in principle, all employees and unpaid family workers as well as any working proprietor. In practice, it refers to the total number of employees registered by anemployer at the responsible administrative agency.
2. Institution which provides data
Labour Market Regulatory Authority (LMRA).
3. Data availability
The LMRA publishes these data under its Bahrain Labour Market Indicators (BLMI) section. The BLMI dashboard can be found in: (http://blmi.lmra.bh/2014/03/mi_dashboard.xml). The general BLMI data with other non-LMRA sources can be found: (http://blmi.lmra.bh/2014/03/mi_data.xml)
Figures and results are often reported in tables in both PDF and Excel formats.
Data for this LMRA table for 2009 can be found here: (http://blmi.lmra.bh/2009/09/data/lmr/Table_36b.pdf) and (http://blmi.lmra.bh/2009/12/data/lmr/Table_36b.pdf).
Data for 2010 can be found here: (http://blmi.lmra.bh/2010/03/data/ems/Table_36b.pdf), (http://blmi.lmra.bh/2010/06/data/ems/Table_36b.pdf), (http://blmi.lmra.bh/2010/09/data/ems/Table_36b.pdf) and (http://blmi.lmra.bh/2010/12/data/ems/Table_36b.pdf).
Data for 2011 can be found here: (http://blmi.lmra.bh/2011/03/data/ems/Table_36b.pdf), (http://blmi.lmra.bh/2011/06/data/ems/Table_36b.pdf), (http://blmi.lmra.bh/2011/09/data/ems/Table_36b.pdf) and (http://blmi.lmra.bh/2011/12/data/ems/Table_36b.pdf).
Data for 2012 can be found here: (http://blmi.lmra.bh/2012/03/data/ems/Table_36b.pdf), (http://blmi.lmra.bh/2012/06/data/ems/Table_36b.pdf), (http://blmi.lmra.bh/2012/09/data/ems/Table_36b.pdf) and (http://blmi.lmra.bh/2012/12/data/ems/Table_36b.pdf).
Data for 2013 can be found here: (http://blmi.lmra.bh/2013/03/data/ems/Table_36b.pdf), (http://blmi.lmra.bh/2013/06/data/ems/Table_36b.pdf), (http://blmi.lmra.bh/2013/09/data/ems/Table_36b.pdf) and (http://blmi.lmra.bh/2013/12/data/ems/Table_36b.pdf).
Data for 2014 can be found here: (http://blmi.lmra.bh/2014/03/data/ems/Table_36b.pdf) and (http://blmi.lmra.bh/2014/06/data/ems/Table_36b.pdf).
The definitions that the LMRA adopts for its data can be found in the Glossary section: (http://blmi.lmra.bh/mi_glossary.xml).
Date of access: September 2014
|
|
Sector / Number of Employees |
|
|
Commercial |
Government |
Non Commercial Non Government |
|
|
0 -5 |
6 – 9 |
10 – 19 |
20 – 99 |
100 – 499 |
500+ |
Total |
0 -5 |
6 – 9 |
10 – 19 |
20 – 99 |
100 – 499 |
500+ |
Total |
0 -5 |
6 – 9 |
10 – 19 |
20 – 99 |
100 – 499 |
Total |
| 2009 |
Q3 |
5,221 |
2,330 |
2,790 |
6,806 |
6,584 |
5,945 |
29,676 |
12 |
16 |
9 |
131 |
274 |
491 |
933 |
434 |
102 |
53 |
87 |
91 |
767 |
| Q4 |
5,912 |
2,890 |
3,557 |
8,995 |
8,427 |
6,857 |
36,638 |
6 |
3 |
11 |
222 |
467 |
1,159 |
1,868 |
465 |
81 |
84 |
117 |
165 |
912 |
| 2010 |
Q1 |
6,394 |
3,693 |
4,681 |
11,611 |
10,354 |
8,331 |
45,064 |
4 |
2 |
36 |
209 |
348 |
1,445 |
2,044 |
480 |
163 |
92 |
171 |
254 |
1,160 |
| Q2 |
5,363 |
2,515 |
3,385 |
8,164 |
7,267 |
7,197 |
33,891 |
9 |
5 |
27 |
147 |
212 |
656 |
1,056 |
430 |
93 |
66 |
220 |
384 |
1,193 |
| Q3 |
3,328 |
1,588 |
2,125 |
4,893 |
5,407 |
4,383 |
21,724 |
1 |
1 |
6 |
72 |
74 |
261 |
415 |
242 |
45 |
28 |
73 |
98 |
486 |
| Q4 |
5,390 |
2,345 |
2,771 |
7,198 |
5,945 |
5,426 |
29,075 |
3 |
2 |
22 |
110 |
458 |
1,662 |
2,257 |
303 |
115 |
42 |
129 |
169 |
758 |
| 2011 |
Q1 |
6,852 |
3,029 |
3,995 |
9,508 |
7,936 |
6,030 |
37,350 |
12 |
5 |
120 |
232 |
418 |
2,025 |
2,812 |
450 |
126 |
95 |
219 |
211 |
1,101 |
| Q2 |
7,439 |
2,992 |
3,635 |
8,188 |
7,146 |
5,204 |
34,604 |
13 |
9 |
36 |
191 |
508 |
967 |
1,724 |
547 |
106 |
78 |
219 |
370 |
1,320 |
| Q3 |
6,241 |
2,397 |
2,874 |
6,117 |
5,149 |
4,330 |
27,108 |
7 |
5 |
24 |
136 |
400 |
650 |
1,222 |
466 |
88 |
67 |
119 |
119 |
859 |
| Q4 |
6,616 |
3,046 |
3,500 |
7,870 |
6,757 |
5,813 |
33,602 |
8 |
13 |
20 |
165 |
376 |
793 |
1,375 |
512 |
100 |
62 |
126 |
184 |
984 |
| 2012 |
Q1 |
7,637 |
3,728 |
4,101 |
9,278 |
8,341 |
6,706 |
39,791 |
13 |
21 |
39 |
281 |
327 |
1,820 |
2,501 |
550 |
138 |
104 |
156 |
254 |
1,202 |
| Q2 |
7,056 |
2,996 |
3,554 |
8,359 |
7,319 |
6,232 |
35,516 |
11 |
9 |
42 |
185 |
490 |
1,422 |
2,159 |
662 |
163 |
71 |
211 |
436 |
1,543 |
| Q3 |
6,195 |
2,658 |
3,096 |
6,876 |
6,859 |
5,452 |
31,136 |
4 |
24 |
29 |
199 |
360 |
1,201 |
1,817 |
607 |
136 |
59 |
132 |
159 |
1,093 |
| Q4 |
6,704 |
2,915 |
3,259 |
7,605 |
7,192 |
5,425 |
33,100 |
3 |
8 |
27 |
154 |
234 |
1,378 |
1,804 |
566 |
113 |
67 |
179 |
199 |
1,124 |
| 2013 |
Q1 |
7,078 |
2,997 |
3,745 |
8,557 |
7,966 |
5,312 |
35,655 |
11 |
26 |
68 |
190 |
466 |
1,757 |
2,518 |
544 |
161 |
77 |
226 |
224 |
1,232 |
| Q2 |
7,647 |
3,233 |
3,702 |
8,074 |
7,354 |
5,477 |
35,487 |
20 |
28 |
65 |
213 |
489 |
2,107 |
2,922 |
526 |
160 |
69 |
227 |
363 |
1,345 |
| Q3 |
7,071 |
2,897 |
3,382 |
7,097 |
6,986 |
5,793 |
33,226 |
9 |
13 |
15 |
143 |
277 |
991 |
1,448 |
561 |
143 |
68 |
184 |
128 |
1,084 |
| Q4 |
7,871 |
3,388 |
3,850 |
8,208 |
8,042 |
6,570 |
37,929 |
6 |
4 |
18 |
218 |
322 |
1,040 |
1,608 |
648 |
146 |
72 |
157 |
192 |
1,215 |
| 2014 |
Q1 |
9,133 |
4,107 |
4,667 |
10,022 |
9,436 |
7,189 |
44,554 |
12 |
27 |
32 |
249 |
437 |
2,518 |
3,275 |
673 |
147 |
98 |
163 |
283 |
1,364 |
| Q2 |
9,031 |
3,719 |
4,310 |
9,031 |
8,859 |
6,373 |
41,323 |
5 |
24 |
22 |
244 |
674 |
1,985 |
2,954 |
688 |
183 |
75 |
246 |
479 |
1,671 |
Source: Labour Market Regulatory Authority (LMRA), Expatriate Management System (EMS)
ANNEXED NOTE
1. Technical Notes and Definitions
This table shows the flow of renewed permits (or visas) that are given to foreigners by the LMRA by the size of the establishment where they work. These renwed visas combine those given for regular and temporary workers, investors and dependents.
The LMRA Expatriate Management System (EMS) stores information and past history of sponsors and workers, and their dependents, within the scope of Law No. 19/2006 on regulating the labour market. The scope of the system covers regular, temporary and investor work visas for foreign workers, their dependents, in the commercial sector, the government sector and the non-commercial, non-government sector. It presently excludes domestic workers, and work visas for artists and certain other categories of workers in non-civilian organizations. It distinguishes four types of visas for operational purposes: regular work visas for workers with 24-month validity; temporary work visas issued for workers with 6-month validity; investor work visas issued for investors investing up to BD 100,000; and dependent visas issued for dependent members of eligible foreign workers.The system tracks visa applications, renewals, mobility of workers between employers and from one occupation to another as well as notification of termination and runaway workers, and in general all operations of LMRA including inspection and offence management. The system is updated continuously and linked with other labour-related databases of the Kingdom, including CIO, GDNPR, GOSI, PFC, CSB, Ministry of Labour (MoL), and Ministry of Industry and Commerce (MOIC).
Work Visa is a legal certificate to allow a foreign worker to enter the country for working purposes for a period of two years with the possibility of renewal.
Worker is a generic term that refers to an employed person in general, or to an employee, a self-employed, or a particular category of worker, such as full-time or part-time worker, depending on the context in which the term is used. Four major categories of workers in terms of their status in employment are employees, employers, own-account workers, and unpaid family workers.
Size of establishment is the number of persons engaged in an establishment at a given period, including, in principle, all employees and unpaid family workers as well as any working proprietor. In practice, it refers to the total number of employees registered by anemployer at the responsible administrative agency.
2. Institution which provides data
Labour Market Regulatory Authority (LMRA).
3. Data availability
The LMRA publishes these data under its Bahrain Labour Market Indicators (BLMI) section. The BLMI dashboard can be found in: (http://blmi.lmra.bh/2014/03/mi_dashboard.xml). The general BLMI data with other non-LMRA sources can be found: (http://blmi.lmra.bh/2014/03/mi_data.xml)
Figures and results are often reported in tables in both PDF and Excel formats.
Data for this LMRA table for 2009 can be found here: (http://blmi.lmra.bh/2009/09/data/lmr/Table_36b.pdf) and (http://blmi.lmra.bh/2009/12/data/lmr/Table_36b.pdf).
Data for 2010 can be found here: (http://blmi.lmra.bh/2010/03/data/ems/Table_36b.pdf), (http://blmi.lmra.bh/2010/06/data/ems/Table_36b.pdf), (http://blmi.lmra.bh/2010/09/data/ems/Table_36b.pdf) and (http://blmi.lmra.bh/2010/12/data/ems/Table_36b.pdf).
Data for 2011 can be found here: (http://blmi.lmra.bh/2011/03/data/ems/Table_36b.pdf), (http://blmi.lmra.bh/2011/06/data/ems/Table_36b.pdf), (http://blmi.lmra.bh/2011/09/data/ems/Table_36b.pdf) and (http://blmi.lmra.bh/2011/12/data/ems/Table_36b.pdf).
Data for 2012 can be found here: (http://blmi.lmra.bh/2012/03/data/ems/Table_36b.pdf), (http://blmi.lmra.bh/2012/06/data/ems/Table_36b.pdf), (http://blmi.lmra.bh/2012/09/data/ems/Table_36b.pdf) and (http://blmi.lmra.bh/2012/12/data/ems/Table_36b.pdf).
Data for 2013 can be found here: (http://blmi.lmra.bh/2013/03/data/ems/Table_36b.pdf), (http://blmi.lmra.bh/2013/06/data/ems/Table_36b.pdf), (http://blmi.lmra.bh/2013/09/data/ems/Table_36b.pdf) and (http://blmi.lmra.bh/2013/12/data/ems/Table_36b.pdf).
Data for 2014 can be found here: (http://blmi.lmra.bh/2014/03/data/ems/Table_36b.pdf) and (http://blmi.lmra.bh/2014/06/data/ems/Table_36b.pdf).
The definitions that the LMRA adopts for its data can be found in the Glossary section: (http://blmi.lmra.bh/mi_glossary.xml).
Date of access: September 2014
|
|
Agriculture, hunting and forestry |
Fishing |
Mining and quarrying |
Manufacturing |
Electricity, gas and water supply |
Construction |
Wholesale and retail trade, repair |
Hotels and restaurants |
Transport, storage, communication |
Financial intermediation |
Real estate, renting, business activities |
Public administration |
Education |
Health and social work |
Other social, personal services |
Extra-territorial organizations, bodies |
Not specified |
Total |
| 2009 |
Q3 |
11 |
0 |
0 |
159 |
0 |
127 |
40 |
4 |
0 |
5 |
31 |
0 |
0 |
0 |
29 |
0 |
0 |
406 |
| Q4 |
0 |
0 |
0 |
117 |
0 |
303 |
126 |
6 |
2 |
0 |
28 |
0 |
0 |
0 |
0 |
0 |
0 |
582 |
| 2010 |
Q1 |
0 |
0 |
0 |
37 |
0 |
141 |
32 |
0 |
2 |
1 |
56 |
0 |
0 |
0 |
0 |
0 |
8 |
277 |
| Q2 |
0 |
0 |
0 |
130 |
0 |
151 |
15 |
0 |
0 |
0 |
34 |
0 |
0 |
0 |
0 |
0 |
0 |
330 |
| Q3 |
0 |
0 |
0 |
170 |
0 |
208 |
62 |
0 |
2 |
2 |
29 |
0 |
0 |
0 |
1 |
0 |
3 |
477 |
| Q4 |
0 |
0 |
0 |
219 |
0 |
110 |
20 |
0 |
2 |
0 |
26 |
0 |
0 |
0 |
0 |
0 |
1 |
378 |
| 2011 |
Q1 |
0 |
0 |
0 |
111 |
0 |
77 |
19 |
2 |
0 |
0 |
8 |
0 |
0 |
0 |
0 |
0 |
0 |
217 |
| Q2 |
0 |
0 |
0 |
189 |
0 |
153 |
9 |
2 |
0 |
0 |
27 |
0 |
0 |
0 |
0 |
0 |
0 |
380 |
| Q3 |
0 |
0 |
3 |
115 |
0 |
32 |
7 |
0 |
0 |
0 |
20 |
0 |
0 |
0 |
1 |
0 |
0 |
178 |
| Q4 |
0 |
0 |
3 |
256 |
5 |
51 |
11 |
0 |
0 |
3 |
28 |
0 |
0 |
0 |
1 |
0 |
0 |
358 |
| 2012 |
Q1 |
0 |
0 |
4 |
185 |
0 |
151 |
1 |
0 |
3 |
2 |
31 |
0 |
0 |
0 |
0 |
0 |
0 |
377 |
| Q2 |
0 |
0 |
1 |
106 |
0 |
278 |
36 |
0 |
0 |
0 |
16 |
0 |
0 |
0 |
0 |
0 |
0 |
437 |
| Q3 |
0 |
0 |
1 |
112 |
0 |
203 |
60 |
0 |
1 |
0 |
18 |
0 |
0 |
0 |
0 |
0 |
0 |
395 |
| Q4 |
0 |
0 |
16 |
231 |
1 |
83 |
89 |
0 |
1 |
0 |
28 |
0 |
0 |
0 |
0 |
0 |
0 |
449 |
| 2013 |
Q1 |
0 |
0 |
2 |
246 |
4 |
63 |
16 |
0 |
1 |
0 |
32 |
0 |
0 |
0 |
0 |
0 |
0 |
364 |
| Q2 |
0 |
0 |
1 |
149 |
1 |
39 |
5 |
0 |
0 |
0 |
15 |
0 |
0 |
0 |
0 |
0 |
0 |
210 |
| Q3 |
0 |
0 |
3 |
225 |
0 |
30 |
32 |
1 |
1 |
0 |
18 |
0 |
0 |
0 |
0 |
0 |
0 |
310 |
| Q4 |
0 |
0 |
3 |
177 |
0 |
22 |
24 |
0 |
4 |
0 |
25 |
0 |
0 |
0 |
2 |
0 |
0 |
257 |
| 2014 |
Q1 |
0 |
0 |
2 |
145 |
0 |
35 |
30 |
0 |
5 |
2 |
19 |
0 |
0 |
0 |
0 |
0 |
0 |
238 |
| Q2 |
0 |
0 |
1 |
90 |
0 |
5 |
29 |
0 |
0 |
0 |
7 |
0 |
0 |
0 |
0 |
0 |
0 |
132 |
Source: Labour Market Regulatory Authority (LMRA), Expatriate Management System (EMS)
ANNEXED NOTE
1. Technical Notes and Definitions
This table shows the flow of new permits (or visas) that are given to foreign temporary workers by the LMRA by sector of economic activity.
The LMRA Expatriate Management System (EMS) stores information and past history of sponsors and workers, and their dependents, within the scope of Law No. 19/2006 on regulating the labour market. The scope of the system covers regular, temporary and investor work visas for foreign workers, their dependents, in the commercial sector, the government sector and the non-commercial, non-government sector. It presently excludes domestic workers, and work visas for artists and certain other categories of workers in non-civilian organizations. It distinguishes four types of visas for operational purposes: regular work visas for workers with 24-month validity; temporary work visas issued for workers with 6-month validity; investor work visas issued for investors investing up to BD 100,000; and dependent visas issued for dependent members of eligible foreign workers.The system tracks visa applications, renewals, mobility of workers between employers and from one occupation to another as well as notification of termination and runaway workers, and in general all operations of LMRA including inspection and offence management. The system is updated continuously and linked with other labour-related databases of the Kingdom, including CIO, GDNPR, GOSI, PFC, CSB, Ministry of Labour (MoL), and Ministry of Industry and Commerce (MOIC).
Temporary Worker is a worker engaged to work in an enterprise for a short period of time, i.e. for less than two years and usually six months.
Work Visa is a legal certificate to allow a foreign worker to enter the country for working purposes for a period of two years with the possibility of renewal.
Worker is a generic term that refers to an employed person in general, or to an employee, a self-employed, or a particular category of worker, such as full-time or part-time worker, depending on the context in which the term is used. Four major categories of workers in terms of their status in employment are employees, employers, own-account workers, and unpaid family workers.
2. Institution which provides data
Labour Market Regulatory Authority (LMRA).
3. Data availability
The LMRA publishes these data under its Bahrain Labour Market Indicators (BLMI) section. The BLMI dashboard can be found in: (http://blmi.lmra.bh/2014/03/mi_dashboard.xml). The general BLMI data with other non-LMRA sources can be found: (http://blmi.lmra.bh/2014/03/mi_data.xml)
Figures and results are often reported in tables in both PDF and Excel formats.
Data for this LMRA table for 2009 can be found here: (http://blmi.lmra.bh/2009/09/data/lmr/Table_36a.pdf) and (http://blmi.lmra.bh/2009/12/data/lmr/Table_36a.pdf).
Data for 2010 can be found here: (http://blmi.lmra.bh/2010/03/data/ems/Table_36a.pdf), (http://blmi.lmra.bh/2010/06/data/ems/Table_36a.pdf), (http://blmi.lmra.bh/2010/09/data/ems/Table_36a.pdf) and (http://blmi.lmra.bh/2010/12/data/ems/Table_36a.pdf).
Data for 2011 can be found here: (http://blmi.lmra.bh/2011/03/data/ems/Table_36a.pdf), (http://blmi.lmra.bh/2011/06/data/ems/Table_36a.pdf), (http://blmi.lmra.bh/2011/09/data/ems/Table_36a.pdf) and (http://blmi.lmra.bh/2011/12/data/ems/Table_36a.pdf).
Data for 2012 can be found here: (http://blmi.lmra.bh/2012/03/data/ems/Table_36a.pdf), (http://blmi.lmra.bh/2012/06/data/ems/Table_36a.pdf), (http://blmi.lmra.bh/2012/09/data/ems/Table_36a.pdf) and (http://blmi.lmra.bh/2012/12/data/ems/Table_36a.pdf).
Data for 2013 can be found here: (http://blmi.lmra.bh/2013/03/data/ems/Table_36a.pdf), (http://blmi.lmra.bh/2013/06/data/ems/Table_36a.pdf), (http://blmi.lmra.bh/2013/09/data/ems/Table_36a.pdf) and (http://blmi.lmra.bh/2013/12/data/ems/Table_36a.pdf).
Data for 2014 can be found here: (http://blmi.lmra.bh/2014/03/data/ems/Table_36a.pdf) and (http://blmi.lmra.bh/2014/06/data/ems/Table_36a.pdf).
The definitions that the LMRA adopts for its data can be found in the Glossary section: (http://blmi.lmra.bh/mi_glossary.xml).
Date of access:September 2014
|
|
Agriculture, hunting and forestry |
Fishing |
Mining and quarrying |
Manufacturing |
Electricity, gas and water supply |
Construction |
Wholesale and retail trade, repair |
Hotels and restaurants |
Transport, storage, communication |
Financial intermediation |
Real estate, renting, business activities |
Public administration |
Education |
Health and social work |
Other social, personal services |
Extra-territorial organizations, bodies |
Not specified |
Total |
| 2009 |
Q3 |
0 |
0 |
0 |
7 |
0 |
4 |
23 |
1 |
0 |
1 |
16 |
0 |
0 |
0 |
0 |
0 |
1 |
53 |
| Q4 |
0 |
0 |
0 |
4 |
0 |
2 |
33 |
2 |
2 |
1 |
19 |
0 |
2 |
0 |
0 |
0 |
0 |
65 |
| 2010 |
Q1 |
0 |
0 |
0 |
9 |
0 |
0 |
42 |
6 |
0 |
3 |
23 |
0 |
1 |
0 |
0 |
0 |
0 |
84 |
| Q2 |
1 |
0 |
0 |
12 |
0 |
1 |
47 |
4 |
2 |
8 |
30 |
0 |
0 |
0 |
1 |
0 |
0 |
106 |
| Q3 |
0 |
0 |
0 |
8 |
0 |
2 |
37 |
5 |
2 |
5 |
29 |
0 |
0 |
3 |
1 |
0 |
0 |
92 |
| Q4 |
0 |
0 |
1 |
12 |
0 |
3 |
71 |
4 |
3 |
10 |
57 |
0 |
2 |
0 |
3 |
0 |
0 |
166 |
| 2011 |
Q1 |
0 |
0 |
0 |
15 |
0 |
11 |
112 |
9 |
3 |
7 |
59 |
0 |
1 |
0 |
2 |
0 |
0 |
219 |
| Q2 |
0 |
1 |
1 |
10 |
0 |
4 |
74 |
5 |
3 |
12 |
77 |
0 |
2 |
0 |
0 |
0 |
0 |
189 |
| Q3 |
0 |
0 |
0 |
16 |
0 |
4 |
57 |
4 |
3 |
7 |
43 |
0 |
0 |
0 |
3 |
0 |
0 |
137 |
| Q4 |
0 |
0 |
0 |
11 |
0 |
1 |
61 |
6 |
2 |
7 |
50 |
0 |
1 |
0 |
4 |
0 |
0 |
143 |
| 2012 |
Q1 |
0 |
0 |
0 |
20 |
0 |
3 |
105 |
9 |
4 |
8 |
88 |
0 |
1 |
0 |
0 |
0 |
0 |
238 |
| Q2 |
0 |
0 |
0 |
24 |
0 |
3 |
102 |
5 |
5 |
16 |
84 |
0 |
0 |
1 |
4 |
0 |
0 |
244 |
| Q3 |
0 |
0 |
0 |
12 |
0 |
7 |
89 |
8 |
5 |
13 |
73 |
0 |
2 |
4 |
0 |
0 |
0 |
213 |
| Q4 |
0 |
0 |
0 |
19 |
0 |
4 |
126 |
6 |
1 |
12 |
78 |
0 |
1 |
0 |
5 |
0 |
0 |
252 |
| 2013 |
Q1 |
0 |
0 |
0 |
20 |
0 |
7 |
139 |
11 |
4 |
9 |
107 |
0 |
2 |
0 |
3 |
0 |
0 |
302 |
| Q2 |
2 |
0 |
1 |
11 |
0 |
2 |
117 |
8 |
4 |
13 |
116 |
0 |
1 |
0 |
3 |
0 |
0 |
278 |
| Q3 |
0 |
1 |
0 |
19 |
0 |
7 |
72 |
9 |
3 |
14 |
88 |
0 |
1 |
0 |
4 |
0 |
0 |
218 |
| Q4 |
1 |
0 |
0 |
13 |
0 |
6 |
95 |
9 |
7 |
10 |
122 |
0 |
3 |
0 |
3 |
0 |
0 |
269 |
| 2014 |
Q1 |
0 |
0 |
0 |
15 |
0 |
3 |
137 |
14 |
6 |
12 |
157 |
0 |
0 |
2 |
2 |
0 |
0 |
348 |
| Q2 |
0 |
0 |
0 |
26 |
0 |
5 |
161 |
9 |
1 |
23 |
145 |
0 |
0 |
5 |
3 |
0 |
0 |
378 |
Source: Labour Market Regulatory Authority (LMRA), Expatriate Management System (EMS)
ANNEXED NOTE
1. Technical Notes and Definitions
This table shows the flow of renewed permits (or visas) that are given to foreign investors by the LMRA by sector of economic activity.
The LMRA Expatriate Management System (EMS) stores information and past history of sponsors and workers, and their dependents, within the scope of Law No. 19/2006 on regulating the labour market. The scope of the system covers regular, temporary and investor work visas for foreign workers, their dependents, in the commercial sector, the government sector and the non-commercial, non-government sector. It presently excludes domestic workers, and work visas for artists and certain other categories of workers in non-civilian organizations. It distinguishes four types of visas for operational purposes: regular work visas for workers with 24-month validity; temporary work visas issued for workers with 6-month validity; investor work visas issued for investors investing up to BD 100,000; and dependent visas issued for dependent members of eligible foreign workers.The system tracks visa applications, renewals, mobility of workers between employers and from one occupation to another as well as notification of termination and runaway workers, and in general all operations of LMRA including inspection and offence management. The system is updated continuously and linked with other labour-related databases of the Kingdom, including CIO, GDNPR, GOSI, PFC, CSB, Ministry of Labour (MoL), and Ministry of Industry and Commerce (MOIC).
Investor work visas are issued for investors investing up to BD 100,000.
2. Institution which provides data
Labour Market Regulatory Authority (LMRA).
3. Data availability
The LMRA publishes these data under its Bahrain Labour Market Indicators (BLMI) section. The BLMI dashboard can be found in: (http://blmi.lmra.bh/2014/03/mi_dashboard.xml). The general BLMI data with other non-LMRA sources can be found: (http://blmi.lmra.bh/2014/03/mi_data.xml)
Figures and results are often reported in tables in both PDF and Excel formats.
Data for this LMRA table for 2009 can be found here: (http://blmi.lmra.bh/2009/09/data/lmr/Table_36a.pdf) and (http://blmi.lmra.bh/2009/12/data/lmr/Table_36a.pdf).
Data for 2010 can be found here: (http://blmi.lmra.bh/2010/03/data/ems/Table_36a.pdf), (http://blmi.lmra.bh/2010/06/data/ems/Table_36a.pdf), (http://blmi.lmra.bh/2010/09/data/ems/Table_36a.pdf) and (http://blmi.lmra.bh/2010/12/data/ems/Table_36a.pdf).
Data for 2011 can be found here: (http://blmi.lmra.bh/2011/03/data/ems/Table_36a.pdf), (http://blmi.lmra.bh/2011/06/data/ems/Table_36a.pdf), (http://blmi.lmra.bh/2011/09/data/ems/Table_36a.pdf) and (http://blmi.lmra.bh/2011/12/data/ems/Table_36a.pdf).
Data for 2012 can be found here: (http://blmi.lmra.bh/2012/03/data/ems/Table_36a.pdf), (http://blmi.lmra.bh/2012/06/data/ems/Table_36a.pdf), (http://blmi.lmra.bh/2012/09/data/ems/Table_36a.pdf) and (http://blmi.lmra.bh/2012/12/data/ems/Table_36a.pdf).
Data for 2013 can be found here: (http://blmi.lmra.bh/2013/03/data/ems/Table_36a.pdf), (http://blmi.lmra.bh/2013/06/data/ems/Table_36a.pdf), (http://blmi.lmra.bh/2013/09/data/ems/Table_36a.pdf) and (http://blmi.lmra.bh/2013/12/data/ems/Table_36a.pdf).
Data for 2014 can be found here: (http://blmi.lmra.bh/2014/03/data/ems/Table_36a.pdf) and (http://blmi.lmra.bh/2014/06/data/ems/Table_36a.pdf).
The definitions that the LMRA adopts for its data can be found in the Glossary section: (http://blmi.lmra.bh/mi_glossary.xml).
Date of access: September 2014
|
|
Agriculture, hunting and forestry |
Fishing |
Mining and quarrying |
Manufacturing |
Electricity, gas and water supply |
Construction |
Wholesale and retail trade, repair |
Hotels and restaurants |
Transport, storage, communication |
Financial intermediation |
Real estate, renting, business activities |
Public administration |
Education |
Health and social work |
Other social, personal services |
Extra-territorial organizations, bodies |
Not specified |
Total |
|
|
Employment |
Dependent |
Employment |
Dependent |
Employment |
Dependent |
Employment |
Dependent |
Employment |
Dependent |
Employment |
Dependent |
Employment |
Dependent |
Employment |
Dependent |
Employment |
Dependent |
Employment |
Dependent |
Employment |
Dependent |
Employment |
Dependent |
Employment |
Dependent |
Employment |
Dependent |
Employment |
Dependent |
Employment |
Dependent |
Employment |
Dependent |
Employment |
Dependent |
| 2009 |
Q3 |
189 |
16 |
38 |
0 |
160 |
69 |
4,167 |
656 |
11 |
9 |
8,604 |
751 |
5,806 |
1,550 |
1,875 |
196 |
1,111 |
309 |
388 |
373 |
1,667 |
666 |
29 |
34 |
114 |
103 |
30 |
15 |
602 |
59 |
0 |
0 |
974 |
346 |
25,765 |
5,152 |
| Q4 |
207 |
21 |
43 |
1 |
202 |
83 |
5,331 |
845 |
7 |
15 |
10,456 |
853 |
7,512 |
1,961 |
2,358 |
210 |
995 |
412 |
481 |
458 |
2,064 |
832 |
51 |
49 |
261 |
217 |
61 |
20 |
637 |
23 |
0 |
0 |
1,132 |
973 |
31,798 |
6,973 |
| 2010 |
Q1 |
185 |
19 |
67 |
4 |
307 |
167 |
6,061 |
1,204 |
11 |
18 |
12,617 |
1,096 |
8,811 |
2,702 |
2,967 |
373 |
1,069 |
535 |
753 |
891 |
2,517 |
1,345 |
75 |
105 |
241 |
290 |
101 |
62 |
713 |
70 |
0 |
0 |
1,275 |
1,256 |
37,770 |
10,137 |
| Q2 |
82 |
14 |
65 |
4 |
151 |
125 |
4,346 |
1,117 |
9 |
6 |
9,219 |
1,013 |
5,670 |
2,218 |
1,911 |
295 |
1,000 |
440 |
612 |
764 |
2,382 |
1,190 |
38 |
41 |
372 |
325 |
118 |
43 |
575 |
66 |
0 |
0 |
777 |
716 |
27,327 |
8,377 |
| Q3 |
54 |
4 |
26 |
1 |
96 |
32 |
2,806 |
550 |
4 |
3 |
7,057 |
580 |
3,679 |
1,191 |
1,261 |
157 |
606 |
244 |
373 |
300 |
1,290 |
440 |
12 |
16 |
118 |
87 |
50 |
18 |
322 |
40 |
0 |
0 |
338 |
301 |
18,092 |
3,964 |
| Q4 |
179 |
19 |
142 |
7 |
183 |
94 |
3,145 |
723 |
6 |
7 |
8,966 |
745 |
5,150 |
1,867 |
1,916 |
218 |
802 |
313 |
467 |
502 |
1,921 |
817 |
516 |
1,117 |
233 |
239 |
167 |
47 |
536 |
46 |
0 |
0 |
236 |
220 |
24,565 |
6,981 |
| 2011 |
Q1 |
266 |
11 |
149 |
0 |
246 |
139 |
4,579 |
1,298 |
16 |
19 |
9,517 |
1,142 |
7,007 |
2,836 |
2,260 |
283 |
1,157 |
490 |
672 |
767 |
2,423 |
1,194 |
740 |
1,295 |
311 |
301 |
216 |
80 |
630 |
90 |
0 |
0 |
343 |
350 |
30,532 |
10,295 |
| Q2 |
268 |
13 |
175 |
5 |
308 |
96 |
4,588 |
1,174 |
20 |
23 |
7,812 |
1,184 |
6,836 |
2,610 |
2,162 |
305 |
936 |
522 |
601 |
672 |
2,244 |
1,160 |
388 |
605 |
447 |
435 |
152 |
47 |
720 |
75 |
0 |
0 |
223 |
273 |
27,880 |
9,199 |
| Q3 |
188 |
7 |
196 |
3 |
190 |
80 |
3,953 |
716 |
15 |
33 |
6,155 |
765 |
5,999 |
1,785 |
1,782 |
186 |
884 |
323 |
398 |
401 |
1,714 |
736 |
301 |
382 |
181 |
147 |
84 |
41 |
686 |
71 |
0 |
0 |
242 |
230 |
22,968 |
5,906 |
| Q4 |
255 |
16 |
188 |
5 |
167 |
78 |
4,772 |
921 |
18 |
21 |
8,603 |
978 |
6,443 |
2,274 |
2,327 |
253 |
932 |
375 |
498 |
471 |
2,235 |
885 |
360 |
472 |
266 |
218 |
120 |
67 |
744 |
68 |
0 |
0 |
213 |
217 |
28,141 |
7,319 |
| 2012 |
Q1 |
284 |
31 |
265 |
8 |
195 |
129 |
5,063 |
1,191 |
13 |
20 |
10,689 |
1,200 |
7,454 |
2,762 |
2,710 |
367 |
976 |
504 |
737 |
766 |
2,249 |
1,196 |
748 |
1,064 |
295 |
273 |
212 |
67 |
764 |
116 |
1 |
0 |
271 |
259 |
32,926 |
9,953 |
| Q2 |
259 |
17 |
286 |
3 |
158 |
147 |
4,337 |
1,219 |
25 |
29 |
9,094 |
1,246 |
6,449 |
2,605 |
1,995 |
423 |
954 |
490 |
668 |
753 |
2,122 |
1,265 |
554 |
802 |
454 |
468 |
223 |
94 |
784 |
109 |
0 |
1 |
251 |
253 |
28,613 |
9,924 |
| Q3 |
247 |
14 |
346 |
2 |
194 |
115 |
4,068 |
806 |
30 |
39 |
8,317 |
957 |
6,250 |
2,040 |
1,932 |
250 |
825 |
352 |
487 |
488 |
1,838 |
793 |
520 |
680 |
236 |
199 |
212 |
52 |
647 |
57 |
0 |
0 |
232 |
213 |
26,381 |
7,057 |
| Q4 |
239 |
24 |
301 |
6 |
149 |
87 |
3,763 |
921 |
23 |
22 |
9,295 |
1,002 |
6,364 |
2,438 |
2,211 |
302 |
878 |
432 |
495 |
505 |
1,746 |
850 |
486 |
820 |
262 |
202 |
225 |
68 |
727 |
92 |
0 |
0 |
193 |
199 |
27,357 |
7,970 |
| 2013 |
Q1 |
269 |
25 |
225 |
3 |
236 |
115 |
3,868 |
1,160 |
13 |
24 |
8,728 |
1,158 |
6,988 |
3,080 |
2,260 |
302 |
989 |
538 |
622 |
700 |
2,235 |
1,168 |
626 |
1,019 |
320 |
289 |
207 |
102 |
682 |
93 |
0 |
0 |
321 |
374 |
28,589 |
10,150 |
| Q2 |
271 |
18 |
184 |
8 |
178 |
106 |
4,157 |
1,335 |
25 |
45 |
8,205 |
1,398 |
6,688 |
3,121 |
2,238 |
368 |
919 |
511 |
589 |
729 |
2,328 |
1,293 |
788 |
1,202 |
481 |
413 |
165 |
52 |
714 |
130 |
0 |
0 |
280 |
327 |
28,210 |
11,056 |
| Q3 |
258 |
15 |
256 |
3 |
246 |
94 |
4,119 |
958 |
9 |
14 |
8,751 |
1,000 |
6,851 |
2,281 |
2,137 |
243 |
838 |
412 |
492 |
467 |
2,079 |
946 |
476 |
424 |
207 |
187 |
111 |
41 |
807 |
55 |
0 |
0 |
218 |
235 |
27,855 |
7,375 |
| Q4 |
278 |
32 |
294 |
10 |
209 |
167 |
4,714 |
1,006 |
22 |
29 |
10,302 |
1,317 |
7,492 |
2,801 |
2,601 |
339 |
970 |
419 |
467 |
533 |
2,060 |
1,045 |
570 |
418 |
245 |
206 |
151 |
71 |
833 |
107 |
0 |
0 |
272 |
246 |
31,480 |
8,746 |
| 2014 |
Q1 |
297 |
37 |
270 |
4 |
294 |
210 |
5,382 |
1,334 |
15 |
25 |
12,367 |
1,373 |
8,449 |
3,242 |
3,118 |
475 |
986 |
545 |
638 |
749 |
2,328 |
1,311 |
976 |
1,474 |
334 |
255 |
234 |
107 |
1,026 |
131 |
1 |
2 |
297 |
321 |
37,012 |
11,595 |
| Q2 |
372 |
38 |
268 |
3 |
283 |
174 |
4,995 |
1,327 |
31 |
51 |
11,065 |
1,583 |
7,696 |
3,316 |
2,732 |
498 |
1,101 |
546 |
593 |
748 |
2,250 |
1,354 |
750 |
1,178 |
520 |
496 |
226 |
114 |
902 |
109 |
0 |
|
347 |
377 |
34,131 |
11,912 |
Source: Labour Market Regulatory Authority (LMRA), Expatriate Management System (EMS)
ANNEXED NOTE
1. Technical Notes and Definitions
This table shows the flow of renewed permits (or visas) that are given to foreign regular workers and dependents by the LMRA, by sector of economic activity.
The LMRA Expatriate Management System (EMS) stores information and past history of sponsors and workers, and their dependents, within the scope of Law No. 19/2006 on regulating the labour market. The scope of the system covers regular, temporary and investor work visas for foreign workers, their dependents, in the commercial sector, the government sector and the non-commercial, non-government sector. It presently excludes domestic workers, and work visas for artists and certain other categories of workers in non-civilian organizations. It distinguishes four types of visas for operational purposes: regular work visas for workers with 24-month validity; temporary work visas issued for workers with 6-month validity; investor work visas issued for investors investing up to BD 100,000; and dependent visas issued for dependent members of eligible foreign workers.The system tracks visa applications, renewals, mobility of workers between employers and from one occupation to another as well as notification of termination and runaway workers, and in general all operations of LMRA including inspection and offence management. The system is updated continuously and linked with other labour-related databases of the Kingdom, including CIO, GDNPR, GOSI, PFC, CSB, Ministry of Labour (MoL), and Ministry of Industry and Commerce (MOIC).
Work Visa is a legal certificate to allow a foreign worker to enter the country for working purposes for a period of two years with the possibility of renewal.
Worker is a generic term that refers to an employed person in general, or to an employee, a self-employed, or a particular category of worker, such as full-time or part-time worker, depending on the context in which the term is used. Four major categories of workers in terms of their status in employment are employees, employers, own-account workers, and unpaid family workers.
2. Institution which provides data
Labour Market Regulatory Authority (LMRA).
3. Data availability
The LMRA publishes these data under its Bahrain Labour Market Indicators (BLMI) section. The BLMI dashboard can be found in: (http://blmi.lmra.bh/2014/03/mi_dashboard.xml). The general BLMI data with other non-LMRA sources can be found: (http://blmi.lmra.bh/2014/03/mi_data.xml)
Figures and results are often reported in tables in both PDF and Excel formats.
Data for this LMRA table for 2009 can be found here: (http://blmi.lmra.bh/2009/09/data/lmr/Table_36a.pdf) and (http://blmi.lmra.bh/2009/12/data/lmr/Table_36a.pdf).
Data for 2010 can be found here: (http://blmi.lmra.bh/2010/03/data/ems/Table_36a.pdf), (http://blmi.lmra.bh/2010/06/data/ems/Table_36a.pdf), (http://blmi.lmra.bh/2010/09/data/ems/Table_36a.pdf) and (http://blmi.lmra.bh/2010/12/data/ems/Table_36a.pdf).
Data for 2011 can be found here: (http://blmi.lmra.bh/2011/03/data/ems/Table_36a.pdf), (http://blmi.lmra.bh/2011/06/data/ems/Table_36a.pdf), (http://blmi.lmra.bh/2011/09/data/ems/Table_36a.pdf) and (http://blmi.lmra.bh/2011/12/data/ems/Table_36a.pdf).
Data for 2012 can be found here: (http://blmi.lmra.bh/2012/03/data/ems/Table_36a.pdf), (http://blmi.lmra.bh/2012/06/data/ems/Table_36a.pdf), (http://blmi.lmra.bh/2012/09/data/ems/Table_36a.pdf) and (http://blmi.lmra.bh/2012/12/data/ems/Table_36a.pdf).
Data for 2013 can be found here: (http://blmi.lmra.bh/2013/03/data/ems/Table_36a.pdf), (http://blmi.lmra.bh/2013/06/data/ems/Table_36a.pdf), (http://blmi.lmra.bh/2013/09/data/ems/Table_36a.pdf) and (http://blmi.lmra.bh/2013/12/data/ems/Table_36a.pdf).
Data for 2014 can be found here: (http://blmi.lmra.bh/2014/03/data/ems/Table_36a.pdf) and (http://blmi.lmra.bh/2014/06/data/ems/Table_36a.pdf).
The definitions that the LMRA adopts for its data can be found in the Glossary section: (http://blmi.lmra.bh/mi_glossary.xml).
Date of access:September 2014
|
|
Agriculture, hunting and forestry |
Fishing |
Mining and quarrying |
Manufacturing |
Electricity, gas and water supply |
Construction |
Wholesale and retail trade, repair |
Hotels and restaurants |
Transport, storage, communication |
Financial intermediation |
Real estate, renting, business activities |
Public administration |
Education |
Health and social work |
Other social, personal services |
Extra-territorial organizations, bodies |
Not specified |
Total |
| 2009 |
Q3 |
216 |
38 |
229 |
4,989 |
20 |
9,486 |
7,419 |
2,076 |
1,420 |
767 |
2,380 |
63 |
217 |
45 |
690 |
0 |
1,321 |
31,376 |
| Q4 |
228 |
44 |
285 |
6,297 |
22 |
11,614 |
9,632 |
2,576 |
1,411 |
940 |
2,943 |
100 |
480 |
81 |
660 |
0 |
2,105 |
39,418 |
| 2010 |
Q1 |
204 |
71 |
474 |
7,311 |
29 |
13,854 |
11,587 |
3,346 |
1,606 |
1,648 |
3,941 |
180 |
532 |
163 |
783 |
0 |
2,539 |
48,268 |
| Q2 |
97 |
69 |
276 |
5,605 |
15 |
10,384 |
7,950 |
2,210 |
1,442 |
1,384 |
3,636 |
79 |
697 |
161 |
642 |
0 |
1,493 |
36,140 |
| Q3 |
58 |
27 |
128 |
3,534 |
7 |
7,847 |
4,969 |
1,423 |
854 |
680 |
1,788 |
28 |
205 |
71 |
364 |
0 |
642 |
22,625 |
| Q4 |
198 |
149 |
278 |
4,099 |
13 |
9,824 |
7,108 |
2,138 |
1,120 |
979 |
2,821 |
1,633 |
474 |
214 |
585 |
0 |
457 |
32,090 |
| 2011 |
Q1 |
277 |
149 |
385 |
6,003 |
35 |
10,747 |
9,974 |
2,554 |
1,650 |
1,446 |
3,684 |
2,035 |
613 |
296 |
722 |
0 |
693 |
41,263 |
| Q2 |
281 |
181 |
405 |
5,961 |
43 |
9,153 |
9,529 |
2,474 |
1,461 |
1,285 |
3,508 |
993 |
884 |
199 |
795 |
0 |
496 |
37,648 |
| Q3 |
195 |
199 |
273 |
4,800 |
48 |
6,956 |
7,848 |
1,972 |
1,210 |
806 |
2,513 |
683 |
328 |
125 |
761 |
0 |
472 |
29,189 |
| Q4 |
271 |
193 |
248 |
5,960 |
44 |
9,633 |
8,789 |
2,586 |
1,309 |
979 |
3,198 |
832 |
485 |
187 |
817 |
0 |
430 |
35,961 |
| 2012 |
Q1 |
315 |
273 |
328 |
6,459 |
33 |
12,043 |
10,322 |
3,086 |
1,487 |
1,513 |
3,564 |
1,812 |
569 |
279 |
880 |
1 |
530 |
43,494 |
| Q2 |
276 |
289 |
306 |
5,686 |
54 |
10,621 |
9,192 |
2,423 |
1,449 |
1,437 |
3,487 |
1,356 |
922 |
318 |
897 |
1 |
504 |
39,218 |
| Q3 |
261 |
348 |
310 |
4,998 |
69 |
9,484 |
8,439 |
2,190 |
1,183 |
988 |
2,722 |
1,200 |
437 |
268 |
704 |
0 |
445 |
34,046 |
| Q4 |
263 |
307 |
252 |
4,934 |
46 |
10,384 |
9,017 |
2,519 |
1,312 |
1,012 |
2,702 |
1,306 |
465 |
293 |
824 |
0 |
392 |
36,028 |
| 2013 |
Q1 |
294 |
228 |
353 |
5,294 |
41 |
9,956 |
10,223 |
2,573 |
1,532 |
1,331 |
3,542 |
1,645 |
611 |
309 |
778 |
0 |
695 |
39,405 |
| Q2 |
291 |
192 |
286 |
5,652 |
71 |
9,644 |
9,931 |
2,614 |
1,434 |
1,331 |
3,752 |
1,990 |
895 |
217 |
847 |
0 |
607 |
39,754 |
| Q3 |
273 |
260 |
343 |
5,321 |
23 |
9,788 |
9,236 |
2,390 |
1,254 |
973 |
3,131 |
900 |
395 |
152 |
866 |
0 |
453 |
35,758 |
| Q4 |
311 |
304 |
379 |
5,910 |
51 |
11,647 |
10,412 |
2,949 |
1,400 |
1,010 |
3,252 |
988 |
454 |
222 |
945 |
0 |
518 |
40,752 |
| 2014 |
Q1 |
334 |
274 |
506 |
6,876 |
40 |
13,778 |
11,858 |
3,607 |
1,542 |
1,401 |
3,815 |
2,450 |
589 |
343 |
1,159 |
3 |
618 |
49,193 |
| Q2 |
410 |
271 |
458 |
6,438 |
82 |
12,658 |
11,202 |
3,239 |
1,648 |
1,364 |
3,756 |
1,928 |
1,016 |
345 |
1,014 |
0 |
724 |
46,553 |
Source: Labour Market Regulatory Authority (LMRA), Expatriate Management System (EMS)
ANNEXED NOTE
1. Technical Notes and Definitions
This table shows the flow of renewed permits (or visas) that are given to foreigners by the LMRA by sector of economic activity. These renwed visas combine those given for regular and temporary workers, investors and dependents.
The LMRA Expatriate Management System (EMS) stores information and past history of sponsors and workers, and their dependents, within the scope of Law No. 19/2006 on regulating the labour market. The scope of the system covers regular, temporary and investor work visas for foreign workers, their dependents, in the commercial sector, the government sector and the non-commercial, non-government sector. It presently excludes domestic workers, and work visas for artists and certain other categories of workers in non-civilian organizations. It distinguishes four types of visas for operational purposes: regular work visas for workers with 24-month validity; temporary work visas issued for workers with 6-month validity; investor work visas issued for investors investing up to BD 100,000; and dependent visas issued for dependent members of eligible foreign workers.The system tracks visa applications, renewals, mobility of workers between employers and from one occupation to another as well as notification of termination and runaway workers, and in general all operations of LMRA including inspection and offence management. The system is updated continuously and linked with other labour-related databases of the Kingdom, including CIO, GDNPR, GOSI, PFC, CSB, Ministry of Labour (MoL), and Ministry of Industry and Commerce (MOIC).
Work Visa is a legal certificate to allow a foreign worker to enter the country for working purposes for a period of two years with the possibility of renewal.
Worker is a generic term that refers to an employed person in general, or to an employee, a self-employed, or a particular category of worker, such as full-time or part-time worker, depending on the context in which the term is used. Four major categories of workers in terms of their status in employment are employees, employers, own-account workers, and unpaid family workers.
2. Institution which provides data
Labour Market Regulatory Authority (LMRA).
3. Data availability
The LMRA publishes these data under its Bahrain Labour Market Indicators (BLMI) section. The BLMI dashboard can be found in: (http://blmi.lmra.bh/2014/03/mi_dashboard.xml). The general BLMI data with other non-LMRA sources can be found: (http://blmi.lmra.bh/2014/03/mi_data.xml)
Figures and results are often reported in tables in both PDF and Excel formats.
Data for this LMRA table for 2009 can be found here: (http://blmi.lmra.bh/2009/09/data/lmr/Table_36a.pdf) and (http://blmi.lmra.bh/2009/12/data/lmr/Table_36a.pdf).
Data for 2010 can be found here: (http://blmi.lmra.bh/2010/03/data/ems/Table_36a.pdf), (http://blmi.lmra.bh/2010/06/data/ems/Table_36a.pdf), (http://blmi.lmra.bh/2010/09/data/ems/Table_36a.pdf) and (http://blmi.lmra.bh/2010/12/data/ems/Table_36a.pdf).
Data for 2011 can be found here: (http://blmi.lmra.bh/2011/03/data/ems/Table_36a.pdf), (http://blmi.lmra.bh/2011/06/data/ems/Table_36a.pdf), (http://blmi.lmra.bh/2011/09/data/ems/Table_36a.pdf) and (http://blmi.lmra.bh/2011/12/data/ems/Table_36a.pdf).
Data for 2012 can be found here: (http://blmi.lmra.bh/2012/03/data/ems/Table_36a.pdf), (http://blmi.lmra.bh/2012/06/data/ems/Table_36a.pdf), (http://blmi.lmra.bh/2012/09/data/ems/Table_36a.pdf) and (http://blmi.lmra.bh/2012/12/data/ems/Table_36a.pdf).
Data for 2013 can be found here: (http://blmi.lmra.bh/2013/03/data/ems/Table_36a.pdf), (http://blmi.lmra.bh/2013/06/data/ems/Table_36a.pdf), (http://blmi.lmra.bh/2013/09/data/ems/Table_36a.pdf) and (http://blmi.lmra.bh/2013/12/data/ems/Table_36a.pdf).
Data for 2014 can be found here: (http://blmi.lmra.bh/2014/03/data/ems/Table_36a.pdf) and (http://blmi.lmra.bh/2014/06/data/ems/Table_36a.pdf).
The definitions that the LMRA adopts for its data can be found in the Glossary section: (http://blmi.lmra.bh/mi_glossary.xml).
Date of access: September 2014
|
|
Sector / Number of Employees |
|
|
Commercial |
Government |
Non Commercial Non Government |
|
|
0 -5 |
6 – 9 |
10 – 19 |
20 – 99 |
100 – 499 |
500+ |
Total |
0 -5 |
6 – 9 |
10 – 19 |
20 – 99 |
100 – 499 |
500+ |
Total |
0 -5 |
6 – 9 |
10 – 19 |
20 – 99 |
100 – 499 |
500+ |
Total |
| 2009 |
Q3 |
68 |
8 |
111 |
86 |
122 |
143 |
538 |
0 |
0 |
0 |
0 |
0 |
0 |
0 |
0 |
0 |
0 |
0 |
0 |
0 |
0 |
| Q4 |
44 |
36 |
45 |
263 |
100 |
344 |
832 |
0 |
0 |
0 |
0 |
0 |
0 |
0 |
0 |
0 |
0 |
0 |
0 |
0 |
0 |
| 2010 |
Q1 |
226 |
36 |
176 |
224 |
485 |
501 |
1,648 |
0 |
0 |
0 |
5 |
0 |
0 |
5 |
0 |
0 |
0 |
0 |
0 |
0 |
0 |
| Q2 |
35 |
5 |
61 |
118 |
94 |
204 |
517 |
0 |
0 |
0 |
7 |
0 |
0 |
7 |
0 |
0 |
0 |
0 |
0 |
0 |
0 |
| Q3 |
61 |
2 |
56 |
76 |
110 |
134 |
439 |
0 |
0 |
0 |
5 |
0 |
0 |
5 |
0 |
0 |
0 |
0 |
0 |
0 |
0 |
| Q4 |
25 |
10 |
8 |
179 |
267 |
143 |
632 |
0 |
0 |
0 |
0 |
0 |
0 |
0 |
0 |
0 |
0 |
0 |
0 |
0 |
0 |
| 2011 |
Q1 |
48 |
27 |
7 |
174 |
454 |
590 |
1,300 |
0 |
0 |
0 |
0 |
0 |
0 |
0 |
0 |
0 |
0 |
0 |
0 |
0 |
0 |
| Q2 |
3 |
45 |
78 |
105 |
75 |
254 |
560 |
0 |
0 |
0 |
1 |
0 |
0 |
1 |
0 |
0 |
0 |
0 |
0 |
0 |
0 |
| Q3 |
6 |
7 |
26 |
93 |
181 |
280 |
593 |
0 |
0 |
0 |
0 |
0 |
0 |
0 |
0 |
0 |
0 |
0 |
0 |
0 |
0 |
| Q4 |
13 |
34 |
24 |
101 |
191 |
287 |
650 |
0 |
0 |
0 |
0 |
0 |
0 |
0 |
0 |
0 |
0 |
0 |
0 |
0 |
0 |
| 2012 |
Q1 |
12 |
20 |
29 |
364 |
181 |
257 |
863 |
0 |
0 |
0 |
0 |
0 |
0 |
0 |
0 |
0 |
0 |
0 |
0 |
0 |
0 |
| Q2 |
7 |
23 |
5 |
361 |
278 |
520 |
1,194 |
0 |
0 |
0 |
0 |
0 |
0 |
0 |
0 |
0 |
0 |
0 |
0 |
0 |
0 |
| Q3 |
7 |
18 |
51 |
228 |
295 |
357 |
956 |
0 |
0 |
0 |
0 |
0 |
0 |
0 |
0 |
0 |
0 |
0 |
0 |
0 |
0 |
| Q4 |
295 |
18 |
95 |
110 |
493 |
536 |
1,547 |
0 |
0 |
0 |
0 |
0 |
0 |
0 |
0 |
0 |
0 |
0 |
0 |
0 |
0 |
| 2013 |
Q1 |
11 |
2 |
40 |
225 |
290 |
674 |
1,242 |
0 |
0 |
0 |
0 |
0 |
0 |
0 |
0 |
0 |
0 |
0 |
0 |
0 |
0 |
| Q2 |
9 |
|
34 |
92 |
101 |
150 |
386 |
0 |
0 |
0 |
0 |
0 |
0 |
0 |
0 |
0 |
0 |
0 |
0 |
0 |
0 |
| Q3 |
5 |
8 |
8 |
79 |
95 |
225 |
420 |
0 |
0 |
0 |
0 |
0 |
0 |
0 |
0 |
0 |
0 |
0 |
0 |
0 |
0 |
| Q4 |
2 |
4 |
27 |
126 |
152 |
164 |
475 |
0 |
0 |
0 |
0 |
0 |
0 |
0 |
0 |
0 |
0 |
0 |
0 |
0 |
0 |
| 2014 |
Q1 |
205 |
15 |
32 |
116 |
395 |
101 |
864 |
0 |
0 |
0 |
0 |
0 |
0 |
0 |
0 |
0 |
0 |
0 |
0 |
0 |
0 |
| Q2 |
36 |
0 |
17 |
59 |
54 |
99 |
265 |
0 |
0 |
0 |
0 |
0 |
0 |
0 |
0 |
0 |
0 |
0 |
0 |
0 |
0 |
Source: Labour Market Regulatory Authority (LMRA), Expatriate Management System (EMS)
ANNEXED NOTE
1. Technical Notes and Definitions
This table shows the flow of new permits (or visas) that are given to temporary workers by the LMRA by the size of establishment as per the number of their employees.
The LMRA Expatriate Management System (EMS) stores information and past history of sponsors and workers, and their dependents, within the scope of Law No. 19/2006 on regulating the labour market. The scope of the system covers regular, temporary and investor work visas for foreign workers, their dependents, in the commercial sector, the government sector and the non-commercial, non-government sector. It presently excludes domestic workers, and work visas for artists and certain other categories of workers in non-civilian organizations. It distinguishes four types of visas for operational purposes: regular work visas for workers with 24-month validity; temporary work visas issued for workers with 6-month validity; investor work visas issued for investors investing up to BD 100,000; and dependent visas issued for dependent members of eligible foreign workers.The system tracks visa applications, renewals, mobility of workers between employers and from one occupation to another as well as notification of termination and runaway workers, and in general all operations of LMRA including inspection and offence management. The system is updated continuously and linked with other labour-related databases of the Kingdom, including CIO, GDNPR, GOSI, PFC, CSB, Ministry of Labour (MoL), and Ministry of Industry and Commerce (MOIC).
Size of establishment is the number of persons engaged in an establishment at a given period, including, in principle, all employees and unpaid family workers as well as any working proprietor. In practice, it refers to the total number of employees registered by anemployer at the responsible administrative agency.
Temporary Worker is a worker engaged to work in an enterprise for a short period of time, i.e. for less than two years and usually six months.
Work Visa is a legal certificate to allow a foreign worker to enter the country for working purposes for a period of two years with the possibility of renewal.
Worker is a generic term that refers to an employed person in general, or to an employee, a self-employed, or a particular category of worker, such as full-time or part-time worker, depending on the context in which the term is used. Four major categories of workers in terms of their status in employment are employees, employers, own-account workers, and unpaid family workers.
2. Institution which provides data
Labour Market Regulatory Authority (LMRA).
3. Data availability
The LMRA publishes these data under its Bahrain Labour Market Indicators (BLMI) section. The BLMI dashboard can be found in: (http://blmi.lmra.bh/2014/03/mi_dashboard.xml). The general BLMI data with other non-LMRA sources can be found: (http://blmi.lmra.bh/2014/03/mi_data.xml)
Figures and results are often reported in tables in both PDF and Excel formats.
Data for this LMRA table for 2009 can be found here: (http://blmi.lmra.bh/2009/09/data/lmr/Table_35b.pdf) and (http://blmi.lmra.bh/2009/12/data/lmr/Table_35b.pdf).
Data for 2010 can be found here: (http://blmi.lmra.bh/2010/03/data/ems/Table_35b.pdf), (http://blmi.lmra.bh/2010/06/data/ems/Table_35b.pdf), (http://blmi.lmra.bh/2010/09/data/ems/Table_35b.pdf) and (http://blmi.lmra.bh/2010/12/data/ems/Table_35b.pdf).
Data for 2011 can be found here: (http://blmi.lmra.bh/2011/03/data/ems/Table_35b.pdf), (http://blmi.lmra.bh/2011/06/data/ems/Table_35b.pdf), (http://blmi.lmra.bh/2011/09/data/ems/Table_35b.pdf) and (http://blmi.lmra.bh/2011/12/data/ems/Table_35b.pdf).
Data for 2012 can be found here: (http://blmi.lmra.bh/2012/03/data/ems/Table_35b.pdf), (http://blmi.lmra.bh/2012/06/data/ems/Table_35b.pdf), (http://blmi.lmra.bh/2012/09/data/ems/Table_35b.pdf) and (http://blmi.lmra.bh/2012/12/data/ems/Table_35b.pdf).
Data for 2013 can be found here: (http://blmi.lmra.bh/2013/03/data/ems/Table_35b.pdf), (http://blmi.lmra.bh/2013/06/data/ems/Table_35b.pdf), (http://blmi.lmra.bh/2013/09/data/ems/Table_35b.pdf) and (http://blmi.lmra.bh/2013/12/data/ems/Table_35b.pdf).
Data for 2014 can be found here: (http://blmi.lmra.bh/2014/03/data/ems/Table_35b.pdf) and (http://blmi.lmra.bh/2014/03/data/ems/Table_35b.pdf).
The definitions that the LMRA adopts for its data can be found in the Glossary section: (http://blmi.lmra.bh/mi_glossary.xml).
Date of access: September 2014
| |
|
Sector / Number of Employees |
| |
|
Commercial |
Government |
Non Commercial Non Government |
| |
|
0 -5 |
6 – 9 |
10 – 19 |
20 – 99 |
100 – 499 |
500+ |
Total |
0 -5 |
6 – 9 |
10 – 19 |
20 – 99 |
100 – 499 |
500+ |
Total |
0 -5 |
6 – 9 |
10 – 19 |
20 – 99 |
100 – 499 |
500+ |
Total |
| 2009 |
Q3 |
84 |
3 |
0 |
1 |
1 |
0 |
89 |
0 |
0 |
0 |
0 |
0 |
0 |
0 |
0 |
0 |
0 |
0 |
0 |
0 |
0 |
| Q4 |
86 |
2 |
5 |
3 |
0 |
0 |
96 |
0 |
0 |
0 |
0 |
0 |
0 |
0 |
0 |
0 |
0 |
0 |
0 |
0 |
0 |
| 2010 |
Q1 |
125 |
4 |
5 |
5 |
0 |
0 |
139 |
0 |
0 |
0 |
0 |
0 |
0 |
0 |
0 |
0 |
0 |
0 |
0 |
0 |
0 |
| Q2 |
172 |
7 |
4 |
3 |
0 |
0 |
186 |
0 |
0 |
0 |
0 |
0 |
0 |
0 |
0 |
0 |
0 |
0 |
0 |
0 |
0 |
| Q3 |
129 |
3 |
2 |
5 |
0 |
0 |
139 |
0 |
0 |
0 |
0 |
0 |
0 |
0 |
0 |
0 |
0 |
0 |
0 |
0 |
0 |
| Q4 |
131 |
6 |
2 |
2 |
0 |
0 |
141 |
0 |
0 |
0 |
0 |
0 |
0 |
0 |
0 |
0 |
0 |
0 |
0 |
0 |
0 |
| 2011 |
Q1 |
108 |
3 |
2 |
4 |
0 |
0 |
117 |
0 |
0 |
0 |
0 |
0 |
0 |
0 |
0 |
0 |
0 |
0 |
0 |
0 |
0 |
| Q2 |
145 |
4 |
3 |
1 |
0 |
0 |
153 |
0 |
0 |
0 |
0 |
0 |
0 |
0 |
0 |
0 |
0 |
0 |
0 |
0 |
0 |
| Q3 |
119 |
3 |
1 |
5 |
0 |
0 |
128 |
0 |
0 |
0 |
0 |
0 |
0 |
0 |
0 |
0 |
0 |
0 |
0 |
0 |
0 |
| Q4 |
108 |
4 |
5 |
3 |
1 |
0 |
121 |
0 |
0 |
0 |
0 |
0 |
0 |
0 |
0 |
0 |
0 |
0 |
0 |
0 |
0 |
| 2012 |
Q1 |
155 |
6 |
6 |
5 |
0 |
0 |
172 |
0 |
0 |
0 |
0 |
0 |
0 |
0 |
0 |
0 |
0 |
0 |
0 |
0 |
0 |
| Q2 |
213 |
3 |
5 |
1 |
0 |
0 |
222 |
0 |
0 |
0 |
0 |
0 |
0 |
0 |
0 |
0 |
0 |
0 |
0 |
0 |
0 |
| Q3 |
226 |
5 |
2 |
3 |
0 |
0 |
236 |
0 |
0 |
0 |
0 |
0 |
0 |
0 |
0 |
0 |
0 |
0 |
0 |
0 |
0 |
| Q4 |
203 |
4 |
2 |
1 |
0 |
0 |
210 |
0 |
0 |
0 |
0 |
0 |
0 |
0 |
0 |
0 |
0 |
0 |
0 |
0 |
0 |
| 2013 |
Q1 |
253 |
6 |
3 |
2 |
0 |
0 |
264 |
0 |
0 |
0 |
0 |
0 |
0 |
0 |
0 |
0 |
0 |
0 |
0 |
0 |
0 |
| Q2 |
245 |
9 |
6 |
0 |
0 |
0 |
260 |
0 |
0 |
0 |
0 |
0 |
0 |
0 |
0 |
0 |
0 |
0 |
0 |
0 |
0 |
| Q3 |
201 |
8 |
3 |
2 |
0 |
0 |
214 |
0 |
0 |
0 |
0 |
0 |
0 |
0 |
0 |
0 |
0 |
0 |
0 |
0 |
0 |
| Q4 |
247 |
1 |
2 |
3 |
0 |
0 |
253 |
0 |
0 |
0 |
0 |
0 |
0 |
0 |
0 |
0 |
0 |
0 |
0 |
0 |
0 |
| 2014 |
Q1 |
311 |
4 |
2 |
3 |
0 |
0 |
320 |
0 |
0 |
0 |
0 |
0 |
0 |
0 |
0 |
0 |
0 |
0 |
0 |
0 |
0 |
| Q2 |
370 |
5 |
2 |
5 |
0 |
0 |
382 |
0 |
0 |
0 |
0 |
0 |
0 |
0 |
0 |
0 |
0 |
0 |
0 |
0 |
0 |
Source: Labour Market Regulatory Authority (LMRA), Expatriate Management System (EMS)
ANNEXED NOTE
1. Technical Notes and Definitions
This table shows the flow of new permits (or visas) that are given to foreign investors by the LMRA by the size of establishment as per the number of their employees.
The LMRA Expatriate Management System (EMS) stores information and past history of sponsors and workers, and their dependents, within the scope of Law No. 19/2006 on regulating the labour market. The scope of the system covers regular, temporary and investor work visas for foreign workers, their dependents, in the commercial sector, the government sector and the non-commercial, non-government sector. It presently excludes domestic workers, and work visas for artists and certain other categories of workers in non-civilian organizations. It distinguishes four types of visas for operational purposes: regular work visas for workers with 24-month validity; temporary work visas issued for workers with 6-month validity; investor work visas issued for investors investing up to BD 100,000; and dependent visas issued for dependent members of eligible foreign workers.The system tracks visa applications, renewals, mobility of workers between employers and from one occupation to another as well as notification of termination and runaway workers, and in general all operations of LMRA including inspection and offence management. The system is updated continuously and linked with other labour-related databases of the Kingdom, including CIO, GDNPR, GOSI, PFC, CSB, Ministry of Labour (MoL), and Ministry of Industry and Commerce (MOIC).
Size of establishment is the number of persons engaged in an establishment at a given period, including, in principle, all employees and unpaid family workers as well as any working proprietor. In practice, it refers to the total number of employees registered by anemployer at the responsible administrative agency.
Investor work visas are issued for investors investing up to BD 100,000.
2. Institution which provides data
Labour Market Regulatory Authority (LMRA).
3. Data availability
The LMRA publishes these data under its Bahrain Labour Market Indicators (BLMI) section. The BLMI dashboard can be found in: (http://blmi.lmra.bh/2014/03/mi_dashboard.xml). The general BLMI data with other non-LMRA sources can be found: (http://blmi.lmra.bh/2014/03/mi_data.xml)
Figures and results are often reported in tables in both PDF and Excel formats.
Data for this LMRA table for 2009 can be found here: (http://blmi.lmra.bh/2009/09/data/lmr/Table_35b.pdf) and (http://blmi.lmra.bh/2009/12/data/lmr/Table_35b.pdf).
Data for 2010 can be found here: (http://blmi.lmra.bh/2010/03/data/ems/Table_35b.pdf), (http://blmi.lmra.bh/2010/06/data/ems/Table_35b.pdf), (http://blmi.lmra.bh/2010/09/data/ems/Table_35b.pdf) and (http://blmi.lmra.bh/2010/12/data/ems/Table_35b.pdf).
Data for 2011 can be found here: (http://blmi.lmra.bh/2011/03/data/ems/Table_35b.pdf), (http://blmi.lmra.bh/2011/06/data/ems/Table_35b.pdf), (http://blmi.lmra.bh/2011/09/data/ems/Table_35b.pdf) and (http://blmi.lmra.bh/2011/12/data/ems/Table_35b.pdf).
Data for 2012 can be found here: (http://blmi.lmra.bh/2012/03/data/ems/Table_35b.pdf), (http://blmi.lmra.bh/2012/06/data/ems/Table_35b.pdf), (http://blmi.lmra.bh/2012/09/data/ems/Table_35b.pdf) and (http://blmi.lmra.bh/2012/12/data/ems/Table_35b.pdf).
Data for 2013 can be found here: (http://blmi.lmra.bh/2013/03/data/ems/Table_35b.pdf), (http://blmi.lmra.bh/2013/06/data/ems/Table_35b.pdf), (http://blmi.lmra.bh/2013/09/data/ems/Table_35b.pdf) and (http://blmi.lmra.bh/2013/12/data/ems/Table_35b.pdf).
Data for 2014 can be found here: (http://blmi.lmra.bh/2014/03/data/ems/Table_35b.pdf) and (http://blmi.lmra.bh/2014/03/data/ems/Table_35b.pdf).
The definitions that the LMRA adopts for its data can be found in the Glossary section: (http://blmi.lmra.bh/mi_glossary.xml).
Date of access: September 2014
| |
|
Sector / Number of Employees |
| |
|
Commercial |
Government |
Non Commercial Non Government |
| |
|
0 -5 |
6 – 9 |
10 – 19 |
20 – 99 |
100 – 499 |
500+ |
Total |
0 -5 |
6 – 9 |
10 – 19 |
20 – 99 |
100 – 499 |
500+ |
Total |
0 -5 |
6 – 9 |
10 – 19 |
20 – 99 |
100 – 499 |
Total |
| |
|
Employment |
Dependent |
Employment |
Dependent |
Employment |
Dependent |
Employment |
Dependent |
Employment |
Dependent |
Employment |
Dependent |
Employment |
Dependent |
Employment |
Dependent |
Employment |
Dependent |
Employment |
Dependent |
Employment |
Dependent |
Employment |
Dependent |
Employment |
Dependent |
Employment |
Dependent |
Employment |
Dependent |
Employment |
Dependent |
Employment |
Dependent |
Employment |
Dependent |
Employment |
Dependent |
Employment |
Dependent |
| 2009 |
Q3 |
8,528 |
1,431 |
2,347 |
505 |
2,204 |
567 |
4,613 |
1,366 |
2,579 |
869 |
2,347 |
457 |
22,618 |
5,195 |
1 |
7 |
12 |
17 |
1 |
6 |
61 |
113 |
144 |
175 |
305 |
202 |
524 |
520 |
621 |
36 |
136 |
17 |
40 |
8 |
136 |
31 |
138 |
97 |
1,071 |
189 |
| Q4 |
8,466 |
1,259 |
2,272 |
373 |
2,162 |
424 |
5,863 |
1,087 |
3,331 |
808 |
2,412 |
298 |
24,506 |
4,249 |
3 |
0 |
5 |
3 |
7 |
4 |
28 |
52 |
88 |
104 |
60 |
490 |
191 |
653 |
574 |
14 |
136 |
13 |
53 |
17 |
106 |
66 |
68 |
107 |
937 |
217 |
| 2010 |
Q1 |
7,133 |
1,413 |
3,063 |
596 |
2,381 |
631 |
5,583 |
1,475 |
3,319 |
1,029 |
2,414 |
452 |
23,893 |
5,596 |
2 |
6 |
2 |
5 |
18 |
11 |
28 |
77 |
60 |
108 |
106 |
266 |
216 |
473 |
574 |
32 |
129 |
7 |
36 |
27 |
92 |
45 |
48 |
61 |
879 |
172 |
| Q2 |
7,750 |
1,594 |
2,232 |
570 |
2,097 |
503 |
5,501 |
1,465 |
3,067 |
949 |
2,439 |
385 |
23,086 |
5,466 |
1 |
2 |
2 |
8 |
5 |
10 |
13 |
51 |
51 |
74 |
47 |
276 |
119 |
421 |
789 |
23 |
104 |
11 |
42 |
7 |
60 |
42 |
29 |
51 |
1,024 |
134 |
| Q3 |
7,888 |
1,457 |
2,092 |
531 |
2,285 |
569 |
5,324 |
1,445 |
3,506 |
904 |
2,683 |
363 |
23,778 |
5,904 |
2 |
4 |
6 |
2 |
8 |
25 |
27 |
52 |
117 |
102 |
230 |
159 |
390 |
344 |
576 |
32 |
147 |
10 |
53 |
7 |
122 |
40 |
133 |
93 |
1,031 |
182 |
| Q4 |
7,406 |
1,155 |
1,978 |
402 |
2,277 |
413 |
5,545 |
1,134 |
4,207 |
762 |
2,910 |
363 |
24,323 |
4,229 |
2 |
2 |
0 |
11 |
15 |
18 |
21 |
35 |
63 |
111 |
114 |
300 |
215 |
477 |
474 |
31 |
72 |
9 |
53 |
21 |
85 |
24 |
44 |
99 |
728 |
184 |
| 2011 |
Q1 |
6,639 |
1,284 |
1,866 |
393 |
2,371 |
538 |
4,941 |
1,044 |
3,531 |
786 |
2,785 |
387 |
22,133 |
4,432 |
5 |
0 |
|
|
7 |
12 |
23 |
40 |
57 |
114 |
74 |
318 |
166 |
484 |
395 |
15 |
89 |
9 |
24 |
8 |
87 |
44 |
35 |
32 |
630 |
108 |
| Q2 |
6,000 |
1,574 |
1,775 |
570 |
1,784 |
533 |
4,512 |
1,343 |
4,308 |
1,024 |
2,882 |
464 |
21,261 |
5,508 |
1 |
0 |
8 |
22 |
6 |
4 |
17 |
36 |
101 |
136 |
42 |
274 |
175 |
472 |
441 |
31 |
71 |
18 |
23 |
19 |
94 |
39 |
37 |
48 |
666 |
155 |
| Q3 |
7,771 |
1,432 |
2,299 |
436 |
2,494 |
606 |
5,711 |
1,140 |
4,133 |
867 |
5,023 |
463 |
27,431 |
4,944 |
3 |
1 |
2 |
7 |
3 |
10 |
19 |
37 |
147 |
152 |
372 |
168 |
546 |
375 |
528 |
29 |
90 |
3 |
28 |
10 |
98 |
29 |
189 |
60 |
933 |
131 |
| Q4 |
7,908 |
1,229 |
2,362 |
354 |
2,729 |
454 |
5,013 |
1,040 |
4,916 |
824 |
4,259 |
456 |
27,187 |
4,357 |
4 |
7 |
2 |
4 |
1 |
5 |
36 |
30 |
100 |
109 |
181 |
390 |
324 |
545 |
484 |
27 |
116 |
9 |
28 |
20 |
66 |
24 |
61 |
85 |
755 |
165 |
| 2012 |
Q1 |
8,691 |
1,622 |
2,965 |
548 |
2,945 |
569 |
5,636 |
1,341 |
4,026 |
1,112 |
5,140 |
777 |
29,403 |
5,969 |
3 |
6 |
2 |
1 |
4 |
18 |
58 |
61 |
118 |
83 |
232 |
295 |
417 |
464 |
435 |
39 |
106 |
1 |
43 |
13 |
70 |
26 |
43 |
41 |
697 |
120 |
| Q2 |
9,829 |
1,989 |
2,760 |
648 |
2,773 |
634 |
5,425 |
1,402 |
4,437 |
941 |
3,895 |
706 |
29,119 |
6,320 |
|
1 |
|
6 |
4 |
20 |
44 |
57 |
93 |
90 |
177 |
386 |
318 |
560 |
745 |
25 |
142 |
18 |
41 |
21 |
67 |
49 |
53 |
38 |
1,048 |
151 |
| Q3 |
9,579 |
1,893 |
2,626 |
563 |
2,590 |
627 |
5,800 |
1,377 |
4,842 |
1,109 |
3,872 |
563 |
29,309 |
6,132 |
4 |
3 |
3 |
5 |
7 |
13 |
45 |
49 |
103 |
137 |
393 |
214 |
555 |
421 |
727 |
30 |
160 |
27 |
56 |
11 |
138 |
67 |
138 |
75 |
1,219 |
210 |
| Q4 |
9,380 |
1,320 |
2,388 |
454 |
2,249 |
503 |
5,296 |
913 |
4,487 |
793 |
3,706 |
419 |
27,506 |
4,402 |
1 |
1 |
2 |
5 |
16 |
5 |
21 |
60 |
65 |
84 |
238 |
183 |
343 |
338 |
650 |
48 |
118 |
4 |
28 |
10 |
95 |
61 |
74 |
73 |
965 |
196 |
| 2013 |
Q1 |
11,093 |
2,155 |
2,646 |
681 |
2,570 |
606 |
6,220 |
1,587 |
4,586 |
1,140 |
3,857 |
583 |
30,972 |
6,752 |
3 |
9 |
2 |
1 |
2 |
14 |
40 |
53 |
76 |
89 |
113 |
556 |
236 |
722 |
717 |
43 |
117 |
11 |
34 |
10 |
78 |
67 |
46 |
31 |
992 |
162 |
| Q2 |
11,092 |
2,270 |
2,826 |
700 |
2,408 |
630 |
6,497 |
1,589 |
4,854 |
950 |
3,268 |
629 |
30,945 |
6,768 |
3 |
5 |
|
|
7 |
10 |
60 |
93 |
62 |
71 |
119 |
739 |
251 |
918 |
696 |
38 |
143 |
17 |
28 |
15 |
79 |
25 |
39 |
33 |
985 |
128 |
| Q3 |
9,989 |
1,805 |
2,736 |
571 |
2,015 |
554 |
4,821 |
1,311 |
4,617 |
895 |
2,907 |
510 |
27,085 |
5,646 |
2 |
4 |
10 |
8 |
4 |
6 |
26 |
37 |
103 |
114 |
611 |
216 |
756 |
385 |
609 |
43 |
119 |
25 |
37 |
10 |
81 |
36 |
154 |
103 |
1,000 |
217 |
| Q4 |
9,365 |
1,629 |
2,240 |
474 |
1,913 |
426 |
3,900 |
988 |
3,357 |
797 |
2,649 |
394 |
23,424 |
4,708 |
4 |
7 |
1 |
5 |
6 |
6 |
35 |
58 |
76 |
91 |
381 |
414 |
503 |
581 |
461 |
22 |
74 |
9 |
25 |
14 |
72 |
36 |
90 |
122 |
722 |
203 |
| 2014 |
Q1 |
10,188 |
2,238 |
2,558 |
606 |
2,217 |
573 |
4,878 |
1,288 |
3,638 |
944 |
2,811 |
421 |
26,290 |
6,070 |
3 |
3 |
|
2 |
4 |
8 |
34 |
100 |
97 |
84 |
78 |
561 |
216 |
758 |
426 |
30 |
94 |
10 |
24 |
15 |
49 |
35 |
77 |
37 |
670 |
127 |
| Q2 |
11,739 |
2,631 |
3,018 |
692 |
2,427 |
689 |
5,473 |
1,571 |
4,603 |
1,055 |
2,919 |
542 |
30,179 |
7,180 |
1 |
7 |
4 |
10 |
1 |
11 |
19 |
69 |
69 |
92 |
57 |
615 |
151 |
804 |
545 |
42 |
110 |
10 |
26 |
27 |
61 |
31 |
62 |
78 |
804 |
188 |
Source: Labour Market Regulatory Authority (LMRA), Expatriate Management System (EMS)
ANNEXED NOTE
1. Technical Notes and Definitions
This table shows the flow of new permits (or visas) that are given to employees and dependents by the LMRA by the size of establishment as per the number of their employees.
The LMRA Expatriate Management System (EMS) stores information and past history of sponsors and workers, and their dependents, within the scope of Law No. 19/2006 on regulating the labour market. The scope of the system covers regular, temporary and investor work visas for foreign workers, their dependents, in the commercial sector, the government sector and the non-commercial, non-government sector. It presently excludes domestic workers, and work visas for artists and certain other categories of workers in non-civilian organizations. It distinguishes four types of visas for operational purposes: regular work visas for workers with 24-month validity; temporary work visas issued for workers with 6-month validity; investor work visas issued for investors investing up to BD 100,000; and dependent visas issued for dependent members of eligible foreign workers.The system tracks visa applications, renewals, mobility of workers between employers and from one occupation to another as well as notification of termination and runaway workers, and in general all operations of LMRA including inspection and offence management. The system is updated continuously and linked with other labour-related databases of the Kingdom, including CIO, GDNPR, GOSI, PFC, CSB, Ministry of Labour (MoL), and Ministry of Industry and Commerce (MOIC).
Size of establishment is the number of persons engaged in an establishment at a given period, including, in principle, all employees and unpaid family workers as well as any working proprietor. In practice, it refers to the total number of employees registered by anemployer at the responsible administrative agency.
Work Visa is a legal certificate to allow a foreign worker to enter the country for working purposes for a period of two years with the possibility of renewal.
Worker is a generic term that refers to an employed person in general, or to an employee, a self-employed, or a particular category of worker, such as full-time or part-time worker, depending on the context in which the term is used. Four major categories of workers in terms of their status in employment are employees, employers, own-account workers, and unpaid family workers.
2. Institution which provides data
Labour Market Regulatory Authority (LMRA).
3. Data availability
The LMRA publishes these data under its Bahrain Labour Market Indicators (BLMI) section. The BLMI dashboard can be found in: (http://blmi.lmra.bh/2014/03/mi_dashboard.xml). The general BLMI data with other non-LMRA sources can be found: (http://blmi.lmra.bh/2014/03/mi_data.xml)
Figures and results are often reported in tables in both PDF and Excel formats.
Data for this LMRA table for 2009 can be found here: (http://blmi.lmra.bh/2009/09/data/lmr/Table_35b.pdf) and (http://blmi.lmra.bh/2009/12/data/lmr/Table_35b.pdf).
Data for 2010 can be found here: (http://blmi.lmra.bh/2010/03/data/ems/Table_35b.pdf), (http://blmi.lmra.bh/2010/06/data/ems/Table_35b.pdf), (http://blmi.lmra.bh/2010/09/data/ems/Table_35b.pdf) and (http://blmi.lmra.bh/2010/12/data/ems/Table_35b.pdf).
Data for 2011 can be found here: (http://blmi.lmra.bh/2011/03/data/ems/Table_35b.pdf), (http://blmi.lmra.bh/2011/06/data/ems/Table_35b.pdf), (http://blmi.lmra.bh/2011/09/data/ems/Table_35b.pdf) and (http://blmi.lmra.bh/2011/12/data/ems/Table_35b.pdf).
Data for 2012 can be found here: (http://blmi.lmra.bh/2012/03/data/ems/Table_35b.pdf), (http://blmi.lmra.bh/2012/06/data/ems/Table_35b.pdf), (http://blmi.lmra.bh/2012/09/data/ems/Table_35b.pdf) and (http://blmi.lmra.bh/2012/12/data/ems/Table_35b.pdf).
Data for 2013 can be found here: (http://blmi.lmra.bh/2013/03/data/ems/Table_35b.pdf), (http://blmi.lmra.bh/2013/06/data/ems/Table_35b.pdf), (http://blmi.lmra.bh/2013/09/data/ems/Table_35b.pdf) and (http://blmi.lmra.bh/2013/12/data/ems/Table_35b.pdf).
Data for 2014 can be found here: (http://blmi.lmra.bh/2014/03/data/ems/Table_35b.pdf) and (http://blmi.lmra.bh/2014/03/data/ems/Table_35b.pdf).
The definitions that the LMRA adopts for its data can be found in the Glossary section: (http://blmi.lmra.bh/mi_glossary.xml).
Date of access: September 2014
|
Sector / Number of Employees |
|
Commercial |
Government |
Non Commercial Non Government |
|
0 -5 |
6 – 9 |
10 – 19 |
20 – 99 |
100 – 499 |
500+ |
Total |
0 -5 |
6 – 9 |
10 – 19 |
20 – 99 |
100 – 499 |
500+ |
Total |
0 -5 |
6 – 9 |
10 – 19 |
20 – 99 |
100 – 499 |
Total |
| Q3 |
10,111 |
2,863 |
2,882 |
6,066 |
3,571 |
2,947 |
28,440 |
8 |
29 |
7 |
174 |
319 |
507 |
1,044 |
657 |
153 |
48 |
167 |
235 |
1,260 |
| Q4 |
9,855 |
2,683 |
2,636 |
7,216 |
4,239 |
3,054 |
29,683 |
3 |
8 |
11 |
80 |
192 |
550 |
844 |
588 |
149 |
70 |
172 |
175 |
1,154 |
| Q1 |
8,897 |
3,699 |
3,193 |
7,287 |
4,833 |
3,367 |
31,276 |
8 |
7 |
29 |
110 |
168 |
372 |
694 |
606 |
136 |
63 |
137 |
109 |
1,051 |
| Q2 |
9,551 |
2,814 |
2,665 |
7,087 |
4,110 |
3,028 |
29,255 |
3 |
10 |
15 |
71 |
125 |
323 |
547 |
812 |
115 |
49 |
102 |
80 |
1,158 |
| Q3 |
9,535 |
2,628 |
2,912 |
6,850 |
4,520 |
3,180 |
29,625 |
6 |
8 |
33 |
84 |
219 |
389 |
739 |
608 |
157 |
60 |
162 |
226 |
1,213 |
| Q4 |
8,717 |
2,396 |
2,700 |
6,860 |
5,236 |
3,416 |
29,325 |
4 |
11 |
33 |
56 |
174 |
414 |
692 |
505 |
81 |
74 |
109 |
143 |
912 |
| Q1 |
8,079 |
2,289 |
2,918 |
6,163 |
4,771 |
3,762 |
27,982 |
5 |
0 |
19 |
63 |
171 |
392 |
650 |
410 |
98 |
32 |
131 |
67 |
738 |
| Q2 |
7,722 |
2,394 |
2,398 |
5,961 |
5,407 |
3,600 |
27,482 |
1 |
30 |
10 |
54 |
237 |
316 |
648 |
472 |
89 |
42 |
133 |
85 |
821 |
| Q3 |
9,328 |
2,745 |
3,127 |
6,949 |
5,181 |
5,766 |
33,096 |
4 |
9 |
13 |
56 |
299 |
540 |
921 |
557 |
93 |
38 |
127 |
249 |
1,064 |
| Q4 |
9,258 |
2,754 |
3,212 |
6,157 |
5,932 |
5,002 |
32,315 |
11 |
6 |
6 |
66 |
209 |
571 |
869 |
511 |
125 |
48 |
90 |
146 |
920 |
| Q1 |
10,480 |
3,539 |
3,549 |
7,346 |
5,319 |
6,174 |
36,407 |
9 |
3 |
22 |
119 |
201 |
527 |
881 |
474 |
107 |
56 |
96 |
84 |
817 |
| Q2 |
12,038 |
3,434 |
3,417 |
7,189 |
5,656 |
5,121 |
36,855 |
1 |
6 |
24 |
101 |
183 |
563 |
878 |
770 |
160 |
62 |
116 |
91 |
1,199 |
| Q3 |
11,705 |
3,212 |
3,270 |
7,408 |
6,246 |
4,792 |
36,633 |
7 |
8 |
20 |
94 |
240 |
607 |
976 |
757 |
187 |
67 |
205 |
213 |
1,429 |
| Q4 |
11,198 |
2,864 |
2,849 |
6,320 |
5,773 |
4,661 |
33,665 |
2 |
7 |
21 |
81 |
149 |
421 |
681 |
698 |
122 |
38 |
156 |
147 |
1,161 |
| Q1 |
13,512 |
3,335 |
3,219 |
8,034 |
6,016 |
5,114 |
39,230 |
12 |
3 |
16 |
93 |
165 |
669 |
958 |
760 |
128 |
44 |
145 |
77 |
1,154 |
| Q2 |
13,616 |
3,535 |
3,078 |
8,178 |
5,905 |
4,047 |
38,359 |
8 |
0 |
17 |
153 |
133 |
858 |
1,169 |
734 |
160 |
43 |
104 |
72 |
1,113 |
| Q3 |
12,000 |
3,323 |
2,580 |
6,213 |
5,607 |
3,642 |
33,365 |
6 |
18 |
10 |
63 |
217 |
827 |
1,141 |
652 |
144 |
47 |
117 |
257 |
1,217 |
| Q4 |
11,243 |
2,719 |
2,368 |
5,017 |
4,306 |
3,207 |
28,860 |
11 |
6 |
12 |
93 |
167 |
795 |
1,084 |
483 |
83 |
39 |
108 |
212 |
925 |
| Q1 |
12,942 |
3,183 |
2,824 |
6,285 |
4,977 |
3,333 |
33,544 |
6 |
2 |
12 |
134 |
181 |
639 |
974 |
456 |
104 |
39 |
84 |
114 |
797 |
| Q2 |
14,776 |
3,715 |
3,135 |
7,108 |
5,712 |
3,560 |
38,006 |
8 |
14 |
12 |
88 |
161 |
672 |
955 |
587 |
120 |
53 |
92 |
140 |
992 |
Source: Labour Market Regulatory Authority (LMRA), Expatriate Management System (EMS)
ANNEXED NOTE
1. Technical Notes and Definitions
This table shows the flow of new permits (or visas) that are given to foreigners by the LMRA by the size of establishment as per the number of their employees. These new visas combine those given for regular and temporary workers, investors and dependents.
The LMRA Expatriate Management System (EMS) stores information and past history of sponsors and workers, and their dependents, within the scope of Law No. 19/2006 on regulating the labour market. The scope of the system covers regular, temporary and investor work visas for foreign workers, their dependents, in the commercial sector, the government sector and the non-commercial, non-government sector. It presently excludes domestic workers, and work visas for artists and certain other categories of workers in non-civilian organizations. It distinguishes four types of visas for operational purposes: regular work visas for workers with 24-month validity; temporary work visas issued for workers with 6-month validity; investor work visas issued for investors investing up to BD 100,000; and dependent visas issued for dependent members of eligible foreign workers.The system tracks visa applications, renewals, mobility of workers between employers and from one occupation to another as well as notification of termination and runaway workers, and in general all operations of LMRA including inspection and offence management. The system is updated continuously and linked with other labour-related databases of the Kingdom, including CIO, GDNPR, GOSI, PFC, CSB, Ministry of Labour (MoL), and Ministry of Industry and Commerce (MOIC).
Size of establishment is the number of persons engaged in an establishment at a given period, including, in principle, all employees and unpaid family workers as well as any working proprietor. In practice, it refers to the total number of employees registered by anemployer at the responsible administrative agency.
Work Visa is a legal certificate to allow a foreign worker to enter the country for working purposes for a period of two years with the possibility of renewal.
Worker is a generic term that refers to an employed person in general, or to an employee, a self-employed, or a particular category of worker, such as full-time or part-time worker, depending on the context in which the term is used. Four major categories of workers in terms of their status in employment are employees, employers, own-account workers, and unpaid family workers.
2. Institution which provides data
Labour Market Regulatory Authority (LMRA).
3. Data availability
The LMRA publishes these data under its Bahrain Labour Market Indicators (BLMI) section. The BLMI dashboard can be found in: (http://blmi.lmra.bh/2014/03/mi_dashboard.xml). The general BLMI data with other non-LMRA sources can be found: (http://blmi.lmra.bh/2014/03/mi_data.xml)
Figures and results are often reported in tables in both PDF and Excel formats.
Data for this LMRA table for 2009 can be found here: (http://blmi.lmra.bh/2009/09/data/lmr/Table_35b.pdf) and (http://blmi.lmra.bh/2009/12/data/lmr/Table_35b.pdf).
Data for 2010 can be found here: (http://blmi.lmra.bh/2010/03/data/ems/Table_35b.pdf), (http://blmi.lmra.bh/2010/06/data/ems/Table_35b.pdf), (http://blmi.lmra.bh/2010/09/data/ems/Table_35b.pdf) and (http://blmi.lmra.bh/2010/12/data/ems/Table_35b.pdf).
Data for 2011 can be found here: (http://blmi.lmra.bh/2011/03/data/ems/Table_35b.pdf), (http://blmi.lmra.bh/2011/06/data/ems/Table_35b.pdf), (http://blmi.lmra.bh/2011/09/data/ems/Table_35b.pdf) and (http://blmi.lmra.bh/2011/12/data/ems/Table_35b.pdf).
Data for 2012 can be found here: (http://blmi.lmra.bh/2012/03/data/ems/Table_35b.pdf), (http://blmi.lmra.bh/2012/06/data/ems/Table_35b.pdf), (http://blmi.lmra.bh/2012/09/data/ems/Table_35b.pdf) and (http://blmi.lmra.bh/2012/12/data/ems/Table_35b.pdf).
Data for 2013 can be found here: (http://blmi.lmra.bh/2013/03/data/ems/Table_35b.pdf), (http://blmi.lmra.bh/2013/06/data/ems/Table_35b.pdf), (http://blmi.lmra.bh/2013/09/data/ems/Table_35b.pdf) and (http://blmi.lmra.bh/2013/12/data/ems/Table_35b.pdf).
Data for 2014 can be found here: (http://blmi.lmra.bh/2014/03/data/ems/Table_35b.pdf) and (http://blmi.lmra.bh/2014/03/data/ems/Table_35b.pdf).
The definitions that the LMRA adopts for its data can be found in the Glossary section: (http://blmi.lmra.bh/mi_glossary.xml).
Date of access: September 2014
|
|
Agriculture, hunting and forestry |
Fishing |
Mining and quarrying |
Manufacturing |
Electricity, gas and water supply |
Construction |
Wholesale and retail trade, repair |
Hotels and restaurants |
Transport, storage, communication |
Financial intermediation |
Real estate, renting, business activities |
Public administration |
Education |
Health and social work |
Other social, personal services |
Extra-territorial organizations, bodies |
Not specified |
Total |
| 2009 |
Q3 |
0 |
0 |
1 |
97 |
0 |
181 |
137 |
0 |
15 |
15 |
92 |
0 |
0 |
0 |
0 |
0 |
0 |
538 |
| Q4 |
0 |
0 |
2 |
322 |
0 |
283 |
73 |
0 |
9 |
1 |
142 |
0 |
0 |
0 |
0 |
0 |
0 |
832 |
| 2010 |
Q1 |
0 |
0 |
0 |
453 |
0 |
912 |
131 |
0 |
3 |
4 |
140 |
0 |
0 |
0 |
0 |
0 |
10 |
1,653 |
| Q2 |
1 |
0 |
0 |
206 |
0 |
167 |
43 |
0 |
17 |
0 |
83 |
0 |
0 |
0 |
0 |
0 |
7 |
524 |
| Q3 |
1 |
0 |
0 |
183 |
0 |
167 |
58 |
3 |
9 |
0 |
23 |
0 |
0 |
0 |
0 |
0 |
0 |
444 |
| Q4 |
0 |
0 |
2 |
225 |
0 |
307 |
29 |
2 |
0 |
0 |
67 |
0 |
0 |
0 |
0 |
0 |
0 |
632 |
| 2011 |
Q1 |
0 |
0 |
17 |
543 |
0 |
275 |
387 |
0 |
0 |
2 |
74 |
0 |
0 |
0 |
2 |
0 |
0 |
1,300 |
| Q2 |
0 |
0 |
5 |
304 |
7 |
138 |
30 |
15 |
6 |
0 |
55 |
0 |
0 |
0 |
1 |
0 |
0 |
561 |
| Q3 |
0 |
0 |
16 |
309 |
0 |
192 |
17 |
4 |
8 |
3 |
44 |
0 |
0 |
0 |
0 |
0 |
0 |
593 |
| Q4 |
0 |
0 |
2 |
114 |
61 |
339 |
74 |
5 |
1 |
|
54 |
0 |
0 |
0 |
0 |
0 |
0 |
650 |
| 2012 |
Q1 |
0 |
0 |
26 |
180 |
32 |
488 |
71 |
6 |
3 |
1 |
56 |
0 |
0 |
0 |
0 |
0 |
0 |
863 |
| Q2 |
0 |
0 |
27 |
363 |
5 |
594 |
152 |
0 |
1 |
0 |
52 |
0 |
0 |
0 |
0 |
0 |
0 |
1,194 |
| Q3 |
0 |
0 |
14 |
351 |
2 |
443 |
53 |
5 |
6 |
0 |
82 |
0 |
0 |
0 |
0 |
0 |
0 |
956 |
| Q4 |
0 |
0 |
20 |
466 |
98 |
797 |
48 |
0 |
1 |
|
117 |
0 |
0 |
0 |
0 |
0 |
0 |
1,547 |
| 2013 |
Q1 |
0 |
0 |
15 |
468 |
1 |
626 |
86 |
5 |
2 |
0 |
39 |
0 |
0 |
0 |
0 |
0 |
0 |
1,242 |
| Q2 |
0 |
0 |
31 |
161 |
0 |
79 |
59 |
|
12 |
1 |
40 |
0 |
0 |
0 |
3 |
0 |
0 |
386 |
| Q3 |
0 |
0 |
27 |
261 |
0 |
35 |
53 |
5 |
8 |
2 |
28 |
0 |
1 |
0 |
0 |
0 |
0 |
420 |
| Q4 |
0 |
0 |
28 |
193 |
96 |
57 |
58 |
0 |
4 |
0 |
38 |
0 |
1 |
0 |
0 |
0 |
0 |
475 |
| 2014 |
Q1 |
0 |
0 |
69 |
135 |
0 |
523 |
90 |
9 |
2 |
1 |
33 |
0 |
1 |
0 |
1 |
0 |
0 |
864 |
| Q2 |
0 |
0 |
19 |
113 |
0 |
59 |
28 |
8 |
1 |
0 |
37 |
0 |
0 |
0 |
0 |
0 |
0 |
265 |
Source: Labour Market Regulatory Authority (LMRA), Expatriate Management System (EMS)
ANNEXED NOTE
1. Technical Notes and Definitions
This table shows the flow of new permits (or visas) that are given to foreign temporary workers by the LMRA by sector of economic activity.
The LMRA Expatriate Management System (EMS) stores information and past history of sponsors and workers, and their dependents, within the scope of Law No. 19/2006 on regulating the labour market. The scope of the system covers regular, temporary and investor work visas for foreign workers, their dependents, in the commercial sector, the government sector and the non-commercial, non-government sector. It presently excludes domestic workers, and work visas for artists and certain other categories of workers in non-civilian organizations. It distinguishes four types of visas for operational purposes: regular work visas for workers with 24-month validity; temporary work visas issued for workers with 6-month validity; investor work visas issued for investors investing up to BD 100,000; and dependent visas issued for dependent members of eligible foreign workers.The system tracks visa applications, renewals, mobility of workers between employers and from one occupation to another as well as notification of termination and runaway workers, and in general all operations of LMRA including inspection and offence management. The system is updated continuously and linked with other labour-related databases of the Kingdom, including CIO, GDNPR, GOSI, PFC, CSB, Ministry of Labour (MoL), and Ministry of Industry and Commerce (MOIC).
Temporary Worker is a worker engaged to work in an enterprise for a short period of time, i.e. for less than two years and usually six months.
Work Visa is a legal certificate to allow a foreign worker to enter the country for working purposes for a period of two years with the possibility of renewal.
Worker is a generic term that refers to an employed person in general, or to an employee, a self-employed, or a particular category of worker, such as full-time or part-time worker, depending on the context in which the term is used. Four major categories of workers in terms of their status in employment are employees, employers, own-account workers, and unpaid family workers.
2. Institution which provides data
Labour Market Regulatory Authority (LMRA).
3. Data availability
The LMRA publishes these data under its Bahrain Labour Market Indicators (BLMI) section. The BLMI dashboard can be found in: (http://blmi.lmra.bh/2014/03/mi_dashboard.xml). The general BLMI data with other non-LMRA sources can be found: (http://blmi.lmra.bh/2014/03/mi_data.xml)
Figures and results are often reported in tables in both PDF and Excel formats.
Data for this LMRA table for 2009 can be found here: (http://blmi.lmra.bh/2009/09/data/lmr/Table_35a.pdf) and (http://blmi.lmra.bh/2009/12/data/lmr/Table_35a.pdf).
Data for 2010 can be found here: (http://blmi.lmra.bh/2010/03/data/ems/Table_35a.pdf), (http://blmi.lmra.bh/2010/06/data/ems/Table_35a.pdf), (http://blmi.lmra.bh/2010/09/data/ems/Table_35a.pdf) and (http://blmi.lmra.bh/2010/12/data/ems/Table_35a.pdf).
Data for 2011 can be found here: (http://blmi.lmra.bh/2011/03/data/ems/Table_35a.pdf), (http://blmi.lmra.bh/2011/06/data/ems/Table_35a.pdf), (http://blmi.lmra.bh/2011/09/data/ems/Table_35a.pdf) and (http://blmi.lmra.bh/2011/12/data/ems/Table_35a.pdf).
Data for 2012 can be found here: (http://blmi.lmra.bh/2012/03/data/ems/Table_35a.pdf), (http://blmi.lmra.bh/2012/06/data/ems/Table_35a.pdf), (http://blmi.lmra.bh/2012/09/data/ems/Table_35a.pdf) and (http://blmi.lmra.bh/2012/12/data/ems/Table_35a.pdf).
Data for 2013 can be found here: (http://blmi.lmra.bh/2013/03/data/ems/Table_35a.pdf), (http://blmi.lmra.bh/2013/06/data/ems/Table_35a.pdf), (http://blmi.lmra.bh/2013/09/data/ems/Table_35a.pdf) and (http://blmi.lmra.bh/2013/12/data/ems/Table_35a.pdf).
Data for 2014 can be found here: (http://blmi.lmra.bh/2014/03/data/ems/Table_35a.pdf) and (http://blmi.lmra.bh/2014/06/data/ems/Table_35a.pdf).
The definitions that the LMRA adopts for its data can be found in the Glossary section: (http://blmi.lmra.bh/mi_glossary.xml).
Date of access: September 2014
|
|
Agriculture, hunting and forestry |
Fishing |
Mining and quarrying |
Manufacturing |
Electricity, gas and water supply |
Construction |
Wholesale and retail trade, repair |
Hotels and restaurants |
Transport, storage, communication |
Financial intermediation |
Real estate, renting, business activities |
Public administration |
Education |
Health and social work |
Other social, personal services |
Extra-territorial organizations, bodies |
Not specified |
Total |
| 2009 |
Q3 |
0 |
0 |
0 |
0 |
4 |
3 |
28 |
6 |
3 |
11 |
31 |
0 |
0 |
0 |
3 |
0 |
0 |
89 |
| Q4 |
0 |
1 |
0 |
3 |
0 |
1 |
35 |
4 |
1 |
8 |
41 |
0 |
0 |
0 |
2 |
0 |
0 |
96 |
| 2010 |
Q1 |
0 |
0 |
0 |
9 |
0 |
2 |
43 |
7 |
1 |
19 |
57 |
0 |
0 |
1 |
0 |
0 |
0 |
139 |
| Q2 |
0 |
0 |
0 |
6 |
0 |
5 |
77 |
6 |
2 |
16 |
73 |
0 |
0 |
0 |
1 |
0 |
0 |
186 |
| Q3 |
1 |
0 |
0 |
8 |
0 |
2 |
62 |
2 |
0 |
14 |
49 |
0 |
0 |
1 |
0 |
0 |
0 |
139 |
| Q4 |
0 |
0 |
0 |
7 |
0 |
1 |
53 |
4 |
0 |
8 |
67 |
0 |
0 |
1 |
0 |
0 |
0 |
141 |
| 2011 |
Q1 |
0 |
0 |
0 |
4 |
0 |
3 |
41 |
2 |
1 |
5 |
60 |
0 |
0 |
0 |
1 |
0 |
0 |
117 |
| Q2 |
1 |
0 |
0 |
3 |
0 |
1 |
53 |
2 |
0 |
6 |
83 |
0 |
2 |
0 |
2 |
0 |
0 |
153 |
| Q3 |
1 |
0 |
0 |
5 |
0 |
5 |
39 |
11 |
0 |
7 |
53 |
0 |
1 |
2 |
4 |
0 |
0 |
128 |
| Q4 |
0 |
0 |
0 |
1 |
0 |
1 |
34 |
6 |
3 |
10 |
64 |
0 |
0 |
1 |
1 |
0 |
0 |
121 |
| 2012 |
Q1 |
1 |
0 |
0 |
3 |
0 |
3 |
48 |
3 |
3 |
20 |
90 |
0 |
0 |
0 |
1 |
0 |
0 |
172 |
| Q2 |
0 |
1 |
0 |
4 |
0 |
2 |
75 |
7 |
1 |
18 |
109 |
0 |
0 |
4 |
1 |
0 |
0 |
222 |
| Q3 |
0 |
0 |
0 |
6 |
0 |
1 |
99 |
4 |
1 |
19 |
105 |
0 |
0 |
1 |
0 |
0 |
0 |
236 |
| Q4 |
1 |
0 |
0 |
3 |
0 |
0 |
80 |
9 |
0 |
21 |
95 |
0 |
0 |
0 |
1 |
0 |
0 |
210 |
| 2013 |
Q1 |
0 |
0 |
1 |
2 |
0 |
4 |
105 |
3 |
0 |
17 |
130 |
0 |
2 |
0 |
0 |
0 |
0 |
264 |
| Q2 |
0 |
0 |
0 |
10 |
1 |
1 |
85 |
11 |
0 |
24 |
127 |
0 |
0 |
0 |
1 |
0 |
0 |
260 |
| Q3 |
0 |
0 |
0 |
3 |
1 |
2 |
68 |
5 |
0 |
13 |
116 |
0 |
2 |
2 |
2 |
0 |
0 |
214 |
| Q4 |
0 |
0 |
0 |
3 |
0 |
0 |
83 |
10 |
1 |
18 |
134 |
0 |
0 |
3 |
1 |
0 |
0 |
253 |
| 2014 |
Q1 |
1 |
0 |
0 |
5 |
0 |
3 |
112 |
8 |
1 |
15 |
172 |
0 |
0 |
3 |
0 |
0 |
0 |
320 |
| Q2 |
0 |
1 |
0 |
0 |
10 |
0 |
2 |
127 |
10 |
3 |
16 |
207 |
0 |
0 |
2 |
4 |
0 |
382 |
Source: Labour Market Regulatory Authority (LMRA), Expatriate Management System (EMS)
ANNEXED NOTE
1. Technical Notes and Definitions
This table shows the flow of new permits (or visas) that are given to foreign investors by the LMRA by sector of economic activity.
The LMRA Expatriate Management System (EMS) stores information and past history of sponsors and workers, and their dependents, within the scope of Law No. 19/2006 on regulating the labour market. The scope of the system covers regular, temporary and investor work visas for foreign workers, their dependents, in the commercial sector, the government sector and the non-commercial, non-government sector. It presently excludes domestic workers, and work visas for artists and certain other categories of workers in non-civilian organizations. It distinguishes four types of visas for operational purposes: regular work visas for workers with 24-month validity; temporary work visas issued for workers with 6-month validity; investor work visas issued for investors investing up to BD 100,000; and dependent visas issued for dependent members of eligible foreign workers.The system tracks visa applications, renewals, mobility of workers between employers and from one occupation to another as well as notification of termination and runaway workers, and in general all operations of LMRA including inspection and offence management. The system is updated continuously and linked with other labour-related databases of the Kingdom, including CIO, GDNPR, GOSI, PFC, CSB, Ministry of Labour (MoL), and Ministry of Industry and Commerce (MOIC).
Investor work visas are issued for investors investing up to BD 100,000.
2. Institution which provides data
Labour Market Regulatory Authority (LMRA).
3. Data availability
The LMRA publishes these data under its Bahrain Labour Market Indicators (BLMI) section. The BLMI dashboard can be found in: (http://blmi.lmra.bh/2014/03/mi_dashboard.xml). The general BLMI data with other non-LMRA sources can be found: (http://blmi.lmra.bh/2014/03/mi_data.xml)
Figures and results are often reported in tables in both PDF and Excel formats.
Data for this LMRA table for 2009 can be found here: (http://blmi.lmra.bh/2009/09/data/lmr/Table_35a.pdf) and (http://blmi.lmra.bh/2009/12/data/lmr/Table_35a.pdf).
Data for 2010 can be found here: (http://blmi.lmra.bh/2010/03/data/ems/Table_35a.pdf), (http://blmi.lmra.bh/2010/06/data/ems/Table_35a.pdf), (http://blmi.lmra.bh/2010/09/data/ems/Table_35a.pdf) and (http://blmi.lmra.bh/2010/12/data/ems/Table_35a.pdf).
Data for 2011 can be found here: (http://blmi.lmra.bh/2011/03/data/ems/Table_35a.pdf), (http://blmi.lmra.bh/2011/06/data/ems/Table_35a.pdf), (http://blmi.lmra.bh/2011/09/data/ems/Table_35a.pdf) and (http://blmi.lmra.bh/2011/12/data/ems/Table_35a.pdf).
Data for 2012 can be found here: (http://blmi.lmra.bh/2012/03/data/ems/Table_35a.pdf), (http://blmi.lmra.bh/2012/06/data/ems/Table_35a.pdf), (http://blmi.lmra.bh/2012/09/data/ems/Table_35a.pdf) and (http://blmi.lmra.bh/2012/12/data/ems/Table_35a.pdf).
Data for 2013 can be found here: (http://blmi.lmra.bh/2013/03/data/ems/Table_35a.pdf), (http://blmi.lmra.bh/2013/06/data/ems/Table_35a.pdf), (http://blmi.lmra.bh/2013/09/data/ems/Table_35a.pdf) and (http://blmi.lmra.bh/2013/12/data/ems/Table_35a.pdf).
Data for 2014 can be found here: (http://blmi.lmra.bh/2014/03/data/ems/Table_35a.pdf) and (http://blmi.lmra.bh/2014/06/data/ems/Table_35a.pdf).
The definitions that the LMRA adopts for its data can be found in the Glossary section: (http://blmi.lmra.bh/mi_glossary.xml).
Date of access: September 2014
|
|
Agriculture, hunting and forestry |
Fishing |
Mining and quarrying |
Manufacturing |
Electricity, gas and water supply |
Construction |
Wholesale and retail trade, repair |
Hotels and restaurants |
Transport, storage, communication |
Financial intermediation |
Real estate, renting, business activities |
Public administration |
Education |
Health and social work |
Other social, personal services |
Extra-territorial organizations, bodies |
Not specified |
Total |
|
|
Employment |
Dependent |
Employment |
Dependent |
Employment |
Dependent |
Employment |
Dependent |
Employment |
Dependent |
Employment |
Dependent |
Employment |
Dependent |
Employment |
Dependent |
Employment |
Dependent |
Employment |
Dependent |
Employment |
Dependent |
Employment |
Dependent |
Employment |
Dependent |
Employment |
Dependent |
Employment |
Dependent |
Employment |
Dependent |
Employment |
Dependent |
Employment |
Dependent |
| 2009 |
Q3 |
190 |
12 |
163 |
1 |
114 |
45 |
3,795 |
569 |
17 |
2 |
6,895 |
767 |
5,389 |
1,656 |
2,401 |
286 |
879 |
393 |
383 |
473 |
1,800 |
896 |
38 |
104 |
378 |
227 |
72 |
34 |
787 |
43 |
|
|
912 |
396 |
24,213 |
5,904 |
| Q4 |
244 |
6 |
164 |
0 |
41 |
31 |
4,471 |
559 |
21 |
7 |
8,267 |
548 |
5,330 |
1,306 |
2,211 |
170 |
799 |
307 |
411 |
396 |
1,916 |
818 |
15 |
22 |
273 |
258 |
51 |
20 |
801 |
55 |
|
|
619 |
616 |
25,634 |
5,119 |
| 2010 |
Q1 |
162 |
15 |
202 |
7 |
58 |
34 |
3,856 |
724 |
3 |
36 |
7,719 |
901 |
5,774 |
1,809 |
2,248 |
297 |
723 |
276 |
383 |
396 |
2,151 |
983 |
28 |
48 |
209 |
157 |
102 |
49 |
780 |
49 |
|
|
590 |
460 |
24,988 |
6,241 |
| Q2 |
209 |
14 |
195 |
2 |
43 |
20 |
3,563 |
676 |
12 |
18 |
8,270 |
799 |
5,103 |
1,798 |
2,152 |
308 |
897 |
325 |
361 |
437 |
1,790 |
954 |
13 |
29 |
149 |
143 |
132 |
38 |
661 |
40 |
|
|
679 |
420 |
24,229 |
6,021 |
| Q3 |
183 |
14 |
185 |
4 |
91 |
39 |
3,912 |
667 |
22 |
15 |
8,259 |
760 |
4,997 |
1,730 |
2,346 |
284 |
803 |
338 |
451 |
397 |
1,946 |
913 |
31 |
43 |
332 |
185 |
83 |
34 |
750 |
67 |
|
|
808 |
305 |
25,199 |
5,795 |
| Q4 |
247 |
15 |
301 |
5 |
118 |
52 |
3,764 |
510 |
18 |
21 |
9,003 |
618 |
4,825 |
1,329 |
2,560 |
178 |
670 |
268 |
431 |
337 |
2,147 |
826 |
88 |
320 |
198 |
191 |
151 |
63 |
643 |
43 |
|
|
102 |
114 |
25,266 |
4,890 |
| 2011 |
Q1 |
210 |
6 |
247 |
7 |
128 |
65 |
2,977 |
526 |
8 |
17 |
8,327 |
744 |
4,616 |
1,447 |
2,399 |
225 |
730 |
274 |
327 |
320 |
1,927 |
732 |
50 |
323 |
167 |
104 |
166 |
59 |
572 |
48 |
|
|
78 |
127 |
22,929 |
5,024 |
| Q2 |
167 |
26 |
310 |
5 |
112 |
55 |
3,474 |
688 |
7 |
28 |
7,579 |
893 |
4,472 |
1,783 |
1,760 |
296 |
696 |
333 |
312 |
353 |
2,232 |
969 |
48 |
296 |
142 |
154 |
131 |
58 |
552 |
85 |
|
|
108 |
113 |
22,102 |
6,135 |
| Q3 |
215 |
13 |
369 |
7 |
185 |
59 |
4,353 |
517 |
22 |
9 |
10,340 |
803 |
5,721 |
1,635 |
2,506 |
255 |
864 |
330 |
389 |
348 |
2,125 |
885 |
374 |
176 |
385 |
183 |
109 |
43 |
799 |
49 |
|
|
154 |
138 |
28,910 |
5,450 |
| Q4 |
258 |
8 |
277 |
0 |
184 |
80 |
3,833 |
563 |
24 |
3 |
9,804 |
693 |
5,900 |
1,287 |
2,779 |
204 |
886 |
277 |
355 |
418 |
2,496 |
765 |
186 |
403 |
161 |
199 |
126 |
50 |
840 |
30 |
0 |
1 |
157 |
86 |
28,266 |
5,067 |
| 2012 |
Q1 |
296 |
19 |
257 |
5 |
194 |
156 |
4,071 |
766 |
12 |
26 |
11,282 |
1,059 |
6,366 |
1,824 |
2,819 |
335 |
912 |
368 |
330 |
398 |
2,198 |
921 |
224 |
259 |
161 |
122 |
144 |
53 |
1,078 |
82 |
0 |
1 |
173 |
159 |
30,517 |
6,553 |
| Q2 |
313 |
14 |
528 |
2 |
169 |
110 |
4,293 |
763 |
9 |
18 |
10,296 |
1,175 |
6,719 |
2,111 |
2,855 |
373 |
716 |
322 |
325 |
304 |
2,595 |
1,029 |
103 |
374 |
218 |
108 |
163 |
71 |
1,018 |
90 |
|
|
165 |
167 |
30,485 |
7,031 |
| Q3 |
293 |
19 |
571 |
3 |
206 |
97 |
4,354 |
730 |
7 |
13 |
10,349 |
1,043 |
6,658 |
1,897 |
3,117 |
361 |
694 |
368 |
349 |
370 |
2,442 |
1,106 |
409 |
182 |
353 |
233 |
145 |
91 |
1,038 |
84 |
1 |
0 |
97 |
166 |
31,083 |
6,763 |
| Q4 |
318 |
18 |
441 |
1 |
219 |
71 |
3,851 |
506 |
15 |
11 |
9,592 |
710 |
6,536 |
1,479 |
2,852 |
276 |
664 |
282 |
252 |
260 |
2,463 |
736 |
221 |
157 |
218 |
177 |
162 |
57 |
902 |
49 |
0 |
6 |
108 |
140 |
28,814 |
4,936 |
| 2013 |
Q1 |
409 |
27 |
469 |
3 |
173 |
85 |
4,606 |
871 |
6 |
11 |
9,704 |
1,243 |
7,180 |
2,435 |
3,407 |
387 |
808 |
303 |
323 |
335 |
3,576 |
964 |
130 |
562 |
168 |
136 |
129 |
48 |
1,025 |
96 |
0 |
1 |
87 |
129 |
32,200 |
7,636 |
| Q2 |
441 |
14 |
490 |
1 |
140 |
88 |
4,587 |
851 |
8 |
5 |
9,293 |
1,180 |
7,175 |
2,383 |
3,457 |
456 |
718 |
306 |
318 |
353 |
3,782 |
1,031 |
100 |
703 |
162 |
112 |
180 |
62 |
1,218 |
102 |
0 |
0 |
112 |
167 |
32,181 |
7,814 |
| Q3 |
361 |
19 |
407 |
1 |
108 |
86 |
3,834 |
663 |
18 |
7 |
8,173 |
939 |
6,312 |
1,983 |
3,355 |
400 |
670 |
316 |
289 |
306 |
2,915 |
842 |
598 |
199 |
351 |
210 |
141 |
60 |
1,201 |
105 |
7 |
1 |
101 |
111 |
28,841 |
6,248 |
| Q4 |
267 |
20 |
276 |
4 |
67 |
47 |
3,252 |
535 |
9 |
13 |
6,521 |
716 |
6,061 |
1,556 |
2,991 |
327 |
620 |
210 |
243 |
329 |
2,534 |
842 |
371 |
409 |
261 |
248 |
138 |
35 |
951 |
79 |
1 |
4 |
86 |
118 |
24,649 |
5,492 |
| 2014 |
Q1 |
274 |
16 |
266 |
2 |
63 |
59 |
3,233 |
774 |
6 |
15 |
8,327 |
937 |
6,611 |
2,214 |
3,388 |
359 |
736 |
340 |
240 |
298 |
2,344 |
950 |
79 |
530 |
208 |
121 |
125 |
77 |
1,152 |
71 |
0 |
2 |
124 |
190 |
27,176 |
6,955 |
| Q2 |
317 |
22 |
354 |
0 |
109 |
68 |
3,933 |
875 |
12 |
12 |
9,963 |
1,042 |
7,443 |
2,711 |
3,442 |
469 |
880 |
348 |
289 |
310 |
2,441 |
1,149 |
56 |
632 |
211 |
177 |
167 |
108 |
1,454 |
116 |
1 |
1 |
62 |
132 |
31,134 |
8,172 |
Source: Labour Market Regulatory Authority (LMRA), Expatriate Management System (EMS)
ANNEXED NOTE
1. Technical Notes and Definitions
This table shows the flow of new permits (or visas) that are given to foreigners by the LMRA for new employment and dependent visas.
The LMRA Expatriate Management System (EMS) stores information and past history of sponsors and workers, and their dependents, within the scope of Law No. 19/2006 on regulating the labour market. The scope of the system covers regular, temporary and investor work visas for foreign workers, their dependents, in the commercial sector, the government sector and the non-commercial, non-government sector. It presently excludes domestic workers, and work visas for artists and certain other categories of workers in non-civilian organizations. It distinguishes four types of visas for operational purposes: regular work visas for workers with 24-month validity; temporary work visas issued for workers with 6-month validity; investor work visas issued for investors investing up to BD 100,000; and dependent visas issued for dependent members of eligible foreign workers.The system tracks visa applications, renewals, mobility of workers between employers and from one occupation to another as well as notification of termination and runaway workers, and in general all operations of LMRA including inspection and offence management. The system is updated continuously and linked with other labour-related databases of the Kingdom, including CIO, GDNPR, GOSI, PFC, CSB, Ministry of Labour (MoL), and Ministry of Industry and Commerce (MOIC).
Work Visa is a legal certificate to allow a foreign worker to enter the country for working purposes for a period of two years with the possibility of renewal.
Worker is a generic term that refers to an employed person in general, or to an employee, a self-employed, or a particular category of worker, such as full-time or part-time worker, depending on the context in which the term is used. Four major categories of workers in terms of their status in employment are employees, employers, own-account workers, and unpaid family workers.
2. Institution which provides data
Labour Market Regulatory Authority (LMRA).
3. Data availability
The LMRA publishes these data under its Bahrain Labour Market Indicators (BLMI) section. The BLMI dashboard can be found in: (http://blmi.lmra.bh/2014/03/mi_dashboard.xml). The general BLMI data with other non-LMRA sources can be found: (http://blmi.lmra.bh/2014/03/mi_data.xml)
Figures and results are often reported in tables in both PDF and Excel formats.
Data for this LMRA table for 2009 can be found here: (http://blmi.lmra.bh/2009/09/data/lmr/Table_35a.pdf) and (http://blmi.lmra.bh/2009/12/data/lmr/Table_35a.pdf).
Data for 2010 can be found here: (http://blmi.lmra.bh/2010/03/data/ems/Table_35a.pdf), (http://blmi.lmra.bh/2010/06/data/ems/Table_35a.pdf), (http://blmi.lmra.bh/2010/09/data/ems/Table_35a.pdf) and (http://blmi.lmra.bh/2010/12/data/ems/Table_35a.pdf).
Data for 2011 can be found here: (http://blmi.lmra.bh/2011/03/data/ems/Table_35a.pdf), (http://blmi.lmra.bh/2011/06/data/ems/Table_35a.pdf), (http://blmi.lmra.bh/2011/09/data/ems/Table_35a.pdf) and (http://blmi.lmra.bh/2011/12/data/ems/Table_35a.pdf).
Data for 2012 can be found here: (http://blmi.lmra.bh/2012/03/data/ems/Table_35a.pdf), (http://blmi.lmra.bh/2012/06/data/ems/Table_35a.pdf), (http://blmi.lmra.bh/2012/09/data/ems/Table_35a.pdf) and (http://blmi.lmra.bh/2012/12/data/ems/Table_35a.pdf).
Data for 2013 can be found here: (http://blmi.lmra.bh/2013/03/data/ems/Table_35a.pdf), (http://blmi.lmra.bh/2013/06/data/ems/Table_35a.pdf), (http://blmi.lmra.bh/2013/09/data/ems/Table_35a.pdf) and (http://blmi.lmra.bh/2013/12/data/ems/Table_35a.pdf).
Data for 2014 can be found here: (http://blmi.lmra.bh/2014/03/data/ems/Table_35a.pdf) and (http://blmi.lmra.bh/2014/06/data/ems/Table_35a.pdf).
The definitions that the LMRA adopts for its data can be found in the Glossary section: (http://blmi.lmra.bh/mi_glossary.xml).
Date of access: September 2014
|
|
Agriculture, hunting and forestry |
Fishing |
Mining and quarrying |
Manufacturing |
Electricity, gas and water supply |
Construction |
Wholesale and retail trade, repair |
Hotels and restaurants |
Transport, storage, communication |
Financial intermediation |
Real estate, renting, business activities |
Public administration |
Education |
Health and social work |
Other social, personal services |
Extra-territorial organizations, bodies |
Not specified |
Total |
| 2009 |
Q3 |
202 |
164 |
160 |
4,465 |
19 |
7,846 |
7,210 |
2,693 |
1,290 |
882 |
2,819 |
142 |
605 |
106 |
833 |
0 |
1,308 |
30,744 |
| Q4 |
250 |
165 |
74 |
5,355 |
28 |
9,099 |
6,744 |
2,385 |
1,116 |
816 |
2,917 |
37 |
531 |
71 |
858 |
0 |
1,235 |
31,681 |
| 2010 |
Q1 |
177 |
209 |
92 |
5,042 |
39 |
9,534 |
7,757 |
2,552 |
1,003 |
802 |
3,331 |
76 |
366 |
152 |
829 |
0 |
1,060 |
33,021 |
| Q2 |
224 |
197 |
63 |
4,451 |
30 |
9,241 |
7,021 |
2,466 |
1,241 |
814 |
2,900 |
42 |
292 |
170 |
702 |
0 |
1,106 |
30,960 |
| Q3 |
199 |
189 |
130 |
4,770 |
37 |
9,188 |
6,847 |
2,635 |
1,150 |
862 |
2,931 |
74 |
517 |
118 |
817 |
0 |
1,113 |
31,577 |
| Q4 |
262 |
306 |
172 |
4,506 |
39 |
9,929 |
6,236 |
2,744 |
938 |
776 |
3,107 |
408 |
389 |
215 |
686 |
0 |
216 |
30,929 |
| 2011 |
Q1 |
216 |
254 |
210 |
4,050 |
25 |
9,349 |
6,491 |
2,626 |
1,005 |
654 |
2,793 |
373 |
271 |
225 |
623 |
0 |
205 |
29,370 |
| Q2 |
194 |
315 |
172 |
4,469 |
42 |
8,611 |
6,338 |
2,073 |
1,035 |
671 |
3,339 |
344 |
298 |
189 |
640 |
0 |
221 |
28,951 |
| Q3 |
229 |
376 |
260 |
5,184 |
31 |
11,340 |
7,412 |
2,776 |
1,202 |
747 |
3,107 |
550 |
569 |
154 |
852 |
0 |
292 |
35,081 |
| Q4 |
266 |
277 |
266 |
4,511 |
88 |
10,837 |
7,295 |
2,994 |
1,167 |
783 |
3,379 |
589 |
360 |
177 |
871 |
1 |
243 |
34,104 |
| 2012 |
Q1 |
316 |
262 |
376 |
5,020 |
70 |
12,832 |
8,309 |
3,163 |
1,286 |
749 |
3,265 |
483 |
283 |
197 |
1,161 |
1 |
332 |
38,105 |
| Q2 |
327 |
531 |
306 |
5,423 |
32 |
12,067 |
9,057 |
3,235 |
1,040 |
647 |
3,785 |
477 |
326 |
238 |
1,109 |
0 |
332 |
38,932 |
| Q3 |
312 |
574 |
317 |
5,441 |
22 |
11,836 |
8,707 |
3,487 |
1,069 |
738 |
3,735 |
591 |
586 |
237 |
1,122 |
1 |
263 |
39,038 |
| Q4 |
337 |
442 |
310 |
4,826 |
124 |
11,099 |
8,143 |
3,137 |
947 |
533 |
3,411 |
378 |
395 |
219 |
952 |
6 |
248 |
35,507 |
| 2013 |
Q1 |
436 |
472 |
274 |
5,947 |
18 |
11,577 |
9,806 |
3,802 |
1,113 |
675 |
4,709 |
692 |
306 |
177 |
1,121 |
1 |
216 |
41,342 |
| Q2 |
455 |
491 |
259 |
5,609 |
14 |
10,553 |
9,702 |
3,924 |
1,036 |
696 |
4,980 |
803 |
274 |
242 |
1,324 |
0 |
279 |
40,641 |
| Q3 |
380 |
408 |
221 |
4,761 |
26 |
9,149 |
8,416 |
3,765 |
994 |
610 |
3,901 |
797 |
564 |
203 |
1,308 |
8 |
212 |
35,723 |
| Q4 |
287 |
280 |
142 |
3,983 |
118 |
7,294 |
7,758 |
3,328 |
835 |
590 |
3,548 |
780 |
510 |
176 |
1,031 |
5 |
204 |
30,869 |
| 2014 |
Q1 |
291 |
268 |
191 |
4,147 |
21 |
9,790 |
9,027 |
3,764 |
1,079 |
554 |
3,499 |
609 |
330 |
205 |
1,224 |
2 |
314 |
35,315 |
| Q2 |
340 |
354 |
196 |
4,931 |
24 |
11,066 |
10,309 |
3,929 |
1,232 |
615 |
3,834 |
688 |
388 |
277 |
1,574 |
2 |
194 |
39,953 |
Source: Labour Market Regulatory Authority (LMRA), Expatriate Management System (EMS)
ANNEXED NOTE
1. Technical Notes and Definitions
This table shows the flow of new permits (or visas) that are given to foreigners by the LMRA. These new visas combine those given for regular and temporary workers, investors and dependents.
The LMRA Expatriate Management System (EMS) stores information and past history of sponsors and workers, and their dependents, within the scope of Law No. 19/2006 on regulating the labour market. The scope of the system covers regular, temporary and investor work visas for foreign workers, their dependents, in the commercial sector, the government sector and the non-commercial, non-government sector. It presently excludes domestic workers, and work visas for artists and certain other categories of workers in non-civilian organizations. It distinguishes four types of visas for operational purposes: regular work visas for workers with 24-month validity; temporary work visas issued for workers with 6-month validity; investor work visas issued for investors investing up to BD 100,000; and dependent visas issued for dependent members of eligible foreign workers.The system tracks visa applications, renewals, mobility of workers between employers and from one occupation to another as well as notification of termination and runaway workers, and in general all operations of LMRA including inspection and offence management. The system is updated continuously and linked with other labour-related databases of the Kingdom, including CIO, GDNPR, GOSI, PFC, CSB, Ministry of Labour (MoL), and Ministry of Industry and Commerce (MOIC).
Work Visa is a legal certificate to allow a foreign worker to enter the country for working purposes for a period of two years with the possibility of renewal.
Worker is a generic term that refers to an employed person in general, or to an employee, a self-employed, or a particular category of worker, such as full-time or part-time worker, depending on the context in which the term is used. Four major categories of workers in terms of their status in employment are employees, employers, own-account workers, and unpaid family workers.
2. Institution which provides data
Labour Market Regulatory Authority (LMRA).
3. Data availability
The LMRA publishes these data under its Bahrain Labour Market Indicators (BLMI) section. The BLMI dashboard can be found in: (http://blmi.lmra.bh/2014/03/mi_dashboard.xml). The general BLMI data with other non-LMRA sources can be found: (http://blmi.lmra.bh/2014/03/mi_data.xml)
Figures and results are often reported in tables in both PDF and Excel formats.
Data for this LMRA table for 2009 can be found here: (http://blmi.lmra.bh/2009/09/data/lmr/Table_35a.pdf) and (http://blmi.lmra.bh/2009/12/data/lmr/Table_35a.pdf).
Data for 2010 can be found here: (http://blmi.lmra.bh/2010/03/data/ems/Table_35a.pdf), (http://blmi.lmra.bh/2010/06/data/ems/Table_35a.pdf), (http://blmi.lmra.bh/2010/09/data/ems/Table_35a.pdf) and (http://blmi.lmra.bh/2010/12/data/ems/Table_35a.pdf).
Data for 2011 can be found here: (http://blmi.lmra.bh/2011/03/data/ems/Table_35a.pdf), (http://blmi.lmra.bh/2011/06/data/ems/Table_35a.pdf), (http://blmi.lmra.bh/2011/09/data/ems/Table_35a.pdf) and (http://blmi.lmra.bh/2011/12/data/ems/Table_35a.pdf).
Data for 2012 can be found here: (http://blmi.lmra.bh/2012/03/data/ems/Table_35a.pdf), (http://blmi.lmra.bh/2012/06/data/ems/Table_35a.pdf), (http://blmi.lmra.bh/2012/09/data/ems/Table_35a.pdf) and (http://blmi.lmra.bh/2012/12/data/ems/Table_35a.pdf).
Data for 2013 can be found here: (http://blmi.lmra.bh/2013/03/data/ems/Table_35a.pdf), (http://blmi.lmra.bh/2013/06/data/ems/Table_35a.pdf), (http://blmi.lmra.bh/2013/09/data/ems/Table_35a.pdf) and (http://blmi.lmra.bh/2013/12/data/ems/Table_35a.pdf).
Data for 2014 can be found here: (http://blmi.lmra.bh/2014/03/data/ems/Table_35a.pdf) and (http://blmi.lmra.bh/2014/06/data/ems/Table_35a.pdf).
The definitions that the LMRA adopts for its data can be found in the Glossary section: (http://blmi.lmra.bh/mi_glossary.xml).
Date of access: September 2014
| Year |
Omani |
Expatriate |
Total |
| 1985 |
1,102,000 |
314,000 |
1,416,000 |
| 1986 |
1,143,000 |
295,000 |
1,438,000 |
| 1987 |
1,185,000 |
239,000 |
1,424,000 |
| 1988 |
1,226,000 |
275,000 |
1,501,000 |
| 1989 |
1,274,000 |
285,000 |
1,559,000 |
| 1990 |
1,321,000 |
304,000 |
1,625,000 |
| 1991 |
1,369,000 |
388,000 |
1,757,000 |
| 1992 |
1,417,000 |
465,000 |
1,882,000 |
| 1993 (1) |
1,465,000 |
535,000 |
2,000,000 |
| 1994 |
1,512,000 |
538,000 |
2,050,000 |
| 1995 |
1,557,000 |
574,000 |
2,131,000 |
| 1996 |
1,602,000 |
612,000 |
2,214,000 |
| 1997 |
1,642,000 |
613,000 |
2,255,000 |
| 1998 |
1,685,000 |
602,000 |
2,287,000 |
| 1999 |
1,729,000 |
596,000 |
2,325,000 |
| 2000 |
1,778,000 |
624,000 |
2,402,000 |
| 2001 |
1,826,000 |
652,000 |
2,478,000 |
| 2002 |
1,870,000 |
668,000 |
2,538,000 |
| 2003 (1) |
1,782,000 |
559,000 |
2,341,000 |
| 2004 |
1,803,000 |
613,000 |
2,416,000 |
| 2005 |
1,843,000 |
666,000 |
2,509,000 |
| 2006 |
1,884,000 |
693,000 |
2,577,000 |
| 2007 |
1,923,000 |
820,000 |
2,743,000 |
| 2008 |
1,967,000 |
900,000 |
2,867,000 |
| 2009 |
2,018,000 |
1,156,000 |
3,174,000 |
| 2010 (1) |
1,957,000 |
816,000 |
2,773,000 |
| 2011 (2) |
2,013,000 |
1,282,000 |
3,295,000 |
| 2012 (2) |
2,093,000 |
1,530,000 |
3,623,000 |
| 2013 (2) |
2,172,000 |
1,683,000 |
3,855,000 |
Source: Ministry of National Economy and General Directorate for Civil Status
ANNEXED NOTE
1. Technical Notes and Definitions
The table refers to the population estimated or registered in the Sultanate as of the mid of each given year.
1- Population recorded at each census date in 1993; 2003 and 2010
2- Population registered in the National Registration System, a civil register recording all Omani and expatriate residents
The civil registration is based on the civil status system and is maintained by the General Directorate of Civil Status, a part of the Royal Oman Police.
Since 2004, registration of all vital events taking place in the Sultanate (births, death, marriages and divorces) in the civil register is mandatory for Omanis and residents of the Sultanate.
DGCS also issues and keeps records of identity cards for Omanis and residence cards to foreign residents.
3- Population estimated by projection based on partial statistical operations and on population censuses (1993 and 2003).
Projections were prepared by the use of the” Component Method” which takes into consideration all the components of demographic growth (births, deaths, migrants’ entries and exits)
2. Institution which provides data
National Center for Statistics and Information (NCSI)
3. Data availability
The National Center for Statistics and Information (NCSI) processes and disseminates all statistical data of use to the public and to government action.
The present data is published in 2014′ Statistical Yearbook, available online on NSCI’s website. Each thematic section is presented in PDF format.
The “population” section is available at:
http://www.ncsi.gov.om/NCSI_website/book/SYB2014/2-Population.pdf
Date of access: October 2014.
|
Work |
With Family |
Study Training |
Medical Treatment |
Marriage |
Tourism |
Business Mission |
Other |
Total |
|
males |
females |
total |
males |
females |
total |
males |
females |
total |
males |
females |
total |
males |
females |
total |
males |
females |
total |
males |
females |
total |
males |
females |
total |
males |
females |
total |
| GCC |
1,071 |
144 |
1,215 |
911 |
1,269 |
2,180 |
330 |
148 |
478 |
4 |
3 |
7 |
115 |
605 |
720 |
160 |
74 |
234 |
21 |
14 |
35 |
1,024 |
930 |
1,954 |
3,636 |
3,187 |
6,823 |
| Other Arabs |
7,437 |
943 |
8,380 |
2,954 |
5,063 |
8,017 |
114 |
68 |
182 |
5 |
5 |
10 |
38 |
1,160 |
1,198 |
20 |
18 |
38 |
6 |
4 |
10 |
1,124 |
1,091 |
2,215 |
11,698 |
8,352 |
20,050 |
| Asian |
132,049 |
28,066 |
160,115 |
10,307 |
22,355 |
32,662 |
170 |
142 |
312 |
21 |
11 |
32 |
51 |
1,695 |
1,746 |
48 |
91 |
139 |
287 |
19 |
306 |
5,410 |
4,904 |
10,314 |
148,343 |
57,283 |
205,626 |
| African |
249 |
2,325 |
2,574 |
74 |
201 |
275 |
0 |
1 |
1 |
1 |
1 |
2 |
0 |
29 |
29 |
2 |
2 |
4 |
0 |
2 |
2 |
16 |
21 |
37 |
342 |
2,582 |
2,924 |
| European |
2,001 |
960 |
2,961 |
665 |
1,606 |
2,271 |
10 |
20 |
30 |
1 |
1 |
2 |
6 |
228 |
234 |
8 |
8 |
16 |
2 |
6 |
8 |
140 |
126 |
266 |
2,833 |
2,955 |
5,788 |
| North American |
1,533 |
579 |
2,112 |
303 |
591 |
894 |
39 |
30 |
69 |
0 |
0 |
0 |
4 |
26 |
30 |
3 |
2 |
5 |
5 |
0 |
5 |
37 |
43 |
80 |
1,924 |
1,271 |
3,195 |
| South American |
28 |
13 |
41 |
4 |
14 |
18 |
0 |
0 |
0 |
0 |
0 |
0 |
0 |
6 |
6 |
1 |
0 |
1 |
0 |
0 |
0 |
2 |
2 |
4 |
35 |
35 |
70 |
| Oceanian |
131 |
97 |
228 |
72 |
130 |
202 |
1 |
0 |
1 |
0 |
0 |
0 |
0 |
8 |
8 |
0 |
1 |
1 |
0 |
0 |
0 |
11 |
10 |
21 |
215 |
246 |
461 |
| Total |
144,499 |
33,127 |
177,626 |
15,290 |
31,229 |
46,519 |
664 |
409 |
1,073 |
32 |
21 |
53 |
214 |
3,757 |
3,971 |
242 |
196 |
438 |
321 |
45 |
366 |
7,764 |
7,127 |
14,891 |
169,026 |
75,911 |
244,937 |
Source: Central Informatics Organization (CIO)
ANNEXED NOTE
1. Technical Notes and Definitions
This table shows the non-Bahraini residences by nationality group, sex and reason of residence in the census of 1991.
| census year |
reference period |
implementing institution |
implementation method |
population covered |
| 1981 |
November 16 |
Ministry of Finance
Statistics Department |
field interviews |
de jure, de facto |
all individuals (nationals and non-nationals): 1- present within the country’s borders during time of reference; 2- residing in Bahrain irrespective of where are they at census times |
| 1991 |
April 6 |
Central Informatics Organisation (CIO) |
field interviews |
| 2001 |
April 7 |
field interviews; characteristics of population in collective households (among which labour camps) was obtained from sponsors |
| 2010 |
April 27 |
based on administrative records |
Nationality of the person is defined by the passport used to enter the country. A Non-Bahrainis is considered as such depending on the passport used to enter the country (or obtain the visa).
Note that some of the sub-totals on the CIO table do not match those as they appear in this table. The figures of the males and females are considered fixed and added accordingly.
2. Institution which provides data
Central Informatics Organization, known prior to 2001 as the “Central Statistics Organisation” under the Ministry of Cabinet Affairs.
3. Data availability
Figures and results reported here are available on the Central Informatics Organisation (CIO) website: (http://www.cio.gov.bh)
CIO figures and results are often reported in tables in both PDF and Excel formats.
The 2001 data for this table can be found: (http://www.cio.gov.bh/cio_ara/English/Publications/Statistical%20Abstract/ABS2008/Ch2/31B.pdf).
They can also be found in the Statistical Abstracts of 2002 under the Population section.
Date of access: August 2014
|
Work |
With Family |
Study Training |
Medical Treatment |
Marriage |
Tourism |
Business Mission |
Other |
Total |
|
males |
females |
total |
males |
females |
total |
males |
females |
total |
males |
females |
total |
males |
females |
total |
males |
females |
total |
males |
females |
total |
males |
females |
total |
males |
females |
total |
| GCC |
820 |
20 |
840 |
771 |
1,044 |
1,815 |
201 |
191 |
392 |
1 |
6 |
7 |
97 |
426 |
523 |
61 |
31 |
92 |
58 |
9 |
67 |
517 |
475 |
992 |
2,526 |
2,202 |
4,728 |
| Other Arabs |
5,837 |
788 |
6,625 |
3,130 |
5,451 |
8,581 |
95 |
57 |
152 |
2 |
5 |
7 |
37 |
489 |
526 |
21 |
29 |
50 |
5 |
6 |
11 |
959 |
966 |
1,925 |
10,086 |
7,791 |
17,877 |
| Asian |
102,145 |
18,069 |
120,214 |
8,527 |
17,853 |
26,380 |
206 |
144 |
350 |
10 |
5 |
15 |
65 |
1,299 |
1,364 |
36 |
47 |
83 |
57 |
28 |
85 |
3,047 |
2,552 |
5,599 |
114,093 |
39,997 |
154,090 |
| African |
107 |
57 |
164 |
34 |
100 |
134 |
0 |
1 |
1 |
0 |
0 |
0 |
0 |
14 |
14 |
1 |
2 |
3 |
0 |
0 |
0 |
17 |
12 |
29 |
159 |
186 |
345 |
| European |
2,259 |
874 |
3,133 |
622 |
1,674 |
2,296 |
19 |
16 |
35 |
1 |
0 |
1 |
9 |
212 |
221 |
20 |
24 |
44 |
11 |
3 |
14 |
128 |
120 |
248 |
3,069 |
2,923 |
5,992 |
| North American |
514 |
131 |
645 |
167 |
358 |
525 |
19 |
18 |
37 |
1 |
0 |
1 |
1 |
28 |
29 |
3 |
6 |
9 |
19 |
3 |
22 |
17 |
18 |
35 |
741 |
562 |
1,303 |
| South American |
30 |
8 |
38 |
10 |
31 |
41 |
1 |
1 |
2 |
0 |
0 |
0 |
0 |
9 |
9 |
0 |
0 |
0 |
0 |
0 |
0 |
1 |
2 |
3 |
42 |
51 |
93 |
| Oceanian |
127 |
28 |
155 |
44 |
92 |
136 |
0 |
0 |
0 |
0 |
0 |
0 |
0 |
0 |
0 |
2 |
4 |
6 |
0 |
0 |
0 |
4 |
3 |
7 |
177 |
127 |
304 |
| Total |
111,839 |
19,975 |
131,814 |
13,305 |
26,603 |
39,908 |
541 |
428 |
969 |
15 |
16 |
31 |
209 |
2,477 |
2,686 |
144 |
143 |
287 |
150 |
49 |
199 |
4,690 |
4,148 |
8,838 |
130,893 |
53,839 |
184,732 |
Source: Central Informatics Organization (CIO)
ANNEXED NOTE
1. Technical Notes and Definitions
This table shows the non-Bahraini residences by nationality group, sex and reason of residence in the census of 1991.
| census year |
reference period |
implementing institution |
implementation method |
population covered |
| 1981 |
November 16 |
Ministry of Finance
Statistics Department |
field interviews |
de jure, de facto |
all individuals (nationals and non-nationals): 1- present within the country’s borders during time of reference; 2- residing in Bahrain irrespective of where are they at census times |
| 1991 |
April 6 |
Central Informatics Organisation (CIO) |
field interviews |
| 2001 |
April 7 |
field interviews; characteristics of population in collective households (among which labour camps) was obtained from sponsors |
| 2010 |
April 27 |
based on administrative records |
Nationality of the person is defined by the passport used to enter the country. A Non-Bahrainis is considered as such depending on the passport used to enter the country (or obtain the visa).
Note that some of the sub-totals on the CIO table do not match those as they appear in this table. The figures of the males and females are considered fixed and added accordingly.
2. Institution which provides data
Central Informatics Organization, known prior to 2001 as the “Central Statistics Organisation” under the Ministry of Cabinet Affairs.
3. Data availability
Figures and results reported here are available on the Central Informatics Organisation (CIO) website: (http://www.cio.gov.bh)
CIO figures and results are often reported in tables in both PDF and Excel formats.
The 1991 data for this table can be found: (http://www.cio.gov.bh/cio_ara/English/Publications/Statistical%20Abstract/ABS2008/Ch2/31A.pdf).
They can also be found in the Statistical Abstracts of 2000, 2001 and 2002 under the Population section.
Date of access: August 2014
| |
|
New Visas |
Renewals |
Termination |
| |
|
Dependent |
Employment |
Investor |
Temporary Worker |
Total |
Dependent |
Employment |
Investor |
Temporary Worker |
Total |
Dependent |
Employment |
Investor |
Temporary Worker |
Total |
| 2008 |
Q3 |
3,080 |
9,014 |
31 |
455 |
12,580 |
3,073 |
13,505 |
8 |
397 |
16,983 |
1,023 |
3,914 |
2 |
83 |
5,022 |
| |
Q4 |
6,128 |
27,238 |
78 |
1,793 |
35,237 |
4,451 |
19,375 |
46 |
463 |
24,335 |
894 |
5,370 |
0 |
659 |
6,923 |
| 2009 |
Q1 |
7,123 |
34,458 |
93 |
2,340 |
44,014 |
6,439 |
26,459 |
142 |
338 |
33,378 |
1,929 |
15,255 |
10 |
1,755 |
18,949 |
| |
Q2 |
7,581 |
27,663 |
105 |
1,013 |
36,362 |
8,326 |
29,300 |
125 |
558 |
38,309 |
2,214 |
15,211 |
4 |
657 |
18,086 |
| |
Q3 |
5,904 |
24,211 |
91 |
538 |
30,744 |
5,152 |
25,753 |
65 |
406 |
31,376 |
1,845 |
14,032 |
6 |
816 |
16,699 |
| |
Q4 |
5,119 |
25,633 |
97 |
832 |
31,681 |
6,974 |
31,793 |
69 |
582 |
39,418 |
1,708 |
14,744 |
9 |
943 |
17,404 |
| 2010 |
Q1 |
6,241 |
24,988 |
139 |
1,653 |
33,021 |
11,539 |
43,168 |
94 |
285 |
55,086 |
1,828 |
16,043 |
12 |
1,016 |
18,899 |
| |
Q2 |
6,021 |
24,229 |
186 |
524 |
30,960 |
10,897 |
34,048 |
121 |
336 |
45,402 |
2,433 |
15,662 |
6 |
549 |
18,650 |
| |
Q3 |
5,795 |
25,199 |
139 |
444 |
31,577 |
6,670 |
29,847 |
131 |
478 |
37,126 |
2,041 |
16,806 |
8 |
420 |
19,275 |
| |
Q4 |
4,890 |
25,266 |
141 |
632 |
30,929 |
7,244 |
25,632 |
170 |
380 |
33,426 |
1,736 |
16,433 |
13 |
377 |
18,559 |
| 2011 |
Q1 |
5024 |
22929 |
117 |
1300 |
29,370 |
9538 |
28220 |
193 |
214 |
38,165 |
2,067 |
17,629 |
7 |
716 |
20,419 |
| |
Q2 |
6135 |
22102 |
153 |
561 |
28,951 |
9199 |
27880 |
189 |
380 |
37,648 |
2,759 |
17,472 |
14 |
698 |
20,943 |
| |
Q3 |
5450 |
28910 |
128 |
593 |
35,081 |
5910 |
22968 |
137 |
178 |
29,193 |
2,062 |
14,606 |
9 |
311 |
16,988 |
| |
Q4 |
5067 |
28266 |
121 |
650 |
34,104 |
7319 |
28141 |
143 |
358 |
35,961 |
2,052 |
15,143 |
12 |
310 |
17,517 |
| 2012 |
Q1 |
6,553 |
30,517 |
172 |
863 |
38,105 |
9,953 |
32,925 |
238 |
377 |
43,493 |
2,469 |
14,748 |
10 |
226 |
17,453 |
| |
Q2 |
7,031 |
30,485 |
222 |
1,194 |
38,932 |
9,923 |
28,613 |
244 |
437 |
39,217 |
2,661 |
14,628 |
14 |
328 |
17,631 |
| |
Q3 |
6,763 |
31,083 |
236 |
956 |
39,038 |
7,057 |
26,381 |
213 |
395 |
34,046 |
2,082 |
14,087 |
21 |
582 |
16,772 |
| |
Q4 |
4,936 |
28,814 |
210 |
1,547 |
35,507 |
7,970 |
27,357 |
252 |
449 |
36,028 |
2,463 |
17,086 |
24 |
1,510 |
21,083 |
| 2013 |
Q1 |
7,636 |
32,200 |
264 |
1,242 |
41,342 |
10,150 |
28,589 |
302 |
364 |
39,405 |
3,390 |
19,998 |
26 |
1,457 |
24,871 |
| |
Q2 |
7,814 |
32,181 |
260 |
386 |
40,641 |
11,056 |
28,210 |
278 |
210 |
39,754 |
4,124 |
20,057 |
31 |
713 |
24,925 |
| |
Q3 |
6,248 |
28,841 |
214 |
420 |
35,723 |
7,375 |
27,855 |
218 |
310 |
35,758 |
3,569 |
22,051 |
24 |
475 |
26,119 |
| |
Q4 |
5,492 |
24,649 |
253 |
475 |
30,869 |
8,746 |
31,480 |
269 |
257 |
40,752 |
3,579 |
23,957 |
32 |
444 |
28,012 |
| 2014 |
Q1 |
6,955 |
27,176 |
320 |
864 |
35,315 |
11,595 |
37,012 |
348 |
238 |
49,193 |
4,002 |
22,855 |
30 |
411 |
27,298 |
Source: Labour Market Regulatory Authority (LMRA), Expatriate Management System (EMS)
ANNEXED NOTE
1. Technical Notes and Definitions
This table shows the flow of work permits (or visas) that are given to foreigners distinguished by the type permit granted by the LMRA (for employment, temporary employment, investor and dependendent) and separated into new visas, renewals to already existing visas and termination of visas.
The LMRA Expatriate Management System (EMS) stores information and past history of sponsors and workers, and their dependents, within the scope of Law No. 19/2006 on regulating the labour market. The scope of the system covers regular, temporary and investor work visas for foreign workers, their dependents, in the commercial sector, the government sector and the non-commercial, non-government sector.
Until September 2014 the system excluded domestic workers, and work visas for artists and certain other categories of workers in non-civilian organizations. It distinguishes four types of visas for operational purposes: regular work visas for workers with 24-month validity; temporary work visas issued for workers with 6-month validity; investor work visas issued for investors investing up to BD 100,000; and dependent visas issued for dependent members of eligible foreign workers.The system tracks visa applications, renewals, mobility of workers between employers and from one occupation to another as well as notification of termination and runaway workers, and in general all operations of LMRA including inspection and offence management. The system is updated continuously and linked with other labour-related databases of the Kingdom, including CIO, GDNPR, GOSI, PFC, CSB, Ministry of Labour (MoL), and Ministry of Industry and Commerce (MOIC).
Work Visa is a legal certificate to allow a foreign worker to enter the country for working purposes for a period of two years with the possibility of renewal.
Regular Worker is a worker engaged to work in an enterprise for a long period of time, i.e. for more than six months and usually two years with possibility of renewal.
Investor is a person who invests up to 100,000 Bahraini dinars.
Temporary Worker is a worker engaged to work in an enterprise for a short period of time, i.e. for less than two years and usually six months.
Dependent is a person who is a dependent member of the family of the eligible foreign worker.
Worker is a generic term that refers to an employed person in general, or to an employee, a self-employed, or a particular category of worker, such as full-time or part-time worker, depending on the context in which the term is used. Four major categories of workers in terms of their status in employment are employees, employers, own-account workers, and unpaid family workers.
Termination refers to an employer’s application to the LMRA announcing the end of employment of a foraign worker in theeconomic unit (CR/Branch)
2. Institution which provides data
Labour Market Regulatory Authority (LMRA).
3. Data availability
The LMRA publishes these data under its Bahrain Labour Market Indicators (BLMI) section. The BLMI dashboard can be found in: (http://blmi.lmra.bh/2014/03/mi_dashboard.xml). The general BLMI data with other non-LMRA sources can be found: (http://blmi.lmra.bh/2014/03/mi_data.xml)
Figures and results are often reported in tables in both PDF and Excel formats.
Data for this LMRA table can be found in two separate links here: (http://blmi.lmra.bh/2011/12/data/ems/Table_33.pdf) and (http://blmi.lmra.bh/2014/03/data/ems/Table_33.pdf).
The definitions that the LMRA adopts for its data can be found in the Glossary section: (http://blmi.lmra.bh/mi_glossary.xml).
Date of access: August 2014
|
Work permits issued |
| Regular workers |
Domestic workers |
Temporary Workers |
| New visas |
Renewal |
New visas |
Renewal |
| 2002 |
47,853 |
56,317 |
21,459 |
9,624 |
0 |
| 2003 |
57,212 |
63,813 |
25,607 |
10,188 |
2,857 |
| 2004 |
55,904 |
66,864 |
29,731 |
10,390 |
5,546 |
| 2005 |
69,525 |
75,941 |
30,562 |
11,904 |
4,588 |
| 2006 |
91,664 |
75,512 |
31,876 |
13,029 |
3,298 |
| 2007 |
97,905 |
90,535 |
33,393 |
14,324 |
5,501 |
| 2008 |
76,181 |
56,657 |
36,319 |
15,060 |
3,431 |
| 2009 |
0 |
41 |
35,683 |
16,222 |
0 |
| 2010 |
0 |
5 |
26,821 |
13,949 |
0 |
| 2011 |
0 |
0 |
33,205 |
18,712 |
0 |
| 2012 |
0 |
0 |
39,803 |
17,919 |
0 |
| 2013 Q1 |
0 |
0 |
9,835 |
4,428 |
0 |
Source: Labour Market Regulatory Authority (LMRA); Ministry of Labour (MOL)
ANNEXED NOTE
1. Technical Notes and Definitions
This table shows the flow of work permits (or visas) that are given to foreign workers distinguished by the type permit granted by the Ministry of Labour (MOL).
The Labour Market Regulatory Authority (LMRA) currently regulates the issuance and tracking of visas under the Expatriate Management System (EMS). Until September 2014, the system excluded domestic worker visa issuance, work for artists and other categories of workers of non-civilian organizations. These visas were issued by the Ministry of Labour as shown in this table. The Ministry of Labour also was the main work visa issuer prior to the establishment of the LMRA.
Work Visa is a legal certificate to allow a foreign worker to enter the country for working purposes for a period of two years with the possibility of renewal.
Worker is a generic term that refers to an employed person in general, or to an employee, a self-employed, or a particular category of worker, such as full-time or part-time worker, depending on the context in which the term is used. Four major categories of workers in terms of their status in employment are employees, employers, own-account workers, and unpaid family workers.
Regular Worker is a worker engaged to work in an enterprise for a long period of time, i.e. for more than six months and usually two years with possibility of renewal.
Temporary Worker is a worker engaged to work in an enterprise for a short period of time, i.e. for less than two years and usually six months.
Domestic worker is an employee who works, and often also lives, within the employer’s household.
2. Institution which provides data
Ministry of Labour (MOL).
Labour Market Regulatory Authority (LMRA).
3. Data availability
The LMRA publishes these data under its Bahrain Labour Market Indicators (BLMI) section. The BLMI dashboard can be found in: (http://blmi.lmra.bh/2014/03/mi_dashboard.xml). The general BLMI data with other non-LMRA sources can be found: (http://blmi.lmra.bh/2014/03/mi_data.xml)
Figures and results are often reported in tables in both PDF and Excel formats.
Data for this table found here: (http://blmi.lmra.bh/2014/03/data/mol/Table_32.pdf)
The definitions that the LMRA adopts for its data can be found in the Glossary section: (http://blmi.lmra.bh/mi_glossary.xml)
Date of access: August 2014
|
|
Regular Workers |
Investors |
Temporary |
|
|
New Visas |
Renewals |
Total |
New Visas |
Renewals |
Total |
New Visas |
Renewals |
Total |
| 2008 |
Q3 |
18,930 |
15,033 |
33,963 |
89 |
13 |
102 |
1,417 |
411 |
411 |
| |
Q4 |
42,887 |
22,167 |
65,054 |
113 |
64 |
177 |
2,748 |
510 |
510 |
| 2009 |
Q1 |
50,535 |
30,519 |
81,054 |
143 |
157 |
300 |
1,873 |
439 |
439 |
| |
Q2 |
37,057 |
31,875 |
68,932 |
172 |
129 |
301 |
1,162 |
760 |
760 |
| |
Q3 |
35,956 |
29,456 |
65,412 |
242 |
68 |
310 |
779 |
612 |
612 |
| |
Q4 |
36,450 |
35,797 |
72,247 |
168 |
74 |
242 |
1,089 |
600 |
600 |
| 2010 |
Q1 |
42,203 |
42,558 |
84,761 |
251 |
91 |
342 |
1,990 |
329 |
329 |
| |
Q2 |
39,612 |
33,739 |
73,351 |
324 |
114 |
438 |
704 |
323 |
323 |
| |
Q3 |
38,642 |
29,195 |
67,837 |
219 |
134 |
353 |
516 |
500 |
500 |
| |
Q4 |
36,440 |
30,330 |
66,770 |
189 |
196 |
385 |
854 |
368 |
368 |
| 2011 |
Q1 |
31,023 |
31,566 |
62,589 |
187 |
210 |
397 |
1,249 |
203 |
203 |
| |
Q2 |
31,731 |
29,528 |
61,259 |
239 |
199 |
438 |
682 |
399 |
399 |
| |
Q3 |
41,949 |
25,142 |
67,091 |
203 |
143 |
346 |
641 |
175 |
175 |
| |
Q4 |
42,073 |
30,307 |
72,380 |
196 |
150 |
346 |
805 |
366 |
366 |
| 2012 |
Q1 |
45,185 |
34,221 |
79,406 |
297 |
247 |
544 |
981 |
376 |
376 |
| |
Q2 |
44,954 |
30,672 |
75,626 |
350 |
253 |
603 |
1,388 |
445 |
445 |
| |
Q3 |
43,480 |
28,227 |
71,707 |
319 |
227 |
546 |
1,179 |
397 |
397 |
| |
Q4 |
42,596 |
29,177 |
71,773 |
341 |
259 |
600 |
1,925 |
458 |
458 |
| 2013 |
Q1 |
44,431 |
30,182 |
74,613 |
409 |
317 |
726 |
971 |
376 |
376 |
| |
Q2 |
45,222 |
29,932 |
75,154 |
314 |
286 |
600 |
441 |
191 |
191 |
| |
Q3 |
42,462 |
29,610 |
72,072 |
352 |
224 |
576 |
472 |
310 |
310 |
| |
Q4 |
39,840 |
33,325 |
73,165 |
436 |
269 |
705 |
519 |
259 |
259 |
| 2014 |
Q1 |
41,856 |
38,709 |
80,565 |
464 |
369 |
833 |
945 |
251 |
251 |
| |
Q2 |
5,421 |
4,556 |
9,977 |
90 |
41 |
131 |
26 |
18 |
18 |
Source: Labour Market Regulatory Authority (LMRA), Expatriate Management System (EMS)
ANNEXED NOTE
1. Technical Notes and Definitions
This table shows the flow of work permits (or visas) applications that are given to foreigners distinguished by the type permit granted by the LMRA (EMS).
The LMRA Expatriate Management System (EMS) stores information and past history of sponsors and workers, and their dependents, within the scope of Law No. 19/2006 on regulating the labour market. The scope of the system covers regular, temporary and investor work visas for foreign workers, their dependents, in the commercial sector, the government sector and the non-commercial, non-government sector. It presently excludes domestic workers, and work visas for artists and certain other categories of workers in non-civilian organizations. The system tracks visa applications, renewals, mobility of workers between employers and from one occupation to another as well as notification of termination and runaway workers, and in general all operations of LMRA including inspection and offence management. The system is updated continuously and linked with other labour-related databases of the Kingdom, including CIO, GDNPR, GOSI, PFC, CSB, Ministry of Labour (MoL), and Ministry of Industry and Commerce (MOIC).
The Expat Management System (EMS) distinguishes four types of visas for operational purposes: regular work visas for workers with 24-month validity; temporary work visas issued for workers with 6-month validity; investor work visas issued for investors investing up to BD 100,000; and dependent visas issued for dependent members of eligible foreign workers.
Work Visa is a legal certificate to allow a foreign worker to enter the country for working purposes for a period of two years with the possibility of renewal.
Regular Worker is a worker engaged to work in an enterprise for a long period of time, i.e. for more than six months and usually two years with possibility of renewal.
Investor is a person who invests up to 100,000 Bahraini dinars.
Temporary Worker is a worker engaged to work in an enterprise for a short period of time, i.e. for less than two years and usually six months.
Worker is a generic term that refers to an employed person in general, or to an employee, a self-employed, or a particular category of worker, such as full-time or part-time worker, depending on the context in which the term is used. Four major categories of workers in terms of their status in employment are employees, employers, own-account workers, and unpaid family workers.
2. Institution which provides data
Labour Market Regulatory Authority (LMRA).
3. Data availability
The LMRA publishes these data under its Bahrain Labour Market Indicators (BLMI) section. The BLMI dashboard can be found in: (http://blmi.lmra.bh/2014/03/mi_dashboard.xml). The general BLMI data with other non-LMRA sources can be found: (http://blmi.lmra.bh/2014/03/mi_data.xml)
Figures and results are often reported in tables in both PDF and Excel formats.
Data for this LMRA table found here: (http://blmi.lmra.bh/2014/03/data/ems/Table_32.pdf).
The definitions that the LMRA adopts for its data can be found in the Glossary section: (http://blmi.lmra.bh/mi_glossary.xml).
Date of access: August 2014
|
Regular Workers |
Investors |
Temporary |
| New Visas |
Renewals |
Total |
New Visas |
Renewals |
Total |
New Visas |
Renewals |
Total |
| 2008 |
Q3 |
9,014 |
5,630 |
14,644 |
31 |
5 |
36 |
455 |
3 |
3 |
| |
Q4 |
27,238 |
5,640 |
32,878 |
78 |
23 |
101 |
1,793 |
24 |
24 |
| 2009 |
Q1 |
34,458 |
8,298 |
42,756 |
93 |
55 |
148 |
2,340 |
86 |
86 |
| |
Q2 |
27,693 |
29,431 |
57,124 |
105 |
128 |
233 |
1,013 |
620 |
620 |
| |
Q3 |
24,234 |
25,948 |
50,182 |
91 |
65 |
156 |
538 |
406 |
406 |
| |
Q4 |
25,648 |
32,258 |
57,906 |
97 |
69 |
166 |
832 |
582 |
582 |
| 2010 |
Q1 |
24,992 |
39,256 |
64,248 |
139 |
86 |
225 |
1,653 |
277 |
277 |
| |
Q2 |
24,229 |
31,852 |
56,081 |
186 |
111 |
297 |
524 |
330 |
330 |
| |
Q3 |
25,208 |
27,477 |
52,685 |
139 |
115 |
254 |
445 |
476 |
476 |
| |
Q4 |
25,266 |
27,382 |
52,648 |
141 |
177 |
318 |
632 |
346 |
346 |
| 2011 |
Q1 |
22,929 |
28,220 |
51,149 |
117 |
193 |
310 |
1,300 |
214 |
214 |
| |
Q2 |
22,070 |
27,210 |
49,280 |
153 |
187 |
340 |
561 |
378 |
378 |
| |
Q3 |
29,075 |
22,966 |
52,041 |
128 |
137 |
265 |
593 |
178 |
178 |
| |
Q4 |
28,407 |
28,141 |
56,548 |
121 |
143 |
264 |
650 |
358 |
358 |
| 2012 |
Q1 |
30,517 |
32,925 |
63,442 |
172 |
238 |
410 |
863 |
377 |
377 |
| |
Q2 |
30,485 |
28,613 |
59,098 |
222 |
244 |
466 |
1,194 |
437 |
437 |
| |
Q3 |
31,083 |
26,381 |
57,464 |
236 |
213 |
449 |
956 |
395 |
395 |
| |
Q4 |
28,814 |
27,357 |
56,171 |
210 |
252 |
462 |
1,547 |
449 |
449 |
| 2013 |
Q1 |
32,200 |
28,589 |
60,789 |
264 |
302 |
566 |
1,242 |
364 |
364 |
| |
Q2 |
32,181 |
28,210 |
60,391 |
260 |
278 |
538 |
386 |
210 |
210 |
| |
Q3 |
28,841 |
27,855 |
56,696 |
214 |
218 |
432 |
420 |
310 |
310 |
| |
Q4 |
24,649 |
31,480 |
56,129 |
253 |
269 |
522 |
475 |
257 |
257 |
| 2014 |
Q1 |
27,176 |
37,012 |
64,188 |
320 |
348 |
668 |
864 |
238 |
238 |
| |
Q2 |
3,817 |
4,359 |
8,176 |
47 |
47 |
94 |
14 |
19 |
19 |
Source: Labour Market Regulatory Authority (LMRA), Expatriate Management System (EMS)
ANNEXED NOTE
1. Technical Notes and Definitions
This table shows the flow of work permits (or visas) that are given to foreigners distinguished by the type permit granted by the LMRA (EMS).
The LMRA Expatriate Management System (EMS) stores information and past history of sponsors and workers, and their dependents, within the scope of Law No. 19/2006 on regulating the labour market. The scope of the system covers regular, temporary and investor work visas for foreign workers, their dependents, in the commercial sector, the government sector and the non-commercial, non-government sector. It presently excludes domestic workers, and work visas for artists and certain other categories of workers in non-civilian organizations. The system tracks visa applications, renewals, mobility of workers between employers and from one occupation to another as well as notification of termination and runaway workers, and in general all operations of LMRA including inspection and offence management. The system is updated continuously and linked with other labour-related databases of the Kingdom, including CIO, GDNPR, GOSI, PFC, CSB, Ministry of Labour (MoL), and Ministry of Industry and Commerce (MOIC).
The Expat Management System (EMS) distinguishes four types of visas for operational purposes: regular work visas for workers with 24-month validity; temporary work visas issued for workers with 6-month validity; investor work visas issued for investors investing up to BD 100,000; and dependent visas issued for dependent members of eligible foreign workers.
Work Visa is a legal certificate to allow a foreign worker to enter the country for working purposes for a period of two years with the possibility of renewal.
Regular Worker is a worker engaged to work in an enterprise for a long period of time, i.e. for more than six months and usually two years with possibility of renewal.
Investor is a person who invests up to 100,000 Bahraini dinars.
Temporary Worker is a worker engaged to work in an enterprise for a short period of time, i.e. for less than two years and usually six months.
Worker is a generic term that refers to an employed person in general, or to an employee, a self-employed, or a particular category of worker, such as full-time or part-time worker, depending on the context in which the term is used. Four major categories of workers in terms of their status in employment are employees, employers, own-account workers, and unpaid family workers.
2. Institution which provides data
Labour Market Regulatory Authority (LMRA).
3. Data availability
The LMRA publishes these data under its Bahrain Labour Market Indicators (BLMI) section. The BLMI dashboard can be found in: (http://blmi.lmra.bh/2014/03/mi_dashboard.xml). The general BLMI data with other non-LMRA sources can be found: (http://blmi.lmra.bh/2014/03/mi_data.xml)
Figures and results are often reported in tables in both PDF and Excel formats.
Data for this LMRA table found here: (http://blmi.lmra.bh/2014/03/data/ems/Table_32.pdf)
The definitions that the LMRA adopts for its data can be found in the Glossary section: (http://blmi.lmra.bh/mi_glossary.xml)
Date of access: August 2014
|
1991 |
2001 |
| Work |
131,814 |
177,626 |
| With Family |
39,908 |
46,519 |
| Study/Training |
969 |
1,073 |
| Medical Treatment |
31 |
53 |
| Marriage |
2,686 |
3,971 |
| Tourism |
287 |
438 |
| Business Mission |
199 |
366 |
| Others |
8,838 |
14,891 |
| Total |
184,732 |
244,937 |
Source: Central Informatics Organization (CIO)
1. Technical Notes and Definitions
This table shows the non-Bahraini residences by nationality group in the censuses of 1991 and 2001.
|
|
|
|
|
|
| census year |
reference period |
implementing institution |
implementation method |
population covered |
| 1981 |
November 16 |
Ministry of Finance
Statistics Department |
field interviews |
de jure, de facto |
all individuals (nationals and non-nationals): 1- present within the country’s borders during time of reference; 2- residing in Bahrain irrespective of where are they at census times |
| 1991 |
April 6 |
Central Informatics Organisation (CIO) |
field interviews |
| 2001 |
April 7 |
field interviews; characteristics of population in collective households (among which labour camps) was obtained from sponsors |
| 2010 |
April 27 |
based on administrative records |
Nationality of the person is defined by the passport used to enter the country. A Non-Bahrainis is considered as such depending on the passport used to enter the country (or obtain the visa).
2. Institution which provides data
Central Informatics Organization, known prior to 2001 as the “Central Statistics Organisation” under the Ministry of Cabinet Affairs.
3. Data availability
Figures and results reported here are available on the Central Informatics Organisation (CIO) website: (http://www.cio.gov.bh)
CIO figures and results are often reported in tables in both PDF and Excel formats.
The 1991 data for this table can be found: (http://www.cio.gov.bh/cio_ara/English/Publications/Statistical%20Abstract/ABS2008/Ch2/31A.pdf).
The 2001 data for this table can be found: (http://www.cio.gov.bh/cio_ara/English/Publications/Statistical%20Abstract/ABS2008/Ch2/31B.pdf).
They can also be found in the Statistical Abstracts of 2000, 2001 and 2002 under the Population section.
Date of access: August 2014
|
1991 |
2001 |
| GCC |
4,728 |
6,823 |
| Other Arabs |
17,877 |
20,050 |
| Asian |
154,090 |
205,626 |
| African |
345 |
2,924 |
| European |
5,992 |
5,788 |
| North American |
1,303 |
3,195 |
| South American |
93 |
70 |
| Oceanian |
304 |
461 |
| Total |
184,732 |
244,937 |
Source: Central Informatics Organization (CIO)
ANNEXED NOTE
1. Technical Notes and Definitions
This table shows the non-Bahraini residences by nationality group in the censuses of 1991 and 2001.
| census year |
reference period |
implementing institution |
implementation method |
population covered |
| 1981 |
November 16 |
Ministry of Finance
Statistics Department |
field interviews |
de jure, de facto |
all individuals (nationals and non-nationals): 1- present within the country’s borders during time of reference; 2- residing in Bahrain irrespective of where are they at census times |
| 1991 |
April 6 |
Central Informatics Organisation (CIO) |
field interviews |
| 2001 |
April 7 |
field interviews; characteristics of population in collective households (among which labour camps) was obtained from sponsors |
| 2010 |
April 27 |
based on administrative records |
Nationality of the person is defined by the passport used to enter the country. A Non-Bahrainis is considered as such depending on the passport used to enter the country (or obtain the visa).
2. Institution which provides data
Central Informatics Organization, known prior to 2001 as the “Central Statistics Organisation” under the Ministry of Cabinet Affairs.
3. Data availability
Figures and results reported here are available on the Central Informatics Organisation (CIO) website: (http://www.cio.gov.bh)
CIO figures and results are often reported in tables in both PDF and Excel formats.
The 1991 data for this table can be found: (http://www.cio.gov.bh/cio_ara/English/Publications/Statistical%20Abstract/ABS2008/Ch2/31A.pdf).
The 2001 data for this table can be found: (http://www.cio.gov.bh/cio_ara/English/Publications/Statistical%20Abstract/ABS2008/Ch2/31B.pdf).
They can also be found in the Statistical Abstracts of 2000, 2001 and 2002 under the Population section.
Date of access: August 2014
|
Arrivals |
Departures |
| 1999 |
4,462,637 |
4,446,142 |
| 2000 |
5,047,716 |
5,030,711 |
| 2001 |
5,650,764 |
5,636,227 |
| 2002 |
6,182,997 |
6,144,185 |
| 2003 |
6,304,472 |
6,258,149 |
| 2004 |
7,303,912 |
7,260,767 |
| 2005 |
8,683,169 |
8,351,230 |
| 2006 |
9,250,530 |
9,179,951 |
| 2007 |
9,284,512 |
9,247,697 |
| 2008 |
7,894,573 |
9,135,587 |
| 2009 |
8,465,712 |
8,954,471 |
| 2010 |
8,754,697 |
8,451,357 |
| 2011 |
9,021,735 |
9,13,66 |
| 2012 |
10,861,805 |
10,755,837 |
| 2013 |
12,145,400 |
12,010,623 |
Source: Central Informatics Organization (CIO), taken from the Ministry of Interior (Immigration Directorate)
ANNEXED NOTE
1. Technical Notes and Definitions
This table shows the flow of arrivals and departures (all nationalities).
Arrivals and departures are captured and often distinguished by air, sea ports and the King Fahad causeway (land).
2. Institution which provides data
Ministry of Interior (Immigration Directorate).
Central Informatics Organization, known prior to 2001 as the “Central Statistics Organisation” under the Ministry of Cabinet Affairs.
3. Data availability
Figures and results reported here are available on the Central Informatics Organisation (CIO) website: (http://www.cio.gov.bh)
Figures and results are often reported in tables in both PDF and Excel formats.
Data for this table can be found: (http://www.cio.gov.bh/cio_ara/English/Publications/Statistical%20Abstract/ABS2013/15-Transport/10.pdf)
Some of the information can also be found in the Statistical Abstracts, Transport & Communication sections.
Date of access: August 2014
|
Population by country of citizenship |
| Oman |
1,957,336 |
| U. A. E. |
6,426 |
| Bahrain |
388 |
| Saudi Arabia |
725 |
| Qatar |
168 |
| Kuwait |
290 |
| GCC countries |
7,997 |
| Egypt |
29,877 |
| Sudan |
6,867 |
| Jordan |
7,403 |
| Iraq |
4,159 |
| Other Arab countries |
12,683 |
| Non-GCC Arab countries |
60,989 |
| India |
465,660 |
| Bangladesh |
107,125 |
| Pakistan |
84,658 |
| Indonesia |
25,300 |
| Sri Lanka |
10,178 |
| Philippines |
15,651 |
| Other Asian countries |
12,939 |
| Asian countries |
721,511 |
| Britain |
4,054 |
| Other European countries |
4,487 |
| U.S. |
1,540 |
| Other countries |
15,565 |
| Rest of the world |
25,646 |
| Total |
816,143 |
Source: Ministry of National Economy
ANNEXED NOTE
1. Technical Notes and Definitions
The table refers to the population recorded during census 2010.
The Ministry of National Economy of Oman has conducted three censuses in 1993, 2003 and 2010.
“The date of reference for census 2010 is December 12, 2010. Period of implemention: December 12 to 21, 2010. The Sultanate uses the de jure and the de facto approach in the enumeration.
For information on technical means used in Oman’s censuses, please see:
http://unstats.un.org/unsd/demographic/meetings/Conferences/Korea/2012/docs/s07-5-1-Oman.pdf
2. Institution which provides data
National Center for Statistics and Information (NCSI)
3. Data availability
The National Center for Statistics and Information (NCSI) processes and disseminates all statistical data of use to the public and to government action.
1993′ and 2003’s census results are not available online. However, they are quoted in recent publications released by NCSI (Annual Statistical Yearbooks, survey results, studies).
2010’s census results are available on NCSI’s website, in several thematic publications, in the “publications” section
http://www.ncsi.gov.om/NCSI_website/N_publications_ar.aspx
http://www.ncsi.gov.om/NCSI_website/N_publications.aspx
Some results are also available in the Ministry of National Economy’s database dedicated to 2010′ census:
http://85.154.248.117/MONE2010/#
The present results have been retrieved from MONE database.
Last date of access: October 2014.
| |
Departures |
| 2000 |
2001 |
2002 |
2003 |
2004 |
2005 |
2006 |
2007 |
2008 |
2009 |
2010 |
2011 |
2012 |
| Bahraini |
1,179,564 |
1,253,711 |
1,345,107 |
1,455,216 |
1,633,583 |
1,813,154 |
1,978,130 |
2,073,600 |
2,458,672 |
2,433,051 |
2,021,346 |
245,716 |
2,846,454 |
| GCC |
2,915,977 |
3,271,494 |
3,405,925 |
3,295,928 |
3,804,084 |
4,475,103 |
4,737,356 |
4,569,270 |
5,307,910 |
5,214,968 |
4,307,641 |
325,782 |
4,687,741 |
| Kuwaiti |
169,701 |
189,428 |
217,947 |
181,019 |
212,941 |
258,033 |
295,132 |
291,485 |
392,000 |
415,575 |
284,866 |
23,712 |
280,610 |
| Omani |
20,638 |
23,773 |
25,676 |
25,441 |
29,022 |
33,829 |
38,200 |
43,380 |
50,554 |
49,433 |
37,642 |
3,588 |
46,925 |
| Qatari |
83,034 |
88,401 |
89,633 |
86,495 |
102,086 |
137,137 |
151,361 |
158,888 |
160,126 |
150,568 |
113,777 |
7,973 |
115,416 |
| Saudi Arabian |
2,610,019 |
2,933,622 |
3,034,558 |
2,965,808 |
3,418,357 |
4,000,571 |
4,201,913 |
4,018,250 |
4,618,986 |
4,516,259 |
3,815,115 |
285,954 |
4,198,109 |
| Emirate |
32,585 |
36,270 |
38,111 |
37,165 |
41,678 |
45,533 |
50,750 |
57,267 |
86,244 |
83,133 |
56,241 |
4,555 |
46,681 |
| Other Arab |
154,195 |
209,788 |
262,372 |
296,231 |
377,037 |
426,061 |
490,417 |
511,384 |
639,251 |
693,444 |
511,321 |
43,912 |
688,367 |
| Egyptian |
32,520 |
41,625 |
52,772 |
59,967 |
78,721 |
91,700 |
104,533 |
105,463 |
126,184 |
138,977 |
109,603 |
11,456 |
158,419 |
| Iraqi |
1,393 |
2,198 |
3,288 |
3,459 |
6,020 |
10,201 |
10,209 |
10,967 |
13,625 |
15,487 |
12,210 |
581 |
7,889 |
| Jordanian |
33,620 |
48,104 |
66,592 |
73,762 |
89,884 |
100,190 |
112,273 |
115,040 |
135,350 |
140,870 |
106,770 |
12,083 |
158,709 |
| Lebanese |
25,198 |
34,536 |
46,587 |
52,238 |
68,248 |
73,055 |
86,838 |
89,342 |
111,411 |
110,917 |
81,015 |
7,200 |
78,404 |
| Palestinian |
8,972 |
13,866 |
14,221 |
8,871 |
13,620 |
15,051 |
19,252 |
21,049 |
37,137 |
41,032 |
32,192 |
3,156 |
44,738 |
| Sudanese |
12,008 |
14,109 |
15,228 |
20,509 |
25,423 |
29,281 |
34,478 |
36,531 |
48,186 |
57,923 |
37,711 |
2,923 |
40,773 |
| Syrian |
16,674 |
21,555 |
27,271 |
34,660 |
42,341 |
47,122 |
56,233 |
62,058 |
80,497 |
90,483 |
65,364 |
6,513 |
93,188 |
| Other Arabs |
23,810 |
33,795 |
36,413 |
42,765 |
52,780 |
59,461 |
66,601 |
70,934 |
86,861 |
97,755 |
66,456 |
0 |
106,247 |
| Asia |
432,677 |
507,532 |
673,973 |
730,768 |
866,985 |
1,163,685 |
1,249,996 |
1,328,194 |
1,653,583 |
1,973,151 |
1,298,131 |
130,981 |
1,699,062 |
| Bangladeshi |
30,088 |
28,369 |
43,231 |
36,929 |
41,900 |
48,832 |
67,717 |
83,746 |
85,415 |
74,403 |
59,982 |
5,490 |
66,681 |
| Ceylonese |
17,361 |
18,267 |
22,036 |
22,668 |
23,695 |
24,662 |
26,393 |
25,309 |
28,934 |
30,327 |
25,348 |
3,108 |
34,395 |
| Indian |
213,484 |
240,521 |
299,863 |
335,277 |
402,274 |
473,637 |
571,547 |
647,733 |
854,814 |
940,772 |
694,074 |
76,787 |
955,232 |
| Iranian |
2,541 |
3,286 |
10,403 |
16,328 |
20,085 |
22,628 |
27,326 |
8,155 |
9,009 |
8,726 |
6,055 |
169 |
2,791 |
| Japanese |
11,502 |
10,725 |
13,469 |
12,411 |
12,748 |
14,812 |
17,016 |
16,482 |
18,761 |
18,094 |
14,210 |
2,057 |
21,530 |
| Korean ( North ) |
3,586 |
3,640 |
4,101 |
4,223 |
5,419 |
5,839 |
8,706 |
12,753 |
20,271 |
27,372 |
22,481 |
2,247 |
33,731 |
| Korean ( South ) |
8 |
24 |
69 |
122 |
221 |
102 |
44 |
30 |
33 |
43 |
25 |
1 |
41 |
| Malaysian |
1,322 |
2,379 |
4,221 |
4,567 |
8,090 |
9,426 |
12,474 |
17,236 |
26,395 |
23,687 |
14,769 |
1,785 |
12,874 |
| Nepalese |
11,332 |
19,870 |
30,470 |
20,775 |
12,344 |
17,951 |
43,264 |
52,311 |
62,872 |
79,365 |
46,075 |
3,842 |
49,105 |
| Pakistani |
56,877 |
71,320 |
96,227 |
105,373 |
123,459 |
143,775 |
169,382 |
178,548 |
214,333 |
225,890 |
167,010 |
18,092 |
242,572 |
| Philippines |
49,224 |
66,781 |
100,719 |
108,366 |
131,744 |
145,805 |
192,393 |
203,742 |
230,357 |
231,970 |
153,730 |
16,452 |
191,099 |
| Singaporean |
1,458 |
1,445 |
1,429 |
1,425 |
2,899 |
3,070 |
3,798 |
3,833 |
4,517 |
5,041 |
3,971 |
368 |
3,664 |
| Thai |
2,323 |
3,396 |
4,991 |
12,173 |
17,930 |
23,687 |
28,020 |
11,761 |
13,682 |
16,126 |
8,659 |
583 |
8,679 |
| Other Asians |
31,571 |
37,509 |
42,744 |
50,131 |
64,177 |
229,459 |
81,916 |
66,555 |
84,190 |
291,335 |
81,742 |
0 |
76,668 |
| African |
11,180 |
14,693 |
18,889 |
24,279 |
32,207 |
1,597,035 |
39,855 |
39,194 |
48,744 |
53,586 |
37,338 |
2,003 |
45,106 |
| America |
119,015 |
137,922 |
172,933 |
183,290 |
194,705 |
195,539 |
229,071 |
240,111 |
285,710 |
296,218 |
243,538 |
6,142 |
320,984 |
| American |
95,262 |
108,338 |
135,305 |
140,911 |
143,672 |
140,795 |
163,419 |
166,610 |
192,089 |
196,822 |
164,763 |
0 |
234,175 |
| Canadian |
21,502 |
26,315 |
33,327 |
37,089 |
44,965 |
46,963 |
53,970 |
56,322 |
67,648 |
70,631 |
57,012 |
6,142 |
66,317 |
| Other American |
2,251 |
3,269 |
4,301 |
5,290 |
6,068 |
7,781 |
11,682 |
17,179 |
25,973 |
28,765 |
21,763 |
0 |
20,492 |
| Europe |
200,471 |
218,799 |
241,487 |
246,471 |
315,824 |
358,044 |
408,702 |
445,969 |
542,585 |
561,085 |
464,234 |
41,427 |
512,021 |
| Austrian |
1,472 |
1,355 |
1,507 |
1,942 |
3,312 |
3,360 |
4,378 |
6,460 |
6,727 |
7,335 |
6,938 |
554 |
6,069 |
| British |
132,501 |
144,676 |
156,765 |
159,222 |
189,954 |
220,015 |
243,987 |
239,973 |
274,154 |
278,286 |
222,375 |
23,517 |
262,412 |
| Dutch (Netherlands) |
7,594 |
7,431 |
8,384 |
9,106 |
13,177 |
13,931 |
17,205 |
17,537 |
19,132 |
20,005 |
15,507 |
1,403 |
19,659 |
| Finn (Finland) |
624 |
481 |
709 |
773 |
878 |
1,065 |
995 |
1,685 |
1,982 |
2,307 |
1,776 |
211 |
2,293 |
| French |
10,832 |
12,050 |
16,271 |
16,920 |
21,107 |
22,966 |
27,418 |
35,134 |
50,830 |
44,972 |
39,079 |
3,315 |
36,672 |
| German |
11,330 |
12,218 |
13,391 |
14,152 |
24,703 |
27,947 |
34,558 |
50,695 |
68,763 |
76,853 |
66,750 |
8,167 |
65,384 |
| Irish |
9,300 |
10,393 |
10,701 |
10,651 |
13,280 |
13,965 |
15,846 |
15,320 |
16,862 |
18,956 |
14,207 |
1,669 |
19,644 |
| Italian |
5,911 |
7,211 |
7,911 |
7,860 |
10,793 |
12,064 |
13,987 |
23,538 |
31,202 |
35,339 |
30,658 |
1,957 |
24,138 |
| Sweden |
2,176 |
2,390 |
2,703 |
3,217 |
3,929 |
3,855 |
4,230 |
4,301 |
5,157 |
5,326 |
4,022 |
302 |
3,866 |
| Swiss |
1,639 |
1,494 |
1,942 |
2,035 |
2,951 |
3,156 |
4,647 |
4,751 |
5,782 |
5,837 |
4,535 |
332 |
4,035 |
| Other Europeans |
17,092 |
19,100 |
21,203 |
20,593 |
31,740 |
35,720 |
41,451 |
46,575 |
61,994 |
65,869 |
58,387 |
0 |
67,849 |
| Oceania |
17,571 |
21,088 |
23,374 |
25,861 |
35,762 |
42,978 |
46,307 |
39,875 |
44,596 |
43,702 |
33,419 |
3,270 |
36,292 |
| Australian |
14,077 |
16,733 |
17,931 |
19,847 |
28,208 |
35,567 |
38,149 |
32,617 |
35,760 |
34,315 |
25,506 |
2,528 |
28,448 |
| New Zealander |
3,494 |
4,355 |
5,443 |
6,014 |
7,554 |
7,411 |
8,158 |
7,258 |
8,836 |
9,387 |
7,913 |
742 |
7,844 |
| Other Nationalities |
61 |
200 |
125 |
105 |
580 |
59,413 |
108 |
82 |
151 |
274 |
419 |
0 |
494 |
| Total |
5,030,711 |
5,635,227 |
6,144,185 |
6,258,149 |
7,260,767 |
10,131,012 |
9,179,942 |
9,247,679 |
10,981,202 |
11,269,479 |
8,917,387 |
799,233 |
10,836,521 |
Source: Central Informatics Organization (CIO), taken from the Ministry of Interior (Immigration Directorate)
ANNEXED NOTE
1. Technical Notes and Definitions
This table shows the flow of departures by nationality.
Departures are captured and often distinguished by air, sea ports and the King Fahad causeway (land).
Nationality of the person is defined by the passport used to enter the country. A Non-Bahrainis is considered as such depending on the passport used to enter the country (or obtain the visa).
2. Institution which provides data
Ministry of Interior (Immigration Directorate)
Central Informatics Organization, known prior to 2001 as the “Central Statistics Organisation” under the Ministry of Cabinet Affairs.
3. Data availability
Figures and results reported here are available on the Central Informatics Organisation (CIO) website: (http://www.cio.gov.bh)
Figures and results are often reported in tables in both PDF and Excel formats.
Data for 2000 can be found: (http://www.cio.gov.bh/cio_ara/English/Publications/Statistical%20Abstract/2000/2000-CH15%20Transport%20and%20Communications.pdf)
Data for 2001 can be found: (http://www.cio.gov.bh/cio_ara/English/Publications/Statistical%20Abstract/2001/2001-CH15%20Transport%20and%20Communications.pdf)
Data for 2002 can be found: (http://www.cio.gov.bh/cio_ara/English/Publications/Statistical%20Abstract/2002/Ch15%20%202002.pdf)
Data for 2003 can be found: (http://www.cio.gov.bh/cio_ara/English/Publications/Statistical%20Abstract/2003/Ch15%20%202003.pdf)
Data for 2004 can be found: (http://www.cio.gov.bh/cio_ara/English/Publications/Statistical%20Abstract/2004/CH15.pdf)
Data for 2005 can be found: (http://www.cio.gov.bh/cio_ara/English/Publications/Statistical%20Abstract/2005/2005-CH15%20Transport%20and%20Communications.pdf)
Data for 2006 can be found: (http://www.cio.gov.bh/cio_ara/English/Publications/Statistical%20Abstract/2006/PDF/2006-CH15%20Transport%20and%20Communications.pdf)
Data for 2007 can be found: (http://www.cio.gov.bh/cio_ara/English/Publications/Statistical%20Abstract/ABS2007/2007-CH15TransportCommunications.pdf)
Data for 2008 can be found: (http://www.cio.gov.bh/cio_ara/English/Publications/Statistical%20Abstract/ABS2008/Ch15/13.pdf)
Data for 2009 can be found: (http://www.cio.gov.bh/cio_ara/English/Publications/Statistical%20Abstract/ABS2009/Ch15/13.pdf)
Data for 2010 can be found: (http://www.cio.gov.bh/cio_ara/English/Publications/Statistical%20Abstract/ABS2010/Ch15/13.pdf)
Data for 2011 can be found: (http://www.cio.gov.bh/cio_ara/English/Publications/Statistical%20Abstract/ABS2011/15-Transport/12.pdf)
Data for 2012 can be found: (http://www.cio.gov.bh/cio_ara/English/Publications/Statistical%20Abstract/ABS2012/15-Transport/11.pdf)
This information (2000-2011) can also be found in the Statistical Abstracts, Transport & Communication sections.
Date of access: August 2014
|
|
Sector / Number of Employees |
|
|
Commercial |
Government |
Non Commercial Non Government |
|
|
0 -5 |
6 – 9 |
10 – 19 |
20 – 99 |
100 – 499 |
500+ |
Total |
0 -5 |
6 – 9 |
10 – 19 |
20 – 99 |
100 – 499 |
500+ |
Total |
0 -5 |
6 – 9 |
10 – 19 |
20 – 99 |
100 – 499 |
Total |
| 2009 |
Q1 |
38 |
13 |
58 |
495 |
396 |
755 |
1,755 |
0 |
0 |
0 |
0 |
0 |
0 |
0 |
0 |
0 |
0 |
0 |
0 |
0 |
| Q2 |
16 |
31 |
36 |
120 |
182 |
271 |
656 |
0 |
0 |
0 |
0 |
0 |
0 |
0 |
0 |
0 |
1 |
0 |
0 |
1 |
| Q3 |
5 |
9 |
20 |
135 |
291 |
356 |
816 |
0 |
0 |
0 |
0 |
0 |
0 |
0 |
0 |
0 |
0 |
0 |
0 |
0 |
| Q4 |
6 |
3 |
45 |
165 |
230 |
494 |
943 |
0 |
0 |
0 |
0 |
0 |
0 |
0 |
0 |
0 |
0 |
0 |
0 |
0 |
| 2010 |
Q1 |
9 |
4 |
102 |
163 |
434 |
304 |
1,016 |
0 |
0 |
0 |
0 |
0 |
0 |
0 |
0 |
0 |
0 |
0 |
0 |
0 |
| Q2 |
1 |
8 |
26 |
76 |
107 |
331 |
549 |
0 |
0 |
0 |
0 |
0 |
0 |
0 |
0 |
0 |
0 |
0 |
0 |
0 |
| Q3 |
22 |
17 |
15 |
148 |
125 |
93 |
420 |
0 |
0 |
0 |
0 |
0 |
0 |
0 |
0 |
0 |
0 |
0 |
0 |
0 |
| Q4 |
8 |
10 |
14 |
168 |
37 |
140 |
377 |
0 |
0 |
0 |
0 |
0 |
0 |
0 |
0 |
0 |
0 |
0 |
0 |
0 |
| 2011 |
Q1 |
19 |
3 |
17 |
136 |
143 |
398 |
716 |
0 |
0 |
0 |
0 |
0 |
0 |
0 |
0 |
0 |
0 |
0 |
0 |
0 |
| Q2 |
9 |
11 |
21 |
74 |
235 |
347 |
697 |
0 |
0 |
0 |
1 |
0 |
0 |
1 |
0 |
0 |
0 |
0 |
0 |
0 |
| Q3 |
14 |
4 |
13 |
34 |
126 |
120 |
311 |
0 |
0 |
0 |
0 |
0 |
0 |
0 |
0 |
0 |
0 |
0 |
0 |
0 |
| Q4 |
5 |
0 |
5 |
55 |
128 |
117 |
310 |
0 |
0 |
0 |
1 |
0 |
0 |
1 |
0 |
0 |
0 |
0 |
0 |
0 |
| 2012 |
Q1 |
1 |
7 |
12 |
36 |
46 |
124 |
226 |
0 |
0 |
0 |
0 |
0 |
0 |
0 |
0 |
0 |
0 |
0 |
0 |
0 |
| Q2 |
2 |
7 |
7 |
78 |
46 |
188 |
328 |
0 |
0 |
0 |
0 |
0 |
0 |
0 |
0 |
0 |
0 |
0 |
0 |
0 |
| Q3 |
2 |
4 |
18 |
184 |
117 |
257 |
582 |
0 |
0 |
0 |
0 |
0 |
0 |
0 |
0 |
0 |
0 |
0 |
0 |
0 |
| Q4 |
7 |
35 |
23 |
372 |
472 |
601 |
1,510 |
0 |
0 |
0 |
0 |
0 |
0 |
0 |
0 |
0 |
0 |
0 |
0 |
0 |
| 2013 |
Q1 |
27 |
1 |
33 |
266 |
341 |
789 |
1,457 |
0 |
0 |
0 |
0 |
0 |
0 |
0 |
0 |
0 |
0 |
0 |
0 |
0 |
| Q2 |
6 |
4 |
27 |
176 |
255 |
245 |
713 |
0 |
0 |
0 |
0 |
0 |
0 |
0 |
0 |
0 |
0 |
0 |
0 |
0 |
| Q3 |
9 |
12 |
23 |
65 |
128 |
238 |
475 |
0 |
0 |
0 |
0 |
0 |
0 |
0 |
0 |
0 |
0 |
0 |
0 |
0 |
| Q4 |
2 |
6 |
14 |
72 |
172 |
178 |
444 |
0 |
0 |
0 |
0 |
0 |
0 |
0 |
0 |
0 |
0 |
0 |
0 |
0 |
| 2014 |
Q1 |
11 |
1 |
7 |
68 |
118 |
206 |
411 |
0 |
0 |
0 |
0 |
0 |
0 |
0 |
0 |
0 |
0 |
0 |
0 |
0 |
| Q2 |
192 |
0 |
21 |
134 |
391 |
163 |
901 |
0 |
0 |
0 |
0 |
0 |
0 |
0 |
0 |
0 |
0 |
0 |
0 |
0 |
Source: Labour Market Regulatory Authority (LMRA), Expatriate Management System (EMS)
ANNEXED NOTE
1. Technical Notes and Definitions
This table shows the flow of renewed permits (or visas) that are given to foreigners by the LMRA. These renwed visas combine those given for regular and temporary workers, investors and dependents.
The LMRA Expatriate Management System (EMS) stores information and past history of sponsors and workers, and their dependents, within the scope of Law No. 19/2006 on regulating the labour market. The scope of the system covers regular, temporary and investor work visas for foreign workers, their dependents, in the commercial sector, the government sector and the non-commercial, non-government sector. It presently excludes domestic workers, and work visas for artists and certain other categories of workers in non-civilian organizations. It distinguishes four types of visas for operational purposes: regular work visas for workers with 24-month validity; temporary work visas issued for workers with 6-month validity; investor work visas issued for investors investing up to BD 100,000; and dependent visas issued for dependent members of eligible foreign workers.The system tracks visa applications, renewals, mobility of workers between employers and from one occupation to another as well as notification of termination and runaway workers, and in general all operations of LMRA including inspection and offence management. The system is updated continuously and linked with other labour-related databases of the Kingdom, including CIO, GDNPR, GOSI, PFC, CSB, Ministry of Labour (MoL), and Ministry of Industry and Commerce (MOIC).
Termination refers to an employer’s application to the LMRA announcing the end of employment of a foraign worker in theeconomic unit (CR/Branch)
Temporary Worker is a worker engaged to work in an enterprise for a short period of time, i.e. for less than two years and usually six months.
Work Visa is a legal certificate to allow a foreign worker to enter the country for working purposes for a period of two years with the possibility of renewal.
Worker is a generic term that refers to an employed person in general, or to an employee, a self-employed, or a particular category of worker, such as full-time or part-time worker, depending on the context in which the term is used. Four major categories of workers in terms of their status in employment are employees, employers, own-account workers, and unpaid family workers.
Size of establishment is the number of persons engaged in an establishment at a given period, including, in principle, all employees and unpaid family workers as well as any working proprietor. In practice, it refers to the total number of employees registered by anemployer at the responsible administrative agency.
2. Institution which provides data
Labour Market Regulatory Authority (LMRA).
3. Data availability
The LMRA publishes these data under its Bahrain Labour Market Indicators (BLMI) section. The BLMI dashboard can be found in: (http://blmi.lmra.bh/2014/03/mi_dashboard.xml). The general BLMI data with other non-LMRA sources can be found: (http://blmi.lmra.bh/2014/03/mi_data.xml)
Figures and results are often reported in tables in both PDF and Excel formats.
Data for this LMRA table for 2009 can be found here: (http://blmi.lmra.bh/2009/03/data/ems/Table_37b.pdf), (http://blmi.lmra.bh/2009/06/data/ems/Table_37b.pdf) and (http://blmi.lmra.bh/2009/09/data/ems/Table_37b.pdf) and (http://blmi.lmra.bh/2009/12/data/ems/Table_37b.pdf).
Data for 2010 can be found here: (http://blmi.lmra.bh/2010/03/data/ems/Table_37b.pdf), (http://blmi.lmra.bh/2010/06/data/ems/Table_37b.pdf), (http://blmi.lmra.bh/2010/09/data/ems/Table_37b.pdf) and (http://blmi.lmra.bh/2010/12/data/ems/Table_37b.pdf)
Data for 2011 can be found here: (http://blmi.lmra.bh/2011/03/data/ems/Table_37b.pdf), (http://blmi.lmra.bh/2011/06/data/ems/Table_37b.pdf), (http://blmi.lmra.bh/2011/09/data/ems/Table_37b.pdf) and (http://blmi.lmra.bh/2011/12/data/ems/Table_37b.pdf)
Data for 2012 can be found here: (http://blmi.lmra.bh/2012/03/data/ems/Table_37b.pdf), (http://blmi.lmra.bh/2012/06/data/ems/Table_37b.pdf), (http://blmi.lmra.bh/2012/09/data/ems/Table_37b.pdf) and (http://blmi.lmra.bh/2012/12/data/ems/Table_37b.pdf).
Data for 2013 can be found here: (http://blmi.lmra.bh/2013/03/data/ems/Table_37b.pdf), (http://blmi.lmra.bh/2013/06/data/ems/Table_37b.pdf), (http://blmi.lmra.bh/2013/09/data/ems/Table_37b.pdf) and (http://blmi.lmra.bh/2013/12/data/ems/Table_37b.pdf).
Data for 2014 can be found here: (http://blmi.lmra.bh/2014/03/data/ems/Table_37b.pdf) and (http://blmi.lmra.bh/2014/06/data/ems/Table_37b.pdf).
The definitions that the LMRA adopts for its data can be found in the Glossary section: (http://blmi.lmra.bh/mi_glossary.xml).
Date of access: September 2014
|
|
Sector / Number of Employees |
|
|
Commercial |
Government |
Non Commercial Non Government |
|
|
0 -5 |
6 – 9 |
10 – 19 |
20 – 99 |
100 – 499 |
500+ |
Total |
0 -5 |
6 – 9 |
10 – 19 |
20 – 99 |
100 – 499 |
500+ |
Total |
0 -5 |
6 – 9 |
10 – 19 |
20 – 99 |
100 – 499 |
Total |
| 2009 |
Q1 |
6 |
1 |
3 |
0 |
0 |
0 |
10 |
0 |
0 |
0 |
0 |
0 |
0 |
0 |
0 |
0 |
0 |
0 |
0 |
0 |
| Q2 |
2 |
0 |
0 |
2 |
0 |
0 |
4 |
0 |
0 |
0 |
0 |
0 |
0 |
0 |
0 |
0 |
0 |
0 |
0 |
0 |
| Q3 |
4 |
0 |
0 |
1 |
1 |
0 |
6 |
0 |
0 |
0 |
0 |
0 |
0 |
0 |
0 |
0 |
0 |
0 |
0 |
0 |
| Q4 |
6 |
0 |
0 |
2 |
1 |
0 |
9 |
0 |
0 |
0 |
0 |
0 |
0 |
0 |
0 |
0 |
0 |
0 |
0 |
0 |
| 2010 |
Q1 |
6 |
1 |
2 |
3 |
0 |
0 |
12 |
0 |
0 |
0 |
0 |
0 |
0 |
0 |
0 |
0 |
0 |
0 |
0 |
0 |
| Q2 |
2 |
4 |
0 |
0 |
0 |
0 |
6 |
0 |
0 |
0 |
0 |
0 |
0 |
0 |
0 |
0 |
0 |
0 |
0 |
0 |
| Q3 |
8 |
0 |
0 |
0 |
0 |
0 |
8 |
0 |
0 |
0 |
0 |
0 |
0 |
0 |
0 |
0 |
0 |
0 |
0 |
0 |
| Q4 |
11 |
1 |
0 |
0 |
1 |
0 |
13 |
0 |
0 |
0 |
0 |
0 |
0 |
0 |
0 |
0 |
0 |
0 |
0 |
0 |
| 2011 |
Q1 |
6 |
0 |
1 |
0 |
0 |
0 |
7 |
0 |
0 |
0 |
0 |
0 |
0 |
0 |
0 |
0 |
0 |
0 |
0 |
0 |
| Q2 |
13 |
1 |
0 |
0 |
0 |
0 |
14 |
0 |
0 |
0 |
0 |
0 |
0 |
0 |
0 |
0 |
0 |
0 |
0 |
0 |
| Q3 |
8 |
0 |
1 |
0 |
0 |
0 |
9 |
0 |
0 |
0 |
0 |
0 |
0 |
0 |
0 |
0 |
0 |
0 |
0 |
0 |
| Q4 |
11 |
1 |
1 |
0 |
0 |
0 |
13 |
0 |
0 |
0 |
0 |
0 |
0 |
0 |
0 |
0 |
0 |
0 |
0 |
0 |
| 2012 |
Q1 |
9 |
0 |
1 |
0 |
0 |
0 |
10 |
0 |
0 |
0 |
0 |
0 |
0 |
0 |
0 |
0 |
0 |
0 |
0 |
0 |
| Q2 |
13 |
0 |
0 |
0 |
1 |
0 |
14 |
0 |
0 |
0 |
0 |
0 |
0 |
0 |
0 |
0 |
0 |
0 |
0 |
0 |
| Q3 |
18 |
1 |
2 |
0 |
0 |
0 |
21 |
0 |
0 |
0 |
0 |
0 |
0 |
0 |
0 |
0 |
0 |
0 |
0 |
0 |
| Q4 |
20 |
2 |
1 |
0 |
1 |
0 |
24 |
0 |
0 |
0 |
0 |
0 |
0 |
0 |
0 |
0 |
0 |
0 |
0 |
0 |
| 2013 |
Q1 |
20 |
1 |
4 |
1 |
0 |
0 |
26 |
0 |
0 |
0 |
0 |
0 |
0 |
0 |
0 |
0 |
0 |
0 |
0 |
0 |
| Q2 |
26 |
2 |
2 |
0 |
1 |
0 |
31 |
0 |
0 |
0 |
0 |
0 |
0 |
0 |
0 |
0 |
0 |
0 |
0 |
0 |
| Q3 |
23 |
1 |
0 |
0 |
0 |
0 |
24 |
0 |
0 |
0 |
0 |
0 |
0 |
0 |
0 |
0 |
0 |
0 |
0 |
0 |
| Q4 |
31 |
0 |
0 |
0 |
1 |
0 |
32 |
0 |
0 |
0 |
0 |
0 |
0 |
0 |
0 |
0 |
0 |
0 |
0 |
0 |
| 2014 |
Q1 |
23 |
2 |
2 |
2 |
1 |
0 |
30 |
0 |
0 |
0 |
0 |
0 |
0 |
0 |
0 |
0 |
0 |
0 |
0 |
0 |
| Q2 |
43 |
0 |
1 |
0 |
0 |
0 |
44 |
0 |
0 |
0 |
0 |
0 |
0 |
0 |
0 |
0 |
0 |
0 |
0 |
0 |
Source: Labour Market Regulatory Authority (LMRA), Expatriate Management System (EMS)
ANNEXED NOTE
1. Technical Notes and Definitions
This table shows the flow of renewed permits (or visas) that are given to foreigners by the LMRA. These renwed visas combine those given for regular and temporary workers, investors and dependents.
The LMRA Expatriate Management System (EMS) stores information and past history of sponsors and workers, and their dependents, within the scope of Law No. 19/2006 on regulating the labour market. The scope of the system covers regular, temporary and investor work visas for foreign workers, their dependents, in the commercial sector, the government sector and the non-commercial, non-government sector. It presently excludes domestic workers, and work visas for artists and certain other categories of workers in non-civilian organizations. It distinguishes four types of visas for operational purposes: regular work visas for workers with 24-month validity; temporary work visas issued for workers with 6-month validity; investor work visas issued for investors investing up to BD 100,000; and dependent visas issued for dependent members of eligible foreign workers.The system tracks visa applications, renewals, mobility of workers between employers and from one occupation to another as well as notification of termination and runaway workers, and in general all operations of LMRA including inspection and offence management. The system is updated continuously and linked with other labour-related databases of the Kingdom, including CIO, GDNPR, GOSI, PFC, CSB, Ministry of Labour (MoL), and Ministry of Industry and Commerce (MOIC).
Termination refers to an employer’s application to the LMRA announcing the end of employment of a foraign worker in theeconomic unit (CR/Branch)
Investor work visas are issued for investors investing up to BD 100,000.
Size of establishment is the number of persons engaged in an establishment at a given period, including, in principle, all employees and unpaid family workers as well as any working proprietor. In practice, it refers to the total number of employees registered by anemployer at the responsible administrative agency.
2. Institution which provides data
Labour Market Regulatory Authority (LMRA).
3. Data availability
The LMRA publishes these data under its Bahrain Labour Market Indicators (BLMI) section. The BLMI dashboard can be found in: (http://blmi.lmra.bh/2014/03/mi_dashboard.xml). The general BLMI data with other non-LMRA sources can be found: (http://blmi.lmra.bh/2014/03/mi_data.xml)
Figures and results are often reported in tables in both PDF and Excel formats.
Data for this LMRA table for 2009 can be found here: (http://blmi.lmra.bh/2009/03/data/ems/Table_37b.pdf), (http://blmi.lmra.bh/2009/06/data/ems/Table_37b.pdf) and (http://blmi.lmra.bh/2009/09/data/ems/Table_37b.pdf) and (http://blmi.lmra.bh/2009/12/data/ems/Table_37b.pdf).
Data for 2010 can be found here: (http://blmi.lmra.bh/2010/03/data/ems/Table_37b.pdf), (http://blmi.lmra.bh/2010/06/data/ems/Table_37b.pdf), (http://blmi.lmra.bh/2010/09/data/ems/Table_37b.pdf) and (http://blmi.lmra.bh/2010/12/data/ems/Table_37b.pdf)
Data for 2011 can be found here: (http://blmi.lmra.bh/2011/03/data/ems/Table_37b.pdf), (http://blmi.lmra.bh/2011/06/data/ems/Table_37b.pdf), (http://blmi.lmra.bh/2011/09/data/ems/Table_37b.pdf) and (http://blmi.lmra.bh/2011/12/data/ems/Table_37b.pdf)
Data for 2012 can be found here: (http://blmi.lmra.bh/2012/03/data/ems/Table_37b.pdf), (http://blmi.lmra.bh/2012/06/data/ems/Table_37b.pdf), (http://blmi.lmra.bh/2012/09/data/ems/Table_37b.pdf) and (http://blmi.lmra.bh/2012/12/data/ems/Table_37b.pdf).
Data for 2013 can be found here: (http://blmi.lmra.bh/2013/03/data/ems/Table_37b.pdf), (http://blmi.lmra.bh/2013/06/data/ems/Table_37b.pdf), (http://blmi.lmra.bh/2013/09/data/ems/Table_37b.pdf) and (http://blmi.lmra.bh/2013/12/data/ems/Table_37b.pdf).
Data for 2014 can be found here: (http://blmi.lmra.bh/2014/03/data/ems/Table_37b.pdf) and (http://blmi.lmra.bh/2014/06/data/ems/Table_37b.pdf).
The definitions that the LMRA adopts for its data can be found in the Glossary section: (http://blmi.lmra.bh/mi_glossary.xml).
Date of access: September 2014
|
|
Sector / Number of Employees |
|
|
Commercial |
Government |
Non Commercial Non Government |
|
|
0 -5 |
6 – 9 |
10 – 19 |
20 – 99 |
100 – 499 |
500+ |
Total |
0 -5 |
6 – 9 |
10 – 19 |
20 – 99 |
100 – 499 |
500+ |
Total |
0 -5 |
6 – 9 |
10 – 19 |
20 – 99 |
100 – 499 |
Total |
|
|
Employment |
Dependent |
Employment |
Dependent |
Employment |
Dependent |
Employment |
Dependent |
Employment |
Dependent |
Employment |
Dependent |
Employment |
Dependent |
Employment |
Dependent |
Employment |
Dependent |
Employment |
Dependent |
Employment |
Dependent |
Employment |
Dependent |
Employment |
Dependent |
Employment |
Dependent |
Employment |
Dependent |
Employment |
Dependent |
Employment |
Dependent |
Employment |
Dependent |
Employment |
Dependent |
Employment |
Dependent |
| 2009 |
Q1 |
2,943 |
310 |
1,081 |
137 |
1,248 |
187 |
3,313 |
510 |
3,109 |
484 |
3,162 |
196 |
14,856 |
1,824 |
3 |
0 |
2 |
5 |
5 |
4 |
23 |
10 |
21 |
24 |
36 |
39 |
90 |
82 |
181 |
9 |
58 |
3 |
26 |
1 |
24 |
4 |
21 |
6 |
310 |
23 |
| Q2 |
2,993 |
413 |
1,140 |
158 |
1,356 |
214 |
3,204 |
543 |
2,644 |
442 |
3,271 |
246 |
14,608 |
2,016 |
1 |
5 |
1 |
0 |
2 |
2 |
21 |
9 |
27 |
45 |
130 |
103 |
182 |
164 |
204 |
0 |
52 |
5 |
36 |
2 |
57 |
10 |
88 |
21 |
437 |
38 |
| Q3 |
2,857 |
306 |
992 |
124 |
1,432 |
152 |
2,869 |
449 |
2,313 |
418 |
3,176 |
215 |
13,639 |
1,664 |
|
|
1 |
0 |
1 |
0 |
18 |
35 |
30 |
67 |
23 |
12 |
73 |
114 |
194 |
2 |
29 |
3 |
16 |
8 |
43 |
25 |
41 |
33 |
323 |
71 |
| Q4 |
3,293 |
334 |
1,125 |
126 |
1,406 |
185 |
3,005 |
433 |
2,311 |
326 |
3,218 |
225 |
14,358 |
1,629 |
0 |
0 |
3 |
0 |
12 |
5 |
0 |
11 |
18 |
20 |
24 |
15 |
57 |
51 |
220 |
1 |
37 |
0 |
18 |
4 |
35 |
18 |
21 |
9 |
331 |
32 |
| 2010 |
Q1 |
3,562 |
347 |
1,172 |
135 |
1,317 |
172 |
3,780 |
520 |
2,850 |
362 |
2,898 |
188 |
15,579 |
1,724 |
0 |
0 |
1 |
2 |
4 |
4 |
11 |
12 |
28 |
32 |
32 |
21 |
76 |
71 |
276 |
5 |
39 |
2 |
12 |
0 |
33 |
7 |
32 |
25 |
392 |
39 |
| Q2 |
3,890 |
438 |
1,022 |
126 |
1,345 |
197 |
3,760 |
604 |
2,443 |
460 |
2,558 |
297 |
15,018 |
2,122 |
1 |
0 |
1 |
0 |
5 |
3 |
20 |
21 |
38 |
62 |
113 |
121 |
178 |
207 |
274 |
17 |
31 |
3 |
14 |
3 |
61 |
17 |
91 |
69 |
471 |
109 |
| Q3 |
3,938 |
411 |
1,163 |
140 |
1,535 |
166 |
3,923 |
503 |
3,455 |
453 |
2,281 |
177 |
16,295 |
1,850 |
1 |
0 |
0 |
0 |
4 |
5 |
24 |
23 |
64 |
63 |
33 |
38 |
126 |
129 |
270 |
6 |
33 |
2 |
19 |
3 |
37 |
20 |
30 |
32 |
389 |
63 |
| Q4 |
4,523 |
412 |
1,320 |
140 |
1,764 |
150 |
3,219 |
415 |
2,508 |
366 |
2,656 |
182 |
15,990 |
1,665 |
0 |
0 |
0 |
0 |
3 |
0 |
18 |
15 |
21 |
21 |
26 |
9 |
68 |
45 |
285 |
3 |
29 |
2 |
18 |
2 |
32 |
9 |
14 |
11 |
378 |
27 |
| 2011 |
Q1 |
4,466 |
478 |
1,285 |
161 |
2,186 |
214 |
4,292 |
511 |
2,401 |
373 |
2,556 |
221 |
17,186 |
1,958 |
1 |
0 |
1 |
0 |
16 |
10 |
23 |
10 |
29 |
35 |
23 |
17 |
93 |
72 |
257 |
10 |
24 |
0 |
17 |
5 |
40 |
11 |
13 |
12 |
351 |
38 |
| Q2 |
4866 |
604 |
1359 |
239 |
1873 |
288 |
3603 |
649 |
2660 |
511 |
2613 |
271 |
16,974 |
2,562 |
4 |
|
2 |
1 |
4 |
1 |
18 |
19 |
41 |
41 |
90 |
72 |
159 |
134 |
246 |
5 |
35 |
2 |
23 |
10 |
74 |
25 |
103 |
49 |
481 |
91 |
| Q3 |
4351 |
510 |
1202 |
116 |
1585 |
196 |
3023 |
524 |
2295 |
438 |
1758 |
158 |
14,214 |
1,942 |
2 |
2 |
0 |
0 |
4 |
9 |
11 |
16 |
64 |
36 |
27 |
32 |
108 |
95 |
256 |
4 |
37 |
2 |
19 |
4 |
34 |
3 |
41 |
21 |
387 |
34 |
| Q4 |
4483 |
504 |
1264 |
171 |
1668 |
230 |
2835 |
439 |
3215 |
346 |
1859 |
198 |
15,324 |
1,888 |
2 |
3 |
1 |
|
6 |
5 |
13 |
22 |
43 |
43 |
22 |
82 |
87 |
155 |
228 |
6 |
46 |
6 |
18 |
8 |
35 |
4 |
25 |
17 |
352 |
41 |
| 2012 |
Q1 |
4432 |
617 |
1213 |
193 |
1552 |
232 |
3131 |
590 |
2216 |
368 |
1757 |
281 |
14,301 |
2,281 |
2 |
3 |
1 |
|
3 |
6 |
8 |
14 |
44 |
53 |
17 |
69 |
75 |
145 |
230 |
2 |
47 |
5 |
28 |
10 |
38 |
18 |
31 |
9 |
374 |
44 |
| Q2 |
4250 |
594 |
1346 |
220 |
1551 |
242 |
2906 |
642 |
2149 |
422 |
1808 |
217 |
14,010 |
2,337 |
0 |
0 |
0 |
1 |
3 |
4 |
11 |
19 |
47 |
43 |
122 |
170 |
183 |
237 |
195 |
7 |
43 |
|
15 |
6 |
86 |
17 |
107 |
60 |
446 |
90 |
| Q3 |
4114 |
499 |
1094 |
141 |
1513 |
192 |
2719 |
471 |
2339 |
369 |
1786 |
237 |
13,565 |
1,909 |
2 |
0 |
|
0 |
3 |
8 |
12 |
16 |
48 |
31 |
34 |
29 |
99 |
84 |
268 |
9 |
55 |
4 |
18 |
2 |
47 |
18 |
45 |
57 |
433 |
90 |
| Q4 |
4,806 |
544 |
1,281 |
204 |
1,795 |
253 |
3,097 |
568 |
2,679 |
445 |
2,862 |
293 |
16,520 |
2,307 |
1 |
|
|
4 |
1 |
1 |
12 |
24 |
36 |
24 |
31 |
32 |
81 |
85 |
324 |
20 |
51 |
7 |
15 |
7 |
45 |
10 |
55 |
28 |
490 |
72 |
| 2013 |
Q1 |
5,694 |
783 |
1,513 |
265 |
1,969 |
290 |
3,559 |
784 |
3,094 |
556 |
3,462 |
451 |
19,291 |
3,129 |
|
|
3 |
2 |
2 |
1 |
13 |
27 |
62 |
71 |
50 |
91 |
130 |
192 |
407 |
11 |
60 |
3 |
23 |
8 |
58 |
33 |
29 |
14 |
577 |
69 |
| Q2 |
5,637 |
945 |
1,534 |
256 |
1,935 |
403 |
3,352 |
845 |
3,170 |
592 |
3,501 |
578 |
19,129 |
3,619 |
1 |
3 |
2 |
4 |
2 |
3 |
8 |
13 |
86 |
67 |
124 |
256 |
223 |
346 |
378 |
17 |
81 |
4 |
37 |
20 |
98 |
64 |
111 |
54 |
705 |
159 |
| Q3 |
6,486 |
827 |
1,709 |
261 |
2,214 |
304 |
3,524 |
801 |
3,501 |
590 |
3,702 |
439 |
21,136 |
3,222 |
2 |
6 |
4 |
9 |
3 |
|
12 |
25 |
64 |
44 |
71 |
146 |
156 |
230 |
489 |
18 |
96 |
1 |
26 |
5 |
94 |
54 |
54 |
39 |
759 |
117 |
| Q4 |
7,812 |
922 |
2,094 |
276 |
2,655 |
344 |
3,915 |
774 |
3,502 |
602 |
3,224 |
397 |
23,202 |
3,315 |
7 |
2 |
2 |
1 |
9 |
4 |
22 |
37 |
39 |
26 |
68 |
120 |
147 |
190 |
405 |
6 |
82 |
3 |
16 |
9 |
61 |
26 |
44 |
30 |
608 |
74 |
| 2014 |
Q1 |
7,471 |
1,198 |
1,920 |
347 |
2,303 |
355 |
3,726 |
856 |
3,450 |
588 |
3,207 |
373 |
22,077 |
3,717 |
1 |
|
19 |
7 |
|
1 |
20 |
31 |
35 |
60 |
65 |
84 |
140 |
183 |
441 |
6 |
53 |
3 |
52 |
35 |
44 |
22 |
47 |
36 |
637 |
102 |
| Q2 |
6,772 |
980 |
1,856 |
240 |
2,064 |
357 |
4,001 |
892 |
3,287 |
597 |
3,496 |
401 |
21,476 |
3,467 |
2 |
8 |
2 |
6 |
1 |
4 |
34 |
45 |
85 |
42 |
206 |
192 |
435 |
297 |
500 |
32 |
87 |
7 |
23 |
1 |
79 |
28 |
115 |
54 |
804 |
122 |
Source: Labour Market Regulatory Authority (LMRA), Expatriate Management System (EMS)
ANNEXED NOTE
1. Technical Notes and Definitions
This table shows the flow of renewed permits (or visas) that are given to foreigners by the LMRA. These renwed visas combine those given for regular and temporary workers, investors and dependents.
The LMRA Expatriate Management System (EMS) stores information and past history of sponsors and workers, and their dependents, within the scope of Law No. 19/2006 on regulating the labour market. The scope of the system covers regular, temporary and investor work visas for foreign workers, their dependents, in the commercial sector, the government sector and the non-commercial, non-government sector. It presently excludes domestic workers, and work visas for artists and certain other categories of workers in non-civilian organizations. It distinguishes four types of visas for operational purposes: regular work visas for workers with 24-month validity; temporary work visas issued for workers with 6-month validity; investor work visas issued for investors investing up to BD 100,000; and dependent visas issued for dependent members of eligible foreign workers.The system tracks visa applications, renewals, mobility of workers between employers and from one occupation to another as well as notification of termination and runaway workers, and in general all operations of LMRA including inspection and offence management. The system is updated continuously and linked with other labour-related databases of the Kingdom, including CIO, GDNPR, GOSI, PFC, CSB, Ministry of Labour (MoL), and Ministry of Industry and Commerce (MOIC).
Termination refers to an employer’s application to the LMRA announcing the end of employment of a foraign worker in theeconomic unit (CR/Branch)
Work Visa is a legal certificate to allow a foreign worker to enter the country for working purposes for a period of two years with the possibility of renewal.
Worker is a generic term that refers to an employed person in general, or to an employee, a self-employed, or a particular category of worker, such as full-time or part-time worker, depending on the context in which the term is used. Four major categories of workers in terms of their status in employment are employees, employers, own-account workers, and unpaid family workers.
Size of establishment is the number of persons engaged in an establishment at a given period, including, in principle, all employees and unpaid family workers as well as any working proprietor. In practice, it refers to the total number of employees registered by anemployer at the responsible administrative agency.
2. Institution which provides data
Labour Market Regulatory Authority (LMRA).
3. Data availability
The LMRA publishes these data under its Bahrain Labour Market Indicators (BLMI) section. The BLMI dashboard can be found in: (http://blmi.lmra.bh/2014/03/mi_dashboard.xml). The general BLMI data with other non-LMRA sources can be found: (http://blmi.lmra.bh/2014/03/mi_data.xml)
Figures and results are often reported in tables in both PDF and Excel formats.
Data for this LMRA table for 2009 can be found here: (http://blmi.lmra.bh/2009/03/data/ems/Table_37b.pdf), (http://blmi.lmra.bh/2009/06/data/ems/Table_37b.pdf) and (http://blmi.lmra.bh/2009/09/data/ems/Table_37b.pdf) and (http://blmi.lmra.bh/2009/12/data/ems/Table_37b.pdf).
Data for 2010 can be found here: (http://blmi.lmra.bh/2010/03/data/ems/Table_37b.pdf), (http://blmi.lmra.bh/2010/06/data/ems/Table_37b.pdf), (http://blmi.lmra.bh/2010/09/data/ems/Table_37b.pdf) and (http://blmi.lmra.bh/2010/12/data/ems/Table_37b.pdf)
Data for 2011 can be found here: (http://blmi.lmra.bh/2011/03/data/ems/Table_37b.pdf), (http://blmi.lmra.bh/2011/06/data/ems/Table_37b.pdf), (http://blmi.lmra.bh/2011/09/data/ems/Table_37b.pdf) and (http://blmi.lmra.bh/2011/12/data/ems/Table_37b.pdf)
Data for 2012 can be found here: (http://blmi.lmra.bh/2012/03/data/ems/Table_37b.pdf), (http://blmi.lmra.bh/2012/06/data/ems/Table_37b.pdf), (http://blmi.lmra.bh/2012/09/data/ems/Table_37b.pdf) and (http://blmi.lmra.bh/2012/12/data/ems/Table_37b.pdf).
Data for 2013 can be found here: (http://blmi.lmra.bh/2013/03/data/ems/Table_37b.pdf), (http://blmi.lmra.bh/2013/06/data/ems/Table_37b.pdf), (http://blmi.lmra.bh/2013/09/data/ems/Table_37b.pdf) and (http://blmi.lmra.bh/2013/12/data/ems/Table_37b.pdf).
Data for 2014 can be found here: (http://blmi.lmra.bh/2014/03/data/ems/Table_37b.pdf) and (http://blmi.lmra.bh/2014/06/data/ems/Table_37b.pdf).
The definitions that the LMRA adopts for its data can be found in the Glossary section: (http://blmi.lmra.bh/mi_glossary.xml).
Date of access: September 2014
|
|
Sector / Number of Employees |
|
|
Commercial |
Government |
Non Commercial Non Government |
|
|
0 -5 |
6 – 9 |
10 – 19 |
20 – 99 |
100 – 499 |
500+ |
Total |
0 -5 |
6 – 9 |
10 – 19 |
20 – 99 |
100 – 499 |
500+ |
Total |
0 -5 |
6 – 9 |
10 – 19 |
20 – 99 |
100 – 499 |
Total |
| 2009 |
Q1 |
3,297 |
1,232 |
1,496 |
4,318 |
3,989 |
4,113 |
18,445 |
3 |
7 |
9 |
33 |
45 |
75 |
172 |
190 |
61 |
27 |
28 |
27 |
333 |
| Q2 |
3,424 |
1,329 |
1,606 |
3,869 |
3,268 |
3,788 |
17,284 |
6 |
1 |
4 |
30 |
72 |
233 |
346 |
204 |
57 |
39 |
67 |
109 |
476 |
| Q3 |
3,172 |
1,125 |
1,604 |
3,454 |
3,023 |
3,747 |
16,125 |
0 |
1 |
1 |
53 |
97 |
35 |
187 |
196 |
32 |
24 |
68 |
74 |
394 |
| Q4 |
3,639 |
1,254 |
1,636 |
3,605 |
2,868 |
3,937 |
16,939 |
0 |
8 |
23 |
0 |
38 |
39 |
108 |
221 |
37 |
22 |
53 |
30 |
363 |
| 2010 |
Q1 |
3,924 |
1,312 |
1,593 |
4,466 |
3,646 |
3,390 |
18,331 |
0 |
3 |
8 |
23 |
60 |
53 |
147 |
281 |
41 |
12 |
40 |
57 |
431 |
| Q2 |
4,331 |
1,160 |
1,568 |
4,440 |
3,010 |
3,186 |
17,695 |
1 |
1 |
8 |
41 |
100 |
234 |
385 |
291 |
34 |
17 |
78 |
160 |
580 |
| Q3 |
4,379 |
1,320 |
1,716 |
4,574 |
4,033 |
2,551 |
18,573 |
1 |
0 |
9 |
47 |
127 |
71 |
255 |
276 |
35 |
22 |
57 |
62 |
452 |
| Q4 |
4,954 |
1,471 |
1,928 |
3,802 |
2,912 |
2,978 |
18,045 |
0 |
0 |
3 |
33 |
42 |
35 |
113 |
288 |
31 |
20 |
41 |
25 |
405 |
| 2011 |
Q1 |
4,969 |
1,449 |
2,418 |
4,939 |
2,917 |
3,175 |
19,867 |
1 |
1 |
26 |
33 |
64 |
40 |
165 |
267 |
24 |
22 |
51 |
25 |
389 |
| Q2 |
5,492 |
1,610 |
2,182 |
4,326 |
3,406 |
3,231 |
20,247 |
4 |
3 |
5 |
38 |
82 |
162 |
294 |
251 |
37 |
33 |
99 |
152 |
572 |
| Q3 |
4,883 |
1,322 |
1,795 |
3,581 |
2,859 |
2,036 |
16,476 |
4 |
0 |
13 |
27 |
100 |
59 |
203 |
260 |
39 |
23 |
37 |
62 |
421 |
| Q4 |
5,003 |
1,436 |
1,904 |
3,329 |
3,689 |
2,174 |
17,535 |
5 |
1 |
11 |
36 |
86 |
104 |
243 |
234 |
52 |
26 |
39 |
42 |
393 |
| 2012 |
Q1 |
5,059 |
1,413 |
1,797 |
3,757 |
2,630 |
2,162 |
16,818 |
5 |
1 |
9 |
22 |
97 |
86 |
220 |
232 |
52 |
38 |
56 |
40 |
418 |
| Q2 |
4,859 |
1,573 |
1,800 |
3,626 |
2,618 |
2,213 |
16,689 |
0 |
1 |
7 |
30 |
90 |
292 |
420 |
202 |
43 |
21 |
103 |
167 |
536 |
| Q3 |
4,633 |
1,240 |
1,725 |
3,374 |
2,825 |
2,280 |
16,077 |
2 |
0 |
11 |
28 |
79 |
63 |
183 |
277 |
59 |
20 |
65 |
102 |
523 |
| Q4 |
5,377 |
1,522 |
2,072 |
4,037 |
3,597 |
3,756 |
20,361 |
1 |
4 |
2 |
36 |
60 |
63 |
166 |
344 |
58 |
22 |
55 |
83 |
562 |
| 2013 |
Q1 |
6,524 |
1,780 |
2,296 |
4,610 |
3,991 |
4,702 |
23,903 |
|
5 |
3 |
40 |
133 |
141 |
322 |
418 |
63 |
31 |
91 |
43 |
646 |
| Q2 |
6,614 |
1,796 |
2,367 |
4,373 |
4,018 |
4,324 |
23,492 |
4 |
6 |
5 |
21 |
153 |
380 |
569 |
395 |
85 |
57 |
162 |
165 |
864 |
| Q3 |
7,345 |
1,983 |
2,541 |
4,390 |
4,219 |
4,379 |
24,857 |
8 |
13 |
3 |
37 |
108 |
217 |
386 |
507 |
97 |
31 |
148 |
93 |
876 |
| Q4 |
8,767 |
2,376 |
3,013 |
4,761 |
4,277 |
3,799 |
26,993 |
9 |
3 |
13 |
59 |
65 |
188 |
337 |
411 |
85 |
25 |
87 |
74 |
682 |
| 2014 |
Q1 |
8,703 |
2,270 |
2,667 |
4,652 |
4,157 |
3,786 |
26,235 |
1 |
26 |
1 |
51 |
95 |
149 |
323 |
447 |
56 |
87 |
66 |
83 |
739 |
| Q2 |
7,987 |
2,096 |
2,443 |
5,027 |
4,275 |
4,060 |
25,888 |
10 |
8 |
5 |
79 |
127 |
398 |
627 |
532 |
94 |
24 |
107 |
169 |
926 |
Source: Labour Market Regulatory Authority (LMRA), Expatriate Management System (EMS)
ANNEXED NOTE
1. Technical Notes and Definitions
This table shows the flow of renewed permits (or visas) that are given to foreigners by the LMRA. These renwed visas combine those given for regular and temporary workers, investors and dependents.
The LMRA Expatriate Management System (EMS) stores information and past history of sponsors and workers, and their dependents, within the scope of Law No. 19/2006 on regulating the labour market. The scope of the system covers regular, temporary and investor work visas for foreign workers, their dependents, in the commercial sector, the government sector and the non-commercial, non-government sector. It presently excludes domestic workers, and work visas for artists and certain other categories of workers in non-civilian organizations. It distinguishes four types of visas for operational purposes: regular work visas for workers with 24-month validity; temporary work visas issued for workers with 6-month validity; investor work visas issued for investors investing up to BD 100,000; and dependent visas issued for dependent members of eligible foreign workers.The system tracks visa applications, renewals, mobility of workers between employers and from one occupation to another as well as notification of termination and runaway workers, and in general all operations of LMRA including inspection and offence management. The system is updated continuously and linked with other labour-related databases of the Kingdom, including CIO, GDNPR, GOSI, PFC, CSB, Ministry of Labour (MoL), and Ministry of Industry and Commerce (MOIC).
Termination refers to an employer’s application to the LMRA announcing the end of employment of a foraign worker in theeconomic unit (CR/Branch)
Size of establishment is the number of persons engaged in an establishment at a given period, including, in principle, all employees and unpaid family workers as well as any working proprietor. In practice, it refers to the total number of employees registered by anemployer at the responsible administrative agency.
2. Institution which provides data
Labour Market Regulatory Authority (LMRA).
3. Data availability
The LMRA publishes these data under its Bahrain Labour Market Indicators (BLMI) section. The BLMI dashboard can be found in: (http://blmi.lmra.bh/2014/03/mi_dashboard.xml). The general BLMI data with other non-LMRA sources can be found: (http://blmi.lmra.bh/2014/03/mi_data.xml)
Figures and results are often reported in tables in both PDF and Excel formats.
Data for this LMRA table for 2009 can be found here: (http://blmi.lmra.bh/2009/03/data/ems/Table_37b.pdf), (http://blmi.lmra.bh/2009/06/data/ems/Table_37b.pdf) and (http://blmi.lmra.bh/2009/09/data/ems/Table_37b.pdf) and (http://blmi.lmra.bh/2009/12/data/ems/Table_37b.pdf).
Data for 2010 can be found here: (http://blmi.lmra.bh/2010/03/data/ems/Table_37b.pdf), (http://blmi.lmra.bh/2010/06/data/ems/Table_37b.pdf), (http://blmi.lmra.bh/2010/09/data/ems/Table_37b.pdf) and (http://blmi.lmra.bh/2010/12/data/ems/Table_37b.pdf)
Data for 2011 can be found here: (http://blmi.lmra.bh/2011/03/data/ems/Table_37b.pdf), (http://blmi.lmra.bh/2011/06/data/ems/Table_37b.pdf), (http://blmi.lmra.bh/2011/09/data/ems/Table_37b.pdf) and (http://blmi.lmra.bh/2011/12/data/ems/Table_37b.pdf)
Data for 2012 can be found here: (http://blmi.lmra.bh/2012/03/data/ems/Table_37b.pdf), (http://blmi.lmra.bh/2012/06/data/ems/Table_37b.pdf), (http://blmi.lmra.bh/2012/09/data/ems/Table_37b.pdf) and (http://blmi.lmra.bh/2012/12/data/ems/Table_37b.pdf).
Data for 2013 can be found here: (http://blmi.lmra.bh/2013/03/data/ems/Table_37b.pdf), (http://blmi.lmra.bh/2013/06/data/ems/Table_37b.pdf), (http://blmi.lmra.bh/2013/09/data/ems/Table_37b.pdf) and (http://blmi.lmra.bh/2013/12/data/ems/Table_37b.pdf).
Data for 2014 can be found here: (http://blmi.lmra.bh/2014/03/data/ems/Table_37b.pdf) and (http://blmi.lmra.bh/2014/06/data/ems/Table_37b.pdf).
The definitions that the LMRA adopts for its data can be found in the Glossary section: (http://blmi.lmra.bh/mi_glossary.xml).
Date of access: September 2014
|
|
Agriculture, hunting and forestry |
Fishing |
Mining and quarrying |
Manufacturing |
Electricity, gas and water supply |
Construction |
Wholesale and retail trade, repair |
Hotels and restaurants |
Transport, storage, communication |
Financial intermediation |
Real estate, renting, business activities |
Public administration |
Education |
Health and social work |
Other social, personal services |
Extra-territorial organizations, bodies |
Not specified |
Total |
| 2009 |
Q2 |
31 |
0 |
0 |
231 |
0 |
237 |
90 |
1 |
27 |
1 |
38 |
0 |
0 |
0 |
0 |
0 |
1 |
657 |
| Q3 |
0 |
0 |
0 |
40 |
0 |
21 |
14 |
1 |
0 |
0 |
8 |
0 |
0 |
0 |
0 |
0 |
0 |
84 |
| Q4 |
0 |
0 |
0 |
147 |
0 |
49 |
420 |
1 |
4 |
2 |
36 |
0 |
0 |
0 |
0 |
0 |
0 |
659 |
| 2010 |
Q1 |
2 |
0 |
0 |
355 |
0 |
503 |
93 |
1 |
4 |
3 |
53 |
0 |
0 |
0 |
0 |
0 |
2 |
1,016 |
| Q2 |
0 |
0 |
0 |
90 |
0 |
329 |
82 |
0 |
2 |
4 |
38 |
0 |
0 |
0 |
0 |
0 |
4 |
549 |
| Q3 |
2 |
0 |
0 |
49 |
0 |
226 |
68 |
0 |
1 |
1 |
70 |
0 |
0 |
0 |
0 |
0 |
3 |
420 |
| Q4 |
0 |
0 |
0 |
131 |
0 |
187 |
33 |
0 |
0 |
0 |
26 |
0 |
0 |
0 |
0 |
0 |
0 |
377 |
| 2011 |
Q1 |
0 |
0 |
0 |
181 |
0 |
266 |
236 |
0 |
1 |
1 |
31 |
0 |
0 |
0 |
0 |
0 |
0 |
716 |
| Q2 |
0 |
0 |
3 |
311 |
0 |
248 |
97 |
0 |
2 |
0 |
36 |
0 |
0 |
0 |
0 |
0 |
1 |
698 |
| Q3 |
0 |
0 |
0 |
154 |
0 |
113 |
20 |
2 |
0 |
0 |
22 |
0 |
0 |
0 |
0 |
0 |
0 |
311 |
| Q4 |
0 |
0 |
1 |
138 |
0 |
126 |
11 |
6 |
1 |
3 |
25 |
0 |
0 |
0 |
0 |
0 |
0 |
311 |
| 2012 |
Q1 |
0 |
0 |
1 |
124 |
0 |
67 |
6 |
3 |
1 |
2 |
22 |
0 |
0 |
0 |
0 |
0 |
0 |
226 |
| Q2 |
0 |
0 |
4 |
197 |
0 |
68 |
11 |
6 |
0 |
1 |
41 |
0 |
0 |
0 |
0 |
0 |
0 |
328 |
| Q3 |
0 |
0 |
6 |
178 |
0 |
340 |
26 |
3 |
2 |
0 |
27 |
0 |
0 |
0 |
0 |
0 |
0 |
582 |
| Q4 |
0 |
0 |
4 |
383 |
0 |
941 |
146 |
4 |
2 |
0 |
30 |
0 |
0 |
0 |
0 |
0 |
0 |
1,510 |
| 2013 |
Q1 |
0 |
0 |
26 |
338 |
70 |
125 |
97 |
0 |
1 |
0 |
56 |
0 |
0 |
0 |
0 |
0 |
0 |
713 |
| Q2 |
0 |
0 |
26 |
338 |
70 |
125 |
97 |
0 |
1 |
0 |
56 |
0 |
0 |
0 |
0 |
0 |
0 |
713 |
| Q3 |
0 |
0 |
12 |
277 |
5 |
64 |
69 |
4 |
9 |
0 |
35 |
0 |
0 |
0 |
0 |
0 |
0 |
475 |
| Q4 |
0 |
0 |
21 |
235 |
65 |
67 |
28 |
0 |
3 |
0 |
24 |
0 |
0 |
0 |
1 |
0 |
0 |
444 |
| 2014 |
Q1 |
0 |
0 |
34 |
253 |
0 |
48 |
44 |
6 |
5 |
1 |
20 |
0 |
0 |
0 |
0 |
0 |
0 |
411 |
| Q2 |
0 |
0 |
28 |
233 |
4 |
502 |
82 |
2 |
7 |
1 |
40 |
0 |
0 |
0 |
2 |
0 |
0 |
901 |
Source: Labour Market Regulatory Authority (LMRA), Expatriate Management System (EMS)
ANNEXED NOTE
1. Technical Notes and Definitions
This table shows the flow of renewed permits (or visas) that are given to foreigners by the LMRA. These renwed visas combine those given for regular and temporary workers, investors and dependents.
The LMRA Expatriate Management System (EMS) stores information and past history of sponsors and workers, and their dependents, within the scope of Law No. 19/2006 on regulating the labour market. The scope of the system covers regular, temporary and investor work visas for foreign workers, their dependents, in the commercial sector, the government sector and the non-commercial, non-government sector. It presently excludes domestic workers, and work visas for artists and certain other categories of workers in non-civilian organizations. It distinguishes four types of visas for operational purposes: regular work visas for workers with 24-month validity; temporary work visas issued for workers with 6-month validity; investor work visas issued for investors investing up to BD 100,000; and dependent visas issued for dependent members of eligible foreign workers.The system tracks visa applications, renewals, mobility of workers between employers and from one occupation to another as well as notification of termination and runaway workers, and in general all operations of LMRA including inspection and offence management. The system is updated continuously and linked with other labour-related databases of the Kingdom, including CIO, GDNPR, GOSI, PFC, CSB, Ministry of Labour (MoL), and Ministry of Industry and Commerce (MOIC).
Termination refers to an employer’s application to the LMRA announcing the end of employment of a foraign worker in theeconomic unit (CR/Branch)
Temporary Worker is a worker engaged to work in an enterprise for a short period of time, i.e. for less than two years and usually six months.
Work Visa is a legal certificate to allow a foreign worker to enter the country for working purposes for a period of two years with the possibility of renewal.
Worker is a generic term that refers to an employed person in general, or to an employee, a self-employed, or a particular category of worker, such as full-time or part-time worker, depending on the context in which the term is used. Four major categories of workers in terms of their status in employment are employees, employers, own-account workers, and unpaid family workers.
2. Institution which provides data
Labour Market Regulatory Authority (LMRA).
3. Data availability
The LMRA publishes these data under its Bahrain Labour Market Indicators (BLMI) section. The BLMI dashboard can be found in: (http://blmi.lmra.bh/2014/03/mi_dashboard.xml). The general BLMI data with other non-LMRA sources can be found: (http://blmi.lmra.bh/2014/03/mi_data.xml)
Figures and results are often reported in tables in both PDF and Excel formats.
Data for this LMRA table for 2009 can be found here: (http://blmi.lmra.bh/2009/06/data/lmr/Table_37a.pdf), (http://blmi.lmra.bh/2009/09/data/lmr/Table_37a.pdf) and (http://blmi.lmra.bh/2009/12/data/lmr/Table_37a.pdf).
Data for 2010 can be found here: (http://blmi.lmra.bh/2010/03/data/ems/Table_37a.pdf), (http://blmi.lmra.bh/2010/06/data/ems/Table_37a.pdf), (http://blmi.lmra.bh/2010/09/data/ems/Table_37a.pdf) and (http://blmi.lmra.bh/2010/12/data/ems/Table_37a.pdf)
Data for 2011 can be found here: (http://blmi.lmra.bh/2011/03/data/ems/Table_37a.pdf), (http://blmi.lmra.bh/2011/06/data/ems/Table_37a.pdf), (http://blmi.lmra.bh/2011/09/data/ems/Table_37a.pdf) and (http://blmi.lmra.bh/2011/12/data/ems/Table_37a.pdf)
Data for 2012 can be found here: (http://blmi.lmra.bh/2012/03/data/ems/Table_37a.pdf), (http://blmi.lmra.bh/2012/06/data/ems/Table_37a.pdf), (http://blmi.lmra.bh/2012/09/data/ems/Table_37a.pdf) and (http://blmi.lmra.bh/2012/12/data/ems/Table_37a.pdf).
Data for 2013 can be found here: (http://blmi.lmra.bh/2013/03/data/ems/Table_37a.pdf), (http://blmi.lmra.bh/2013/06/data/ems/Table_37a.pdf), (http://blmi.lmra.bh/2013/09/data/ems/Table_37a.pdf) and (http://blmi.lmra.bh/2013/12/data/ems/Table_37a.pdf).
Data for 2014 can be found here: (http://blmi.lmra.bh/2014/03/data/ems/Table_37a.pdf) and (http://blmi.lmra.bh/2014/06/data/ems/Table_37a.pdf).
The definitions that the LMRA adopts for its data can be found in the Glossary section: (http://blmi.lmra.bh/mi_glossary.xml).
Date of access: September 2014
|
|
Agriculture, hunting and forestry |
Fishing |
Mining and quarrying |
Manufacturing |
Electricity, gas and water supply |
Construction |
Wholesale and retail trade, repair |
Hotels and restaurants |
Transport, storage, communication |
Financial intermediation |
Real estate, renting, business activities |
Public administration |
Education |
Health and social work |
Other social, personal services |
Extra-territorial organizations, bodies |
Not specified |
Total |
| 2009 |
Q2 |
0 |
0 |
0 |
0 |
0 |
0 |
1 |
2 |
0 |
0 |
1 |
0 |
0 |
0 |
0 |
0 |
0 |
4 |
| Q3 |
0 |
0 |
0 |
0 |
0 |
0 |
0 |
0 |
0 |
0 |
0 |
0 |
0 |
0 |
0 |
0 |
1 |
1 |
| Q4 |
0 |
0 |
0 |
0 |
0 |
0 |
0 |
0 |
0 |
0 |
0 |
0 |
0 |
0 |
0 |
0 |
0 |
0 |
| 2010 |
Q1 |
0 |
0 |
0 |
0 |
0 |
1 |
3 |
1 |
2 |
0 |
5 |
0 |
0 |
0 |
0 |
0 |
0 |
12 |
| Q2 |
0 |
0 |
0 |
1 |
0 |
0 |
5 |
0 |
0 |
0 |
0 |
0 |
0 |
0 |
0 |
0 |
0 |
6 |
| Q3 |
0 |
0 |
0 |
0 |
0 |
0 |
1 |
0 |
0 |
0 |
6 |
0 |
0 |
0 |
1 |
0 |
0 |
8 |
| Q4 |
0 |
0 |
0 |
0 |
0 |
1 |
6 |
1 |
1 |
0 |
4 |
0 |
0 |
0 |
0 |
0 |
0 |
13 |
| 2011 |
Q1 |
0 |
0 |
0 |
0 |
0 |
0 |
2 |
0 |
0 |
1 |
4 |
0 |
0 |
0 |
0 |
0 |
0 |
7 |
| Q2 |
0 |
0 |
0 |
0 |
0 |
1 |
4 |
0 |
0 |
1 |
6 |
0 |
2 |
0 |
0 |
0 |
0 |
14 |
| Q3 |
0 |
0 |
0 |
1 |
0 |
0 |
1 |
0 |
0 |
0 |
7 |
0 |
0 |
0 |
0 |
0 |
0 |
9 |
| Q4 |
0 |
0 |
0 |
0 |
0 |
1 |
4 |
0 |
1 |
0 |
7 |
0 |
0 |
0 |
0 |
0 |
0 |
13 |
| 2012 |
Q1 |
0 |
0 |
0 |
0 |
0 |
0 |
3 |
0 |
0 |
0 |
6 |
0 |
0 |
0 |
1 |
0 |
0 |
10 |
| Q2 |
0 |
0 |
0 |
1 |
0 |
0 |
1 |
0 |
0 |
1 |
11 |
0 |
0 |
0 |
0 |
0 |
0 |
14 |
| Q3 |
0 |
0 |
0 |
2 |
0 |
0 |
8 |
3 |
1 |
2 |
5 |
0 |
0 |
0 |
0 |
0 |
0 |
21 |
| Q4 |
0 |
0 |
0 |
2 |
0 |
1 |
8 |
0 |
2 |
0 |
10 |
0 |
0 |
0 |
0 |
0 |
1 |
24 |
| 2013 |
Q1 |
0 |
0 |
1 |
0 |
0 |
2 |
10 |
1 |
1 |
2 |
6 |
0 |
3 |
0 |
0 |
0 |
0 |
26 |
| Q2 |
0 |
0 |
0 |
3 |
0 |
0 |
14 |
2 |
0 |
0 |
11 |
0 |
0 |
0 |
1 |
0 |
0 |
31 |
| Q3 |
0 |
0 |
0 |
2 |
0 |
0 |
7 |
0 |
0 |
2 |
10 |
0 |
0 |
2 |
1 |
0 |
0 |
24 |
| Q4 |
0 |
0 |
0 |
2 |
0 |
0 |
12 |
1 |
1 |
2 |
14 |
0 |
0 |
0 |
0 |
0 |
0 |
32 |
| 2014 |
Q1 |
0 |
0 |
0 |
0 |
0 |
2 |
8 |
1 |
2 |
3 |
13 |
0 |
1 |
0 |
0 |
0 |
0 |
30 |
| |
Q2 |
0 |
0 |
0 |
2 |
0 |
1 |
21 |
1 |
0 |
3 |
16 |
0 |
0 |
0 |
0 |
0 |
0 |
44 |
Source: Labour Market Regulatory Authority (LMRA), Expatriate Management System (EMS)
ANNEXED NOTE
1. Technical Notes and Definitions
This table shows the flow of renewed permits (or visas) that are given to foreigners by the LMRA. These renwed visas combine those given for regular and temporary workers, investors and dependents.
The LMRA Expatriate Management System (EMS) stores information and past history of sponsors and workers, and their dependents, within the scope of Law No. 19/2006 on regulating the labour market. The scope of the system covers regular, temporary and investor work visas for foreign workers, their dependents, in the commercial sector, the government sector and the non-commercial, non-government sector. It presently excludes domestic workers, and work visas for artists and certain other categories of workers in non-civilian organizations. It distinguishes four types of visas for operational purposes: regular work visas for workers with 24-month validity; temporary work visas issued for workers with 6-month validity; investor work visas issued for investors investing up to BD 100,000; and dependent visas issued for dependent members of eligible foreign workers.The system tracks visa applications, renewals, mobility of workers between employers and from one occupation to another as well as notification of termination and runaway workers, and in general all operations of LMRA including inspection and offence management. The system is updated continuously and linked with other labour-related databases of the Kingdom, including CIO, GDNPR, GOSI, PFC, CSB, Ministry of Labour (MoL), and Ministry of Industry and Commerce (MOIC).
Termination refers to an employer’s application to the LMRA announcing the end of employment of a foraign worker in theeconomic unit (CR/Branch)
Investor work visas are issued for investors investing up to BD 100,000.
2. Institution which provides data
Labour Market Regulatory Authority (LMRA).
3. Data availability
The LMRA publishes these data under its Bahrain Labour Market Indicators (BLMI) section. The BLMI dashboard can be found in: (http://blmi.lmra.bh/2014/03/mi_dashboard.xml). The general BLMI data with other non-LMRA sources can be found: (http://blmi.lmra.bh/2014/03/mi_data.xml)
Figures and results are often reported in tables in both PDF and Excel formats.
Data for this LMRA table for 2009 can be found here: (http://blmi.lmra.bh/2009/06/data/lmr/Table_37a.pdf), (http://blmi.lmra.bh/2009/09/data/lmr/Table_37a.pdf) and (http://blmi.lmra.bh/2009/12/data/lmr/Table_37a.pdf).
Data for 2010 can be found here: (http://blmi.lmra.bh/2010/03/data/ems/Table_37a.pdf), (http://blmi.lmra.bh/2010/06/data/ems/Table_37a.pdf), (http://blmi.lmra.bh/2010/09/data/ems/Table_37a.pdf) and (http://blmi.lmra.bh/2010/12/data/ems/Table_37a.pdf)
Data for 2011 can be found here: (http://blmi.lmra.bh/2011/03/data/ems/Table_37a.pdf), (http://blmi.lmra.bh/2011/06/data/ems/Table_37a.pdf), (http://blmi.lmra.bh/2011/09/data/ems/Table_37a.pdf) and (http://blmi.lmra.bh/2011/12/data/ems/Table_37a.pdf)
Data for 2012 can be found here: (http://blmi.lmra.bh/2012/03/data/ems/Table_37a.pdf), (http://blmi.lmra.bh/2012/06/data/ems/Table_37a.pdf), (http://blmi.lmra.bh/2012/09/data/ems/Table_37a.pdf) and (http://blmi.lmra.bh/2012/12/data/ems/Table_37a.pdf).
Data for 2013 can be found here: (http://blmi.lmra.bh/2013/03/data/ems/Table_37a.pdf), (http://blmi.lmra.bh/2013/06/data/ems/Table_37a.pdf), (http://blmi.lmra.bh/2013/09/data/ems/Table_37a.pdf) and (http://blmi.lmra.bh/2013/12/data/ems/Table_37a.pdf).
Data for 2014 can be found here: (http://blmi.lmra.bh/2014/03/data/ems/Table_37a.pdf) and (http://blmi.lmra.bh/2014/06/data/ems/Table_37a.pdf).
The definitions that the LMRA adopts for its data can be found in the Glossary section: (http://blmi.lmra.bh/mi_glossary.xml).
Date of access: September 2014
|
|
Agriculture, hunting and forestry |
Fishing |
Mining and quarrying |
Manufacturing |
Electricity, gas and water supply |
Construction |
Wholesale and retail trade, repair |
Hotels and restaurants |
Transport, storage, communication |
Financial intermediation |
Real estate, renting, business activities |
Public administration |
Education |
Health and social work |
Other social, personal services |
Extra-territorial organizations, bodies |
Not specified |
Total |
|
|
Employment |
Dependent |
Employment |
Dependent |
Employment |
Dependent |
Employment |
Dependent |
Employment |
Dependent |
Employment |
Dependent |
Employment |
Dependent |
Employment |
Dependent |
Employment |
Dependent |
Employment |
Dependent |
Employment |
Dependent |
Employment |
Dependent |
Employment |
Dependent |
Employment |
Dependent |
Employment |
Dependent |
Employment |
Dependent |
Employment |
Dependent |
Employment |
Dependent |
| 2009 |
Q2 |
118 |
9 |
46 |
|
82 |
9 |
2,401 |
328 |
1 |
1 |
5,664 |
299 |
3,197 |
587 |
1,231 |
103 |
336 |
108 |
237 |
232 |
1,036 |
382 |
11 |
|
176 |
69 |
39 |
6 |
329 |
5 |
0 |
0 |
381 |
141 |
15,285 |
2,279 |
| Q3 |
13 |
3 |
5 |
0 |
13 |
10 |
660 |
97 |
1 |
|
1,079 |
94 |
781 |
229 |
313 |
45 |
209 |
166 |
80 |
92 |
423 |
160 |
2 |
6 |
63 |
52 |
29 |
5 |
120 |
6 |
0 |
0 |
155 |
83 |
3,946 |
1,048 |
| Q4 |
13 |
0 |
11 |
3 |
22 |
15 |
980 |
95 |
4 |
4 |
1,663 |
108 |
1,120 |
244 |
437 |
28 |
153 |
45 |
137 |
129 |
440 |
149 |
3 |
0 |
54 |
23 |
20 |
5 |
162 |
3 |
0 |
0 |
153 |
45 |
5,372 |
896 |
| 2010 |
Q1 |
41 |
7 |
73 |
1 |
83 |
13 |
2,153 |
195 |
3 |
3 |
7,012 |
302 |
2,843 |
497 |
1,368 |
79 |
479 |
102 |
207 |
169 |
1,018 |
331 |
6 |
15 |
84 |
35 |
29 |
8 |
340 |
6 |
0 |
0 |
308 |
71 |
16,047 |
1,834 |
| Q2 |
52 |
0 |
69 |
1 |
36 |
16 |
2,179 |
292 |
1 |
|
5,879 |
310 |
2,925 |
584 |
1,401 |
91 |
719 |
156 |
260 |
211 |
1,184 |
423 |
16 |
18 |
175 |
122 |
46 |
19 |
351 |
20 |
0 |
0 |
374 |
175 |
15,667 |
2,438 |
| Q3 |
182 |
7 |
67 |
1 |
61 |
5 |
2,519 |
236 |
5 |
6 |
6,788 |
273 |
2,768 |
458 |
1,418 |
72 |
694 |
140 |
286 |
222 |
1,169 |
401 |
14 |
9 |
110 |
98 |
47 |
16 |
359 |
10 |
0 |
0 |
323 |
88 |
16,810 |
2,042 |
| Q4 |
123 |
0 |
171 |
0 |
41 |
15 |
2,310 |
200 |
1 |
0 |
6,542 |
201 |
3,298 |
481 |
1,402 |
64 |
623 |
146 |
225 |
202 |
1,136 |
333 |
18 |
9 |
63 |
22 |
62 |
20 |
378 |
13 |
0 |
0 |
43 |
31 |
16,436 |
1,737 |
| 2011 |
Q1 |
105 |
17 |
168 |
0 |
74 |
8 |
2,378 |
196 |
1 |
0 |
7,235 |
300 |
3,392 |
673 |
1,562 |
105 |
571 |
135 |
196 |
166 |
1,337 |
335 |
20 |
18 |
64 |
41 |
75 |
27 |
405 |
16 |
0 |
0 |
47 |
31 |
17,630 |
2,068 |
| Q2 |
146 |
10 |
132 |
4 |
73 |
22 |
2,292 |
304 |
3 |
6 |
7,030 |
367 |
3,287 |
700 |
1,618 |
107 |
482 |
154 |
253 |
242 |
1,481 |
603 |
94 |
74 |
198 |
88 |
81 |
24 |
384 |
29 |
0 |
0 |
60 |
53 |
17,614 |
2,787 |
| Q3 |
168 |
6 |
153 |
0 |
61 |
20 |
2,069 |
192 |
5 |
1 |
5,040 |
260 |
2,839 |
521 |
1,296 |
99 |
393 |
112 |
230 |
205 |
1,203 |
463 |
31 |
41 |
110 |
62 |
101 |
19 |
318 |
7 |
0 |
0 |
692 |
63 |
14,709 |
2,071 |
| Q4 |
134 |
0 |
151 |
0 |
51 |
21 |
2,046 |
193 |
5 |
2 |
6,380 |
342 |
2,991 |
573 |
1,348 |
95 |
433 |
125 |
201 |
155 |
1,024 |
327 |
25 |
83 |
74 |
27 |
79 |
18 |
329 |
8 |
1 |
0 |
491 |
115 |
15,763 |
2,084 |
| 2012 |
Q1 |
132 |
3 |
138 |
0 |
76 |
88 |
1858 |
272 |
6 |
0 |
5591 |
384 |
2846 |
603 |
1386 |
105 |
456 |
161 |
205 |
169 |
1031 |
441 |
21 |
75 |
88 |
50 |
59 |
12 |
388 |
16 |
0 |
0 |
469 |
91 |
14,750 |
2,470 |
| Q2 |
113 |
7 |
110 |
2 |
45 |
29 |
1911 |
309 |
5 |
6 |
5163 |
384 |
3037 |
679 |
1399 |
96 |
489 |
148 |
248 |
223 |
1085 |
411 |
121 |
170 |
198 |
88 |
66 |
29 |
353 |
13 |
0 |
0 |
296 |
70 |
14,639 |
2,664 |
| Q3 |
162 |
7 |
192 |
0 |
41 |
17 |
1894 |
227 |
11 |
6 |
5040 |
326 |
2945 |
605 |
1423 |
94 |
408 |
122 |
176 |
141 |
1000 |
280 |
36 |
37 |
140 |
137 |
73 |
30 |
363 |
17 |
0 |
0 |
193 |
37 |
14,097 |
2,083 |
| Q4 |
148 |
1 |
209 |
2 |
78 |
26 |
2091 |
249 |
13 |
6 |
6574 |
467 |
3437 |
665 |
1677 |
120 |
452 |
134 |
200 |
186 |
1296 |
394 |
27 |
33 |
113 |
61 |
92 |
27 |
463 |
39 |
0 |
0 |
221 |
54 |
17,091 |
2,464 |
| 2013 |
Q1 |
139 |
9 |
268 |
2 |
132 |
45 |
2,571 |
328 |
12 |
12 |
7,493 |
559 |
4,087 |
936 |
1,893 |
153 |
701 |
258 |
234 |
204 |
1,519 |
586 |
51 |
91 |
130 |
92 |
78 |
24 |
533 |
21 |
0 |
0 |
157 |
70 |
19,998 |
3,390 |
| Q2 |
138 |
2 |
274 |
0 |
139 |
68 |
2,575 |
336 |
8 |
6 |
7,212 |
654 |
4,057 |
1,058 |
1,847 |
155 |
722 |
382 |
297 |
262 |
1,607 |
647 |
118 |
245 |
288 |
178 |
62 |
23 |
593 |
45 |
0 |
0 |
120 |
63 |
20,057 |
4,124 |
| Q3 |
182 |
2 |
391 |
5 |
143 |
46 |
2,760 |
352 |
5 |
|
8,125 |
672 |
4,327 |
880 |
2,153 |
201 |
818 |
224 |
302 |
257 |
1,748 |
493 |
73 |
157 |
220 |
172 |
79 |
28 |
639 |
36 |
0 |
0 |
86 |
44 |
22,051 |
3,569 |
| Q4 |
253 |
7 |
299 |
1 |
167 |
43 |
3,128 |
352 |
14 |
12 |
8,669 |
621 |
4,960 |
930 |
2,174 |
188 |
659 |
252 |
269 |
268 |
2,181 |
585 |
68 |
114 |
129 |
78 |
76 |
27 |
803 |
48 |
0 |
0 |
108 |
53 |
23,957 |
3,579 |
| 2014 |
Q1 |
270 |
10 |
303 |
1 |
143 |
56 |
2,932 |
455 |
11 |
7 |
8,340 |
603 |
4,782 |
1,218 |
2,307 |
235 |
544 |
219 |
281 |
225 |
1,744 |
614 |
64 |
83 |
171 |
126 |
73 |
32 |
801 |
42 |
0 |
0 |
88 |
76 |
22,854 |
4,002 |
| Q2 |
266 |
8 |
370 |
6 |
141 |
65 |
2,781 |
418 |
4 |
2 |
8,399 |
661 |
4,517 |
1,099 |
2,191 |
186 |
544 |
205 |
229 |
206 |
1,667 |
544 |
204 |
196 |
283 |
96 |
79 |
32 |
820 |
32 |
0 |
0 |
115 |
85 |
22,610 |
3,841 |
Source: Labour Market Regulatory Authority (LMRA), Expatriate Management System (EMS)
ANNEXED NOTE
1. Technical Notes and Definitions
This table shows the flow of renewed permits (or visas) that are given to foreigners by the LMRA. These renwed visas combine those given for regular and temporary workers, investors and dependents.
The LMRA Expatriate Management System (EMS) stores information and past history of sponsors and workers, and their dependents, within the scope of Law No. 19/2006 on regulating the labour market. The scope of the system covers regular, temporary and investor work visas for foreign workers, their dependents, in the commercial sector, the government sector and the non-commercial, non-government sector. It presently excludes domestic workers, and work visas for artists and certain other categories of workers in non-civilian organizations. It distinguishes four types of visas for operational purposes: regular work visas for workers with 24-month validity; temporary work visas issued for workers with 6-month validity; investor work visas issued for investors investing up to BD 100,000; and dependent visas issued for dependent members of eligible foreign workers.The system tracks visa applications, renewals, mobility of workers between employers and from one occupation to another as well as notification of termination and runaway workers, and in general all operations of LMRA including inspection and offence management. The system is updated continuously and linked with other labour-related databases of the Kingdom, including CIO, GDNPR, GOSI, PFC, CSB, Ministry of Labour (MoL), and Ministry of Industry and Commerce (MOIC).
Termination refers to an employer’s application to the LMRA announcing the end of employment of a foraign worker in theeconomic unit (CR/Branch)
Work Visa is a legal certificate to allow a foreign worker to enter the country for working purposes for a period of two years with the possibility of renewal.
Worker is a generic term that refers to an employed person in general, or to an employee, a self-employed, or a particular category of worker, such as full-time or part-time worker, depending on the context in which the term is used. Four major categories of workers in terms of their status in employment are employees, employers, own-account workers, and unpaid family workers.
* When there is a discrepancy between the calculated total and that shown in the LMRA original table (such as in Q2 2014 for Dependent visas), the calculated total is used.
2. Institution which provides data
Labour Market Regulatory Authority (LMRA).
3. Data availability
The LMRA publishes these data under its Bahrain Labour Market Indicators (BLMI) section. The BLMI dashboard can be found in: (http://blmi.lmra.bh/2014/03/mi_dashboard.xml). The general BLMI data with other non-LMRA sources can be found: (http://blmi.lmra.bh/2014/03/mi_data.xml)
Figures and results are often reported in tables in both PDF and Excel formats.
Data for this LMRA table for 2009 can be found here: (http://blmi.lmra.bh/2009/06/data/lmr/Table_37a.pdf), (http://blmi.lmra.bh/2009/09/data/lmr/Table_37a.pdf) and (http://blmi.lmra.bh/2009/12/data/lmr/Table_37a.pdf).
Data for 2010 can be found here: (http://blmi.lmra.bh/2010/03/data/ems/Table_37a.pdf), (http://blmi.lmra.bh/2010/06/data/ems/Table_37a.pdf), (http://blmi.lmra.bh/2010/09/data/ems/Table_37a.pdf) and (http://blmi.lmra.bh/2010/12/data/ems/Table_37a.pdf)
Data for 2011 can be found here: (http://blmi.lmra.bh/2011/03/data/ems/Table_37a.pdf), (http://blmi.lmra.bh/2011/06/data/ems/Table_37a.pdf), (http://blmi.lmra.bh/2011/09/data/ems/Table_37a.pdf) and (http://blmi.lmra.bh/2011/12/data/ems/Table_37a.pdf)
Data for 2012 can be found here: (http://blmi.lmra.bh/2012/03/data/ems/Table_37a.pdf), (http://blmi.lmra.bh/2012/06/data/ems/Table_37a.pdf), (http://blmi.lmra.bh/2012/09/data/ems/Table_37a.pdf) and (http://blmi.lmra.bh/2012/12/data/ems/Table_37a.pdf).
Data for 2013 can be found here: (http://blmi.lmra.bh/2013/03/data/ems/Table_37a.pdf), (http://blmi.lmra.bh/2013/06/data/ems/Table_37a.pdf), (http://blmi.lmra.bh/2013/09/data/ems/Table_37a.pdf) and (http://blmi.lmra.bh/2013/12/data/ems/Table_37a.pdf).
Data for 2014 can be found here: (http://blmi.lmra.bh/2014/03/data/ems/Table_37a.pdf) and (http://blmi.lmra.bh/2014/06/data/ems/Table_37a.pdf).
The definitions that the LMRA adopts for its data can be found in the Glossary section: (http://blmi.lmra.bh/mi_glossary.xml).
Date of access: September 2014
|
|
Agriculture, hunting and forestry |
Fishing |
Mining and quarrying |
Manufacturing |
Electricity, gas and water supply |
Construction |
Wholesale and retail trade, repair |
Hotels and restaurants |
Transport, storage, communication |
Financial intermediation |
Real estate, renting, business activities |
Public administration |
Education |
Health and social work |
Other social, personal services |
Extra-territorial organizations, bodies |
Not specified |
Total |
| 2009 |
Q2 |
158 |
46 |
91 |
2,960 |
2 |
6,200 |
3,875 |
1,337 |
471 |
470 |
1,457 |
11 |
245 |
45 |
334 |
0 |
523 |
18,225 |
| Q3 |
16 |
5 |
23 |
797 |
1 |
1,194 |
1,025 |
359 |
375 |
172 |
591 |
8 |
115 |
34 |
126 |
0 |
238 |
5,079 |
| Q4 |
13 |
14 |
37 |
1,222 |
8 |
1,820 |
1,784 |
466 |
202 |
268 |
625 |
3 |
77 |
25 |
165 |
0 |
198 |
6,927 |
| 2010 |
Q1 |
50 |
74 |
96 |
2,703 |
6 |
7,818 |
3,436 |
1,449 |
587 |
379 |
1,407 |
21 |
119 |
37 |
346 |
0 |
381 |
18,909 |
| Q2 |
52 |
70 |
52 |
2,562 |
1 |
6,518 |
3,596 |
1,492 |
877 |
475 |
1,645 |
34 |
297 |
65 |
371 |
0 |
553 |
18,660 |
| Q3 |
191 |
68 |
66 |
2,804 |
11 |
7,287 |
3,295 |
1,490 |
835 |
509 |
1,646 |
23 |
208 |
63 |
370 |
0 |
414 |
19,280 |
| Q4 |
123 |
171 |
56 |
2,641 |
1 |
6,931 |
3,818 |
1,467 |
770 |
427 |
1,499 |
27 |
85 |
82 |
391 |
0 |
74 |
18,563 |
| 2011 |
Q1 |
122 |
168 |
82 |
2,755 |
1 |
7,801 |
4,303 |
1,667 |
707 |
364 |
1,707 |
38 |
105 |
102 |
421 |
0 |
78 |
20,421 |
| Q2 |
156 |
136 |
98 |
2,907 |
9 |
7,646 |
4,088 |
1,725 |
638 |
496 |
2,126 |
168 |
288 |
105 |
413 |
0 |
114 |
21,113 |
| Q3 |
174 |
153 |
81 |
2,416 |
6 |
5,413 |
3,381 |
1,397 |
505 |
435 |
1,695 |
72 |
172 |
120 |
325 |
0 |
755 |
17,100 |
| Q4 |
134 |
151 |
73 |
2,377 |
7 |
6,849 |
3,579 |
1,449 |
560 |
359 |
1,383 |
108 |
101 |
97 |
337 |
1 |
606 |
18,171 |
| 2012 |
Q1 |
135 |
138 |
165 |
2,254 |
6 |
6,042 |
3,458 |
1,494 |
618 |
376 |
1,500 |
96 |
138 |
71 |
405 |
0 |
560 |
17,456 |
| Q2 |
120 |
112 |
78 |
2,418 |
11 |
5,615 |
3,728 |
1,501 |
637 |
473 |
1,548 |
291 |
286 |
95 |
366 |
0 |
366 |
17,645 |
| Q3 |
169 |
192 |
64 |
2,301 |
17 |
5,706 |
3,584 |
1,523 |
533 |
319 |
1,312 |
73 |
277 |
103 |
380 |
0 |
230 |
16,783 |
| Q4 |
149 |
211 |
108 |
2,725 |
19 |
7,983 |
4,256 |
1,801 |
590 |
386 |
1,730 |
60 |
174 |
119 |
502 |
0 |
276 |
21,089 |
| 2013 |
Q1 |
148 |
270 |
202 |
3,165 |
24 |
9,076 |
5,116 |
2,047 |
964 |
440 |
2,169 |
142 |
225 |
102 |
554 |
0 |
227 |
24,871 |
| Q2 |
140 |
274 |
233 |
3,252 |
84 |
7,991 |
5,226 |
2,004 |
1,105 |
559 |
2,321 |
363 |
466 |
85 |
639 |
0 |
183 |
24,925 |
| Q3 |
184 |
396 |
201 |
3,391 |
10 |
8,861 |
5,283 |
2,358 |
1,051 |
561 |
2,286 |
230 |
392 |
109 |
676 |
0 |
130 |
26,119 |
| Q4 |
260 |
300 |
231 |
3,717 |
91 |
9,357 |
5,930 |
2,363 |
915 |
539 |
2,804 |
182 |
207 |
103 |
852 |
0 |
161 |
28,012 |
| 2014 |
Q1 |
280 |
304 |
233 |
3,640 |
18 |
8,993 |
6,052 |
2,549 |
770 |
510 |
2,391 |
147 |
298 |
105 |
843 |
0 |
164 |
27,297 |
| Q2 |
274 |
376 |
234 |
3,434 |
10 |
9,563 |
5,719 |
2,380 |
756 |
439 |
2,267 |
400 |
379 |
111 |
899 |
0 |
200 |
27,441 |
Source: Labour Market Regulatory Authority (LMRA), Expatriate Management System (EMS)
ANNEXED NOTE
1. Technical Notes and Definitions
This table shows the flow of renewed permits (or visas) that are given to foreigners by the LMRA. These renwed visas combine those given for regular and temporary workers, investors and dependents.
The LMRA Expatriate Management System (EMS) stores information and past history of sponsors and workers, and their dependents, within the scope of Law No. 19/2006 on regulating the labour market. The scope of the system covers regular, temporary and investor work visas for foreign workers, their dependents, in the commercial sector, the government sector and the non-commercial, non-government sector. It presently excludes domestic workers, and work visas for artists and certain other categories of workers in non-civilian organizations. It distinguishes four types of visas for operational purposes: regular work visas for workers with 24-month validity; temporary work visas issued for workers with 6-month validity; investor work visas issued for investors investing up to BD 100,000; and dependent visas issued for dependent members of eligible foreign workers.The system tracks visa applications, renewals, mobility of workers between employers and from one occupation to another as well as notification of termination and runaway workers, and in general all operations of LMRA including inspection and offence management. The system is updated continuously and linked with other labour-related databases of the Kingdom, including CIO, GDNPR, GOSI, PFC, CSB, Ministry of Labour (MoL), and Ministry of Industry and Commerce (MOIC).
Termination refers to an employer’s application to the LMRA announcing the end of employment of a foraign worker in theeconomic unit (CR/Branch)
2. Institution which provides data
Labour Market Regulatory Authority (LMRA).
3. Data availability
The LMRA publishes these data under its Bahrain Labour Market Indicators (BLMI) section. The BLMI dashboard can be found in: (http://blmi.lmra.bh/2014/03/mi_dashboard.xml). The general BLMI data with other non-LMRA sources can be found: (http://blmi.lmra.bh/2014/03/mi_data.xml)
Figures and results are often reported in tables in both PDF and Excel formats.
Data for this LMRA table for 2009 can be found here: (http://blmi.lmra.bh/2009/06/data/lmr/Table_37a.pdf), (http://blmi.lmra.bh/2009/09/data/lmr/Table_37a.pdf) and (http://blmi.lmra.bh/2009/12/data/lmr/Table_37a.pdf).
Data for 2010 can be found here: (http://blmi.lmra.bh/2010/03/data/ems/Table_37a.pdf), (http://blmi.lmra.bh/2010/06/data/ems/Table_37a.pdf), (http://blmi.lmra.bh/2010/09/data/ems/Table_37a.pdf) and (http://blmi.lmra.bh/2010/12/data/ems/Table_37a.pdf)
Data for 2011 can be found here: (http://blmi.lmra.bh/2011/03/data/ems/Table_37a.pdf), (http://blmi.lmra.bh/2011/06/data/ems/Table_37a.pdf), (http://blmi.lmra.bh/2011/09/data/ems/Table_37a.pdf) and (http://blmi.lmra.bh/2011/12/data/ems/Table_37a.pdf)
Data for 2012 can be found here: (http://blmi.lmra.bh/2012/03/data/ems/Table_37a.pdf), (http://blmi.lmra.bh/2012/06/data/ems/Table_37a.pdf), (http://blmi.lmra.bh/2012/09/data/ems/Table_37a.pdf) and (http://blmi.lmra.bh/2012/12/data/ems/Table_37a.pdf).
Data for 2013 can be found here: (http://blmi.lmra.bh/2013/03/data/ems/Table_37a.pdf), (http://blmi.lmra.bh/2013/06/data/ems/Table_37a.pdf), (http://blmi.lmra.bh/2013/09/data/ems/Table_37a.pdf) and (http://blmi.lmra.bh/2013/12/data/ems/Table_37a.pdf).
Data for 2014 can be found here: (http://blmi.lmra.bh/2014/03/data/ems/Table_37a.pdf) and (http://blmi.lmra.bh/2014/06/data/ems/Table_37a.pdf).
The definitions that the LMRA adopts for its data can be found in the Glossary section: (http://blmi.lmra.bh/mi_glossary.xml).
Date of access: September 2014
|
|
Sector / Number of Employees |
|
|
Commercial |
Government |
Non Commercial Non Government |
|
|
0 -5 |
6 – 9 |
10 – 19 |
20 – 99 |
100 – 499 |
500+ |
Total |
0 -5 |
6 – 9 |
10 – 19 |
20 – 99 |
100 – 499 |
500+ |
Total |
0 -5 |
6 – 9 |
10 – 19 |
20 – 99 |
100 – 499 |
500+ |
Total |
| 2009 |
Q3 |
0 |
19 |
28 |
43 |
139 |
177 |
406 |
0 |
0 |
0 |
0 |
0 |
0 |
0 |
0 |
0 |
0 |
0 |
0 |
0 |
0 |
| Q4 |
12 |
3 |
33 |
66 |
109 |
359 |
582 |
0 |
0 |
0 |
0 |
0 |
0 |
0 |
0 |
0 |
0 |
0 |
0 |
0 |
0 |
| 2010 |
Q1 |
23 |
35 |
25 |
31 |
93 |
70 |
277 |
0 |
0 |
0 |
0 |
0 |
0 |
0 |
0 |
0 |
0 |
0 |
0 |
0 |
0 |
| Q2 |
0 |
11 |
23 |
129 |
30 |
137 |
330 |
0 |
0 |
0 |
0 |
0 |
0 |
0 |
0 |
0 |
0 |
0 |
0 |
0 |
0 |
| Q3 |
2 |
19 |
61 |
152 |
74 |
166 |
474 |
0 |
0 |
0 |
3 |
0 |
0 |
3 |
0 |
0 |
0 |
0 |
0 |
0 |
0 |
| Q4 |
2 |
7 |
25 |
63 |
73 |
207 |
377 |
0 |
0 |
0 |
1 |
0 |
0 |
1 |
0 |
0 |
0 |
0 |
0 |
0 |
0 |
| 2011 |
Q1 |
16 |
5 |
22 |
16 |
60 |
98 |
217 |
0 |
0 |
0 |
0 |
0 |
0 |
0 |
0 |
0 |
0 |
0 |
0 |
0 |
0 |
| Q2 |
8 |
4 |
2 |
57 |
158 |
151 |
380 |
0 |
0 |
0 |
0 |
0 |
0 |
0 |
0 |
0 |
0 |
0 |
0 |
0 |
0 |
| Q3 |
8 |
5 |
4 |
21 |
41 |
99 |
178 |
0 |
0 |
0 |
0 |
0 |
0 |
0 |
0 |
0 |
0 |
0 |
0 |
0 |
0 |
| Q4 |
4 |
7 |
53 |
32 |
34 |
228 |
358 |
0 |
0 |
0 |
0 |
0 |
0 |
0 |
0 |
0 |
0 |
0 |
0 |
0 |
0 |
| 2012 |
Q1 |
0 |
8 |
11 |
34 |
94 |
230 |
377 |
0 |
0 |
0 |
0 |
0 |
0 |
0 |
0 |
0 |
0 |
0 |
0 |
0 |
0 |
| Q2 |
0 |
25 |
5 |
53 |
120 |
234 |
437 |
0 |
0 |
0 |
0 |
0 |
0 |
0 |
0 |
0 |
0 |
0 |
0 |
0 |
0 |
| Q3 |
2 |
1 |
25 |
83 |
66 |
218 |
395 |
0 |
0 |
0 |
0 |
0 |
0 |
0 |
0 |
0 |
0 |
0 |
0 |
0 |
0 |
| Q4 |
2 |
8 |
23 |
85 |
114 |
217 |
449 |
0 |
0 |
0 |
0 |
0 |
0 |
0 |
0 |
0 |
0 |
0 |
0 |
0 |
0 |
| 2013 |
Q1 |
5 |
7 |
23 |
42 |
123 |
164 |
364 |
0 |
0 |
0 |
0 |
0 |
0 |
0 |
0 |
0 |
0 |
0 |
0 |
0 |
0 |
| Q2 |
1 |
7 |
5 |
30 |
59 |
108 |
210 |
0 |
0 |
0 |
0 |
0 |
0 |
0 |
0 |
0 |
0 |
0 |
0 |
0 |
0 |
| Q3 |
1 |
9 |
8 |
31 |
76 |
185 |
310 |
0 |
0 |
0 |
0 |
0 |
0 |
0 |
0 |
0 |
0 |
0 |
0 |
0 |
0 |
| Q4 |
0 |
6 |
11 |
29 |
53 |
158 |
257 |
0 |
0 |
0 |
0 |
0 |
0 |
0 |
0 |
0 |
0 |
0 |
0 |
0 |
0 |
| 2014 |
Q1 |
0 |
4 |
9 |
48 |
59 |
118 |
238 |
0 |
0 |
0 |
0 |
0 |
0 |
0 |
0 |
0 |
0 |
0 |
0 |
0 |
0 |
| Q2 |
3 |
0 |
18 |
29 |
20 |
62 |
132 |
0 |
0 |
0 |
0 |
0 |
0 |
0 |
0 |
0 |
0 |
0 |
0 |
0 |
0 |
Source: Labour Market Regulatory Authority (LMRA), Expatriate Management System (EMS)
ANNEXED NOTE
1. Technical Notes and Definitions
This table shows the flow of new permits (or visas) that are given to foreign temporary workers by the LMRA by the size of the establishment.
The LMRA Expatriate Management System (EMS) stores information and past history of sponsors and workers, and their dependents, within the scope of Law No. 19/2006 on regulating the labour market. The scope of the system covers regular, temporary and investor work visas for foreign workers, their dependents, in the commercial sector, the government sector and the non-commercial, non-government sector. It presently excludes domestic workers, and work visas for artists and certain other categories of workers in non-civilian organizations. It distinguishes four types of visas for operational purposes: regular work visas for workers with 24-month validity; temporary work visas issued for workers with 6-month validity; investor work visas issued for investors investing up to BD 100,000; and dependent visas issued for dependent members of eligible foreign workers.The system tracks visa applications, renewals, mobility of workers between employers and from one occupation to another as well as notification of termination and runaway workers, and in general all operations of LMRA including inspection and offence management. The system is updated continuously and linked with other labour-related databases of the Kingdom, including CIO, GDNPR, GOSI, PFC, CSB, Ministry of Labour (MoL), and Ministry of Industry and Commerce (MOIC).
Temporary Worker is a worker engaged to work in an enterprise for a short period of time, i.e. for less than two years and usually six months.
Work Visa is a legal certificate to allow a foreign worker to enter the country for working purposes for a period of two years with the possibility of renewal.
Worker is a generic term that refers to an employed person in general, or to an employee, a self-employed, or a particular category of worker, such as full-time or part-time worker, depending on the context in which the term is used. Four major categories of workers in terms of their status in employment are employees, employers, own-account workers, and unpaid family workers.
Size of establishment is the number of persons engaged in an establishment at a given period, including, in principle, all employees and unpaid family workers as well as any working proprietor. In practice, it refers to the total number of employees registered by anemployer at the responsible administrative agency.
2. Institution which provides data
Labour Market Regulatory Authority (LMRA).
3. Data availability
The LMRA publishes these data under its Bahrain Labour Market Indicators (BLMI) section. The BLMI dashboard can be found in: (http://blmi.lmra.bh/2014/03/mi_dashboard.xml). The general BLMI data with other non-LMRA sources can be found: (http://blmi.lmra.bh/2014/03/mi_data.xml)
Figures and results are often reported in tables in both PDF and Excel formats.
Data for this LMRA table for 2009 can be found here: (http://blmi.lmra.bh/2009/09/data/lmr/Table_36b.pdf) and (http://blmi.lmra.bh/2009/12/data/lmr/Table_36b.pdf).
Data for 2010 can be found here: (http://blmi.lmra.bh/2010/03/data/ems/Table_36b.pdf), (http://blmi.lmra.bh/2010/06/data/ems/Table_36b.pdf), (http://blmi.lmra.bh/2010/09/data/ems/Table_36b.pdf) and (http://blmi.lmra.bh/2010/12/data/ems/Table_36b.pdf).
Data for 2011 can be found here: (http://blmi.lmra.bh/2011/03/data/ems/Table_36b.pdf), (http://blmi.lmra.bh/2011/06/data/ems/Table_36b.pdf), (http://blmi.lmra.bh/2011/09/data/ems/Table_36b.pdf) and (http://blmi.lmra.bh/2011/12/data/ems/Table_36b.pdf).
Data for 2012 can be found here: (http://blmi.lmra.bh/2012/03/data/ems/Table_36b.pdf), (http://blmi.lmra.bh/2012/06/data/ems/Table_36b.pdf), (http://blmi.lmra.bh/2012/09/data/ems/Table_36b.pdf) and (http://blmi.lmra.bh/2012/12/data/ems/Table_36b.pdf).
Data for 2013 can be found here: (http://blmi.lmra.bh/2013/03/data/ems/Table_36b.pdf), (http://blmi.lmra.bh/2013/06/data/ems/Table_36b.pdf), (http://blmi.lmra.bh/2013/09/data/ems/Table_36b.pdf) and (http://blmi.lmra.bh/2013/12/data/ems/Table_36b.pdf).
Data for 2014 can be found here: (http://blmi.lmra.bh/2014/03/data/ems/Table_36b.pdf) and (http://blmi.lmra.bh/2014/06/data/ems/Table_36b.pdf).
The definitions that the LMRA adopts for its data can be found in the Glossary section: (http://blmi.lmra.bh/mi_glossary.xml).
Date of access: September 2014
|
|
Sector / Number of Employees |
|
|
Commercial |
Government |
Non Commercial Non Government |
|
|
0 -5 |
6 – 9 |
10 – 19 |
20 – 99 |
100 – 499 |
500+ |
Total |
0 -5 |
6 – 9 |
10 – 19 |
20 – 99 |
100 – 499 |
500+ |
Total |
0 -5 |
6 – 9 |
10 – 19 |
20 – 99 |
100 – 499 |
500+ |
Total |
| 2009 |
Q3 |
36 |
5 |
2 |
8 |
0 |
0 |
51 |
0 |
0 |
0 |
0 |
0 |
0 |
0 |
0 |
0 |
0 |
1 |
0 |
0 |
1 |
| Q4 |
50 |
8 |
5 |
1 |
0 |
0 |
64 |
0 |
0 |
0 |
0 |
0 |
0 |
0 |
1 |
0 |
0 |
0 |
0 |
0 |
1 |
| 2010 |
Q1 |
58 |
17 |
8 |
0 |
1 |
0 |
84 |
0 |
0 |
0 |
0 |
0 |
0 |
0 |
0 |
0 |
0 |
0 |
0 |
0 |
0 |
| Q2 |
64 |
22 |
10 |
8 |
1 |
1 |
106 |
0 |
0 |
0 |
0 |
0 |
0 |
0 |
0 |
0 |
0 |
0 |
0 |
0 |
0 |
| Q3 |
75 |
8 |
6 |
2 |
1 |
0 |
92 |
0 |
0 |
0 |
0 |
0 |
0 |
0 |
0 |
0 |
0 |
0 |
0 |
0 |
0 |
| Q4 |
129 |
20 |
5 |
10 |
1 |
0 |
165 |
0 |
0 |
0 |
0 |
0 |
0 |
0 |
0 |
0 |
1 |
0 |
0 |
0 |
1 |
| 2011 |
Q1 |
180 |
16 |
14 |
8 |
1 |
0 |
219 |
0 |
0 |
0 |
0 |
0 |
0 |
0 |
0 |
0 |
0 |
1 |
0 |
0 |
1 |
| Q2 |
144 |
16 |
7 |
16 |
4 |
2 |
189 |
0 |
0 |
0 |
0 |
0 |
0 |
0 |
0 |
0 |
0 |
0 |
0 |
0 |
0 |
| Q3 |
107 |
11 |
9 |
7 |
1 |
1 |
136 |
0 |
0 |
0 |
0 |
0 |
0 |
0 |
0 |
0 |
0 |
0 |
0 |
0 |
0 |
| Q4 |
118 |
14 |
6 |
4 |
0 |
0 |
142 |
0 |
0 |
0 |
0 |
0 |
0 |
0 |
1 |
0 |
0 |
0 |
0 |
0 |
1 |
| 2012 |
Q1 |
183 |
32 |
11 |
12 |
0 |
0 |
238 |
0 |
0 |
0 |
0 |
0 |
0 |
0 |
0 |
0 |
0 |
0 |
0 |
0 |
0 |
| Q2 |
187 |
26 |
13 |
16 |
2 |
0 |
244 |
0 |
0 |
0 |
0 |
0 |
0 |
0 |
0 |
0 |
0 |
0 |
0 |
0 |
0 |
| Q3 |
162 |
20 |
13 |
15 |
3 |
0 |
213 |
0 |
0 |
0 |
0 |
0 |
0 |
0 |
0 |
0 |
0 |
0 |
0 |
0 |
0 |
| Q4 |
213 |
13 |
12 |
12 |
2 |
0 |
252 |
0 |
0 |
0 |
0 |
0 |
0 |
0 |
0 |
0 |
0 |
1 |
0 |
0 |
1 |
| 2013 |
Q1 |
239 |
28 |
18 |
13 |
2 |
1 |
301 |
0 |
0 |
0 |
0 |
0 |
0 |
0 |
0 |
0 |
0 |
0 |
0 |
0 |
0 |
| Q2 |
221 |
25 |
15 |
15 |
1 |
0 |
277 |
0 |
0 |
0 |
0 |
0 |
0 |
0 |
0 |
0 |
0 |
1 |
0 |
0 |
1 |
| Q3 |
172 |
22 |
7 |
10 |
5 |
2 |
218 |
0 |
0 |
0 |
0 |
0 |
0 |
0 |
0 |
0 |
0 |
0 |
0 |
0 |
0 |
| Q4 |
221 |
18 |
15 |
13 |
1 |
0 |
268 |
0 |
0 |
0 |
0 |
0 |
0 |
0 |
1 |
0 |
0 |
0 |
0 |
0 |
1 |
| 2014 |
Q1 |
275 |
26 |
29 |
18 |
0 |
0 |
348 |
0 |
0 |
0 |
0 |
0 |
0 |
0 |
0 |
0 |
0 |
0 |
0 |
0 |
0 |
| Q2 |
299 |
36 |
11 |
23 |
4 |
0 |
373 |
0 |
0 |
0 |
0 |
0 |
0 |
0 |
0 |
0 |
0 |
0 |
0 |
0 |
0 |
Source: Labour Market Regulatory Authority (LMRA), Expatriate Management System (EMS)
ANNEXED NOTE
1. Technical Notes and Definitions
This table shows the flow of renewed permits (or visas) that are given to foreign investors by the LMRA by the size of the establishment.
The LMRA Expatriate Management System (EMS) stores information and past history of sponsors and workers, and their dependents, within the scope of Law No. 19/2006 on regulating the labour market. The scope of the system covers regular, temporary and investor work visas for foreign workers, their dependents, in the commercial sector, the government sector and the non-commercial, non-government sector. It presently excludes domestic workers, and work visas for artists and certain other categories of workers in non-civilian organizations. It distinguishes four types of visas for operational purposes: regular work visas for workers with 24-month validity; temporary work visas issued for workers with 6-month validity; investor work visas issued for investors investing up to BD 100,000; and dependent visas issued for dependent members of eligible foreign workers.The system tracks visa applications, renewals, mobility of workers between employers and from one occupation to another as well as notification of termination and runaway workers, and in general all operations of LMRA including inspection and offence management. The system is updated continuously and linked with other labour-related databases of the Kingdom, including CIO, GDNPR, GOSI, PFC, CSB, Ministry of Labour (MoL), and Ministry of Industry and Commerce (MOIC).
Investor work visas are issued for investors investing up to BD 100,000.
Size of establishment is the number of persons engaged in an establishment at a given period, including, in principle, all employees and unpaid family workers as well as any working proprietor. In practice, it refers to the total number of employees registered by anemployer at the responsible administrative agency.
2. Institution which provides data
Labour Market Regulatory Authority (LMRA).
3. Data availability
The LMRA publishes these data under its Bahrain Labour Market Indicators (BLMI) section. The BLMI dashboard can be found in: (http://blmi.lmra.bh/2014/03/mi_dashboard.xml). The general BLMI data with other non-LMRA sources can be found: (http://blmi.lmra.bh/2014/03/mi_data.xml)
Figures and results are often reported in tables in both PDF and Excel formats.
Data for this LMRA table for 2009 can be found here: (http://blmi.lmra.bh/2009/09/data/lmr/Table_36b.pdf) and (http://blmi.lmra.bh/2009/12/data/lmr/Table_36b.pdf).
Data for 2010 can be found here: (http://blmi.lmra.bh/2010/03/data/ems/Table_36b.pdf), (http://blmi.lmra.bh/2010/06/data/ems/Table_36b.pdf), (http://blmi.lmra.bh/2010/09/data/ems/Table_36b.pdf) and (http://blmi.lmra.bh/2010/12/data/ems/Table_36b.pdf).
Data for 2011 can be found here: (http://blmi.lmra.bh/2011/03/data/ems/Table_36b.pdf), (http://blmi.lmra.bh/2011/06/data/ems/Table_36b.pdf), (http://blmi.lmra.bh/2011/09/data/ems/Table_36b.pdf) and (http://blmi.lmra.bh/2011/12/data/ems/Table_36b.pdf).
Data for 2012 can be found here: (http://blmi.lmra.bh/2012/03/data/ems/Table_36b.pdf), (http://blmi.lmra.bh/2012/06/data/ems/Table_36b.pdf), (http://blmi.lmra.bh/2012/09/data/ems/Table_36b.pdf) and (http://blmi.lmra.bh/2012/12/data/ems/Table_36b.pdf).
Data for 2013 can be found here: (http://blmi.lmra.bh/2013/03/data/ems/Table_36b.pdf), (http://blmi.lmra.bh/2013/06/data/ems/Table_36b.pdf), (http://blmi.lmra.bh/2013/09/data/ems/Table_36b.pdf) and (http://blmi.lmra.bh/2013/12/data/ems/Table_36b.pdf).
Data for 2014 can be found here: (http://blmi.lmra.bh/2014/03/data/ems/Table_36b.pdf) and (http://blmi.lmra.bh/2014/06/data/ems/Table_36b.pdf).
The definitions that the LMRA adopts for its data can be found in the Glossary section: (http://blmi.lmra.bh/mi_glossary.xml).
Date of access: September 2014
|
Omanis |
Expatriates |
Total |
| Males |
Females |
Total |
Males |
Females |
Total |
Males |
Females |
Total |
| 1993 |
755,110 |
728,116 |
1,483,226 |
422,597 |
111,820 |
534,417 |
1,177,707 |
839,936 |
2,017,643 |
| 2003 |
900,540 |
881,018 |
1,781,558 |
412,699 |
146,558 |
559,257 |
1,313,239 |
1,027,576 |
2,340,815 |
| 2010 |
990,590 |
966,746 |
1,957,336 |
621,818 |
194,325 |
816,143 |
1,612,408 |
1,161,071 |
2,773,479 |
Source: Ministry of National Economy
ANNEXED NOTE
1. Technical Notes and Definitions
The table refers to the population recorded during census 2010.
The Ministry of National Economy of Oman has conducted three censuses in 1993, 2003 and 2010.
“The date of reference for census 2010 is December 12, 2010. Period of implemention: December 12 to 21, 2010. The Sultanate uses the de jure and the de facto approach in the enumeration.
For information on technical means used in Oman’s censuses, please see:
http://unstats.un.org/unsd/demographic/meetings/Conferences/Korea/2012/docs/s07-5-1-Oman.pdf
2. Institution which provides data
National Center for Statistics and Information (NCSI)
3. Data availability
The National Center for Statistics and Information (NCSI) processes and disseminates all statistical data of use to the public and to government action.
1993′ and 2003’s census results are not available online. However, they are quoted in recent publications released by NCSI (Annual Statistical Yearbooks, survey results, studies).
2010’s census results are available on NCSI’s website, in several thematic publications, in the “publications” section
http://www.ncsi.gov.om/NCSI_website/N_publications_ar.aspx
http://www.ncsi.gov.om/NCSI_website/N_publications.aspx
Some results are also available in the Ministry of National Economy’s database dedicated to 2010′ census:
http://85.154.248.117/MONE2010/#
The present data is taken from the following publication (p. 15):
http://www.ncsi.gov.om/NCSI_website/PublicationAttachment/MANPOWER2011%20(6).pdf
Last date of access: October 2014.
| |
Omanis |
Expatriates |
Total |
| 1993 |
1,483,226 |
534,417 |
2,017,643 |
| 2003 |
1,781,558 |
559,257 |
2,340,815 |
| 2010 |
1,957,336 |
816,143 |
2,773,479 |
Source: Ministry of National Economy
ANNEXED NOTE
1. Technical Notes and Definitions
The table refers to the population recorded during census 2010.
The Ministry of National Economy of Oman has conducted three censuses in 1993, 2003 and 2010.
“The date of reference for census 2010 is December 12, 2010. Period of implemention: December 12 to 21, 2010. The Sultanate uses the de jure and the de facto approach in the enumeration.
“
For information on technical means used in Oman’s censuses, please see:
http://unstats.un.org/unsd/demographic/meetings/Conferences/Korea/2012/docs/s07-5-1-Oman.pdf
2. Institution which provides data
National Center for Statistics and Information (NCSI)
3. Data availability
The National Center for Statistics and Information (NCSI) processes and disseminates all statistical data of use to the public and to government action.
1993′ and 2003’s census results are not available online. However, they are quoted in recent publications released by NCSI (Annual Statistical Yearbooks, survey results, studies).
2010’s census results are available on NCSI’s website, in several thematic publications, in the “publications” section
http://www.ncsi.gov.om/NCSI_website/N_publications_ar.aspx
http://www.ncsi.gov.om/NCSI_website/N_publications.aspx
Some results are also available in the Ministry of National Economy’s database dedicated to 2010′ census:
http://85.154.248.117/MONE2010/#
The present data is taken from the following publication (p. 15):
http://www.ncsi.gov.om/NCSI_website/PublicationAttachment/MANPOWER2011%20(6).pdf
Last date of access: October 2014.
|
Bahraini |
Non-Bahraini |
Total |
|
males |
females |
total |
males |
females |
total |
males |
females |
total |
| Never Married |
28,113 |
12,485 |
40,598 |
293,734 |
66,460 |
360,194 |
321,847 |
78,945 |
400,792 |
| Married |
89,222 |
39,810 |
129,032 |
143,047 |
21,861 |
164,908 |
232,269 |
61,671 |
293,940 |
| Divorced |
2,771 |
2,968 |
5,739 |
375 |
311 |
686 |
3,146 |
3,279 |
6,425 |
| Widowed |
444 |
1,219 |
1,663 |
238 |
149 |
387 |
682 |
1,368 |
2,050 |
| Total |
120,550 |
56,482 |
177,032 |
437,394 |
88,781 |
526,175 |
557,944 |
145,263 |
703,207 |
Source: Central Informatics Organisation (CIO) – Bahrain
ANNEXED NOTE
1. Technical Notes and Definitions
| census year |
reference period |
implementing institution |
implementation method |
population covered |
| 1981 |
November 16 |
Ministry of Finance
Statistics Department |
field interviews |
de jure, de facto |
all individuals (nationals and non-nationals): 1- present within the country’s borders during time of reference; 2- residing in Bahrain irrespective of where are they at census times |
| 1991 |
April 6 |
Central Informatics Organisation (CIO) |
field interviews |
| 2001 |
April 7 |
field interviews; characteristics of population in collective households (among which labour camps) was obtained from sponsors |
| 2010 |
April 27 |
based on administrative records |
Nationality of the person is defined by the passport used to enter the country. A Non-Bahrainis is considered as such depending on the passport used to enter the country (or obtain the visa).
Period of reference for employment refers to the 7-days period prior to the survey.
Population of reference in table: all employed individuals (nationals and non-nationals) aged 15 and above
Overall definitions for the Censuses of 1991 are not available on the CIO website. However, the 2001 censuses used the following definitions:
Employed population includes population in the following categories:
Employer is defined as a person who operates his / her own economic enterprise or engages independently in a profession for trade and hires one or more employees.
Self-Employed is defined as a person who operates his / her own economic enterprise or engages independently in a profession or trade and hires nobody.
Paid Employee is defined as a person who works for a public or private organization and receives regular wages/salary whether in cash or in kind.
Marital Status refers to the personal status with regard to marriage/divorce laws and customs.
Never married refers to to a person who has never been in marital life before or a person who has a civil contract but is not living with a partner.
Married refers to a person who is legally married with respect to marriage laws and customs.
Divorced refers to an ever married person but not currently married, whose marriage was dissolved by divorce.
Widowed refers to an ever married person but not currently married, whose marriage has been dissolved by the death of the spouse.
2. Institution which provides data
Central Informatics Organization, known prior to 2001 as the “Central Statistics Organisation” under the Ministry of Cabinet Affairs
3. Data availability
Figures and results reported here are available on the Central Informatics Organisation (CIO) website. For Arabic version: (http://www.cio.gov.bh/cio_ara/default.aspx). For the English version: (http://www.cio.gov.bh/CIO_ENG/Default.aspx)
The CIO often provides its figures and estimates through tables in PDF format.
The 2010′ census figures on the labor force can be found: (http://www.cio.gov.bh/cio_eng/SubDetailed.aspx?subcatid=493)
This 2010′ census data is deduced from a larger set of tables that also include employment status.
This 2010′ census data for Bahraini employed population can be found: (http://www.cio.gov.bh/cio_ara/English/Publications/Census/LabourForce/4.12.2.pdf)
Figures for non-Bahraini employed population can be found: (http://www.cio.gov.bh/cio_ara/English/Publications/Census/LabourForce/4.12.3.pdf)
These figures can also be found in the Statistical Abstract 2000, Labor Force Section: (http://www.cio.gov.bh/CIO_ENG/SubDetailed.aspx?subcatid=324)
Further detailed data and definitions on the 2010 Census can be found on the census’s separate website: (http://www.census2010.gov.bh/results.php)
Date of access: July 2014
|
Bahraini |
Non-Bahraini |
Total |
|
males |
females |
total |
males |
females |
total |
males |
females |
total |
| Never Married |
24,543 |
8,731 |
33,274 |
54,396 |
17,000 |
71,396 |
78,939 |
25,731 |
104,670 |
| Married |
58,899 |
15,747 |
74,646 |
91,883 |
15,527 |
107,410 |
150,782 |
31,274 |
182,056 |
| Divorced |
1,292 |
1,211 |
2,503 |
235 |
608 |
843 |
1,527 |
1,819 |
3,346 |
| Widowed |
186 |
378 |
564 |
90 |
652 |
742 |
276 |
1,030 |
1,306 |
| Total |
84,920 |
26,067 |
110,987 |
146,604 |
33,787 |
180,391 |
231,524 |
59,854 |
291,378 |
Source: Central Informatics Organisation (CIO) – Bahrain
ANNEXED NOTE
1. Technical Notes and Definitions
| census year |
reference period |
implementing institution |
implementation method |
population covered |
| 1981 |
November 16 |
Ministry of Finance
Statistics Department |
field interviews |
de jure, de facto |
all individuals (nationals and non-nationals): 1- present within the country’s borders during time of reference; 2- residing in Bahrain irrespective of where are they at census times |
| 1991 |
April 6 |
Central Informatics Organisation (CIO) |
field interviews |
| 2001 |
April 7 |
field interviews; characteristics of population in collective households (among which labour camps) was obtained from sponsors |
| 2010 |
April 27 |
based on administrative records |
Nationality of the person is defined by the passport used to enter the country. A Non-Bahrainis is considered as such depending on the passport used to enter the country (or obtain the visa).
Period of reference for employment refers to the 7-days period prior to the survey.
Population of reference in table: all employed individuals (nationals and non-nationals) aged 15 and above
Employed population includes population in the following categories:
Employer is defined as a person who operates his / her own economic enterprise or engages independently in a profession for trade and hires one or more employees.
Self-Employed is defined as a person who operates his / her own economic enterprise or engages independently in a profession or trade and hires nobody.
Paid Employee is defined as a person who works for a public or private organization and receives regular wages/salary whether in cash or in kind.
Unpaid Employee is defined as a person works for an enterprise, usually owned by some of his relatives, without receiving regulat wages/salary whether in cash or in kind.
Marital Status refers to the personal status with regard to marriage/divorce laws and customs.
Never married refers to to a person who has never been in marital life before or a person who has a civil contract but is not living with a partner.
Married refers to a person who is legally married with respect to marriage laws and customs.
Divorced refers to an ever married person but not currently married, whose marriage was dissolved by divorce.
Widowed refers to an ever married person but not currently married, whose marriage has been dissolved by the death of the spouse.
2. Institution which provides data
Central Informatics Organization, known prior to 2001 as the “Central Statistics Organisation” under the Ministry of Cabinet Affairs.
3. Data availability
Figures and results reported here are available on the Central Informatics Organisation (CIO) website. For Arabic version: (http://www.cio.gov.bh/cio_ara/default.aspx). For the English version: (http://www.cio.gov.bh/CIO_ENG/Default.aspx)
The CIO often provides its figures and estimates through tables in PDF format.
Data and figures for the 1991′ and 2001′ censuses regarding the labor force can be found: (http://www.cio.gov.bh/cio_eng/SubDetailed.aspx?subcatid=378)
This 2001′ census data can be found: (http://www.cio.gov.bh/cio_ara/English/Publications/Statistical%20Abstract/ABS2009/CH11/5.pdf)
These figures can also be found in the Statistical Abstract 2001, Labor Force section: (http://www.cio.gov.bh/CIO_ENG/SubDetailed.aspx?subcatid=173)
Date of access: July 2014
|
Bahraini |
Non-Bahraini |
Total |
|
males |
females |
total |
males |
females |
total |
males |
females |
total |
| Never Married |
17,538 |
4,371 |
21,909 |
35,250 |
10,574 |
45,824 |
52,788 |
14,945 |
67,733 |
| Married |
45,660 |
7,984 |
53,644 |
77,483 |
10,141 |
87,624 |
123,143 |
18,125 |
141,268 |
| Divorced |
601 |
554 |
1,155 |
205 |
441 |
646 |
806 |
995 |
1,801 |
| Widowed |
284 |
276 |
560 |
133 |
575 |
708 |
417 |
851 |
1,268 |
| Total |
64,083 |
13,185 |
77,268 |
113,071 |
21,731 |
134,802 |
177,154 |
34,916 |
212,070 |
Source: Central Informatics Organisation (CIO) – Bahrain
ANNEXED NOTE
1. Technical Notes and Definitions
| census year |
reference period |
implementing institution |
implementation method |
population covered |
| 1981 |
November 16 |
Ministry of Finance
Statistics Department |
field interviews |
de jure, de facto |
all individuals (nationals and non-nationals): 1- present within the country’s borders during time of reference; 2- residing in Bahrain irrespective of where are they at census times |
| 1991 |
April 6 |
Central Informatics Organisation (CIO) |
field interviews |
| 2001 |
April 7 |
field interviews; characteristics of population in collective households (among which labour camps) was obtained from sponsors |
| 2010 |
April 27 |
based on administrative records |
Nationality of the person is defined by the passport used to enter the country. A Non-Bahrainis is considered as such depending on the passport used to enter the country (or obtain the visa).
Period of reference for employment refers to the 7-days period prior to the survey.
Population of reference in table: all employed individuals (nationals and non-nationals) aged 15 and above
Employed population includes population in the following categories:
Employer is defined as a person who operates his / her own economic enterprise or engages independently in a profession for trade and hires one or more employees.
Self-Employed is defined as a person who operates his / her own economic enterprise or engages independently in a profession or trade and hires nobody.
Paid Employee is defined as a person who works for a public or private organization and receives regular wages/salary whether in cash or in kind.
Unpaid Employee is defined as a person works for an enterprise, usually owned by some of his relatives, without receiving regulat wages/salary whether in cash or in kind.
Marital Status refers to the personal status with regard to marriage/divorce laws and customs.
Never married refers to to a person who has never been in marital life before or a person who has a civil contract but is not living with a partner.
Married refers to a person who is legally married with respect to marriage laws and customs.
Divorced refers to an ever married person but not currently married, whose marriage was dissolved by divorce.
Widowed refers to an ever married person but not currently married, whose marriage has been dissolved by the death of the spouse.
2. Institution which provides data
Central Informatics Organization, known prior to 2001 as the “Central Statistics Organisation” under the Ministry of Cabinet Affairs
3. Data availability
Figures and results reported here are available on the Central Informatics Organisation (CIO) website. For Arabic version: (http://www.cio.gov.bh/cio_ara/default.aspx). For the English version: (http://www.cio.gov.bh/CIO_ENG/Default.aspx)
The CIO often provides its figures and estimates through tables in PDF format.
Data and figures for the 1991′ and 2001′ censuses regarding the labor force can be found: (http://www.cio.gov.bh/cio_eng/SubDetailed.aspx?subcatid=378)
This 1991′ census data can be found: (http://www.cio.gov.bh/cio_ara/English/Publications/Statistical%20Abstract/ABS2009/CH11/5.pdf)
Figures for this 1991′ census table can found in the Statistical Abstract 2000, Labor Force section: (http://www.cio.gov.bh/CIO_ENG/SubDetailed.aspx?subcatid=172)
These figures can also be found in the Statistical Abstract 2001, Labor Force section: (http://www.cio.gov.bh/CIO_ENG/SubDetailed.aspx?subcatid=173)
Date of access: June 2014
|
Bahraini |
Non-Bahraini |
Total |
|
males |
females |
total |
males |
females |
total |
males |
females |
total |
| Illiterate/ Read only |
2,257 |
1,119 |
3,376 |
18,298 |
7,798 |
26,096 |
20,555 |
8,917 |
29,472 |
| Read & Write |
11,475 |
3,744 |
15,219 |
133,919 |
37,316 |
171,235 |
145,394 |
41,060 |
186,454 |
| Primary |
13,365 |
2,266 |
15,631 |
77,666 |
7,394 |
85,060 |
91,031 |
9,660 |
100,691 |
| Preparatory |
20,168 |
5,194 |
25,362 |
64,165 |
11,489 |
75,654 |
84,333 |
16,683 |
101,016 |
| Secondary |
50,278 |
23,375 |
73,653 |
68,114 |
8,141 |
76,255 |
118,392 |
31,516 |
149,908 |
| Above Secondary/ Diploma |
10,831 |
7,579 |
18,410 |
39,449 |
9,408 |
48,857 |
50,280 |
16,987 |
67,267 |
| BSC or BA. |
9,882 |
11,546 |
21,428 |
24,488 |
4,831 |
29,319 |
34,370 |
16,377 |
50,747 |
| High Diploma |
766 |
796 |
1,562 |
7,177 |
1,641 |
8,818 |
7,943 |
2,437 |
10,380 |
| Masters |
1,128 |
734 |
1,862 |
3,196 |
502 |
3,698 |
4,324 |
1,236 |
5,560 |
| Doctorate |
383 |
112 |
495 |
909 |
198 |
1,107 |
1,292 |
310 |
1,602 |
| Unknown |
17 |
17 |
34 |
13 |
63 |
76 |
30 |
80 |
110 |
| Total |
120,550 |
56,482 |
177,032 |
437,394 |
88,781 |
526,175 |
557,944 |
145,263 |
703,207 |
Source: Central Informatics Organisation (CIO) – Bahrain
ANNEXED NOTE
1. Technical Notes and Definitions
| census year |
reference period |
implementing institution |
implementation method |
population covered |
| 1981 |
November 16 |
Ministry of Finance
Statistics Department |
field interviews |
de jure, de facto |
all individuals (nationals and non-nationals): 1- present within the country’s borders during time of reference; 2- residing in Bahrain irrespective of where are they at census times |
| 1991 |
April 6 |
Central Informatics Organisation (CIO) |
field interviews |
| 2001 |
April 7 |
field interviews; characteristics of population in collective households (among which labour camps) was obtained from sponsors |
| 2010 |
April 27 |
based on administrative records |
Nationality of the person is defined by the passport used to enter the country. A Non-Bahrainis is considered as such depending on the passport used to enter the country (or obtain the visa).
Period of reference for employment refers to the 7-days period prior to the survey.
Population of reference in table: all employed individuals (nationals and non-nationals) aged 15 and above
Employed population includes population in the following categories:
Employer is defined as a person who operates his / her own economic enterprise or engages independently in a profession for trade and hires one or more employees.
Self-Employed is defined as a person who operates his / her own economic enterprise or engages independently in a profession or trade and hires nobody.
Paid Employee is defined as a person who works for a public or private organization and receives regular wages/salary whether in cash or in kind.
Illiterate refers to a person who cannot read or write a brief, simple sentence about his/her daily life in any language.
Read Only refers to a person who can read only but cannot write, such as those persons who have learned to read the Quran.
Read and Write refers to a person who is 10 years or older and passed one of the classes within primary education, but has not obtained any certificate of any formal education. This is a person who has can write and read simple sentences about his/her daily life in any language. This includes a blind person who can read and write using Braille.
Primary education accepts children who are six years old and above, and comprises of six grades (1-6 grade). It also includes adults who are enrolled in literacy classes.
Preparatory education accepts students who have completed and passed primary education, and comprises of three grades (7-9 grades). It also includes adults who are enrolled in advanced fellow-up education.
Secondary education accepts students who have completed and passed primary education, and comprises of three grades (10-12 grades). It also includes adults who are enrolled in advanced strengthening classes.
Above Secondary/Diploma education accepts students who have completed and passed secondary education, and comprises of one or two additional years. The student obtains a post-Secondary diploma that is officially certified.
B.Sc. or B.A. education accepts students who have completed and passed secondary or above secondary/diploma education.
High Diploma education accepts students who have completed and passed Bachelor’s degree, and could be one or two years. The student obtains an officially certified diploma.
Master’s education accepts students who have completed a Bachelor’s or high diploma degrees, and could comprise of one or more years. The student obtains upon graduation a Master’s degree.
Doctorate education accepts students who have obtained a Bachelor’s degree with experience, or Master’s degree or High Diploma, and comprises of two or more years. The student obtains a doctorate upon completion.
Not Stated or Unknown refers to a case where the interviewer does not know or is not certain of the highest level of education of the interviewee.
2. Institution which provides data
Central Informatics Organization, known prior to 2001 as the “Central Statistics Organisation” under the Ministry of Cabinet Affairs.
3. Data availability
Figures and results reported here are available on the Central Informatics Organisation (CIO) website. For Arabic version: (http://www.cio.gov.bh/cio_ara/default.aspx). For the English version: (http://www.cio.gov.bh/CIO_ENG/Default.aspx)
The CIO often provides its figures and estimates through tables in PDF format.
The 2010′ census figures on the labor force can be found: (http://www.cio.gov.bh/cio_eng/SubDetailed.aspx?subcatid=493)
This 2010′ census data is deduced from a larger set of tables that also include employment status.
This 2010′ census data for Bahraini males can be found: (http://www.cio.gov.bh/cio_ara/English/Publications/Census/LabourForce/4.11.5.pdf)
Figures for Bahraini females can be found: (http://www.cio.gov.bh/cio_ara/English/Publications/Census/LabourForce/4.11.6.pdf)
Figures for Non-Bahraini males can be found: (http://www.cio.gov.bh/cio_ara/English/Publications/Census/LabourForce/4.11.8.pdf)
Figures for Non-Bahraini females can be found: (http://www.cio.gov.bh/cio_ara/English/Publications/Census/LabourForce/4.11.9.pdf)
Further detailed data and definitions on the 2010 Census can be found on the census’s separate website: (http://www.census2010.gov.bh/results.php)
Date of access: June 2014
|
Bahraini |
Non-Bahraini |
Total |
|
males |
females |
total |
males |
females |
total |
males |
females |
total |
| Never Married |
14,733 |
3,757 |
18,490 |
25,325 |
2,848 |
28,173 |
40,058 |
6,605 |
46,663 |
| Married |
33,817 |
3,512 |
37,329 |
48,278 |
3,606 |
51,884 |
82,095 |
7,118 |
89,213 |
| Divorced |
518 |
360 |
878 |
191 |
146 |
337 |
709 |
506 |
1,215 |
| Widowed |
236 |
245 |
481 |
123 |
197 |
320 |
359 |
442 |
801 |
| Total |
49,304 |
7,874 |
57,178 |
73,917 |
6,797 |
80,714 |
123,221 |
14,671 |
137,892 |
Source: Central Informatics Organisation (CIO) – Bahrain
ANNEXED NOTE
1. Technical Notes and Definitions
| census year |
reference period |
implementing institution |
implementation method |
population covered |
| 1981 |
November 16 |
Ministry of Finance
Statistics Department |
field interviews |
de jure, de facto |
all individuals (nationals and non-nationals): 1- present within the country’s borders during time of reference; 2- residing in Bahrain irrespective of where are they at census times |
| 1991 |
April 6 |
Central Informatics Organisation (CIO) |
field interviews |
| 2001 |
April 7 |
field interviews; characteristics of population in collective households (among which labour camps) was obtained from sponsors |
| 2010 |
April 27 |
based on administrative records |
Nationality of the person is defined by the passport used to enter the country. A Non-Bahrainis is considered as such depending on the passport used to enter the country (or obtain the visa).
Period of reference for employment refers to the 7-days period prior to the survey.
Population of reference in table: all employed individuals (nationals and non-nationals) aged 15 and above
Employed population includes population in the following categories:
Employer is defined as a person who operates his / her own economic enterprise or engages independently in a profession for trade and hires one or more employees.
Self-Employed is defined as a person who operates his / her own economic enterprise or engages independently in a profession or trade and hires nobody.
Paid Employee is defined as a person who works for a public or private organization and receives regular wages/salary whether in cash or in kind.
Unpaid Employee is defined as a person works for an enterprise, usually owned by some of his relatives, without receiving regulat wages/salary whether in cash or in kind.
Marital Status refers to the personal status with regard to marriage/divorce laws and customs.
Overall definitions for the Censuses of 1981 are not available on the CIO website. However, the 2001 censuses used the following definitions:
Never married refers to to a person who has never been in marital life before or a person who has a civil contract but is not living with a partner.
Married refers to a person who is legally married with respect to marriage laws and customs.
Divorced refers to an ever married person but not currently married, whose marriage was dissolved by divorce.
Widowed refers to an ever married person but not currently married, whose marriage has been dissolved by the death of the spouse.
2. Institution which provides data
Central Informatics Organization, known prior to 2001 as the “Central Statistics Organisation” under the Ministry of Cabinet Affairs.
3. Data availability
Figures and results reported here are available on the Central Informatics Organisation (CIO) website. For Arabic version: (http://www.cio.gov.bh/cio_ara/default.aspx). For the English version: (http://www.cio.gov.bh/CIO_ENG/Default.aspx)
The CIO often provides its figures and estimates through tables in PDF format.
Figures for this 1981′ census table can found in the Statistical Abstract 2000, Labor Force section: (http://www.cio.gov.bh/CIO_ENG/SubDetailed.aspx?subcatid=172)
Date of access: June 2014
|
Bahraini |
Non-Bahraini |
Total |
|
males |
females |
total |
males |
females |
total |
males |
females |
total |
| Illiterate/ Read only |
3,606 |
545 |
4,151 |
22,077 |
6,640 |
28,717 |
25,683 |
7,185 |
32,868 |
| Read & Write |
4,972 |
577 |
5,549 |
21,427 |
9,562 |
30,989 |
26,399 |
10,139 |
36,538 |
| Primary |
10,814 |
1,054 |
11,868 |
14,487 |
2,734 |
17,221 |
25,301 |
3,788 |
29,089 |
| Preparatory |
13,979 |
1,690 |
15,669 |
16,827 |
2,639 |
19,466 |
30,806 |
4,329 |
35,135 |
| Above Preparatory |
2,225 |
295 |
2,520 |
5,473 |
680 |
6,153 |
7,698 |
975 |
8,673 |
| Secondary |
32,656 |
9,602 |
42,258 |
25,430 |
4,856 |
30,286 |
58,086 |
14,458 |
72,544 |
| Above Secondary / Diploma |
4,609 |
3,564 |
8,173 |
5,176 |
1,911 |
7,087 |
9,785 |
5,475 |
15,260 |
| BSC or BA. |
7,377 |
6,281 |
13,658 |
9,118 |
2,309 |
11,427 |
16,495 |
8,590 |
25,085 |
| High Diploma |
2,689 |
1,782 |
4,471 |
2,576 |
777 |
3,353 |
5,265 |
2,559 |
7,824 |
| Master’s |
1,513 |
497 |
2,010 |
1,884 |
365 |
2,249 |
3,397 |
862 |
4,259 |
| Doctorate |
471 |
178 |
649 |
398 |
78 |
476 |
869 |
256 |
1,125 |
| Unknown |
9 |
2 |
11 |
21,731 |
1,236 |
22,967 |
21,740 |
1,238 |
22,978 |
| Total |
84,920 |
26,067 |
110,987 |
146,604 |
33,787 |
180,391 |
231,524 |
59,854 |
291,378 |
Source: Central Informatics Organisation (CIO) – Bahrain
ANNEXED NOTE
1. Technical Notes and Definitions
| census year |
reference period |
implementing institution |
implementation method |
population covered |
| 1981 |
November 16 |
Ministry of Finance
Statistics Department |
field interviews |
de jure, de facto |
all individuals (nationals and non-nationals): 1- present within the country’s borders during time of reference; 2- residing in Bahrain irrespective of where are they at census times |
| 1991 |
April 6 |
Central Informatics Organisation (CIO) |
field interviews |
| 2001 |
April 7 |
field interviews; characteristics of population in collective households (among which labour camps) was obtained from sponsors |
| 2010 |
April 27 |
based on administrative records |
Nationality of the person is defined by the passport used to enter the country. A Non-Bahrainis is considered as such depending on the passport used to enter the country (or obtain the visa).
Period of reference for employment refers to the 7-days period prior to the survey.
Population of reference in table: all employed individuals (nationals and non-nationals) aged 15 and above
Employed population includes population in the following categories:
Employer is defined as a person who operates his / her own economic enterprise or engages independently in a profession for trade and hires one or more employees.
Self-Employed is defined as a person who operates his / her own economic enterprise or engages independently in a profession or trade and hires nobody.
Paid Employee is defined as a person who works for a public or private organization and receives regular wages/salary whether in cash or in kind.
Unpaid Employee is defined as a person works for an enterprise, usually owned by some of his relatives, without receiving regulat wages/salary whether in cash or in kind.
Primary education comprises a total of six grades (1-6) and is generally the beginning of systematic apprenticeship of reading, writing mathematics and other subjects.
Preparatory education comprises a total of three grades (7-9).
Secondary education comprises of the last three grades of the schooling system (10-12) prior to graduation.
2. Institution which provides data
Central Informatics Organization, known prior to 2001 as the “Central Statistics Organisation” under the Ministry of Cabinet Affairs.
3. Data availability
Figures and results reported here are available on the Central Informatics Organisation (CIO) website. For Arabic version: (http://www.cio.gov.bh/cio_ara/default.aspx). For the English version: (http://www.cio.gov.bh/CIO_ENG/Default.aspx)
The CIO often provides its figures and estimates through tables in PDF format.
Figures of this 2001′ census table can also be found, divided into Bahraini and non-Bahraini employed population in: (http://www.cio.gov.bh/cio_eng/SubDetailed.aspx?subcatid=378)
Date of access: July 2014
| |
Bahraini |
Non Bahraini |
| |
Employer |
Sel-Employed |
Paid Employee |
Employer |
Paid Employee |
| |
males |
females |
total |
males |
females |
total |
males |
females |
total |
males |
females |
total |
males |
females |
total |
| Illiterate/ Read only |
618 |
272 |
890 |
407 |
40 |
447 |
1,232 |
807 |
2,039 |
135 |
13 |
148 |
18,163 |
7,785 |
25,948 |
| Read & Write |
964 |
344 |
1,308 |
728 |
73 |
801 |
9,783 |
3,327 |
13,110 |
453 |
53 |
506 |
133,466 |
37,263 |
170,729 |
| Primary |
592 |
196 |
788 |
507 |
47 |
554 |
12,266 |
2,023 |
14,289 |
176 |
13 |
189 |
77,490 |
7,381 |
84,871 |
| Preparatory |
794 |
436 |
1,230 |
599 |
84 |
683 |
18,775 |
4,674 |
23,449 |
268 |
42 |
310 |
63,897 |
11,447 |
75,344 |
| Secondary |
1,758 |
1,195 |
2,953 |
790 |
146 |
936 |
47,730 |
22,034 |
69,764 |
570 |
90 |
660 |
67,544 |
8,051 |
75,595 |
| Above Secondary/Diploma |
455 |
255 |
710 |
128 |
30 |
158 |
10,248 |
7,294 |
17,542 |
341 |
63 |
404 |
39,108 |
9,345 |
48,453 |
| BSC or BA. |
281 |
96 |
377 |
41 |
17 |
58 |
9,560 |
11,433 |
20,993 |
414 |
63 |
477 |
24,074 |
4,768 |
28,842 |
| High Diploma |
39 |
9 |
48 |
8 |
0 |
8 |
719 |
787 |
1,506 |
73 |
9 |
82 |
7,104 |
1,632 |
8,736 |
| Masters |
49 |
15 |
64 |
8 |
1 |
9 |
1,071 |
718 |
1,789 |
76 |
12 |
88 |
3,120 |
490 |
3,610 |
| Doctorate |
16 |
4 |
20 |
5 |
0 |
5 |
362 |
108 |
470 |
30 |
4 |
34 |
879 |
194 |
1,073 |
| Unknown |
2 |
2 |
4 |
1 |
0 |
1 |
14 |
15 |
29 |
1 |
0 |
1 |
12 |
63 |
75 |
| Total |
5,568 |
2,824 |
8,392 |
3,222 |
438 |
3,660 |
111,760 |
53,220 |
164,980 |
2,537 |
362 |
2,899 |
434,857 |
88,419 |
523,276 |
Source: Central Informatics Organisation (CIO) – Bahrain
ANNEXED NOTE
1. Technical Notes and Definitions
| census year |
reference period |
implementing institution |
implementation method |
population covered |
| 1981 |
November 16 |
Ministry of Finance
Statistics Department Ministry of Finance
Statistics Department |
field interviews |
de jure, de facto |
all individuals (nationals and non-nationals): 1- present within the country’s borders during time of reference; 2- residing in Bahrain irrespective of where are they at census times |
| 1991 |
April 6 |
Central Informatics Organisation (CIO) |
field interviews |
| 2001 |
April 7 |
field interviews; characteristics of population in collective households (among which labour camps) was obtained from sponsors |
| 2010 |
April 27 |
based on administrative records |
Nationality of the person is defined by the passport used to enter the country. A Non-Bahrainis is considered as such depending on the passport used to enter the country (or obtain the visa). Nationality of the person is defined by the passport used to enter the country. A Non-Bahrainis is considered as such depending on the passport used to enter the country (or obtain the visa).
Employer is defined as a person (15 years or older) who operates his / her own economic enterprise or engages independently in a profession or trade and hires one or more employees with or without cash or in-kind payment.Employer is defined as a person (15 years or older) who operates his / her own economic enterprise or engages independently in a profession or trade and hires one or more employees with or without cash or in-kind payment.
Self-Employed is defined as a person (15 years or older) who operates his / her own economic enterprise or engages independently in a profession or trade and hires nobody.Self-Employed is defined as a person (15 years or older) who operates his / her own economic enterprise or engages independently in a profession or trade and hires nobody.
Paid Employee is defined as a person (15 years or older) who works for a public or private organization and has received at the time of the census a full or part salary, whether in cash or in kind.Paid Employee is defined as a person (15 years or older) who works for a public or private organization and has received at the time of the census a full or part salary, whether in cash or in kind.
Illiterate refers to a person who cannot read or write a brief, simple sentence about his/her daily life in any language.
Read Only refers to a person who can read only but cannot write, such as those persons who have learned to read the Quran.
Read and Write refers to a person who is 10 years or older and passed one of the classes within primary education, but has not obtained any certificate of any formal education. This is a person who has can write and read simple sentences about his/her daily life in any language. This includes a blind person who can read and write using Braille. Read and Write refers to a person who is 10 years or older and passed one of the classes within primary education, but has not obtained any certificate of any formal education. This is a person who has can write and read simple sentences about his/her daily life in any language. This includes a blind person who can read and write using Braille.
Primary education accepts children who are six years old and above, and comprises of six grades (1-6 grade). It also includes adults who are enrolled in literacy classes.
Preparatory education accepts students who have completed and passed primary education, and comprises of three grades (7-9 grades). It also includes adults who are enrolled in advanced fellow-up education. Preparatory education accepts students who have completed and passed primary education, and comprises of three grades (7-9 grades). It also includes adults who are enrolled in advanced fellow-up education.
Secondary education accepts students who have completed and passed primary education, and comprises of three grades (10-12 grades). It also includes adults who are enrolled in advanced strengthening classes.Secondary education accepts students who have completed and passed primary education, and comprises of three grades (10-12 grades). It also includes adults who are enrolled in advanced strengthening classes.
Above Secondary/Diploma education accepts students who have completed and passed secondary education, and comprises of one or two additional years. The student obtains a post-Secondary diploma that is officially certified.
B.Sc. or B.A. education accepts students who have completed and passed secondary or above secondary/diploma education.
High Diploma education accepts students who have completed and passed Bachelor’s degree, and could be one or two years. The student obtains an officially certified diploma.
Master’s education accepts students who have completed a Bachelor’s or high diploma degrees, and could comprise of one or more years. The student obtains upon graduation a Master’s degree.
Doctorate education accepts students who have obtained a Bachelor’s degree with experience, or Master’s degree or High Diploma, and comprises of two or more years. The student obtains a doctorate upon completion.
Not Stated or Unknown refers to a case where the interviewer does not know or is not certain of the highest level of education of the interviewee.
2. Institution which provides data
Central Informatics Organization, known prior to 2001 as the “Central Statistics Organisation” under the Ministry of Cabinet Affairs.
3. Data availability
Figures and results reported here are available on the Central Informatics Organisation (CIO) website. For Arabic version: (http://www.cio.gov.bh/cio_ara/default.aspx). For the English version: (http://www.cio.gov.bh/CIO_ENG/Default.aspx)
The CIO often provides its figures and estimates through tables in PDF format
The 2010′ census figures on the labor force can be found: (http://www.cio.gov.bh/cio_eng/SubDetailed.aspx?subcatid=493)
This 2010′ census data for Bahraini males can be found: (http://www.cio.gov.bh/cio_ara/English/Publications/Census/LabourForce/4.11.5.pdf)
Figures for Bahraini females can be found: (http://www.cio.gov.bh/cio_ara/English/Publications/Census/LabourForce/4.11.6.pdf)
Figures for Non-Bahraini males can be found: (http://www.cio.gov.bh/cio_ara/English/Publications/Census/LabourForce/4.11.8.pdf)
Figures for Non-Bahraini females can be found: (http://www.cio.gov.bh/cio_ara/English/Publications/Census/LabourForce/4.11.9.pdf)
Further detailed data and definitions on the 2010 Census can be found on the census’s separate website: (http://www.census2010.gov.bh/results.php)
Date of access: June 2014
|
Bahraini |
Non-Bahraini |
Total |
|
males |
females |
total |
males |
females |
total |
males |
females |
total |
| Illiterate/ Read only |
7,183 |
467 |
7,650 |
11,188 |
1,799 |
12,987 |
18,371 |
2,266 |
20,637 |
| Read & Write |
8,315 |
280 |
8,595 |
27,441 |
5,415 |
32,856 |
35,756 |
5,695 |
41,451 |
| Primary |
9,875 |
415 |
10,290 |
19,485 |
1,989 |
21,474 |
29,360 |
2,404 |
31,764 |
| Preparatory |
8,541 |
563 |
9,104 |
13,076 |
1,919 |
14,995 |
21,617 |
2,482 |
24,099 |
| Above Preparatory |
1,408 |
114 |
1,522 |
4,677 |
672 |
5,349 |
6,085 |
786 |
6,871 |
| Secondary |
19,129 |
5,361 |
24,490 |
20,646 |
4,218 |
24,864 |
39,775 |
9,579 |
49,354 |
| Above Secondary / Diploma |
3,252 |
2,186 |
5,438 |
4,784 |
2,160 |
6,944 |
8,036 |
4,346 |
12,382 |
| BSC or BA. |
4,403 |
2,945 |
7,348 |
7,936 |
2,558 |
10,494 |
12,339 |
5,503 |
17,842 |
| High Diploma |
1,097 |
641 |
1,738 |
1,714 |
434 |
2,148 |
2,811 |
1,075 |
3,886 |
| Master’s |
593 |
157 |
750 |
1,206 |
235 |
1,441 |
1,799 |
392 |
2,191 |
| Doctorate |
218 |
50 |
268 |
350 |
54 |
404 |
568 |
104 |
672 |
| Unknown |
69 |
6 |
75 |
568 |
278 |
846 |
637 |
284 |
921 |
| Total |
64,083 |
13,185 |
77,268 |
113,071 |
21,731 |
134,802 |
177,154 |
34,916 |
212,070 |
Source: Central Informatics Organisation (CIO) – Bahrain
ANNEXED NOTE
1. Technical Notes and Definitions
| census year |
reference period |
implementing institution |
implementation method |
population covered |
| 1981 |
November 16 |
Ministry of Finance
Statistics Department |
field interviews |
de jure, de facto |
all individuals (nationals and non-nationals): 1- present within the country’s borders during time of reference; 2- residing in Bahrain irrespective of where are they at census times |
| 1991 |
April 6 |
Central Informatics Organisation (CIO) |
field interviews |
| 2001 |
April 7 |
field interviews; characteristics of population in collective households (among which labour camps) was obtained from sponsors |
| 2010 |
April 27 |
based on administrative records |
Nationality of the person is defined by the passport used to enter the country. A Non-Bahrainis is considered as such depending on the passport used to enter the country (or obtain the visa).
Period of reference for employment refers to the 7-days period prior to the survey.
Population of reference in table: all employed individuals (nationals and non-nationals) aged 15 and above
Overall definitions for the Censuses of 1991 are not available on the CIO website. However, the 2001 censuses used the following definitions:
Employed population includes population in the following categories:
Employer is defined as a person who operates his / her own economic enterprise or engages independently in a profession for trade and hires one or more employees.
Self-Employed is defined as a person who operates his / her own economic enterprise or engages independently in a profession or trade and hires nobody.
Paid Employee is defined as a person who works for a public or private organization and receives regular wages/salary whether in cash or in kind.
Unpaid Employee is defined as a person works for an enterprise, usually owned by some of his relatives, without receiving regulat wages/salary whether in cash or in kind.
Primary education comprises a total of six grades (1-6) and is generally the beginning of systematic apprenticeship of reading, writing mathematics and other subjects.
Preparatory education comprises a total of three grades (7-9).
Secondary education comprises of the last three grades of the schooling system (10-12) prior to graduation.
Classification of educational levels are encoded in line with the International Standard Classification of Education (ISCED) of the United Nations Educational, Scientific and Cultural Organization (UNESCO), as noted by the CIO.
2. Institution which provides data
Central Informatics Organization, known prior to 2001 as the “Central Statistics Organisation” under the Ministry of Cabinet Affairs.
3. Data availability
Figures and results reported here are available on the Central Informatics Organisation (CIO) website. For Arabic version: (http://www.cio.gov.bh/cio_ara/default.aspx). For the English version: (http://www.cio.gov.bh/CIO_ENG/Default.aspx)
The CIO often provides its figures and estimates through tables in PDF format.
Figures of this 1991′ census table can be found in the Statistical Abstract 2000, Labor Force section: (http://www.cio.gov.bh/CIO_ENG/SubDetailed.aspx?subcatid=172)
General information on the classifications used under the CIO can be found: (http://www.cio.gov.bh/cio_eng/SubDetailed.aspx?subcatid=278)
Information on the ISCED educational calassification under the UNESCO can be found: (http://www.uis.unesco.org/Education/Pages/international-standard-classification-of-education.aspx)
Date of access: July 2014
|
Bahraini |
Non-Bahraini |
Total |
|
males |
females |
total |
males |
females |
total |
males |
females |
total |
| Illiterate/ Read only |
13,528 |
631 |
14,159 |
16,304 |
906 |
17,210 |
29,832 |
1,537 |
31,369 |
| Read & Write |
10,339 |
287 |
10,626 |
20,036 |
1,554 |
21,590 |
30,375 |
1,841 |
32,216 |
| Primary |
6,990 |
438 |
7,428 |
8,572 |
394 |
8,966 |
15,562 |
832 |
16,394 |
| Preparatory |
5,719 |
692 |
6,411 |
7,113 |
433 |
7,546 |
12,832 |
1,125 |
13,957 |
| Above Preparatory |
0 |
0 |
0 |
0 |
0 |
0 |
0 |
0 |
0 |
| Secondary |
10,805 |
4,920 |
15,725 |
16,474 |
2,605 |
19,079 |
27,279 |
7,525 |
34,804 |
| Above Secondary / Diploma |
0 |
0 |
0 |
0 |
0 |
0 |
0 |
0 |
0 |
| BSC or BA. |
1,668 |
864 |
2,532 |
4,624 |
788 |
5,412 |
6,292 |
1,652 |
7,944 |
| High Diploma |
250 |
41 |
291 |
785 |
112 |
897 |
1,035 |
153 |
1,188 |
| Master’s |
0 |
0 |
0 |
0 |
0 |
0 |
0 |
0 |
0 |
| Doctorate |
0 |
0 |
0 |
0 |
0 |
0 |
0 |
0 |
0 |
| Unknown |
5 |
1 |
6 |
9 |
5 |
14 |
14 |
6 |
20 |
| Total |
49,304 |
7,874 |
57,178 |
73,917 |
6,797 |
80,714 |
123,221 |
14,671 |
137,892 |
Source: Central Informatics Organisation (CIO) – Bahrain
ANNEXED NOTE
1. Technical Notes and Definitions
| census year |
reference period |
implementing institution |
implementation method |
population covered |
| 1981 |
November 16 |
Ministry of Finance
Statistics Department |
field interviews |
de jure, de facto |
all individuals (nationals and non-nationals): 1- present within the country’s borders during time of reference; 2- residing in Bahrain irrespective of where are they at census times |
| 1991 |
April 6 |
Central Informatics Organisation (CIO) |
field interviews |
| 2001 |
April 7 |
field interviews; characteristics of population in collective households (among which labour camps) was obtained from sponsors |
| 2010 |
April 27 |
based on administrative records |
Nationality of the person is defined by the passport used to enter the country. A Non-Bahrainis is considered as such depending on the passport used to enter the country (or obtain the visa).
Period of reference for employment refers to the 7-days period prior to the survey.
Population of reference in table: all employed individuals (nationals and non-nationals) aged 15 and above
Employed population includes population in the following categories:
Employer is defined as a person who operates his / her own economic enterprise or engages independently in a profession for trade and hires one or more employees.
Self-Employed is defined as a person who operates his / her own economic enterprise or engages independently in a profession or trade and hires nobody.
Paid Employee is defined as a person who works for a public or private organization and receives regular wages/salary whether in cash or in kind.
Unpaid Employee is defined as a person works for an enterprise, usually owned by some of his relatives, without receiving regulat wages/salary whether in cash or in kind.
Primary education comprises a total of six grades (1-6) and is generally the beginning of systematic apprenticeship of reading, writing mathematics and other subjects.
Preparatory education comprises a total of three grades (7-9).
Secondary education comprises of the last three grades of the schooling system (10-12) prior to graduation.
Classification of educational levels are encoded in line with the International Standard Classification of Education (ISCED) of the United Nations Educational, Scientific and Cultural Organization (UNESCO), as noted by the CIO.
2. Institution which provides data
Central Informatics Organization, known prior to 2001 as the “Central Statistics Organisation” under the Ministry of Cabinet Affairs.
3. Data availability
Figures and results reported here are available on the Central Informatics Organisation (CIO) website. For Arabic version: (http://www.cio.gov.bh/cio_ara/default.aspx). For the English version: (http://www.cio.gov.bh/CIO_ENG/Default.aspx)
The CIO often provides its figures and estimates through tables in PDF format.
Figures of this 1981′ census table can be found in the Statistical Abstract 2000, Labor Force section: (http://www.cio.gov.bh/CIO_ENG/SubDetailed.aspx?subcatid=172)
General information on the classifications used under the CIO can be found: (http://www.cio.gov.bh/cio_eng/SubDetailed.aspx?subcatid=278)
Information on the ISCED educational calassification under the UNESCO can be found: (http://www.uis.unesco.org/Education/Pages/international-standard-classification-of-education.aspx)
Date of access: July 2014
|
Bahraini |
Non-Bahraini |
|
Employer |
Self-Employed |
Paid Employee |
Employer |
Paid Employee |
|
males |
females |
total |
males |
females |
total |
males |
females |
total |
males |
females |
total |
males |
females |
total |
| Never Married |
715 |
194 |
909 |
339 |
39 |
378 |
27,059 |
12,252 |
39,311 |
1,095 |
119 |
1,214 |
292,639 |
66,341 |
358,980 |
| Married |
4,533 |
2,248 |
6,781 |
2,743 |
339 |
3,082 |
81,946 |
37,223 |
119,169 |
1,413 |
226 |
1,639 |
141,634 |
21,635 |
163,269 |
| Divorced |
190 |
102 |
292 |
94 |
27 |
121 |
2,487 |
2,839 |
5,326 |
20 |
6 |
26 |
355 |
305 |
660 |
| Widowed |
130 |
280 |
410 |
46 |
33 |
79 |
268 |
906 |
1,174 |
9 |
11 |
20 |
229 |
138 |
367 |
| Total |
5,568 |
2,824 |
8,392 |
3,222 |
438 |
3,660 |
111,760 |
53,220 |
164,980 |
2,537 |
362 |
2,899 |
434,857 |
88,419 |
523,276 |
Source: Central Informatics Organisation (CIO) – Bahrain
ANNEXED NOTE
1. Technical Notes and Definitions
| census year |
reference period |
implementing institution |
implementation method |
population covered |
| 1981 |
November 16 |
Ministry of Finance
Statistics Department |
field interviews |
de jure, de facto |
all individuals (nationals and non-nationals): 1- present within the country’s borders during time of reference; 2- residing in Bahrain irrespective of where are they at census times |
| 1991 |
April 6 |
Central Informatics Organisation (CIO) |
field interviews |
| 2001 |
April 7 |
field interviews; characteristics of population in collective households (among which labour camps) was obtained from sponsors |
| 2010 |
April 27 |
based on administrative records |
Nationality of the person is defined by the passport used to enter the country. A Non-Bahrainis is considered as such depending on the passport used to enter the country (or obtain the visa).
Marital Status refers to the personal status with regard to marriage/divorce laws and customs.
Never married refers to to a person who has never been in marital life before or a person who has a civil contract but is not living with a partner.
Married refers to a person who is legally married with respect to marriage laws and customs.
Divorced refers to an ever married person but not currently married, whose marriage was dissolved by divorce.
Widowed refers to an ever married person but not currently married, whose marriage has been dissolved by the death of the spouse.
Employer is defined as a person (15 years or older) who operates his / her own economic enterprise or engages independently in a profession or trade and hires one or more employees with or without cash or in-kind payment.
Self-Employed is defined as a person (15 years or older) who operates his / her own economic enterprise or engages independently in a profession or trade and hires nobody.
Paid Employee is defined as a person (15 years or older) who works for a public or private organization and has received at the time of the census a full or part salary, whether in cash or in kind.
2. Institution which provides data
Central Informatics Organization, known prior to 2001 as the “Central Statistics Organisation” under the Ministry of Cabinet Affairs.
3. Data availability
Figures and results reported here are available on the Central Informatics Organisation (CIO) website. For Arabic version: (http://www.cio.gov.bh/cio_ara/default.aspx). For the English version: (http://www.cio.gov.bh/CIO_ENG/Default.aspx)
The CIO often provides its figures and estimates through tables in PDF format.
The 2010′ census figures on the labor force can be found: (http://www.cio.gov.bh/cio_eng/SubDetailed.aspx?subcatid=493)
This 2010′ census data for Bahraini employed population can be found: (http://www.cio.gov.bh/cio_ara/English/Publications/Census/LabourForce/4.12.2.pdf)
Figures for non-Bahraini employed population can be found: (http://www.cio.gov.bh/cio_ara/English/Publications/Census/LabourForce/4.12.3.pdf)
Further detailed data and definitions on the 2010 Census can be found on the census’s separate website: (http://www.census2010.gov.bh/results.php)
Date of access: June 2014
|
Bahraini |
Non-Bahraini |
|
Employer |
Self-Employed |
Paid Employee |
Employer |
Paid Employee |
|
males |
females |
total |
males |
females |
total |
males |
females |
total |
males |
females |
total |
males |
females |
total |
| 15 – 19 |
11 |
0 |
11 |
29 |
2 |
31 |
1,712 |
414 |
2,126 |
2 |
0 |
2 |
750 |
208 |
958 |
| 20 – 24 |
141 |
81 |
222 |
129 |
15 |
144 |
14,396 |
5,999 |
20,395 |
96 |
13 |
109 |
36,110 |
12,008 |
48,118 |
| 25 – 29 |
336 |
267 |
603 |
192 |
40 |
232 |
18,705 |
10,835 |
29,540 |
269 |
42 |
311 |
101,205 |
20,132 |
121,337 |
| 30 – 34 |
668 |
466 |
1,134 |
300 |
41 |
341 |
16,952 |
9,534 |
26,486 |
383 |
72 |
455 |
89,639 |
17,535 |
107,174 |
| 35 – 39 |
821 |
652 |
1,473 |
251 |
79 |
330 |
13,515 |
7,029 |
20,544 |
427 |
89 |
516 |
73,436 |
14,610 |
88,046 |
| 40 – 44 |
903 |
780 |
1,683 |
273 |
87 |
360 |
12,679 |
5,941 |
18,620 |
455 |
92 |
547 |
54,767 |
10,726 |
65,493 |
| 45 – 49 |
63 |
1 |
64 |
280 |
69 |
349 |
12,841 |
6,000 |
18,841 |
66 |
5 |
71 |
36,317 |
7,197 |
43,514 |
| 50 – 54 |
77 |
1 |
78 |
268 |
30 |
298 |
10,241 |
4,404 |
14,645 |
57 |
0 |
57 |
26,134 |
3,751 |
29,885 |
| 55 – 59 |
55 |
1 |
56 |
366 |
20 |
386 |
6,883 |
2,138 |
9,021 |
21 |
0 |
21 |
12,476 |
1,639 |
14,115 |
| 60 – 64 |
41 |
1 |
42 |
342 |
6 |
348 |
3,011 |
835 |
3,846 |
10 |
1 |
11 |
3,461 |
480 |
3,941 |
| 65+ years |
2,452 |
574 |
3,026 |
792 |
49 |
841 |
825 |
91 |
916 |
751 |
48 |
799 |
562 |
133 |
695 |
| Total |
5,568 |
2,824 |
8,392 |
3,222 |
438 |
3,660 |
111,760 |
53,220 |
164,980 |
2,537 |
362 |
2,899 |
434,857 |
88,419 |
523,276 |
Source: Central Informatics Organisation (CIO) – Bahrain
ANNEXED NOTE
1. Technical Notes and Definitions
| census year |
reference period |
implementing institution |
implementation method |
population covered |
| 1981 |
November 16 |
Ministry of Finance
Statistics Department |
field interviews |
de jure, de facto |
all individuals (nationals and non-nationals): 1- present within the country’s borders during time of reference; 2- residing in Bahrain irrespective of where are they at census times |
| 1991 |
April 6 |
Central Informatics Organisation (CIO) |
field interviews |
| 2001 |
April 7 |
field interviews; characteristics of population in collective households (among which labour camps) was obtained from sponsors |
| 2010 |
April 27 |
based on administrative records |
Nationality of the person is defined by the passport used to enter the country. A Non-Bahrainis is considered as such depending on the passport used to enter the country (or obtain the visa).
Period of reference for employment refers to the 7-days period prior to the survey.
Population of reference in table: all employed individuals (nationals and non-nationals) aged 15 and above
Employed population includes population in the following categories:
Employer, defined as a person (15 years or older) who operates his / her own economic enterprise or engages independently in a profession or trade and hires one or more employees with or without cash or in-kind payment.
Self-Employed, defined as a person (15 years or older) who operates his / her own economic enterprise or engages independently in a profession or trade and hires nobody.
Paid Employee, defined as a person (15 years or older) who works for a public or private organization and has received at the time of the census a full or part salary, whether in cash or in kind.
2. Institution which provides data
Central Informatics Organization, known prior to 2001 as the “Central Statistics Organisation” under the Ministry of Cabinet Affairs.
3. Data availability
Figures and results reported here are available on the Central Informatics Organisation (CIO) website. For Arabic version: (http://www.cio.gov.bh/cio_ara/default.aspx). For the English version: (http://www.cio.gov.bh/CIO_ENG/Default.aspx)
The CIO often provides its figures and estimates through tables in PDF format
The 2010′ census figures on the labor force can be found: (http://www.cio.gov.bh/cio_eng/SubDetailed.aspx?subcatid=493)
This 2010′ census data for Bahraini males can be found: (http://www.cio.gov.bh/cio_ara/English/Publications/Census/LabourForce/4.10.5.pdf)
Figures for Bahraini females can be found: (http://www.cio.gov.bh/cio_ara/English/Publications/Census/LabourForce/4.10.6.pdf)
Figures for Non-Bahraini males can be found: (http://www.cio.gov.bh/cio_ara/English/Publications/Census/LabourForce/4.10.8.pdf)
Figures for Non-Bahraini females can be found: (http://www.cio.gov.bh/cio_ara/English/Publications/Census/LabourForce/4.10.9.pdf)
Further detailed data and definitions on the 2010 Census can be found on the census’s separate website: (http://www.census2010.gov.bh/results.php)
Date of access: June 2014
|
Bahraini |
Non-Bahraini |
Total |
|
males |
females |
total |
males |
females |
total |
males |
females |
total |
| Employer |
5,568 |
2,824 |
8,392 |
2,537 |
362 |
2,899 |
8,105 |
3,186 |
11,291 |
| Self-Employed |
3,222 |
438 |
3,660 |
0 |
0 |
0 |
3,222 |
438 |
3,660 |
| Paid Employee |
111,760 |
53,220 |
164,980 |
434,857 |
88,419 |
523,276 |
546,617 |
141,639 |
688,256 |
| Total |
120,550 |
56,482 |
177,032 |
437,394 |
88,781 |
526,175 |
557,944 |
145,263 |
703,207 |
Source: Central Informatics Organisation (CIO) – Bahrain
ANNEXED NOTE
1. Technical Notes and Definitions
| census year |
reference period |
implementing institution |
implementation method |
population covered |
| 1981 |
November 16 |
Ministry of Finance
Statistics Department |
field interviews |
de jure, de facto |
all individuals (nationals and non-nationals): 1- present within the country’s borders during time of reference; 2- residing in Bahrain irrespective of where are they at census times |
| 1991 |
April 6 |
Central Informatics Organisation (CIO) |
field interviews |
| 2001 |
April 7 |
field interviews; characteristics of population in collective households (among which labour camps) was obtained from sponsors |
| 2010 |
April 27 |
based on administrative records |
Nationality of the person is defined by the passport used to enter the country. A Non-Bahrainis is considered as such depending on the passport used to enter the country (or obtain the visa).
Period of reference for employment refers to the 7-days period prior to the survey.
Population of reference in table: all employed individuals (nationals and non-nationals) aged 15 and above
Employed population includes population in the following categories:
Employer, defined as a person (15 years or older) who operates his / her own economic enterprise or engages independently in a profession or trade and hires one or more employees with or without cash or in-kind payment.
Self-Employed, defined as a person (15 years or older) who operates his / her own economic enterprise or engages independently in a profession or trade and hires nobody.
Paid Employee, defined as a person (15 years or older) who works for a public or private organization and has received at the time of the census a full or part salary, whether in cash or in kind.
2. Institution which provides data
Central Informatics Organization, known prior to 2001 as the “Central Statistics Organisation” under the Ministry of Cabinet Affairs
3. Data availability
Figures and results reported here are available on the Central Informatics Organisation (CIO) website. For Arabic version: (http://www.cio.gov.bh/cio_ara/default.aspx). For the English version: (http://www.cio.gov.bh/CIO_ENG/Default.aspx)
The CIO often provides its figures and estimates through tables in PDF format
The 2010′ census figures on the labor force can be found: (http://www.cio.gov.bh/cio_eng/SubDetailed.aspx?subcatid=493)
This 2010′ census data for Bahraini males can be found: (http://www.cio.gov.bh/cio_ara/English/Publications/Census/LabourForce/4.10.5.pdf)
Figures for Bahraini females can be found: (http://www.cio.gov.bh/cio_ara/English/Publications/Census/LabourForce/4.10.6.pdf)
Figures for Non-Bahraini males can be found: (http://www.cio.gov.bh/cio_ara/English/Publications/Census/LabourForce/4.10.8.pdf)
Figures for Non-Bahraini females can be found: (http://www.cio.gov.bh/cio_ara/English/Publications/Census/LabourForce/4.10.9.pdf)
Further detailed data and definitions on the 2010 Census can be found on the census’s separate website: (http://www.census2010.gov.bh/results.php)
Date of access: June 2014
|
Bahraini |
Non-Bahraini |
Total |
|
males |
females |
total |
males |
females |
total |
males |
females |
total |
| Employer |
4,737 |
815 |
5,552 |
637 |
47 |
684 |
5,374 |
862 |
6,236 |
| Self-Employed |
3,617 |
184 |
3,801 |
655 |
21 |
676 |
4,272 |
205 |
4,477 |
| Paid Employee |
76,520 |
25,038 |
101,558 |
145,285 |
33,714 |
178,999 |
221,805 |
58,752 |
280,557 |
| Unpaid Employee |
46 |
30 |
76 |
27 |
5 |
32 |
73 |
35 |
108 |
| Total |
84,920 |
26,067 |
110,987 |
146,604 |
33,787 |
180,391 |
231,524 |
59,854 |
291,378 |
Source: Central Informatics Organisation (CIO) – Bahrain
ANNEXED NOTE
1. Technical Notes and Definitions
| census year |
reference period |
implementing institution |
implementation method |
population covered |
| 1981 |
November 16 |
Ministry of Finance
Statistics Department |
field interviews |
de jure, de facto |
all individuals (nationals and non-nationals): 1- present within the country’s borders during time of reference; 2- residing in Bahrain irrespective of where are they at census times |
| 1991 |
April 6 |
Central Informatics Organisation (CIO) |
field interviews |
| 2001 |
April 7 |
field interviews; characteristics of population in collective households (among which labour camps) was obtained from sponsors |
| 2010 |
April 27 |
based on administrative records |
Nationality of the person is defined by the passport used to enter the country. A Non-Bahrainis is considered as such depending on the passport used to enter the country (or obtain the visa).
Period of reference for employment refers to the 7-days period prior to the survey.
Population of reference in table: all employed individuals (nationals and non-nationals) aged 15 and above
Employed population includes population in the following categories:
Employer is defined as a person who operates his / her own economic enterprise or engages independently in a profession for trade and hires one or more employees.
Self-Employed is defined as a person who operates his / her own economic enterprise or engages independently in a profession or trade and hires nobody.
Paid Employee is defined as a person who works for a public or private organization and receives regular wages/salary whether in cash or in kind.
Unpaid Employee is defined as a person works for an enterprise, usually owned by some of his relatives, without receiving regulat wages/salary whether in cash or in kind.
2. Institution which provides data
Central Informatics Organization, known prior to 2001 as the “Central Statistics Organisation” under the Ministry of Cabinet Affairs
3. Data availability
Figures and results reported here are available on the Central Informatics Organisation (CIO) website. For Arabic version: (http://www.cio.gov.bh/cio_ara/default.aspx). For the English version: (http://www.cio.gov.bh/CIO_ENG/Default.aspx)
The CIO often provides its figures and estimates through tables in PDF format
Census figures for 1991 and 2001 regarding the labor force can be found: (http://www.cio.gov.bh/cio_eng/SubDetailed.aspx?subcatid=378)
These 2001 census figures can be found: (http://www.cio.gov.bh/cio_ara/English/Publications/Statistical%20Abstract/ABS2009/CH11/7.pdf)
They can also be found in the Statistical Abstract 2001, Labor Force section: (http://www.cio.gov.bh/CIO_ENG/SubDetailed.aspx?subcatid=1730 )
Date of access: July 2014
|
Bahraini |
Non-Bahraini |
Total |
|
males |
females |
total |
males |
females |
total |
males |
females |
total |
| Employer |
3,767 |
193 |
3,960 |
531 |
23 |
554 |
4,298 |
216 |
4,514 |
| Self-Employed |
5,950 |
121 |
6,071 |
942 |
32 |
974 |
6,892 |
153 |
7,045 |
| Paid Employee |
54,252 |
12,863 |
67,115 |
111,561 |
21,668 |
133,229 |
165,813 |
34,531 |
200,344 |
| Unpaid Employee |
114 |
8 |
122 |
37 |
8 |
45 |
151 |
16 |
167 |
| Total |
64,083 |
13,185 |
77,268 |
113,071 |
21,731 |
134,802 |
177,154 |
34,916 |
212,070 |
Source: Central Informatics Organisation (CIO) – Bahrain
ANNEXED NOTE
1. Technical Notes and Definitions
| census year |
reference period |
implementing institution |
implementation method |
population covered |
| 1981 |
November 16 |
Ministry of Finance
Statistics Department |
field interviews |
de jure, de facto |
all individuals (nationals and non-nationals): 1- present within the country’s borders during time of reference; 2- residing in Bahrain irrespective of where are they at census times |
| 1991 |
April 6 |
Central Informatics Organisation (CIO) |
field interviews |
| 2001 |
April 7 |
field interviews; characteristics of population in collective households (among which labour camps) was obtained from sponsors |
| 2010 |
April 27 |
based on administrative records |
Nationality of the person is defined by the passport used to enter the country. A Non-Bahrainis is considered as such depending on the passport used to enter the country (or obtain the visa).
Period of reference for employment refers to the 7-days period prior to the survey.
Population of reference in table: all employed individuals (nationals and non-nationals) aged 15 and above
Overall definitions for the Censuses of 1991 are not available on the CIO website. However, the 2001 censuses used the following definitions:
Employed population includes population in the following categories:
Employer is defined as a person who operates his / her own economic enterprise or engages independently in a profession for trade and hires one or more employees.
Self-Employed is defined as a person who operates his / her own economic enterprise or engages independently in a profession or trade and hires nobody.
Paid Employee is defined as a person who works for a public or private organization and receives regular wages/salary whether in cash or in kind.
Unpaid Employee is defined as a person works for an enterprise, usually owned by some of his relatives, without receiving regulat wages/salary whether in cash or in kind.
2. Institution which provides data
Central Informatics Organization, known prior to 2001 as the “Central Statistics Organisation” under the Ministry of Cabinet Affairs
3. Data availability
Figures and results reported here are available on the Central Informatics Organisation (CIO) website. For Arabic version: (http://www.cio.gov.bh/cio_ara/default.aspx). For the English version: (http://www.cio.gov.bh/CIO_ENG/Default.aspx)
The CIO often provides its figures and estimates through tables in PDF format
Census figures for 1991 and 2001 regarding the labor force can be found: (http://www.cio.gov.bh/cio_eng/SubDetailed.aspx?subcatid=378)
These 1991 census figures can be found: (http://www.cio.gov.bh/cio_ara/English/Publications/Statistical%20Abstract/ABS2009/CH11/7.pdf)
These figures can also be found in the Statistical Abstract 2000, Labor Force section: (http://www.cio.gov.bh/CIO_ENG/SubDetailed.aspx?subcatid=172)
They can also be found in the Statistical Abstract 2001, Labor Force section: (http://www.cio.gov.bh/CIO_ENG/SubDetailed.aspx?subcatid=1730)
Date of access: July 2014
|
Bahraini |
Non-Bahraini |
Total |
|
males |
females |
total |
males |
females |
total |
males |
females |
total |
| Employer |
1,108 |
22 |
1,130 |
280 |
2 |
282 |
1,388 |
24 |
1,412 |
| Self-Employed |
9,443 |
106 |
9,549 |
2474 |
31 |
2,505 |
11,917 |
137 |
12,054 |
| Paid Employee |
36,827 |
7,601 |
44,428 |
71,080 |
6,748 |
77,828 |
107,907 |
14,349 |
122,256 |
| Unpaid Employee |
126 |
11 |
137 |
29 |
3 |
32 |
155 |
14 |
169 |
| Not Stated |
39 |
9 |
48 |
54 |
13 |
67 |
93 |
22 |
115 |
| Not Applicable* |
1761 |
125 |
1,886 |
0 |
0 |
0 |
1,761 |
125 |
1,886 |
| Total |
49,304 |
7,874 |
57,178 |
73,917 |
6,797 |
80,714 |
123,221 |
14,671 |
137,892 |
Source: Central Informatics Organisation (CIO) – Bahrain
*Bahrainis residing outside of Bahrain
ANNEXED NOTE
1. Technical Notes and Definitions
The table provides figures of Bahrain’s total employed population (nationals and non-nationals) based on their employed status and sex at the date of the 1981′ census.
Reference period: the 1981 specific census date is unknown.
Population of reference: all individuals (nationals and non-nationals) present within the country’s borders during time of reference.
Implementation method: the Censuses are carried out according to de jure methodology, i.e. counting persons using their usual place of residence irrespective of where are they at census times.
Nationality of the person is defined by the passport used to enter the country. A Non-Bahrainis is considered as such depending on the passport used to enter the country (or obtain the visa)
Overall definitions for the Censuses of 1981 are not available on the CIO website. However, the 2001 censuses used the following definitions:
Employer is defined as a person who operates his / her own economic enterprise or engages independently in a profession for trade and hires one or more employees.
Self-Employed is defined as a person who operates his / her own economic enterprise or engages independently in a profession or trade and hires nobody.
Paid Employee is defined as a person who works for a public or private organization and receives regular wages/salary whether in cash or in kind.
Unpaid Employee is defined as a person works for an enterprise, usually owned by some of his relatives, without receiving regulat wages/salary whether in cash or in kind.
2. Institution which provides data
Central Informatics Organization, known prior to 2001 as the “Central Statistics Organisation” under the Ministry of Cabinet Affairs
3. Data availability
Figures and results reported here are available on the Central Informatics Organisation (CIO) website. For Arabic version: (http://www.cio.gov.bh/cio_ara/default.aspx). For the English version: (http://www.cio.gov.bh/CIO_ENG/Default.aspx)
The CIO often provides its figures and estimates through tables in PDF format
These 1981′ census figures can be found in the Statistical Abstract 2000, Labor Force section: (http://www.cio.gov.bh/CIO_ENG/SubDetailed.aspx?subcatid=172)
Date of access: July 2014
|
|
Public Sector |
Private Sector |
Domestic Workers |
Total |
| Year |
Quarter |
Bahraini |
Non-Bahraini |
Total |
Bahraini |
Non-Bahraini |
Total |
Bahraini |
Non-Bahraini |
Total |
Bahraini |
Non-Bahraini |
Total |
| 2003 |
Q1 |
40,012 |
8,532 |
48,544 |
65,753 |
165,843 |
231,596 |
0 |
33,458 |
33,458 |
105,765 |
207,833 |
313,598 |
| Q2 |
40,288 |
8,580 |
48,868 |
66,364 |
168,627 |
234,991 |
0 |
34,667 |
34,667 |
106,652 |
211,874 |
318,526 |
| Q3 |
40,690 |
8,733 |
49,423 |
66,632 |
171,789 |
238,421 |
0 |
35,667 |
35,667 |
107,322 |
216,189 |
323,511 |
| Q4 |
41,591 |
8,805 |
50,396 |
68,243 |
175,101 |
243,344 |
0 |
37,639 |
37,639 |
109,834 |
221,545 |
331,379 |
| 2004 |
Q1 |
41,774 |
8,872 |
50,646 |
68,769 |
181,996 |
250,765 |
0 |
38,993 |
38,993 |
110,543 |
229,861 |
340,404 |
| Q2 |
41,902 |
8,952 |
50,854 |
70,426 |
186,931 |
257,357 |
0 |
40,889 |
40,889 |
112,328 |
236,772 |
349,100 |
| Q3 |
42,865 |
9,419 |
52,284 |
72,375 |
194,407 |
266,782 |
0 |
42,840 |
42,840 |
115,240 |
246,666 |
361,906 |
| Q4 |
43,238 |
9,482 |
52,720 |
75,038 |
200,965 |
276,003 |
0 |
44,586 |
44,586 |
118,276 |
255,033 |
373,309 |
| 2005 |
Q1 |
43,342 |
9,519 |
52,861 |
73,687 |
218,436 |
292,123 |
0 |
46,507 |
46,507 |
117,029 |
274,462 |
391,491 |
| Q2 |
43,619 |
9,574 |
53,193 |
74,394 |
230,188 |
304,582 |
0 |
49,427 |
49,427 |
118,013 |
289,189 |
407,202 |
| Q3 |
44,283 |
9,740 |
54,023 |
74,164 |
223,776 |
297,940 |
0 |
50,822 |
50,822 |
118,447 |
284,338 |
402,785 |
| Q4 |
44,738 |
9,779 |
54,517 |
77,595 |
234,413 |
312,008 |
0 |
51,647 |
51,647 |
122,333 |
295,839 |
418,172 |
| 2006 |
Q1 |
45,004 |
9,805 |
54,809 |
81,007 |
243,474 |
324,481 |
0 |
52,522 |
52,522 |
126,011 |
305,801 |
431,812 |
| Q2 |
45,487 |
9,809 |
55,296 |
81,134 |
245,176 |
326,310 |
0 |
54,201 |
54,201 |
126,621 |
309,186 |
435,807 |
| Q3 |
46,353 |
9,952 |
56,305 |
81,361 |
251,503 |
332,864 |
0 |
55,997 |
55,997 |
127,714 |
317,452 |
445,166 |
| Q4 |
47,562 |
10,278 |
57,840 |
81,648 |
262,829 |
344,477 |
0 |
57,948 |
57,948 |
129,210 |
331,055 |
460,265 |
| 2007 |
Q1 |
46,530 |
10,287 |
56,817 |
81,935 |
274,156 |
356,091 |
0 |
59,353 |
59,353 |
128,465 |
343,796 |
472,261 |
| Q2 |
47,005 |
10,320 |
57,325 |
82,223 |
286,020 |
368,243 |
0 |
62,851 |
62,851 |
129,228 |
359,191 |
488,419 |
| Q3 |
47,601 |
11,563 |
59,164 |
82,582 |
293,713 |
376,295 |
0 |
64,127 |
64,127 |
130,183 |
369,403 |
499,586 |
| Q4 |
48,007 |
11,959 |
59,966 |
82,122 |
297,086 |
379,208 |
0 |
64,610 |
64,610 |
130,129 |
373,655 |
503,784 |
| 2008 |
Q1 |
47,836 |
12,086 |
59,922 |
82,123 |
302,351 |
384,474 |
0 |
67,503 |
67,503 |
129,959 |
381,940 |
511,899 |
| Q2 |
47,457 |
12,201 |
59,658 |
85,820 |
314,931 |
400,751 |
0 |
69,786 |
69,786 |
133,277 |
396,918 |
530,195 |
| Q3 |
46,238 |
7,211 |
53,449 |
88,480 |
330,382 |
418,862 |
0 |
70,538 |
70,538 |
134,718 |
408,131 |
542,849 |
| Q4 |
46,776 |
7,632 |
54,408 |
93,320 |
355,529 |
448,849 |
0 |
72,541 |
72,541 |
140,096 |
435,702 |
575,798 |
| 2009 |
Q1 |
46,915 |
7,537 |
54,452 |
95,727 |
372,020 |
467,747 |
0 |
75,393 |
75,393 |
142,642 |
454,950 |
597,592 |
| Q2 |
47,059 |
7,499 |
54,558 |
91,605 |
385,916 |
477,521 |
0 |
75,490 |
75,490 |
138,664 |
468,905 |
607,569 |
| Q3 |
47,136 |
7,638 |
54,774 |
90,868 |
371,707 |
462,575 |
0 |
76,045 |
76,045 |
138,004 |
455,390 |
593,394 |
| Q4 |
47,530 |
7,760 |
55,290 |
89,002 |
374,987 |
463,989 |
0 |
79,212 |
79,212 |
136,532 |
461,959 |
598,491 |
| 2010 |
Q1 |
47,565 |
7,862 |
55,427 |
90,791 |
365,770 |
456,561 |
0 |
81,672 |
81,672 |
138,356 |
455,304 |
593,660 |
| Q2 |
47,685 |
7,727 |
55,412 |
91,661 |
366,528 |
458,189 |
0 |
83,439 |
83,439 |
139,346 |
457,694 |
597,040 |
| Q3 |
47,615 |
7,887 |
55,502 |
92,300 |
365,740 |
458,040 |
0 |
83,860 |
83,860 |
139,915 |
457,487 |
597,402 |
| Q4 |
48,111 |
7,912 |
56,023 |
92,528 |
366,795 |
459,323 |
0 |
84,002 |
84,002 |
140,639 |
458,709 |
599,348 |
| 2011 |
Q1 |
47,998 |
7,928 |
55,926 |
93,265 |
362,536 |
455,801 |
0 |
83,197 |
83,197 |
141,263 |
453,661 |
594,924 |
| Q2 |
47,311 |
7,822 |
55,133 |
90,444 |
356,419 |
446,863 |
0 |
84,473 |
84,473 |
137,755 |
448,714 |
586,469 |
| Q3 |
47,225 |
8,170 |
55,395 |
91,251 |
359,855 |
451,106 |
0 |
86,288 |
86,288 |
138,476 |
454,313 |
592,789 |
| Q4 |
47,642 |
8,174 |
55,816 |
92,524 |
362,466 |
454,990 |
0 |
87,420 |
87,420 |
140,166 |
458,060 |
598,226 |
| 2012 |
Q1 |
49,073 |
8,329 |
57,402 |
93,575 |
367,313 |
460,888 |
0 |
88,624 |
88,624 |
142,648 |
464,266 |
606,914 |
| Q2 |
51,932 |
8,412 |
60,344 |
93,706 |
373,084 |
466,790 |
0 |
90,124 |
90,124 |
145,638 |
471,620 |
617,258 |
| Q3 |
51,926 |
8,733 |
60,659 |
93,903 |
380,001 |
473,904 |
0 |
92,561 |
92,561 |
145,829 |
481,295 |
627,124 |
| Q4 |
52,243 |
8,904 |
61,147 |
94,496 |
384,777 |
479,273 |
0 |
95,297 |
95,297 |
146,739 |
488,978 |
635,717 |
| 2013 |
Q1 |
52,848 |
9,086 |
61,934 |
94,933 |
392,387 |
487,320 |
0 |
98,324 |
98,324 |
147,781 |
499,797 |
647,578 |
| Q2 |
56,535 |
9,146 |
65,681 |
95,710 |
400,127 |
495,837 |
0 |
100,349 |
100,349 |
152,245 |
509,622 |
661,867 |
| Q3 |
56,665 |
9,533 |
66,198 |
95,230 |
403,002 |
498,232 |
0 |
102,702 |
102,702 |
151,895 |
515,237 |
667,132 |
| Q4 |
56,865 |
9,946 |
66,811 |
95,608 |
400,482 |
496,090 |
0 |
103,728 |
103,728 |
152,473 |
514,156 |
666,629 |
| 2014 |
Q1 |
56,988 |
10,010 |
66,998 |
96,537 |
392,789 |
489,326 |
0 |
105,203 |
105,203 |
153,525 |
508,002 |
661,527 |
Source: Labour Market Regulatory Authority (LMRA) – Bahrain
ANNEXED NOTE
1. Technical Notes and Definitions
The table provides figures of Bahrain’s total employed population (nationals and non-nationals) based on their place of employment as collated and reported by the LMRA.
The LMRA estimates take into account official sources of employment data such as the pension organizations (General Organisation for Social Insurance, GOSI, for the private sector, and the Pension Fund Comission, PFC, for the public sector) in addition to the Civil Service Bureau (CSB) and Labour Force Surveys under the Central Informatics Organization (CIO). However, the LMRA-produced figures also take into account unregistered employment that is not included in GOSI and PFC. Not every employed person is registered either because registration of certain categories is not mandatory by law, or because there are delays and errors in the registration system. The LMRA estimates, for example, account for unpaid family workers, uninsured self-employed persons, multiple job holders and civilian employees in non-civilian organizations.
Note that the LMRA data, along with GOSI and PFC, do not include non-civilian employees (engaged in military, defense and other relevant entities and ranked as so).
This LMRA table included several notes:
1. Data for 2006 Q2 is that of 2006 April and for 2006 Q3 is that of 2006 August.
2. From 2008 Q2 onward, “Public sector” for Non-Bahraini workers refers to workers in the “Government sector” of the Expatriate Management System (EMS) of LMRA. Correspondingly, “Private Sector” for Non-Bahraini workers refers to the sum of “Commercial” and “Non-Commercial, Non-Government” (NCNG) sectors of LMRA’s EMS system.
3. Male popluation includes persons with unrecorded sex attribute.
4. Details may not add up to totals due to rounding error.
Employee is defined here as who works in a paid employment job, that is to say, a job where the explicit or implicit contract of employment gives the incumbent a basic remuneration that is independent of the revenue of the unit for which he or she works (the unit can be a corporation, a non-profit institution, a government or a household).
A Bahraini citizen is defined here as a legal national of the Kingdom of Bahrain. This category excludes nationals of the GCC.
A Non-Bahraini citizen is defined here as any foreigner or expatriate of a nationality other than Bahraini.
Public Sector is defined here as the one where employees are registered at the Public Fund Commission (PFC)
Private Sector is defined here as the one where employees are registered at the General Organisation for Social Insurance (GOSI)
Domestic Worker is defined here as an employee who works, and often lives within the employer’s household.
Employment as defined by the LMRA is in line with the ILO resolution concerning statistics of the economically active population, employment, unemployment and underemployment, Thirteenth International Conference of Labour Statisticians, Geneva, October 1982. It includes all persons above a specific age during a specific period either in paid employment or in self-employment and includes the following:
(a) paid employment
(a1) at work: persons who during the reference period performed some work for wage or salary, in cash or in kind, even for one hour
(a2) with a job but not at work: persons who, having already worked in their present job, were temporarily not at work during the reference period and had a formal attachment to their job (e.g., absence because of illness or injury, holiday or vacation, strike or lockout, educational or training leave, maternity or parental leave, reduction in economic activity, temporary disorganization or suspension of work due to such reasons as bad weather, mechanical or electrical breakdown, or shortage of raw materials or fuels).
(b) self employment
(b1) at work: persons who during the reference period performed some work for profit or family gain, in cash or in kind
(b2) with an enterprise but not at work: persons with an enterprise, which may be a business enterprise, a farm or a service undertaking, who were temporarily not at work during the reference period for any specific reason.
According to international statistical standards, members of the armed forces are included among persons in paid employment
2. Institution which provides data
Labour Market Regulatory Authority (LMRA)
The LMRA data is collated using several sources: data extracted from files submitted by Expatriate Management System (LMRA-EMS), General Organisation for Social Insurance (GOSI), Pension Fund Commission (PFC), and Civil Service Bureau (CSB) monthly data files to LMRA, and Labour Force Survey 2004
3. Data availability
The LMRA publishes these data under its Bahrain Labourr Market Indicators (BLMI) section. The BLMI dashboard can be found in: (http://blmi.lmra.bh/2014/03/mi_dashboard.xml). The general BLMI data with other non-LMRA sources can be found: (http://blmi.lmra.bh/2014/03/mi_data.xml)
Figures and results are often reported in tables in both PDF and Excel formats.
Data for this LMRA table can be found: (http://blmi.lmra.bh/2014/03/data/lmr/Table_A.pdf)
The definitions that the LMRA adopts for its data can be found in the Glossary section: (http://blmi.lmra.bh/mi_glossary.xml)
For some details on the way the LMRA estimates employment, refer to the documents titled “Estimation of Employment and Wages (Tables A & B)” and “Comparison of LMRA Employment Data with Those of CBB” and “LMRA Estimation of Unregistered (at GOSI and PFC) Bahraini Employed Persons” in the Documents page: (http://blmi.lmra.bh/mi_documents.xml)
Date of access: July 2014
|
|
Public Sector |
Private Sector |
Domestic Workers |
Total |
| Year |
Quarter |
males |
females |
total |
males |
females |
total |
males |
females |
total |
males |
females |
total |
| 2003 |
Q1 |
6,471 |
2,061 |
8,532 |
154,959 |
10,884 |
165,843 |
11,371 |
22,087 |
33,458 |
172,801 |
35,032 |
207,833 |
| Q2 |
6,492 |
2,088 |
8,580 |
158,030 |
10,598 |
168,628 |
11,848 |
22,819 |
34,667 |
176,370 |
35,505 |
211,875 |
| Q3 |
6,599 |
2,134 |
8,733 |
161,683 |
10,106 |
171,789 |
12,185 |
23,481 |
35,666 |
180,467 |
35,721 |
216,188 |
| Q4 |
6,630 |
2,175 |
8,805 |
164,915 |
10,186 |
175,101 |
12,904 |
24,735 |
37,639 |
184,449 |
37,096 |
221,545 |
| 2004 |
Q1 |
6,660 |
2,212 |
8,872 |
172,034 |
9,963 |
181,997 |
13,341 |
25,651 |
38,992 |
192,035 |
37,826 |
229,861 |
| Q2 |
6,680 |
2,272 |
8,952 |
176,688 |
10,244 |
186,932 |
13,884 |
27,006 |
40,890 |
197,252 |
39,522 |
236,774 |
| Q3 |
7,079 |
2,340 |
9,419 |
183,877 |
10,530 |
194,407 |
14,660 |
28,180 |
42,840 |
205,616 |
41,050 |
246,666 |
| Q4 |
7,119 |
2,363 |
9,482 |
190,195 |
10,770 |
200,965 |
15,270 |
29,316 |
44,586 |
212,584 |
42,449 |
255,033 |
| 2005 |
Q1 |
7,148 |
2,371 |
9,519 |
206,525 |
11,911 |
218,436 |
16,002 |
30,506 |
46,508 |
229,675 |
44,788 |
274,463 |
| Q2 |
7,177 |
2,397 |
9,574 |
218,034 |
12,155 |
230,189 |
17,145 |
32,283 |
49,428 |
242,356 |
46,835 |
289,191 |
| Q3 |
7,326 |
2,414 |
9,740 |
211,944 |
11,832 |
223,776 |
17,745 |
33,077 |
50,822 |
237,015 |
47,323 |
284,338 |
| Q4 |
7,338 |
2,441 |
9,779 |
222,159 |
12,254 |
234,413 |
18,102 |
33,545 |
51,647 |
247,599 |
48,240 |
295,839 |
| 2006 |
Q1 |
7,356 |
2,449 |
9,805 |
231,006 |
12,468 |
243,474 |
18,372 |
34,150 |
52,522 |
256,734 |
49,067 |
305,801 |
| Q2 |
7,358 |
2,451 |
9,809 |
232,686 |
12,490 |
245,176 |
18,897 |
35,304 |
54,201 |
258,941 |
50,245 |
309,186 |
| Q3 |
7,392 |
2,560 |
9,952 |
238,815 |
12,688 |
251,503 |
19,640 |
36,356 |
55,996 |
265,847 |
51,604 |
317,451 |
| Q4 |
7,582 |
2,696 |
10,278 |
249,906 |
12,923 |
262,829 |
20,378 |
37,570 |
57,948 |
277,866 |
53,189 |
331,055 |
| 2007 |
Q1 |
7,568 |
2,719 |
10,287 |
260,998 |
13,158 |
274,156 |
20,873 |
38,480 |
59,353 |
289,439 |
54,357 |
343,796 |
| Q2 |
7,570 |
2,750 |
10,320 |
272,602 |
13,418 |
286,020 |
22,187 |
40,664 |
62,851 |
302,359 |
56,832 |
359,191 |
| Q3 |
8,527 |
3,036 |
11,563 |
280,142 |
13,571 |
293,713 |
22,803 |
41,324 |
64,127 |
311,472 |
57,931 |
369,403 |
| Q4 |
8,869 |
3,090 |
11,959 |
283,288 |
13,798 |
297,086 |
23,230 |
41,380 |
64,610 |
315,387 |
58,268 |
373,655 |
| 2008 |
Q1 |
8,917 |
3,169 |
12,086 |
288,219 |
14,132 |
302,351 |
24,391 |
43,112 |
67,503 |
321,527 |
60,413 |
381,940 |
| Q2 |
8,983 |
3,218 |
12,201 |
300,185 |
14,746 |
314,931 |
25,338 |
44,448 |
69,786 |
334,506 |
62,412 |
396,918 |
| Q3 |
5,341 |
1,870 |
7,211 |
313,051 |
17,331 |
330,382 |
25,633 |
44,905 |
70,538 |
344,025 |
64,106 |
408,131 |
| Q4 |
5,667 |
1,965 |
7,632 |
335,971 |
19,558 |
355,529 |
26,384 |
46,157 |
72,541 |
368,022 |
67,680 |
435,702 |
| 2009 |
Q1 |
5,593 |
1,944 |
7,537 |
351,368 |
20,652 |
372,020 |
27,320 |
48,073 |
75,393 |
384,281 |
70,669 |
454,950 |
| Q2 |
5,528 |
1,971 |
7,499 |
364,464 |
21,452 |
385,916 |
27,431 |
48,060 |
75,491 |
397,423 |
71,483 |
468,906 |
| Q3 |
5,596 |
2,042 |
7,638 |
350,007 |
21,700 |
371,707 |
28,035 |
48,009 |
76,044 |
383,638 |
71,751 |
455,389 |
| Q4 |
5,662 |
2,098 |
7,760 |
352,643 |
22,344 |
374,987 |
29,169 |
50,042 |
79,211 |
387,474 |
74,484 |
461,958 |
| 2010 |
Q1 |
5,747 |
2,115 |
7,862 |
343,347 |
22,423 |
365,770 |
30,495 |
51,177 |
81,672 |
379,589 |
75,715 |
455,304 |
| Q2 |
5,641 |
2,086 |
7,727 |
344,011 |
22,517 |
366,528 |
31,457 |
51,981 |
83,438 |
381,109 |
76,584 |
457,693 |
| Q3 |
5,751 |
2,136 |
7,887 |
342,909 |
22,831 |
365,740 |
31,625 |
52,235 |
83,860 |
380,285 |
77,202 |
457,487 |
| Q4 |
5,762 |
2,150 |
7,912 |
343,621 |
23,174 |
366,795 |
31,542 |
52,460 |
84,002 |
380,925 |
77,784 |
458,709 |
| 2011 |
Q1 |
5,759 |
2,169 |
7,928 |
339,489 |
23,047 |
362,536 |
31,387 |
51,811 |
83,198 |
376,635 |
77,027 |
453,662 |
| Q2 |
5,676 |
2,146 |
7,822 |
333,755 |
22,664 |
356,419 |
32,182 |
52,291 |
84,473 |
371,613 |
77,101 |
448,714 |
| Q3 |
5,978 |
2,192 |
8,170 |
336,800 |
23,055 |
359,855 |
32,680 |
53,609 |
86,289 |
375,458 |
78,856 |
454,314 |
| Q4 |
5,936 |
2,238 |
8,174 |
338,958 |
23,508 |
362,466 |
32,828 |
54,592 |
87,420 |
377,722 |
80,338 |
458,060 |
| 2012 |
Q1 |
6,026 |
2,303 |
8,329 |
343,077 |
24,236 |
367,313 |
33,067 |
55,557 |
88,624 |
382,170 |
82,096 |
464,266 |
| Q2 |
5,979 |
2,433 |
8,412 |
348,529 |
24,555 |
373,084 |
33,341 |
56,783 |
90,124 |
387,849 |
83,771 |
471,620 |
| Q3 |
6,286 |
2,447 |
8,733 |
354,842 |
25,159 |
380,001 |
34,369 |
58,192 |
92,561 |
395,497 |
85,798 |
481,295 |
| Q4 |
6,399 |
2,505 |
8,904 |
359,051 |
25,726 |
384,777 |
35,813 |
59,484 |
95,297 |
401,263 |
87,715 |
488,978 |
| 2013 |
Q1 |
6,473 |
2,613 |
9,086 |
366,052 |
26,335 |
392,387 |
37,285 |
61,039 |
98,324 |
409,810 |
89,987 |
499,797 |
| Q2 |
6,455 |
2,691 |
9,146 |
372,914 |
27,213 |
400,127 |
37,915 |
62,434 |
100,349 |
417,284 |
92,338 |
509,622 |
| Q3 |
6,644 |
2,889 |
9,533 |
374,824 |
28,178 |
403,002 |
38,916 |
63,786 |
102,702 |
420,384 |
94,853 |
515,237 |
| Q4 |
6,786 |
3,160 |
9,946 |
371,669 |
28,813 |
400,482 |
39,629 |
64,099 |
103,728 |
418,084 |
96,072 |
514,156 |
| 2014 |
Q1 |
6,834 |
3,176 |
10,010 |
363,777 |
29,012 |
392,789 |
40,398 |
64,805 |
105,203 |
411,009 |
96,993 |
508,002 |
Source: Labour Market Regulatory Authority (LMRA) – Bahrain
ANNEXED NOTE
1. Technical Notes and Definitions
The table provides figures of Bahrain’s total employed population (non-nationals only) based on their sex and place of employment as collated and reported by the LMRA.
The LMRA estimates take into account official sources of employment data such as the pension organizations (General Organisation for Social Insurance, GOSI, for the private sector, and the Pension Fund Comission, PFC, for the public sector) in addition to the Civil Service Bureau (CSB) and Labour Force Surveys under the Central Informatics Organization (CIO). However, the LMRA-produced figures also take into account unregistered employment that is not included in GOSI and PFC. Not every employed person is registered either because registration of certain categories is not mandatory by law, or because there are delays and errors in the registration system. The LMRA estimates, for example, account for unpaid family workers, uninsured self-employed persons, multiple job holders and civilian employees in non-civilian organizations, in addition to domestic workers and other expatriates registed under the LMRA’s Expatriate Management System (EMS) The LMRA estimates take into account official sources of employment data such as the pension organizations (General Organisation for Social Insurance, GOSI, for the private sector, and the Pension Fund Comission, PFC, for the public sector) in addition to the Civil Service Bureau (CSB) and Labour Force Surveys under the Central Informatics Organization (CIO). However, the LMRA-produced figures also take into account unregistered employment that is not included in GOSI and PFC. Not every employed person is registered either because registration of certain categories is not mandatory by law, or because there are delays and errors in the registration system. The LMRA estimates, for example, account for unpaid family workers, uninsured self-employed persons, multiple job holders and civilian employees in non-civilian organizations, in addition to domestic workers and other expatriates registed under the LMRA’s Expatriate Management System (EMS)
Note that the LMRA data, along with GOSI and PFC, do not include non-civilian employees (engaged in military and defense and other relevant entities).Note that the LMRA data, along with GOSI and PFC, do not include non-civilian employees (engaged in military and defense and other relevant entities).
This LMRA table included several notes:
1. Data for 2006 Q2 is that of 2006 April and for 2006 Q3 is that of 2006 August.
2. From 2008 Q2 onward, “Public sector” for Non-Bahraini workers refers to workers in the “Government sector” of the Expatriate Management System (EMS) of LMRA. Correspondingly, “Private Sector” for Non-Bahraini workers refers to the sum of “Commercial” and “Non-Commercial, Non-Government” (NCNG) sectors of LMRA’s EMS system.
3. Male popluation includes persons with unrecorded sex attribute.
4. Details may not add up to totals due to rounding error.
Employee is defined here as who works in a paid employment job, that is to say, a job where the explicit or implicit contract of employment gives the incumbent a basic remuneration that is independent of the revenue of the unit for which he or she works (the unit can be a corporation, a non-profit institution, a government or a household).Employee is defined here as who works in a paid employment job, that is to say, a job where the explicit or implicit contract of employment gives the incumbent a basic remuneration that is independent of the revenue of the unit for which he or she works (the unit can be a corporation, a non-profit institution, a government or a household).
A Bahraini citizen is defined here as a legal national of the Kingdom of Bahrain. This category excludes nationals of the GCC.A Bahraini citizen is defined here as a legal national of the Kingdom of Bahrain. This category excludes nationals of the GCC.
A Non-Bahraini citizen is defined here as any foreigner or expatriate of a nationality other than Bahraini.A Non-Bahraini citizen is defined here as any foreigner or expatriate of a nationality other than Bahraini.
Public Sector is defined here as the one where employees are registered at the Public Fund Commission (PFC)Public Sector is defined here as the one where employees are registered at the Public Fund Commission (PFC)
Private Sector is defined here as the one where employees are registered at the General Organisation for Social Insurance (GOSI)Private Sector is defined here as the one where employees are registered at the General Organisation for Social Insurance (GOSI)
Domestic Worker is defined here as an employee who works, and often lives within the employer’s household.Domestic Worker is defined here as an employee who works, and often lives within the employer’s household.
Employment as defined by the LMRA is in line with the ILO resolution concerning statistics of the economically active population, employment, unemployment and underemployment, Thirteenth International Conference of Labour Statisticians, Geneva, October 1982. It includes all persons above a specific age during a specific period either in paid employment or in self-employment and includes the following:Employment as defined by the LMRA is in line with the ILO resolution concerning statistics of the economically active population, employment, unemployment and underemployment, Thirteenth International Conference of Labour Statisticians, Geneva, October 1982. It includes all persons above a specific age during a specific period either in paid employment or in self-employment and includes the following:
(a) paid employment
(a1) at work: persons who during the reference period performed some work for wage or salary, in cash or in kind, even for one hour
(a2) with a job but not at work: persons who, having already worked in their present job, were temporarily not at work during the reference period and had a formal attachment to their job (e.g., absence because of illness or injury, holiday or vacation, strike or lockout, educational or training leave, maternity or parental leave, reduction in economic activity, temporary disorganization or suspension of work due to such reasons as bad weather, mechanical or electrical breakdown, or shortage of raw materials or fuels).
(b) self employment
(b1) at work: persons who during the reference period performed some work for profit or family gain, in cash or in kind
(b2) with an enterprise but not at work: persons with an enterprise, which may be a business enterprise, a farm or a service undertaking, who were temporarily not at work during the reference period for any specific reason.
2. Institution which provides data
Labour Market Regulatory Authority (LMRA)
The LMRA data is collated using several sources: data extracted from files submitted by Expatriate Management System (LMRA-EMS), General Organisation for Social Insurance (GOSI), Pension Fund Commission (PFC), and Civil Service Bureau (CSB) monthly data files to LMRA, and Labour Force Survey 2004
3. Data availability
The LMRA publishes these data under its Bahrain Labourr Market Indicators (BLMI) section. The BLMI dashboard can be found in: (http://blmi.lmra.bh/2014/03/mi_dashboard.xml). The general BLMI data with other non-LMRA sources can be found: (http://blmi.lmra.bh/2014/03/mi_data.xml)
Figures and results are often reported in tables in both PDF and Excel formats.
Data for this LMRA table is split between a table for females by citizenship and employment sector, found here: (http://blmi.lmra.bh/2014/03/data/lmr/Table_A2.pdf), and a table for males by citizenship and employment sector, found here: (http://blmi.lmra.bh/2014/03/data/lmr/Table_A1.pdf)
The definitions that the LMRA adopts for its data can be found in the Glossary section: (http://blmi.lmra.bh/mi_glossary.xml)
For some details on the way the LMRA estimates employment, refer to the documents titled “Estimation of Employment and Wages (Tables A & B)” and “Comparison of LMRA Employment Data with Those of CBB” and “LMRA Estimation of Unregistered (at GOSI and PFC) Bahraini Employed Persons” in the Documents page: (http://blmi.lmra.bh/mi_documents.xml)
Date of access: July 2014
|
|
Public Sector |
Private Sector |
Domestic Workers |
Total |
| Year |
Quarter |
males |
females |
total |
males |
females |
total |
males |
females |
total |
males |
females |
total |
| 2003 |
Q1 |
25,389 |
14,623 |
40,012 |
50,677 |
15,076 |
65,753 |
0 |
0 |
0 |
76,066 |
29,699 |
105,765 |
| Q2 |
25,570 |
14,718 |
40,288 |
51,345 |
15,019 |
66,364 |
0 |
0 |
0 |
76,915 |
29,737 |
106,652 |
| Q3 |
25,589 |
15,101 |
40,690 |
51,769 |
14,864 |
66,633 |
0 |
0 |
0 |
77,358 |
29,965 |
107,323 |
| Q4 |
26,138 |
15,453 |
41,591 |
52,833 |
15,410 |
68,243 |
0 |
0 |
0 |
78,971 |
30,863 |
109,834 |
| 2004 |
Q1 |
26,129 |
15,645 |
41,774 |
53,195 |
15,574 |
68,769 |
0 |
0 |
0 |
79,324 |
31,219 |
110,543 |
| Q2 |
26,239 |
15,663 |
41,902 |
54,348 |
16,079 |
70,427 |
0 |
0 |
0 |
80,587 |
31,742 |
112,329 |
| Q3 |
26,638 |
16,227 |
42,865 |
55,655 |
16,720 |
72,375 |
0 |
0 |
0 |
82,293 |
32,947 |
115,240 |
| Q4 |
26,819 |
16,419 |
43,238 |
57,560 |
17,478 |
75,038 |
0 |
0 |
0 |
84,379 |
33,897 |
118,276 |
| 2005 |
Q1 |
26,841 |
16,501 |
43,342 |
56,280 |
17,407 |
73,687 |
0 |
0 |
0 |
83,121 |
33,908 |
117,029 |
| Q2 |
27,000 |
16,619 |
43,619 |
57,161 |
17,233 |
74,394 |
0 |
0 |
0 |
84,161 |
33,852 |
118,013 |
| Q3 |
27,350 |
16,933 |
44,283 |
56,722 |
17,443 |
74,165 |
0 |
0 |
0 |
84,072 |
34,376 |
118,448 |
| Q4 |
27,581 |
17,157 |
44,738 |
59,106 |
18,489 |
77,595 |
0 |
0 |
0 |
86,687 |
35,646 |
122,333 |
| 2006 |
Q1 |
27,741 |
17,263 |
45,004 |
62,112 |
18,894 |
81,006 |
0 |
0 |
0 |
89,853 |
36,157 |
126,010 |
| Q2 |
28,154 |
17,333 |
45,487 |
62,114 |
19,020 |
81,134 |
0 |
0 |
0 |
90,268 |
36,353 |
126,621 |
| Q3 |
28,803 |
17,550 |
46,353 |
62,372 |
18,989 |
81,361 |
0 |
0 |
0 |
91,175 |
36,539 |
127,714 |
| Q4 |
29,437 |
18,125 |
47,562 |
62,223 |
19,425 |
81,648 |
0 |
0 |
0 |
91,660 |
37,550 |
129,210 |
| 2007 |
Q1 |
28,097 |
18,433 |
46,530 |
62,074 |
19,862 |
81,936 |
0 |
0 |
0 |
90,171 |
38,295 |
128,466 |
| Q2 |
28,345 |
18,660 |
47,005 |
61,924 |
20,298 |
82,222 |
0 |
0 |
0 |
90,269 |
38,958 |
129,227 |
| Q3 |
28,567 |
19,034 |
47,601 |
62,254 |
20,328 |
82,582 |
0 |
0 |
0 |
90,821 |
39,362 |
130,183 |
| Q4 |
28,779 |
19,228 |
48,007 |
61,789 |
20,334 |
82,123 |
0 |
0 |
0 |
90,568 |
39,562 |
130,130 |
| 2008 |
Q1 |
28,625 |
19,211 |
47,836 |
61,769 |
20,354 |
82,123 |
0 |
0 |
0 |
90,394 |
39,565 |
129,959 |
| Q2 |
28,202 |
19,255 |
47,457 |
64,082 |
21,738 |
85,820 |
0 |
0 |
0 |
92,284 |
40,993 |
133,277 |
| Q3 |
27,246 |
18,992 |
46,238 |
65,757 |
22,723 |
88,480 |
0 |
0 |
0 |
93,003 |
41,715 |
134,718 |
| Q4 |
27,353 |
19,423 |
46,776 |
68,043 |
25,276 |
93,319 |
0 |
0 |
0 |
95,396 |
44,699 |
140,095 |
| 2009 |
Q1 |
27,383 |
19,532 |
46,915 |
69,070 |
26,657 |
95,727 |
0 |
0 |
0 |
96,453 |
46,189 |
142,642 |
| Q2 |
27,439 |
19,620 |
47,059 |
66,628 |
24,977 |
91,605 |
0 |
0 |
0 |
94,067 |
44,597 |
138,664 |
| Q3 |
27,461 |
19,675 |
47,136 |
66,242 |
24,627 |
90,869 |
0 |
0 |
0 |
93,703 |
44,302 |
138,005 |
| Q4 |
27,507 |
20,023 |
47,530 |
64,646 |
24,356 |
89,002 |
0 |
0 |
0 |
92,153 |
44,379 |
136,532 |
| 2010 |
Q1 |
27,465 |
20,100 |
47,565 |
65,976 |
24,815 |
90,791 |
0 |
0 |
0 |
93,441 |
44,915 |
138,356 |
| Q2 |
27,370 |
20,315 |
47,685 |
66,407 |
25,254 |
91,661 |
0 |
0 |
0 |
93,777 |
45,569 |
139,346 |
| Q3 |
27,328 |
20,287 |
47,615 |
67,154 |
25,146 |
92,300 |
0 |
0 |
0 |
94,482 |
45,433 |
139,915 |
| Q4 |
27,438 |
20,673 |
48,111 |
67,142 |
25,386 |
92,528 |
0 |
0 |
0 |
94,580 |
46,059 |
140,639 |
| 2011 |
Q1 |
27,291 |
20,707 |
47,998 |
67,739 |
25,527 |
93,266 |
0 |
0 |
0 |
95,030 |
46,234 |
141,264 |
| Q2 |
26,802 |
20,509 |
47,311 |
65,519 |
24,924 |
90,443 |
0 |
0 |
0 |
92,321 |
45,433 |
137,754 |
| Q3 |
26,622 |
20,603 |
47,225 |
66,315 |
24,935 |
91,250 |
0 |
0 |
0 |
92,937 |
45,538 |
138,475 |
| Q4 |
26,636 |
21,006 |
47,642 |
67,248 |
25,276 |
92,524 |
0 |
0 |
0 |
93,884 |
46,282 |
140,166 |
| 2012 |
Q1 |
26,867 |
22,206 |
49,073 |
68,188 |
25,387 |
93,575 |
0 |
0 |
0 |
95,055 |
47,593 |
142,648 |
| Q2 |
27,446 |
24,486 |
51,932 |
68,341 |
25,364 |
93,705 |
0 |
0 |
0 |
95,787 |
49,850 |
145,637 |
| Q3 |
27,449 |
24,477 |
51,926 |
68,667 |
25,237 |
93,904 |
0 |
0 |
0 |
96,116 |
49,714 |
145,830 |
| Q4 |
27,614 |
24,629 |
52,243 |
68,880 |
25,616 |
94,496 |
0 |
0 |
0 |
96,494 |
50,245 |
146,739 |
| 2013 |
Q1 |
27,623 |
25,225 |
52,848 |
69,070 |
25,863 |
94,933 |
0 |
0 |
0 |
96,693 |
51,088 |
147,781 |
| Q2 |
30,145 |
26,390 |
56,535 |
69,517 |
26,193 |
95,710 |
0 |
0 |
0 |
99,662 |
52,583 |
152,245 |
| Q3 |
30,115 |
26,550 |
56,665 |
69,139 |
26,090 |
95,229 |
0 |
0 |
0 |
99,254 |
52,640 |
151,894 |
| Q4 |
30,169 |
26,696 |
56,865 |
69,354 |
26,254 |
95,608 |
0 |
0 |
0 |
99,523 |
52,950 |
152,473 |
| 2014 |
Q1 |
30,213 |
26,775 |
56,988 |
69,738 |
26,799 |
96,537 |
0 |
0 |
0 |
99,951 |
53,574 |
153,525 |
Source: Labour Market Regulatory Authority (LMRA) – Bahrain
ANNEXED NOTE
1. Technical Notes and Definitions
The table provides figures of Bahrain’s total employed population (nationals only) based on their sex and place of employment as collated and reported by the LMRA.
The LMRA estimates take into account official sources of employment data such as the pension organizations (General Organisation for Social Insurance, GOSI, for the private sector, and the Pension Fund Comission, PFC, for the public sector) in addition to the Civil Service Bureau (CSB) and Labour Force Surveys under the Central Informatics Organization (CIO). However, the LMRA-produced figures also take into account unregistered employment that is not included in GOSI and PFC. Not every employed person is registered either because registration of certain categories is not mandatory by law, or because there are delays and errors in the registration system. The LMRA estimates, for example, account for unpaid family workers, uninsured self-employed persons, multiple job holders and civilian employees in non-civilian organizations. The LMRA estimates take into account official sources of employment data such as the pension organizations (General Organisation for Social Insurance, GOSI, for the private sector, and the Pension Fund Comission, PFC, for the public sector) in addition to the Civil Service Bureau (CSB) and Labour Force Surveys under the Central Informatics Organization (CIO). However, the LMRA-produced figures also take into account unregistered employment that is not included in GOSI and PFC. Not every employed person is registered either because registration of certain categories is not mandatory by law, or because there are delays and errors in the registration system. The LMRA estimates, for example, account for unpaid family workers, uninsured self-employed persons, multiple job holders and civilian employees in non-civilian organizations.
Note that the LMRA data, along with GOSI and PFC, do not include non-civilian employees (engaged in military and defense and other relevant entities).Note that the LMRA data, along with GOSI and PFC, do not include non-civilian employees (engaged in military and defense and other relevant entities).
This LMRA table included several notes:
1. Data for 2006 Q2 is that of 2006 April and for 2006 Q3 is that of 2006 August.
2. From 2008 Q2 onward, “Public sector” for Non-Bahraini workers refers to workers in the “Government sector” of the Expatriate Management System (EMS) of LMRA. Correspondingly, “Private Sector” for Non-Bahraini workers refers to the sum of “Commercial” and “Non-Commercial, Non-Government” (NCNG) sectors of LMRA’s EMS system.
3. Male popluation includes persons with unrecorded sex attribute.
4. Details may not add up to totals due to rounding error.
Employee is defined here as who works in a paid employment job, that is to say, a job where the explicit or implicit contract of employment gives the incumbent a basic remuneration that is independent of the revenue of the unit for which he or she works (the unit can be a corporation, a non-profit institution, a government or a household).Employee is defined here as who works in a paid employment job, that is to say, a job where the explicit or implicit contract of employment gives the incumbent a basic remuneration that is independent of the revenue of the unit for which he or she works (the unit can be a corporation, a non-profit institution, a government or a household).
A Bahraini citizen is defined here as a legal national of the Kingdom of Bahrain. This category excludes nationals of the GCC.A Bahraini citizen is defined here as a legal national of the Kingdom of Bahrain. This category excludes nationals of the GCC.
A Non-Bahraini citizen is defined here as any foreigner or expatriate of a nationality other than Bahraini.A Non-Bahraini citizen is defined here as any foreigner or expatriate of a nationality other than Bahraini.
Public Sector is defined here as the one where employees are registered at the Public Fund Commission (PFC)Public Sector is defined here as the one where employees are registered at the Public Fund Commission (PFC)
Private Sector is defined here as the one where employees are registered at the General Organisation for Social Insurance (GOSI)Private Sector is defined here as the one where employees are registered at the General Organisation for Social Insurance (GOSI)
Domestic Worker is defined here as an employee who works, and often lives within the employer’s household.Domestic Worker is defined here as an employee who works, and often lives within the employer’s household.
Employment as defined by the LMRA is in line with the ILO resolution concerning statistics of the economically active population, employment, unemployment and underemployment, Thirteenth International Conference of Labour Statisticians, Geneva, October 1982. It includes all persons above a specific age during a specific period either in paid employment or in self-employment and includes the following:Employment as defined by the LMRA is in line with the ILO resolution concerning statistics of the economically active population, employment, unemployment and underemployment, Thirteenth International Conference of Labour Statisticians, Geneva, October 1982. It includes all persons above a specific age during a specific period either in paid employment or in self-employment and includes the following:
(a) paid employment
(a1) at work: persons who during the reference period performed some work for wage or salary, in cash or in kind, even for one hour
(a2) with a job but not at work: persons who, having already worked in their present job, were temporarily not at work during the reference period and had a formal attachment to their job (e.g., absence because of illness or injury, holiday or vacation, strike or lockout, educational or training leave, maternity or parental leave, reduction in economic activity, temporary disorganization or suspension of work due to such reasons as bad weather, mechanical or electrical breakdown, or shortage of raw materials or fuels).
(b) self employment
(b1) at work: persons who during the reference period performed some work for profit or family gain, in cash or in kind
(b2) with an enterprise but not at work: persons with an enterprise, which may be a business enterprise, a farm or a service undertaking, who were temporarily not at work during the reference period for any specific reason.
2. Institution which provides data
Labour Market Regulatory Authority (LMRA)
The LMRA data is collated using several sources: data extracted from files submitted by Expatriate Management System (LMRA-EMS), General Organisation for Social Insurance (GOSI), Pension Fund Commission (PFC), and Civil Service Bureau (CSB) monthly data files to LMRA, and Labour Force Survey 2004.
3. Data availability
The LMRA publishes these data under its Bahrain Labourr Market Indicators (BLMI) section. The BLMI dashboard can be found in: (http://blmi.lmra.bh/2014/03/mi_dashboard.xml). The general BLMI data with other non-LMRA sources can be found: (http://blmi.lmra.bh/2014/03/mi_data.xml)
Figures and results are often reported in tables in both PDF and Excel formats.
Data for this LMRA table is split between a table for females by citizenship and employment sector, found here: (http://blmi.lmra.bh/2014/03/data/lmr/Table_A2.pdf), and a table for males by citizenship and employment sector, found here: (http://blmi.lmra.bh/2014/03/data/lmr/Table_A1.pdf)
The definitions that the LMRA adopts for its data can be found in the Glossary section: (http://blmi.lmra.bh/mi_glossary.xml)
For some details on the way the LMRA estimates employment, refer to the documents titled “Estimation of Employment and Wages (Tables A & B)” and “Comparison of LMRA Employment Data with Those of CBB” and “LMRA Estimation of Unregistered (at GOSI and PFC) Bahraini Employed Persons” in the Documents page: (http://blmi.lmra.bh/mi_documents.xml)
Date of access: July 2014
| |
males |
females |
Total |
| Bahraini |
30,213 |
26,775 |
56,988 |
| Arab Nationals |
5,173 |
1,865 |
7,038 |
| GCC |
88 |
90 |
178 |
| Saudi Arabia |
28 |
42 |
70 |
| Kuwait |
1 |
15 |
16 |
| United Arab Emirates |
2 |
11 |
13 |
| Oman |
55 |
7 |
62 |
| Qatar |
2 |
15 |
17 |
| Other Arab |
5,085 |
1,775 |
6,860 |
| Egypt |
3,393 |
1,266 |
4,659 |
| Iraq |
58 |
16 |
74 |
| Syrian Arab Republic |
61 |
19 |
80 |
| Lebanon |
30 |
14 |
44 |
| Yemen, Rep. of |
29 |
13 |
42 |
| West bank and Gaza strip |
44 |
17 |
61 |
| Morocco |
243 |
21 |
264 |
| Jordan |
1,069 |
351 |
1,420 |
| Sudan |
100 |
32 |
132 |
| Tunisia |
35 |
21 |
56 |
| Algeria |
14 |
3 |
17 |
| Libya |
9 |
2 |
11 |
| Other Nationalities |
11,734 |
3,866 |
15,600 |
| Asia |
10,922 |
3,520 |
14,442 |
| India |
6,228 |
2,887 |
9,115 |
| Bangladesh |
1,547 |
15 |
1,562 |
| Pakistan |
1,737 |
39 |
1,776 |
| Philippines |
975 |
496 |
1,471 |
| Nepal |
143 |
18 |
161 |
| Sri Lanka |
111 |
6 |
117 |
| Thailand |
16 |
2 |
18 |
| China |
0 |
10 |
10 |
| Indonesia |
9 |
6 |
15 |
| Iran, Islamic Rep. of |
77 |
19 |
96 |
| Korea, Republic of |
2 |
1 |
3 |
| Japan |
8 |
1 |
9 |
| Malaysia |
48 |
14 |
62 |
| Singapore |
6 |
3 |
9 |
| Uzbekistan |
1 |
0 |
1 |
| Afghanistan |
8 |
2 |
10 |
| Hong Kong, China |
6 |
1 |
7 |
| Europe |
413 |
149 |
562 |
| United Kingdom |
234 |
92 |
326 |
| Turkey |
10 |
5 |
15 |
| France |
10 |
5 |
15 |
| Germany |
4 |
3 |
7 |
| Ireland |
32 |
18 |
50 |
| Switzerland |
60 |
7 |
67 |
| Italy |
4 |
3 |
7 |
| Romania |
2 |
0 |
2 |
| Cyprus |
11 |
1 |
12 |
| Greece |
14 |
0 |
14 |
| Netherlands |
3 |
1 |
4 |
| Spain |
1 |
2 |
3 |
| Bulgaria |
1 |
1 |
2 |
| Belgium |
9 |
1 |
10 |
| Portugal |
3 |
2 |
5 |
| Denmark |
2 |
0 |
2 |
| Sweden |
4 |
2 |
6 |
| Austria |
3 |
4 |
7 |
| Finland |
2 |
1 |
3 |
| Slovakia |
1 |
0 |
1 |
| Czech Republic |
1 |
1 |
2 |
| Poland |
2 |
0 |
2 |
| Noth America |
106 |
64 |
170 |
| United States |
67 |
33 |
100 |
| Canada |
39 |
31 |
70 |
| South America |
1 |
1 |
2 |
| Brazil |
0 |
1 |
1 |
| El Salvador |
1 |
0 |
1 |
| Oceania |
83 |
30 |
113 |
| Australia |
32 |
15 |
47 |
| New Zealand |
51 |
15 |
66 |
| Africa |
105 |
37 |
142 |
| Tanzania, United Republic of |
53 |
10 |
63 |
| Nigeria |
15 |
5 |
20 |
| Somalia |
14 |
5 |
19 |
| South Africa |
7 |
8 |
15 |
| Seychelles |
5 |
2 |
7 |
| Ehtiopia |
4 |
2 |
6 |
| Mauritania |
2 |
4 |
6 |
| Kenya |
5 |
0 |
5 |
| Djibouti |
0 |
1 |
1 |
| Other |
86 |
50 |
136 |
| Not Specified |
18 |
15 |
33 |
| Total |
47,120 |
32,506 |
79,626 |
Source: Labour Market Regulatory Authority (LMRA) – Bahrain
Data extracted from files submitted by Pension Fund Commission (PFC) monthly data files to LMRA
ANNEXED NOTE
1. Technical Notes and Definitions
The table provides figures of Bahrain’s total employed population based on their country of citizenship and sex, as registered under the public pension fund (Pension Fund Commission, PFC).
Note that the LMRA data, along with GOSI and PFC, do not include non-civilian employees (engaged in military, defense and other relevant armed forces activities, and ranked as non-civilian).Note that the LMRA data, along with GOSI and PFC, do not include non-civilian employees (engaged in military, defense and other relevant armed forces activities, and ranked as non-civilian).
Employee is defined here as who works in a paid employment job, that is to say, a job where the explicit or implicit contract of employment gives the incumbent a basic remuneration that is independent of the revenue of the unit for which he or she works (the unit can be a corporation, a non-profit institution, a government or a household).Employee is defined here as who works in a paid employment job, that is to say, a job where the explicit or implicit contract of employment gives the incumbent a basic remuneration that is independent of the revenue of the unit for which he or she works (the unit can be a corporation, a non-profit institution, a government or a household).
A Bahraini citizen is defined here as a legal national of the Kingdom of Bahrain. This category excludes nationals of the GCC.A Bahraini citizen is defined here as a legal national of the Kingdom of Bahrain. This category excludes nationals of the GCC.
A Non-Bahraini citizen is defined here as any foreigner or expatriate of a nationality other than Bahraini.A Non-Bahraini citizen is defined here as any foreigner or expatriate of a nationality other than Bahraini.
Public Sector is defined here as the one where employees are registered at the Public Fund Commission (PFC)Public Sector is defined here as the one where employees are registered at the Public Fund Commission (PFC)
Private Sector is defined here as the one where employees are registered at the General Organisation for Social Insurance (GOSI)Private Sector is defined here as the one where employees are registered at the General Organisation for Social Insurance (GOSI)
The Pension Fund Commission (PFC) provides insurance against old age, disability and death (Type A benefits) and against work-related injuries (Type B benefits) to all eligible workers in the public sector. It is now managed by the newly established SociaThe Pension Fund Commission (PFC) provides insurance against old age, disability and death (Type A benefits) and against work-related injuries (Type B benefits) to all eligible workers in the public sector. It is now managed by the newly established Socia
PFC includes under mandatory coverage:PFC includes under mandatory coverage:
1. All government employees, and Bahraini and non-Bahraini workers covered under the governmental Pension law number 13, 1975.
2. Members and officers of the armed forces and public security covered under the governmental Pension Law number 11, 1976
3. Semi governmental organization workers like the Economic Development Board.
4. Some large establishment company in private sector that prefer to register in PFC like Arab Open University.
5. Non Bahrainis governmental workers under the injuries insurance.
PFC exclusions from mandatory coverage:PFC exclusions from mandatory coverage:
1. Workers in private-sector establishments.
2. Workers in co-operatives and joint ventures not explicitly excluded.
3. Workers in agriculture enterprises, manufacturing or marketing their products, and workers operating and repairing mechanical agriculture machines, as well as guards and management.
4. Private drivers, guards, elevator operators and workers in gardeners.
5. Workers in ships including engineers and crews, operating within the territorial region.
6. Family members of employers working in the establishment, including sons and brothers above 18 years old, and daughters and married sisters.
7. Workers in probation period, workers in vocational training, workers under training, and students working during the summer.
The Social Insurance Organization (SIO) was created according to Law (3) of 2008 to replace the separate entities of PFC and GOSI. However, the laws of these public and private sector funds still apply.
2. Institution which provides data
Labour Market Regulatory Authority (LMRA)
Pension Fund Commission (PFC)
3. Data availability
The LMRA publishes these data under its Bahrain Labourr Market Indicators (BLMI) section. The BLMI dashboard can be found in: (http://blmi.lmra.bh/2014/03/mi_dashboard.xml). The general BLMI data with other non-LMRA sources can be found: (http://blmi.lmra.bh/2014/03/mi_data.xml)
Figures and results are often reported in both PDF and Excel formats.
Data for this LMRA table can be found in the Data section of the LMRA website, available for each quarter of the years: (http://blmi.lmra.bh/2014/03/mi_data.xml)
Data for this LMRA table Q4 2014 can be found: (http://blmi.lmra.bh/2014/03/data/pfc/Table_07a.pdf)
The definitions that the LMRA adopts for its data can be found in the Glossary section: (http://blmi.lmra.bh/mi_glossary.xml
For some details on the way the LMRA estimates employment, refer to the Documents page: (http://blmi.lmra.bh/mi_documents.xml)
More details on the PFC and GOSI can be found on the Social Insurance Organization (SIO) website: (https://www.sio.bh)
Date of access: July 2014
|
males |
females |
Total |
| Bahraini |
59,266 |
25,856 |
85,122 |
| Arab Nationals |
7,927 |
737 |
8,664 |
| GCC |
441 |
179 |
620 |
| Saudi Arabia |
234 |
96 |
330 |
| Kuwait |
14 |
8 |
22 |
| United Arab Emirates |
9 |
1 |
10 |
| Oman |
180 |
69 |
249 |
| Qatar |
4 |
5 |
9 |
| Other Arab |
7,486 |
558 |
8,044 |
| Iraq |
387 |
66 |
453 |
| Syrian Arab Republic |
1,278 |
104 |
1,382 |
| Lebanon |
804 |
189 |
993 |
| Yemen, Rep. of |
3,279 |
6 |
3,285 |
| West bank and Gaza strip |
191 |
21 |
212 |
| Jordan |
1,547 |
172 |
1,719 |
| Other Nationalities |
394,446 |
28,072 |
422,518 |
| Asia |
381,445 |
24,233 |
405,678 |
| India |
196,492 |
5,845 |
202,337 |
| Bangladesh |
108,795 |
388 |
109,183 |
| Pakistan |
42,002 |
427 |
42,429 |
| Philippines |
12,878 |
13,281 |
26,159 |
| Nepal |
15,027 |
768 |
15,795 |
| Sri Lanka |
3,983 |
1,948 |
5,931 |
| Thailand |
744 |
916 |
1,660 |
| China |
451 |
236 |
687 |
| Indonesia |
327 |
232 |
559 |
| Iran, Islamic Rep. of |
186 |
10 |
196 |
| Myanmar |
65 |
82 |
147 |
| Korea, Republic of |
104 |
17 |
121 |
| Japan |
106 |
3 |
109 |
| Viet Nam |
103 |
4 |
107 |
| Malaysia |
81 |
23 |
104 |
| Singapore |
27 |
14 |
41 |
| Uzbekistan |
23 |
10 |
33 |
| Kazakhstan |
9 |
9 |
18 |
| Korea, Dem. People’s Rep. of |
14 |
2 |
16 |
| Kyrgyzstan |
5 |
6 |
11 |
| Cambodia |
4 |
4 |
8 |
| Turkmenistan |
3 |
4 |
7 |
| Afghanistan |
6 |
0 |
6 |
| Azerbaijan |
5 |
0 |
5 |
| Maldives |
4 |
0 |
4 |
| Hong Kong, China |
0 |
2 |
2 |
| Taiwan, China |
1 |
1 |
2 |
| Tajikistan |
0 |
1 |
1 |
| Europe |
4,042 |
1,290 |
5,332 |
| United Kingdom |
1,659 |
544 |
2,203 |
| Turkey |
804 |
24 |
828 |
| France |
222 |
65 |
287 |
| Australia |
147 |
61 |
208 |
| Germany |
171 |
35 |
206 |
| Ireland |
118 |
78 |
196 |
| Switzerland |
97 |
50 |
147 |
| Poland |
84 |
57 |
141 |
| Italy |
103 |
20 |
123 |
| Russian Federation |
33 |
65 |
98 |
| Romania |
42 |
51 |
93 |
| Cyprus |
73 |
12 |
85 |
| Greece |
64 |
14 |
78 |
| Netherlands |
65 |
11 |
76 |
| Spain |
54 |
22 |
76 |
| Bulgaria |
27 |
40 |
67 |
| Belgium |
51 |
5 |
56 |
| Ukraine |
29 |
23 |
52 |
| Portugal |
40 |
7 |
47 |
| Belarus |
6 |
39 |
45 |
| Denmark |
23 |
4 |
27 |
| Sweden |
23 |
4 |
27 |
| Austria |
19 |
5 |
24 |
| Hungary |
8 |
6 |
14 |
| Norway |
10 |
4 |
14 |
| Finland |
10 |
3 |
13 |
| Albania |
5 |
7 |
12 |
| Estonia |
7 |
5 |
12 |
| Serbia and Montenegro |
8 |
4 |
12 |
| Slovakia |
6 |
4 |
10 |
| Croatia |
4 |
5 |
9 |
| Czech Republic |
3 |
4 |
7 |
| Bosnia and Herzegovina |
3 |
3 |
6 |
| Lithuania |
2 |
3 |
5 |
| Slovenia |
3 |
1 |
4 |
| Armenia |
2 |
1 |
3 |
| Iceland |
3 |
0 |
3 |
| Latvia |
3 |
0 |
3 |
| Georgia |
2 |
0 |
2 |
| Moldova, Rep. of |
2 |
2 |
4 |
| Malta |
7 |
2 |
9 |
| Noth America |
1,002 |
259 |
1,261 |
| United States |
726 |
173 |
899 |
| Canada |
253 |
70 |
323 |
| Mexico |
14 |
7 |
21 |
| Trinidad and Tobago |
8 |
2 |
10 |
| Dominican Republic |
1 |
7 |
8 |
| Central America |
13 |
0 |
13 |
| Guatemala |
7 |
0 |
7 |
| Panama |
3 |
0 |
3 |
| Costa Rica |
1 |
0 |
1 |
| Nicaragua |
2 |
0 |
2 |
| South America |
80 |
32 |
112 |
| Brazil |
25 |
15 |
40 |
| Colombia |
18 |
7 |
25 |
| Venezuela |
24 |
4 |
28 |
| Peru |
7 |
2 |
9 |
| Argentina |
3 |
1 |
4 |
| Uruguay |
1 |
2 |
3 |
| Chile |
2 |
0 |
2 |
| El Salvador |
0 |
1 |
1 |
| Oceania |
60 |
19 |
79 |
| New Zealand |
58 |
19 |
77 |
| Kiribati |
2 |
0 |
2 |
| Other |
9 |
5 |
14 |
| Saint Vincent and the Grenadines |
1 |
0 |
1 |
| Jamaica |
2 |
1 |
3 |
| Cayman Islands |
2 |
0 |
2 |
| Virgin Islands (British) |
2 |
1 |
3 |
| Cuba |
1 |
1 |
2 |
| Saint Lucia |
1 |
1 |
2 |
| Dominica |
0 |
1 |
1 |
| Not Specified |
7,795 |
2,234 |
10,029 |
| Total |
461,639 |
54,665 |
516,304 |
Source: Labour Market Regulatory Authority (LMRA) – Bahrain
Data extracted from files submitted by General Organisation for Social Insurance (GOSI) monthly data files to LMRA.
ANNEXED NOTE
1. Technical Notes and Definitions
The table provides figures of Bahrain’s total employed population (nationals and non-nationals) based on their country of citizenship and sex, as registered by the private sector pension fund (General Organisation for Social Insurance, GOSI).
Employee is defined here as who works in a paid employment job, that is to say, a job where the explicit or implicit contract of employment gives the incumbent a basic remuneration that is independent of the revenue of the unit for which he or she works (the unit can be a corporation, a non-profit institution, a government or a household).
A Bahraini citizen is defined here as a legal national of the Kingdom of Bahrain. This category excludes nationals of the GCC.
A Non-Bahraini citizen is defined here as any foreigner or expatriate of a nationality other than Bahraini.A Non-Bahraini citizen is defined here as any foreigner or expatriate of a nationality other than Bahraini.
Public Sector is defined here as the one where employees are registered at the Public Fund Commission (PFC)Public Sector is defined here as the one where employees are registered at the Public Fund Commission (PFC)
Private Sector is defined here as the one where employees are registered at the General Organisation for Social Insurance (GOSI)Private Sector is defined here as the one where employees are registered at the General Organisation for Social Insurance (GOSI)
General Organisation for Social Insurance (GOSI) provides insurance against old age, disability and death (Type A benefits) and against employment injuries (Type B benefits) to all eligible workers in the private sector in accordance with their employment contracts. Employers or economic units falling within the scope of the GOSI law are required to insure their employees on a mandatory basis. Other employers or economic units may insure their employees on an optional basis. It is now managed by the newly established Social Insurance Organization (SIO).General Organisation for Social Insurance (GOSI) provides insurance against old age, disability and death (Type A benefits) and against employment injuries (Type B benefits) to all eligible workers in the private sector in accordance with their employment contracts. Employers or economic units falling within the scope of the GOSI law are required to insure their employees on a mandatory basis. Other employers or economic units may insure their employees on an optional basis. It is now managed by the newly established Social Insurance Organization (SIO).
An employer under GOSI is a physical or legal person engaging one or more worker. In case, the employer has more than one branch and all have the same economic activity, they are considered as one employer. If the branches have different economic activities with separate accounts, each activity is considered as one employer.
GOSI inclusions under mandatory coverage: GOSI inclusions under mandatory coverage:
1. Workers in private-sector establishments with 10 or more workers – fourth stage 2002. On June 2004, mandatory insurance coverage was extended to workers in establishments with 5 or more workers; and as of June 2005 to workers in all establishments with one or more workers.
2. Workers in co-operatives and joint ventures not explicitly excluded
3. Workers in agriculture enterprises, manufacturing or marketing their products, and workers operating and repairing mechanical agriculture machines, as well as guards and management.
4. Private drivers, guards, elevator operators and workers in gardeners.
5. Workers in ships including engineers and crews, operating within the territorial region.
6. Family members of employers working in the establishment, including sons and brothers above 18 years old, and daughters and married sisters.
7. Workers in probation period, workers in vocational training, workers under training, and students working during the summer.
GOSI exclusions from mandatory coverage:GOSI exclusions from mandatory coverage:
1. All government employees, and Bahraini and non-Bahraini workers covered under the governmental Pension Law number 13, 1975.
2. Members and officers of the armed forces and public security.
3. Workers in public institutions expressly excluded from the Social Insurance Scheme.
4. Staff of diplomatic agencies holding the same nationality of the institution.
5. Employees working on international assignments.
6. Personnel of vessels such as engineers and screw working in international territory
7. Domestic workers.
8. Agriculture labourers in agriculture establishments not marketing or processing their products.
9. Family members of employers working in the establishment, including wives, sons and brothers below 18 year old, unmarried daughters and sisters, and parents.
10. Workers engaged on temporary jobs not more than 3 months, or on ad-hoc jobs, not forming part of the activity of the employer.
11. Expatriate workers assigned by holding companies or a branch outside Bahrain to their local branch in Bahrain for the purpose of training local employees in their work for a period not more than 12 months.
12. Students joining an establishment for practical experience, not for official training.
The Social Insurance Organization (SIO) was created according to Law (3) of 2008 to replace the separate entities of PFC and GOSI. However, the laws of each public and private sector funds still apply.
2. Institution which provides data
Labour Market Regulatory Authority (LMRA)
General Organisation for Social Insurance (GOSI)
3. Data availability
The LMRA publishes these data under its Bahrain Labourr Market Indicators (BLMI) section. The BLMI dashboard can be found in: (http://blmi.lmra.bh/2014/03/mi_dashboard.xml). The general BLMI data with other non-LMRA sources can be found: (http://blmi.lmra.bh/2014/03/mi_data.xml)
Figures and results are often reported in tables in both PDF and Excel formats.
Data for this LMRA table can be found in the Data section of the LMRA website, available for each quarter of the years: (http://blmi.lmra.bh/2014/03/mi_data.xml)
Data for Q1 2014 can be found: (http://blmi.lmra.bh/2014/03/data/gos/Table_07a.pdf)
The definitions that the LMRA adopts for its data can be found in the Glossary section: (http://blmi.lmra.bh/mi_glossary.xml)
For some details on the way the LMRA estimates employment, refer to the Documents page: (http://blmi.lmra.bh/mi_documents.xml)
More details on the PFC and GOSI can be found on the Social Insurance Organization (SIO) website: (https://www.sio.gov.bh/)
Date of access: July 2014
|
Bahraini |
Non-Bahrainis |
Total |
|
males |
females |
total |
males |
females |
total |
males |
females |
total |
| Agriculture, forestry and fishing |
1,086 |
58 |
1,144 |
6,393 |
14 |
6,407 |
7,479 |
72 |
7,551 |
| Mining and quarrying |
289 |
43 |
332 |
1,389 |
15 |
1,404 |
1,678 |
58 |
1,736 |
| Manufacturing |
14,236 |
4,865 |
19,101 |
62,901 |
2,372 |
65,273 |
77,137 |
7237 |
84,374 |
| Electricity, gas, steam and air conditioning supply |
391 |
27 |
418 |
57 |
3 |
60 |
448 |
30 |
478 |
| Water supply; sewerage, waste management and remediation activities |
113 |
27 |
140 |
548 |
3 |
551 |
661 |
30 |
691 |
| Construction |
9,626 |
4,444 |
14,070 |
145,416 |
1,222 |
146,638 |
155,042 |
5666 |
160,708 |
| Wholesale and retail trade; repair of motor vehicles and motorcycles |
15,545 |
7,915 |
23,460 |
80,226 |
5,808 |
86,034 |
95,771 |
13723 |
109,494 |
| Transportation and storage |
4,760 |
1,013 |
5,773 |
9,447 |
1,685 |
11,132 |
14,207 |
2698 |
16,905 |
| Accommodation and food service activities |
2,506 |
1,450 |
3,956 |
26,812 |
4,744 |
31,556 |
29,318 |
6194 |
35,512 |
| Information and communication |
2,197 |
957 |
3,154 |
3,557 |
425 |
3,982 |
5,754 |
1382 |
7,136 |
| Financial and insurance activities |
6,302 |
3,788 |
10,090 |
6,028 |
1,235 |
7,263 |
12,330 |
5023 |
17,353 |
| Real estate activities |
1,164 |
535 |
1,699 |
5,427 |
526 |
5,953 |
6,591 |
1061 |
7,652 |
| Professional, scientific and technical activities |
2,088 |
2,028 |
4,116 |
8,445 |
1,496 |
9,941 |
10,533 |
3524 |
14,057 |
| Administrative and support service activities |
2,915 |
1,224 |
4,139 |
14,585 |
924 |
15,509 |
17,500 |
2148 |
19,648 |
| Public administration and defence; compulsory social security |
42,751 |
12,224 |
54,975 |
25,073 |
3,009 |
28,082 |
67,824 |
15233 |
83,057 |
| Education |
5,840 |
12,029 |
17,869 |
4,870 |
1,534 |
6,404 |
10,710 |
13563 |
24,273 |
| Human health and social work activities |
464 |
650 |
1,114 |
963 |
1,339 |
2,302 |
1,427 |
1989 |
3,416 |
| Arts, entertainment and recreation |
213 |
58 |
271 |
643 |
211 |
854 |
856 |
269 |
1,125 |
| Other service activities |
727 |
1,275 |
2,002 |
8,642 |
2,221 |
10,863 |
9,369 |
3496 |
12,865 |
Activities of extraterritorial organizations and
bodies |
192 |
75 |
267 |
1,306 |
258 |
1,564 |
1,498 |
333 |
1,831 |
Activities of households as emplyers of domestic
personnel |
0 |
0 |
0 |
24,666 |
59,737 |
84,403 |
24,666 |
59737 |
84,403 |
| Not Applicable * |
7,145 |
1,797 |
8,942 |
0 |
0 |
0 |
7,145 |
1797 |
8,942 |
| Total |
120,550 |
56,482 |
177,032 |
437,394 |
88,781 |
526,175 |
557,944 |
145,263 |
703,207 |
Source: Central Informatics Organisation (CIO) – Bahrain
*Includes population working abroad
ANNEXED NOTE
1. Technical Notes and Definitions
| census year |
reference period |
implementing institution |
implementation method |
population covered |
| 1981 |
November 16 |
Ministry of Finance
Statistics Department |
field interviews |
de jure, de facto |
all individuals (nationals and non-nationals): 1- present within the country’s borders during time of reference; 2- residing in Bahrain irrespective of where are they at census times |
| 1991 |
April 6 |
Central Informatics Organisation (CIO) |
field interviews |
| 2001 |
April 7 |
field interviews; characteristics of population in collective households (among which labour camps) was obtained from sponsors |
| 2010 |
April 27 |
based on administrative records |
Nationality of the person is defined by the passport used to enter the country. A Non-Bahrainis is considered as such depending on the passport used to enter the country (or obtain the visa).
Period of reference for employment refers to the 7-days period prior to the survey.
Population of reference in table: all employed individuals (nationals and non-nationals) aged 15 and above
Employed population includes population in the following categories:
Employer: A person who operates his / her own economic enterprise or engages independently in a profession for trade and hires one or more employees.
Self-employed: A person who operates his / her own economic enterprise or engages independently in a profession or trade and hires nobody.
Paid employee: A person who works for a public or private organization and receives regular wages / salary whether in cash or in kind.
Unpaid worker: A person works for an enterprise, usually owned by some of his relatives, without receiving a salary / wage
Classification of economic activity are encoded in line with the Standard Industrial Directory of Economic Activities (ISIC-Ver. 3.1) of United Nations Statistics Division (UNSD), as noted by the CIO.
2. Institution which provides data
Central Informatics Organization, known prior to 2001 as the “Central Statistics Organisation” under the Ministry of Cabinet Affairs.
3. Data availability
Figures and results reported here are available on the Central Informatics Organisation (CIO) website. For Arabic version: (http://www.cio.gov.bh/cio_ara/default.aspx). For the English version: (http://www.cio.gov.bh/CIO_ENG/Default.aspx)
The CIO often provides its figures and estimates through tables in PDF format.
The 2010′ census figures for this table can be found: (http://www.cio.gov.bh/cio_ara/English/Publications/Census/LabourForce/4.13.pdf)
the 2010′ census figures in general can be found: (http://www.cio.gov.bh/CIO_ENG/SubDetailed.aspx?subcatid=256)
Further detailed data and definitions on the 2010 Census can be found on the census’s separate website: (http://www.census2010.gov.bh/results.php)
Further detailed data and definitions on the 2010 Census can be found on the census’s separate website: (http://www.census2010.gov.bh/results.php)
General information on the classifications used under the CIO can be found: (http://www.cio.gov.bh/cio_eng/SubDetailed.aspx?subcatid=278)
Information on the ISIC-Ver. 3.1 classification used under the CIO can be found: (http://unstats.un.org/unsd/cr/registry/regcst.asp?Cl=17)
Date of access: July 2014
|
Bahraini |
Non-Bahrainis |
Total |
|
males |
females |
total |
males |
females |
total |
males |
females |
total |
| Agriculture and Animal Husbandry |
763 |
54 |
817 |
1,430 |
22 |
1,452 |
2,193 |
76 |
2,269 |
| Fishing |
862 |
30 |
892 |
1,314 |
8 |
1,322 |
2,176 |
38 |
2,214 |
| Mining and Quarrying |
1,958 |
166 |
2,124 |
625 |
31 |
656 |
2,583 |
197 |
2,780 |
| Manufacturing |
9,606 |
3,925 |
13,531 |
33,127 |
3,321 |
36,448 |
42,733 |
7,246 |
49,979 |
| Electricity, Gas and Water |
1,270 |
82 |
1,352 |
1,151 |
12 |
1,163 |
2,421 |
94 |
2,515 |
| Construction |
4,061 |
351 |
4,412 |
21,908 |
98 |
22,006 |
25,969 |
449 |
26,418 |
| Trades and Repairs |
8,041 |
2,414 |
10,455 |
23,086 |
934 |
24,020 |
31,127 |
3,348 |
34,475 |
| Restaurants and Hotels |
2,020 |
427 |
2,447 |
9,181 |
1,465 |
10,646 |
11,201 |
1,892 |
13,093 |
| Transport, Storage and Communications |
8,230 |
1,070 |
9,300 |
3,391 |
1,078 |
4,469 |
11,621 |
2,148 |
13,769 |
| Banks, insurance and finance |
3,070 |
1,534 |
4,604 |
1,531 |
340 |
1,871 |
4,601 |
1,874 |
6,475 |
| Real Estate and Business |
4,143 |
1,076 |
5,219 |
10,516 |
478 |
10,994 |
14,659 |
1,554 |
16,213 |
| Government, Defense, Foreign Affairs and Security |
29,292 |
3,910 |
33,202 |
18,841 |
345 |
19,186 |
48,133 |
4,255 |
52,388 |
| Educational Establishment |
3,894 |
6,528 |
10,422 |
1,838 |
1,297 |
3,135 |
5,732 |
7,825 |
13,557 |
| Hospital, Health Center, Clinic and Social Work |
2,462 |
3,200 |
5,662 |
717 |
1,196 |
1,913 |
3,179 |
4,396 |
7,575 |
| Community, Social and Personal Services |
3,131 |
1,104 |
4,235 |
5,644 |
666 |
6,310 |
8,775 |
1,770 |
10,545 |
| Households with Employed Persons |
63 |
31 |
94 |
7,599 |
21,886 |
29,485 |
7,662 |
21,917 |
29,579 |
| Regional and Inter-regional Organisations |
118 |
49 |
167 |
1,493 |
447 |
1,940 |
1,611 |
496 |
2,107 |
| Not Applicable* |
1,936 |
116 |
2,052 |
3,212 |
163 |
3,375 |
5,148 |
279 |
5,427 |
| Total |
84,920 |
26,067 |
110,987 |
146,604 |
33,787 |
180,391 |
231,524 |
59,854 |
291,378 |
Source: Central Informatics Organisation (CIO) – Bahrain
*Includes population working abroad
ANNEXED NOTE
1. Technical Notes and Definitions
| census year |
reference period |
implementing institution |
implementation method |
population covered |
| 1981 |
November 16 |
Ministry of Finance
Statistics Department |
field interviews |
de jure, de facto |
all individuals (nationals and non-nationals): 1- present within the country’s borders during time of reference; 2- residing in Bahrain irrespective of where are they at census times |
| 1991 |
April 6 |
Central Informatics Organisation (CIO) |
field interviews |
| 2001 |
April 7 |
field interviews; characteristics of population in collective households (among which labour camps) was obtained from sponsors |
| 2010 |
April 27 |
based on administrative records |
Nationality of the person is defined by the passport used to enter the country. A Non-Bahrainis is considered as such depending on the passport used to enter the country (or obtain the visa).
Period of reference for employment refers to the 7-days period prior to the survey.
Population of reference in table: all employed individuals (nationals and non-nationals) aged 15 and above
Employed population includes population in the following categories:
Employer: A person who operates his / her own economic enterprise or engages independently in a profession for trade and hires one or more employees.
Self-employed: A person who operates his / her own economic enterprise or engages independently in a profession or trade and hires nobody.
Paid employee: A person who works for a public or private organization and receives regular wages / salary whether in cash or in kind.
Unpaid worker: A person works for an enterprise, usually owned by some of his relatives, without receiving a salary / wage
Classification of economic activity are encoded in line with the Standard Industrial Directory of Economic Activities (ISIC-Ver. 3.1) of United Nations Statistics Division (UNSD), as noted by the CIO.
2. Institution which provides data
Central Informatics Organization, known prior to 2001 as the “Central Statistics Organisation” under the Ministry of Cabinet Affairs.
3. Data availability
Figures and results reported here are available on the Central Informatics Organisation (CIO) website. For Arabic version: (http://www.cio.gov.bh/cio_ara/default.aspx). For the English version: (http://www.cio.gov.bh/CIO_ENG/Default.aspx)
The CIO often provides its figures and estimates through tables in PDF format.
The 2001′ census figures for this table can be found: (http://www.cio.gov.bh/cio_ara/English/Publications/Statistical%20Abstract/ABS2009/CH11/10B.pdf)
They can also be found in Statistical Abstract 2002, Labor Force section: (http://www.cio.gov.bh/cio_ara/English/Publications/Statistical%20Abstract/2002/Ch11%20%202002.pdf)
General information on the classifications used under the CIO can be found: (http://www.cio.gov.bh/cio_eng/SubDetailed.aspx?subcatid=278)
Information on the ISIC-Ver. 3.1 classification used under the CIO can be found: (http://unstats.un.org/unsd/cr/registry/regcst.asp?Cl=17)
Date of access: July 2014
|
Bahraini |
Non-Bahrainis |
Total |
|
males |
females |
total |
males |
females |
total |
males |
females |
total |
| Agriculture and Animal Husbandry |
951 |
30 |
981 |
2213 |
19 |
2,232 |
3,164 |
49 |
3,213 |
| Fishing |
991 |
18 |
1,009 |
881 |
5 |
886 |
1,872 |
23 |
1,895 |
| Mining and Quarrying |
2,661 |
115 |
2,776 |
808 |
54 |
862 |
3,469 |
169 |
3,638 |
| Manufacturing |
5,883 |
518 |
6,401 |
18681 |
1,536 |
20,217 |
24,564 |
2,054 |
26,618 |
| Electricity, Gas and Water |
946 |
37 |
983 |
1895 |
20 |
1,915 |
2,841 |
57 |
2,898 |
| Construction |
2,077 |
69 |
2,146 |
24426 |
166 |
24,592 |
26,503 |
235 |
26,738 |
| Trades and Repairs |
5,604 |
504 |
6,108 |
16096 |
828 |
16,924 |
21,700 |
1,332 |
23,032 |
| Restaurants and Hotels |
689 |
89 |
778 |
5500 |
651 |
6,151 |
6,189 |
740 |
6,929 |
| Transport, Storage and Communications |
7,327 |
803 |
8,130 |
4821 |
838 |
5,659 |
12,148 |
1,641 |
13,789 |
| Real Estate and Business |
2,540 |
1132 |
3,672 |
1261 |
333 |
1,594 |
3,801 |
1,465 |
5,266 |
| Real Estate and Business |
1,897 |
281 |
2,178 |
9437 |
375 |
9,812 |
11,334 |
656 |
11,990 |
| Government, Defense, Foreign Affairs and Security |
23,749 |
3066 |
26,815 |
13696 |
441 |
14,137 |
37,445 |
3,507 |
40,952 |
| Educational Establishment |
3,046 |
4158 |
7,204 |
1709 |
1,531 |
3,240 |
4,755 |
5,689 |
10,444 |
| Hospital, Health Center, Clinic and Social Work |
1,610 |
1753 |
3,363 |
668 |
1,110 |
1,778 |
2,278 |
2,863 |
5,141 |
| Community, Social and Personal Services |
2,769 |
470 |
3,239 |
5239 |
432 |
5,671 |
8,008 |
902 |
8,910 |
| Households with Employed Persons |
37 |
16 |
53 |
4434 |
13,267 |
17,701 |
4,471 |
13,283 |
17,754 |
| Regional and Inter-regional Organisations |
114 |
41 |
155 |
489 |
99 |
588 |
603 |
140 |
743 |
| Unknown |
142 |
5 |
147 |
817 |
26 |
843 |
959 |
31 |
990 |
| Not Applicable* |
1,050 |
80 |
1,130 |
0 |
0 |
0 |
1,050 |
80 |
1,130 |
| Total |
64,083 |
13,185 |
77,268 |
113,071 |
21,731 |
134,802 |
177,154 |
34,916 |
212,070 |
Source: Central Informatics Organisation (CIO) – Bahrain
*Bahrainis working abroad
ANNEXED NOTE
1. Technical Notes and Definitions
| census year |
reference period |
implementing institution |
implementation method |
population covered |
| 1981 |
November 16 |
Ministry of Finance
Statistics Department |
field interviews |
de jure, de facto |
all individuals (nationals and non-nationals): 1- present within the country’s borders during time of reference; 2- residing in Bahrain irrespective of where are they at census times |
| 1991 |
April 6 |
Central Informatics Organisation (CIO) |
field interviews |
| 2001 |
April 7 |
field interviews; characteristics of population in collective households (among which labour camps) was obtained from sponsors |
| 2010 |
April 27 |
based on administrative records |
Nationality of the person is defined by the passport used to enter the country. A Non-Bahrainis is considered as such depending on the passport used to enter the country (or obtain the visa).
Period of reference for employment refers to the 7-days period prior to the survey.
Population of reference in table: all employed individuals (nationals and non-nationals) aged 15 and above
Employed population includes population in the following categories:
Employer: A person who operates his / her own economic enterprise or engages independently in a profession for trade and hires one or more employees.
Self-employed: A person who operates his / her own economic enterprise or engages independently in a profession or trade and hires nobody.
Paid employee: A person who works for a public or private organization and receives regular wages / salary whether in cash or in kind.
Unpaid worker: A person works for an enterprise, usually owned by some of his relatives, without receiving a salary / wage
Classification of economic activity are encoded in line with the Standard Industrial Directory of Economic Activities (ISIC) of United Nations Statistics Division (UNSD), as noted by the CIO.
2. Institution which provides data
Central Informatics Organization, known prior to 2001 as the “Central Statistics Organisation” under the Ministry of Cabinet Affairs.
3. Data availability
Figures and results reported here are available on the Central Informatics Organisation (CIO) website. For Arabic version: (http://www.cio.gov.bh/cio_ara/default.aspx). For the English version: (http://www.cio.gov.bh/CIO_ENG/Default.aspx)
The CIO often provides its figures and estimates through tables in PDF format.
These 1991′ census figures can be found: (http://www.cio.gov.bh/CIO_ARA/English/Publications/Statistical%20Abstract/ABS2009/CH11/10A.pdf)
They can also be found in the Statistical Abstract 2000, Labor Force section: (http://www.cio.gov.bh/CIO_ENG/SubDetailed.aspx?subcatid=172)
General information on the classifications used under the CIO can be found: (http://www.cio.gov.bh/cio_eng/SubDetailed.aspx?subcatid=278)
Information on the ISIC classification used under the CIO can be found: (http://unstats.un.org/unsd/iiss/International-Standard-Industrial-Classification-of-all-Economic-Activities-ISIC.ashx)
Date of access: July 2014
|
Bahraini |
Non-Bahrainis |
Total |
|
males |
females |
total |
males |
females |
total |
males |
females |
total |
| Agriculture and Fishing |
2,406 |
14 |
2,420 |
1263 |
8 |
1,271 |
3,669 |
22 |
3,691 |
| Mining and Quarrying |
3,520 |
82 |
3,602 |
1094 |
76 |
1,170 |
4,614 |
158 |
4,772 |
| Manufacturing |
3,681 |
141 |
3,822 |
7399 |
133 |
7,532 |
11,080 |
274 |
11,354 |
| Electricity, Gas and Water |
1,765 |
81 |
1,846 |
972 |
27 |
999 |
2,737 |
108 |
2,845 |
| Construction |
3,793 |
59 |
3,852 |
25208 |
148 |
25,356 |
29,001 |
207 |
29,208 |
| Wholesale, Retail Trade, Restaurants and Hotels |
5,478 |
345 |
5,823 |
12256 |
414 |
12,670 |
17,734 |
759 |
18,493 |
| Transport, Storage and Communications |
7,903 |
730 |
8,633 |
3957 |
567 |
4,524 |
11,860 |
1,297 |
13,157 |
| Financing, Insurance, Real Estate and Business Services |
1,878 |
901 |
2,779 |
1490 |
345 |
1,835 |
3,368 |
1,246 |
4,614 |
| Community, Social and Personal Services |
16,994 |
5374 |
22,368 |
20083 |
5,064 |
25,147 |
37,077 |
10,438 |
47,515 |
| Non-Specified Activities |
125 |
22 |
147 |
195 |
15 |
210 |
320 |
37 |
357 |
| Bahrainis Working Abroad |
1,761 |
125 |
1,886 |
0 |
0 |
0 |
1,761 |
125 |
1,886 |
| Total |
49,304 |
7,874 |
57,178 |
73,917 |
6,797 |
80,714 |
123,221 |
14,671 |
137,892 |
Source: Central Informatics Organisation (CIO) – Bahrain
ANNEXED NOTE
1. Technical Notes and Definitions
|
|
|
|
|
|
| census year |
reference period |
implementing institution |
implementation method |
population covered |
| 1981 |
November 16 |
Ministry of Finance
Statistics Department |
field interviews |
de jure, de facto |
all individuals (nationals and non-nationals): 1- present within the country’s borders during time of reference; 2- residing in Bahrain irrespective of where are they at census times |
| 1991 |
April 6 |
Central Informatics Organisation (CIO) |
field interviews |
| 2001 |
April 7 |
field interviews; characteristics of population in collective households (among which labour camps) was obtained from sponsors |
| 2010 |
April 27 |
based on administrative records |
Nationality of the person is defined by the passport used to enter the country. A Non-Bahrainis is considered as such depending on the passport used to enter the country (or obtain the visa).
Period of reference for employment refers to the 7-days period prior to the survey.
Population of reference in table: all employed individuals (nationals and non-nationals) aged 15 and above
Employed population includes population in the following categories:
Employer: A person who operates his / her own economic enterprise or engages independently in a profession for trade and hires one or more employees.
Self-employed: A person who operates his / her own economic enterprise or engages independently in a profession or trade and hires nobody.
Paid employee: A person who works for a public or private organization and receives regular wages / salary whether in cash or in kind.
Unpaid worker: A person works for an enterprise, usually owned by some of his relatives, without receiving a salary / wage
Classification of economic activity are encoded in line with the Standard Industrial Directory of Economic Activities (ISIC) of United Nations Statistics Division, as noted by the CIO.
2. Institution which provides data
Central Informatics Organization, known prior to 2001 as the “Central Statistics Organisation” under the Ministry of Cabinet Affairs.
3. Data availability
Figures and results reported here are available on the Central Informatics Organisation (CIO) website. For Arabic version: (http://www.cio.gov.bh/cio_ara/default.aspx). For the English version: (http://www.cio.gov.bh/CIO_ENG/Default.aspx)
The CIO often provides its figures and estimates through tables in PDF format.
These 1981′ census figures can be found in the Statistical Abstract 2000, Labor Force section: (http://www.cio.gov.bh/CIO_ENG/SubDetailed.aspx?subcatid=172)
General information on the classifications used under the CIO can be found: (http://www.cio.gov.bh/cio_eng/SubDetailed.aspx?subcatid=278)
Information on the ISIC classification used under the CIO can be found: (http://unstats.un.org/unsd/iiss/International-Standard-Industrial-Classification-of-all-Economic-Activities-ISIC.ashx)
Date of access: July 2014
|
15-19 |
20-24 |
25-29 |
30-34 |
35-39 |
40-44 |
45-49 |
50-54 |
55-59 |
60-64 |
65 years and above |
Total |
|
males |
females |
total |
males |
females |
total |
males |
females |
total |
males |
females |
total |
males |
females |
total |
males |
females |
total |
males |
females |
total |
males |
females |
total |
males |
females |
total |
males |
females |
total |
males |
females |
total |
males |
females |
total |
| Agriculture, forestry and fishing |
6 |
0 |
6 |
398 |
2 |
400 |
1,685 |
0 |
1,685 |
1,446 |
2 |
1,448 |
1,185 |
2 |
1,187 |
834 |
2 |
836 |
497 |
1 |
498 |
231 |
3 |
234 |
84 |
1 |
85 |
21 |
0 |
21 |
6 |
1 |
7 |
6,393 |
14 |
6,407 |
| Mining and quarrying |
1 |
0 |
1 |
88 |
2 |
90 |
196 |
4 |
200 |
223 |
3 |
226 |
241 |
2 |
243 |
220 |
2 |
222 |
158 |
1 |
159 |
164 |
1 |
165 |
74 |
0 |
74 |
19 |
0 |
19 |
5 |
0 |
5 |
1,389 |
15 |
1,404 |
| Manufacturing |
92 |
17 |
109 |
5,009 |
310 |
5,319 |
15,210 |
647 |
15,857 |
13,107 |
492 |
13,599 |
10,521 |
357 |
10,878 |
7,956 |
190 |
8,146 |
5,185 |
151 |
5,336 |
3,584 |
102 |
3,686 |
1,699 |
71 |
1,770 |
418 |
24 |
442 |
120 |
11 |
131 |
62,901 |
2,372 |
65,273 |
| Electricity, gas, steam and air conditioning supply |
0 |
0 |
0 |
0 |
0 |
0 |
6 |
2 |
8 |
3 |
1 |
4 |
12 |
0 |
12 |
9 |
0 |
9 |
9 |
0 |
9 |
8 |
0 |
8 |
6 |
0 |
6 |
3 |
0 |
3 |
1 |
0 |
1 |
57 |
3 |
60 |
| Water supply; sewerage, waste management and remediation activities |
0 |
0 |
0 |
38 |
0 |
38 |
115 |
0 |
115 |
109 |
0 |
109 |
97 |
2 |
99 |
89 |
0 |
89 |
56 |
0 |
56 |
25 |
0 |
25 |
16 |
1 |
17 |
3 |
0 |
3 |
0 |
0 |
0 |
548 |
3 |
551 |
| Construction |
173 |
0 |
173 |
14,053 |
148 |
14,201 |
38,780 |
322 |
39,102 |
31,459 |
240 |
31,699 |
24,290 |
199 |
24,489 |
17,223 |
154 |
17,377 |
9,831 |
96 |
9,927 |
6,367 |
41 |
6,408 |
2,620 |
13 |
2,633 |
543 |
9 |
552 |
77 |
0 |
77 |
145,416 |
1,222 |
146,638 |
| Wholesale and retail trade; repair of motor vehicles and motorcycles |
144 |
12 |
156 |
6,666 |
677 |
7,343 |
17,794 |
1,525 |
19,319 |
16,597 |
1,287 |
17,884 |
13,672 |
872 |
14,544 |
10,140 |
636 |
10,776 |
6,903 |
426 |
7,329 |
5,023 |
237 |
5,260 |
2,439 |
91 |
2,530 |
612 |
31 |
643 |
236 |
14 |
250 |
80,226 |
5,808 |
86,034 |
| Transportation and storage |
9 |
0 |
9 |
549 |
307 |
856 |
2,110 |
641 |
2,751 |
1,912 |
340 |
2,252 |
1,602 |
185 |
1,787 |
1,285 |
99 |
1,384 |
798 |
62 |
860 |
672 |
36 |
708 |
369 |
14 |
383 |
115 |
1 |
116 |
26 |
0 |
26 |
9,447 |
1,685 |
11,132 |
| Accommodation and food service activities |
77 |
14 |
91 |
2,449 |
751 |
3,200 |
6,849 |
1,549 |
8,398 |
5,982 |
1,119 |
7,101 |
4,662 |
590 |
5,252 |
3,003 |
347 |
3,350 |
1,854 |
222 |
2,076 |
1,258 |
110 |
1,368 |
527 |
33 |
560 |
123 |
8 |
131 |
28 |
1 |
29 |
26,812 |
4,744 |
31,556 |
| Information and communication |
4 |
2 |
6 |
174 |
35 |
209 |
1,017 |
145 |
1,162 |
877 |
83 |
960 |
531 |
51 |
582 |
378 |
47 |
425 |
255 |
39 |
294 |
161 |
13 |
174 |
111 |
8 |
119 |
37 |
2 |
39 |
12 |
0 |
12 |
3,557 |
425 |
3,982 |
| Financial and insurance activities |
3 |
1 |
4 |
184 |
74 |
258 |
964 |
285 |
1,249 |
1,254 |
292 |
1,546 |
1,105 |
202 |
1,307 |
829 |
140 |
969 |
640 |
114 |
754 |
505 |
78 |
583 |
335 |
39 |
374 |
150 |
10 |
160 |
59 |
0 |
59 |
6,028 |
1,235 |
7,263 |
| Real estate activities |
7 |
3 |
10 |
415 |
77 |
492 |
1,107 |
116 |
1,223 |
1,087 |
120 |
1,207 |
955 |
81 |
1,036 |
773 |
49 |
822 |
465 |
37 |
502 |
384 |
29 |
413 |
154 |
5 |
159 |
50 |
6 |
56 |
30 |
3 |
33 |
5,427 |
526 |
5,953 |
| Professional, scientific and technical activities |
7 |
3 |
10 |
400 |
116 |
516 |
1,520 |
396 |
1,916 |
1,669 |
337 |
2,006 |
1,468 |
229 |
1,697 |
1,120 |
180 |
1,300 |
858 |
105 |
963 |
670 |
69 |
739 |
416 |
42 |
458 |
214 |
13 |
227 |
103 |
6 |
109 |
8,445 |
1,496 |
9,941 |
| Administrative and support service activities |
25 |
1 |
26 |
1,528 |
115 |
1,643 |
4,057 |
247 |
4,304 |
2,916 |
178 |
3,094 |
2,409 |
128 |
2,537 |
1,697 |
119 |
1,816 |
969 |
79 |
1,048 |
581 |
36 |
617 |
310 |
15 |
325 |
59 |
6 |
65 |
34 |
0 |
34 |
14,585 |
924 |
15,509 |
| Public administration and defence; compulsory social security |
97 |
10 |
107 |
1,291 |
98 |
1,389 |
2,519 |
467 |
2,986 |
3,591 |
816 |
4,407 |
4,023 |
535 |
4,558 |
4,039 |
374 |
4,413 |
3,787 |
278 |
4,065 |
3,340 |
215 |
3,555 |
1,669 |
159 |
1,828 |
486 |
43 |
529 |
231 |
14 |
245 |
25,073 |
3,009 |
28,082 |
| Education |
1 |
0 |
1 |
65 |
53 |
118 |
377 |
220 |
597 |
869 |
292 |
1,161 |
1,115 |
267 |
1,382 |
879 |
222 |
1,101 |
670 |
156 |
826 |
393 |
143 |
536 |
280 |
125 |
405 |
133 |
39 |
172 |
88 |
17 |
105 |
4,870 |
1,534 |
6,404 |
| Human health and social work activities |
0 |
1 |
1 |
42 |
92 |
134 |
121 |
326 |
447 |
172 |
285 |
457 |
165 |
264 |
429 |
147 |
178 |
325 |
98 |
76 |
174 |
96 |
62 |
158 |
68 |
40 |
108 |
38 |
13 |
51 |
16 |
2 |
18 |
963 |
1,339 |
2,302 |
| Arts, entertainment and recreation |
2 |
0 |
2 |
57 |
22 |
79 |
128 |
57 |
185 |
117 |
47 |
164 |
112 |
25 |
137 |
82 |
31 |
113 |
71 |
12 |
83 |
43 |
9 |
52 |
26 |
7 |
33 |
3 |
1 |
4 |
2 |
0 |
2 |
643 |
211 |
854 |
| Other service activities |
23 |
7 |
30 |
843 |
207 |
1,050 |
2,224 |
388 |
2,612 |
1,828 |
422 |
2,250 |
1,423 |
425 |
1,848 |
1,012 |
320 |
1,332 |
608 |
250 |
858 |
422 |
127 |
549 |
194 |
56 |
250 |
45 |
17 |
62 |
20 |
2 |
22 |
8,642 |
2,221 |
10,863 |
Activities of extraterritorial organizations and
bodies |
1 |
0 |
1 |
27 |
6 |
33 |
80 |
32 |
112 |
154 |
49 |
203 |
221 |
49 |
270 |
239 |
45 |
284 |
205 |
31 |
236 |
176 |
29 |
205 |
126 |
11 |
137 |
51 |
6 |
57 |
26 |
0 |
26 |
1,306 |
258 |
1,564 |
| Activities of households as employers of domestic personnel |
80 |
137 |
217 |
1,930 |
8,929 |
10,859 |
4,615 |
12,805 |
17,420 |
4,650 |
11,202 |
15,852 |
4,054 |
10,234 |
14,288 |
3,268 |
7,683 |
10,951 |
2,466 |
5,066 |
7,532 |
2,088 |
2,411 |
4,499 |
974 |
908 |
1,882 |
348 |
252 |
600 |
193 |
110 |
303 |
24,666 |
59,737 |
84,403 |
| Total |
752 |
208 |
960 |
36,206 |
12,021 |
48,227 |
101,474 |
20,174 |
121,648 |
90,022 |
17,607 |
107,629 |
73,863 |
14,699 |
88,562 |
55,222 |
10,818 |
66,040 |
36,383 |
7,202 |
43,585 |
26,191 |
3,751 |
29,942 |
12,497 |
1,639 |
14,136 |
3,471 |
481 |
3,952 |
1,313 |
181 |
1,494 |
437,394 |
88,781 |
526,175 |
Source: Central Informatics Organisation (CIO) – Bahrain
ANNEXED NOTE
1. Technical Notes and Definitions
| census year |
reference period |
implementing institution |
implementation method |
population covered |
| 1981 |
November 16 |
Ministry of Finance
Statistics Department |
field interviews |
de jure, de facto |
all individuals (nationals and non-nationals): 1- present within the country’s borders during time of reference; 2- residing in Bahrain irrespective of where are they at census times |
| 1991 |
April 6 |
Central Informatics Organisation (CIO) |
field interviews |
| 2001 |
April 7 |
field interviews; characteristics of population in collective households (among which labour camps) was obtained from sponsors |
| 2010 |
April 27 |
based on administrative records |
Nationality of the person is defined by the passport used to enter the country. A Non-Bahrainis is considered as such depending on the passport used to enter the country (or obtain the visa).
Period of reference for employment refers to the 7-days period prior to the survey.
Population of reference in table: all employed individuals (nationals and non-nationals) aged 15 and above
Employed population includes population in the following categories:
Employer: A person who operates his / her own economic enterprise or engages independently in a profession for trade and hires one or more employees.
Self-employed: A person who operates his / her own economic enterprise or engages independently in a profession or trade and hires nobody.
Paid employee: A person who works for a public or private organization and receives regular wages / salary whether in cash or in kind.
Unpaid worker: A person works for an enterprise, usually owned by some of his relatives, without receiving a salary / wage
Classification of economic activity are encoded in line with the Standard Industrial Directory of Economic Activities (ISIC-Ver. 3.1) of United Nations Statistics Division (UNSD), as noted by the CIO.
2. Institution which provides data
Central Informatics Organization, known prior to 2001 as the “Central Statistics Organisation” under the Ministry of Cabinet Affairs
3. Data availability
Figures and results reported here are available on the Central Informatics Organisation (CIO) website. For Arabic version: (http://www.cio.gov.bh/cio_ara/default.aspx). For the English version: (http://www.cio.gov.bh/CIO_ENG/Default.aspx)
The CIO often provides its figures and estimates through tables in PDF format
the 2010′ census figures in general can be found: (http://www.cio.gov.bh/CIO_ENG/SubDetailed.aspx?subcatid=256)
The 2010′ census figures for this table can be found: (http://www.cio.gov.bh/cio_eng/SubDetailed.aspx?subcatid=493)
More specifically, the employed national population is split into two tables. The figures for the male population can be found: (http://www.cio.gov.bh/cio_ara/English/Publications/Census/LabourForce/4.14.8.pdf), and for the female population: (http://www.cio.gov.bh/cio_ara/English/Publications/Census/LabourForce/4.14.6.pdf)
Further detailed data and definitions on the 2010 Census can be found on the census’s separate website: (http://www.census2010.gov.bh/results.php)
General information on the classifications used under the CIO can be found: (http://www.cio.gov.bh/cio_eng/SubDetailed.aspx?subcatid=278)
Information on the ISIC-Ver. 3.1 classification used under the CIO can be found: (http://unstats.un.org/unsd/cr/registry/regcst.asp?Cl=17)
Date of access: July 2014
|
15-19 |
20-24 |
25-29 |
30-34 |
35-39 |
40-44 |
45-49 |
50-54 |
55-59 |
60-64 |
65 years and above |
Total |
|
males |
females |
total |
males |
females |
total |
males |
females |
total |
males |
females |
total |
males |
females |
total |
males |
females |
total |
males |
females |
total |
males |
females |
total |
males |
females |
total |
males |
females |
total |
males |
females |
total |
males |
females |
total |
| Agriculture, forestry and fishing |
0 |
0 |
0 |
46 |
2 |
48 |
77 |
3 |
80 |
123 |
0 |
123 |
97 |
5 |
102 |
100 |
5 |
105 |
103 |
7 |
110 |
115 |
10 |
125 |
105 |
6 |
111 |
88 |
8 |
96 |
232 |
12 |
244 |
1,086 |
58 |
1,144 |
| Mining and quarrying |
6 |
0 |
6 |
46 |
6 |
52 |
67 |
12 |
79 |
65 |
7 |
72 |
37 |
4 |
41 |
22 |
5 |
27 |
18 |
3 |
21 |
13 |
3 |
16 |
9 |
3 |
12 |
2 |
0 |
2 |
4 |
0 |
4 |
289 |
43 |
332 |
| Manufacturing |
337 |
44 |
381 |
1,679 |
517 |
2,196 |
2,325 |
774 |
3,099 |
2,390 |
858 |
3,248 |
2,058 |
682 |
2,740 |
1,513 |
628 |
2,141 |
1,458 |
532 |
1,990 |
1,169 |
394 |
1,563 |
775 |
203 |
978 |
235 |
91 |
326 |
297 |
142 |
439 |
14,236 |
4,865 |
19,101 |
| Electricity, gas, steam and air conditioning supply |
1 |
0 |
1 |
31 |
1 |
32 |
62 |
6 |
68 |
54 |
3 |
57 |
28 |
2 |
30 |
70 |
6 |
76 |
71 |
8 |
79 |
42 |
1 |
43 |
28 |
0 |
28 |
4 |
0 |
4 |
0 |
0 |
0 |
391 |
27 |
418 |
| Water supply; sewerage, waste management and remediation activities |
2 |
0 |
2 |
22 |
4 |
26 |
30 |
7 |
37 |
20 |
3 |
23 |
14 |
4 |
18 |
10 |
1 |
11 |
0 |
2 |
2 |
5 |
2 |
7 |
5 |
1 |
6 |
0 |
2 |
2 |
5 |
1 |
6 |
113 |
27 |
140 |
| Construction |
394 |
83 |
477 |
2,116 |
662 |
2,778 |
1,812 |
826 |
2,638 |
1,410 |
736 |
2,146 |
900 |
621 |
1,521 |
645 |
591 |
1,236 |
573 |
463 |
1,036 |
556 |
296 |
852 |
507 |
102 |
609 |
280 |
38 |
318 |
433 |
26 |
459 |
9,626 |
4,444 |
14,070 |
| Wholesale and retail trade; repair of motor vehicles and motorcycles |
|
|
0 |
|
|
0 |
|
|
0 |
|
|
0 |
|
|
0 |
|
|
0 |
|
|
0 |
|
|
0 |
|
|
0 |
|
|
0 |
|
|
0 |
0 |
0 |
0 |
| Transportation and storage |
456 |
143 |
599 |
2,958 |
1,296 |
4,254 |
2,652 |
1,430 |
4,082 |
2,348 |
1,291 |
3,639 |
1,537 |
965 |
2,502 |
1,202 |
856 |
2,058 |
1,068 |
704 |
1,772 |
1,027 |
503 |
1,530 |
898 |
314 |
1,212 |
479 |
185 |
664 |
920 |
228 |
1,148 |
15,545 |
7,915 |
23,460 |
| Accommodation and food service activities |
55 |
14 |
69 |
571 |
155 |
726 |
824 |
233 |
1,057 |
748 |
162 |
910 |
642 |
125 |
767 |
618 |
147 |
765 |
515 |
108 |
623 |
410 |
54 |
464 |
248 |
10 |
258 |
76 |
4 |
80 |
53 |
1 |
54 |
4,760 |
1,013 |
5,773 |
| Information and communication |
137 |
25 |
162 |
652 |
171 |
823 |
453 |
236 |
689 |
370 |
244 |
614 |
230 |
184 |
414 |
156 |
181 |
337 |
171 |
163 |
334 |
139 |
111 |
250 |
77 |
60 |
137 |
48 |
37 |
85 |
73 |
38 |
111 |
2,506 |
1,450 |
3,956 |
| Financial and insurance activities |
22 |
5 |
27 |
386 |
181 |
567 |
500 |
310 |
810 |
291 |
195 |
486 |
177 |
85 |
262 |
237 |
78 |
315 |
284 |
58 |
342 |
194 |
34 |
228 |
70 |
7 |
77 |
19 |
2 |
21 |
17 |
2 |
19 |
2,197 |
957 |
3,154 |
| Real estate activities |
25 |
8 |
33 |
957 |
704 |
1,661 |
1,599 |
1,301 |
2,900 |
1,079 |
698 |
1,777 |
611 |
332 |
943 |
596 |
283 |
879 |
638 |
256 |
894 |
457 |
154 |
611 |
241 |
36 |
277 |
65 |
12 |
77 |
34 |
4 |
38 |
6,302 |
3,788 |
10,090 |
| Professional, scientific and technical activities |
8 |
7 |
15 |
161 |
70 |
231 |
202 |
116 |
318 |
163 |
70 |
233 |
104 |
44 |
148 |
105 |
41 |
146 |
93 |
46 |
139 |
89 |
48 |
137 |
75 |
40 |
115 |
67 |
21 |
88 |
97 |
32 |
129 |
1,164 |
535 |
1,699 |
| Administrative and support service activities |
27 |
12 |
39 |
439 |
351 |
790 |
552 |
840 |
1,392 |
291 |
332 |
623 |
191 |
169 |
360 |
140 |
111 |
251 |
141 |
93 |
234 |
92 |
66 |
158 |
95 |
35 |
130 |
64 |
11 |
75 |
56 |
8 |
64 |
2,088 |
2,028 |
4,116 |
| Public administration and defence; compulsory social security |
82 |
12 |
94 |
720 |
218 |
938 |
641 |
243 |
884 |
436 |
175 |
611 |
287 |
173 |
460 |
188 |
153 |
341 |
175 |
139 |
314 |
159 |
72 |
231 |
104 |
26 |
130 |
62 |
5 |
67 |
61 |
8 |
69 |
2,915 |
1,224 |
4,139 |
| Education |
136 |
21 |
157 |
3,159 |
961 |
4,120 |
5,999 |
2,389 |
8,388 |
6,148 |
2,288 |
8,436 |
5,820 |
1,733 |
7,553 |
6,538 |
1,474 |
8,012 |
6,284 |
1,531 |
7,815 |
4,602 |
1,167 |
5,769 |
2,579 |
535 |
3,114 |
938 |
105 |
1,043 |
548 |
20 |
568 |
42,751 |
12,224 |
54,975 |
| Human health and social work activities |
1 |
4 |
5 |
186 |
423 |
609 |
753 |
1,935 |
2,688 |
1,150 |
2,524 |
3,674 |
1,024 |
2,141 |
3,165 |
763 |
1,748 |
2,511 |
627 |
1,402 |
2,029 |
558 |
1,093 |
1,651 |
439 |
481 |
920 |
232 |
207 |
439 |
107 |
71 |
178 |
5,840 |
12,029 |
17,869 |
| Arts, entertainment and recreation |
3 |
6 |
9 |
79 |
118 |
197 |
88 |
144 |
232 |
54 |
100 |
154 |
59 |
87 |
146 |
35 |
55 |
90 |
33 |
54 |
87 |
21 |
32 |
53 |
33 |
29 |
62 |
29 |
16 |
45 |
30 |
9 |
39 |
464 |
650 |
1,114 |
| Other service activities |
2 |
1 |
3 |
26 |
8 |
34 |
31 |
10 |
41 |
37 |
7 |
44 |
24 |
5 |
29 |
37 |
11 |
48 |
24 |
8 |
32 |
20 |
4 |
24 |
6 |
3 |
9 |
3 |
0 |
3 |
3 |
1 |
4 |
213 |
58 |
271 |
Activities of extraterritorial organizations and
bodies |
5 |
5 |
10 |
52 |
73 |
125 |
88 |
151 |
239 |
114 |
181 |
295 |
108 |
203 |
311 |
84 |
187 |
271 |
62 |
169 |
231 |
46 |
139 |
185 |
45 |
70 |
115 |
29 |
42 |
71 |
94 |
55 |
149 |
727 |
1,275 |
2,002 |
Activities of households as employers of domestic
personnel |
0 |
0 |
0 |
5 |
5 |
10 |
23 |
10 |
33 |
43 |
12 |
55 |
31 |
10 |
41 |
23 |
13 |
36 |
19 |
13 |
32 |
22 |
7 |
29 |
14 |
4 |
18 |
7 |
1 |
8 |
5 |
0 |
5 |
192 |
75 |
267 |
| Not Applicable * |
53 |
26 |
79 |
375 |
169 |
544 |
455 |
166 |
621 |
586 |
155 |
741 |
608 |
186 |
794 |
773 |
234 |
1,007 |
827 |
311 |
1,138 |
850 |
245 |
1,095 |
951 |
194 |
1,145 |
667 |
55 |
722 |
1,000 |
56 |
1,056 |
7,145 |
1,797 |
8,942 |
| Total |
1,752 |
416 |
2,168 |
14,666 |
6,095 |
20,761 |
19,233 |
11,142 |
30,375 |
17,920 |
10,041 |
27,961 |
14,587 |
7,760 |
22,347 |
13,855 |
6,808 |
20,663 |
13,184 |
6,070 |
19,254 |
10,586 |
4,435 |
15,021 |
7,304 |
2,159 |
9,463 |
3,394 |
842 |
4,236 |
4,069 |
714 |
4,783 |
120,550 |
56,482 |
177,032 |
Source: Central Informatics Organisation (CIO) – Bahrain
*Includes population working abroad
ANNEXED NOTE
1. Technical Notes and Definitions
| census year |
reference period |
implementing institution |
implementation method |
population covered |
| 1981 |
November 16 |
Ministry of Finance
Statistics Department |
field interviews |
de jure, de facto |
all individuals (nationals and non-nationals): 1- present within the country’s borders during time of reference; 2- residing in Bahrain irrespective of where are they at census times |
| 1991 |
April 6 |
Central Informatics Organisation (CIO) |
field interviews |
| 2001 |
April 7 |
field interviews; characteristics of population in collective households (among which labour camps) was obtained from sponsors |
| 2010 |
April 27 |
based on administrative records |
Nationality of the person is defined by the passport used to enter the country. A Non-Bahrainis is considered as such depending on the passport used to enter the country (or obtain the visa).
Period of reference for employment refers to the 7-days period prior to the survey.
Population of reference in table: all employed individuals (nationals and non-nationals) aged 15 and above
Employed population includes population in the following categories:
Employer: A person who operates his / her own economic enterprise or engages independently in a profession for trade and hires one or more employees.
Self-employed: A person who operates his / her own economic enterprise or engages independently in a profession or trade and hires nobody.
Paid employee: A person who works for a public or private organization and receives regular wages / salary whether in cash or in kind.
Unpaid worker: A person works for an enterprise, usually owned by some of his relatives, without receiving a salary / wage
Classification of economic activity are encoded in line with the Standard Industrial Directory of Economic Activities (ISIC-Ver. 3.1) of United Nations Statistics Division (UNSD), as noted by the CIO.
2. Institution which provides data
Central Informatics Organization, known prior to 2001 as the “Central Statistics Organisation” under the Ministry of Cabinet Affairs.
3. Data availability
Figures and results reported here are available on the Central Informatics Organisation (CIO) website. For Arabic version: (http://www.cio.gov.bh/cio_ara/default.aspx). For the English version: (http://www.cio.gov.bh/CIO_ENG/Default.aspx)
The CIO often provides its figures and estimates through tables in PDF format
the 2010′ census figures in general can be found: (http://www.cio.gov.bh/CIO_ENG/SubDetailed.aspx?subcatid=256)
The 2010′ census figures for this table can be found: (http://www.cio.gov.bh/cio_eng/SubDetailed.aspx?subcatid=493)
More specifically, the employed national population is split into two tables. The figures for the male population can be found: (http://www.cio.gov.bh/cio_ara/English/Publications/Census/LabourForce/4.14.5.pdf), and for the female population: (http://www.cio.gov.bh/cio_ara/English/Publications/Census/LabourForce/4.14.9.pdf)
Further detailed data and definitions on the 2010 Census can be found on the census’s separate website: (http://www.census2010.gov.bh/results.php)
General information on the classifications used under the CIO can be found: (http://www.cio.gov.bh/cio_eng/SubDetailed.aspx?subcatid=278)
Information on the ISIC-Ver. 3.1 classification used under the CIO can be found: (http://unstats.un.org/unsd/cr/registry/regcst.asp?Cl=17)
Date of access: July 2014
|
Bahraini |
Non-Bahraini |
Total |
|
males |
females |
total |
males |
females |
total |
males |
females |
total |
| Legislators, Senior Officials, Managers, and Business Owners |
12,161 |
2,100 |
14,261 |
6,025 |
455 |
6,480 |
18,186 |
2,555 |
20,741 |
| Scientific, Technical and Humanities Professionals |
8,270 |
4,758 |
13,028 |
11,212 |
1,768 |
12,980 |
19,482 |
6,526 |
26,008 |
| Scientific, Technical and Humanities Technicians |
7,194 |
6,789 |
13,983 |
4,380 |
2,261 |
6,641 |
11,574 |
9,050 |
20,624 |
| Clerical Workers |
15,570 |
6,961 |
22,531 |
6,815 |
1,166 |
7,981 |
22,385 |
8,127 |
30,512 |
| Sales Workers |
2,878 |
1,078 |
3,956 |
5,203 |
452 |
5,655 |
8,081 |
1,530 |
9,611 |
| Services Workers |
16,619 |
1,485 |
18,104 |
32,706 |
24,342 |
57,048 |
49,325 |
25,827 |
75,152 |
| Agricultural, Animal Husbandry Workers, Hunters and Fishermen |
893 |
7 |
900 |
5,988 |
10 |
5,998 |
6,881 |
17 |
6,898 |
| Industrial, Chemical and Food Industries Workers |
2,832 |
2,772 |
5,604 |
15,107 |
3,021 |
18,128 |
17,939 |
5,793 |
23,732 |
| Principal and Auxiliary Engineering Occupation |
18,141 |
59 |
18,200 |
55,278 |
24 |
55,302 |
73,419 |
83 |
73,502 |
| Unknown |
362 |
58 |
420 |
3,890 |
288 |
4,178 |
4,252 |
346 |
4,598 |
| Total |
84,920 |
26,067 |
110,987 |
146,604 |
33,787 |
180,391 |
231,524 |
59,854 |
291,378 |
Source: Central Informatics Organisation (CIO) – Bahrain
ANNEXED NOTE
1. Technical Notes and Definitions
| census year |
reference period |
implementing institution |
implementation method |
population covered |
| 1981 |
November 16 |
Ministry of Finance
Statistics Department |
field interviews |
de jure, de facto |
all individuals (nationals and non-nationals): 1- present within the country’s borders during time of reference; 2- residing in Bahrain irrespective of where are they at census times |
| 1991 |
April 6 |
Central Informatics Organisation (CIO) |
field interviews |
| 2001 |
April 7 |
field interviews; characteristics of population in collective households (among which labour camps) was obtained from sponsors |
| 2010 |
April 27 |
based on administrative records |
Nationality of the person is defined by the passport used to enter the country. A Non-Bahrainis is considered as such depending on the passport used to enter the country (or obtain the visa).
Period of reference for employment refers to the 7-days period prior to the survey.
Population of reference in table: all employed individuals (nationals and non-nationals) aged 15 and above
Employed population includes population in the following categories:
Employer: A person who operates his / her own economic enterprise or engages independently in a profession for trade and hires one or more employees.
Self-employed: A person who operates his / her own economic enterprise or engages independently in a profession or trade and hires nobody.
Paid employee: A person who works for a public or private organization and receives regular wages / salary whether in cash or in kind.
Unpaid worker: A person works for an enterprise, usually owned by some of his relatives, without receiving a salary / wage
Classification of occupations are encoded in line with the International Standard Classification of Occupations (ISCO) of the International Labour Organization (ILO), as noted by the CIO.
2. Institution which provides data
Central Informatics Organization, known prior to 2001 as the “Central Statistics Organisation” under the Ministry of Cabinet Affairs.
3. Data availability
Figures and results reported here are available on the Central Informatics Organisation (CIO) website. For Arabic version: (http://www.cio.gov.bh/cio_ara/default.aspx). For the English version: (http://www.cio.gov.bh/CIO_ENG/Default.aspx)
The CIO often provides its figures and estimates through tables in PDF format.
The CIO has 2001′ census figures for this particular classification in total population and Bahraini population. Therefore, the non-Bahraini population division was calculated as total minus Bahraini for each sex
Data and figures for the 1991′ and 2001′ censuses regarding the labor force can be found: (http://www.cio.gov.bh/cio_eng/SubDetailed.aspx?subcatid=378)
Figures for this 2001′ census total employed population can be found: (http://www.cio.gov.bh/cio_ara/English/Publications/Statistical%20Abstract/ABS2009/CH11/11A.pdf)
Figures for this 2001′ census Bahraini employed population can be found: (http://www.cio.gov.bh/cio_ara/English/Publications/Statistical%20Abstract/ABS2009/CH11/11B.pdf)
Relevant data can be also found in Statistical Abstract 2001, found through: (http://www.cio.gov.bh/CIO_ENG/SubDetailed.aspx?subcatid=173)
General information on the coding of occupation classifications under the CIO can be found: (http://www.cio.gov.bh/cio_eng/SubDetailed.aspx?subcatid=278)
Information on the ISCO occupations classification under the ILO can be found: (http://www.ilo.org/public/english/bureau/stat/isco/)
Date of access: July 2014
|
Bahraini |
Non-Bahraini |
Total |
|
males |
females |
total |
males |
females |
total |
males |
females |
total |
| Legislators, Administration Directors and Managers,Working Proprietors |
18,566 |
8,897 |
27,463 |
25,021 |
3,056 |
28,077 |
43,587 |
11,953 |
55,540 |
| Scientific, Technical and Human Matters Professionals |
11,318 |
12,222 |
23,540 |
25,060 |
4,136 |
29,196 |
36,378 |
16,358 |
52,736 |
| Scientific, Technical and Human Subjects Technicians |
12,779 |
9,580 |
22,359 |
15,176 |
4,899 |
20,075 |
27,955 |
14,479 |
42,434 |
| Clerical Occupations |
18,587 |
15,154 |
33,741 |
6,533 |
2,725 |
9,258 |
25,120 |
17,879 |
42,999 |
| Sales Occupations |
3,412 |
2,466 |
5,878 |
17,252 |
2,580 |
19,832 |
20,664 |
5,046 |
25,710 |
| Services Occupations |
16,438 |
4,326 |
20,764 |
83,494 |
68,559 |
152,053 |
99,932 |
72,885 |
172,817 |
| Agriculture, Stock- Breeding,Aviculture and Hunting Occupations |
876 |
6 |
882 |
9,767 |
1 |
9,768 |
10,643 |
7 |
10,650 |
| Industrial, Chemical and Food Industries Occupations |
6,853 |
2,007 |
8,860 |
30,842 |
2,060 |
32,902 |
37,695 |
4,067 |
41,762 |
| Principal and Auxiliary Engineering Occupations |
29,706 |
1,204 |
30,910 |
223,731 |
338 |
224,069 |
253,437 |
1,542 |
254,979 |
| Unknown |
2,015 |
620 |
2,635 |
518 |
427 |
945 |
2,533 |
1,047 |
3,580 |
| Total |
120,550 |
56,482 |
177,032 |
437,394 |
88,781 |
526,175 |
557,944 |
145,263 |
703,207 |
Source: Central Informatics Organisation (CIO) – Bahrain
ANNEXED NOTE
1. Technical Notes and Definitions
| census year |
reference period |
implementing institution |
implementation method |
population covered |
| 1981 |
November 16 |
Ministry of Finance
Statistics Department |
field interviews |
de jure, de facto |
all individuals (nationals and non-nationals): 1- present within the country’s borders during time of reference; 2- residing in Bahrain irrespective of where are they at census times |
| 1991 |
April 6 |
Central Informatics Organisation (CIO) |
field interviews |
| 2001 |
April 7 |
field interviews; characteristics of population in collective households (among which labour camps) was obtained from sponsors |
| 2010 |
April 27 |
based on administrative records |
Nationality of the person is defined by the passport used to enter the country. A Non-Bahrainis is considered as such depending on the passport used to enter the country (or obtain the visa).
Period of reference for employment refers to the 7-days period prior to the survey.
Population of reference in table: all employed individuals (nationals and non-nationals) aged 15 and above
Employed population includes population in the following categories:
Employer: A person who operates his / her own economic enterprise or engages independently in a profession for trade and hires one or more employees.
Self-employed: A person who operates his / her own economic enterprise or engages independently in a profession or trade and hires nobody.
Paid employee: A person who works for a public or private organization and receives regular wages / salary whether in cash or in kind.
Unpaid worker: A person works for an enterprise, usually owned by some of his relatives, without receiving a salary / wage
Classification of occupations are encoded in line with the International Standard Classification of Occupations (ISCO) of the International Labour Organization (ILO), as noted by the CIO.
2. Institution which provides data
Central Informatics Organization, known prior to 2001 as the “Central Statistics Organisation” under the Ministry of Cabinet Affairs.
3. Data availability
Figures and results reported here are available on the Central Informatics Organisation (CIO) website. For Arabic version: (http://www.cio.gov.bh/cio_ara/default.aspx). For the English version: (http://www.cio.gov.bh/CIO_ENG/Default.aspx)
The CIO often provides its figures and estimates through tables in PDF format.
The CIO has 2001′ census figures for this particular classification in total population and Bahraini population. Therefore, the non-Bahraini population division was calculated as total minus Bahraini for each sex
Data and figures for the 1991′ and 2001′ censuses regarding the labor force can be found: (http://www.cio.gov.bh/cio_eng/SubDetailed.aspx?subcatid=378)
Figures for this 2001′ census total employed population can be found: (http://www.cio.gov.bh/cio_ara/English/Publications/Statistical%20Abstract/ABS2009/CH11/11A.pdf)
Figures for this 2001′ census Bahraini employed population can be found: (http://www.cio.gov.bh/cio_ara/English/Publications/Statistical%20Abstract/ABS2009/CH11/11B.pdf)
Relevant data can be also found in Statistical Abstract 2001, found through: (http://www.cio.gov.bh/CIO_ENG/SubDetailed.aspx?subcatid=173)
General information on the coding of occupation classifications under the CIO can be found: (http://www.cio.gov.bh/cio_eng/SubDetailed.aspx?subcatid=278)
Information on the ISCO occupations classification under the ILO can be found: (http://www.ilo.org/public/english/bureau/stat/isco/)
Date of access: July 2014
|
Bahraini |
Non-Bahraini |
Total |
|
males |
females |
total |
males |
females |
total |
males |
females |
total |
| Administration & Business Managers |
8,595 |
780 |
9,375 |
3,395 |
229 |
3,624 |
11,990 |
1,009 |
12,999 |
| Administration Directors & Managers |
1,184 |
301 |
1485 |
631 |
85 |
716 |
1,815 |
386 |
2201 |
| Coporate & General Managers |
6,066 |
319 |
6,385 |
2,289 |
112 |
2401 |
8,355 |
431 |
8786 |
| Protections Managers |
31 |
1 |
32 |
6 |
0 |
6 |
37 |
1 |
38 |
| Adm. Chiefs & Public Officials |
1,314 |
159 |
1,473 |
469 |
32 |
501 |
1,783 |
191 |
1974 |
| Professionals |
5,021 |
2,433 |
7,454 |
8,554 |
1,200 |
9,754 |
13,575 |
3,633 |
17,208 |
| Professionals in Pure Sciences |
501 |
174 |
675 |
450 |
47 |
497 |
951 |
221 |
1172 |
| Professionals in Applied Sciences |
1,389 |
136 |
1525 |
3,514 |
40 |
3554 |
4,903 |
176 |
5079 |
| Professionals in Medical & Drug Sciences |
322 |
259 |
581 |
362 |
198 |
560 |
684 |
457 |
1141 |
| Professionals in Human, Social, Educational Sciences |
1,050 |
1,227 |
2277 |
1,428 |
558 |
1986 |
2,478 |
1785 |
4263 |
| Professionals in Culture, Communications & sports |
463 |
225 |
688 |
776 |
212 |
988 |
1,239 |
437 |
1676 |
| Professionals in Political, Economic & Financial Sciences |
1,296 |
412 |
1708 |
2,024 |
145 |
2169 |
3,320 |
557 |
3877 |
| Technicians |
5,188 |
4,306 |
9,494 |
3,330 |
2,559 |
5,889 |
8,518 |
6,865 |
15,383 |
| Pure Sciences Technicians |
478 |
224 |
702 |
180 |
37 |
217 |
658 |
261 |
919 |
| Applied Sciences Technicians |
1,950 |
59 |
2009 |
1,910 |
27 |
1937 |
3,860 |
86 |
3946 |
| Medical & Drug Sciences Technicians |
559 |
988 |
1547 |
272 |
992 |
1264 |
831 |
1980 |
2811 |
| Social, Educational Sciences & Religious Affairs Technicians |
1,478 |
2,621 |
4099 |
596 |
1,234 |
1830 |
2,074 |
3855 |
5929 |
| Cultural, Communication & Tourism Technicians |
46 |
13 |
59 |
78 |
12 |
90 |
124 |
25 |
149 |
| Economics & Financial, Accounting & Secretarial Sciences |
677 |
401 |
1078 |
294 |
257 |
551 |
971 |
658 |
1629 |
| Clerical Workers |
10,834 |
4,052 |
14,886 |
4,224 |
1,198 |
5,422 |
15,058 |
5,250 |
20,308 |
| Administrative Clerical Workers |
8,597 |
3,445 |
12,042 |
3,668 |
1,026 |
4,694 |
12,265 |
4,471 |
16,736 |
| Clerical Workers in Finance & Accounting |
2,237 |
607 |
2,844 |
556 |
172 |
728 |
2,793 |
779 |
3,572 |
| Sales Workers |
2,413 |
214 |
2,627 |
7,133 |
567 |
7,700 |
9,546 |
781 |
10,327 |
| Commercial Agents |
627 |
58 |
685 |
709 |
56 |
765 |
1,336 |
114 |
1,450 |
| Consumer, Luxury & Cultural Goods Sales Workers |
1,514 |
149 |
1,663 |
5,485 |
496 |
5,981 |
6,999 |
645 |
7,644 |
| Scientific, Const. Ind. & Agr. Equipment Salesman |
272 |
7 |
279 |
939 |
15 |
954 |
1,211 |
22 |
1,233 |
| Service Workers |
12,992 |
960 |
13,952 |
24,313 |
14,564 |
38,877 |
37,305 |
15,524 |
52,829 |
| Personal & Housing Services Workers |
1,712 |
399 |
2,111 |
14,556 |
14,488 |
29,044 |
16,268 |
14,887 |
31,155 |
| Religious, Social & Protective Workers |
9,881 |
544 |
10,425 |
7,829 |
70 |
7,899 |
17,710 |
614 |
18,324 |
| Sea Services, Loading, Unloading, Packing & Packaging Workers |
1,399 |
17 |
1,416 |
1,928 |
6 |
1,934 |
3,327 |
23 |
3,350 |
| Agriculture & Fisheries Workers |
1,234 |
3 |
1,237 |
4,226 |
6 |
4,232 |
5,460 |
9 |
5,469 |
| Agr. Animal & Birds Husbandry Workers |
1,145 |
3 |
1,148 |
4,065 |
5 |
4,070 |
5,210 |
8 |
5,218 |
| Fish Farm & Fishery Occupations |
89 |
0 |
89 |
161 |
1 |
162 |
250 |
1 |
251 |
| Supervisor, Food & Chemical Ind. Workers |
4,063 |
309 |
4,372 |
9,986 |
1,368 |
11,354 |
14,049 |
1,677 |
15,726 |
| Supervision Occupations |
2,437 |
136 |
2,573 |
1,552 |
46 |
1,598 |
3,989 |
182 |
4,171 |
| Industrial Operations Occupations |
315 |
169 |
484 |
6,640 |
1,308 |
7,948 |
6,955 |
1,477 |
8,432 |
| Miners, Quarryment & Chemical Operations Occupations |
1,040 |
2 |
1,042 |
412 |
1 |
413 |
1,452 |
3 |
1,455 |
| Food Industry Occupations |
271 |
2 |
273 |
1,382 |
13 |
1,395 |
1,653 |
15 |
1,668 |
| Plant & Machine Operators, Assemblers & Labourers |
13,455 |
21 |
13,476 |
47,693 |
18 |
47,711 |
61,148 |
39 |
61,187 |
| Mechanical Occupations |
9,131 |
5 |
9,136 |
13,973 |
1 |
13,974 |
23,104 |
6 |
23,110 |
| Electrical & Electronics Occupations |
1,711 |
9 |
1,720 |
2,835 |
7 |
2,842 |
4,546 |
16 |
4,562 |
| Carpenters & Decorators |
778 |
7 |
785 |
5,440 |
|
5,440 |
6,218 |
7 |
6,225 |
| Construction Occupations |
1,741 |
0 |
1,741 |
25,313 |
8 |
25,321 |
27,054 |
8 |
27,062 |
| Equipments & Instruments Assembly Occupations |
94 |
0 |
94 |
132 |
2 |
134 |
226 |
2 |
228 |
| Unknown |
288 |
107 |
395 |
217 |
22 |
239 |
505 |
129 |
634 |
| Total |
64,083 |
13,185 |
77,268 |
113,071 |
21,731 |
134,802 |
177,154 |
34,916 |
212,070 |
Source: Central Informatics Organisation (CIO) – Bahrain
ANNEXED NOTE
1. Technical Notes and Definitions
| census year |
reference period |
implementing institution |
implementation method |
population covered |
| 1981 |
November 16 |
Ministry of Finance
Statistics Department |
field interviews |
de jure, de facto |
all individuals (nationals and non-nationals): 1- present within the country’s borders during time of reference; 2- residing in Bahrain irrespective of where are they at census times |
| 1991 |
April 6 |
Central Informatics Organisation (CIO) |
field interviews |
| 2001 |
April 7 |
field interviews; characteristics of population in collective households (among which labour camps) was obtained from sponsors |
| 2010 |
April 27 |
based on administrative records |
Nationality of the person is defined by the passport used to enter the country. A Non-Bahrainis is considered as such depending on the passport used to enter the country (or obtain the visa).
Period of reference for employment refers to the 7-days period prior to the survey.
Population of reference in table: all employed individuals (nationals and non-nationals) aged 15 and above
Employed population includes population in the following categories:
Employer: A person who operates his / her own economic enterprise or engages independently in a profession for trade and hires one or more employees.
Self-employed: A person who operates his / her own economic enterprise or engages independently in a profession or trade and hires nobody.
Paid employee: A person who works for a public or private organization and receives regular wages / salary whether in cash or in kind.
Unpaid worker: A person works for an enterprise, usually owned by some of his relatives, without receiving a salary / wage
Classification of occupations are encoded in line with the International Standard Classification of Occupations (ISCO) of the International Labour Organization (ILO), as noted by the CIO.
2. Institution which provides data
Central Informatics Organization, known prior to 2001 as the “Central Statistics Organization” under the Ministry of Cabinet Affairs.
3. Data availability
Figures and results reported here are available on the Central Informatics Organisation (CIO) website. For Arabic version: (http://www.cio.gov.bh/cio_ara/default.aspx). For the English version: (http://www.cio.gov.bh/CIO_ENG/Default.aspx)
The CIO often provides its figures and estimates through tables in PDF format.
Data and figures of this 1991′ census table can be found: (http://www.cio.gov.bh/cio_ara/English/Publications/Statistical%20Abstract/ABS2009/CH11/8A.pdf)
This data can also be found in Statistical Abstract 2000, Labor Force section, found through: (http://www.cio.gov.bh/CIO_ENG/SubDetailed.aspx?subcatid=172)
General information on the coding of occupation classifications under the CIO can be found: (http://www.cio.gov.bh/cio_eng/SubDetailed.aspx?subcatid=278)
Information on the ISCO occupations classification under the ILO can be found: (http://www.ilo.org/public/english/bureau/stat/isco/)
Date of access: July 2014
|
Illiterate / Read Only |
Read & Write |
Primary |
Preparatory |
Above Preparatory |
Secondary |
Above Secondary Diploma |
B.Sc. or B.A |
High Diploma |
Master’s Degree |
Ph.D. or Equivalent |
Not Stated |
Total |
|
males |
females |
males |
females |
males |
females |
males |
females |
males |
females |
males |
females |
males |
females |
males |
females |
males |
females |
males |
females |
males |
females |
males |
females |
males |
females |
total |
| Legislators, Senior Officials, Managers and Business Owners |
648 |
8 |
841 |
18 |
913 |
31 |
775 |
45 |
150 |
5 |
2507 |
214 |
614 |
126 |
1504 |
210 |
353 |
91 |
229 |
23 |
52 |
9 |
9 |
0 |
8595 |
780 |
9375 |
| Scientific, Technical and Humanities Professionals |
12 |
0 |
33 |
3 |
169 |
20 |
194 |
28 |
35 |
14 |
1394 |
524 |
617 |
288 |
1701 |
1188 |
386 |
216 |
317 |
113 |
162 |
39 |
1 |
0 |
5021 |
2433 |
7454 |
| Scientific, Technical and Humanities Technicians |
5 |
0 |
22 |
5 |
519 |
109 |
465 |
162 |
89 |
29 |
2141 |
1246 |
1000 |
1186 |
731 |
1313 |
195 |
238 |
18 |
14 |
1 |
2 |
2 |
2 |
5188 |
4306 |
9494 |
| Clerical Workers |
3 |
2 |
400 |
20 |
895 |
61 |
1155 |
159 |
205 |
43 |
7393 |
3021 |
525 |
553 |
241 |
180 |
11 |
12 |
1 |
0 |
2 |
0 |
3 |
1 |
10834 |
4052 |
14886 |
| Sales Workers |
622 |
3 |
396 |
13 |
269 |
17 |
297 |
33 |
58 |
3 |
647 |
129 |
59 |
7 |
47 |
8 |
12 |
1 |
1 |
0 |
0 |
0 |
5 |
0 |
2413 |
214 |
2627 |
| Services Workers |
2,175 |
444 |
2817 |
197 |
3722 |
145 |
3082 |
87 |
415 |
11 |
708 |
66 |
41 |
7 |
16 |
0 |
5 |
0 |
0 |
0 |
0 |
0 |
11 |
3 |
12992 |
960 |
13952 |
| Agricultural, Animal Husbandry Workers, Hunters and Fishermen |
677 |
0 |
230 |
0 |
135 |
0 |
80 |
0 |
20 |
0 |
82 |
2 |
4 |
0 |
0 |
1 |
2 |
0 |
0 |
0 |
0 |
0 |
4 |
0 |
1234 |
3 |
1237 |
| Industrial, Chemical and Food Industries Workers |
356 |
9 |
526 |
23 |
605 |
22 |
569 |
42 |
115 |
9 |
1479 |
146 |
227 |
15 |
128 |
39 |
43 |
4 |
12 |
0 |
1 |
0 |
2 |
0 |
4063 |
309 |
4372 |
| Principal and Auxiliary Engineering Occupation |
2660 |
1 |
3026 |
1 |
2617 |
3 |
1887 |
2 |
313 |
0 |
2726 |
7 |
155 |
3 |
32 |
4 |
15 |
0 |
2 |
0 |
0 |
0 |
22 |
0 |
13455 |
21 |
13476 |
| Unknown |
25 |
0 |
24 |
0 |
31 |
7 |
37 |
5 |
8 |
0 |
52 |
6 |
10 |
1 |
3 |
2 |
75 |
79 |
13 |
7 |
0 |
0 |
10 |
0 |
288 |
107 |
395 |
| Total |
7183 |
467 |
8315 |
280 |
9875 |
415 |
8541 |
563 |
1408 |
114 |
19129 |
5361 |
3252 |
2186 |
4403 |
2945 |
1097 |
641 |
593 |
157 |
218 |
50 |
69 |
6 |
64083 |
13185 |
77268 |
Source: Central Informatics Organisation (CIO) – Bahrain
ANNEXED NOTE
1. Technical Notes and Definitions
| census year |
reference period |
implementing institution |
implementation method |
population covered |
| 1981 |
November 16 |
Ministry of Finance
Statistics Department |
field interviews |
de jure, de facto |
all individuals (nationals and non-nationals): 1- present within the country’s borders during time of reference; 2- residing in Bahrain irrespective of where are they at census times |
| 1991 |
April 6 |
Central Informatics Organisation (CIO) |
field interviews |
| 2001 |
April 7 |
field interviews; characteristics of population in collective households (among which labour camps) was obtained from sponsors |
| 2010 |
April 27 |
based on administrative records |
Nationality of the person is defined by the passport used to enter the country. A Non-Bahrainis is considered as such depending on the passport used to enter the country (or obtain the visa).
Period of reference for employment refers to the 7-days period prior to the survey.
Population of reference in table: all employed individuals (nationals and non-nationals) aged 15 and above
Employed population includes population in the following categories:
Employer: A person who operates his / her own economic enterprise or engages independently in a profession for trade and hires one or more employees.
Self-employed: A person who operates his / her own economic enterprise or engages independently in a profession or trade and hires nobody.
Paid employee: A person who works for a public or private organization and receives regular wages / salary whether in cash or in kind.
Unpaid worker: A person works for an enterprise, usually owned by some of his relatives, without receiving a salary / wage
Classification of occupations are encoded in line with the International Standard Classification of Occupations (ISCO) of the International Labour Organization (ILO), as noted by the CIO.
Classification of educational levels are encoded in line with the International Standard Classification of Education (ISCED) of the United Nations Educational, Scientific and Cultural Organization (UNESCO), as noted by the CIO.
2. Institution which provides data
Central Informatics Organization, known prior to 2001 as the “Central Statistics Organisation” under the Ministry of Cabinet Affairs
3. Data availability
Figures and results reported here are available on the Central Informatics Organisation (CIO) website. For Arabic version: (http://www.cio.gov.bh/cio_ara/default.aspx). For the English version: (http://www.cio.gov.bh/CIO_ENG/Default.aspx)
The CIO often provides its figures and estimates through tables in PDF format
Figures for this 1991′ census table can be found: (http://www.cio.gov.bh/cio_ara/English/Publications/Statistical%20Abstract/ABS2009/CH11/9A.pdf)
These figures can also be found in the Statistical Abstract 2010, found through: (http://www.cio.gov.bh/CIO_ENG/SubDetailed.aspx?subcatid=324)
This data can also be found in Statistical Abstract 2000, Labor Force section, found through: (http://www.cio.gov.bh/CIO_ENG/SubDetailed.aspx?subcatid=172)
General information on the classifications used under the CIO can be found: (http://www.cio.gov.bh/cio_eng/SubDetailed.aspx?subcatid=278)
Information on the ISCO occupations classification under the ILO can be found: (http://www.ilo.org/public/english/bureau/stat/isco/)
Information on the ISCED educational calassification under the UNESCO can be found: (http://www.uis.unesco.org/Education/Pages/international-standard-classification-of-education.aspx)
Date of access: July 2014
|
Bahrainis |
Non-Bahrainis |
| 1981 |
57,178 |
80,714 |
| 1991 |
77,268 |
134,802 |
| 2001 |
110,987 |
180,391 |
| 2010 |
177,032 |
526,175 |
Source: Central Informatics Organisation (CIO) – Bahrain
ANNEXED NOTE
1. Technical Notes and Definitions
| census year |
reference period |
implementing institution |
implementation method |
population covered |
| 1981 |
November 16 |
Ministry of Finance
Statistics Department |
field interviews |
de jure, de facto |
all individuals (nationals and non-nationals): 1- present within the country’s borders during time of reference; 2- residing in Bahrain irrespective of where are they at census times |
| 1991 |
April 6 |
Central Informatics Organisation (CIO) |
field interviews |
| 2001 |
April 7 |
field interviews; characteristics of population in collective households (among which labour camps) was obtained from sponsors |
| 2010 |
April 27 |
based on administrative records |
Nationality of the person is defined by the passport used to enter the country. A Non-Bahraini is considered as such depending on the passport used to enter the country (or obtain the visa).
Period of reference for employment refers to the 7-days period prior to the survey.
Population of reference in table: all employed individuals (nationals and non-nationals) aged 15 and above
Employed population includes population in the following categories:
Employer: A person who operates his / her own economic enterprise or engages independently in a profession for trade and hires one or more employees.
Self-employed: A person who operates his / her own economic enterprise or engages independently in a profession or trade and hires nobody.
Paid employee: A person who works for a public or private organization and receives regular wages / salary whether in cash or in kind.
Unpaid worker: A person works for an enterprise, usually owned by some of his relatives, without receiving a salary / wage
2. Institution which provides data
Central Informatics Organization, known prior to 2001 as the “Central Statistics Organisation” under the Ministry of Cabinet Affairs.
3. Data availability
Figures and results reported here are available on the Central Informatics Organisation (CIO) website. For Arabic version: (http://www.cio.gov.bh/cio_ara/default.aspx). For the English version: (http://www.cio.gov.bh/CIO_ENG/Default.aspx)
The CIO often provides its figures and estimates through tables in PDF format.
The 1981 census figures can be found in the Statistical Abstract 2000, Labour Force Section: (http://www.cio.gov.bh/cio_ara/English/Publications/Statistical%20Abstract/2000/2000-CH11-a%20Labour%20Force.pdf)
The 1991 and 2001 census figures can be found: (http://www.cio.gov.bh/cio_ara/English/Publications/Statistical%20Abstract/ABS2009/CH11/2.pdf)
The 2010 census figures for employed Bahraini population can be found: (http://www.cio.gov.bh/cio_ara/English/Publications/Census/LabourForce/4.10.4.pdf)
The 2010 census figures for employed non-Bahraini population can be found: (http://www.cio.gov.bh/cio_ara/English/Publications/Census/LabourForce/4.10.7.pdf)
These census figures can also be found in the Statistical Abstracts, Labour Force Sections: (http://www.cio.gov.bh/CIO_ENG/SubDetailed.aspx?subcatid=119)
Date of access: June 2014
|
2010 |
2011 |
2012 |
2013 |
2014 |
|
Q3 |
Q4 |
Q1 |
Q2 |
Q3 |
Q4 |
Q1 |
Q2 |
Q3 |
Q4 |
Q1 |
Q2 |
Q3 |
Q4 |
Q1 |
| Bahraini |
44,829 |
45,261 |
45,099 |
45,391 |
45,441 |
45,822 |
45,300 |
48,035 |
48,294 |
48,133 |
48,738 |
56,535 |
56,665 |
56,865 |
56,988 |
| |
|
|
|
|
|
|
|
|
|
|
|
|
|
|
|
| Arab Nationals |
4,474 |
4,601 |
4,681 |
4,740 |
4,801 |
4,970 |
4,993 |
5,416 |
5,466 |
5,644 |
5,695 |
6,349 |
6,464 |
6,245 |
7,064 |
| GCC |
137 |
137 |
138 |
137 |
137 |
153 |
152 |
156 |
166 |
166 |
165 |
191 |
180 |
173 |
178 |
| Kuwait |
17 |
17 |
17 |
17 |
17 |
17 |
16 |
17 |
19 |
19 |
19 |
20 |
18 |
16 |
16 |
| Oman |
55 |
55 |
55 |
54 |
54 |
55 |
55 |
56 |
58 |
59 |
58 |
63 |
65 |
63 |
62 |
| Qatar |
11 |
11 |
12 |
12 |
12 |
12 |
12 |
12 |
15 |
15 |
14 |
14 |
13 |
13 |
17 |
| Saudi Arabia |
45 |
45 |
45 |
45 |
45 |
59 |
59 |
60 |
59 |
59 |
60 |
72 |
71 |
68 |
70 |
| United Arab Emirates |
9 |
9 |
9 |
9 |
9 |
10 |
10 |
11 |
15 |
14 |
14 |
22 |
13 |
13 |
13 |
|
|
|
|
|
|
|
|
|
|
|
|
|
|
|
|
| Other Arab |
4,337 |
4,464 |
4,543 |
4,603 |
4,664 |
4,817 |
4,841 |
5,260 |
5,300 |
5,478 |
5,530 |
6,158 |
6,284 |
6,072 |
6,886 |
| Algeria |
27 |
27 |
27 |
27 |
27 |
27 |
27 |
27 |
27 |
27 |
27 |
31 |
24 |
18 |
17 |
| Djibouti |
2 |
2 |
2 |
2 |
2 |
2 |
2 |
2 |
2 |
2 |
2 |
2 |
2 |
1 |
1 |
| Egypt |
3,022 |
3,118 |
3,168 |
3,222 |
3,274 |
3,396 |
3,412 |
3,634 |
3,649 |
3,784 |
3,816 |
4,200 |
4,293 |
4,189 |
4,659 |
| Iraq |
79 |
79 |
81 |
84 |
87 |
88 |
88 |
91 |
91 |
91 |
92 |
103 |
100 |
73 |
74 |
| Jordan |
766 |
792 |
806 |
804 |
806 |
827 |
833 |
918 |
940 |
992 |
993 |
1,101 |
1,126 |
1,101 |
1,420 |
| Lebanon |
34 |
34 |
34 |
35 |
35 |
35 |
35 |
38 |
38 |
38 |
37 |
50 |
50 |
43 |
44 |
| Libya |
7 |
7 |
8 |
9 |
9 |
9 |
9 |
10 |
10 |
|
12 |
13 |
11 |
9 |
11 |
| Mauritania |
2 |
2 |
2 |
2 |
2 |
2 |
2 |
2 |
2 |
2 |
2 |
5 |
7 |
6 |
6 |
| Morocco |
194 |
194 |
194 |
194 |
194 |
203 |
203 |
215 |
213 |
212 |
213 |
252 |
254 |
248 |
264 |
| Somalia |
12 |
12 |
12 |
12 |
12 |
12 |
12 |
12 |
12 |
12 |
12 |
21 |
21 |
19 |
19 |
| Sudan |
78 |
78 |
80 |
81 |
82 |
82 |
82 |
100 |
102 |
103 |
107 |
136 |
145 |
133 |
132 |
| Syrian Arab Republic |
38 |
38 |
38 |
38 |
38 |
38 |
38 |
73 |
72 |
72 |
72 |
86 |
86 |
75 |
80 |
| Tunisia |
13 |
18 |
25 |
26 |
26 |
26 |
27 |
45 |
48 |
48 |
51 |
53 |
55 |
55 |
56 |
| West bank and Gaza strip |
55 |
55 |
56 |
56 |
56 |
56 |
56 |
58 |
58 |
58 |
58 |
64 |
67 |
61 |
61 |
| Yemen, Rep. of |
8 |
8 |
10 |
11 |
14 |
14 |
15 |
35 |
36 |
37 |
36 |
41 |
43 |
41 |
42 |
|
|
|
|
|
|
|
|
|
|
|
|
|
|
|
|
| Other Nationalities |
7,134 |
7,147 |
7,266 |
7,310 |
7,395 |
7,428 |
7,415 |
7,624 |
7,673 |
7,746 |
7,834 |
14,497 |
14,983 |
15,312 |
15,574 |
| Africa |
85 |
85 |
82 |
84 |
84 |
84 |
84 |
88 |
89 |
88 |
88 |
104 |
108 |
119 |
116 |
| Ethiopia |
4 |
4 |
1 |
4 |
4 |
4 |
4 |
4 |
4 |
4 |
4 |
6 |
6 |
6 |
6 |
| Kenya |
1 |
1 |
1 |
1 |
1 |
1 |
1 |
2 |
2 |
2 |
2 |
4 |
5 |
5 |
5 |
| Nigeria |
11 |
11 |
11 |
10 |
10 |
10 |
10 |
13 |
14 |
14 |
14 |
19 |
19 |
19 |
20 |
| Seychelles |
4 |
4 |
4 |
4 |
4 |
4 |
4 |
4 |
4 |
4 |
4 |
7 |
7 |
7 |
7 |
| South Africa |
1 |
1 |
1 |
1 |
1 |
1 |
1 |
1 |
1 |
1 |
1 |
5 |
8 |
19 |
15 |
| Tanzania, United Republic of |
64 |
64 |
64 |
64 |
64 |
64 |
64 |
64 |
64 |
63 |
63 |
63 |
63 |
63 |
63 |
|
|
|
|
|
|
|
|
|
|
|
|
|
|
|
|
| Asia |
6,247 |
6,260 |
6,322 |
6,370 |
6,461 |
6,493 |
6,481 |
6,658 |
6,723 |
6,784 |
6,871 |
13,329 |
13,780 |
14,194 |
14,442 |
| Afghanistan |
4 |
4 |
4 |
4 |
4 |
4 |
4 |
4 |
4 |
4 |
4 |
10 |
10 |
10 |
10 |
| Bangladesh |
612 |
612 |
613 |
611 |
614 |
614 |
612 |
610 |
611 |
613 |
618 |
1,472 |
1,501 |
1,521 |
1,562 |
| China |
8 |
8 |
8 |
8 |
8 |
8 |
8 |
8 |
8 |
8 |
8 |
10 |
10 |
10 |
10 |
| Hong Kong, China |
6 |
6 |
6 |
6 |
6 |
6 |
6 |
7 |
7 |
7 |
7 |
7 |
7 |
7 |
7 |
| India |
4,467 |
4,469 |
4,508 |
4,550 |
4,615 |
4,645 |
4,637 |
4,781 |
4,830 |
4,863 |
4,927 |
8,579 |
8,809 |
8,975 |
9,115 |
| Indonesia |
11 |
11 |
11 |
11 |
11 |
11 |
11 |
12 |
12 |
12 |
12 |
15 |
15 |
15 |
15 |
| Iran, Islamic Rep. of |
97 |
97 |
97 |
97 |
97 |
97 |
97 |
97 |
98 |
98 |
98 |
98 |
98 |
97 |
96 |
| Japan |
6 |
6 |
6 |
6 |
6 |
6 |
6 |
6 |
6 |
6 |
6 |
9 |
9 |
9 |
9 |
| Korea, Republic of |
3 |
3 |
3 |
3 |
3 |
3 |
3 |
3 |
3 |
3 |
3 |
3 |
3 |
3 |
3 |
| Malaysia |
48 |
48 |
52 |
59 |
59 |
59 |
60 |
64 |
65 |
65 |
65 |
65 |
65 |
62 |
62 |
| Nepal |
106 |
106 |
106 |
105 |
105 |
105 |
105 |
105 |
105 |
105 |
106 |
163 |
163 |
160 |
161 |
| Pakistan |
289 |
290 |
293 |
294 |
305 |
306 |
304 |
301 |
303 |
301 |
314 |
1,720 |
1,754 |
1,757 |
1,776 |
| Philippines |
484 |
494 |
509 |
510 |
521 |
522 |
521 |
552 |
563 |
590 |
593 |
1,031 |
1,188 |
1,424 |
1,471 |
| Singapore |
6 |
6 |
6 |
6 |
6 |
6 |
6 |
6 |
6 |
6 |
6 |
10 |
9 |
9 |
9 |
| Sri Lanka |
83 |
83 |
83 |
83 |
84 |
84 |
84 |
84 |
84 |
85 |
86 |
117 |
119 |
117 |
117 |
| Thailand |
16 |
16 |
16 |
16 |
16 |
16 |
16 |
16 |
16 |
16 |
16 |
18 |
18 |
17 |
18 |
| Uzbekistan |
1 |
1 |
1 |
1 |
1 |
1 |
1 |
2 |
2 |
2 |
2 |
2 |
2 |
1 |
1 |
|
|
|
|
|
|
|
|
|
|
|
|
|
|
|
|
| Europe |
412 |
412 |
443 |
450 |
450 |
451 |
451 |
456 |
452 |
462 |
459 |
593 |
609 |
544 |
562 |
| Austria |
2 |
2 |
2 |
2 |
2 |
2 |
2 |
2 |
2 |
2 |
4 |
4 |
5 |
6 |
7 |
| Belgium |
3 |
3 |
4 |
4 |
4 |
4 |
4 |
4 |
4 |
4 |
4 |
11 |
11 |
10 |
10 |
| Bulgaria |
1 |
1 |
1 |
1 |
1 |
1 |
1 |
1 |
1 |
1 |
1 |
2 |
2 |
2 |
2 |
| Cyprus |
17 |
17 |
17 |
17 |
17 |
17 |
17 |
17 |
17 |
17 |
17 |
19 |
19 |
12 |
12 |
| Czech Republic |
1 |
1 |
1 |
1 |
1 |
1 |
1 |
1 |
1 |
1 |
1 |
2 |
2 |
2 |
2 |
| Denmark |
1 |
1 |
1 |
1 |
1 |
1 |
1 |
1 |
1 |
1 |
1 |
1 |
1 |
1 |
2 |
| Finland |
1 |
1 |
1 |
1 |
1 |
1 |
1 |
1 |
1 |
1 |
1 |
3 |
3 |
3 |
3 |
| France |
11 |
11 |
12 |
12 |
13 |
13 |
13 |
14 |
14 |
14 |
14 |
15 |
14 |
14 |
15 |
| Germany |
4 |
4 |
7 |
7 |
7 |
7 |
7 |
8 |
8 |
8 |
8 |
9 |
9 |
8 |
7 |
| Greece |
2 |
2 |
2 |
3 |
3 |
3 |
3 |
3 |
3 |
3 |
4 |
13 |
13 |
13 |
14 |
| Ireland |
37 |
37 |
45 |
46 |
46 |
46 |
46 |
46 |
46 |
46 |
46 |
52 |
57 |
54 |
50 |
| Italy |
5 |
5 |
7 |
7 |
7 |
7 |
7 |
7 |
7 |
7 |
7 |
7 |
7 |
7 |
7 |
| Lithuania |
1 |
1 |
1 |
1 |
1 |
1 |
1 |
0 |
0 |
10 |
0 |
0 |
0 |
0 |
0 |
| Netherlands |
3 |
3 |
3 |
3 |
3 |
3 |
3 |
3 |
3 |
3 |
3 |
5 |
5 |
4 |
4 |
| Norway |
1 |
1 |
1 |
1 |
1 |
1 |
1 |
1 |
1 |
1 |
1 |
1 |
1 |
0 |
0 |
| Poland |
2 |
2 |
2 |
2 |
2 |
2 |
2 |
2 |
2 |
2 |
2 |
2 |
2 |
2 |
2 |
| Portugal |
2 |
2 |
2 |
2 |
2 |
2 |
2 |
2 |
2 |
2 |
3 |
5 |
6 |
5 |
5 |
| Romania |
1 |
1 |
1 |
2 |
2 |
2 |
2 |
2 |
2 |
2 |
2 |
3 |
3 |
3 |
2 |
| Slovakia |
0 |
0 |
0 |
0 |
0 |
0 |
0 |
0 |
0 |
0 |
0 |
0 |
1 |
1 |
1 |
| Spain |
2 |
2 |
2 |
2 |
2 |
2 |
2 |
1 |
1 |
1 |
1 |
2 |
2 |
3 |
3 |
| Sweden |
7 |
7 |
7 |
7 |
7 |
7 |
7 |
7 |
7 |
7 |
7 |
9 |
10 |
6 |
6 |
| Switzerland |
44 |
44 |
44 |
42 |
42 |
42 |
42 |
42 |
42 |
42 |
42 |
75 |
75 |
67 |
67 |
| Turkey |
24 |
24 |
24 |
24 |
24 |
24 |
24 |
26 |
26 |
26 |
28 |
29 |
29 |
14 |
15 |
| United Kingdom |
240 |
240 |
256 |
262 |
261 |
262 |
262 |
265 |
261 |
261 |
262 |
324 |
332 |
307 |
326 |
|
|
|
|
|
|
|
|
|
|
|
|
|
|
|
|
| Noth America |
159 |
159 |
169 |
169 |
168 |
168 |
168 |
173 |
171 |
174 |
177 |
205 |
211 |
166 |
171 |
| Canada |
63 |
63 |
67 |
65 |
64 |
64 |
64 |
64 |
64 |
64 |
65 |
72 |
75 |
66 |
70 |
| El Salvador |
1 |
1 |
1 |
1 |
1 |
1 |
1 |
1 |
1 |
1 |
1 |
1 |
1 |
1 |
1 |
| United States |
95 |
95 |
101 |
103 |
103 |
103 |
103 |
108 |
106 |
109 |
111 |
132 |
135 |
99 |
100 |
|
|
|
|
|
|
|
|
|
|
|
|
|
|
|
|
| South America |
1 |
1 |
1 |
1 |
1 |
1 |
1 |
1 |
1 |
1 |
1 |
2 |
2 |
2 |
1 |
| Brazil |
1 |
1 |
1 |
1 |
1 |
1 |
1 |
1 |
1 |
1 |
1 |
2 |
2 |
2 |
1 |
|
|
|
|
|
|
|
|
|
|
|
|
|
|
|
|
| Oceania |
156 |
156 |
174 |
161 |
156 |
156 |
156 |
156 |
144 |
144 |
144 |
153 |
153 |
147 |
113 |
| New Zealand |
93 |
93 |
109 |
101 |
98 |
98 |
98 |
98 |
90 |
90 |
90 |
94 |
95 |
93 |
66 |
| Australia |
63 |
63 |
65 |
60 |
58 |
58 |
58 |
58 |
54 |
54 |
54 |
59 |
58 |
54 |
47 |
|
|
|
|
|
|
|
|
|
|
|
|
|
|
|
|
| Other |
72 |
72 |
72 |
72 |
72 |
72 |
71 |
89 |
89 |
89 |
90 |
100 |
104 |
111 |
136 |
| Not Specified |
2 |
2 |
3 |
3 |
3 |
3 |
3 |
3 |
4 |
4 |
4 |
11 |
16 |
29 |
33 |
| |
|
|
|
|
|
|
|
|
|
|
|
|
|
|
|
| Total |
56,437 |
57,009 |
57,046 |
57,441 |
57,637 |
58,220 |
57,708 |
61,075 |
61,433 |
61,523 |
62,267 |
77,381 |
78,112 |
78,422 |
79,626 |
Source: Labour Market Regulatory Authority (LMRA) – Bahrain
Data extracted from files submitted by Pension Fund Commission (PFC) monthly data files to LMRA
ANNEXED NOTE
1. Technical Notes and Definitions
The table provides figures of Bahrain’s total employed population based on their country of citizenship, as registered under the public pension fund (Pension Fund Commission, PFC).
Note that the LMRA data, along with GOSI and PFC, do not include non-civilian employees (engaged in military, defense and other relevant armed forces activities, and ranked as non-civilian).
Employee is defined here as who works in a paid employment job, that is to say, a job where the explicit or implicit contract of employment gives the incumbent a basic remuneration that is independent of the revenue of the unit for which he or she works (the unit can be a corporation, a non-profit institution, a government or a household).Employee is defined here as who works in a paid employment job, that is to say, a job where the explicit or implicit contract of employment gives the incumbent a basic remuneration that is independent of the revenue of the unit for which he or she works (the unit can be a corporation, a non-profit institution, a government or a household).
A Bahraini citizen is defined here as a legal national of the Kingdom of Bahrain. This category excludes nationals of the GCC.A Bahraini citizen is defined here as a legal national of the Kingdom of Bahrain. This category excludes nationals of the GCC.
A Non-Bahraini citizen is defined here as any foreigner or expatriate of a nationality other than Bahraini.A Non-Bahraini citizen is defined here as any foreigner or expatriate of a nationality other than Bahraini.
Public Sector is defined here as the one where employees are registered at the Public Fund Commission (PFC)Public Sector is defined here as the one where employees are registered at the Public Fund Commission (PFC)
Private Sector is defined here as the one where employees are registered at the General Organisation for Social Insurance (GOSI)Private Sector is defined here as the one where employees are registered at the General Organisation for Social Insurance (GOSI)
The Pension Fund Commission (PFC) provides insurance against old age, disability and death (Type A benefits) and against work-related injuries (Type B benefits) to all eligible workers in the public sector. It is now managed by the newly established SociaThe Pension Fund Commission (PFC) provides insurance against old age, disability and death (Type A benefits) and against work-related injuries (Type B benefits) to all eligible workers in the public sector. It is now managed by the newly established Socia
PFC includes under mandatory coverage:PFC includes under mandatory coverage:
1. All government employees, and Bahraini and non-Bahraini workers covered under the governmental Pension law number 13, 1975.
2. Members and officers of the armed forces and public security covered under the governmental Pension Law number 11, 1976
3. Semi governmental organization workers like the Economic Development Board.
4. Some large establishment company in private sector that prefer to register in PFC like Arab Open University.
5. Non Bahrainis governmental workers under the injuries insurance.
PFC exclusions from mandatory coverage:PFC exclusions from mandatory coverage:
1. Workers in private-sector establishments.
2. Workers in co-operatives and joint ventures not explicitly excluded.
3. Workers in agriculture enterprises, manufacturing or marketing their products, and workers operating and repairing mechanical agriculture machines, as well as guards and management.
4. Private drivers, guards, elevator operators and workers in gardeners.
5. Workers in ships including engineers and crews, operating within the territorial region.
6. Family members of employers working in the establishment, including sons and brothers above 18 years old, and daughters and married sisters.
7. Workers in probation period, workers in vocational training, workers under training, and students working during the summer.
The Social Insurance Organization (SIO) was created according to Law (3) of 2008 to replace the separate entities of PFC and GOSI. However, the laws of these public and private sector funds still apply.
Note two minor discrepancies in the sums. The sum of Q3 2010 as reported by the LMRA does not match sum in this table. There is a difference of 8 individuals. For Q1 2011, the sum shown in this table is lower than the sum as reported by the LMRA by three individuals. We take the employed population of the nationalities as fixed and accurate. The LMRA notes that details may not add up to totals due to rounding and missing values.
2. Institution which provides data
Labour Market Regulatory Authority (LMRA)
Pension Fund Commission (PFC)
3. Data availability
The LMRA publishes these data under its Bahrain Labour Market Indicators (BLMI) section. The BLMI dashboard can be found in: (http://blmi.lmra.bh/2014/03/mi_dashboard.xml). The general BLMI data with other non-LMRA sources can be found: (http://blmi.lmra.bh/2014/03/mi_data.xml)
Figures and results are often reported in both PDF and Excel formats.
Data for this LMRA table can be found in the Data section of the LMRA website, available for each quarter of the years: (http://blmi.lmra.bh/2014/03/mi_data.xml)
More specifically, data for this LMRA table for Q3 and Q4 of 2010 can be found in these two links respectively: (http://blmi.lmra.bh/2010/09/data/pfc/Table_07a.pdf), (http://blmi.lmra.bh/2010/12/data/pfc/Table_07a.pdf)
Data for Q1-Q4 of 2011 can be found in these links respectively: (http://blmi.lmra.bh/2011/03/data/pfc/Table_07a.pdf), (http://blmi.lmra.bh/2011/06/data/pfc/Table_07a.pdf), (http://blmi.lmra.bh/2011/09/data/pfc/Table_07a.pdf), (http://blmi.lmra.bh/2011/12/data/pfc/Table_07a.pdf)
Data for Q1-Q4 of 2012 can be found in these links respectively: (http://blmi.lmra.bh/2012/03/data/pfc/Table_07a.pdf), (http://blmi.lmra.bh/2012/06/data/pfc/Table_07a.pdf), (http://blmi.lmra.bh/2012/09/data/pfc/Table_07a.pdf), (http://blmi.lmra.bh/2012/12/data/pfc/Table_07a.pdf)
Data for Q1-Q4 of 2013 can be found in these links, respecitvely: (http://blmi.lmra.bh/2013/03/data/pfc/Table_07a.pdf), (http://blmi.lmra.bh/2013/06/data/pfc/Table_07a.pdf), (http://blmi.lmra.bh/2013/09/data/pfc/Table_07a.pdf), (http://blmi.lmra.bh/2013/12/data/pfc/Table_07a.pdf)
Data for this LMRA table Q4 2014 can be found: (http://blmi.lmra.bh/2014/03/data/pfc/Table_07a.pdf)
The definitions that the LMRA adopts for its data can be found in the Glossary section: (http://blmi.lmra.bh/mi_glossary.xml)
For some details on the way the LMRA estimates employment, refer to the Documents page: (http://blmi.lmra.bh/mi_documents.xml)
More details on the PFC and GOSI can be found on the Social Insurance Organization (SIO) website: (https://www.sio.bh)
Date of access: July 2014
|
males |
females |
Total |
| Bahraini |
120,550 |
56,482 |
177,032 |
|
|
|
|
| Arab |
22,772 |
3,217 |
23,625 |
| GCC |
2,874 |
853 |
3,727 |
| Other Arabs |
19,898 |
2,364 |
22,262 |
|
|
|
|
| Non-Arab |
414,622 |
85,564 |
500,186 |
| Asian |
406,598 |
65,928 |
472,526 |
| African |
1,272 |
17,150 |
18,422 |
| European |
4,612 |
1,774 |
6,386 |
| North American |
1,479 |
431 |
1,910 |
| South American |
186 |
60 |
246 |
| Oceanian |
475 |
221 |
696 |
|
|
|
|
| Total Non-Bahrainis |
437,394 |
88,781 |
526,175 |
|
|
|
|
| Total |
557,944 |
145,263 |
703,207 |
Source: Central Informatics Organisation (CIO) – Bahrain
ANNEXED NOTE
1. Technical Notes and Definitions
| census year |
reference period |
implementing institution |
implementation method |
population covered |
| 1981 |
November 16 |
Ministry of Finance
Statistics Department |
field interviews |
de jure, de facto |
all individuals (nationals and non-nationals): 1- present within the country’s borders during time of reference; 2- residing in Bahrain irrespective of where are they at census times |
| 1991 |
April 6 |
Central Informatics Organisation (CIO) |
field interviews |
| 2001 |
April 7 |
field interviews; characteristics of population in collective households (among which labour camps) was obtained from sponsors |
| 2010 |
April 27 |
based on administrative records |
Nationality of the person is defined by the passport used to enter the country. A Non-Bahraini is considered as such depending on the passport used to enter the country (or obtain the visa).
Period of reference for employment refers to the 7-days period prior to the survey.
Population of reference in table: all employed individuals (nationals and non-nationals) aged 15 and above
Employed population includes population in the following categories:
Employer: A person who operates his / her own economic enterprise or engages independently in a profession for trade and hires one or more employees.
Self-employed: A person who operates his / her own economic enterprise or engages independently in a profession or trade and hires nobody.
Paid employee: A person who works for a public or private organization and receives regular wages / salary whether in cash or in kind.
Unpaid worker: A person works for an enterprise, usually owned by some of his relatives, without receiving a salary / wage
2. Institution which provides data
Central Informatics Organization, known prior to 2001 as the “Central Statistics Organisation” under the Ministry of Cabinet Affairs.
3. Data availability
Figures and results reported here are available on the Central Informatics Organisation (CIO) website. For Arabic version: (http://www.cio.gov.bh/cio_ara/default.aspx). For the English version: (http://www.cio.gov.bh/CIO_ENG/Default.aspx)
The CIO often provides its figures and estimates through tables in PDF format.
The 1981 census figures can be found in the Statistical Abstract 2000, Labour Force Section: (http://www.cio.gov.bh/cio_ara/English/Publications/Statistical%20Abstract/2000/2000-CH11-a%20Labour%20Force.pdf)
The 1991 and 2001 census figures can be found: (http://www.cio.gov.bh/cio_ara/English/Publications/Statistical%20Abstract/ABS2009/CH11/2.pdf)
The 2010 census figures for employed Bahraini population can be found: (http://www.cio.gov.bh/cio_ara/English/Publications/Census/LabourForce/4.10.4.pdf)
The 2010 census figures for employed non-Bahraini population can be found: (http://www.cio.gov.bh/cio_ara/English/Publications/Census/LabourForce/4.10.7.pdf)
These census figures can also be found in the Statistical Abstracts, Labour Force Sections: (http://www.cio.gov.bh/CIO_ENG/SubDetailed.aspx?subcatid=119)
Date of access: June 2014
|
2010 |
2011 |
2012 |
2013 |
2014 |
|
Q3 |
Q4 |
Q1 |
Q2 |
Q3 |
Q4 |
Q1 |
Q2 |
Q3 |
Q4 |
Q1 |
Q2 |
Q3 |
Q4 |
Q1 |
| Bahrainis |
81,497 |
81,741 |
82,340 |
|
80,155 |
81,268 |
77,391 |
82,649 |
82,788 |
83,341 |
83,699 |
84,367 |
83,932 |
84,286 |
85,122 |
|
|
|
|
|
|
|
|
|
|
|
|
|
|
|
|
| Arab Nationals |
6,502 |
6,745 |
6,901 |
|
8,344 |
8,581 |
8,789 |
9,378 |
9,388 |
9,415 |
9,368 |
9,223 |
9,012 |
8,931 |
8,664 |
| GCC |
654 |
710 |
712 |
|
698 |
704 |
688 |
732 |
727 |
716 |
712 |
697 |
645 |
630 |
620 |
| Kuwait |
29 |
32 |
32 |
|
29 |
33 |
26 |
25 |
24 |
24 |
26 |
25 |
25 |
24 |
22 |
| Oman |
313 |
360 |
362 |
|
341 |
335 |
329 |
330 |
310 |
290 |
278 |
271 |
263 |
258 |
249 |
| Qatar |
11 |
12 |
12 |
|
13 |
14 |
16 |
13 |
15 |
15 |
14 |
12 |
8 |
8 |
9 |
| Saudi Arabia |
293 |
296 |
295 |
|
305 |
308 |
305 |
351 |
364 |
374 |
383 |
378 |
338 |
330 |
330 |
| United Arab Emirates |
8 |
10 |
11 |
|
10 |
14 |
12 |
13 |
14 |
13 |
11 |
11 |
11 |
10 |
10 |
|
|
|
|
|
|
|
|
|
|
|
|
|
|
|
|
| Other Arabs |
5,848 |
6,035 |
6,189 |
|
7,646 |
7,877 |
8,101 |
8,646 |
8,661 |
8,699 |
8,656 |
8,526 |
8,367 |
8,301 |
8,044 |
| Iraq |
487 |
502 |
519 |
|
492 |
490 |
475 |
480 |
458 |
448 |
446 |
444 |
447 |
452 |
453 |
| Jordan |
1,297 |
1,317 |
1,358 |
|
1,362 |
1,384 |
1,367 |
1,419 |
1,445 |
1,497 |
1,550 |
1,572 |
1,625 |
1,682 |
1,719 |
| Syrian Arab Republic |
1,111 |
1,150 |
1,161 |
|
1,057 |
1,051 |
1,035 |
1,117 |
1,159 |
1,219 |
1,264 |
1,287 |
1,308 |
1,363 |
1,382 |
| Lebanon |
1,302 |
1,299 |
1,272 |
|
1,125 |
1,126 |
1,074 |
1,091 |
1,085 |
1,075 |
1,055 |
1,035 |
1,014 |
1,010 |
993 |
| West bank and Gaza strip |
143 |
144 |
153 |
|
150 |
148 |
157 |
165 |
169 |
173 |
180 |
188 |
193 |
205 |
212 |
| Yemen, Rep. of |
1,508 |
1,623 |
1,726 |
|
3,460 |
3,678 |
3,993 |
4,374 |
4,345 |
4,287 |
4,161 |
4,000 |
3,780 |
3,589 |
3,285 |
|
|
|
|
|
|
|
|
|
|
|
|
|
|
|
|
| Other Nationalities |
364,727 |
368,627 |
369,630 |
|
367,768 |
373,711 |
366,586 |
386,343 |
392,803 |
399,005 |
406,992 |
415,099 |
420,024 |
422,096 |
422,518 |
| Asia |
350,777 |
354,473 |
355,441 |
|
353,421 |
359,091 |
352,170 |
371,171 |
377,445 |
383,431 |
391,143 |
399,030 |
403,572 |
405,509 |
405,678 |
| Afghanistan |
1 |
2 |
2 |
|
2 |
3 |
2 |
3 |
3 |
5 |
9 |
7 |
7 |
7 |
6 |
| Azerbaijan |
4 |
5 |
6 |
|
5 |
4 |
2 |
3 |
3 |
3 |
4 |
4 |
6 |
5 |
5 |
| Bangladesh |
71,992 |
74,876 |
77,347 |
|
75,984 |
79,121 |
80,065 |
84,969 |
88,559 |
91,992 |
96,575 |
101,682 |
105,399 |
107,726 |
109,183 |
| Bhutan |
1 |
1 |
1 |
|
|
|
|
|
|
|
|
|
|
|
|
| Cambodia |
2 |
2 |
2 |
|
2 |
2 |
1 |
1 |
1 |
1 |
1 |
5 |
6 |
8 |
8 |
| China |
696 |
709 |
652 |
|
749 |
796 |
843 |
856 |
772 |
777 |
773 |
772 |
755 |
720 |
687 |
| Hong Kong, China |
5 |
4 |
4 |
|
3 |
3 |
3 |
3 |
2 |
2 |
2 |
3 |
2 |
2 |
2 |
| India |
203,467 |
202,729 |
200,860 |
|
198,045 |
198,500 |
191,403 |
199,630 |
200,466 |
201,592 |
203,220 |
204,498 |
203,929 |
203,214 |
202,337 |
| Indonesia |
643 |
633 |
649 |
|
608 |
541 |
518 |
510 |
496 |
512 |
525 |
538 |
538 |
543 |
559 |
| Iran, Islamic Rep. of |
317 |
297 |
284 |
|
264 |
252 |
230 |
220 |
217 |
209 |
201 |
199 |
198 |
198 |
196 |
| Japan |
86 |
92 |
97 |
|
123 |
125 |
99 |
124 |
122 |
127 |
121 |
119 |
113 |
112 |
109 |
| Kazakhstan |
7 |
8 |
9 |
|
10 |
13 |
14 |
16 |
16 |
16 |
16 |
15 |
17 |
17 |
18 |
| Korea, Dem. People’s Rep. of |
133 |
116 |
98 |
|
63 |
46 |
43 |
42 |
27 |
26 |
25 |
22 |
20 |
20 |
16 |
| Korea, Republic of |
255 |
271 |
270 |
|
285 |
293 |
304 |
330 |
304 |
237 |
218 |
208 |
188 |
158 |
121 |
| Kyrgyzstan |
2 |
2 |
2 |
|
2 |
|
2 |
2 |
2 |
3 |
4 |
4 |
3 |
7 |
11 |
| Lao People’s Dem. Rep. |
6 |
6 |
6 |
|
0 |
|
1 |
1 |
|
|
|
|
|
|
|
| Macau, China |
2 |
2 |
1 |
|
1 |
0 |
1 |
1 |
1 |
1 |
0 |
|
|
|
|
| Malaysia |
320 |
293 |
268 |
|
225 |
223 |
200 |
181 |
156 |
137 |
121 |
117 |
121 |
110 |
104 |
| Maldives |
4 |
4 |
4 |
|
4 |
4 |
5 |
5 |
5 |
5 |
5 |
5 |
5 |
4 |
4 |
| Mongolia |
0 |
0 |
0 |
|
0 |
0 |
1 |
1 |
1 |
1 |
0 |
|
|
|
|
| Myanmar |
45 |
53 |
69 |
|
133 |
149 |
145 |
144 |
126 |
115 |
114 |
116 |
124 |
134 |
147 |
| Nepal |
16,084 |
16,271 |
16,074 |
|
16,581 |
16,776 |
16,232 |
17,148 |
17,175 |
17,033 |
17,036 |
16,998 |
16,664 |
16,228 |
15,795 |
| Pakistan |
28,409 |
29,304 |
30,047 |
|
31,909 |
33,139 |
32,993 |
36,459 |
38,179 |
39,188 |
40,148 |
41,212 |
42,081 |
42,345 |
42,429 |
| Philippines |
21,225 |
21,611 |
21,457 |
|
21,204 |
21,723 |
21,742 |
22,940 |
23,350 |
23,991 |
24,465 |
24,973 |
25,658 |
26,025 |
26,159 |
| Singapore |
112 |
106 |
95 |
|
84 |
76 |
83 |
53 |
43 |
45 |
45 |
40 |
37 |
38 |
41 |
| Sri Lanka |
4,992 |
5,069 |
5,152 |
|
5,120 |
5,290 |
5,241 |
5,434 |
5,426 |
5,473 |
5,625 |
5,617 |
5,845 |
6,040 |
5,931 |
| Taiwan, China |
0 |
0 |
2 |
|
2 |
0 |
2 |
2 |
2 |
2 |
2 |
2 |
3 |
2 |
2 |
| Tajikstan |
0 |
0 |
0 |
|
0 |
0 |
0 |
0 |
|
0 |
0 |
0 |
0 |
0 |
1 |
| Thailand |
1,811 |
1,856 |
1,833 |
|
1,860 |
1,862 |
1,836 |
1,928 |
1,898 |
1,846 |
1,791 |
1,779 |
1,758 |
1,716 |
1,660 |
| Turkmenistan |
1 |
1 |
0 |
|
1 |
0 |
3 |
4 |
6 |
6 |
7 |
6 |
6 |
6 |
7 |
| Uzbekistan |
12 |
11 |
12 |
|
14 |
15 |
15 |
19 |
20 |
25 |
26 |
26 |
26 |
30 |
33 |
| Viet Nam |
143 |
139 |
138 |
|
138 |
135 |
141 |
142 |
67 |
61 |
64 |
63 |
63 |
94 |
107 |
|
|
|
|
|
|
|
|
|
|
|
|
|
|
|
|
| Europe |
5,098 |
5,150 |
5,186 |
|
5,113 |
5,134 |
5,014 |
5,254 |
5,280 |
5,288 |
5,277 |
5,168 |
5,220 |
5,158 |
5,134 |
| Albania |
0 |
0 |
0 |
|
1 |
0 |
1 |
1 |
1 |
3 |
9 |
7 |
8 |
10 |
12 |
| Armenia |
0 |
1 |
1 |
|
1 |
0 |
1 |
1 |
1 |
1 |
1 |
1 |
1 |
1 |
3 |
| Austria |
17 |
16 |
18 |
|
23 |
21 |
21 |
19 |
16 |
21 |
20 |
21 |
22 |
22 |
24 |
| Belarus |
28 |
28 |
25 |
|
33 |
33 |
36 |
41 |
39 |
41 |
40 |
34 |
40 |
44 |
45 |
| Belgium |
60 |
60 |
53 |
|
47 |
46 |
51 |
52 |
54 |
58 |
57 |
60 |
57 |
55 |
56 |
| Bosnia and Herzegovina |
1 |
0 |
0 |
|
1 |
0 |
7 |
8 |
7 |
6 |
6 |
5 |
6 |
5 |
6 |
| Bulgaria |
65 |
66 |
67 |
|
67 |
67 |
65 |
72 |
78 |
75 |
77 |
77 |
75 |
72 |
67 |
| Croatia |
4 |
4 |
3 |
|
7 |
7 |
9 |
11 |
14 |
12 |
13 |
12 |
11 |
10 |
9 |
| Cyprus |
82 |
75 |
74 |
|
77 |
80 |
70 |
83 |
87 |
89 |
88 |
88 |
86 |
83 |
85 |
| Czech Republic |
7 |
9 |
8 |
|
7 |
7 |
10 |
10 |
11 |
13 |
10 |
5 |
5 |
6 |
7 |
| Denmark |
27 |
25 |
27 |
|
28 |
29 |
32 |
31 |
27 |
26 |
27 |
25 |
26 |
28 |
27 |
| Estonia |
6 |
6 |
7 |
|
6 |
7 |
8 |
8 |
9 |
10 |
10 |
11 |
11 |
11 |
12 |
| Finland |
15 |
21 |
20 |
|
17 |
14 |
13 |
13 |
15 |
14 |
15 |
13 |
14 |
14 |
13 |
| France |
336 |
322 |
326 |
|
317 |
316 |
316 |
318 |
304 |
306 |
303 |
292 |
291 |
286 |
287 |
| French Guiana |
1 |
1 |
1 |
|
|
|
|
|
|
|
|
|
|
|
|
| Georgia |
2 |
2 |
1 |
|
1 |
0 |
1 |
1 |
1 |
1 |
2 |
2 |
3 |
3 |
2 |
| Germany |
210 |
209 |
216 |
|
227 |
222 |
232 |
226 |
232 |
234 |
237 |
240 |
239 |
221 |
206 |
| Greece |
54 |
56 |
53 |
|
57 |
66 |
68 |
85 |
86 |
92 |
85 |
86 |
88 |
83 |
78 |
| Hungary |
8 |
8 |
8 |
|
11 |
12 |
14 |
13 |
12 |
10 |
11 |
15 |
16 |
14 |
14 |
| Iceland |
0 |
|
0 |
|
1 |
0 |
1 |
2 |
2 |
2 |
2 |
2 |
2 |
3 |
3 |
| Ireland |
151 |
162 |
173 |
|
169 |
183 |
174 |
189 |
179 |
184 |
194 |
202 |
202 |
206 |
196 |
| Italy |
85 |
86 |
101 |
|
105 |
104 |
108 |
115 |
127 |
122 |
118 |
119 |
140 |
129 |
123 |
| Latvia |
5 |
6 |
7 |
|
5 |
4 |
4 |
4 |
4 |
4 |
4 |
5 |
6 |
3 |
3 |
| Lithuania |
7 |
5 |
5 |
|
1 |
0 |
1 |
1 |
1 |
1 |
1 |
1 |
3 |
3 |
5 |
| Luxembourg |
1 |
1 |
|
|
|
|
|
|
|
|
|
|
|
|
|
| Malta |
11 |
11 |
11 |
|
8 |
10 |
7 |
8 |
8 |
8 |
7 |
8 |
9 |
10 |
9 |
| Moldova, Rep. of |
2 |
4 |
4 |
|
3 |
0 |
3 |
2 |
3 |
2 |
2 |
2 |
6 |
7 |
4 |
| Netherlands |
67 |
80 |
79 |
|
76 |
84 |
88 |
92 |
90 |
87 |
82 |
75 |
71 |
74 |
76 |
| Norway |
14 |
16 |
18 |
|
17 |
14 |
14 |
14 |
14 |
14 |
12 |
13 |
14 |
14 |
14 |
| Poland |
53 |
51 |
51 |
|
51 |
55 |
51 |
57 |
62 |
62 |
68 |
79 |
105 |
104 |
141 |
| Portugal |
32 |
33 |
33 |
|
31 |
34 |
34 |
35 |
40 |
44 |
47 |
42 |
48 |
58 |
47 |
| Romania |
102 |
107 |
112 |
|
111 |
116 |
111 |
117 |
119 |
112 |
114 |
103 |
98 |
93 |
93 |
| Russian Federation |
49 |
54 |
61 |
|
63 |
62 |
69 |
83 |
84 |
82 |
89 |
94 |
99 |
98 |
98 |
| Serbia and Montenegro |
26 |
25 |
26 |
|
23 |
20 |
17 |
16 |
16 |
16 |
16 |
13 |
13 |
13 |
12 |
| Slovakia |
5 |
4 |
5 |
|
6 |
8 |
6 |
10 |
16 |
15 |
14 |
9 |
9 |
9 |
10 |
| Slovenia |
0 |
1 |
1 |
|
1 |
0 |
0 |
1 |
2 |
2 |
2 |
2 |
3 |
3 |
4 |
| Spain |
48 |
52 |
57 |
|
52 |
52 |
54 |
61 |
71 |
71 |
77 |
78 |
76 |
73 |
76 |
| Sweden |
41 |
40 |
43 |
|
40 |
38 |
37 |
33 |
30 |
32 |
28 |
26 |
28 |
27 |
27 |
| Switzerland |
214 |
216 |
213 |
|
200 |
190 |
170 |
174 |
170 |
172 |
163 |
160 |
152 |
149 |
147 |
| Trinidad and Tobago |
6 |
6 |
6 |
|
5 |
5 |
10 |
11 |
14 |
12 |
11 |
11 |
9 |
9 |
10 |
| Turkey |
732 |
744 |
746 |
|
754 |
762 |
744 |
762 |
755 |
775 |
793 |
790 |
806 |
814 |
828 |
| Ukraine |
26 |
24 |
22 |
|
23 |
25 |
25 |
26 |
31 |
30 |
35 |
41 |
42 |
45 |
52 |
| United Kingdom |
2,498 |
2,513 |
2,504 |
|
2,440 |
2,441 |
2,331 |
2,448 |
2,448 |
2,427 |
2,387 |
2,299 |
2,280 |
2,246 |
2,203 |
|
|
|
|
|
|
|
|
|
|
|
|
|
|
|
|
| North America |
1,105 |
1,150 |
1,167 |
0 |
1,271 |
1,322 |
1,336 |
1,319 |
1,329 |
1,364 |
1,332 |
1,299 |
1,313 |
1,330 |
1,304 |
| Canada |
363 |
349 |
356 |
|
354 |
353 |
340 |
330 |
338 |
341 |
331 |
326 |
310 |
318 |
323 |
| Cayman Islands |
3 |
3 |
3 |
|
3 |
3 |
3 |
3 |
2 |
2 |
2 |
2 |
2 |
2 |
2 |
| Colombia |
18 |
23 |
24 |
|
33 |
34 |
35 |
36 |
37 |
38 |
28 |
29 |
27 |
28 |
25 |
| Costa Rica |
0 |
0 |
0 |
|
1 |
0 |
1 |
1 |
1 |
1 |
1 |
1 |
1 |
1 |
1 |
| Cuba |
0 |
1 |
2 |
|
2 |
3 |
3 |
2 |
1 |
3 |
2 |
2 |
2 |
2 |
2 |
| Dominica |
1 |
1 |
1 |
|
1 |
0 |
1 |
1 |
1 |
1 |
1 |
1 |
3 |
3 |
1 |
| Dominican Republic |
0 |
0 |
0 |
|
0 |
0 |
2 |
1 |
1 |
1 |
1 |
2 |
4 |
7 |
8 |
| El Salvador |
0 |
0 |
0 |
|
1 |
0 |
1 |
1 |
1 |
1 |
1 |
1 |
1 |
1 |
1 |
| Guatemala |
6 |
6 |
7 |
|
7 |
6 |
7 |
7 |
7 |
7 |
7 |
7 |
7 |
7 |
7 |
| Jamaica |
2 |
2 |
3 |
|
4 |
4 |
4 |
4 |
5 |
6 |
6 |
6 |
7 |
5 |
3 |
| Mexico |
10 |
13 |
18 |
|
16 |
15 |
15 |
14 |
15 |
17 |
21 |
23 |
23 |
25 |
21 |
| Nicaragua |
0 |
0 |
0 |
|
1 |
0 |
1 |
1 |
2 |
2 |
2 |
1 |
1 |
1 |
2 |
| Panama |
2 |
5 |
4 |
|
4 |
5 |
5 |
4 |
6 |
6 |
4 |
5 |
4 |
5 |
3 |
| Saint Lucia |
0 |
0 |
1 |
|
1 |
0 |
1 |
1 |
1 |
1 |
0 |
1 |
1 |
1 |
2 |
| Saint Vincent and the Grenadines |
1 |
1 |
1 |
|
1 |
0 |
1 |
1 |
|
1 |
1 |
0 |
1 |
1 |
1 |
| United States |
699 |
743 |
741 |
|
837 |
895 |
913 |
909 |
908 |
934 |
922 |
890 |
916 |
920 |
899 |
| Virgin Islands (British) |
0 |
3 |
6 |
|
5 |
4 |
3 |
3 |
3 |
2 |
2 |
2 |
3 |
3 |
3 |
|
|
|
|
|
|
|
|
|
|
|
|
|
|
|
|
| Oceania |
411 |
397 |
365 |
|
352 |
336 |
313 |
323 |
310 |
304 |
293 |
291 |
298 |
294 |
287 |
| Australia |
317 |
308 |
278 |
|
265 |
256 |
240 |
251 |
239 |
236 |
231 |
228 |
228 |
221 |
208 |
| Kiribati |
1 |
1 |
2 |
|
2 |
2 |
2 |
2 |
2 |
2 |
1 |
2 |
2 |
2 |
2 |
| New Zealand |
93 |
88 |
85 |
|
85 |
78 |
71 |
70 |
69 |
66 |
61 |
61 |
68 |
71 |
77 |
|
|
|
|
|
|
|
|
|
|
|
|
|
|
|
|
| South America |
86 |
79 |
78 |
|
86 |
87 |
85 |
91 |
85 |
87 |
83 |
78 |
80 |
85 |
86 |
| Argentina |
8 |
7 |
6 |
|
6 |
7 |
6 |
5 |
5 |
6 |
5 |
3 |
3 |
3 |
4 |
| Bolivia |
1 |
1 |
1 |
|
1 |
0 |
1 |
1 |
1 |
1 |
1 |
|
|
|
|
| Brazil |
36 |
33 |
35 |
|
43 |
45 |
40 |
42 |
37 |
38 |
37 |
35 |
35 |
39 |
40 |
| Chile |
4 |
2 |
2 |
|
0 |
0 |
0 |
|
0 |
0 |
1 |
3 |
2 |
2 |
2 |
| Ecuador |
0 |
0 |
0 |
|
2 |
2 |
0 |
1 |
1 |
1 |
1 |
|
|
|
|
| Paraguay |
1 |
1 |
1 |
|
|
|
|
|
|
|
|
|
|
|
|
| Peru |
7 |
7 |
7 |
|
5 |
6 |
6 |
8 |
8 |
9 |
9 |
9 |
10 |
9 |
9 |
| Uruguay |
0 |
0 |
0 |
|
1 |
0 |
1 |
0 |
2 |
2 |
2 |
1 |
2 |
2 |
3 |
| Venezuela |
29 |
28 |
26 |
|
28 |
27 |
31 |
34 |
31 |
30 |
27 |
27 |
28 |
30 |
28 |
|
|
|
|
|
|
|
|
|
|
|
|
|
|
|
|
| Not specified |
7,250 |
7,378 |
7,393 |
|
7,525 |
7,741 |
7,668 |
8,185 |
8,354 |
8,531 |
8,864 |
9,233 |
9,541 |
9,720 |
10,029 |
| |
|
|
|
|
|
|
|
|
|
|
|
|
|
|
|
| Total |
452,726 |
457,113 |
458,871 |
0 |
456,267 |
463,560 |
452,766 |
478,370 |
484,979 |
491,761 |
500,059 |
508,689 |
512,968 |
515,313 |
516,304 |
Source: Labour Market Regulatory Authority (LMRA) – Bahrain
Data extracted from files submitted by General Organisation for Social Insurance (GOSI) monthly data files to LMRA.
ANNEXED NOTE
1. Technical Notes and Definitions
The table provides figures of Bahrain’s total employed population (nationals and non-nationals) based on their nationality.
The data of this table is taken from the General Organisation for Social Insurance (GOSI) monthly files relayed to the LMRA
Employee is defined here as who works in a paid employment job, that is to say, a job where the explicit or implicit contract of employment gives the incumbent a basic remuneration that is independent of the revenue of the unit for which he or she works (the unit can be a corporation, a non-profit institution, a government or a household).
A Bahraini citizen is defined here as a legal national of the Kingdom of Bahrain. This category excludes nationals of the GCC.A Bahraini citizen is defined here as a legal national of the Kingdom of Bahrain. This category excludes nationals of the GCC.
A Non-Bahraini citizen is defined here as any foreigner or expatriate of a nationality other than Bahraini.A Non-Bahraini citizen is defined here as any foreigner or expatriate of a nationality other than Bahraini.
Public Sector is defined here as the one where employees are registered at the Public Fund Commission (PFC)Public Sector is defined here as the one where employees are registered at the Public Fund Commission (PFC)
Private Sector is defined here as the one where employees are registered at the General Organisation for Social Insurance (GOSI)Private Sector is defined here as the one where employees are registered at the General Organisation for Social Insurance (GOSI)
General Organisation for Social Insurance (GOSI) provides insurance against old age, disability and death (Type A benefits) and against employment injuries (Type B benefits) to all eligible workers in the private sector in accordance with their employment contracts. Employers or economic units falling within the scope of the GOSI law are required to insure their employees on a mandatory basis. Other employers or economic units may insure their employees on an optional basis. It is now managed by the newly established Social Insurance Organization (SIO).General Organisation for Social Insurance (GOSI) provides insurance against old age, disability and death (Type A benefits) and against employment injuries (Type B benefits) to all eligible workers in the private sector in accordance with their employment contracts. Employers or economic units falling within the scope of the GOSI law are required to insure their employees on a mandatory basis. Other employers or economic units may insure their employees on an optional basis. It is now managed by the newly established Social Insurance Organization (SIO).
An employer under GOSI is a physical or legal person engaging one or more worker. In case, the employer has more than one branch and all have the same economic activity, they are considered as one employer. If the branches have different economic activities with separate accounts, each activity is considered as one employer.
GOSI inclusions under mandatory coverage: GOSI inclusions under mandatory coverage:
1. Workers in private-sector establishments with 10 or more workers – fourth stage 2002. On June 2004, mandatory insurance coverage was extended to workers in establishments with 5 or more workers; and as of June 2005 to workers in all establishments with one or more workers.
2. Workers in co-operatives and joint ventures not explicitly excluded
3. Workers in agriculture enterprises, manufacturing or marketing their products, and workers operating and repairing mechanical agriculture machines, as well as guards and management.
4. Private drivers, guards, elevator operators and workers in gardeners.
5. Workers in ships including engineers and crews, operating within the territorial region.
6. Family members of employers working in the establishment, including sons and brothers above 18 years old, and daughters and married sisters.
7. Workers in probation period, workers in vocational training, workers under training, and students working during the summer.
GOSI exclusions from mandatory coverage:GOSI exclusions from mandatory coverage:
1. All government employees, and Bahraini and non-Bahraini workers covered under the governmental Pension Law number 13, 1975.
2. Members and officers of the armed forces and public security.
3. Workers in public institutions expressly excluded from the Social Insurance Scheme.
4. Staff of diplomatic agencies holding the same nationality of the institution.
5. Employees working on international assignments.
6. Personnel of vessels such as engineers and screw working in international territory
7. Domestic workers.
8. Agriculture labourers in agriculture establishments not marketing or processing their products.
9. Family members of employers working in the establishment, including wives, sons and brothers below 18 year old, unmarried daughters and sisters, and parents.
10. Workers engaged on temporary jobs not more than 3 months, or on ad-hoc jobs, not forming part of the activity of the employer.
11. Expatriate workers assigned by holding companies or a branch outside Bahrain to their local branch in Bahrain for the purpose of training local employees in their work for a period not more than 12 months.
12. Students joining an establishment for practical experience, not for official training.
The Social Insurance Organization (SIO) was created according to Law (3) of 2008 to replace the separate entities of PFC and GOSI. However, the laws of each public and private sector funds still apply.
Note one minor discrepancies in the sums. The sum of Q4 2011 as reported by the LMRA is under reported by 7 individuals than the sum calculated in this table here. We take the employed population of the nationalities as fixed and accurate. The LMRA notes that details may not add up to totals due to rounding and missing values.
Note that the PDF uploaded on the LMRA website for Q2 2011 is for Q4 2011 and therefore does not match the quarter.
2. Institution which provides data
Labour Market Regulatory Authority (LMRA)
General Organisation for Social Insurance (GOSI)
3. Data availability
The LMRA publishes these data under its Bahrain Labourr Market Indicators (BLMI) section. The BLMI dashboard can be found in: (http://blmi.lmra.bh/2014/03/mi_dashboard.xml). The general BLMI data with other non-LMRA sources can be found: (http://blmi.lmra.bh/2014/03/mi_data.xml)
Figures and results are often reported in tables in both PDF and Excel formats.
Data for this LMRA table can be found in the Data section of the LMRA website, available for each quarter of the years: (http://blmi.lmra.bh/2014/03/mi_data.xml)
More specifically, data for this LMRA table for Q3 and Q4 of 2010 can be found: (http://blmi.lmra.bh/2010/09/data/gos/Table_07a.pdf), (http://blmi.lmra.bh/2010/12/data/gos/Table_07a.pdf)
Data for Q1, Q3 and Q4 of 2011 can be found in these links, respectivaly: (http://blmi.lmra.bh/2011/03/data/gos/Table_07a.pdf), (http://blmi.lmra.bh/2011/09/data/gos/Table_07a.pdf), (http://blmi.lmra.bh/2011/12/data/gos/Table_07a.pdf)
Data for Q1-Q4 of 2012 can be found in these links, respectively: (http://blmi.lmra.bh/2012/03/data/gos/Table_07a.pdf), (http://blmi.lmra.bh/2012/06/data/gos/Table_07a.pdf), (http://blmi.lmra.bh/2012/09/data/gos/Table_07a.pdf), (http://blmi.lmra.bh/2012/12/data/gos/Table_07a.pdf)
Data for Q1-Q4 of 2013 can be found in these links, respectively: (http://blmi.lmra.bh/2013/03/data/gos/Table_07a.pdf), (http://blmi.lmra.bh/2013/06/data/gos/Table_07a.pdf), (http://blmi.lmra.bh/2013/09/data/gos/Table_07a.pdf), (http://blmi.lmra.bh/2013/12/data/gos/Table_07a.pdf)
Data for Q1 2014 can be found: (http://blmi.lmra.bh/2014/03/data/gos/Table_07a.pdf)
The definitions that the LMRA adopts for its data can be found in the Glossary section: (http://blmi.lmra.bh/mi_glossary.xml)
For some details on the way the LMRA estimates employment, refer to the Documents page: (http://blmi.lmra.bh/mi_documents.xml)
More details on the PFC and GOSI can be found on the Social Insurance Organization (SIO) website: (https://www.sio.bh)
Date of access: July 2014
|
Work |
|
|
With Family |
|
|
Study / Training |
|
|
Medical Treatment |
|
|
Marriage |
|
|
Tourism |
|
|
Business Mission |
|
|
Others |
|
|
Total |
|
|
| Nationality Group |
males |
females |
total |
males |
females |
total |
males |
females |
total |
males |
females |
total |
males |
females |
total |
males |
females |
total |
males |
females |
total |
males |
females |
total |
males |
females |
total |
| GCC |
1,074 |
144 |
1,218 |
911 |
1,269 |
2,180 |
330 |
148 |
478 |
4 |
3 |
7 |
115 |
605 |
720 |
160 |
74 |
234 |
21 |
14 |
35 |
1,024 |
930 |
1,954 |
3,639 |
3,187 |
6,826 |
| Other Arabs |
7,437 |
943 |
8,380 |
2,954 |
5,063 |
8,017 |
114 |
68 |
182 |
5 |
5 |
10 |
38 |
1,160 |
1,198 |
20 |
18 |
38 |
6 |
4 |
10 |
1,124 |
1,091 |
2,215 |
11,698 |
8,352 |
20,050 |
| Asia |
132,049 |
28,066 |
160,115 |
10,307 |
22,355 |
32,662 |
170 |
142 |
312 |
21 |
11 |
32 |
51 |
1,695 |
1,746 |
48 |
91 |
139 |
287 |
19 |
306 |
5,410 |
4,904 |
10,314 |
148,343 |
57,283 |
205,626 |
| Africa |
249 |
2,325 |
2,574 |
74 |
201 |
275 |
0 |
1 |
1 |
1 |
1 |
2 |
0 |
29 |
29 |
2 |
2 |
4 |
0 |
2 |
2 |
16 |
21 |
37 |
342 |
2,582 |
2,924 |
| European |
2,001 |
960 |
2,961 |
665 |
1,606 |
2,271 |
10 |
20 |
30 |
1 |
1 |
2 |
6 |
228 |
234 |
8 |
8 |
16 |
2 |
6 |
8 |
140 |
126 |
266 |
2,833 |
2,955 |
5,788 |
| North American |
1,533 |
579 |
2,112 |
303 |
591 |
894 |
39 |
30 |
69 |
0 |
0 |
0 |
4 |
26 |
30 |
3 |
2 |
5 |
5 |
0 |
5 |
37 |
43 |
80 |
1,924 |
1,271 |
3,195 |
| South American |
28 |
13 |
41 |
4 |
14 |
18 |
0 |
0 |
0 |
0 |
0 |
0 |
0 |
6 |
6 |
1 |
0 |
1 |
0 |
0 |
0 |
2 |
2 |
4 |
35 |
35 |
70 |
| Oceanian |
131 |
97 |
228 |
72 |
130 |
202 |
1 |
0 |
1 |
0 |
0 |
0 |
0 |
8 |
8 |
0 |
1 |
1 |
0 |
0 |
0 |
11 |
10 |
21 |
215 |
246 |
461 |
| Total |
144,502 |
33,127 |
177,629 |
15,290 |
31,229 |
46,519 |
664 |
409 |
1,073 |
32 |
21 |
53 |
214 |
3,757 |
3,971 |
242 |
196 |
438 |
321 |
45 |
366 |
7,764 |
7,127 |
14,891 |
169,029 |
75,911 |
244,940 |
Source: Central Informatics Organisation (CIO) – Bahrain
ANNEXED NOTE
1. Technical Notes and Definitions
The table provides census totals of Bahrain’s non-national resident population based on their reason of residence in Bahrain
Reference period for Census 2001 is April 7th, 2001 .
Implementation method: the Censuses are carried out according to de jure methodology, i.e. counting persons using their usual place of residence irrespective of where are they at census times
Population of reference: all Bahrainis present within Bahrain’s borders during time of reference, be they permanent or temporary residents.
2. Institution which provides data
Central Informatics Organization, known prior to 2001 as the “Central Statistics Organisation” under the Ministry of Cabinet Affairs
Some of the calculated totals differ from the figures report by the CIO. Total male and female figures are assumed as correct and totals are calculated accordingly.
3. Data availability
This data is available on the Central Informatics Organisation (CIO) website. For the Arabic version: (http://www.cio.gov.bh/cio_ara/default.aspx). For the English version: (http://www.cio.gov.bh/CIO_ENG/Default.aspx)
Tables for 1991 and 2001 Censuses, and some prior censuses are available in PDF format: (http://www.cio.gov.bh/CIO_ENG/SubDetailed.aspx?subcatid=416)
This 2001 census data is available in tables in PDF format: (http://www.cio.gov.bh/cio_ara/English/Publications/Statistical%20Abstract/ABS2008/Ch2/31B.pdf)
Data of access: June 2014
|
Work |
|
|
With Family |
|
|
Study / Training |
|
|
Medical Treatment |
|
|
Marriage |
|
|
Tourism |
|
|
Business Mission |
|
|
Others |
|
|
Total |
|
|
| Nationality Group |
males |
females |
total |
males |
females |
total |
males |
females |
total |
males |
females |
total |
males |
females |
total |
males |
females |
total |
males |
females |
total |
males |
females |
total |
males |
females |
total |
| GCC |
820 |
20 |
840 |
771 |
1,044 |
1,815 |
201 |
191 |
392 |
1 |
6 |
7 |
97 |
426 |
523 |
61 |
31 |
92 |
58 |
9 |
67 |
517 |
475 |
992 |
2,526 |
2,202 |
4,728 |
| Other Arabs |
5,837 |
788 |
6,625 |
3,130 |
5,451 |
8,581 |
95 |
57 |
152 |
2 |
5 |
7 |
37 |
489 |
526 |
21 |
29 |
50 |
5 |
6 |
11 |
959 |
966 |
1,925 |
10,086 |
7,791 |
17,877 |
| Asia |
102,145 |
18,069 |
120,214 |
8,527 |
17,853 |
26,380 |
206 |
144 |
350 |
10 |
5 |
15 |
65 |
1,299 |
1,364 |
36 |
47 |
83 |
57 |
28 |
85 |
3,047 |
2,552 |
5,599 |
114,093 |
39,997 |
154,090 |
| Africa |
107 |
57 |
164 |
34 |
100 |
134 |
0 |
1 |
1 |
0 |
0 |
0 |
0 |
14 |
14 |
1 |
2 |
3 |
0 |
0 |
0 |
17 |
12 |
29 |
159 |
186 |
345 |
| European |
2,259 |
874 |
3,133 |
622 |
1,674 |
2,296 |
19 |
16 |
35 |
1 |
0 |
1 |
9 |
212 |
221 |
20 |
24 |
44 |
11 |
3 |
14 |
128 |
120 |
248 |
3,069 |
2,923 |
5,992 |
| North American |
514 |
131 |
645 |
167 |
358 |
525 |
19 |
18 |
37 |
1 |
0 |
1 |
1 |
28 |
29 |
3 |
6 |
9 |
19 |
3 |
22 |
17 |
18 |
35 |
741 |
562 |
1,303 |
| South American |
30 |
8 |
38 |
10 |
31 |
41 |
1 |
1 |
2 |
0 |
0 |
0 |
0 |
9 |
9 |
0 |
0 |
0 |
0 |
0 |
0 |
1 |
2 |
3 |
42 |
51 |
93 |
| Oceanian |
127 |
28 |
155 |
44 |
92 |
136 |
0 |
0 |
0 |
0 |
0 |
0 |
0 |
0 |
0 |
0 |
0 |
0 |
0 |
0 |
0 |
4 |
3 |
7 |
175 |
123 |
298 |
| Total |
111,839 |
19,975 |
131,814 |
13,305 |
26,603 |
39,908 |
541 |
428 |
969 |
15 |
16 |
31 |
209 |
2,477 |
2,686 |
142 |
139 |
281 |
150 |
49 |
199 |
4,690 |
4,148 |
8,838 |
130,891 |
53,835 |
184,726 |
Source: Central Informatics Organisation (CIO) – Bahrain
ANNEXED NOTE
1. Technical Notes and Definitions
The table provides census totals of Bahrain’s non-national resident population based on their reason of residence in Bahrain
Implementation method: the Censuses are carried out according to de jure methodology, i.e. counting persons using their usual place of residence irrespective of where are they at census times
Population of reference: all Bahrainis present within Bahrain’s borders during time of reference, be they permanent or temporary residents.
Some of the calculated totals differ from the figures report by the CIO. Total male and female figures are assumed as correct and totals are calculated accordingly.
2. Institution which provides data
Central Informatics Organization, known prior to 2001 as the “Central Statistics Organisation” under the Ministry of Cabinet Affairs
3. Data availability
This data is available on the Central Informatics Organisation (CIO) website. For the Arabic version: (http://www.cio.gov.bh/cio_ara/default.aspx). For the English version: (http://www.cio.gov.bh/CIO_ENG/Default.aspx)
Tables for 1991 and 2001 Censuses, and some prior censuses are available in PDF format: (http://www.cio.gov.bh/CIO_ENG/SubDetailed.aspx?subcatid=416)
This 1991 census data is available in tables in PDF format: (http://www.cio.gov.bh/cio_ara/English/Publications/Statistical%20Abstract/ABS2008/Ch2/31B.pdf)
Data of access: June 2014
| Current Place of Residence |
Place of Residence Five Years Ago |
Total |
| |
Hidd |
Muharraq |
Manama |
Jidhafs |
Northern |
Sitra |
Centeral |
Isa Town |
Riffa |
Western |
Eastern |
Hamad Town |
Abroad |
Not Stated |
|
| Hidd |
6,027 |
499 |
32 |
4 |
22 |
2 |
5 |
25 |
37 |
29 |
0 |
26 |
101 |
0 |
6,809 |
| Muharraq |
594 |
52,729 |
481 |
24 |
42 |
20 |
107 |
205 |
187 |
13 |
1 |
97 |
653 |
0 |
55,153 |
| Manama |
57 |
359 |
38,324 |
197 |
136 |
86 |
168 |
240 |
173 |
39 |
4 |
123 |
476 |
0 |
40,382 |
| Jidhafs |
34 |
96 |
1,022 |
34,527 |
1,747 |
60 |
188 |
203 |
206 |
57 |
0 |
119 |
179 |
0 |
38,438 |
| Northern |
10 |
91 |
614 |
570 |
25,296 |
75 |
91 |
160 |
112 |
84 |
0 |
125 |
189 |
0 |
27,417 |
| Sitra |
5 |
22 |
176 |
34 |
32 |
25,470 |
132 |
63 |
95 |
35 |
0 |
34 |
94 |
0 |
26,192 |
| Centeral |
21 |
185 |
954 |
258 |
240 |
135 |
26,277 |
1,904 |
264 |
164 |
3 |
174 |
121 |
0 |
30,700 |
| Isa Town |
27 |
235 |
331 |
85 |
75 |
115 |
190 |
26,637 |
329 |
13 |
0 |
95 |
296 |
0 |
28,428 |
| Riffa |
132 |
371 |
529 |
79 |
46 |
76 |
246 |
556 |
34,319 |
145 |
0 |
269 |
388 |
0 |
37,156 |
| Western |
63 |
6 |
66 |
15 |
139 |
28 |
43 |
37 |
90 |
18,229 |
7 |
144 |
76 |
0 |
18,943 |
| Eastern |
9 |
10 |
27 |
5 |
9 |
10 |
7 |
45 |
998 |
7 |
89 |
16 |
7 |
0 |
1,239 |
| Hamad Town |
67 |
411 |
572 |
243 |
295 |
96 |
108 |
537 |
579 |
192 |
10 |
39,456 |
260 |
0 |
42,826 |
| Abroad |
0 |
9 |
2 |
0 |
0 |
0 |
0 |
0 |
1 |
0 |
1 |
0 |
3,650 |
0 |
3,663 |
| Total |
7,046 |
55,023 |
43,130 |
36,041 |
28,079 |
26,173 |
27,562 |
30,612 |
37,390 |
19,007 |
115 |
40,678 |
6,490 |
0 |
357,346 |
Source: Central Informatics Organisation (CIO) – Bahrain
ANNEXED NOTE
1. Technical Notes and Definitions
Reference period for Census 2001 is April 7th 2001Reference period for Census 2001 is April 7th 2001
Implementation method: the Censuses are carried out according to de jure methodology, i.e. counting persons using their usual place of residence irrespective of where are they at census times Implementation method: the Censuses are carried out according t
Population of reference: Bahrainis present within Bahrain’s borders during time of referencePopulation of reference: Bahrainis present within Bahrain’s borders during time of reference
*The place of residence in this table is more clearly explained in the 2001′ census summary report, which has the same categories defined for the 1991′ census:
1) Hidd covers only Hidd town
2) Muharraq covers Muharraq town, Busaiteen, Al-Dair, Samaheej, Arad, Halat Al-Slateh, Halat Al-Naeim and Qalali.
3) Manama covers Manama town, Al-Burhama, Salihiya, Zinj, Bilad Al-Qadeem, Khamis, Abu-Bahm, South Sehla, Nabi Saleh.
4) Jidhafs covers Jidhafs town, Sanabis, Tashan, Al-Musalla, Al-Daih, Karbabad, Jeblat Hibashi, Al-Qalah, North Sehla, Hillat Abdul Saleh, Al-Qadam, Al-Maqsha, Karranah, Bu Quwah, Al-Hajar, Abu Saiba, Shakhura
5) Northern region covers Jannusan, Muqabah, Jid Al-Haj, Sar, Barbar, Al-Markh, Al-Diraz, Bani Jamrah, Al-Qurayya, Budaiya, Janabiya, other northern islands
6) Sitra covers the Industrial area, Mahazza, Al-Qarya , Murqoban, Kharjiya, Abu Al-Aish, Wadyan, Sufala, Al-Hamriya, Um Al-Baidh, East Eker, West Eker, Ma’ameer, Nuwaidrat
7) Central region covers Tubli, Salmabad, Jid Ali, Jerdab, A’Ali, Al-Nasfa, Sanad, Buri
8) Isa Town covers only Isa Town
9) Riffa covers East Riffa, West Riffa, Safreh, Awali, Al-Riffah, Al-Sakhir, Al-Rumaythah
10) Western covers Al-Jasrah, Al-Hamalah, Damistan, Karzak-kan, Malkiya, Sadad, Shahrakkan, Dar Kulaib, Zallaq, Jazaer
11) Southern region covers Askar, Ras Zuwayed, Muzarra, Ras Abu Jurjur, Hafirah, Jau, Al-Dur, Um al-Summan, Hawar Islands
12) Hamad Town covers only Hamad town
2. Institution which provides data
Central Informatics Organization, known prior to 2001 as the “Central Statistics Organisation” under the Ministry of Cabinet Affairs
Survey and Land Registration Bureau (SLRB)
3. Data availability
This data is available on the Central Informatics Organisation (CIO) website. For the Arabic version: (http://www.cio.gov.bh/cio_ara/default.aspx). For the English version: (http://www.cio.gov.bh/CIO_ENG/Default.aspx)
Tables for 1991 and 2001 Censuses, and some prior censuses are available in PDF format: (http://www.cio.gov.bh/cio_eng/SubDetailed.aspx?subcatid=416)
Data for 1991 and 2001 Censuses for Bahrainis and place of residences are available in PDF format: (http://www.cio.gov.bh/cio_ara/English/Publications/Statistical%20Abstract/ABS2008/Ch2/25.pdf)
Data of access: June 2014
|
Place of Residence Five Years Ago |
Total |
| Current Place of Residence |
Hidd |
Muharraq |
Manama |
Jidhafs |
Northern |
Sitra |
Central |
Isa Town |
Riffa |
Western |
Eastern |
Hamad Town |
Abroad |
Not Stated |
|
| Hidd |
4,700 |
351 |
29 |
0 |
4 |
0 |
5 |
22 |
26 |
17 |
2 |
14 |
117 |
1 |
5,288 |
| Muharraq |
454 |
42,857 |
592 |
41 |
26 |
13 |
34 |
162 |
122 |
26 |
3 |
87 |
444 |
23 |
44,884 |
| Manama |
89 |
600 |
39,472 |
292 |
161 |
97 |
107 |
320 |
273 |
18 |
1 |
98 |
416 |
55 |
41,999 |
| Jidhafs |
37 |
78 |
874 |
30,808 |
205 |
62 |
43 |
122 |
67 |
36 |
4 |
29 |
108 |
2 |
32,475 |
| Northern |
24 |
98 |
451 |
306 |
19,060 |
23 |
20 |
129 |
31 |
11 |
0 |
33 |
142 |
3 |
20,331 |
| Sitra |
5 |
37 |
292 |
29 |
8 |
21,411 |
39 |
59 |
49 |
19 |
0 |
34 |
78 |
7 |
22,067 |
| Central |
12 |
155 |
1,121 |
257 |
88 |
72 |
17,970 |
766 |
100 |
56 |
0 |
54 |
89 |
2 |
20,742 |
| Isa Town |
43 |
352 |
709 |
126 |
115 |
91 |
131 |
24,050 |
240 |
42 |
0 |
98 |
366 |
3 |
26,366 |
| Riffa |
137 |
668 |
1,398 |
91 |
65 |
50 |
137 |
772 |
19,807 |
180 |
1 |
103 |
262 |
31 |
23,702 |
| Western |
35 |
4 |
53 |
26 |
13 |
21 |
3 |
6 |
15 |
15,119 |
1 |
6 |
19 |
11 |
15,332 |
| Eastern |
15 |
50 |
70 |
20 |
38 |
30 |
14 |
56 |
730 |
15 |
14 |
4 |
1 |
205 |
1,262 |
| Hamad Town |
190 |
1,438 |
2,908 |
1,327 |
504 |
489 |
479 |
2,263 |
1,761 |
708 |
5 |
8,704 |
321 |
5 |
21,102 |
| Total |
5,741 |
46,688 |
47,969 |
33,323 |
20,287 |
22,359 |
18,982 |
28,727 |
23,221 |
16,247 |
31 |
9,264 |
2,363 |
348 |
275,550 |
Source: Central Informatics Organisation (CIO) – Bahrain
ANNEXED NOTE
1. Technical Notes and Definitions
Reference period for Census 1991 is unknown.Reference period for Census 1991 is unknown.
Implementation method: the Censuses are carried out according to de jure methodology, i.e. counting persons using their usual place of residence irrespective of where are they at census times Implementation method: the Censuses are carried out according t
Population of reference: Bahrainis present within Bahrain’s borders during time of referencePopulation of reference: Bahrainis present within Bahrain’s borders during time of reference
*The place of residence in this table is more clearly explained in the 2001′ census summary report, which has the same categories defined for the 1991′ census:
1) Hidd covers only Hidd town
2) Muharraq covers Muharraq town, Busaiteen, Al-Dair, Samaheej, Arad, Halat Al-Slateh, Halat Al-Naeim and Qalali.
3) Manama covers Manama town, Al-Burhama, Salihiya, Zinj, Bilad Al-Qadeem, Khamis, Abu-Bahm, South Sehla, Nabi Saleh.
4) Jidhafs covers Jidhafs town, Sanabis, Tashan, Al-Musalla, Al-Daih, Karbabad, Jeblat Hibashi, Al-Qalah, North Sehla, Hillat Abdul Saleh, Al-Qadam, Al-Maqsha, Karranah, Bu Quwah, Al-Hajar, Abu Saiba, Shakhura
5) Northern region covers Jannusan, Muqabah, Jid Al-Haj, Sar, Barbar, Al-Markh, Al-Diraz, Bani Jamrah, Al-Qurayya, Budaiya, Janabiya, other northern islands
6) Sitra covers the Industrial area, Mahazza, Al-Qarya , Murqoban, Kharjiya, Abu Al-Aish, Wadyan, Sufala, Al-Hamriya, Um Al-Baidh, East Eker, West Eker, Ma’ameer, Nuwaidrat
7) Central region covers Tubli, Salmabad, Jid Ali, Jerdab, A’Ali, Al-Nasfa, Sanad, Buri
8) Isa Town covers only Isa Town
9) Riffa covers East Riffa, West Riffa, Safreh, Awali, Al-Riffah, Al-Sakhir, Al-Rumaythah
10) Western covers Al-Jasrah, Al-Hamalah, Damistan, Karzak-kan, Malkiya, Sadad, Shahrakkan, Dar Kulaib, Zallaq, Jazaer
11) Southern region covers Askar, Ras Zuwayed, Muzarra, Ras Abu Jurjur, Hafirah, Jau, Al-Dur, Um al-Summan, Hawar Islands
12) Hamad Town covers only Hamad town
2. Institution which provides data
Central Informatics Organization, known prior to 2001 as the “Central Statistics Organisation” under the Ministry of Cabinet Affairs
Survey and Land Registration Bureau (SLRB)
3. Data availability
This data is available on the Central Informatics Organisation (CIO) website. For the Arabic version: (http://www.cio.gov.bh/cio_ara/default.aspx). For the English version: (http://www.cio.gov.bh/CIO_ENG/Default.aspx)
Tables for 1991 and 2001 Censuses, and some prior censuses are available in PDF format: (http://www.cio.gov.bh/cio_eng/SubDetailed.aspx?subcatid=416)
Data for 1991 and 2001 Censuses for Bahrainis and place of residences are available in PDF format: (http://www.cio.gov.bh/cio_ara/English/Publications/Statistical%20Abstract/ABS2008/Ch2/25.pdf)
Data of access: June 2014
|
Bahraini |
|
Non-Bahraini |
|
|
Total |
|
males |
females |
total |
males |
females |
total |
|
| Illiterate / Read Only |
9,684 |
21,885 |
31,569 |
22,469 |
9,080 |
31,549 |
63,118 |
| Read & Write |
7,894 |
8,677 |
16,571 |
21,710 |
11,409 |
33,119 |
49,690 |
| Primary |
18,551 |
13,109 |
31,660 |
15,394 |
4,910 |
20,304 |
51,964 |
| Preparatory |
27,409 |
22,067 |
49,476 |
18,891 |
6,365 |
25,256 |
74,732 |
| Above Preparatory |
3,630 |
2,625 |
6,255 |
5,737 |
1,744 |
7,481 |
13,736 |
| Secondary |
43,232 |
42,177 |
85,409 |
26,558 |
11,965 |
38,523 |
123,932 |
| Above Secondary / Diploma |
5,550 |
6,199 |
11,749 |
5,299 |
3,644 |
8,943 |
20,692 |
| B.Sc./ B.A. |
8,049 |
8,620 |
16,669 |
9,255 |
5,836 |
15,091 |
31,760 |
| High Diploma |
2,891 |
2,363 |
5,254 |
2,586 |
1,520 |
4,106 |
9,360 |
| Master’s Degree |
1,582 |
575 |
2,157 |
1,905 |
946 |
2,851 |
5,008 |
| Doctorate Degree |
490 |
190 |
680 |
407 |
131 |
538 |
1,218 |
| Not Stated |
9 |
3 |
12 |
21,731 |
2,282 |
24,013 |
24,025 |
| Total |
128,971 |
128,490 |
257,461 |
151,942 |
59,832 |
211,774 |
469,235 |
Source: Central Informatics Organisation (CIO) – Bahrain
ANNEXED NOTE
1. Technical Notes and Definitions
Reference period for Census 2001 is April 7th 2001
Population of reference: all individuals (nationals and non-nationals) present within Bahrain’s borders during time of reference, be they permanent or temporary residents.
Nationality is the person’s passport country. A Non-Bahrainis is considered as such depending on the passport used to enter the country (or obtain the visa).
Primary education comprises a total of six grades (1-6) and is generally the beginning of systematic apprenticeship of reading, writing mathematics and other subjects
Preparatory education comprises a total of three grades (7-9)
Secondary education comprises of the last three grades of the schooling system (10-12) prior to graduation
2. Institution which provides data
Central Informatics Organization, known prior to 2001 as the “Central Statistics Organisation” under the Ministry of Cabinet Affairs
3. Data availability
This data is available on the Central Informatics Organisation (CIO) website. For the Arabic version: (http://www.cio.gov.bh/cio_ara/default.aspx). For the English version: (http://www.cio.gov.bh/CIO_ENG/Default.aspx)
For the 2001 census data: (http://www.cio.gov.bh/cio_ara/English/Publications/Statistical%20Abstract/ABS2008/Ch2/19B.pdf)
Data of access: June 2014
|
Bahraini |
Non-Bahraini |
Total |
|
males |
females |
total |
males |
females |
total |
| Illiterate / Read Only |
12,707 |
27,438 |
40,145 |
11,491 |
3,666 |
15,157 |
55,302 |
| Read & Write |
10,815 |
9,975 |
20,790 |
27,677 |
7,495 |
35,172 |
55,962 |
| Primary |
15,003 |
10,547 |
25,550 |
19,968 |
3,719 |
23,687 |
49,237 |
| Preparatory |
18,697 |
15,515 |
34,212 |
14,148 |
4,484 |
18,632 |
52,844 |
| Above Preparatory |
1,996 |
1,370 |
3,366 |
4,777 |
1,359 |
6,136 |
9,502 |
| Secondary |
26,124 |
22,330 |
48,454 |
21,207 |
8,923 |
30,130 |
78,584 |
| Above Secondary / Diploma |
3,627 |
3,275 |
6,902 |
4,856 |
3,763 |
8,619 |
15,521 |
| B.Sc./ B.A. |
4,669 |
3,735 |
8,404 |
8,020 |
4,852 |
12,872 |
21,276 |
| High Diploma |
1,148 |
802 |
1,950 |
1,725 |
765 |
2,490 |
4,440 |
| Master’s Degree |
641 |
189 |
830 |
1,215 |
499 |
1,714 |
2,544 |
| Doctorate Degree |
224 |
55 |
279 |
353 |
82 |
435 |
714 |
| Not Stated |
115 |
223 |
338 |
577 |
344 |
921 |
1,259 |
| Total |
95,766 |
95,454 |
191,220 |
116,014 |
39,951 |
155,965 |
347,185 |
Source: Central Informatics Organisation (CIO) – Bahrain
ANNEXED NOTE
1. Technical Notes and Definitions
Reference period for Census 1991 is unknown
Population of reference: all individuals (nationals and non-nationals) present within Bahrain’s borders during time of reference, be they permanent or temporary residents.
Nationality is the person’s passport country. A Non-Bahrainis is considered as such depending on the passport used to enter the country (or obtain the visa).
Primary education comprises a total of six grades (1-6) and is generally the beginning of systematic apprenticeship of reading, writing mathematics and other subjects
Preparatory education comprises a total of three grades (7-9)
Secondary education comprises of the last three grades of the schooling system (10-12) prior to graduation
2. Institution which provides data
Central Informatics Organization, known prior to 2001 as the “Central Statistics Organisation” under the Ministry of Cabinet Affairs
3. Data availability
This data is available on the Central Informatics Organisation (CIO) website. For the Arabic version: (http://www.cio.gov.bh/cio_ara/default.aspx). For the English version: (http://www.cio.gov.bh/CIO_ENG/Default.aspx)
For the 1991 census data: (http://www.cio.gov.bh/cio_ara/English/Publications/Statistical%20Abstract/ABS2008/Ch2/19A.pdf)
Data of access: June 2014
|
|
Bahrainis |
Non Bahrainis |
|
|
Never Married |
Married |
Divorced |
Widowed |
Total |
Never Married |
Married |
Divorced |
Widowed |
Total |
| 15 – 19 |
males |
22,669 |
57 |
3 |
0 |
22,729 |
3,576 |
26 |
1 |
0 |
3,603 |
| females |
20,762 |
728 |
19 |
2 |
21,511 |
2,864 |
287 |
1 |
0 |
3,152 |
| total |
43,431 |
785 |
22 |
2 |
44,240 |
6,440 |
313 |
2 |
0 |
6,755 |
| 20 – 24 |
males |
17,604 |
2,012 |
63 |
2 |
19,681 |
10,218 |
2,254 |
8 |
2 |
12,482 |
| females |
12,318 |
6,125 |
220 |
14 |
18,677 |
4,935 |
2,847 |
38 |
15 |
7,835 |
| total |
29,922 |
8,137 |
283 |
16 |
38,358 |
15,153 |
5,101 |
46 |
17 |
20,317 |
| 25 – 29 |
males |
8,245 |
6,836 |
216 |
6 |
15,303 |
18,383 |
9,126 |
12 |
5 |
27,526 |
| females |
4,644 |
9,919 |
366 |
28 |
14,957 |
4,977 |
6,456 |
99 |
57 |
11,589 |
| total |
12,889 |
16,755 |
582 |
34 |
30,260 |
23,360 |
15,582 |
111 |
62 |
39,115 |
| 30 – 34 |
males |
3,314 |
10,344 |
274 |
10 |
13,942 |
13,774 |
16,999 |
45 |
5 |
30,823 |
| females |
2,875 |
11,278 |
412 |
70 |
14,635 |
4,261 |
8,350 |
145 |
133 |
12,889 |
| total |
6,189 |
21,622 |
686 |
80 |
28,577 |
18,035 |
25,349 |
190 |
138 |
43,712 |
| 35 – 39 |
males |
1,729 |
12,018 |
283 |
9 |
14,039 |
6,718 |
19,112 |
38 |
14 |
25,882 |
| females |
2,070 |
12,482 |
556 |
190 |
15,298 |
2,345 |
7,573 |
140 |
138 |
10,196 |
| total |
3,799 |
24,500 |
839 |
199 |
29,337 |
9,063 |
26,685 |
178 |
152 |
36,078 |
| 40 – 44 |
males |
960 |
10,626 |
219 |
11 |
11,816 |
3,746 |
19,805 |
49 |
19 |
23,619 |
| females |
1,182 |
10,781 |
566 |
407 |
12,936 |
1,084 |
5,532 |
129 |
142 |
6,887 |
| total |
2,142 |
21,407 |
785 |
418 |
24,752 |
4,830 |
25,337 |
178 |
161 |
30,506 |
| 45 – 49 |
males |
531 |
8,736 |
200 |
22 |
9,489 |
1,551 |
13,920 |
36 |
15 |
15,522 |
| females |
684 |
7,281 |
418 |
510 |
8,893 |
437 |
3,229 |
77 |
130 |
3,873 |
| total |
1,215 |
16,017 |
618 |
532 |
18,382 |
1,988 |
17,149 |
113 |
145 |
19,395 |
| 50 + |
males |
782 |
20,006 |
611 |
573 |
21,972 |
862 |
11,467 |
73 |
83 |
12,485 |
| females |
471 |
13,311 |
1,008 |
6,793 |
21,583 |
241 |
2,670 |
67 |
433 |
3,411 |
| total |
1,253 |
33,317 |
1,619 |
7,366 |
43,555 |
1,103 |
14,137 |
140 |
516 |
15,896 |
| |
males |
55,834 |
70,635 |
1,869 |
633 |
128,971 |
58,828 |
92,709 |
262 |
143 |
151,942 |
| Total |
females |
45,006 |
71,905 |
3,565 |
8,014 |
128,490 |
21,144 |
36,944 |
696 |
1,048 |
59,832 |
| |
total |
100,840 |
142,540 |
5,434 |
8,647 |
257,461 |
79,972 |
129,653 |
958 |
1,191 |
211,774 |
Source: Central Informatics Organisation (CIO) – Bahrain
ANNEXED NOTE
1. Technical Notes and Definitions
Reference period for Census 2001 is April 7th 2001.
Population of reference: all individuals (nationals and non-nationals) present within Bahrain’s borders during time of reference, be they permanent or temporary residents.
Nationality is the person’s passport country. A Non-Bahrainis is considered as such depending on the passport used to enter the country (or obtain the visa).
Marital Status refers to the personal status with regard to marriage/divorce laws and customs.
Never married refers to to a person who has never been in marital life before or a person who has a civil contract but is not living with a partner.
Married refers to a person who is legally married with respect to marriage laws and customs.
Divorced refers to an ever married person but not currently married, whose marriage was dissolved by divorce.
Widowed refers to an ever married person but not currently married, whose marriage has been dissolved by the death of the spouse.
2. Institution which provides data
Central Informatics Organization, known prior to 2001 as the “Central Statistics Organisation” under the Ministry of Cabinet Affairs
3. Data availability
This data is available on the Central Informatics Organisation (CIO) website. For the Arabic version: (http://www.cio.gov.bh/cio_ara/default.aspx). For the English version: (http://www.cio.gov.bh/CIO_ENG/Default.aspx)
For the 2001 census data: (http://www.cio.gov.bh/cio_ara/English/Publications/Statistical%20Abstract/ABS2008/Ch2/17B.pdf)
Data of access: June 2014
|
|
Bahrainis |
Non Bahrainis |
|
|
Never Married |
Married |
Divorced |
Widowed |
Total |
Never Married |
Married |
Divorced |
Widowed |
Total |
| 15 – 19 |
males |
16,383 |
42 |
2 |
0 |
16,427 |
2,191 |
43 |
0 |
0 |
2,234 |
|
females |
15,070 |
864 |
23 |
1 |
15,958 |
1,756 |
310 |
3 |
1 |
2,070 |
| |
total |
31,453 |
906 |
25 |
1 |
32,385 |
3,947 |
353 |
3 |
1 |
4,304 |
| 20 – 24 |
males |
13,212 |
1,621 |
27 |
2 |
14,862 |
8,464 |
1,532 |
4 |
2 |
10,002 |
|
females |
8,690 |
5,911 |
90 |
14 |
14,705 |
3,605 |
2,459 |
33 |
19 |
6,116 |
| |
total |
21,902 |
7,532 |
117 |
16 |
29,567 |
12,069 |
3,991 |
37 |
21 |
16,118 |
| 25 – 29 |
males |
6,941 |
7,494 |
103 |
12 |
14,550 |
13,510 |
9,299 |
19 |
8 |
22,836 |
|
females |
4,162 |
10,613 |
272 |
66 |
15,113 |
3,477 |
5,754 |
87 |
81 |
9,399 |
| |
total |
11,103 |
18,107 |
375 |
78 |
29,663 |
16,987 |
15,053 |
106 |
89 |
32,235 |
| 30 – 34 |
males |
2,462 |
9,350 |
115 |
13 |
11,940 |
8,592 |
21,568 |
33 |
18 |
30,211 |
|
females |
1,879 |
10,630 |
357 |
150 |
13,016 |
2,367 |
6,639 |
130 |
132 |
9,268 |
| |
total |
4,341 |
19,980 |
472 |
163 |
24,956 |
10,959 |
28,207 |
163 |
150 |
39,479 |
| 35 – 39 |
males |
988 |
8,698 |
133 |
17 |
9,836 |
2,816 |
20,708 |
44 |
12 |
23,580 |
|
females |
858 |
7,837 |
274 |
267 |
9,236 |
959 |
5,113 |
117 |
137 |
6,326 |
| |
total |
1,846 |
16,535 |
407 |
284 |
19,072 |
3,775 |
25,821 |
161 |
149 |
29,906 |
| 40 – 44 |
males |
412 |
6,343 |
109 |
16 |
6,880 |
1,059 |
12,606 |
33 |
14 |
13,712 |
|
females |
309 |
4,882 |
211 |
356 |
5,758 |
399 |
2,812 |
61 |
110 |
3,382 |
| |
total |
721 |
11,225 |
320 |
372 |
12,638 |
1,458 |
15,418 |
94 |
124 |
17,094 |
| 45 – 49 |
males |
247 |
3,907 |
62 |
26 |
4,242 |
477 |
6,348 |
27 |
13 |
6,865 |
|
females |
111 |
3,979 |
178 |
511 |
4,779 |
130 |
1,310 |
32 |
82 |
1,554 |
| |
total |
358 |
7,886 |
240 |
537 |
9,021 |
607 |
7,658 |
59 |
95 |
8,419 |
| 50 + |
males |
607 |
15,265 |
368 |
787 |
17,027 |
396 |
5,997 |
64 |
117 |
6,574 |
|
females |
240 |
9,558 |
597 |
6,494 |
16,889 |
94 |
1,304 |
47 |
391 |
1,836 |
| |
total |
847 |
24,823 |
965 |
7,281 |
33,916 |
490 |
7,301 |
111 |
508 |
8,410 |
| Not Stated |
males |
0 |
2 |
0 |
0 |
2 |
0 |
0 |
0 |
0 |
0 |
|
females |
0 |
0 |
0 |
0 |
0 |
0 |
0 |
0 |
0 |
0 |
| |
total |
0 |
2 |
0 |
0 |
2 |
0 |
0 |
0 |
0 |
0 |
| |
males |
41,252 |
52,722 |
919 |
873 |
95,766 |
37,505 |
78,101 |
224 |
184 |
116,014 |
| Total |
females |
31,319 |
54,274 |
2,002 |
7,859 |
95,454 |
12,787 |
25,701 |
510 |
953 |
39,951 |
| |
total |
72,571 |
106,996 |
2,921 |
8,732 |
191,220 |
50,292 |
103,802 |
734 |
1,137 |
155,965 |
Source: Central Informatics Organisation (CIO) – Bahrain
ANNEXED NOTE
1. Technical Notes and Definitions
Reference period for Census 1991 is unknown.
Population of reference: all individuals (nationals and non-nationals) present within Bahrain’s borders during time of reference, be they permanent or temporary residents.
Nationality is the person’s passport country. A Non-Bahrainis is considered as such depending on the passport used to enter the country (or obtain the visa).
Marital Status refers to the personal status with regard to marriage/divorce laws and customs.
Never married refers to to a person who has never been in marital life before or a person who has a civil contract but is not living with a partner.
Married refers to a person who is legally married with respect to marriage laws and customs.
Divorced refers to an ever married person but not currently married, whose marriage was dissolved by divorce.
Widowed refers to an ever married person but not currently married, whose marriage has been dissolved by the death of the spouse.
2. Institution which provides data
Central Informatics Organization, known prior to 2001 as the “Central Statistics Organisation” under the Ministry of Cabinet Affairs
3. Data availability
This data is available on the Central Informatics Organisation (CIO) website. For the Arabic version: (http://www.cio.gov.bh/cio_ara/default.aspx). For the English version: (http://www.cio.gov.bh/CIO_ENG/Default.aspx)
For the 1991 census data: (http://www.cio.gov.bh/cio_ara/English/Publications/Statistical%20Abstract/ABS2008/Ch2/17A.pdf)
Data of access: June 2014
|
Bahrainis |
non-Bahrainis |
|
Never Married |
Married |
Divorced |
Widowed |
Total |
Never Married |
Married |
Divorced |
Widowed |
Total |
|
males |
females |
males |
females |
males |
females |
males |
females |
males |
females |
males |
females |
males |
females |
males |
females |
males |
females |
males |
females |
| Illiterate / Read Only |
1,045 |
1,148 |
7,987 |
13,908 |
288 |
832 |
364 |
5,997 |
9,684 |
21,885 |
8,436 |
3,252 |
13,958 |
5,277 |
29 |
154 |
46 |
397 |
22,469 |
9,080 |
| Read & Write |
1,687 |
1,067 |
5,889 |
6,332 |
212 |
372 |
106 |
906 |
7,894 |
8,677 |
9,266 |
5,891 |
12,402 |
5,102 |
26 |
168 |
16 |
248 |
21,710 |
11,409 |
| Primary |
9,517 |
5,306 |
8,746 |
6,986 |
240 |
381 |
48 |
436 |
18,551 |
13,109 |
6,081 |
2,045 |
9,292 |
2,722 |
12 |
56 |
9 |
87 |
15,394 |
4,910 |
| Preparatory |
17,460 |
13,708 |
9,649 |
7,677 |
273 |
463 |
27 |
219 |
27,409 |
22,067 |
9,290 |
2,979 |
9,564 |
3,245 |
26 |
49 |
11 |
92 |
18,891 |
6,365 |
| Above Preparatory |
1,992 |
1,445 |
1,590 |
1,086 |
39 |
62 |
9 |
32 |
3,630 |
2,625 |
2,156 |
517 |
3,570 |
1,190 |
5 |
17 |
6 |
20 |
5,737 |
1,744 |
| Secondary |
19,657 |
17,336 |
22,964 |
23,607 |
565 |
953 |
46 |
281 |
43,232 |
42,177 |
9,504 |
3,496 |
16,978 |
8,223 |
50 |
126 |
26 |
120 |
26,558 |
11,965 |
| Above Secondary / Diploma |
1,780 |
2,081 |
3,695 |
3,911 |
65 |
165 |
10 |
42 |
5,550 |
6,199 |
1,436 |
889 |
3,839 |
2,690 |
20 |
43 |
4 |
22 |
5,299 |
3,644 |
| B.Sc./ B.A. |
2,029 |
2,239 |
5,895 |
6,085 |
112 |
225 |
13 |
71 |
8,049 |
8,620 |
1,679 |
854 |
7,535 |
4,909 |
31 |
43 |
10 |
30 |
9,255 |
5,836 |
| High Diploma |
461 |
466 |
2,389 |
1,792 |
35 |
81 |
6 |
24 |
2,891 |
2,363 |
435 |
253 |
2,131 |
1,243 |
16 |
13 |
4 |
11 |
2,586 |
1,520 |
| Master’s Degree |
169 |
152 |
1,380 |
397 |
29 |
21 |
4 |
5 |
1,582 |
575 |
183 |
75 |
1,702 |
853 |
16 |
10 |
4 |
8 |
1,905 |
946 |
| Doctorate Degree |
32 |
57 |
447 |
122 |
11 |
10 |
0 |
1 |
490 |
190 |
16 |
10 |
386 |
118 |
3 |
3 |
2 |
0 |
407 |
131 |
| Not Stated |
5 |
1 |
4 |
2 |
0 |
0 |
0 |
0 |
9 |
3 |
10,346 |
883 |
11,352 |
1,372 |
28 |
14 |
5 |
13 |
21,731 |
2,282 |
| Total |
55,834 |
45,006 |
70,635 |
71,905 |
1,869 |
3,565 |
633 |
8,014 |
128,971 |
128,490 |
58,828 |
21,144 |
92,709 |
36,944 |
262 |
696 |
143 |
1,048 |
151,942 |
59,832 |
Source: Central Informatics Organisation (CIO) – Bahrain
ANNEXED NOTE
1. Technical Notes and Definitions
The table provides data for population present in Bahrain at date of 2001′ census by nationality (Bahraini and non-Bahraini), sex, marital status and highest educational level.
Reference period for Census 2001 is April 7th, 2001
Population of reference: all individuals (nationals and non-nationals) present within Bahrain’s borders during time of reference, be they permanent or temporary residents.
Nationality is the person’s passport country. A Non-Bahrainis is considered as such depending on the passport used to enter the country (or obtain the visa).
Primary education comprises a total of six grades (1-6) and is generally the beginning of systematic apprenticeship of reading, writing mathematics and other subjects
Preparatory education comprises a total of three grades (7-9)
Secondary education comprises of the last three grades of the schooling system (10-12) prior to graduation
2. Institution which provides data
Central Informatics Organization, known prior to 2001 as the “Central Statistics Organisation” under the Ministry of Cabinet Affairs
3. Data availability
This data is available on the Central Informatics Organisation (CIO) website. For the Arabic version: (http://www.cio.gov.bh/cio_ara/default.aspx). For the English version: (http://www.cio.gov.bh/CIO_ENG/Default.aspx)
For the 2001 census data: (http://www.cio.gov.bh/cio_ara/English/Publications/Statistical%20Abstract/ABS2008/Ch2/19B.pdf)
Data of access: June 2014
|
Bahrainis |
|
|
|
|
|
|
|
|
|
non-Bahrainis |
|
|
|
|
|
|
|
|
|
|
Never Married |
|
Married |
|
Divorced |
|
Widowed |
|
Total |
|
Never Married |
|
Married |
|
Divorced |
|
Widowed |
|
Total |
|
|
males |
females |
males |
females |
males |
females |
males |
females |
males |
females |
males |
females |
males |
females |
males |
females |
males |
females |
males |
females |
| Illiterate / Read Only |
1,082 |
1,431 |
10,785 |
18,597 |
246 |
752 |
594 |
6,658 |
12,707 |
27,438 |
3,374 |
798 |
8,017 |
2,510 |
44 |
69 |
56 |
289 |
11,491 |
3,666 |
| Read & Write |
2,651 |
1,672 |
7,843 |
7,304 |
181 |
334 |
140 |
665 |
10,815 |
9,975 |
9,219 |
2,943 |
18,393 |
4,148 |
29 |
133 |
36 |
271 |
27,677 |
7,495 |
| Primary |
7,070 |
4,611 |
7,747 |
5,497 |
139 |
243 |
47 |
196 |
15,003 |
10,547 |
6,775 |
1,467 |
13,166 |
2,101 |
13 |
48 |
14 |
103 |
19,968 |
3,719 |
| Preparatory |
12,355 |
10,229 |
6,205 |
4,986 |
112 |
197 |
25 |
103 |
18,697 |
15,515 |
5,497 |
1,835 |
8,620 |
2,511 |
18 |
59 |
13 |
79 |
14,148 |
4,484 |
| Above Preparatory |
1,101 |
487 |
868 |
842 |
23 |
28 |
4 |
13 |
1,996 |
1,370 |
1,787 |
464 |
2,984 |
871 |
3 |
11 |
3 |
13 |
4,777 |
1,359 |
| Secondary |
14,197 |
10,285 |
11,748 |
11,634 |
139 |
306 |
40 |
105 |
26,124 |
22,330 |
7,432 |
2,871 |
13,723 |
5,818 |
31 |
106 |
21 |
128 |
21,207 |
8,923 |
| Above Secondary / Diploma |
1,045 |
1,043 |
2,556 |
2,154 |
22 |
60 |
4 |
18 |
3,627 |
3,275 |
1,249 |
1,031 |
3,574 |
2,681 |
26 |
29 |
7 |
22 |
4,856 |
3,763 |
| B.Sc./ B.A. |
1,376 |
1,242 |
3,249 |
2,426 |
38 |
48 |
6 |
19 |
4,669 |
3,735 |
1,516 |
994 |
6,453 |
3,793 |
29 |
37 |
22 |
28 |
8,020 |
4,852 |
| High Diploma |
195 |
206 |
945 |
574 |
8 |
15 |
0 |
7 |
1,148 |
802 |
247 |
161 |
1,460 |
591 |
14 |
7 |
4 |
6 |
1,725 |
765 |
| Master’s Degree |
128 |
65 |
509 |
117 |
3 |
5 |
1 |
2 |
641 |
189 |
170 |
40 |
1,030 |
451 |
11 |
5 |
4 |
3 |
1,215 |
499 |
| Doctorate Degree |
28 |
16 |
191 |
35 |
5 |
3 |
0 |
1 |
224 |
55 |
12 |
6 |
335 |
73 |
5 |
1 |
1 |
2 |
353 |
82 |
| Not Stated |
24 |
32 |
76 |
108 |
3 |
11 |
12 |
72 |
115 |
223 |
227 |
177 |
346 |
153 |
1 |
5 |
3 |
9 |
577 |
344 |
| Total |
41,252 |
31,319 |
52,722 |
54,274 |
919 |
2,002 |
873 |
7,859 |
95,766 |
95,454 |
37,505 |
12,787 |
78,101 |
25,701 |
224 |
510 |
184 |
953 |
116,014 |
39,951 |
Source: Central Informatics Organisation (CIO) – Bahrain
ANNEXED NOTE
1. Technical Notes and Definitions
The table provides data for population present in Bahrain at date of 1991′ census, by nationality (Bahraini and non-Bahraini), sex, marital status and highest educational level.
Reference period for Census 1991: unknown
Population of reference: all individuals (nationals and non-nationals) present within Bahrain’s borders during time of reference, be they permanent or temporary residents.
Nationality is the person’s passport country. A Non-Bahrainis is considered as such depending on the passport used to enter the country (or obtain the visa).
Primary education comprises a total of six grades (1-6) and is generally the beginning of systematic apprenticeship of reading, writing mathematics and other subjects
Preparatory education comprises a total of three grades (7-9)
Secondary education comprises of the last three grades of the schooling system (10-12) prior to graduation
2. Institution which provides data
Central Informatics Organization, known prior to 2001 as the “Central Statistics Organisation” under the Ministry of Cabinet Affairs
3. Data availability
This data is available on the Central Informatics Organisation (CIO) website. For the Arabic version: (http://www.cio.gov.bh/cio_ara/default.aspx). For the English version: (http://www.cio.gov.bh/CIO_ENG/Default.aspx)
For the 1991 census data: (http://www.cio.gov.bh/cio_ara/English/Publications/Statistical%20Abstract/ABS2008/Ch2/19A.pdf)
Data of access: June 2014
|
Bahrainis |
|
|
Non-Bahrainis |
|
|
Total |
|
|
|
males |
females |
total |
males |
females |
total |
males |
females |
total |
| Never married |
55,834 |
45,006 |
100,840 |
58,828 |
21,144 |
79,972 |
114,662 |
66,150 |
180,812 |
| Married |
70,635 |
71,905 |
142,540 |
92,709 |
36,944 |
129,653 |
163,344 |
108,849 |
272,193 |
| Divorced |
1,869 |
3,565 |
5,434 |
262 |
696 |
958 |
2,131 |
4,261 |
6,392 |
| Widowed |
633 |
8,014 |
8,647 |
143 |
1,048 |
1,191 |
776 |
9,062 |
9,838 |
| Total |
128,971 |
128,490 |
257,461 |
151,942 |
59,832 |
211,774 |
280,913 |
188,322 |
469,235 |
Source: Central Informatics Organisation (CIO) – Bahrain
ANNEXED NOTE
1. Technical Notes and Definitions
The table provides data for Bahrain’s resident population by nationality (Bahraini and non-Bahraini) by sex and marital status at date of 2001′ census.
Reference period for Census 2001 is April 7th, 2001
Population of reference: all individuals (nationals and non-nationals) present within Bahrain’s borders during time of reference, be they permanent or temporary residents.
Nationality is the person’s passport country. A Non-Bahrainis is considered as such depending on the passport used to enter the country (or obtain the visa).
Marital Status refers to the personal status with regard to marriage/divorce laws and customs.
Never married refers to to a person who has never been in marital life before or a person who has a civil contract but is not living with a partner.
Married refers to a person who is legally married with respect to marriage laws and customs.
Divorced refers to an ever married person but not currently married, whose marriage was dissolved by divorce.
Widowed refers to an ever married person but not currently married, whose marriage has been dissolved by the death of the spouse.
2. Institution which provides data
Central Informatics Organization, known prior to 2001 as the “Central Statistics Organisation” under the Ministry of Cabinet Affairs
3. Data availability
This data is available on the Central Informatics Organisation (CIO) website. For the Arabic version: (http://www.cio.gov.bh/cio_ara/default.aspx). For the English version: (http://www.cio.gov.bh/CIO_ENG/Default.aspx)
For the 2001 estimates: (http://www.cio.gov.bh/cio_ara/English/Publications/Statistical%20Abstract/ABS2008/Ch2/17B.pdf)
|
Bahrainis |
|
|
Non-Bahrainis |
|
|
Total |
|
|
|
males |
females |
total |
males |
females |
total |
males |
females |
total |
| Never married |
41,252 |
31,319 |
72,571 |
37,505 |
12,787 |
50,292 |
78,757 |
44,106 |
122,863 |
| Married |
52,722 |
54,274 |
106,996 |
78,101 |
25,701 |
103,802 |
130,823 |
79,975 |
210,798 |
| Divorced |
919 |
2,002 |
2,921 |
224 |
510 |
734 |
1,143 |
2,512 |
3,655 |
| Widowed |
873 |
7,859 |
8,732 |
184 |
953 |
1,137 |
1,057 |
8,812 |
9,869 |
| Total |
95,766 |
95,454 |
191,220 |
116,014 |
39,951 |
155,965 |
211,780 |
135,405 |
347,185 |
Source: Central Informatics Organisation (CIO) – Bahrain
ANNEXED NOTE
1. Technical Notes and Definitions
The table provides data for population present in Bahrain at date of 1991′ census, by nationality (Bahraini and non-Bahraini), sex and marital status.
Reference period for Census 1991: unknown .
Population of reference: all individuals (nationals and non-nationals) present within Bahrain’s borders during time of reference, be they permanent or temporary residents.
Nationality is the person’s passport country. A Non-Bahrainis is considered as such depending on the passport used to enter the country (or obtain the visa).
Marital Status refers to the personal status with regard to marriage/divorce laws and customs.
Never married refers to to a person who has never been in marital life before or a person who has a civil contract but is not living with a partner.
Married refers to a person who is legally married with respect to marriage laws and customs.
Divorced refers to an ever married person but not currently married, whose marriage was dissolved by divorce.
Widowed refers to an ever married person but not currently married, whose marriage has been dissolved by the death of the spouse.
2. Institution which provides data
Central Informatics Organization, known prior to 2001 as the “Central Statistics Organisation” under the Ministry of Cabinet Affairs
3. Data availability
This data is available on the Central Informatics Organisation (CIO) website. For the Arabic version: (http://www.cio.gov.bh/cio_ara/default.aspx). For the English version: (http://www.cio.gov.bh/CIO_ENG/Default.aspx)
For the 1991 census data: (http://www.cio.gov.bh/cio_ara/English/Publications/Statistical%20Abstract/ABS2008/Ch2/17A.pdf)
Data of access: June 2014
| age groups |
Bahrainis |
Non-Bahrainis |
Total |
| GCC |
Other Arabs |
Asian |
African |
European |
North American |
South American |
Oceanian |
Total Non-Bahrainis |
| males |
females |
total |
males |
females |
total |
males |
females |
total |
males |
females |
total |
males |
females |
total |
males |
females |
total |
males |
females |
total |
males |
females |
total |
males |
females |
total |
| 0 – 4 |
32,477 |
31,261 |
63,738 |
60 |
56 |
116 |
4,078 |
3,890 |
7,968 |
7,800 |
7,829 |
15,629 |
79 |
61 |
140 |
468 |
427 |
895 |
204 |
196 |
400 |
21 |
15 |
36 |
50 |
48 |
98 |
25,282 |
89,020 |
| 5 – 9 |
30,277 |
28,735 |
59,012 |
168 |
165 |
333 |
3,666 |
3,402 |
7,068 |
7,657 |
7,307 |
14,964 |
75 |
62 |
137 |
465 |
414 |
879 |
197 |
210 |
407 |
7 |
15 |
22 |
53 |
50 |
103 |
23,913 |
82,925 |
| 10 – 14 |
29,842 |
28,342 |
58,184 |
260 |
270 |
530 |
2,309 |
2,040 |
4,349 |
5,833 |
5,541 |
11,374 |
70 |
51 |
121 |
360 |
304 |
664 |
159 |
166 |
325 |
11 |
15 |
26 |
47 |
38 |
85 |
17,474 |
75,658 |
| 15 – 19 |
30,522 |
29,135 |
59,657 |
362 |
470 |
832 |
1,606 |
1,512 |
3,118 |
4,400 |
3,831 |
8,231 |
52 |
63 |
115 |
236 |
229 |
465 |
102 |
104 |
206 |
9 |
12 |
21 |
33 |
35 |
68 |
13,056 |
72,713 |
| 20 – 24 |
28,259 |
26,617 |
54,876 |
588 |
751 |
1,339 |
2,128 |
2,394 |
4,522 |
35,002 |
10,289 |
45,291 |
138 |
5,592 |
5,730 |
144 |
264 |
408 |
81 |
96 |
177 |
19 |
8 |
27 |
10 |
22 |
32 |
57,526 |
112,402 |
| 25 – 29 |
24,671 |
23,488 |
48,159 |
528 |
625 |
1,153 |
3,431 |
3,745 |
7,176 |
97,339 |
19,601 |
116,940 |
326 |
7,117 |
7,443 |
365 |
583 |
948 |
118 |
166 |
284 |
25 |
28 |
53 |
26 |
50 |
76 |
134,073 |
182,232 |
| 30 – 34 |
21,096 |
20,978 |
42,074 |
394 |
520 |
914 |
4,422 |
3,409 |
7,831 |
84,431 |
21,203 |
105,634 |
287 |
3,044 |
3,331 |
478 |
653 |
1,131 |
171 |
169 |
340 |
34 |
41 |
75 |
55 |
63 |
118 |
119,374 |
161,448 |
| 35 – 39 |
16,561 |
17,326 |
33,887 |
443 |
383 |
826 |
3,912 |
2,269 |
6,181 |
68,554 |
18,982 |
87,536 |
180 |
1,240 |
1,420 |
691 |
676 |
1,367 |
154 |
155 |
309 |
40 |
34 |
74 |
60 |
69 |
129 |
97,842 |
131,729 |
| 40 – 44 |
16,048 |
17,283 |
33,331 |
446 |
380 |
826 |
2,786 |
1,393 |
4,179 |
50,999 |
14,539 |
65,538 |
131 |
426 |
557 |
678 |
558 |
1,236 |
205 |
159 |
364 |
16 |
22 |
38 |
68 |
59 |
127 |
72,865 |
106,196 |
| 45 – 49 |
15,839 |
17,122 |
32,961 |
290 |
310 |
600 |
1,586 |
817 |
2,403 |
33,447 |
10,068 |
43,515 |
108 |
152 |
260 |
675 |
461 |
1,136 |
255 |
150 |
405 |
23 |
21 |
44 |
80 |
67 |
147 |
48,510 |
81,471 |
| 50 – 54 |
13,324 |
14,164 |
27,488 |
256 |
244 |
500 |
1,085 |
478 |
1,563 |
23,960 |
5,430 |
29,390 |
58 |
86 |
144 |
600 |
390 |
990 |
212 |
127 |
339 |
14 |
9 |
23 |
82 |
56 |
138 |
33,087 |
60,575 |
| 55 – 59 |
10,504 |
8,894 |
19,398 |
178 |
116 |
294 |
653 |
248 |
901 |
10,843 |
2,336 |
13,179 |
49 |
55 |
104 |
554 |
287 |
841 |
196 |
119 |
315 |
10 |
5 |
15 |
57 |
45 |
102 |
15,751 |
35,149 |
| 60 – 64 |
6,489 |
5,568 |
12,057 |
115 |
51 |
166 |
264 |
167 |
431 |
2,614 |
765 |
3,379 |
17 |
13 |
30 |
357 |
156 |
513 |
114 |
61 |
175 |
11 |
3 |
14 |
37 |
17 |
54 |
4,762 |
16,819 |
| 65 + |
11,330 |
12,247 |
23,577 |
195 |
66 |
261 |
223 |
300 |
523 |
877 |
563 |
1,440 |
6 |
10 |
16 |
193 |
97 |
290 |
69 |
34 |
103 |
1 |
5 |
6 |
11 |
7 |
18 |
2,657 |
26,234 |
| Total |
287,239 |
281,160 |
568,399 |
4,283 |
4,407 |
8,690 |
32,149 |
26,064 |
58,213 |
433,756 |
128,284 |
562,040 |
1,576 |
17,972 |
19,548 |
6,264 |
5,499 |
11,763 |
2,237 |
1,912 |
4,149 |
241 |
233 |
474 |
669 |
626 |
1,295 |
666,172 |
1,234,571 |
Source: Central Informatics Organisation (CIO) – Bahrain
ANNEXED NOTE
1. Technical Notes and Definitions
The table provides data for population present in Bahrain by nationality groups at date of 2010′ census.
Reference period for Census 2010 is April 27th, 2010
Population of reference: all Bahraini and non-Bahraini individuals present within Bahrain’s borders during time of reference, be they permanent or temporary residents.
Nationality is the person’s passport country. A Non-Bahrainis is considered as such depending on the passport used to enter the country (or obtain the visa)
Age is defined as the time span between the date of birth and the date of the census expressed in complete years
2. Institution which provides data
Central Informatics Organization
3. Data availability
This data is available on the Central Informatics Organisation (CIO) website. For the Arabic version: (http://www.cio.gov.bh/cio_ara/default.aspx). For the English version: (http://www.cio.gov.bh/CIO_ENG/Default.aspx)
The full 2010 census data can be found on both the CIO website and its separate website, found here: (http://www.census2010.gov.bh/index.php)
Some population data for census 2010 can be found in tables, in PDF format: (http://www.cio.gov.bh/CIO_ENG/SubDetailed.aspx?subcatid=586)
This census 2010 data can be found in a table, in PDF format: (http://www.cio.gov.bh/cio_ara/English/Publications/Census/Population/4.pdf)
Data of access: July 2014
|
Bahrainis |
Non-Bahrainis |
Total |
|
males |
females |
total |
males |
females |
total |
males |
females |
total |
| 0 – 4 |
32,477 |
31,261 |
63,738 |
12,760 |
12,522 |
25,282 |
45,237 |
43,783 |
89,020 |
| 5 – 9 |
30,277 |
28,735 |
59,012 |
12,288 |
11,625 |
23,913 |
42,565 |
40,360 |
82,925 |
| 10 – 14 |
29,842 |
28,342 |
58,184 |
9,049 |
8,425 |
17,474 |
38,891 |
36,767 |
75,658 |
| 15 – 19 |
30,522 |
29,135 |
59,657 |
6,800 |
6,256 |
13,056 |
37,322 |
35,391 |
72,713 |
| 20 – 24 |
28,259 |
26,617 |
54,876 |
38,110 |
19,416 |
57,526 |
66,369 |
46,033 |
112,402 |
| 25 – 29 |
24,671 |
23,488 |
48,159 |
102,158 |
31,915 |
134,073 |
126,829 |
55,403 |
182,232 |
| 30 – 34 |
21,096 |
20,978 |
42,074 |
90,272 |
29,102 |
119,374 |
111,368 |
50,080 |
161,448 |
| 35 – 39 |
16,561 |
17,326 |
33,887 |
74,034 |
23,808 |
97,842 |
90,595 |
41,134 |
131,729 |
| 40 – 44 |
16,048 |
17,283 |
33,331 |
55,329 |
17,536 |
72,865 |
71,377 |
34,819 |
106,196 |
| 45 – 49 |
15,839 |
17,122 |
32,961 |
36,464 |
12,046 |
48,510 |
52,303 |
29,168 |
81,471 |
| 50 – 54 |
13,324 |
14,164 |
27,488 |
26,267 |
6,820 |
33,087 |
39,591 |
20,984 |
60,575 |
| 55 – 59 |
10,504 |
8,894 |
19,398 |
12,540 |
3,211 |
15,751 |
23,044 |
12,105 |
35,149 |
| 60 – 64 |
6,489 |
5,568 |
12,057 |
3,529 |
1,233 |
4,762 |
10,018 |
6,801 |
16,819 |
| 65 – 69 |
4,062 |
4,228 |
8,290 |
878 |
458 |
1,336 |
4,940 |
4,686 |
9,626 |
| 70 – 74 |
3,322 |
3,731 |
7,053 |
364 |
302 |
666 |
3,686 |
4,033 |
7,719 |
| 75 + |
3,946 |
4,288 |
8,234 |
333 |
322 |
655 |
4,279 |
4,610 |
8,889 |
| Total |
287,239 |
281,160 |
568,399 |
481,175 |
184,997 |
666,172 |
768,414 |
466,157 |
1,234,571 |
Source: Central Informatics Organisation (CIO) – Bahrain
ANNEXED NOTE
1. Technical Notes and Definitions
The table provides population figures at the date of 2010′ census by sex and age groups
Reference period for Census 2010 is April 27th, 2010.
Population of reference: all individuals (nationals and non-nationals) present within Bahrain’s borders during time of reference, be they permanent or temporary residents.
Nationality of the person is defined by the passport used to enter the country. A Non-Bahrainis is considered as such depending on the passport used to enter the country (or obtain the visa)
Age is defined as the time span between the date of birth and the date of the census expressed in complete years
2. Institution which provides data
Central Informatics Organization, known prior to 2001 as the “Central Statistics Organisation” under the Ministry of Cabinet Affairs
3. Data availability
This data is available on the Central Informatics Organisation (CIO) website. For the Arabic version: (http://www.cio.gov.bh/cio_ara/default.aspx). For the English version: (http://www.cio.gov.bh/CIO_ENG/Default.aspx)
Most censuses will break down the population by nationality and sex, and are published in PDF format
For the 1981 census data: (http://www.cio.gov.bh/cio_ara/English/Publications/Statistical%20Abstract/ABS2008/Ch2/2A.pdf)
For 1991 census data: (http://www.cio.gov.bh/cio_ara/English/Publications/Statistical%20Abstract/ABS2008/Ch2/2B.pdf)
For the 2001 census data: (http://www.cio.gov.bh/cio_ara/English/Publications/Statistical%20Abstract/ABS2008/Ch2/2C.pdf)
For the 2010 census data: (http://www.cio.gov.bh/cio_ara/English/Publications/Census/Population/1.pdf)
The 1981 and 1991 data can be found in the Statistical Abstract 2000, Population section. The 2001 data can be found in the Statistical Abstract 2002, Population section.
http://www.cio.gov.bh/CIO_ENG/SubDetailed.aspx?subcatid=119
The full 2010 census data can be found on both the CIO website and its separate website, found here: (http://www.census2010.gov.bh/index.php)
Data of access: July 2014
|
Bahrainis |
Non-Bahrainis |
Total |
|
males |
females |
total |
males |
females |
total |
males |
females |
total |
| 0 – 4 |
24,705 |
23,616 |
48,321 |
6,249 |
5,815 |
12,064 |
30,954 |
29,431 |
60,385 |
| 5 – 9 |
25,666 |
25,059 |
50,725 |
5,802 |
5,623 |
11,425 |
31,468 |
30,682 |
62,150 |
| 10 – 14 |
25,281 |
23,879 |
49,160 |
5,033 |
4,641 |
9,674 |
30,314 |
28,520 |
58,834 |
| 15 – 19 |
22,729 |
21,511 |
44,240 |
3,603 |
3,152 |
6,755 |
26,332 |
24,663 |
50,995 |
| 20 – 24 |
19,681 |
18,677 |
38,358 |
12,482 |
7,835 |
20,317 |
32,163 |
26,512 |
58,675 |
| 25 – 29 |
15,303 |
14,957 |
30,260 |
27,526 |
11,589 |
39,115 |
42,829 |
26,546 |
69,375 |
| 30 – 34 |
13,942 |
14,635 |
28,577 |
30,823 |
12,889 |
43,712 |
44,765 |
27,524 |
72,289 |
| 35 – 39 |
14,039 |
15,298 |
29,337 |
25,882 |
10,196 |
36,078 |
39,921 |
25,494 |
65,415 |
| 40 – 44 |
11,816 |
12,936 |
24,752 |
23,619 |
6,887 |
30,506 |
35,435 |
19,823 |
55,258 |
| 45 – 49 |
9,489 |
8,893 |
18,382 |
15,522 |
3,873 |
19,395 |
25,011 |
12,766 |
37,777 |
| 50 – 54 |
6,573 |
5,468 |
12,041 |
7,521 |
1,769 |
9,290 |
14,094 |
7,237 |
21,331 |
| 55 – 59 |
4,198 |
4,358 |
8,556 |
2,939 |
761 |
3,700 |
7,137 |
5,119 |
12,256 |
| 60 – 64 |
3,822 |
4,172 |
7,994 |
1,115 |
392 |
1,507 |
4,937 |
4,564 |
9,501 |
| 65 – 69 |
2,705 |
3,027 |
5,732 |
448 |
221 |
669 |
3,153 |
3,248 |
6,401 |
| 70 – 74 |
2,220 |
2,259 |
4,479 |
276 |
124 |
400 |
2,496 |
2,383 |
4,879 |
| 75 + |
2,454 |
2,299 |
4,753 |
186 |
144 |
330 |
2,640 |
2,443 |
5,083 |
| Total |
204,623 |
201,044 |
405,667 |
169,026 |
75,911 |
244,937 |
373,649 |
276,955 |
650,604 |
Source: Central Informatics Organisation (CIO) – Bahrain
ANNEXED NOTE
1. Technical Notes and Definitions
The table provides population figures at the date of 2001′ census by sex and age groups
Reference period for Census 2001 is April 7th 2001
Population of reference: all individuals (nationals and non-nationals) present within Bahrain’s borders during time of reference, be they permanent or temporary residents.
Nationality of the person is defined by the passport used to enter the country. A Non-Bahrainis is considered as such depending on the passport used to enter the country (or obtain the visa)
Age is defined as the time span between the date of birth and the date of the census expressed in complete years
2. Institution which provides data
Central Informatics Organization
3. Data availability
This data is available on the Central Informatics Organisation (CIO) website. For the Arabic version: (http://www.cio.gov.bh/cio_ara/default.aspx). For the English version: (http://www.cio.gov.bh/CIO_ENG/Default.aspx)
Most censuses will break down the population by nationality and sex, and are published in PDF format
For the 1981 census data: (http://www.cio.gov.bh/cio_ara/English/Publications/Statistical%20Abstract/ABS2008/Ch2/2A.pdf)
For 1991 census data: (http://www.cio.gov.bh/cio_ara/English/Publications/Statistical%20Abstract/ABS2008/Ch2/2B.pdf)
For the 2001 census data: (http://www.cio.gov.bh/cio_ara/English/Publications/Statistical%20Abstract/ABS2008/Ch2/2C.pdf)
For the 2010 census data: (http://www.cio.gov.bh/cio_ara/English/Publications/Census/Population/1.pdf)
The 1981 and 1991 data can be found in the Statistical Abstract 2000, Population section. The 2001 data can be found in the Statistical Abstract 2002, Population section.
http://www.cio.gov.bh/CIO_ENG/SubDetailed.aspx?subcatid=119
The full 2010 census data can be found on both the CIO website and its separate website, found here: (http://www.census2010.gov.bh/index.php)
Data of access: July 2014
|
Bahrainis |
Non-Bahrainis |
Total |
|
males |
females |
total |
males |
females |
total |
males |
females |
total |
| 0 – 4 |
24,719 |
23,036 |
47,755 |
6,242 |
5,871 |
12,113 |
30,961 |
28,907 |
59,868 |
| 5 – 9 |
22,595 |
21,498 |
44,093 |
5,198 |
4,871 |
10,069 |
27,793 |
26,369 |
54,162 |
| 10 – 14 |
20,373 |
19,864 |
40,237 |
3,439 |
3,146 |
6,585 |
23,812 |
23,010 |
46,822 |
| 15 – 19 |
16,427 |
15,958 |
32,385 |
2,234 |
2,070 |
4,304 |
18,661 |
18,028 |
36,689 |
| 20 – 24 |
14,862 |
14,705 |
29,567 |
10,002 |
6,116 |
16,118 |
24,864 |
20,821 |
45,685 |
| 25 – 29 |
14,550 |
15,113 |
29,663 |
22,836 |
9,399 |
32,235 |
37,386 |
24,512 |
61,898 |
| 30 – 34 |
11,940 |
13,016 |
24,956 |
30,211 |
9,268 |
39,479 |
42,151 |
22,284 |
64,435 |
| 35 – 39 |
9,836 |
9,236 |
19,072 |
23,580 |
6,326 |
29,906 |
33,416 |
15,562 |
48,978 |
| 40 – 44 |
6,880 |
5,758 |
12,638 |
13,712 |
3,382 |
17,094 |
20,592 |
9,140 |
29,732 |
| 45 – 49 |
4,242 |
4,779 |
9,021 |
6,865 |
1,554 |
8,419 |
11,107 |
6,333 |
17,440 |
| 50 – 54 |
4,164 |
4,717 |
8,881 |
3,653 |
868 |
4,521 |
7,817 |
5,585 |
13,402 |
| 55 – 59 |
3,823 |
3,849 |
7,672 |
1,684 |
424 |
2,108 |
5,507 |
4,273 |
9,780 |
| 60 – 64 |
3,431 |
3,335 |
6,766 |
733 |
242 |
975 |
4,164 |
3,577 |
7,741 |
| 65 – 69 |
2,427 |
2,151 |
4,578 |
245 |
122 |
367 |
2,672 |
2,273 |
4,945 |
| 70 – 74 |
1,613 |
1,379 |
2,992 |
119 |
93 |
212 |
1,732 |
1,472 |
3,204 |
| 75 + |
1,569 |
1,458 |
3,027 |
140 |
87 |
227 |
1,709 |
1,545 |
3,254 |
| Total |
163,451 |
159,852 |
323,303 |
130,893 |
53,839 |
184,732 |
294,344 |
213,691 |
508,035 |
Source: Central Informatics Organisation (CIO) – Bahrain
ANNEXED NOTE
1. Technical Notes and Definitions
The table provides population figures at the date of 1991′ census by sex and age groups
Reference period for Census 1991 is unknown
Population of reference: all individuals (nationals and non-nationals) present within Bahrain’s borders during time of reference, be they permanent or temporary residents.
Nationality of the person is defined by the passport used to enter the country. A Non-Bahrainis is considered as such depending on the passport used to enter the country (or obtain the visa)
Age is defined as the time span between the date of birth and the date of the census expressed in complete years
* Total populations is summed using male and female population figures. Several of the calculated totals differ from the CIO reported total by one or two individuals.
2. Institution which provides data
Central Informatics Organization, known prior to 2001 as the “Central Statistics Organisation” under the Ministry of Cabinet Affairs
3. Data availability
This data is available on the Central Informatics Organisation (CIO) website. For the Arabic version: (http://www.cio.gov.bh/cio_ara/default.aspx). For the English version: (http://www.cio.gov.bh/CIO_ENG/Default.aspx)
Most censuses will break down the population by nationality and sex, and are published in PDF format
For the 1981 census data: (http://www.cio.gov.bh/cio_ara/English/Publications/Statistical%20Abstract/ABS2008/Ch2/2A.pdf)
For 1991 census data: (http://www.cio.gov.bh/cio_ara/English/Publications/Statistical%20Abstract/ABS2008/Ch2/2B.pdf)
For the 2001 census data: (http://www.cio.gov.bh/cio_ara/English/Publications/Statistical%20Abstract/ABS2008/Ch2/2C.pdf)
For the 2010 census data: (http://www.cio.gov.bh/cio_ara/English/Publications/Census/Population/1.pdf)
The 1981 and 1991 data can be found in the Statistical Abstract 2000, Population section. The 2001 data can be found in the Statistical Abstract 2002, Population section.
http://www.cio.gov.bh/CIO_ENG/SubDetailed.aspx?subcatid=119
The full 2010 census data can be found on both the CIO website and its separate website, found here: (http://www.census2010.gov.bh/index.php)
Data of access: July 2014
|
Bahraini |
Non-Bahraini |
Total |
| Governorate |
males |
females |
total |
males |
females |
total |
males |
females |
total |
| Capital |
34,147 |
33,442 |
67,589 |
190,884 |
71,037 |
261,921 |
225,031 |
104,479 |
329,510 |
| Muharraq |
51,706 |
50,538 |
102,244 |
57,148 |
29,722 |
86,870 |
108,854 |
80,260 |
189,114 |
| Northern |
97,833 |
96,229 |
194,062 |
52,701 |
30,186 |
82,887 |
150,534 |
126,415 |
276,949 |
| Central |
86,368 |
85,205 |
171,573 |
118,717 |
36,015 |
154,732 |
205,085 |
121,220 |
326,305 |
| Southern |
17,185 |
15,746 |
32,931 |
52,323 |
16,202 |
68,525 |
69,508 |
31,948 |
101,456 |
| Not Stated |
0 |
0 |
0 |
9,402 |
1,835 |
11,237 |
9,402 |
1,835 |
11,237 |
| Total |
287,239 |
281,160 |
568,399 |
481,175 |
184,997 |
666,172 |
768,414 |
466,157 |
1,234,571 |
Source: Central Informatics Organisation (CIO) – Bahrain
ANNEXED NOTE
1. Technical Notes and Definitions
The table provides data of Bahrain’s resident population based on the census of 2010, based on their place of residence by governorate, nationality and sex for the census year of 2010
Reference period for Census 2010 is April 27th, 2010 .
Implementation method: the Censuses are carried out according to de jure methodology, i.e. counting persons using their usual place of residence irrespective of where are they at census times
Population of reference: Bahrainis present within Bahrain’s borders during time of reference
Nationality is the person’s passport country. A Non-Bahrainis is considered as such depending on the passport used to enter the country (or obtain the visa).
A Governorate refers to an administrative, regiona, non-central unit, with a separate legal entity and budgetary provisions. Bahrain has been divided into governorates based on Decree (16) of 1996. Each governorate is headed by a governor that manages it, assisted by an assistant governor, an administrative body and a select number of individuals with a council.
2. Institution which provides data
Central Informatics Organization, known prior to 2001 as the “Central Statistics Organisation” under the Ministry of Cabinet Affairs
3. Data availability
This data is available on the Central Informatics Organisation (CIO) website. For the Arabic version: (http://www.cio.gov.bh/cio_ara/default.aspx). For the English version: (http://www.cio.gov.bh/CIO_ENG/Default.aspx)
Data for this census 2010 information can be found in a table in PDF format: (http://www.cio.gov.bh/cio_ara/English/Publications/Census/Population/2.pdf)
Data for this census 2010 information can also be found in the report titled “Census Summary Result 2010: Population, Housing, Buildings, Establishment and Agricultural Census released by the CIO”
General tables for the 2010 census data can be found in PDF format: (http://www.cio.gov.bh/CIO_ENG/SubDetailed.aspx?subcatid=256)
Information on the Bahraini governorates can be access through the Survey Land and Registration Bureau (SLRB): (http://www.slrb.gov.bh/Commerce/Products/152-area-of-kingdom-of-bahrain-by-governorates.aspx)
The map and list of towns and villages that fall under the Muharraq Governorate: (http://www.cio.gov.bh/CIO_ENG/English/Publications/Maps/Maps%20by%20Governorate/3_2008_Muharraq.pdf)
The map and list of towns and villages that fall under the Capital Governorate: (http://www.cio.gov.bh/CIO_ENG/English/Publications/Maps/Maps%20by%20Governorate/1_2008_Capital.pdf)
The map and list of towns and villages that fall under the Northern Governorate: (http://www.cio.gov.bh/CIO_ENG/English/Publications/Maps/Maps%20by%20Governorate/4_2008_North.pdf)
The map and list of towns and villages that fall under the Central Governorate: (http://www.cio.gov.bh/CIO_ENG/English/Publications/Maps/Maps%20by%20Governorate/2_2008_Central.pdf)
The map and list of towns and villages that fall under the Southern Governorate: (http://www.cio.gov.bh/CIO_ENG/English/Publications/Maps/Maps%20by%20Governorate/5_2008_South.pdf)
The maps are part of a list of publications released by the CIO on their website: (http://www.cio.gov.bh/CIO_ENG/SubDetailed.aspx?subcatid=89)
The definitions for the 2010′ census can be found in Arabic: (http://www.census2010.gov.bh/results.php)
Data of access: June 2014
|
Illiterate / Read Only |
Read & Write |
Primary |
Preparatory |
Secondary |
Above Secondary / Diploma |
B.Sc. Or BA |
High Diploma |
Masters |
Doctorate |
Unknown |
|
males |
females |
males |
females |
males |
females |
males |
females |
males |
females |
males |
females |
males |
females |
males |
females |
males |
females |
males |
females |
males |
females |
| 15 – 19 |
50 |
106 |
374 |
387 |
1,275 |
1,154 |
4,093 |
3,704 |
957 |
873 |
51 |
32 |
0 |
0 |
0 |
0 |
0 |
0 |
0 |
0 |
0 |
0 |
| 20 – 24 |
1,184 |
1,652 |
15,748 |
7,986 |
4,651 |
1,757 |
4,564 |
1,754 |
8,683 |
4,133 |
1,630 |
980 |
1,229 |
894 |
353 |
196 |
66 |
42 |
0 |
0 |
2 |
22 |
| 25 – 29 |
5,266 |
2,629 |
15,369 |
12,124 |
29,983 |
57 |
15,574 |
6,553 |
20,817 |
3,796 |
6,593 |
2,988 |
7,084 |
2,876 |
1,127 |
793 |
323 |
91 |
22 |
8 |
0 |
0 |
| 30 – 34 |
4,233 |
2,331 |
21,995 |
10,266 |
19,117 |
3,468 |
15,248 |
3,822 |
15,206 |
4,046 |
5,021 |
1,958 |
6,003 |
2,218 |
2,521 |
705 |
722 |
244 |
206 |
44 |
0 |
0 |
| 35 – 39 |
2,457 |
1,332 |
26,282 |
8,123 |
6,836 |
1,765 |
8,934 |
2,216 |
7,175 |
2,219 |
18,542 |
6,615 |
2,484 |
990 |
847 |
338 |
381 |
159 |
93 |
35 |
3 |
16 |
| 40 – 44 |
2,222 |
1,187 |
24,441 |
7,549 |
6,864 |
1,715 |
8,465 |
2,285 |
6,756 |
2,097 |
2,587 |
1,207 |
2,562 |
999 |
812 |
264 |
499 |
167 |
119 |
46 |
2 |
20 |
| 45 – 49 |
1,387 |
767 |
14,947 |
4,885 |
4,667 |
1,160 |
5,452 |
1,551 |
4,947 |
1,521 |
2,060 |
994 |
1,917 |
786 |
567 |
234 |
392 |
112 |
127 |
31 |
1 |
5 |
| 50 – 54 |
924 |
416 |
10,102 |
2,508 |
3,593 |
697 |
3,965 |
839 |
3,637 |
901 |
1,604 |
687 |
1,551 |
520 |
432 |
126 |
340 |
83 |
116 |
41 |
3 |
2 |
| 55 – 59 |
426 |
199 |
4,218 |
1,063 |
1,580 |
277 |
1,743 |
370 |
1,720 |
435 |
1,016 |
369 |
1,146 |
330 |
318 |
74 |
268 |
65 |
104 |
28 |
1 |
1 |
| 60 – 64 |
124 |
101 |
996 |
411 |
348 |
107 |
345 |
118 |
444 |
190 |
383 |
145 |
523 |
89 |
159 |
22 |
147 |
32 |
59 |
17 |
1 |
1 |
| 65 Years & Above |
235 |
232 |
383 |
372 |
82 |
115 |
98 |
103 |
148 |
118 |
171 |
71 |
240 |
46 |
70 |
9 |
79 |
7 |
69 |
7 |
0 |
2 |
| Total |
18,508 |
10,952 |
134,855 |
55,674 |
78,996 |
12,272 |
68,481 |
23,315 |
70,490 |
20,329 |
39,658 |
16,046 |
24,739 |
9,748 |
7,206 |
2,761 |
3,217 |
1,002 |
915 |
257 |
13 |
69 |
Source: Central Informatics Organisation (CIO)
ANNEXED NOTES
1. Technical Notes and Definitions
Reference period for Census 2010 is April 27th, 2010 .
Implementation method: the Censuses are carried out according to de jure methodology, i.e. counting persons using their usual place of residence irrespective of where are they at census times
Population of reference: all Bahrainis present within Bahrain’s borders during time of reference, be they permanent or temporary residents.
Nationality is the person’s passport country. A Non-Bahrainis is considered as such depending on the passport used to enter the country (or obtain the visa).
Age is defined as the time span between the date of birth and the date of the census expressed in complete years.
Illiterate refers to a person who cannot read or write a brief, simple sentence about his/her daily life in any language.
Read Only refers to a person who can read only but cannot write, such as those persons who have learned to read the Quran.
Read and Write refers to a person who is 10 years or older and passed one of the classes within primary education, but has not obtained any certificate of any formal education. This is a person who has can write and read simple sentences about his/her daily life in any language. This includes a blind person who can read and write using Braille.
Primary education accepts children who are six years old and above, and comprises of six grades (1-6 grade). It also includes adults who are enrolled in literacy classes.
Preparatory education accepts students who have completed and passed primary education, and comprises of three grades (7-9 grades). It also includes adults who are enrolled in advanced fellow-up education.
Secondary education accepts students who have completed and passed primary education, and comprises of three grades (10-12 grades). It also includes adults who are enrolled in advanced strengthening classes.
Above Secondary/Diploma education accepts students who have completed and passed secondary education, and comprises of one or two additional years. The student obtains a post-Secondary diploma that is officially certified.
B.Sc. or B.A. education accepts students who have completed and passed secondary or above secondary/diploma education.
High Diploma education accepts students who have completed and passed Bachelor’s degree, and could be one or two years. The student obtains an officially certified diploma.
Master’s education accepts students who have completed a Bachelor’s or high diploma degrees, and could comprise of one or more years. The student obtains upon graduation a Master’s degree.
Doctorate education accepts students who have obtained a Bachelor’s degree with experience, or Master’s degree or High Diploma, and comprises of two or more years. The student obtains a doctorate upon completion.
Not Stated or Unknown refers to a case where the interviewer does not know or is not certain of the highest level of education of the interviewee.
2. Institution which provides data
Central Informatics Organization, known prior to 2001 as the “Central Statistics Organisation” under the Ministry of Cabinet Affairs
3. Data availability
This data is available on the Central Informatics Organisation (CIO) website. For the Arabic version: (http://www.cio.gov.bh/cio_ara/default.aspx). For the English version: (http://www.cio.gov.bh/CIO_ENG/Default.aspx)
Census 2010 data can be found in PDF format: (http://www.cio.gov.bh/cio_eng/SubDetailed.aspx?subcatid=256)
This Census 2010 data for non-Bahraini males can be found in a table in PDF format: (http://www.cio.gov.bh/cio_ara/English/Publications/Census/Education/2_6_8.pdf)
This Census 2010 data for non-Bahraini females can be found in a table in PDF format: (http://www.cio.gov.bh/cio_ara/English/Publications/Census/Education/2_6_9.pdf)
The definitions for the 2010′ census can be found in Arabic: (http://www.census2010.gov.bh/results.php)
Data of access: June 2014
|
Illiterate / Read Only |
Read & Write |
Primary |
Preparatory |
Secondary |
Above Secondary / Diploma |
B.Sc. Or BA |
High Diploma |
Masters |
Doctorate |
Unknown |
|
males |
females |
males |
females |
males |
females |
males |
females |
males |
females |
males |
females |
males |
females |
males |
females |
males |
females |
males |
females |
males |
females |
| 15 – 19 |
65 |
46 |
664 |
364 |
6,287 |
5,575 |
17,368 |
16,088 |
6,057 |
6,905 |
75 |
156 |
6 |
1 |
0 |
0 |
0 |
0 |
0 |
0 |
0 |
0 |
| 20 – 24 |
132 |
164 |
1,476 |
564 |
2,640 |
752 |
3,456 |
1,936 |
17,842 |
19,637 |
1,403 |
1,786 |
1,288 |
1,760 |
16 |
15 |
6 |
1 |
0 |
1 |
0 |
1 |
| 25 – 29 |
136 |
181 |
641 |
760 |
1,370 |
972 |
1,670 |
2,615 |
16,511 |
12,133 |
1,634 |
2,292 |
2,658 |
4,480 |
24 |
35 |
27 |
19 |
0 |
1 |
0 |
0 |
| 30 – 34 |
42 |
76 |
1,294 |
1,234 |
2,976 |
1,214 |
5,458 |
4,167 |
7,639 |
8,487 |
1,428 |
2,112 |
1,892 |
3,205 |
128 |
129 |
217 |
344 |
22 |
10 |
0 |
0 |
| 35 – 39 |
43 |
170 |
848 |
1,092 |
1,375 |
985 |
3,571 |
2,831 |
5,335 |
5,912 |
4,073 |
4,529 |
1,111 |
1,619 |
50 |
72 |
135 |
106 |
17 |
5 |
3 |
5 |
| 40 – 44 |
124 |
599 |
2,184 |
2,726 |
2,038 |
1,646 |
3,523 |
3,340 |
5,697 |
5,660 |
1,104 |
1,317 |
1,085 |
1,729 |
79 |
116 |
185 |
128 |
28 |
15 |
1 |
7 |
| 45 – 49 |
343 |
1,561 |
2,199 |
4,195 |
2,624 |
1,867 |
3,219 |
2,178 |
4,843 |
4,457 |
1,145 |
1,101 |
1,058 |
1,369 |
161 |
237 |
187 |
126 |
58 |
24 |
2 |
7 |
| 50 – 54 |
414 |
2,162 |
2,471 |
4,132 |
1,871 |
1,244 |
2,357 |
1,358 |
3,774 |
3,027 |
1,070 |
1,090 |
958 |
838 |
137 |
186 |
190 |
88 |
75 |
29 |
7 |
10 |
| 55 – 59 |
460 |
2,022 |
2,289 |
2,746 |
1,372 |
760 |
1,714 |
756 |
2,512 |
1,345 |
937 |
578 |
783 |
447 |
152 |
148 |
188 |
61 |
95 |
19 |
2 |
12 |
| 60 – 64 |
509 |
2,189 |
1,542 |
1,771 |
817 |
374 |
936 |
286 |
1,488 |
510 |
480 |
158 |
426 |
176 |
117 |
56 |
104 |
26 |
65 |
15 |
5 |
7 |
| 65 Years & Above |
3,991 |
8,823 |
3,346 |
2,340 |
1,022 |
473 |
631 |
168 |
1,388 |
260 |
376 |
54 |
342 |
54 |
91 |
21 |
65 |
15 |
61 |
10 |
17 |
29 |
| Total |
6,259 |
17,993 |
18,954 |
21,924 |
24,392 |
15,862 |
43,903 |
35,723 |
73,086 |
68,333 |
13,725 |
15,173 |
11,607 |
15,678 |
955 |
1,015 |
1,304 |
914 |
421 |
129 |
37 |
78 |
| |
Bahrainis |
GCC citizens |
Other Arabs |
Asians |
all non-nationals |
TOTAL |
| |
males |
females |
males |
females |
males |
females |
males |
females |
males |
females |
males |
females |
| Illiterate |
6259 |
17,993 |
138 |
126 |
420 |
961 |
17,788 |
7,569 |
18,508 |
10,952 |
24,767 |
28,945 |
| Reads and writes |
18954 |
21,924 |
380 |
507 |
3,073 |
4,289 |
130,304 |
40,237 |
134,855 |
55,674 |
153,809 |
77,598 |
| Elementary/ Primary |
24392 |
15,862 |
169 |
217 |
1,551 |
1,340 |
76,999 |
9,217 |
78,996 |
12,272 |
103,388 |
28,134 |
| Intermediate/ Preparatoy |
43903 |
35,723 |
436 |
609 |
3,903 |
2,909 |
63,323 |
16,057 |
68,481 |
23,315 |
112,384 |
59,038 |
| High school diploma/ Secondary |
73086 |
68,333 |
1,556 |
1,724 |
4,241 |
2,645 |
63,697 |
14,074 |
70,490 |
20,329 |
143,576 |
88,662 |
| Diploma/ above sec. |
13725 |
15,173 |
440 |
342 |
3,134 |
1,921 |
34,812 |
11,740 |
39,658 |
16,046 |
53,383 |
31,219 |
| University degree |
12,562 |
16,693 |
557 |
364 |
4,903 |
2,469 |
23,287 |
7,956 |
31,945 |
12,509 |
44,507 |
29,202 |
| Postgraduate |
1,725 |
1,043 |
119 |
26 |
870 |
195 |
2,244 |
705 |
4,132 |
1,259 |
5,857 |
2,302 |
| NA |
37 |
78 |
|
1 |
1 |
3 |
12 |
52 |
13 |
69 |
50 |
147 |
| Total |
194,643 |
192,822 |
3,795 |
3,916 |
22,096 |
16,732 |
412,466 |
107,607 |
447,078 |
152,425 |
641,721 |
345,247 |
Source: Central Informatics Organisation (CIO)
ANNEXED NOTES
1. Technical Notes and Definitions
Reference period for Census 2010 is April 27th, 2010 .
Implementation method: the Censuses are carried out according to de jure methodology, i.e. counting persons using their usual place of residence irrespective of where are they at census times
Population of reference: all individuals (nationals and non-nationals) present within Bahrain’s borders during time of reference, be they permanent or temporary residents.
Nationality is the person’s passport country. A Non-Bahrainis is considered as such depending on the passport used to enter the country (or obtain the visa).
Illiterate refers to a person who cannot read or write a brief, simple sentence about his/her daily life in any language.
Read Only refers to a person who can read only but cannot write, such as those persons who have learned to read the Quran.
Read and Write refers to a person who is 10 years or older and passed one of the classes within primary education, but has not obtained any certificate of any formal education. This is a person who has can write and read simple sentences about his/her daily life in any language. This includes a blind person who can read and write using Braille.
Primary education accepts children who are six years old and above, and comprises of six grades (1-6 grade). It also includes adults who are enrolled in literacy classes.
Preparatory education accepts students who have completed and passed primary education, and comprises of three grades (7-9 grades). It also includes adults who are enrolled in advanced fellow-up education.
Secondary education accepts students who have completed and passed primary education, and comprises of three grades (10-12 grades). It also includes adults who are enrolled in advanced strengthening classes.
B.Sc. or B.A. education accepts students who have completed and passed secondary or above secondary/diploma education.
High Diploma education accepts students who have completed and passed Bachelor’s degree, and could be one or two years. The student obtains an officially certified diploma.
Master’s education accepts students who have completed a Bachelor’s or high diploma degrees, and could comprise of one or more years. The student obtains upon graduation a Master’s degree.
Doctorate education accepts students who have obtained a Bachelor’s degree with experience, or Master’s degree or High Diploma, and comprises of two or more years. The student obtains a doctorate upon completion.
Not Stated or Unknown refers to a case where the interviewer does not know or is not certain of the highest level of education of the interviewee.
2. Institution which provides data
Central Informatics Organization, known prior to 2001 as the “Central Statistics Organisation” under the Ministry of Cabinet Affairs
3. Data availability
This data is available on the Central Informatics Organisation (CIO) website. For the Arabic version: (http://www.cio.gov.bh/cio_ara/default.aspx). For the English version: (http://www.cio.gov.bh/CIO_ENG/Default.aspx)
For Census 2010 Bahraini males: (http://www.cio.gov.bh/cio_ara/English/Publications/Census/Education/2_6_5.pdf)
For Census 2010 Bahraini females: (http://www.cio.gov.bh/cio_ara/English/Publications/Census/Education/2_6_6.pdf)
For Census 2010 non-Bahraini males: (http://www.cio.gov.bh/cio_ara/English/Publications/Census/Education/2_6_8.pdf)
For Census 2010 non-Bahraini females: (http://www.cio.gov.bh/cio_ara/English/Publications/Census/Education/2_6_9.pdf)
The definitions for the 2010′ census can be found in Arabic: (http://www.census2010.gov.bh/results.php)
Data of access: June 2014
| |
Bahraini |
Non-Bahraini |
Total |
| |
males |
females |
total |
males |
females |
total |
| Illiterate/ Read only |
6,259 |
17,993 |
24,252 |
18,508 |
10,952 |
29,460 |
53,712 |
| Read & Write |
18,954 |
21,924 |
40,878 |
134,855 |
55,674 |
190,529 |
231,407 |
| Primary |
24,392 |
15,862 |
40,254 |
78,996 |
12,272 |
91,268 |
131,522 |
| Preparatory |
43,903 |
35,723 |
79,626 |
68,481 |
23,315 |
91,796 |
171,422 |
| Secondary |
73,086 |
68,333 |
141,419 |
70,490 |
20,329 |
90,819 |
232,238 |
| Above Secondary/Diploma |
13,725 |
15,173 |
28,898 |
39,658 |
16,046 |
55,704 |
84,602 |
| BSC or BA. |
11,607 |
15,678 |
27,285 |
24,739 |
9,748 |
34,487 |
61,772 |
| High Diploma |
955 |
1,015 |
1,970 |
7,206 |
2,761 |
9,967 |
11,937 |
| Masters |
1,304 |
914 |
2,218 |
3,217 |
1,002 |
4,219 |
6,437 |
| Doctorate |
421 |
129 |
550 |
915 |
257 |
1,172 |
1,722 |
| Unknown |
37 |
78 |
115 |
13 |
69 |
82 |
197 |
| Total |
194,643 |
192,822 |
387,465 |
447,078 |
152,425 |
599,503 |
986,968 |
Source: Central Informatics Organisation (CIO) – Bahrain
ANNEXED NOTE
1. Technical Notes and Definitions
Reference period for Census 2010 is April 27th, 2010 .
Population of reference: all individuals (nationals and non-nationals) present within Bahrain’s borders during time of reference, be they permanent or temporary residents.
Nationality is the person’s passport country. A Non-Bahrainis is considered as such depending on the passport used to enter the country (or obtain the visa).
Illiterate refers to a person who cannot read or write a brief, simple sentence about his/her daily life in any language.
Read Only refers to a person who can read only but cannot write, such as those persons who have learned to read the Quran.
Read and Write refers to a person who is 10 years or older and passed one of the classes within primary education, but has not obtained any certificate of any formal education. This is a person who has can write and read simple sentences about his/her daily life in any language. This includes a blind person who can read and write using Braille.
Primary education accepts children who are six years old and above, and comprises of six grades (1-6 grade). It also includes adults who are enrolled in literacy classes.
Preparatory education accepts students who have completed and passed primary education, and comprises of three grades (7-9 grades). It also includes adults who are enrolled in advanced fellow-up education.
Secondary education accepts students who have completed and passed primary education, and comprises of three grades (10-12 grades). It also includes adults who are enrolled in advanced strengthening classes.
Above Secondary/Diploma education accepts students who have completed and passed secondary education, and comprises of one or two additional years. The student obtains a post-Secondary diploma that is officially certified.
B.Sc. or B.A. education accepts students who have completed and passed secondary or above secondary/diploma education.
High Diploma education accepts students who have completed and passed Bachelor’s degree, and could be one or two years. The student obtains an officially certified diploma.
Master’s education accepts students who have completed a Bachelor’s or high diploma degrees, and could comprise of one or more years. The student obtains upon graduation a Master’s degree.
Doctorate education accepts students who have obtained a Bachelor’s degree with experience, or Master’s degree or High Diploma, and comprises of two or more years. The student obtains a doctorate upon completion.
Not Stated or Unknown refers to a case where the interviewer does not know or is not certain of the highest level of education of the interviewee.
2. Institution which provides data
Central Informatics Organization, known prior to 2001 as the “Central Statistics Organisation” under the Ministry of Cabinet Affairs
3. Data availability
This data is available on the Central Informatics Organisation (CIO) website. For the Arabic version: (http://www.cio.gov.bh/cio_ara/default.aspx). For the English version: (http://www.cio.gov.bh/CIO_ENG/Default.aspx)
For the 2010 census data: (http://www.cio.gov.bh/cio_eng/SubDetailed.aspx?subcatid=256)
This 2010 census data is available in a table in PDF format: (http://www.cio.gov.bh/cio_ara/English/Publications/Census/Education/2_5.pdf)
The definitions for the 2010′ census can be found in Arabic: (http://www.census2010.gov.bh/results.php)
Data of access: June 2014
| |
|
Bahrainis |
Non Bahrainis |
| |
|
Never Married |
Married |
Divorced |
Widowed |
Total |
Never Married |
Married |
Divorced |
Widowed |
Total |
| 15 – 19 |
males |
30,410 |
109 |
3 |
0 |
30,522 |
6726 |
69 |
3 |
2 |
6,800 |
| females |
27,802 |
1,272 |
61 |
0 |
29,135 |
5634 |
619 |
2 |
1 |
6,256 |
| total |
58,212 |
1,381 |
64 |
0 |
59,657 |
12,360 |
688 |
5 |
3 |
13,056 |
| 20 – 24 |
males |
24,215 |
3,943 |
97 |
4 |
28,259 |
34535 |
3534 |
20 |
21 |
38,110 |
| females |
15,768 |
10,244 |
590 |
15 |
26,617 |
14004 |
5385 |
19 |
8 |
19,416 |
| total |
39,983 |
14,187 |
687 |
19 |
54,876 |
48,539 |
8,919 |
39 |
29 |
57,526 |
| 25 – 29 |
males |
11,236 |
12,964 |
461 |
10 |
24,671 |
85414 |
16607 |
73 |
64 |
102,158 |
| females |
6,760 |
15,841 |
848 |
39 |
23,488 |
18929 |
12913 |
53 |
20 |
31,915 |
| total |
17,996 |
28,805 |
1,309 |
49 |
48,159 |
104,343 |
29,520 |
126 |
84 |
134,073 |
| 30 – 34 |
males |
4,458 |
16,092 |
531 |
15 |
21,096 |
63963 |
26203 |
65 |
41 |
90,272 |
| females |
4,023 |
15,992 |
848 |
115 |
20,978 |
13902 |
15096 |
76 |
28 |
29,102 |
| total |
8,481 |
32,084 |
1,379 |
130 |
42,074 |
77,865 |
41,299 |
141 |
69 |
119,374 |
| 35 – 39 |
males |
2,232 |
13,878 |
434 |
17 |
16,561 |
46954 |
26981 |
63 |
36 |
74,034 |
| females |
2,798 |
13,556 |
784 |
188 |
17,326 |
10373 |
13313 |
88 |
34 |
23,808 |
| total |
5,030 |
27,434 |
1,218 |
205 |
33,887 |
57,327 |
40,294 |
151 |
70 |
97,842 |
| 40 – 44 |
males |
1,687 |
13,903 |
423 |
35 |
16,048 |
31176 |
24077 |
54 |
22 |
55,329 |
| females |
2,548 |
13,536 |
852 |
347 |
17,283 |
6822 |
10599 |
69 |
46 |
17,536 |
| total |
4,235 |
27,439 |
1,275 |
382 |
33,331 |
37,998 |
34,676 |
123 |
68 |
72,865 |
| 45 – 49 |
males |
1,303 |
14,039 |
454 |
43 |
15,839 |
18118 |
18289 |
42 |
15 |
36,464 |
| females |
2,062 |
13,353 |
954 |
753 |
17,122 |
4237 |
7697 |
67 |
45 |
12,046 |
| total |
3,365 |
27,392 |
1,408 |
796 |
32,961 |
22,355 |
25,986 |
109 |
60 |
48,510 |
| 50-54 |
males |
932 |
11,927 |
403 |
62 |
13,324 |
10617 |
15609 |
27 |
14 |
26,267 |
| females |
1,337 |
10,786 |
844 |
1,197 |
14,164 |
1803 |
4922 |
37 |
58 |
6,820 |
| total |
2,269 |
22,713 |
1,247 |
1,259 |
27,488 |
12,420 |
20,531 |
64 |
72 |
33,087 |
| 55-59 |
males |
564 |
9,481 |
377 |
82 |
10,504 |
4107 |
8406 |
19 |
8 |
12,540 |
| females |
755 |
6,235 |
573 |
1,331 |
8,894 |
739 |
2404 |
20 |
48 |
3,211 |
| total |
1,319 |
15,716 |
950 |
1,413 |
19,398 |
4,846 |
10,810 |
39 |
56 |
15,751 |
| 60-64 |
males |
328 |
5,809 |
258 |
94 |
6,489 |
876 |
2638 |
10 |
5 |
3,529 |
| females |
254 |
3,474 |
343 |
1,497 |
5,568 |
211 |
976 |
8 |
38 |
1,233 |
| total |
582 |
9,283 |
601 |
1,591 |
12,057 |
1,087 |
3,614 |
18 |
43 |
4,762 |
| 65+ |
males |
547 |
9,630 |
456 |
697 |
11,330 |
329 |
1214 |
11 |
21 |
1,575 |
| females |
348 |
4,455 |
586 |
6,858 |
12,247 |
150 |
746 |
16 |
170 |
1,082 |
| total |
895 |
14,085 |
1,042 |
7,555 |
23,577 |
479 |
1,960 |
27 |
191 |
2,657 |
| |
males |
77,912 |
111,775 |
3,897 |
1,059 |
194,643 |
302,815 |
143,627 |
387 |
249 |
447,078 |
| Total |
females |
64,455 |
108,744 |
7,283 |
12,340 |
192,822 |
76,804 |
74,670 |
455 |
496 |
152,425 |
| |
total |
142,367 |
220,519 |
11,180 |
13,399 |
387,465 |
379,619 |
218,297 |
842 |
745 |
599,503 |
Source: Central Informatics Organisation (CIO) – Bahrain
ANNEXED NOTE
1. Technical Notes and Definitions
Reference period for Census 2010 is April 27th, 2010 .
Population of reference: all individuals (nationals and non-nationals) present within Bahrain’s borders during time of reference, be they permanent or temporary residents.
Nationality is the person’s passport country. A Non-Bahrainis is considered as such depending on the passport used to enter the country (or obtain the visa).
Age is defined as the time span between the date of birth and the date of the census expressed in complete years.
Marital Status refers to the personal status of a person 12 years or older with regard to marriage/divorce laws and customs of Bahrain.
Never married refers to a person who has never been in marital life until the date of the census.
Married refers to a person who is legally married with respect to marriage laws and customs at the time of the Census. This includes the person who is in his/her first marriage, even if marriage life has not begun yet, and those who are temporarily separated.
Divorced refers to an ever married person but not currently married, whose marriage was dissolved by divorce.
Widowed refers to an ever married person but not currently married, whose marriage has been dissolved by the death of the spouse, with the condition that he/she is not currently in a legal marriage, at the time of the Census.
2. Institution which provides data
Central Informatics Organization, known prior to 2001 as the “Central Statistics Organisation” under the Ministry of Cabinet Affairs
3. Data availability
This data is available on the Central Informatics Organisation (CIO) website. For the Arabic version: (http://www.cio.gov.bh/cio_ara/default.aspx). For the English version: (http://www.cio.gov.bh/CIO_ENG/Default.aspx)
For the 1991 census data: (http://www.cio.gov.bh/cio_ara/English/Publications/Statistical%20Abstract/ABS2008/Ch2/17A.pdf)
For the 2001 estimates: (http://www.cio.gov.bh/cio_ara/English/Publications/Statistical%20Abstract/ABS2008/Ch2/17B.pdf)
For 2010 census data: (http://www.cio.gov.bh/cio_ara/English/Publications/Census/Marital/2.pdf)
The definitions for the 2010′ census can be found in Arabic: (http://www.census2010.gov.bh/results.php)
Data of access: June 2014
| |
Bahrainis |
non-Bahrainis |
| |
Never Married |
Married |
Divorced |
Widowed |
Total |
Never Married |
Married |
Divorced |
Widowed |
Total |
| |
males |
females |
males |
females |
males |
females |
males |
females |
males |
females |
males |
females |
males |
females |
males |
females |
males |
females |
males |
females |
| Illiterate/ Read only |
810 |
1,338 |
4,895 |
8,925 |
194 |
669 |
360 |
7,061 |
6,259 |
17,993 |
14,596 |
6,663 |
3,892 |
4,169 |
13 |
22 |
7 |
98 |
18,508 |
10,952 |
| Read & Write |
4,321 |
3,296 |
13,851 |
14,638 |
516 |
1069 |
266 |
2921 |
18,954 |
21,924 |
96,044 |
31,041 |
38,672 |
24,343 |
86 |
119 |
53 |
171 |
134,855 |
55,674 |
| Primary |
10,750 |
7,155 |
13,053 |
7,401 |
495 |
678 |
95 |
628 |
24,393 |
15,862 |
57,158 |
6,584 |
21,741 |
5,612 |
47 |
31 |
50 |
45 |
78,996 |
12,272 |
| Preparatory |
23,598 |
19,357 |
19,516 |
14,810 |
706 |
1039 |
83 |
517 |
43,903 |
35,723 |
50,346 |
12,977 |
18,058 |
10,229 |
58 |
52 |
19 |
57 |
68,481 |
23,315 |
| Secondary |
32,144 |
26,199 |
39,477 |
38,844 |
1293 |
2536 |
172 |
754 |
73,086 |
68,333 |
44,178 |
8784 |
26,179 |
11,414 |
79 |
72 |
54 |
59 |
70,490 |
20,329 |
| Above Secondary/Diploma |
3,219 |
3,357 |
10,136 |
10,997 |
330 |
622 |
39 |
197 |
13,724 |
15,173 |
23,823 |
6,704 |
15,760 |
9,250 |
44 |
63 |
31 |
29 |
39,658 |
16,046 |
| BSC or BA. |
2,910 |
3,377 |
8,400 |
11,578 |
268 |
541 |
29 |
182 |
11,607 |
15,678 |
12,249 |
2894 |
12,428 |
6,776 |
37 |
56 |
25 |
22 |
24,739 |
9,748 |
| High Diploma |
64 |
161 |
857 |
766 |
29 |
50 |
5 |
38 |
955 |
1,015 |
3,243 |
840 |
3,946 |
1,885 |
10 |
26 |
7 |
10 |
7,206 |
2,761 |
| Masters |
85 |
183 |
1,167 |
655 |
46 |
58 |
6 |
18 |
1,304 |
914 |
928 |
222 |
2,276 |
766 |
11 |
11 |
2 |
3 |
3,217 |
1,002 |
| Doctorate |
10 |
29 |
391 |
81 |
18 |
17 |
2 |
2 |
421 |
129 |
242 |
58 |
670 |
194 |
2 |
3 |
1 |
2 |
915 |
257 |
| Unknown |
1 |
3 |
32 |
49 |
2 |
4 |
2 |
22 |
37 |
78 |
8 |
37 |
5 |
32 |
0 |
0 |
0 |
0 |
13 |
69 |
| Total |
77,912 |
64,455 |
111,775 |
108,744 |
3,897 |
7,283 |
1,059 |
12,340 |
194,643 |
192,822 |
302,815 |
76,804 |
143,627 |
74,670 |
387 |
455 |
249 |
496 |
447,078 |
152,425 |
Source: Central Informatics Organisation (CIO) – Bahrain
ANNEXED NOTE
1. Technical Notes and Definitions
Reference period for Census 2010 was April 27th, 2010 .
Population of reference: all individuals (nationals and non-nationals) present within Bahrain’s borders during time of reference, be they permanent or temporary residents.
Nationality is the person’s passport country. A Non-Bahrainis is considered as such depending on the passport used to enter the country (or obtain the visa).
Illiterate refers to a person who cannot read or write a brief, simple sentence about his/her daily life in any language.
Read Only refers to a person who can read only but cannot write, such as those persons who have learned to read the Quran.
Read and Write refers to a person who is 10 years or older and passed one of the classes within primary education, but has not obtained any certificate of any formal education. This is a person who has can write and read simple sentences about his/her daily life in any language. This includes a blind person who can read and write using Braille.
Primary education accepts children who are six years old and above, and comprises of six grades (1-6 grade). It also includes adults who are enrolled in literacy classes.
Preparatory education accepts students who have completed and passed primary education, and comprises of three grades (7-9 grades). It also includes adults who are enrolled in advanced fellow-up education.
Secondary education accepts students who have completed and passed primary education, and comprises of three grades (10-12 grades). It also includes adults who are enrolled in advanced strengthening classes.
Above Secondary/Diploma education accepts students who have completed and passed secondary education, and comprises of one or two additional years. The student obtains a post-Secondary diploma that is officially certified.
B.Sc. or B.A. education accepts students who have completed and passed secondary or above secondary/diploma education.
High Diploma education accepts students who have completed and passed Bachelor’s degree, and could be one or two years. The student obtains an officially certified diploma.
Master’s education accepts students who have completed a Bachelor’s or high diploma degrees, and could comprise of one or more years. The student obtains upon graduation a Master’s degree.
Doctorate education accepts students who have obtained a Bachelor’s degree with experience, or Master’s degree or High Diploma, and comprises of two or more years. The student obtains a doctorate upon completion.
Marital Status refers to the personal status of a person 12 years or older with regard to marriage/divorce laws and customs of Bahrain.
Never married refers to a person who has never been in marital life until the date of the census.
Married refers to a person who is legally married with respect to marriage laws and customs at the time of the Census. This includes the person who is in his/her first marriage, even if marriage life has not begun yet, and those who are temporarily separated.
Divorced refers to an ever married person but not currently married, whose marriage was dissolved by divorce.
Widowed refers to an ever married person but not currently married, whose marriage has been dissolved by the death of the spouse, with the condition that he/she is not currently in a legal marriage, at the time of the Census.
2. Institution which provides data
Central Informatics Organization, known prior to 2001 as the “Central Statistics Organisation” under the Ministry of Cabinet Affairs
3. Data availability
This data is available on the Central Informatics Organisation (CIO) website. For the Arabic version: (http://www.cio.gov.bh/cio_ara/default.aspx). For the English version: (http://www.cio.gov.bh/CIO_ENG/Default.aspx)
For 2010 census data on Bahraini male: (http://www.cio.gov.bh/cio_ara/English/Publications/Census/Marital/5_5.pdf)
For 2010 census data on Non-Bahraini male: (http://www.cio.gov.bh/cio_ara/English/Publications/Census/Marital/5_8.pdf)
The definitions for the 2010′ census can be found in Arabic: (http://www.census2010.gov.bh/results.php)
Data of access: June 2014
| |
Bahrainis |
Non-Bahrainis |
Total |
|
males |
females |
total |
males |
females |
total |
males |
females |
total |
| Never married |
77,912 |
64,455 |
142,367 |
302,815 |
76,804 |
379,619 |
380,727 |
141,259 |
521,986 |
| Married |
111,775 |
108,744 |
220,519 |
143,627 |
74,670 |
218,297 |
255,402 |
183,414 |
438,816 |
| Divorced |
3,897 |
7,283 |
11,180 |
387 |
455 |
842 |
4,284 |
7,738 |
12,022 |
| Widowed |
1,059 |
12,340 |
13,399 |
249 |
496 |
745 |
1,308 |
12,836 |
14,144 |
| Total |
194,643 |
192,822 |
387,465 |
447,078 |
152,425 |
599,503 |
641,721 |
345,247 |
986,968 |
Source: Central Informatics Organisation (CIO) – Bahrain
ANNEXED NOTE
1. Technical Notes and Definitions
The table provides data for Bahrain’s resident population by nationality (Bahraini and non-Bahraini) by sex and marital status at date of 2010′ census.
Reference period for 2010 is April 27th, 2010 .
Population of reference: all individuals (nationals and non-nationals) present within Bahrain’s borders during time of reference, be they permanent or temporary residents.
Nationality is the person’s passport country. A Non-Bahrainis is considered as such depending on the passport used to enter the country (or obtain the visa).
Marital Status refers to the personal status of a person 12 years or older with regard to marriage/divorce laws and customs of Bahrain.
Never married refers to a person who has never been in marital life until the date of the census.
Married refers to a person who is legally married with respect to marriage laws and customs at the time of the Census. This includes the person who is in his/her first marriage, even if marriage life has not begun yet, and those who are temporarily separated.
Divorced refers to an ever married person but not currently married, whose marriage was dissolved by divorce.
Widowed refers to an ever married person but not currently married, whose marriage has been dissolved by the death of the spouse, with the condition that he/she is not currently in a legal marriage, at the time of the Census.
2. Institution which provides data
Central Informatics Organization, known prior to 2001 as the “Central Statistics Organisation” under the Ministry of Cabinet Affairs
3. Data availability
This data is available on the Central Informatics Organisation (CIO) website. For the Arabic version: (http://www.cio.gov.bh/cio_ara/default.aspx). For the English version: (http://www.cio.gov.bh/CIO_ENG/Default.aspx)
For 2010 census data: (http://www.cio.gov.bh/cio_ara/English/Publications/Census/Marital/1.pdf)
The definitions for the 2010′ census can be found in Arabic: (http://www.census2010.gov.bh/results.php)
Data of access: June 2014
|
Bahrainis |
Non-Bahrainis |
Total |
|
males |
females |
total |
males |
females |
total |
males |
females |
total |
| 1981 |
121,357 |
118,683 |
240,040 |
80,511 |
33,116 |
113,627 |
201,868 |
151,799 |
353,667 |
| 1990 |
157,128 |
153,666 |
310,794 |
122,730 |
50,482 |
173,212 |
279,858 |
204,148 |
484,006 |
| 1991 |
163,451 |
159,852 |
323,303 |
130,893 |
53,839 |
184,732 |
294,344 |
213,691 |
508,035 |
| 1992 |
165,932 |
162,294 |
328,226 |
132,967 |
55,265 |
188,232 |
298,899 |
217,559 |
516,458 |
| 1993 |
169,973 |
166,278 |
336,251 |
136,615 |
57,359 |
193,974 |
306,588 |
223,637 |
530,225 |
| 1994 |
174,108 |
170,371 |
344,479 |
140,366 |
59,521 |
199,887 |
314,474 |
229,892 |
544,366 |
| 1995 |
178,328 |
174,572 |
352,900 |
144,227 |
61,752 |
205,979 |
322,555 |
236,324 |
558,879 |
| 1996 |
182,648 |
178,882 |
361,530 |
148,207 |
64,055 |
212,262 |
330,855 |
242,937 |
573,792 |
| 1997 |
187,065 |
183,312 |
370,377 |
152,307 |
66,431 |
218,738 |
339,372 |
249,743 |
589,115 |
| 1998 |
191,577 |
187,858 |
379,435 |
156,523 |
68,884 |
225,407 |
348,100 |
256,742 |
604,842 |
| 1999 |
196,190 |
192,524 |
388,714 |
160,866 |
71,409 |
232,275 |
357,056 |
263,933 |
620,989 |
| 2000 |
200,903 |
197,318 |
398,221 |
165,344 |
74,017 |
239,361 |
366,247 |
271,335 |
637,582 |
| 2001 |
206,911 |
202,712 |
409,623 |
179,806 |
71,896 |
251,702 |
386,717 |
274,608 |
661,325 |
| 2002 |
215,813 |
211,432 |
427,245 |
202,385 |
80,923 |
283,308 |
418,198 |
292,355 |
710,553 |
| 2003 |
225,099 |
220,532 |
445,631 |
227,797 |
91,088 |
318,885 |
452,896 |
311,620 |
764,516 |
| 2004 |
234,786 |
230,021 |
464,807 |
256,409 |
102,526 |
358,935 |
491,195 |
332,547 |
823,742 |
| 2005 |
244,889 |
239,922 |
484,811 |
288,614 |
115,404 |
404,018 |
533,503 |
355,326 |
888,829 |
| 2006 |
255,428 |
250,243 |
505,671 |
324,856 |
129,895 |
454,751 |
580,284 |
380,138 |
960,422 |
| 2007 |
266,421 |
261,013 |
527,434 |
365,656 |
146,210 |
511,866 |
632,077 |
407,223 |
1,039,300 |
| 2008 |
273,612 |
267,975 |
541,587 |
402,978 |
158,931 |
561,909 |
676,590 |
426,906 |
1,103,496 |
| 2009 |
282,011 |
276,000 |
558,011 |
449,986 |
170,418 |
620,404 |
731,997 |
446,418 |
1,178,415 |
| 2010 |
288,452 |
282,235 |
570,687 |
475,905 |
181,951 |
657,856 |
764,357 |
464,186 |
1,228,543 |
| 2011 |
295,878 |
288,810 |
584,688 |
445,605 |
164,727 |
610,332 |
741,483 |
453,537 |
1,195,020 |
Source: Central Informatics Organisation (CIO) – Bahrain
ANNEXED NOTE
1, Technical Notes and Definitions
The table provides intercensal mid-year estimates of Bahrain’s total resident population (nationals and non-nationals)
Reference period: mid-year
Population of reference: all nationals and non-nationals in the country
Implementation method: the Censuses are carried out according to de jure methodology, i.e. counting persons using their usual place of residence irrespective of where are they at census times
Nationality of the person is defined by the passport used to enter the country. A Non-Bahrainis is considered as such depending on the passport used to enter the country (or obtain the visa)
* Total populations for nationals and non-nationals are summed using male and female population figures. Several of the calculated totals differ from the CIO reported total by one or two individuals.
2. Institution which provides data
Central Informatics Organization, known prior to 2001 as the “Central Statistics Organisation” under the Ministry of Cabinet Affairs
3. Data availability
This data is available on the Central Informatics Organisation (CIO) website. For the Arabic version: (http://www.cio.gov.bh/cio_ara/default.aspx). For the English version: (http://www.cio.gov.bh/CIO_ENG/Default.aspx)
Censuses for 1981 and forward break down the population by nationality, sex and age groups, and are published in PDF format
For 1992-2011 estimates: (http://www.cio.gov.bh/cio_ara/English/Publications/Statistical%20Abstract/ABS2011/CH2/1.pdf)
For 1991-2010 estimates: (http://www.cio.gov.bh/cio_ara/English/Publications/Statistical%20Abstract/ABS2010/CH2/1.pdf)
For 1990-1991 estimates: (http://www.cio.gov.bh/cio_ara/English/Publications/Statistical%20Abstract/ABS2009/Ch2/36.pdf)
For 1981 estimates: (http://www.cio.gov.bh/cio_ara/English/Publications/Statistical%20Abstract/ABS2008/Ch2/2A.pdf)
Data of access: June 2014
| Nationality Group |
males |
females |
total |
| Bahrainis |
163,453 |
159,852 |
323,305 |
| GCC Arabs |
2,526 |
2,202 |
4,728 |
| Other Arabs |
10,086 |
7,791 |
17,877 |
| Arabs |
12,612 |
9,993 |
22,605 |
| Asian |
114,093 |
39,997 |
154,090 |
| African |
159 |
186 |
345 |
| European |
3,069 |
2,923 |
5,992 |
| North American |
741 |
562 |
1,303 |
| South American |
42 |
51 |
93 |
| Oceanian |
177 |
127 |
304 |
| Non-Arabs |
118,281 |
43,846 |
162,127 |
| Total Non-Bahrainis |
130,893 |
53,839 |
184,732 |
| Total |
294,346 |
213,691 |
508,037 |
Source: Central Informatics Organisation (CIO) – Bahrain
ANNEXED NOTE
1. Technical Notes and Definitions
The table provides figures of Bahrain’s national and non-national resident population at date of 1991′ census
Reference period: unknown
Population of reference: all non-nationals in the country at the time of the census
Implementation method: the Censuses are carried out according to de jure methodology, i.e. counting persons using their usual place of residence irrespective of where are they at census times
Nationality of the person is defined by the passport used to enter the country. A Non-Bahrainis is considered as such depending on the passport used to enter the country (or obtain the visa)
2. Institution which provides data
Central Informatics Organization, known prior to 2001 as the “Central Statistics Organisation” under the Ministry of Cabinet Affairs
3. Data availability
This data is available on the Central Informatics Organisation (CIO) website. For the Arabic version: (http://www.cio.gov.bh/cio_ara/default.aspx). For the English version: (http://www.cio.gov.bh/CIO_ENG/Default.aspx)
This data for 1991 and 2001 censuses are available in PDF format: (http://www.cio.gov.bh/cio_ara/English/Publications/Statistical%20Abstract/ABS2008/Ch2/29.pdf)
Data of access: June 2014
| Nationality Group |
males |
females |
total |
| Bahrainis |
287,239 |
281,160 |
568,399 |
| GCC |
4,283 |
4,407 |
8,690 |
| Other Arabs |
32,149 |
26,064 |
58,213 |
| Arabs |
36,432 |
30,471 |
66,903 |
| Asian |
433,756 |
128,284 |
562,040 |
| African |
1,576 |
17,972 |
19,548 |
| European |
6,264 |
5,499 |
11,763 |
| North American |
2,237 |
1,912 |
4,149 |
| South American |
241 |
233 |
474 |
| Oceanian |
669 |
626 |
1,295 |
| Non-Arabs |
444,743 |
154,526 |
599,269 |
| Total Non-Bahrainis |
481,175 |
184,997 |
666,172 |
| Total population |
768,414 |
466,157 |
1,234,571 |
Source: Central Informatics Organisation (CIO) – Bahrain
ANNEXED NOTE
1. Technical Notes and Definitions
The table provides figures of Bahrain’s total resident population at date of 2010′ census
Reference period: the 2001 census was conducted on April 27th, 2010
Population of reference: all non-nationals in the country at the time of the census
Implementation method: the Censuses are carried out according to de jure methodology, i.e. counting persons using their usual place of residence irrespective of where are they at census times
Nationality of the person is defined by the passport used to enter the country. A Non-Bahrainis is considered as such depending on the passport used to enter the country (or obtain the visa)
2. Institution which provides data
Central Informatics Organization, known prior to 2001 as the “Central Statistics Organisation” under the Ministry of Cabinet Affairs
3. Data availability
This data is available on the Central Informatics Organisation (CIO) website. For the Arabic version: (http://www.cio.gov.bh/cio_ara/default.aspx). For the English version: (http://www.cio.gov.bh/CIO_ENG/Default.aspx)
This data for 2010 censuses is available in PDF format: (http://www.cio.gov.bh/cio_ara/English/Publications/Census/Population/4.pdf )
Data of access: June 2014
| Nationality Group |
males |
females |
total |
| Bahrainis |
204,623 |
201,044 |
405,667 |
| GCC |
3,636 |
3,187 |
6,823 |
| Other Arabs |
11,698 |
8,352 |
20,050 |
| Arabs |
15,334 |
11,539 |
26,873 |
| Asian |
148,343 |
57,283 |
205,626 |
| African |
342 |
2,582 |
2,924 |
| European |
2,833 |
2,955 |
5,788 |
| North American |
1,924 |
1,271 |
3,195 |
| South American |
35 |
35 |
70 |
| Oceanian |
215 |
246 |
461 |
| Non-Arabs |
153,692 |
64,372 |
218,064 |
| Total Non-Bahrainis |
169,026 |
75,911 |
244,937 |
| Grand total |
373,649 |
276,955 |
650,604 |
Source: Central Informatics Organisation (CIO) – Bahrain
ANNEXED NOTE
1. Technical Notes and Definitions
The table provides figures of Bahrain’s resident population at date of 2001′ census
Reference period: the 2001 census was conducted on April 7th, 2001
Population of reference: all non-nationals in the country at the time of the census
Implementation method: the Censuses are carried out according to de jure methodology, i.e. counting persons using their usual place of residence irrespective of where are they at census times
Nationality of the person is defined by the passport used to enter the country. A Non-Bahrainis is considered as such depending on the passport used to enter the country (or obtain the visa)
2. Institution which provides data
Central Informatics Organization, known prior to 2001 as the “Central Statistics Organisation” under the Ministry of Cabinet Affairs
3. Data availability
This data is available on the Central Informatics Organisation (CIO) website. For the Arabic version: (http://www.cio.gov.bh/cio_ara/default.aspx). For the English version: (http://www.cio.gov.bh/CIO_ENG/Default.aspx)
This data for 1991 and 2001 censuses are available in PDF format: (http://www.cio.gov.bh/cio_ara/English/Publications/Statistical%20Abstract/ABS2008/Ch2/29.pdf)
This data for 1991 and 2001 censuses are available in PDF format: (http://www.cio.gov.bh/cio_ara/English/Publications/Statistical%20Abstract/ABS2008/Ch2/1.pdf)
Data of access: June 2014
| |
Bahrainis |
Non-Bahrainis |
Total |
| Census |
male |
female |
total |
male |
female |
total |
male |
female |
total |
| 1941 |
… |
… |
74.040 |
… |
… |
15.930 |
… |
… |
89.970 |
| 1950 |
… |
… |
91.179 |
… |
… |
18.471 |
… |
… |
109.650 |
| 1959 |
59.913 |
58.821 |
118.734 |
17.709 |
6.692 |
24.401 |
77.622 |
65.513 |
143.135 |
| 1965 |
72.368 |
71.446 |
143.814 |
27.016 |
11.373 |
38.389 |
99.384 |
82.819 |
182.203 |
| 1971 |
89.772 |
88.421 |
178.193 |
26.542 |
11.343 |
37.885 |
116.314 |
99.764 |
216.078 |
| 1981 |
119.924 |
118.496 |
238.420 |
84.869 |
27.509 |
112.378 |
204.793 |
146.005 |
350.798 |
| 1991 |
163.453 |
159.852 |
323.305 |
130.893 |
53.839 |
184.732 |
294.346 |
213.691 |
508.037 |
| 2001 |
204.623 |
201.044 |
405.667 |
169.026 |
75.911 |
244.937 |
373.649 |
276.955 |
650.604 |
| 2010 |
287.239 |
281.160 |
568.399 |
481.175 |
184.997 |
666.172 |
768.414 |
466.157 |
1.234.571 |
Source: Central Informatics Organization (CIO) – Bahrain
ANNEXED NOTE
1. Technical Notes and Definitions
Reference Periods:
| 1941 |
January 22, 1941 |
| 1950 |
March 1950 |
| 1959 |
May 1959 |
| 1965 |
February 13, 1965 |
| 1971 |
April 1971 |
| 1981 |
n.d. |
| 1991 |
n.d. |
| 2001 |
April 7th, 2001 |
| 2010 |
April 27th, 2010 |
Implementation method: after 1981, the Censuses are carried out according to de jure methodology, i.e. counting persons using their usual place of residence irrespective of where are they at census times
Population of reference: all individuals (nationals and non-nationals) present within the State’s borders during time of reference.
Nationality of the person is defined by the passport used to enter the country. A Non-Bahrainis is considered as such depending on the passport used to enter the country (or obtain the visa)
2. Institution which provides data
Central Informatics Organization, known prior to 2001 as the “Central Statistics Organisation” under the Ministry of Cabinet Affairs
3. Data availability
The census figures and results are all available on the Central Informatics Organisation (CIO) website. For Arabic version: (http://www.cio.gov.bh/cio_ara/default.aspx). For the English version: (http://www.cio.gov.bh/CIO_ENG/Default.aspx)
Most censuses will break down the population by nationality and sex, and are published in PDF format
Census figures for the period 1941-2001 could be accessed through this link: (http://www.cio.gov.bh/cio_ara/English/Publications/Statistical%20Abstract/ABS2008/Ch2/1.pdf)
For main statistics on censuses of 1981, 1991 and 2001: (http://www.cio.gov.bh/CIO_ENG/SubDetailed.aspx?subcatid=416)
Summary report for the census of 2001 can be accessed through: (http://www.cio.gov.bh/CIO_ENG/SubDetailed.aspx?subcatid=605)
Summary report for the census of 2010 can be accessed through: (http://www.cio.gov.bh/CIO_ENG/SubDetailed.aspx?subcatid=256)
Data of access: June 2014
|
Bahrainis |
Non Bahrainis |
Total |
| 1981 |
240.040 |
113.627 |
353.667 |
| 1990 |
310.794 |
173.212 |
484.006 |
| 1991 |
323.303 |
184.732 |
508.035 |
| 1992 |
328.226 |
188.232 |
516.458 |
| 1993 |
336.251 |
193.974 |
530.225 |
| 1994 |
344.479 |
199.887 |
544.366 |
| 1995 |
352.900 |
205.979 |
558.879 |
| 1996 |
361.530 |
212.262 |
573.792 |
| 1997 |
370.377 |
218.738 |
589.115 |
| 1998 |
379.435 |
225.407 |
604.842 |
| 1999 |
388.714 |
232.275 |
620.989 |
| 2000 |
398.221 |
239.361 |
637.582 |
| 2001 |
409.623 |
251.702 |
661.325 |
| 2002 |
427.245 |
283.308 |
710.553 |
| 2003 |
445.631 |
318.885 |
764.516 |
| 2004 |
464.807 |
358.935 |
823.742 |
| 2005 |
484.811 |
404.018 |
888.829 |
| 2006 |
505.671 |
454.751 |
960.422 |
| 2007 |
527.434 |
511.866 |
1.039.300 |
| 2008 |
541.587 |
561.909 |
1.103.496 |
| 2009 |
558.011 |
620.404 |
1.178.415 |
| 2010 |
570.687 |
657.856 |
1.228.543 |
| 2011 |
584.688 |
610.332 |
1.195.020 |
Source: Central Informatics Organization (CIO) – Bahrain
ANNEXED NOTE
1. Technical Notes and Definitions
The table provides mid-year intercensal estimates of Bahrain’s total resident population (nationals and non-nationals)
Reference period: 1991: unknown; April 7th 2001, April 27th 2010.
Implementation method: the Censuses are carried out according to de jure methodology, i.e. counting persons using their usual place of residence irrespective of where are they at census times
Population of reference: all individuals (nationals and non-nationals) present within the State’s borders during time of reference.
Nationality of the person is defined by the passport used to enter the country. A Non-Bahrainis is considered as such depending on the passport used to enter the country (or obtain the visa)
It has to be noticed that the mid-year estimate for 2010 gives a figure lower than that of the census (April 27, 2010)
2. Institution which provides data
Central Informatics Organization, known prior to 2001 as the “Central Statistics Organisation” under the Ministry of Cabinet Affairs
3. Data availability
This data is available on the Central Informatics Organisation (CIO) website. For the Arabic version: (http://www.cio.gov.bh/cio_ara/default.aspx). For the English version: (http://www.cio.gov.bh/CIO_ENG/Default.aspx)
Censuses for 1981 and forward break down the population by nationality, sex and age groups, and are published in PDF format
For 1992-2011 estimates: (http://www.cio.gov.bh/cio_ara/English/Publications/Statistical%20Abstract/ABS2011/CH2/1.pdf)
For 1991-2010 estimates: (http://www.cio.gov.bh/cio_ara/English/Publications/Statistical%20Abstract/ABS2010/CH2/1.pdf)
For 1990-1991 estimates: (http://www.cio.gov.bh/cio_ara/English/Publications/Statistical%20Abstract/ABS2009/Ch2/36.pdf)
For 1981 estimates: (http://www.cio.gov.bh/cio_ara/English/Publications/Statistical%20Abstract/ABS2008/Ch2/2A.pdf)
Data of access: June 2014
|
1991 |
2001 |
2010 |
| Bahrainis |
323.305 |
405.667 |
570.687 |
| GCC |
4.728 |
6.823 |
8.690 |
| Other Arabs |
17.877 |
20.050 |
58.213 |
| Non-Bahraini Arabs |
22.605 |
26.873 |
66.903 |
| Asian |
154.090 |
205.626 |
562.040 |
| African |
345 |
2.924 |
19.548 |
| European |
5.992 |
5.788 |
11.763 |
| North American |
1.303 |
3.195 |
4.149 |
| South American |
93 |
70 |
474 |
| Oceanian |
304 |
461 |
1.295 |
| Non-Arabs |
162.127 |
218.064 |
599.269 |
| Total Non-Bahrainis |
184.732 |
244.937 |
666.172 |
| Total |
508.037 |
650.604 |
1.236.859 |
Source: Central Informatics Organization (CIO) – Bahrain
ANNEXED NOTE
1. Technical Notes and Definitions
The table provides data for Bahrain’s resident population by nationality group for the census years of 1991, 2001 and 2010
Reference Period: 1991: unknown; 2001 census was conducted on April 7th 2001, 2010′ census was conducted on April 27th 2010.
Implementation method: the Censuses are carried out according to de jure methodology, i.e. counting persons using their usual place of residence irrespective of where are they at census times
Population of reference: all individuals (nationals and non-nationals) present within the State’s borders during time of reference.
Nationality of the person is defined by the passport used to enter the country. A Non-Bahrainis is considered as such depending on the passport used to enter the country (or obtain the visa)
It has to be noticed that there is a discrepancy of 2288 persons between the figure for the total Bahraini population in 2010 presented in this table and the one presented in tables aggregated by nationality.
2. Institution which provides data
Central Informatics Organization, known prior to 2001 as the “Central Statistics Organisation” under the Ministry of Cabinet Affairs
3. Data availability
The census figures and results are all available on the Central Informatics Organisation (CIO) website. For Arabic version: (http://www.cio.gov.bh/cio_ara/default.aspx). For the English version: (http://www.cio.gov.bh/CIO_ENG/Default.aspx)
Data for 1991 and 2001 can be found in a table in PDF format: (http://www.cio.gov.bh/cio_ara/English/Publications/Statistical%20Abstract/ABS2008/Ch2/29.pdf)
Data for 2010 can be found in a table in PDF format: (http://www.cio.gov.bh/cio_ara/English/Publications/Census/Population/4.pdf)
General tables for the 2010 census can be found in tables in PDF format: (http://www.cio.gov.bh/CIO_ENG/SubDetailed.aspx?subcatid=256)
Data of access: June 2014
| Census |
Bahrainis |
Non-Bahrainis |
total |
| 1941 |
74.040 |
15.930 |
89.970 |
| 1950 |
91.179 |
18.471 |
109.650 |
| 1959 |
118.734 |
24.401 |
143.135 |
| 1965 |
143.814 |
38.389 |
182.203 |
| 1971 |
178.193 |
37.885 |
216.078 |
| 1981 |
238.420 |
112.378 |
350.798 |
| 1991 |
323.305 |
184.732 |
508.037 |
| 2001 |
405.667 |
244.937 |
650.604 |
| 2010 |
568.399 |
666.172 |
1.234.571 |
Source: Central Informatics Organization (CIO) – Bahrain
ANNEXED NOTE
1. Technical Notes and Definitions
This table provides data for Bahrain’s residents (nationals and non-nationals) at dates of census.
Reference Periods:
| 1941 |
January 22, 1941 |
| 1950 |
March 1950 |
| 1959 |
May 1959 |
| 1965 |
February 13, 1965 |
| 1971 |
April 1971 |
| 1981 |
n.d. |
| 1991 |
n.d. |
| 2001 |
April 7th, 2001 |
| 2010 |
April 27th, 2010 |
Implementation method: the Censuses are carried out according to de jure methodology, i.e. counting persons using their usual place of residence irrespective of where are they at census times
Population of reference: all individuals (nationals and non-nationals) present within the State’s borders during time of reference.
Nationality of the person is defined by the passport used to enter the country. A Non-Bahrainis is considered as such depending on the passport used to enter the country (or obtain the visa)
2. Institution which provides data
Central Informatics Organization, known prior to 2001 as the “Central Statistics Organisation” under the Ministry of Cabinet Affairs
3. Data availability
The census figures and results are all available on the Central Informatics Organisation (CIO) website. For Arabic version: (http://www.cio.gov.bh/cio_ara/default.aspx). For the English version: (http://www.cio.gov.bh/CIO_ENG/Default.aspx)
Census figures for the period 1941-2001 could be accessed through this link: (http://www.cio.gov.bh/cio_ara/English/Publications/Statistical%20Abstract/ABS2008/Ch2/1.pdf)
For main statistics on censuses of 1981, 1991 and 2001: (http://www.cio.gov.bh/CIO_ENG/SubDetailed.aspx?subcatid=416)
Summary report for the census of 2001 can be accessed through: (http://www.cio.gov.bh/CIO_ENG/SubDetailed.aspx?subcatid=605)
Summary report for the census of 2010 can be accessed through: (http://www.cio.gov.bh/CIO_ENG/SubDetailed.aspx?subcatid=256)
The 2001 figures could also be found in PDF format in the CIO publication titled “Bahrain in Figures 2001”, Issue 19, Dec 2002: (http://www.cio.gov.bh/CIO_ENG/English/Publications/Bahrain%20in%20Figure/BIF2001.pdf)
Data of access: June 2014
| |
Population |
Growth rates |
| |
males |
females |
total |
males |
females |
total |
| 1986 |
250.328 |
123.067 |
373.395 |
|
|
|
| 1987 |
256.844 |
127.006 |
383.850 |
2,6 |
3,2 |
2,8 |
| 1988 |
263.958 |
131.251 |
395.209 |
2,7 |
3,3 |
2,9 |
| 1989 |
271.685 |
135.886 |
407.571 |
2,9 |
3,5 |
3,1 |
| 1990 |
279.800 |
140.979 |
420.779 |
2,9 |
3,7 |
3,2 |
| 1991 |
288.600 |
145.772 |
434.372 |
3,1 |
3,3 |
3,2 |
| 1992 |
297.992 |
150.579 |
448.571 |
3,2 |
3,2 |
3,2 |
| 1993 |
308.458 |
155.509 |
463.967 |
3,5 |
3,2 |
3,4 |
| 1994 |
319.379 |
160.951 |
480.330 |
3,5 |
3,4 |
3,5 |
| 1995 |
331.111 |
166.440 |
497.551 |
3,6 |
3,4 |
3,5 |
| 1996 |
343.472 |
172.104 |
515.576 |
3,7 |
3,3 |
3,6 |
| 1997 |
353.787 |
182.687 |
536.474 |
3,0 |
6,0 |
4,0 |
| 1998 |
370.742 |
190.248 |
560.990 |
4,7 |
4,1 |
4,5 |
| 1999 |
388.602 |
198.168 |
586.770 |
4,7 |
4,1 |
4,5 |
| 2000 |
407.148 |
206.821 |
613.969 |
4,7 |
4,3 |
4,5 |
| 2001 |
427.316 |
216.048 |
643.364 |
4,8 |
4,4 |
4,7 |
| 2002 |
450.351 |
226.147 |
676.498 |
5,3 |
4,6 |
5,0 |
| 2003 |
476.513 |
237.346 |
713.859 |
5,6 |
4,8 |
5,4 |
| 2004 |
546.116 |
251.943 |
798.059 |
13,6 |
6,0 |
11,1 |
| 2005 |
637.070 |
269.053 |
906.123 |
15,4 |
6,6 |
12,7 |
| 2006 |
754.298 |
288.649 |
1.042.947 |
16,9 |
7,0 |
14,1 |
| 2007 |
905.747 |
312.503 |
1.218.250 |
18,3 |
7,9 |
15,5 |
| 2008 |
1.111.176 |
337.303 |
1.448.479 |
20,4 |
7,6 |
17,3 |
| 2009 |
1.265.146 |
373.480 |
1.638.626 |
13,0 |
10,2 |
12,3 |
| 2010 |
1.296.110 |
414.988 |
1.715.098 |
2,4 |
10,5 |
4,6 |
| 2011 |
1.288.590 |
444.127 |
1.732.717 |
-0,6 |
6,8 |
1,0 |
| 2012 |
1.355.199 |
477.704 |
1.832.903 |
5,0 |
7,3 |
5,6 |
| 2013 |
1.477.632 |
526.068 |
2.003.700 |
8,6 |
9,6 |
8,9 |
Source: QSA
ANNEXED NOTE
1. Characteristics of data and definitions
The table provides intercensal estimates of Qatar’s total resident population (nationals and non-nationals) based on census results (1986; 1997; 2004; 2010),
civil registration of births and deaths, and registration of entries and exits
2. Institution which provides data
Qatar Statistics Authority, Ministry of Development Planning and Statistics
3. Period of data coverage:
mid-year estimates, given years.
4. Data availability
The data is available in Statistical Yearbooks (Annual Abstracts), available online by thematic chapters.
The present data is published in the Annual Abstract 2014, Population chapter:
https://www.mdps.gov.qa/en/statistics/Statistical%20Releases/General/StatisticalAbstract/2014/population-chapters/1_Population_2014.xls
Date of access: June 2014.
| |
Qataris |
Non-Qataris |
Total |
|
Males |
Females |
Total |
Males |
Females |
Total |
Males |
Females |
Total |
| 2006 |
21.241 |
41.176 |
62.417 |
13.306 |
54.979 |
68.285 |
34.547 |
96.155 |
130.702 |
| 2007 |
22.410 |
42.604 |
65.014 |
16.387 |
63.704 |
80.091 |
38.797 |
106.308 |
145.105 |
| 2008 |
25.450 |
45.108 |
70.558 |
20.669 |
78.005 |
98.674 |
46.119 |
123.113 |
169.232 |
| 2009 |
27.202 |
46.814 |
74.016 |
19.784 |
83.417 |
103.201 |
46.986 |
130.231 |
177.217 |
| 2010* |
24.559 |
47.616 |
72.175 |
22.364 |
96.341 |
118.705 |
46.923 |
143.957 |
190.880 |
| 2011 |
28.675 |
52.857 |
81.532 |
21.332 |
92.446 |
113.778 |
50.007 |
145.303 |
195.310 |
| 2012 |
26.427 |
54.399 |
80.826 |
26.568 |
102.085 |
128.653 |
52.995 |
156.484 |
209.479 |
| 2013 |
26.302 |
58.802 |
85.104 |
27.282 |
114.623 |
141.905 |
53.584 |
173.425 |
227.009 |
Source: Labour Force Sample Surveys, 2006 to 2009 and 2011 to 2013; *: census 2010
ANNEXED NOTE
1. Technical Notes and Definitions
Census 2010:
Reference period for census 2010: the night of April 21st, 2010.
Implementation method: census is based on de jure method; i.e. registering people according to their usual place of residence at time of census.
Populations in transit or visiting Qatar as tourists, as well as residents of public housing or visitors staying in a household for less than two months after night of reference were excluded.
Populations away from usual residence in Qatar for reasons of duty, or on a visit abroad for less than two months, as well as individuals with no personal housing within Qatar staying with a household for more than two months, are counted in their usual/ present residence during census night.
Population of reference: all individuals (nationals and non-nationals) present within the State’s borders during time of reference, including in labour camps.
Labour force Sample Surveys:
The Statistics Authority conducted the first labor Force Sample Survey in 2001. Starting from 2006, the execution of these surveys came to be on annual basis. In 2013, the Survey was conducted on a quarterly basis.
| Labor Force |
Sampling |
Sample size |
Reference |
| Sample Surveys |
frame |
(households) |
individuals |
period |
| 2006 |
based on independent samples drawn from distinct frames of specially constructed PSUs |
5.492 |
31.439 |
March 2006 |
| 2007 |
nd |
5.492 |
31.439 |
October 2007 |
| 2008 |
nd |
6.104 |
nd |
December 2008 |
| 2009 |
nd |
6.109 |
35.839 |
October 2009 |
| 2011 |
nd |
6.920 |
35.839 |
March 2011 |
| 2012 |
Census 2010 |
6.895 |
37.629 |
April 2012 |
| 2013 |
Census 2010 |
c. 7000 |
n.d. |
Quarterly |
Reference period for the labor force data: the week prior to the reference date for data collection.
Population of reference: all Qatari and non-Qatari households of the following types: i. Qatari households; ii. Non-Qatari households; iii. Small labor gatherings; iv. Large labor gatherings, present in Qatar on the night of survey/ periods of reference
The collective households are a group of persons not related to each other and sharing living conditions in a residential unit, I.e. labor camps, students living boarding schools, nurses in hospitals… etc. The survey covered the small collective households (includes less than 7 persons) and large collective households (includes 7 persons or more).
The survey did not cover short periods accommodation, i.e. hotels.
Inactive population:
Full-time student: The person (15 years or older) enrolled in any educational institution as a full-time persistent student with purpose of attaining an academic degree, irrespective of whether the schooling hours are in the morning or evening. Any trainee enrolled in vocational training institutes is regarded as a full-time student.
Full-time housewife: The female (15 years or older) who is fully engaged in home management and family care, and does not practice any other work
Retired: The person who does not look for a job during the week preceding the survey and gets a fixed pension for work he/she had joined before
Disabled: The person (15 years or older) who is not capable of work due to illness, handicap or old age.
Others: Those able to work but not willing to, not enrolled in education, as well as any other cases encountered by the enumerator other than the above mentioned.
2. Institution which provides data
Qatar Statistics Authority (QSA)
(http://www.qsa.gov.qa/eng/index.htm for website in English; http://www.qsa.gov.qa/Ar/index.htm for website in Arabic)
3. Data availability
Labour Force Surveys and publications related to the labour force are available on QSA’s website, in PDF format and can be downloaded from:
http://www.qix.gov.qa/portal/page/portal/QIXPOC/Documents/QIX%20Knowledge%20Base/Publication/Labor%20Force%20Researches/labor%20force%20sample%20survey
Annual Bulletin of the Labour Force survey 2012 is available in PDf and Excel formats:
http://www.qix.gov.qa/portal/page/portal/QIXPOC/Documents/QIX%20Knowledge%20Base/Publication/Labor%20Force%20Researches/labor%20force%20sample%20survey/Source_QSA/Labour_Force_Statistics_QSA_Bu_AE_2012.pdf
https://www.mdps.gov.qa/en/statistics1/pages/topicslisting.aspx?parent=Social&child=LaborForce
Labour Force survey 2013 is available in Excel format as part of the Annual Abstract 2014:
https://www.mdps.gov.qa/en/statistics1/pages/topicslisting.aspx?parent=General&child=StatisticalAbstract
See also Qatar Information Exchange, an interactive data base compiling data on the labour force taken from available surveys:
http://www.qix.gov.qa/portal/page/portal/qix/subject_area/Statistics?subject_area=183
Last date of access: June 2014
|
|
Households |
|
|
Labour camps |
|
|
TOTAL |
|
|
males |
females |
total |
males |
females |
total |
males |
females |
total |
| Doha |
156.566 |
116.675 |
273.241 |
63.110 |
3.496 |
66.606 |
219.676 |
120.171 |
339.847 |
| Al Rayyan |
96.495 |
86.984 |
183.479 |
89.267 |
114 |
89.381 |
185.762 |
87.098 |
272.860 |
| Al Wakrah |
13.607 |
13.286 |
26.893 |
4.548 |
0 |
4.548 |
18.155 |
13.286 |
31.441 |
| Umm Slal |
14.325 |
13.488 |
27.813 |
3.792 |
0 |
3.792 |
18.117 |
13.488 |
31.605 |
| Al Khor |
8.434 |
6.228 |
14.662 |
16.885 |
0 |
16.885 |
25.319 |
6.228 |
31.547 |
| Al Shamal |
2.219 |
1.751 |
3.970 |
945 |
0 |
945 |
3.164 |
1.751 |
4.915 |
| Al-Ghuwairiah |
559 |
376 |
935 |
1.224 |
0 |
1.224 |
1.783 |
376 |
2.159 |
| Al-Jemailiah |
5.329 |
2.749 |
8.078 |
2.225 |
0 |
2.225 |
7.554 |
2.749 |
10.303 |
| Jarian Al-Bathna |
1.717 |
1.045 |
2.762 |
3.916 |
0 |
3.916 |
5.633 |
1.045 |
6.678 |
| Masaieed |
1.679 |
1.455 |
3.134 |
9.540 |
0 |
9.540 |
11.219 |
1.455 |
12.674 |
| Total |
300.930 |
244.037 |
544.967 |
195.452 |
3.610 |
199.062 |
496.382 |
247.647 |
744.029 |
source: census 2004, QSA.
ANNEXED NOTE
1. Technical Notes and Definitions
Reference periods for each census: 1970: unknown; the nights of March 16th, 1986; March 1st, 1997; March 16th, 2004 and April 21st, 2010 respectively.
Implementation method: censuses are based on de jure method; i.e. registering people according to their usual place of residence at time of census.
Populations in transit or visiting Qatar as tourists, as well as residents of public housing or visitors staying in a household for less than two months after night of reference were excluded.
Populations away from usual residence in Qatar for reasons of duty, or on a visit abroad for less than two months, as well as individuals with no personal housing within Qatar staying with a household for more than two months, are counted in their usual/ present residence during census night.
Population of reference: all individuals (nationals and non-nationals) present within the State’s borders during time of reference.
Prior to 2010′ census, only a sample of foreign residents was covered in census.
2. Institution which provides data
Qatar Statistics Authority (QSA), Ministry of Development Planning and Statistics
(http://www.qsa.gov.qa/eng/index.htm for website in English; http://www.qsa.gov.qa/Ar/index.htm for website in Arabic)
3. Data availability
Released parts of censuses (1986; 1997; 2004; 2010) are available on the website of the QSA, in published form in PDF format.
https://www.mdps.gov.qa/en/statistics1/pages/topicslisting.aspx?parent=General&child=Census
Date of access: 5 June 2014.
| |
|
Households |
|
|
Labour camps |
|
|
Public Housing |
|
|
TOTAL |
|
| |
males |
females |
total |
males |
females |
total |
males |
females |
total |
males |
females |
total |
| Doha |
115.622 |
90.937 |
206.559 |
53.792 |
812 |
54.604 |
925 |
347 |
1.272 |
170.339 |
92.096 |
262.435 |
| Al Rayyan |
69.772 |
59.059 |
128.831 |
39.315 |
15 |
39.330 |
1.451 |
112 |
1.563 |
110.538 |
59.186 |
169.724 |
| Al Wakrah |
10.934 |
9.935 |
20.869 |
3.414 |
0 |
3.414 |
0 |
0 |
0 |
14.348 |
9.935 |
24.283 |
| Umm Slal |
9.141 |
7.643 |
16.784 |
1.608 |
0 |
1.608 |
0 |
0 |
0 |
10.749 |
7.643 |
18.392 |
| Al Khor |
5.619 |
3.546 |
9.165 |
8.592 |
5 |
8.597 |
0 |
0 |
0 |
14.211 |
3.551 |
17.762 |
| Al Shamal |
2.239 |
1.458 |
3.697 |
362 |
0 |
362 |
0 |
0 |
0 |
2.601 |
1.458 |
4.059 |
| Al-Ghuwairiah |
1.071 |
315 |
1.386 |
330 |
0 |
330 |
0 |
0 |
0 |
1.401 |
315 |
1.716 |
| Al-Jemailiah |
4.120 |
2.317 |
6.437 |
3.370 |
0 |
3.370 |
16 |
13 |
29 |
7.506 |
2.330 |
9.836 |
| Jarian Al-Bathna |
1.551 |
896 |
2.447 |
2.001 |
0 |
2.001 |
0 |
0 |
0 |
3.552 |
896 |
4.448 |
| Masi’id |
2.369 |
2.024 |
4.393 |
3.158 |
0 |
3.158 |
0 |
0 |
0 |
5.527 |
2.024 |
7.551 |
| Total |
222.438 |
178.130 |
400.568 |
115.942 |
832 |
116.774 |
2.392 |
472 |
2.864 |
340.772 |
179.434 |
520.206 |
Source: census 1997, QSA
ANNEXED NOTE
1. Technical Notes and Definitions
Reference periods for each census: 1970: unknown; the nights of March 16th, 1986; March 1st, 1997; March 16th, 2004 and April 21st, 2010 respectively.
Implementation method: censuses are based on de jure method; i.e. registering people according to their usual place of residence at time of census.
Populations in transit or visiting Qatar as tourists, as well as residents of public housing or visitors staying in a household for less than two months after night of reference were excluded.
Populations away from usual residence in Qatar for reasons of duty, or on a visit abroad for less than two months, as well as individuals with no personal housing within Qatar staying with a household for more than two months, are counted in their usual/ present residence during census night.
Population of reference: all individuals (nationals and non-nationals) present within the State’s borders during time of reference.
Prior to 2010′ census, only a sample of foreign residents was covered in census.
2. Institution which provides data
Qatar Statistics Authority (QSA), Ministry of Development Planning and Statistics
(http://www.qsa.gov.qa/eng/index.htm for website in English; http://www.qsa.gov.qa/Ar/index.htm for website in Arabic)
3. Data availability
Released parts of censuses (1986; 1997; 2004; 2010) are available on the website of the QSA, in published form in PDF format.
https://www.mdps.gov.qa/en/statistics1/pages/topicslisting.aspx?parent=General&child=Census
Date of access: 5 June 2014.
|
Qataris |
Non-Qataris |
Total |
|
Males |
Females |
Total |
Males |
Females |
Total |
Males |
Females |
Total |
| Legislators, Senior Officials And Managers |
6,574 |
1,598 |
8,172 |
24,771 |
2,283 |
27,054 |
31,345 |
3,881 |
35,226 |
| Professionals |
10,383 |
13,846 |
24,229 |
81,379 |
22,919 |
104,298 |
91,762 |
36,765 |
128,527 |
| Technicians And Associate Professionals |
9,386 |
3,971 |
13,357 |
57,473 |
7,209 |
64,682 |
66,859 |
11,180 |
78,039 |
| Clerks |
13,991 |
7,033 |
21,024 |
39,966 |
7,992 |
47,958 |
53,957 |
15,025 |
68,982 |
| Service Workers And Shop And Market Sales Workers |
4,619 |
351 |
4,970 |
74,425 |
13,448 |
87,873 |
79,044 |
13,799 |
92,843 |
| Skilled Agricultural And Fishery Workers |
34 |
0 |
34 |
9,857 |
0 |
9,857 |
9,891 |
0 |
9,891 |
| Craft And Related Trades Workers |
4,619 |
0 |
4,619 |
467,065 |
81 |
467,146 |
471,684 |
81 |
471,765 |
| Plant And Machine Operators And Assemblers |
1,292 |
0 |
1,292 |
146,890 |
486 |
147,376 |
148,182 |
486 |
148,668 |
| Elementary Occupations |
4,843 |
273 |
5,116 |
215,906 |
86,230 |
302,136 |
220,749 |
86,503 |
307,252 |
| Total |
55,741 |
27,072 |
82,813 |
1,117,732 |
140,648 |
1,258,380 |
1,173,473 |
167,720 |
1,341,193 |
Source: Labour Force Bulletin 2012, Qatar Statistics Authority
ANNEXED NOTE
1. Technical Notes and Definitions
Sampling frame of LFB 2012: Population Census 2010.
Sample size: 6895 households and 37629 individuals from: 1- Qatari households; 2- Non-Qatari regular (non-collective) households; 3- Non-Qatari small collective households (2 – 6 persons); 4- Non-Qatari large collective households (7 persons or more).
Reference period for data collection: April 2012.
Reference period for the labor force data: the week prior to the reference period for data collection (April 2012).
Population of reference: all Qatari and non-Qatari households present in Qatar on the night of survey, living in normal and collective households.
The collective households are a group of persons not related to each other and sharing living conditions in a residential unit, I.e. labor camps, students living boarding schools, nurses in hospitals… etc. The survey covered the small collective households (includes less than 7 persons) and large collective households (includes 7 persons or more).
The survey did not cover short periods accommodation, i.e. hotels.
The table refers to the economically active population: People in the working age including employed and unemployed.
Employed population:
Persons aged 15 years an above, who during the week preceding the survey:
a) Perform a work for a wage, salary, profits or household gains, whether it was in cash or in kind.
b) Are temporarily not employed, however, they still have an official relation with their work
The table refers to employed workers (15 years or older) having worked no less than one hour during the week prior to data collection day in April 2012.
Unemployed population:
All persons aged 15 years and over who were, during the week preceding the survey, without work and were willing to work and looking seriously for work.
There is a distinction between two kinds of unemployed persons:
a) First time unemployed: They are the persons who never worked previously, and were during the week preceding the survey looking actively for work.
b)Unemployed who previously worked: They are the persons with previous experience work and during the week preceding the survey were actively looking for work.
The present table does not include the persons seeking work for the first time
Occupations are categorised according to ISCO 88 international classification of occupations (major (1-digit) group titles).
2. Institution which provides data
Qatar Statistics Authority (QSA)
(http://www.qsa.gov.qa/eng/index.htm for website in English; http://www.qsa.gov.qa/Ar/index.htm for website in Arabic)
3. Data availability
The Statistics Authority conducted the first labor Force Sample Survey in 2001. Starting from 2006, the execution of these surveys came to be on annual basis.
Most Labour Force Surveys and publications related to the labour force are available on QSA’s website, in PDF format and can be downloaded from:
https://www.mdps.gov.qa/en/statistics1/pages/topicslisting.aspx?parent=Social&child=LaborForce
Annual Bulletin of the Labour Force survey 2012 is available in PDf and Excel formats:
http://www.qix.gov.qa/portal/page/portal/QIXPOC/Documents/QIX%20Knowledge%20Base/Publication/Labor%20Force%20Researches/labor%20force%20sample%20survey/Source_QSA/Labour_Force_Statistics_QSA_Bu_AE_2012.pdf
https://www.mdps.gov.qa/en/statistics1/pages/topicslisting.aspx?parent=Social&child=LaborForce
See also Qatar Information Exchange, an interactive data base compiling data on the labour force taken from available surveys:
http://www.qix.gov.qa/portal/page/portal/qix/subject_area/Statistics?subject_area=183
Date of access: March 2014.
|
Qataris |
Non-Qataris |
Total |
|
Males |
Females |
Total |
Males |
Females |
Total |
Males |
Females |
Total |
| 15 – 19 |
2,995 |
533 |
3,528 |
10,147 |
10,942 |
21,089 |
13,142 |
11,475 |
24,617 |
| 20 – 24 |
7,451 |
4,081 |
11,532 |
122,559 |
22,456 |
145,015 |
130,010 |
26,537 |
156,547 |
| 25 – 29 |
8,849 |
5,539 |
14,388 |
222,761 |
29,304 |
252,065 |
231,610 |
34,843 |
266,453 |
| 30 – 34 |
9,108 |
5,504 |
14,612 |
227,912 |
25,429 |
253,341 |
237,020 |
30,933 |
267,953 |
| 35 – 39 |
6,956 |
4,244 |
11,200 |
181,225 |
16,735 |
197,960 |
188,181 |
20,979 |
209,160 |
| 40 – 44 |
7,050 |
3,388 |
10,438 |
149,192 |
14,221 |
163,413 |
156,242 |
17,609 |
173,851 |
| 45 – 49 |
5,166 |
2,252 |
7,418 |
95,589 |
8,729 |
104,318 |
100,755 |
10,981 |
111,736 |
| 50 – 54 |
4,411 |
1,008 |
5,419 |
60,488 |
6,312 |
66,800 |
64,899 |
7,320 |
72,219 |
| 55 – 59 |
2,181 |
396 |
2,577 |
30,132 |
2,976 |
33,108 |
32,313 |
3,372 |
35,685 |
| 60 – 64 |
917 |
83 |
1,000 |
10,085 |
1,661 |
11,746 |
11,002 |
1,744 |
12,746 |
| 65 + |
657 |
44 |
701 |
7,642 |
1,883 |
9,525 |
8,299 |
1,927 |
10,226 |
| Total |
55,741 |
27,072 |
82,813 |
1,117,732 |
140,648 |
1,258,380 |
1,173,473 |
167,720 |
1,341,193 |
Source: Labour Force Bulletin 2012, Qatar Statistics Authority
ANNEXED NOTE
1. Technical Notes and Definitions
Sampling frame of LFB 2012: Population Census 2010.
Sample size: 6895 households and 37629 individuals from: 1- Qatari households; 2- Non-Qatari regular (non-collective) households; 3- Non-Qatari small collective households (2 – 6 persons); 4- Non-Qatari large collective households (7 persons or more).
Reference period for data collection: April 2012.
Reference period for the labor force data: the week prior to the reference period for data collection (April 2012).
Population of reference: all Qatari and non-Qatari households present in Qatar on the night of survey, living in normal and collective households.
The collective households are a group of persons not related to each other and sharing living conditions in a residential unit, I.e. labor camps, students living boarding schools, nurses in hospitals… etc. The survey covered the small collective households (includes less than 7 persons) and large collective households (includes 7 persons or more).
The survey did not cover short periods accommodation, i.e. hotels.
The table refers to the economically active population: People in the working age including employed and unemployed.
Employed population:
Persons aged 15 years an above, who during the week preceding the survey:
a) Perform a work for a wage, salary, profits or household gains, whether it was in cash or in kind.
b) Are temporarily not employed, however, they still have an official relation with their work
The table refers to employed workers (15 years or older) having worked no less than one hour during the week prior to data collection day in April 2012.
Unemployed population:
All persons aged 15 years and over who were, during the week preceding the survey, without work and were willing to work and looking seriously for work.
There is a distinction between two kinds of unemployed persons:
a) First time unemployed: They are the persons who never worked previously, and were during the week preceding the survey looking actively for work.
b)Unemployed who previously worked: They are the persons with previous experience work and during the week preceding the survey were actively looking for work.
The present table does not include the persons seeking work for the first time
2. Institution which provides data
Qatar Statistics Authority (QSA)
(http://www.qsa.gov.qa/eng/index.htm for website in English; http://www.qsa.gov.qa/Ar/index.htm for website in Arabic)
3. Data availability
The Statistics Authority conducted the first labor Force Sample Survey in 2001. Starting from 2006, the execution of these surveys came to be on annual basis.
Most Labour Force Surveys and publications related to the labour force are available on QSA’s website, in PDF format and can be downloaded from:
https://www.mdps.gov.qa/en/statistics1/pages/topicslisting.aspx?parent=Social&child=LaborForce
Annual Bulletin of the Labour Force survey 2012 is available in PDf and Excel formats:
http://www.qix.gov.qa/portal/page/portal/QIXPOC/Documents/QIX%20Knowledge%20Base/Publication/Labor%20Force%20Researches/labor%20force%20sample%20survey/Source_QSA/Labour_Force_Statistics_QSA_Bu_AE_2012.pdf
https://www.mdps.gov.qa/en/statistics1/pages/topicslisting.aspx?parent=Social&child=LaborForce
https://www.mdps.gov.qa/en/statistics1/pages/topicslisting.aspx?parent=Social&child=LaborForce
See also Qatar Information Exchange, an interactive data base compiling data on the labour force taken from available surveys:
http://www.qix.gov.qa/portal/page/portal/qix/subject_area/Statistics?subject_area=183
Date of access: March 2014.
|
Qataris |
Non-Qataris |
Total |
|
Males |
Females |
Total |
Males |
Females |
Total |
Males |
Females |
Total |
| Agriculture, forestry and fishing |
26 |
0 |
26 |
18,081 |
55 |
18,136 |
18,107 |
55 |
18,162 |
| Mining and quarrying |
6,820 |
918 |
7,738 |
73,189 |
2,184 |
75,373 |
80,009 |
3,102 |
83,111 |
| Manufacturing |
807 |
111 |
918 |
101,308 |
580 |
101,888 |
102,115 |
691 |
102,806 |
| Electricity, gas, steam and air conditioning supply |
1,228 |
99 |
1,327 |
5,958 |
380 |
6,338 |
7,186 |
479 |
7,665 |
| Water supply; sewerage, waste management and remediation activities |
85 |
38 |
123 |
1,173 |
0 |
1,173 |
1,258 |
38 |
1,296 |
| Construction |
628 |
81 |
709 |
495,706 |
2,849 |
498,555 |
496,334 |
2,930 |
499,264 |
| Wholesale and retail trade; repair of motor vehicles and motorcycles |
1,083 |
368 |
1,451 |
162,753 |
5,155 |
167,908 |
163,836 |
5,523 |
169,359 |
| Transportation and storage |
1,356 |
110 |
1,466 |
31,581 |
5,228 |
36,809 |
32,937 |
5,338 |
38,275 |
| Accommodation and food service activities |
400 |
193 |
593 |
28,815 |
2,797 |
31,612 |
29,215 |
2,990 |
32,205 |
| Information and communication |
1,747 |
656 |
2,403 |
6,928 |
2,127 |
9,055 |
8,675 |
2,783 |
11,458 |
| Financial and insurance activities |
1,339 |
1,463 |
2,802 |
6,910 |
1,746 |
8,656 |
8,249 |
3,209 |
11,458 |
| Real estate activities |
583 |
86 |
669 |
8,382 |
283 |
8,665 |
8,965 |
369 |
9,334 |
| Professional, scientific and technical activities |
222 |
79 |
301 |
23,728 |
1,504 |
25,232 |
23,950 |
1,583 |
25,533 |
| Administrative and support service activities |
262 |
456 |
718 |
38,795 |
1,934 |
40,729 |
39,057 |
2,390 |
41,447 |
| Public administration and defence; compulsory social security |
35,974 |
9,489 |
45,463 |
31,761 |
4,316 |
36,077 |
67,735 |
13,805 |
81,540 |
| Education |
1,662 |
8,990 |
10,652 |
10,232 |
9,525 |
19,757 |
11,894 |
18,515 |
30,409 |
| Human health and social work activities |
1,119 |
3,397 |
4,516 |
10,595 |
8,399 |
18,994 |
11,714 |
11,796 |
23,510 |
| Arts, entertainment and recreation |
312 |
516 |
828 |
6,700 |
236 |
6,936 |
7,012 |
752 |
7,764 |
| Other service activities |
73 |
16 |
89 |
4,260 |
664 |
4,924 |
4,333 |
680 |
5,013 |
| Activities of households as employers; undifferentiated goods- and services-producing activities of households for own use |
0 |
0 |
0 |
49,543 |
90,361 |
139,904 |
49,543 |
90,361 |
139,904 |
| Activities of extraterritorial organizations and bodies |
15 |
6 |
21 |
1,334 |
325 |
1,659 |
1,349 |
331 |
1,680 |
| Total |
55,741 |
27,072 |
82,813 |
1,117,732 |
140,648 |
1,258,380 |
1,173,473 |
167,720 |
1,341,193 |
Source: Labour Force Bulletin 2012, Qatar Statistics Authority
ANNEXED NOTE
1. Technical Notes and Definitions
Sampling frame of LFB 2012: Population Census 2010.
Sample size: 6895 households and 37629 individuals from: 1- Qatari households; 2- Non-Qatari regular (non-collective) households; 3- Non-Qatari small collective households (2 – 6 persons); 4- Non-Qatari large collective households (7 persons or more).
Reference period for data collection: April 2012.
Reference period for the labor force data: the week prior to the reference period for data collection (April 2012).
Population of reference: all Qatari and non-Qatari households present in Qatar on the night of survey, living in normal and collective households.
The collective households are a group of persons not related to each other and sharing living conditions in a residential unit, I.e. labor camps, students living boarding schools, nurses in hospitals… etc. The survey covered the small collective households (includes less than 7 persons) and large collective households (includes 7 persons or more).
The survey did not cover short periods accommodation, i.e. hotels.
The table refers to the economically active population: People in the working age including employed and unemployed.
Employed population:
Persons aged 15 years an above, who during the week preceding the survey:
a) Perform a work for a wage, salary, profits or household gains, whether it was in cash or in kind.
b) Are temporarily not employed, however, they still have an official relation with their work
The table refers to employed workers (15 years or older) having worked no less than one hour during the week prior to data collection day in April 2012.
Unemployed population:
All persons aged 15 years and over who were, during the week preceding the survey, without work and were willing to work and looking seriously for work.
There is a distinction between two kinds of unemployed persons:
a) First time unemployed: They are the persons who never worked previously, and were during the week preceding the survey looking actively for work.
b)Unemployed who previously worked: They are the persons with previous experience work and during the week preceding the survey were actively looking for work.
The present table does not include the persons seeking work for the first time
Economic activities are categorised according to ISIC( Rev. 4) international classification of industries.
2. Institution which provides data
Qatar Statistics Authority (QSA)
https://www.mdps.gov.qa/en/Pages/default.aspx for website in English; https://www.mdps.gov.qa/ar/pages/default.aspx for website in Arabic)
3. Data availability
The Statistics Authority conducted the first labor Force Sample Survey in 2001. Starting from 2006, the execution of these surveys came to be on annual basis.
Most Labour Force Surveys and publications related to the labour force are available on QSA’s website, in PDF format and can be downloaded from:
https://www.mdps.gov.qa/en/statistics1/pages/topicslisting.aspx?parent=Social&child=LaborForce
Annual Bulletin of the Labour Force survey 2012 is available in PDf and Excel formats:
http://www.qix.gov.qa/portal/page/portal/QIXPOC/Documents/QIX%20Knowledge%20Base/Publication/Labor%20Force%20Researches/labor%20force%20sample%20survey/Source_QSA/Labour_Force_Statistics_QSA_Bu_AE_2012.pdf
https://www.mdps.gov.qa/en/statistics1/pages/topicslisting.aspx?parent=Social&child=LaborForce
See also Qatar Information Exchange, an interactive data base compiling data on the labour force taken from available surveys:
http://www.qix.gov.qa/portal/page/portal/qix/subject_area/Statistics?subject_area=183
Date of access: March 2014.
|
Qataris |
Non-Qataris |
Total |
|
Males |
Females |
Total |
Males |
Females |
Total |
Males |
Females |
Total |
| Illiterate |
267 |
36 |
303 |
36,067 |
4,371 |
40,438 |
36,334 |
4,407 |
40,741 |
| Read & Write |
1,919 |
618 |
2,537 |
276,152 |
11,551 |
287,703 |
278,071 |
12,169 |
290,240 |
| Primary |
3,622 |
370 |
3,992 |
169,677 |
25,862 |
195,539 |
173,299 |
26,232 |
199,531 |
| Preparatory |
9,097 |
987 |
10,084 |
235,614 |
39,329 |
274,943 |
244,711 |
40,316 |
285,027 |
| Secondary |
18,854 |
6,833 |
25,687 |
169,808 |
19,314 |
189,122 |
188,662 |
26,147 |
214,809 |
| Pre U. Diploma |
1,835 |
627 |
2,462 |
53,465 |
3,701 |
57,166 |
55,300 |
4,328 |
59,628 |
| University |
17,703 |
16,491 |
34,194 |
159,759 |
33,439 |
193,198 |
177,462 |
49,930 |
227,392 |
| Higher Diploma |
613 |
384 |
997 |
5,483 |
770 |
6,253 |
6,096 |
1,154 |
7,250 |
| M.A / M.Sc. |
1,371 |
488 |
1,859 |
8,772 |
1,764 |
10,536 |
10,143 |
2,252 |
12,395 |
| Ph.D. |
460 |
238 |
698 |
2,935 |
547 |
2,739 |
3,395 |
785 |
4,180 |
| Total |
55,741 |
27,072 |
82,813 |
1,117,732 |
140,648 |
1,257,637 |
1,173,473 |
167,720 |
1,341,193 |
Source: Labour Force Bulletin 2012, Qatar Statistics Authority
ANNEXED NOTE
1. Technical Notes and Definitions
Sampling frame of LFB 2012: Population Census 2010.
Sample size: 6895 households and 37629 individuals from: 1- Qatari households; 2- Non-Qatari regular (non-collective) households; 3- Non-Qatari small collective households (2 – 6 persons); 4- Non-Qatari large collective households (7 persons or more).
Reference period for data collection: April 2012.
Reference period for the labor force data: the week prior to the reference period for data collection (April 2012).
Population of reference: all Qatari and non-Qatari households present in Qatar on the night of survey, living in normal and collective households.
The collective households are a group of persons not related to each other and sharing living conditions in a residential unit, I.e. labor camps, students living boarding schools, nurses in hospitals… etc. The survey covered the small collective households (includes less than 7 persons) and large collective households (includes 7 persons or more).
The survey did not cover short periods accommodation, i.e. hotels.
The table refers to the economically active population: People in the working age including employed and unemployed.
Employed population:
Persons aged 15 years an above, who during the week preceding the survey:
a) Perform a work for a wage, salary, profits or household gains, whether it was in cash or in kind.
b) Are temporarily not employed, however, they still have an official relation with their work
The table refers to employed workers (15 years or older) having worked no less than one hour during the week prior to data collection day in April 2012.
Unemployed population:
All persons aged 15 years and over who were, during the week preceding the survey, without work and were willing to work and looking seriously for work.
There is a distinction between two kinds of unemployed persons:
a) First time unemployed: They are the persons who never worked previously, and were during the week preceding the survey looking actively for work.
b)Unemployed who previously worked: They are the persons with previous experience work and during the week preceding the survey were actively looking for work.
The present table does not include the persons seeking work for the first time
2. Institution which provides data
Qatar Statistics Authority (QSA)
(https://www.mdps.gov.qa/en/Pages/default.aspx for website in English; https://www.mdps.gov.qa/ar/pages/default.aspx for website in Arabic)
3. Data availability
The Statistics Authority conducted the first labor Force Sample Survey in 2001. Starting from 2006, the execution of these surveys came to be on annual basis.
Most Labour Force Surveys and publications related to the labour force are available on QSA’s website, in PDF format and can be downloaded from:
https://www.mdps.gov.qa/en/statistics1/pages/topicslisting.aspx?parent=Social&child=LaborForce
Annual Bulletin of the Labour Force survey 2012 is available in PDf and Excel formats:
http://www.qix.gov.qa/portal/page/portal/QIXPOC/Documents/QIX%20Knowledge%20Base/Publication/Labor%20Force%20Researches/labor%20force%20sample%20survey/Source_QSA/Labour_Force_Statistics_QSA_Bu_AE_2012.pdf
https://www.mdps.gov.qa/en/statistics1/pages/topicslisting.aspx?parent=Social&child=LaborForce
See also Qatar Information Exchange, an interactive data base compiling data on the labour force taken from available surveys:
http://www.qix.gov.qa/portal/page/portal/qix/subject_area/Statistics?subject_area=183
Date of access: March 2014.
|
Workers |
Family dependants |
Total |
| India |
452,578 |
92,224 |
544,802 |
| Philippines |
165,447 |
19,201 |
184,648 |
| Nepal |
339,901 |
778 |
340,679 |
| Bangladesh |
130,630 |
6,615 |
137,245 |
Source: NHRC
1. Data collection methodology
The figures were released during a press conference held October 1, 2013, between NHRC and official representatives of the Nepalese community residing in Qatar.
The press conference followed the publication by the Guardian Newspaper, of reports of fatal work accidents for Nepalese construction workers employed
in the building of 2022′ World Cup facilities.
The figures presented here were quoted in the press. Writers stated they were originally retrieved from a report by Qatar’s National Human Rights Committee (which could not be found).
2. Data availability
The figures have been published in the press:
In Arabic: Al Raya newspaper http://www.raya.com/news/locals (October 1, 2013, p.20)
In English: http://www.arabianbusiness.com/qatar-s-population-exceeds-2m-521314.html (English)
|
QATARIS |
NON-QATARIS |
TOTAL |
|
Males |
Females |
Total |
Males |
Females |
Total |
Males |
Females |
Total |
| 15 – 24 |
28,943 |
28,505 |
57,448 |
217,747 |
51,387 |
269,134 |
246,690 |
79,892 |
326,582 |
| 25 – 34 |
23,526 |
21,191 |
44,717 |
469,082 |
106,416 |
575,498 |
492,608 |
127,607 |
620,215 |
| 35 – 44 |
14,773 |
15,033 |
29,806 |
358,276 |
71,727 |
430,003 |
373,049 |
86,760 |
459,809 |
| 45 – 54 |
10,834 |
13,082 |
23,916 |
187,066 |
27,045 |
214,111 |
197,900 |
40,127 |
238,027 |
| 55 + |
11,518 |
11,801 |
23,319 |
81,430 |
8,849 |
90,279 |
92,948 |
20,650 |
113,598 |
| Total |
89,594 |
89,612 |
179,206 |
1,313,601 |
265,424 |
1,579,025 |
1,403,195 |
355,036 |
1,758,231 |
Source: Quarterly Labour Force Survey, Q4 2013
ANNEXED NOTE
1. Technical Notes and Definitions
Sampling frame of Quarterly LFS 2013: Population Census 2010.
Sample size for the whole year: about 7000 households from: 1- Qatari households; 2- Non-Qatari regular (non-collective) households; 3- Non-Qatari small collective households (2 – 6 persons); 4- Non-Qatari large collective households (7 persons or more).
One fourth of the sample was covered every quarter; each month one third of the quarterly data was collected.
Reference period for data collection: October-December 2013.
Population of reference: all Qatari and non-Qatari households present in Qatar on the night of survey, living in normal and collective households.
The collective households are a group of persons not related to each other and sharing living conditions in a residential unit, I.e. labor camps, students living boarding schools, nurses in hospitals… etc. The survey covered the small collective households (includes less than 7 persons) and large collective households (includes 7 persons or more).
The survey did not cover short periods accommodation, i.e. hotels.
2. Institution which provides data
Qatar Statistics Authority (QSA), Ministry of Development Planning and Statistics
http://www.qsa.gov.qa/eng/index.htm for website in English; http://www.qsa.gov.qa/Ar/index.htm for website in Arabic)
3. Data availability
The Statistics Authority conducted the first labor Force Sample Survey in 2001. Starting from 2006, the execution of these surveys came to be on annual basis.
Most Labour Force Surveys and publications related to the labour force are available on QSA’s website, in PDF format and can be downloaded from:
https://www.mdps.gov.qa/en/statistics1/pages/topicslisting.aspx?parent=Social&child=LaborForce
Quarterly Labour Force survey for Q4 2013 is available in Excel format:
http://www.qsa.gov.qa/eng/publication/annabs/2013/Quarterly%20LFS%20web%20report4ndqtr2013-Eng.xls
See also Qatar Information Exchange, an interactive data base compiling data on the labour force taken from available surveys:
http://www.qix.gov.qa/portal/page/portal/qix/subject_area/Statistics?subject_area=183
Date of access: April 2014.
| year |
Saudis |
Non-Saudis |
Total |
| 1974 |
6.163.805 |
774.397 |
6.938.202 |
| 1975 |
6.429.179 |
857.831 |
7.287.010 |
| 1976 |
6.703.441 |
949.911 |
7.653.352 |
| 1977 |
6.986.636 |
1.051.478 |
8.038.114 |
| 1978 |
7.278.777 |
1.163.442 |
8.442.219 |
| 1979 |
7.579.846 |
1.286.793 |
8.866.639 |
| 1980 |
7.889.794 |
1.422.602 |
9.312.396 |
| 1981 |
8.208.534 |
1.572.028 |
9.780.562 |
| 1982 |
8.535.941 |
1.736.324 |
10.272.265 |
| 1983 |
8.871.851 |
1.916.839 |
10.788.690 |
| 1984 |
9.216.049 |
2.115.025 |
11.331.074 |
| 1985 |
9.568.281 |
2.332.446 |
11.900.727 |
| 1986 |
9.928.242 |
2.570.776 |
12.499.018 |
| 1987 |
10.295.578 |
2.831.810 |
13.127.388 |
| 1988 |
10.669.880 |
3.117.467 |
13.787.347 |
| 1989 |
11.050.692 |
3.429.794 |
14.480.486 |
| 1990 |
11.437.500 |
3.770.971 |
15.208.471 |
| 1991 |
11.829.739 |
4.143.316 |
15.973.055 |
| 1992 |
12.218.200 |
4.540.179 |
16.758.379 |
| 1993 |
12.551.696 |
4.725.476 |
17.277.172 |
| 1994 |
12.863.710 |
4.837.899 |
17.701.609 |
| 1995 |
13.183.469 |
4.953.006 |
18.136.475 |
| 1996 |
13.511.162 |
5.070.860 |
18.582.022 |
| 1997 |
13.846.988 |
5.191.528 |
19.038.516 |
| 1998 |
14.191.149 |
5.315.076 |
19.506.225 |
| 1999 |
14.543.849 |
5.441.575 |
19.985.424 |
| 2000 |
14.905.300 |
5.571.093 |
20.476.393 |
| 2001 |
15.275.721 |
5.703.704 |
20.979.425 |
| 2002 |
15.655.332 |
5.839.481 |
21.494.813 |
| 2003 |
16.044.362 |
5.978.502 |
22.022.864 |
| 2004 |
16.443.987 |
6.119.899 |
22.563.886 |
| 2005 |
16.854.157 |
6.475.427 |
23.329.584 |
| 2006 |
17.270.181 |
6.851.709 |
24.121.890 |
| 2007 |
17.691.336 |
7.249.962 |
24.941.298 |
| 2008 |
18.115.550 |
7.671.475 |
25.787.025 |
| 2009 |
18.543.246 |
8.117.611 |
26.660.857 |
| 2010* |
18.973.615 |
8.589.817 |
27.563.432 |
| 2011** |
19.405.685 |
8.970.670 |
28.376.355 |
| 2012** |
19.838.448 |
9.357.447 |
29.195.895 |
| 2013** |
20.271.058 |
9.723.214 |
29.994.272 |
Source: Population estimates based on the results of population censuses (1974; 1992; 2004; 2010 preliminary results), Central Department for Statistics and Information (CDSI)
* preliminary results
** estimates from census 2010′ preliminary figures
ANNEXED NOTE
1. Technical Notes and Definitions
Reference periods: middle of given years
Population of reference: all individuals (nationals and non-nationals) present within the Kingdom’s borders during time of reference, be they permanent or temporary residents.
Implementation method: the Censuses are carried out according to de facto methodology, i.e. counting persons where they are during time of reference, be they usual residents of the place or temporary residents.
Estimates are based upon censuses’ results.
The first Saudi census was launched in 1962. It is usually not used, as it did not cover the whole of the resident population. 1974 census is the first comprehensive one in Saudi history. However, its rate of coverage and accuracy of data are considered weak.
1992 census’ population figures, along with ensuing estimates of Saudi population and rates of demographic growth for the following years, were shown to be inflated (see Winckler, O. “The Surprising Results of the Saudi Arabian 2004 Demographic Census”, IJMES, n°40, 2008, pp. 12-15).
Between 2004 and 2010 censuses, Saudi population figures seem consistent with natural increase figures. As non-national population is concerned, it is probably underestimated in official counts. Irregular workers and sojourners are also many (non-official, hence unverifiable estimates range between 1 and 2 millions).
Regarding mid-year estimates, it has to be noted that after each census CDSI has readjusted past figures for Saudi and non-Saudi populations, intercensal data as well as data for census years. Therefore, present data differ significantly from available census figures.
2. Institution which provides data
Central Department of Statistics and Information (CDSI), Ministry and Economy and Planning
3. Data availability
Parts of censuses conducted in 1992 and 2004 are available on the website of the CDSI (https://www.stats.gov.sa/en), in published form in PDF format.
https://www.stats.gov.sa/en/13
https://www.stats.gov.sa/ar/13
For 1992 all published data is broken down by nationality (Saudi/non-Saudi). For 2004, only the data on sex and administrative regions and sub-regions of residence is broken down by nationality (Saudi/ Non-Saudi).
As of November 25th, 2013, only preliminary results of 2010′ census have been published: total population by sex and nationality (Saudi/ non-Saudi), as well as total population by nationality, sex, and administrative region (governorate) of residence.
CDSI’s mid-year estimates of population by nationality (Saudi / non-Saudi) are only available in Saudi Arabia Monetary Agency (SAMA) Annual Reports, available online at: http://www.sama.gov.sa/en-us/Pages/default.aspx.
Data presented here are taken from SAMA Annual Report n°48 (2013), p. 361 (estimates for 1974-2012) and from CDSI at https://www.stats.gov.sa/en/indicators (2013 estimates).
Date of access: November 25th, 2013.
|
2011/2012 |
|
Males |
Females |
Total |
| Saudi Arabia |
2 |
1 |
3 |
| United Arab Emirates |
0 |
3 |
3 |
| Kuwait |
0 |
2 |
2 |
| Egypt |
0 |
0 |
0 |
| Jordan |
0 |
0 |
0 |
| Lebanon |
0 |
0 |
0 |
| Sudan |
0 |
1 |
1 |
| Malaysia |
0 |
0 |
0 |
| Singapore |
0 |
0 |
0 |
| United Kingdom |
70 |
40 |
110 |
| France |
15 |
1 |
16 |
| Germany |
1 |
3 |
4 |
| Italy |
0 |
0 |
0 |
| Ireland |
1 |
0 |
1 |
| Spain |
0 |
0 |
0 |
| Japan |
2 |
0 |
2 |
| United States |
200 |
24 |
224 |
| Canada |
1 |
0 |
1 |
| Australia |
2 |
0 |
2 |
| Other |
1 |
0 |
1 |
| TOTAL |
295 |
75 |
370 |
Source: Qatar Foundation, Supreme Council for Education, Universities
ANNEXED NOTE
Students on scholarship are sponsored by the State of Qatar or by another body. The figures presented here do not take into account Qatar students abroad, living on their own expense, if any.
Institution which provides data
Qatar Statistics Authority, Ministry of Development Planning and Statistics
Data availability
These data on education have been found in the “Education” chapter of 2013’s Annual Statistics.
https://www.mdps.gov.qa/en/statistics/Statistical%20Releases/General/StatisticalAbstract/2013/population-chapters/5_Trainning_2013.pdf
QSA publishes Statistical Yearbooks available online, in Excel (certain thematic chapters since 2011) and PDF format, up to 1971’s issue. Most recent issues (2012 and 2013) are published by thematic chapters, released separately in QSA’s “latest releases”.
Issues 1971 to 2011 are available on the Qatar Information Exchange website, accessible from QSA’ website (English and Arabic website)
https://www.mdps.gov.qa/en/statistics1/pages/topicslisting.aspx?parent=General&child=StatisticalAbstract
Last date of access: April 29th, 2014
| Country of citizenship |
Males |
Females |
Total |
| Qatar |
1,208 |
5,627 |
6,835 |
| U.A.E. |
1 |
31 |
32 |
| Bahrain |
36 |
131 |
167 |
| Kuwait |
3 |
15 |
18 |
| Saudi Arabia |
42 |
143 |
185 |
| Oman |
38 |
129 |
167 |
| Gulf Countries |
1,328 |
6,076 |
7,404 |
| Iraq |
39 |
62 |
101 |
| Yemen |
124 |
339 |
463 |
| Palestine |
192 |
400 |
592 |
| Jordan |
153 |
309 |
462 |
| Egypt |
239 |
300 |
539 |
| Syria |
80 |
124 |
204 |
| Lebanon |
15 |
49 |
64 |
| Sudan |
105 |
222 |
327 |
| Somalia |
38 |
50 |
88 |
| Tunisia |
18 |
45 |
63 |
| Algeria |
16 |
38 |
54 |
| Mauritania |
19 |
22 |
41 |
| Other Arab countries |
0 |
0 |
0 |
| Arab Countries |
1,038 |
1,960 |
2,998 |
| United States |
16 |
41 |
57 |
| United Kingdom |
2 |
12 |
14 |
| Canada |
3 |
25 |
28 |
| Iran |
77 |
176 |
253 |
| Pakistan |
47 |
89 |
136 |
| India |
26 |
37 |
63 |
| Other |
174 |
179 |
353 |
| Other Countries |
345 |
559 |
904 |
| Total |
2,711 |
8,595 |
11,306 |
Source: Universities
ANNEXED NOTE
The table refers to the students in Qatar University and Community College
Institution which provides data
Qatar Statistics Authority, Ministry of Development Planning and Statistics
Data availability
These data on education have been found in the “Education” chapter of 2013’s Annual Statistics.
http://www.qsa.gov.qa/eng/publication/annabs/2013/Education2012.xlsx
QSA publishes Statistical Yearbooks available online, in Excel (certain thematic chapters since 2011) and PDF format, up to 1971’s issue. Most recent issues (2012 and 2013) are published by thematic chapters, released separately in QSA’s “latest releases”.
Issues 1971 to 2011 are available on the Qatar Information Exchange website, accessible from QSA’ website (English and Arabic website)
https://www.mdps.gov.qa/en/statistics1/pages/topicslisting.aspx?parent=General&child=StatisticalAbstract
Last date of access: April 29th, 2014
| |
|
Lawyers working |
Lawyers under training |
| |
|
Males |
Females |
Total |
Males |
Females |
Total |
| 2010 |
Qataris |
94 |
13 |
107 |
5 |
5 |
10 |
| G.C.C |
2 |
2 |
4 |
0 |
0 |
0 |
| Other Arabs |
43 |
0 |
43 |
0 |
0 |
0 |
| Foreign |
12 |
1 |
13 |
0 |
0 |
0 |
| Total |
151 |
16 |
167 |
5 |
5 |
10 |
| 2011 |
Qataris |
102 |
15 |
117 |
5 |
2 |
7 |
| G.C.C |
2 |
2 |
4 |
1 |
0 |
1 |
| Other Arabs |
43 |
0 |
43 |
0 |
0 |
0 |
| Foreign |
12 |
1 |
13 |
0 |
0 |
0 |
| Total |
159 |
18 |
177 |
6 |
2 |
8 |
| 2012 |
Qataris |
103 |
17 |
120 |
7 |
1 |
8 |
| G.C.C |
3 |
2 |
5 |
0 |
0 |
0 |
| Other Arabs |
68 |
0 |
68 |
0 |
0 |
0 |
| Foreign |
12 |
1 |
13 |
0 |
0 |
0 |
| Total |
186 |
20 |
206 |
7 |
1 |
8 |
Source: the Attorney Plenary
ANNEXED NOTE
Institution which provides data
Qatar Statistics Authority, Ministry of Development Planning and Statistics
Data availability
These data have been found in Chapter 7 (Judicial and Security Services) of 2013′ Annual Abstract
https://www.mdps.gov.qa/en/statistics/Statistical%20Releases/General/StatisticalAbstract/2012/population-chapters/7_Security_2012.xlsx
QSA publishes Statistical Yearbooks available online, in Excel (certain thematic chapters since 2011) and PDF format, up to 1971’s issue. Most recent issues (2012 and 2013) are published by thematic chapters, released separately in QSA’s “latest releases”.
Issues 1971 to 2011 are available on the Qatar Information Exchange website, accessible from QSA’ website (English and Arabic website)
https://www.mdps.gov.qa/en/statistics1/pages/topicslisting.aspx?parent=General&child=StatisticalAbstract
Last date of access: April 29th, 2014
| |
Professor |
Associate Professor |
Assistant Professor |
Lecturer |
Teaching Assistant |
Total |
| |
Males |
Females |
Males |
Females |
Males |
Females |
Males |
Females |
Males |
Females |
Males |
Females |
Grand Total |
| Qatar |
5 |
8 |
21 |
26 |
36 |
27 |
10 |
19 |
6 |
39 |
78 |
119 |
197 |
| Iraq |
1 |
0 |
1 |
0 |
0 |
0 |
9 |
0 |
0 |
0 |
11 |
0 |
11 |
| Jordan |
3 |
1 |
14 |
1 |
2 |
0 |
3 |
0 |
3 |
10 |
25 |
12 |
37 |
| Palestine |
0 |
0 |
0 |
0 |
1 |
0 |
0 |
1 |
3 |
3 |
4 |
4 |
8 |
| Syria |
0 |
0 |
0 |
0 |
4 |
0 |
3 |
2 |
5 |
2 |
12 |
4 |
16 |
| Egypt |
10 |
0 |
17 |
3 |
18 |
3 |
4 |
3 |
4 |
2 |
53 |
11 |
64 |
| Sudan |
1 |
0 |
2 |
0 |
0 |
0 |
6 |
2 |
1 |
1 |
10 |
3 |
13 |
| U.K. |
2 |
0 |
4 |
1 |
5 |
0 |
17 |
8 |
0 |
2 |
28 |
11 |
39 |
| U.S.A. |
7 |
2 |
12 |
6 |
12 |
8 |
50 |
56 |
3 |
3 |
84 |
75 |
159 |
| Canada |
2 |
0 |
8 |
0 |
12 |
2 |
15 |
6 |
1 |
1 |
38 |
9 |
47 |
| Others |
14 |
0 |
17 |
1 |
39 |
12 |
30 |
22 |
11 |
19 |
111 |
54 |
165 |
| Total |
45 |
11 |
96 |
38 |
129 |
52 |
147 |
119 |
37 |
82 |
454 |
302 |
756 |
Source: Supreme Education Council, Public Universities
The table does not include administrative staff.
“Public Universities” includes Qatar University and Community College
ANNEXED NOTE
Institution which provides data
Qatar Statistics Authority, Ministry of Development Planning and Statistics
Data availability
These data on education have been found in the “Education” chapter of 2013’s Annual Statistics.
http://www.qsa.gov.qa/eng/publication/annabs/2013/Education2012.xlsx
QSA publishes Statistical Yearbooks available online, in Excel (certain thematic chapters since 2011) and PDF format, up to 1971’s issue. Most recent issues (2012 and 2013) are published by thematic chapters, released separately in QSA’s “latest releases”.
Issues 1971 to 2011 are available on the Qatar Information Exchange website, accessible from QSA’ website (English and Arabic website)
https://www.mdps.gov.qa/en/statistics1/pages/topicslisting.aspx?parent=General&child=StatisticalAbstract
https://www.mdps.gov.qa/en/statistics1/pages/topicslisting.aspx?parent=General&child=StatisticalAbstract
| Nationality |
Kuwaitis |
Non-Kuwaitis |
Total |
| |
Males |
Females |
Total |
Males |
Females |
Total |
Males |
Females |
Total |
| 15-19 |
199 |
206 |
405 |
782 |
606 |
1.388 |
981 |
812 |
1.793 |
| 20-24 |
818 |
733 |
1.551 |
586 |
1.294 |
1.880 |
1.404 |
2.027 |
3.431 |
| 25-29 |
1.484 |
1.660 |
3.144 |
2.379 |
3.850 |
6.229 |
3.863 |
5.510 |
9.373 |
| 30-34 |
714 |
1.782 |
2.496 |
4.247 |
3.674 |
7.921 |
4.961 |
5.456 |
10.417 |
| 35-39 |
336 |
801 |
1.137 |
3.077 |
2.182 |
5.259 |
3.413 |
2.983 |
6.396 |
| 40-44 |
336 |
380 |
716 |
2.312 |
1.485 |
3.797 |
2.648 |
1.865 |
4.513 |
| 45-49 |
295 |
246 |
541 |
1.057 |
957 |
2.014 |
1.352 |
1.203 |
2.555 |
| 50-54 |
243 |
207 |
450 |
452 |
512 |
964 |
695 |
719 |
1.414 |
| 55-59 |
170 |
233 |
403 |
253 |
263 |
516 |
423 |
496 |
919 |
| 60-64 |
110 |
233 |
343 |
138 |
122 |
260 |
248 |
355 |
603 |
| >65 |
305 |
40 |
345 |
453 |
261 |
714 |
758 |
301 |
1.059 |
| Total |
5.010 |
6.521 |
11.531 |
15.736 |
15.206 |
30.942 |
20.746 |
21.727 |
42.473 |
Source: PACI
ANNEXED NOTE
1. Characteristics of data and definitions
The source of data used here is the Public Authority for Civil Information (PACI), an independant government body in charge of :
1- centralising all population and labour force data in order to manage a fully computerised population register
2- issuing mandatory civil identification cards to every resident of the country, regardless of age and nationality.
The other source of demographic and socioeconomic data on Kuwait is the Central Statistical Office (CSO), operating within the Planning Ministry. The CSO has conducted ten population and housing censuses since its inception in 1957.
Since 1995 a marked discrepancy was witnessed between PACI’ and CSO’ population figures. PACI’ database is connected electronically with other administrations and bodies registering demographic events and professional/ residency issues (births and death; departures and arrivals; end of service, residency and ID deliveries, etc.).
PACI’s records of residents’ movements is thus regularly updated, which limits the risk of population overcount. Therefore, it is more likely that residents were undercounted during CSO- Ministry of Planning’s census operations (see: Shah, N. Population of Kuwait. Structure and Dynamics, Kuwait: Kuwait University Academic Publication Council, 2010, chapter 1).
(a) Kuwaiti: the Kuwaiti nationality rests upon a document of Kuwaiti nationality or a certificate proving Kuwaiti nationality issued by the Ministry of Interior of Kuwait.
(b) Non-Kuwaiti: his/ her nationality is determined by the name of the State having issued the passport. The foreign national also entered Kuwait legally and has a stamp of residence.
This category includes the Bidoon, a category of stateless persons living in the Emirate. Kuwait’s Bidoon population originates from three broad categories:
1) those whose ancestors failed to apply for nationality or lacked necessary documentation at the time of Kuwait’s independence in 1961;
2) those recruited to work in Kuwait’s army or police force during the 1960s who permanently settled in Kuwait, along with their families;
3) children of Kuwaiti mothers and stateless or foreign fathers (see Human Rights Watch. Prisoners of the Past. Kuwaiti Bidun and the Burden of Statelessness, June 2011, p. 3).
(c) Unemployed population: population aged 15 years and over, able to work, looking for employment and unable to find one.
2. Institution which provides data
The Public Authority for Civil Information (PACI)
3. Period of data coverage: December 2013
The database is updated three times a year and the website presents only the most recent data.
4. Data availability
The statistics section of PACI’s website (http://www.paci.gov.kw/en/ (English); http://www.paci.gov.kw/ (Arabic)) provides population and socio-economic data broken down by nationality (Kuwaiti/ non-Kuwaiti). Some data are displayed by nationality groups.
Analytical tables and data crosstabulations are available for download in PDF, html, .png and Excel (.csv) formats.
Date of access: March 2014.
| |
Kuwaitis |
Non-Kuwaitis |
Total |
| males |
5.010 |
15.736 |
20.746 |
| females |
6.521 |
15.206 |
21.727 |
| total |
11.531 |
30.942 |
42.473 |
Source: PACI
ANNEXED NOTE
1. Characteristics of data and definitions
The source of data used here is the Public Authority for Civil Information (PACI), an independant government body in charge of :
1- centralising all population and labour force data in order to manage a fully computerised population register
2- issuing mandatory civil identification cards to every resident of the country, regardless of age and nationality.
The other source of demographic and socioeconomic data on Kuwait is the Central Statistical Office (CSO), operating within the Planning Ministry. The CSO has conducted ten population and housing censuses since its inception in 1957.
Since 1995 a marked discrepancy was witnessed between PACI’ and CSO’ population figures. PACI’ database is connected electronically with other administrations and bodies registering demographic events and professional/ residency issues (births and death; departures and arrivals; end of service, residency and ID deliveries, etc.).
PACI’s records of residents’ movements is thus regularly updated, which limits the risk of population overcount. Therefore, it is more likely that residents were undercounted during CSO- Ministry of Planning’s census operations (see: Shah, N. Population of Kuwait. Structure and Dynamics, Kuwait: Kuwait University Academic Publication Council, 2010, chapter 1).
(a) Kuwaiti: the Kuwaiti nationality rests upon a document of Kuwaiti nationality or a certificate proving Kuwaiti nationality issued by the Ministry of Interior of Kuwait.
(b) Non-Kuwaiti: his/ her nationality is determined by the name of the State having issued the passport. The foreign national also entered Kuwait legally and has a stamp of residence.
This category includes the Bidoon, a category of stateless persons living in the Emirate. Kuwait’s Bidoon population originates from three broad categories:
1) those whose ancestors failed to apply for nationality or lacked necessary documentation at the time of Kuwait’s independence in 1961;
2) those recruited to work in Kuwait’s army or police force during the 1960s who permanently settled in Kuwait, along with their families;
3) children of Kuwaiti mothers and stateless or foreign fathers (see Human Rights Watch. Prisoners of the Past. Kuwaiti Bidun and the Burden of Statelessness, June 2011, p. 3).
(c) Unemployed population: population aged 15 years and over, able to work, looking for employment and unable to find one.
2. Institution which provides data
The Public Authority for Civil Information (PACI)
3. Period of data coverage: December 2013
The database is updated three times a year and the website presents only the most recent data.
4. Data availability
The statistics section of PACI’s website (http://www.paci.gov.kw/en/ (English); http://www.paci.gov.kw/ (Arabic)) provides population and socio-economic data broken down by nationality (Kuwaiti/ non-Kuwaiti). Some data are displayed by nationality groups.
Analytical tables and data crosstabulations are available for download in PDF, html, .png and Excel (.csv) formats.
Date of access: March 2014.
| Nationality |
Kuwaitis |
Non-Kuwaitis |
| Age Group |
Government sector |
Non-Governmental sector |
Total |
Government sector |
Non-Governmental sector |
Domestic Services Sector |
Total |
| males |
females |
Total |
males |
females |
Total |
males |
females |
Total |
males |
females |
Total |
males |
females |
Total |
males |
females |
Total |
males |
females |
Total |
| 15-19 |
747 |
15 |
762 |
1.894 |
546 |
2.440 |
2.641 |
561 |
3.202 |
37 |
20 |
57 |
146 |
20 |
166 |
47 |
62 |
109 |
230 |
102 |
332 |
| 20-24 |
16.922 |
9.180 |
26102 |
10.914 |
6.426 |
17.340 |
27.836 |
15.606 |
43.442 |
727 |
767 |
1.494 |
52.696 |
4.045 |
56.741 |
17577 |
25595 |
43172 |
71.000 |
30.407 |
101.407 |
| 25-29 |
33.927 |
31.790 |
65717 |
10.711 |
9.402 |
20.113 |
44.638 |
41.192 |
85.830 |
6.183 |
5.735 |
11.918 |
185.271 |
20.550 |
205.821 |
52813 |
71108 |
123921 |
244.267 |
97.393 |
341.660 |
| 30-34 |
32.635 |
29.749 |
62384 |
6.005 |
7.959 |
13.964 |
38.640 |
37.708 |
76.348 |
11.851 |
10.299 |
22.150 |
226.629 |
25.783 |
252.412 |
57832 |
60636 |
118468 |
296.312 |
96.718 |
393.030 |
| 35-39 |
29.150 |
26.032 |
55182 |
3.862 |
7.232 |
11.094 |
33.012 |
33.264 |
66.276 |
13.210 |
9.585 |
22.795 |
195.164 |
21.190 |
216.354 |
52580 |
57583 |
110163 |
260.954 |
88.358 |
349.312 |
| 40-44 |
22.762 |
18.783 |
41545 |
2.497 |
5.924 |
8.421 |
25.259 |
24.707 |
49.966 |
12.358 |
6.077 |
18.435 |
157.999 |
16.915 |
174.914 |
41026 |
43686 |
84712 |
211.383 |
66.678 |
278.061 |
| 45-49 |
16.608 |
11.860 |
28468 |
1.751 |
3.220 |
4.971 |
18.359 |
15.080 |
33.439 |
12.145 |
3.382 |
15.527 |
122.582 |
12.684 |
135.266 |
26841 |
29560 |
56401 |
161.568 |
45.626 |
207.194 |
| 50-54 |
8.181 |
7.132 |
15313 |
1.562 |
1.822 |
3.384 |
9.743 |
8.954 |
18.697 |
10.981 |
2.336 |
13.317 |
79.915 |
8.710 |
88.625 |
12456 |
12279 |
24735 |
103.352 |
23.325 |
126.677 |
| 55-59 |
3.544 |
3.290 |
6834 |
1.724 |
1.126 |
2.850 |
5.268 |
4.416 |
9.684 |
9.705 |
2.131 |
11.836 |
49.212 |
4.756 |
53.968 |
4889 |
4072 |
8961 |
63.806 |
10.959 |
74.765 |
| 60-64 |
1.730 |
1.931 |
3661 |
1.265 |
597 |
1.862 |
2.995 |
2.528 |
5.523 |
5.866 |
1.430 |
7.296 |
22.816 |
2.294 |
25.110 |
1412 |
1349 |
2761 |
30.094 |
5.073 |
35.167 |
| >65 |
2.496 |
953 |
3449 |
1.847 |
1.022 |
2.869 |
4.343 |
1.975 |
6.318 |
4.070 |
892 |
4.962 |
14.661 |
1.454 |
16.115 |
529 |
645 |
1174 |
19.260 |
2.991 |
22.251 |
| Total |
168702 |
140715 |
309417 |
44032 |
45276 |
89308 |
212734 |
185991 |
398725 |
87133 |
42654 |
129787 |
1107091 |
118401 |
1225492 |
268002 |
306575 |
574577 |
1462226 |
467630 |
1929856 |
Source: PACI
ANNEXED NOTE
1. Characteristics of data and definitions
The source of data used here is the Public Authority for Civil Information (PACI), an independant government body in charge of :
1- centralising all population and labour force data in order to manage a fully computerised population register
2- issuing mandatory civil identification cards to every resident of the country, regardless of age and nationality.
The other source of demographic and socioeconomic data on Kuwait is the Central Statistical Office (CSO), operating within the Planning Ministry. The CSO has conducted ten population and housing censuses since its inception in 1957.
Since 1995 a marked discrepancy was witnessed between PACI’ and CSO’ population figures. PACI’ database is connected electronically with other administrations and bodies registering demographic events and professional/ residency issues (births and death; departures and arrivals; end of service, residency and ID deliveries, etc.).
PACI’s records of residents’ movements is thus regularly updated, which limits the risk of population overcount. Therefore, it is more likely that residents were undercounted during CSO- Ministry of Planning’s census operations (see: Shah, N. Population of Kuwait. Structure and Dynamics, Kuwait: Kuwait University Academic Publication Council, 2010, chapter 1).
(a) Kuwaiti: the Kuwaiti nationality rests upon a document of Kuwaiti nationality or a certificate proving Kuwaiti nationality issued by the Ministry of Interior of Kuwait.
(b) Non-Kuwaiti: his/ her nationality is determined by the name of the State having issued the passport. The foreign national also entered Kuwait legally and has a stamp of residence.
This category includes the Bidoon, a category of stateless persons living in the Emirate. Kuwait’s Bidoon population originates from three broad categories:
1) those whose ancestors failed to apply for nationality or lacked necessary documentation at the time of Kuwait’s independence in 1961;
2) those recruited to work in Kuwait’s army or police force during the 1960s who permanently settled in Kuwait, along with their families;
3) children of Kuwaiti mothers and stateless or foreign fathers (see Human Rights Watch. Prisoners of the Past. Kuwaiti Bidun and the Burden of Statelessness, June 2011, p. 3).
(c) Population in the labour force: population aged 15 years and above, included in the labour market, either employed (in the government or private sector, as itinerant worker, employed in the domestic sector), or unemployed.
(d) Government sector: any organization of the government (organizations, authority and departments), included within the state budget
(Ministries and government departments; authorities with attached budgets; authorities with independent budgets).
(e) Non-governmental sector: any part of the private sector (a company or an individual) or any authority of the non-governmental sector.
(f) Domestic services sector: the household/ family sector, where the work is associated with the residence and its inhabitants, their service and their comfort (including maids, nannies, cooks, drivers, etc.).
Note: figures of expatriates differ slightly between PACI’s various sources of data (database; tabulated data).
2. Institution which provides data
The Public Authority for Civil Information (PACI)
3. Period of data coverage: December 2013
The database is updated three times a year and the website presents only the most recent data.
4. Data availability
The statistics section of PACI’s website (http://www.paci.gov.kw/en/ (English); http://www.paci.gov.kw/ (Arabic)) provides population and socio-economic data broken down by nationality (Kuwaiti/ non-Kuwaiti). Some data are displayed by nationality groups.
Analytical tables and data crosstabulations are available for download in PDF, html, .png and Excel (.csv) formats.
Date of access: April 2014.
|
|
Public sector |
Private and other sectors |
Domestic sector |
% Non-nationals |
| Country |
date/ period |
Total population |
non-nationals |
Total population |
non-nationals |
Total population |
non-nationals |
Public sector |
Private and other sectors |
| Bahrain (1) |
Q4 2013 |
149.868 |
38.028 |
496.090 |
400.482 |
103.728 |
103.728 |
25,4 |
80,7 |
| Kuwait (2) |
December 2013 |
439.204 |
129.787 |
1.314.800 |
1.225.492 |
574.577 |
574.577 |
29,6 |
93,2 |
| Oman (3) |
December 2012 |
378.335 |
27.522 |
1.362.118 |
1.190.300 |
n.a. |
125.882 |
7,3 |
87,4 |
| Qatar (4) |
April 2012 |
161.748 |
92.420 |
1.039.541 |
1.026.056 |
139.904 |
139.904 |
57,1 |
98,7 |
| Saudi Arabia (5) |
August/ December 2013 |
3.034.201 |
113.984 |
8.487.533 |
7.352.900 |
930.446 |
927.545 |
3,8 |
86,6 |
| United Arab Emirates |
|
n.a. |
n.a. |
n.a. |
n.a. |
n.a. |
n.a. |
n.a. |
n.a. |
| Total* |
|
4.163.356 |
401.741 |
12.700.082 |
11.195.230 |
1.748.655 |
1.871.636 |
9,6 |
88,2 |
Sources: national institutes of statistics, latest year or period available as of April 2014.
* Total provides the sum of population numbers at different dates between May 2009 and December 2013. It is not exactly the total population at any of these dates.
1- Definition:
Non-nationals are:
1- persons bearing nationality of a foreign State other than the GCC State of residence, or bearing no proof of nationality from any given state (stateless persons and holders of refugee status and travel document in a third country) ;
2- Holders of residence permit residing in the given GCC country at date of census, as per definition of residence used in each of the countries.
Employment refers to a person aged 15 years and above who during the reference period:
– worked for one hour or more for wage or salary, in cash or in kind
– worked for one hour or more for profit or family gain, in cash or in kind
The “public sector” figures include the security services’ employees.
The “private and other sectors” includes the private, mixed (joined), non-profit, diplomatic, etc. sectors.
2- Sources of data:
(1) Labour Market Regulation Authority (LMRA), 2013 (Q4), Table A. Estimated total employment by citizenship and sector (2002 – 2013).
The LMRA “Public sector” figure is reevaluated as follows: Figures of national and non-nationals employed in sector of activity “Public Administration and Defence; Compulsory Social Security” in 2010 Census were added to LMRA figure, which does not include nationals and non-nationals employed in Security services.
(2) Kuwait Public Authority for Civil Information (PACI), Dec. 2013; http://gulfmigration.eu/217/
(3) National Centre for Statistical Information (NCSI), Statistical Yearbook 2013, chapters “Government sector” and “Private sector”
The NCSI/ Ministry of Civil Service and Diwan of Royal Court, etc. figure has been reevaluated as follows: the figure of the Omanis employed in the sector of activity “Public Administration and Defence; Compulsory Social Security” in 2008′ Labour Force Survey (last figure available; 2010′ census only displays a percent distribution of employed Omanis by activity sector) has been added to that of public sector employed Omanis which excludes Security and Defence personnel. The share of public sector-employed non-Omanis involved in the defense and security sector cannot be inferred.
(4) Qatar Statistics Authority (QSA), Labour Force Bulletin 2012.
(5) Saudi Arabia Central Department for Statistics and Information (CDSI), Labor Force Survey 2013 (R2); Ministry of Civil Service (MoCS), issue n°2 of the monthly “Ministry of Civil Service Statistical Report”, http://gulfmigration.eu/public-sector-employees-by-nationality-saudi-non-saudi-sex-and-professional-position-december-2013/ and Ministry of Labour Statistics in SAMA 2013′ Report (private sector employment, 2012, last available data as of April 2nd, 2014).
The MoCS’ figure of public sector employment has been reevaluated as follows: the figure of Saudis and non-Saudis employed in the sector of activity “Public Administration and Defence; Compulsory Social Security” in 2013′ Labour Force Survey have been added to MoCS’s figures of Saudis and non-Saudis enrolled in the public sector.
| Nationality Group |
Kuwaitis |
Non-Kuwaitis |
Total |
| Economic Activity/ sector |
Governmental |
Non-governmental |
Total |
Governmental |
Non-governmental |
Total |
Governmental |
Non-governmental |
Total |
| Agriculture hunting and forestry |
3 |
244 |
247 |
10 |
565 |
575 |
13 |
809 |
822 |
| Mining and quarrying |
823 |
82 |
905 |
26 |
51 |
77 |
849 |
133 |
982 |
| Manufacturing |
250 |
1,929 |
2,179 |
44 |
5,870 |
5,914 |
294 |
7,799 |
8,093 |
| Electricity, gas and water supply |
3,059 |
|
3,059 |
88 |
3 |
91 |
3,147 |
3 |
3,150 |
| Construction |
25 |
5,812 |
5,837 |
8 |
9,020 |
9,028 |
33 |
14,832 |
14,865 |
| Wholesale and retail trade |
40 |
7,149 |
7,189 |
57 |
23,915 |
23,972 |
97 |
31,064 |
31,161 |
| Hotels and restaurants |
90 |
1,301 |
1,391 |
9 |
7,982 |
7,991 |
99 |
9,283 |
9,382 |
| Transport, storage and communications |
919 |
1,611 |
2,530 |
905 |
2,363 |
3,268 |
1,824 |
3,974 |
5,798 |
| Financial intermediation |
853 |
3,392 |
4,245 |
93 |
2,269 |
2,362 |
946 |
5,661 |
6,607 |
| Real estate, renting and business activities |
368 |
3,525 |
3,893 |
34 |
10,370 |
10,404 |
402 |
13,895 |
14,297 |
| Public administration and defence, compulsory social security |
102,922 |
9 |
102,931 |
23,343 |
22 |
23,365 |
126,265 |
31 |
126,296 |
| Education |
23,153 |
1,456 |
24,609 |
5,588 |
13,771 |
19,359 |
28,741 |
15,227 |
43,968 |
| Health and social work |
7,489 |
364 |
7,853 |
10,902 |
7,460 |
18,362 |
18,391 |
7,824 |
26,215 |
| Other community, social and personal service activities |
436 |
1,695 |
2,131 |
491 |
25,049 |
25,540 |
927 |
26,744 |
27,671 |
| Private households with employed persons |
|
60 |
60 |
29 |
296,563 |
296,592 |
29 |
296,623 |
296,652 |
| Extra-territorial organizations and bodies |
5 |
13 |
18 |
599 |
186 |
785 |
604 |
199 |
803 |
| Not Stated |
280 |
23,155 |
23,435 |
428 |
34,723 |
35,151 |
708 |
57,878 |
58,586 |
| Total |
140,715 |
51,797 |
192,512 |
42,654 |
440,182 |
482,836 |
183,369 |
491,979 |
675,348 |
Source: PACI
ANNEXED NOTE
1. Characteristics of data and definitions
The source of data used here is the Public Authority for Civil Information (PACI), an independant government body in charge of :
1- centralising all population and labour force data in order to manage a fully computerised population register
2- issuing mandatory civil identification cards to every resident of the country, regardless of age and nationality.
The other source of demographic and socioeconomic data on Kuwait is the Central Statistical Office (CSO), operating within the Planning Ministry. The CSO has conducted ten population and housing censuses since its inception in 1957.
Since 1995 a marked discrepancy was witnessed between PACI’ and CSO’ population figures. PACI’ database is connected electronically with other administrations and bodies registering demographic events and professional/ residency issues (births and death; departures and arrivals; end of service, residency and ID deliveries, etc.).
PACI’s records of residents’ movements is thus regularly updated, which limits the risk of population overcount. Therefore, it is more likely that residents were undercounted during CSO- Ministry of Planning’s census operations (see: Shah, N. Population of Kuwait. Structure and Dynamics, Kuwait: Kuwait University Academic Publication Council, 2010, chapter 1).
(a) Kuwaiti: the Kuwaiti nationality rests upon a document of Kuwaiti nationality or a certificate proving Kuwaiti nationality issued by the Ministry of Interior of Kuwait.
(b) Non-Kuwaiti: his/ her nationality is determined by the name of the State having issued the passport. The foreign national also entered Kuwait legally and has a stamp of residence.
This category includes the Bidoon, a category of stateless persons living in the Emirate. Kuwait’s Bidoon population originates from three broad categories:
1) those whose ancestors failed to apply for nationality or lacked necessary documentation at the time of Kuwait’s independence in 1961;
2) those recruited to work in Kuwait’s army or police force during the 1960s who permanently settled in Kuwait, along with their families;
3) children of Kuwaiti mothers and stateless or foreign fathers (see Human Rights Watch. Prisoners of the Past. Kuwaiti Bidun and the Burden of Statelessness, June 2011, p. 3).
(c) Population in the labour force: population aged 15 years and above, included in the labour market, either employed (in the government or private sector, as itinerant worker, employed in the domestic sector), or unemployed.
(d) Government sector: any organization of the government (organizations, authority and departments), included within the state budget
(Ministries and government departments; authorities with attached budgets; authorities with independent budgets).
(e) Non-governmental sector: any part of the private sector (a company or an individual) or any authority of the non-governmental sector.
(f) Domestic sector: the household/ family sector, where the work is associated with the residence and its inhabitants, their service and their comfort (including maids, nannies, cooks, drivers, etc.).
The “domestic sector” data is merged with the “non-governmental sector”. A proxy estimate of workers in the domestic sector can be inferred from the number of workers in the category “Private households with employed persons”, or see table http://gulfmigration.eu/employed-population-by-nationality-kuwaiti-non-kuwaiti-activity-sector-and-sex-2013/ .
Presented data include unemployed population.
Economic activities are categorised according to ISIC( Rev. 3) international classification of occupations.
Note: figures of expatriates differ slightly between PACI’s various sources of data (database; tabulated data).
2. Institution which provides data
The Public Authority for Civil Information (PACI)
3. Period of data coverage: December 2013
The database is updated three times a year and the website presents only the most recent data.
4. Data availability
The statistics section of PACI’s website (http://www.paci.gov.kw/en/ (English); http://www.paci.gov.kw/ (Arabic)) provides population and socio-economic data broken down by nationality (Kuwaiti/ non-Kuwaiti). Some data are displayed by nationality groups.
Analytical tables and data crosstabulations are available for download in PDF, html, .png and Excel (.csv) formats.
Date of access: April 2014.
| Nationality Group |
Kuwaitis |
Non-Kuwaitis |
Total |
| Economic Activity/ sector |
Governmental |
Non-governmental |
Total |
Governmental |
Non-governmental |
Total |
Governmental |
Non-governmental |
Total |
| Agriculture hunting and forestry |
3 |
192 |
195 |
19 |
35,514 |
35,533 |
22 |
35,706 |
35,728 |
| Mining and quarrying |
4,300 |
122 |
4,422 |
430 |
1,464 |
1,894 |
4,730 |
1,586 |
6,316 |
| Manufacturing |
2,761 |
2,031 |
4,792 |
2,823 |
106,560 |
109,383 |
5,584 |
108,591 |
114,175 |
| Electricity, gas and water supply |
11,432 |
0 |
11,432 |
1,702 |
71 |
1,773 |
13,134 |
71 |
13,205 |
| Construction |
64 |
6,840 |
6,904 |
50 |
195,409 |
195,459 |
114 |
202,249 |
202,363 |
| Wholesale and retail trade |
138 |
6,599 |
6,737 |
170 |
258,535 |
258,705 |
308 |
265,134 |
265,442 |
| Hotels and restaurants |
84 |
649 |
733 |
253 |
59,381 |
59,634 |
337 |
60,030 |
60,367 |
| Transport, storage and communications |
3,025 |
2,781 |
5,806 |
1,731 |
53,618 |
55,349 |
4,756 |
56,399 |
61,155 |
| Financial intermediation |
826 |
4,445 |
5,271 |
341 |
10,638 |
10,979 |
1,167 |
15,083 |
16,250 |
| Real estate, renting and business activities |
2,544 |
7,359 |
9,903 |
605 |
82,131 |
82,736 |
3,149 |
89,490 |
92,639 |
| Public administration and defence, compulsory social security |
131,778 |
2 |
131,780 |
60,655 |
60 |
60,715 |
192,433 |
62 |
192,495 |
| Education |
6,958 |
364 |
7,322 |
7,024 |
10,203 |
17,227 |
13,982 |
10,567 |
24,549 |
| Health and social work |
3,695 |
241 |
3,936 |
6,508 |
5,115 |
11,623 |
10,203 |
5,356 |
15,559 |
| Other community, social and personal service activities |
683 |
1,159 |
1,842 |
2,015 |
72,130 |
74,145 |
2,698 |
73,289 |
75,987 |
| Private households with employed persons |
3 |
130 |
133 |
194 |
265,423 |
265,617 |
197 |
265,553 |
265,750 |
| Extra-territorial organizations and bodies |
4 |
3 |
7 |
1,796 |
521 |
2,317 |
1,800 |
524 |
2,324 |
| Not Stated |
404 |
16,125 |
16,529 |
817 |
234,056 |
234,873 |
1,221 |
250,181 |
251,402 |
| Total |
168,702 |
49,042 |
217,744 |
87,133 |
1,390,829 |
1,477,962 |
255,835 |
1,439,871 |
1,695,706 |
Source: PACI
ANNEXED NOTE
1. Characteristics of data and definitions
The source of data used here is the Public Authority for Civil Information (PACI), an independant government body in charge of :
1- centralising all population and labour force data in order to manage a fully computerised population register
2- issuing mandatory civil identification cards to every resident of the country, regardless of age and nationality.
The other source of demographic and socioeconomic data on Kuwait is the Central Statistical Office (CSO), operating within the Planning Ministry. The CSO has conducted ten population and housing censuses since its inception in 1957.
Since 1995 a marked discrepancy was witnessed between PACI’ and CSO’ population figures. PACI’ database is connected electronically with other administrations and bodies registering demographic events and professional/ residency issues (births and death; departures and arrivals; end of service, residency and ID deliveries, etc.).
PACI’s records of residents’ movements is thus regularly updated, which limits the risk of population overcount. Therefore, it is more likely that residents were undercounted during CSO- Ministry of Planning’s census operations (see: Shah, N. Population of Kuwait. Structure and Dynamics, Kuwait: Kuwait University Academic Publication Council, 2010, chapter 1).
(a) Kuwaiti: the Kuwaiti nationality rests upon a document of Kuwaiti nationality or a certificate proving Kuwaiti nationality issued by the Ministry of Interior of Kuwait.
(b) Non-Kuwaiti: his/ her nationality is determined by the name of the State having issued the passport. The foreign national also entered Kuwait legally and has a stamp of residence.
This category includes the Bidoon, a category of stateless persons living in the Emirate. Kuwait’s Bidoon population originates from three broad categories:
1) those whose ancestors failed to apply for nationality or lacked necessary documentation at the time of Kuwait’s independence in 1961;
2) those recruited to work in Kuwait’s army or police force during the 1960s who permanently settled in Kuwait, along with their families;
3) children of Kuwaiti mothers and stateless or foreign fathers (see Human Rights Watch. Prisoners of the Past. Kuwaiti Bidun and the Burden of Statelessness, June 2011, p. 3).
(c) Population in the labour force: population aged 15 years and above, included in the labour market, either employed (in the government or private sector, as itinerant worker, employed in the domestic sector), or unemployed.
(d) Government sector: any organization of the government (organizations, authority and departments), included within the state budget
(Ministries and government departments; authorities with attached budgets; authorities with independent budgets).
(e) Non-governmental sector: any part of the private sector (a company or an individual) or any authority of the non-governmental sector.
(f) Domestic sector: the household/ family sector, where the work is associated with the residence and its inhabitants, their service and their comfort (including maids, nannies, cooks, drivers, etc.).
The “domestic sector” data is merged with the “non-governmental sector”. A proxy estimate of workers in the domestic sector can be inferred from the number of workers in the category “Private households with employed persons”, or see table http://gulfmigration.eu/employed-population-by-nationality-kuwaiti-non-kuwaiti-activity-sector-and-sex-2013/ .
Presented data include unemployed population.
Economic activities are categorised according to ISIC( Rev. 3) international classification of occupations.
Note: figures of expatriates differ slightly between PACI’s various sources of data (database; tabulated data).
2. Institution which provides data
The Public Authority for Civil Information (PACI)
3. Period of data coverage: December 2013
The database is updated three times a year and the website presents only the most recent data.
4. Data availability
The statistics section of PACI’s website (http://www.paci.gov.kw/en/ (English); http://www.paci.gov.kw/ (Arabic)) provides population and socio-economic data broken down by nationality (Kuwaiti/ non-Kuwaiti). Some data are displayed by nationality groups.
Analytical tables and data crosstabulations are available for download in PDF, html, .png and Excel (.csv) formats.
Date of access: April 2014.
| Nationality |
Kuwaitis |
Non-Kuwaitis |
Total |
| Economic Activity/ sector |
Governmental |
Non-governmental |
Total |
Governmental |
Non-governmental |
Total |
Governmental |
Non-governmental |
Total |
| Agriculture hunting and forestry |
6 |
436 |
442 |
29 |
36,079 |
36,108 |
35 |
36,515 |
36,550 |
| Mining and quarrying |
5,123 |
204 |
5,327 |
456 |
1,515 |
1,971 |
5,579 |
1,719 |
7,298 |
| Manufacturing |
3,011 |
3,960 |
6,971 |
2,867 |
112,430 |
115,297 |
5,878 |
116,390 |
122,268 |
| Electricity, gas and water supply |
14,491 |
0 |
14,491 |
1,790 |
74 |
1,864 |
16,281 |
74 |
16,355 |
| Construction |
89 |
12,652 |
12,741 |
58 |
204,429 |
204,487 |
147 |
217,081 |
217,228 |
| Wholesale and retail trade |
178 |
13,748 |
13,926 |
227 |
282,450 |
282,677 |
405 |
296,198 |
296,603 |
| Hotels and restaurants |
174 |
1,950 |
2,124 |
262 |
67,363 |
67,625 |
436 |
69,313 |
69,749 |
| Transport, storage and communications |
3,944 |
4,392 |
8,336 |
2,636 |
55,981 |
58,617 |
6,580 |
60,373 |
66,953 |
| Financial intermediation |
1,679 |
7,837 |
9,516 |
434 |
12,907 |
13,341 |
2,113 |
20,744 |
22,857 |
| Real estate, renting and business activities |
2,912 |
10,884 |
13,796 |
639 |
92,501 |
93,140 |
3,551 |
103,385 |
106,936 |
| Public administration and defence, compulsory social security |
234,700 |
11 |
234,711 |
83,998 |
82 |
84,080 |
318,698 |
93 |
318,791 |
| Education |
30,111 |
1,820 |
31,931 |
12,612 |
23,974 |
36,586 |
42,723 |
25,794 |
68,517 |
| Health and social work |
11,184 |
605 |
11,789 |
17,410 |
12,575 |
29,985 |
28,594 |
13,180 |
41,774 |
| Other community, social and personal service activities |
1,119 |
2,854 |
3,973 |
2,506 |
97,179 |
99,685 |
3,625 |
100,033 |
103,658 |
| Private households with employed persons |
3 |
190 |
193 |
223 |
561,986 |
562,209 |
226 |
562,176 |
562,402 |
| Extra-territorial organizations and bodies |
9 |
16 |
25 |
2,395 |
707 |
3,102 |
2,404 |
723 |
3,127 |
| Not Stated |
684 |
39,280 |
39,964 |
1,245 |
268,779 |
270,024 |
1,929 |
308,059 |
309,988 |
| Total |
309,417 |
100,839 |
410,256 |
129,787 |
1,831,011 |
1,960,798 |
439,204 |
1,931,850 |
2,371,054 |
Source: PACI
ANNEXED NOTE
1. Characteristics of data and definitions
The source of data used here is the Public Authority for Civil Information (PACI), an independant government body in charge of :
1- centralising all population and labour force data in order to manage a fully computerised population register
2- issuing mandatory civil identification cards to every resident of the country, regardless of age and nationality.
The other source of demographic and socioeconomic data on Kuwait is the Central Statistical Office (CSO), operating within the Planning Ministry. The CSO has conducted ten population and housing censuses since its inception in 1957.
Since 1995 a marked discrepancy was witnessed between PACI’ and CSO’ population figures. PACI’ database is connected electronically with other administrations and bodies registering demographic events and professional/ residency issues (births and death; departures and arrivals; end of service, residency and ID deliveries, etc.).
PACI’s records of residents’ movements is thus regularly updated, which limits the risk of population overcount. Therefore, it is more likely that residents were undercounted during CSO- Ministry of Planning’s census operations (see: Shah, N. Population of Kuwait. Structure and Dynamics, Kuwait: Kuwait University Academic Publication Council, 2010, chapter 1).
(a) Kuwaiti: the Kuwaiti nationality rests upon a document of Kuwaiti nationality or a certificate proving Kuwaiti nationality issued by the Ministry of Interior of Kuwait.
(b) Non-Kuwaiti: his/ her nationality is determined by the name of the State having issued the passport. The foreign national also entered Kuwait legally and has a stamp of residence.
This category includes the Bidoon, a category of stateless persons living in the Emirate. Kuwait’s Bidoon population originates from three broad categories:
1) those whose ancestors failed to apply for nationality or lacked necessary documentation at the time of Kuwait’s independence in 1961;
2) those recruited to work in Kuwait’s army or police force during the 1960s who permanently settled in Kuwait, along with their families;
3) children of Kuwaiti mothers and stateless or foreign fathers (see Human Rights Watch. Prisoners of the Past. Kuwaiti Bidun and the Burden of Statelessness, June 2011, p. 3).
(c) Population in the labour force: population aged 15 years and above, included in the labour market, either employed (in the government or private sector, as itinerant worker, employed in the domestic sector), or unemployed.
(d) Government sector: any organization of the government (organizations, authority and departments), included within the state budget
(Ministries and government departments; authorities with attached budgets; authorities with independent budgets).
(e) Non-governmental sector: any part of the private sector (a company or an individual) or any authority of the non-governmental sector.
(f) Domestic sector: the household/ family sector, where the work is associated with the residence and its inhabitants, their service and their comfort (including maids, nannies, cooks, drivers, etc.).
The “domestic sector” data is merged with the “non-governmental sector”. A proxy estimate of workers in the domestic sector can be inferred from the number of workers in the category “Private households with employed persons”, or see table http://gulfmigration.eu/employed-population-by-nationality-kuwaiti-non-kuwaiti-activity-sector-and-sex-2013/ .
Presented data include unemployed population.
Economic activities are categorised according to ISIC( Rev. 3) international classification of occupations.
Note: figures of expatriates differ slightly between PACI’s various sources of data (database; tabulated data).
2. Institution which provides data
The Public Authority for Civil Information (PACI)
3. Period of data coverage: December 2013
The database is updated three times a year and the website presents only the most recent data.
4. Data availability
The statistics section of PACI’s website (http://www.paci.gov.kw/en/ (English); http://www.paci.gov.kw/ (Arabic)) provides population and socio-economic data broken down by nationality (Kuwaiti/ non-Kuwaiti). Some data are displayed by nationality groups.
Analytical tables and data crosstabulations are available for download in PDF, html, .png and Excel (.csv) formats.
Date of access: April 2014.
| Age |
Nationality |
KUWAITIS |
NON KUWAITIS |
| group |
Education level |
Illiterate |
Reads and writes |
Elementary |
Intermediate |
High school diploma |
Diploma |
University degree |
Postgraduate |
NA |
Total |
Illiterate |
Reads and writes |
Elementary |
Intermediate |
High school diploma |
Diploma |
University degree |
Postgraduate |
NA |
Total |
| 10-14 |
males |
0 |
34 |
36,480 |
0 |
0 |
0 |
0 |
0 |
32,894 |
69,408 |
224 |
8,406 |
16,540 |
|
|
1 |
|
1 |
26,962 |
52,134 |
| |
females |
1 |
28 |
37,014 |
0 |
0.00 |
0 |
0 |
0 |
29,932 |
66,975 |
236 |
7,321 |
15,867 |
|
|
|
|
|
24,673 |
48,097 |
| |
total |
1 |
62 |
73,494 |
0 |
0 |
0 |
0 |
0 |
62,826 |
136,383 |
460 |
15,727 |
32,407 |
0 |
0 |
1 |
0 |
1 |
51,635 |
100,231 |
| 15-19 |
males |
10 |
0 |
23,264 |
38,417 |
1,870 |
0 |
0 |
0 |
3,631 |
67,192 |
112 |
2,300 |
19,354 |
13,622 |
826 |
5 |
|
|
8,207 |
44,426 |
| |
females |
9 |
11 |
16,274 |
41,816 |
3,708 |
1 |
0 |
0 |
2,601 |
64,420 |
110 |
2,270 |
17,375 |
13,260 |
1,104 |
18 |
2 |
|
6,345 |
40,484 |
| |
total |
19 |
11 |
39,538 |
80,233 |
5,578 |
1 |
0 |
0 |
6,232 |
131,612 |
222 |
4,570 |
36,729 |
26,882 |
1,930 |
23 |
2 |
0 |
14,552 |
84,910 |
| 20-24 |
males |
3 |
5 |
13,908 |
18,790 |
18,979 |
2,329 |
378 |
0 |
3,641 |
58,033 |
1,864 |
34,782 |
8,770 |
32,836 |
8,949 |
1,764 |
1,490 |
8 |
6,041 |
96,504 |
| |
females |
6 |
1 |
8,328 |
14,172 |
27,138 |
3,538 |
446 |
1 |
2,808 |
56,438 |
2,099 |
24,639 |
6,658 |
24,152 |
8,428 |
985 |
1,385 |
2 |
2,538 |
70,886 |
| |
total |
9 |
6 |
22,236 |
32,962 |
46,117 |
5,867 |
824 |
1 |
6,449 |
114,471 |
3,963 |
59,421 |
15,428 |
56,988 |
17,377 |
2,749 |
2,875 |
10 |
8,579 |
167,390 |
| 25-29 |
males |
3 |
7 |
4,253 |
16,256 |
17,679 |
5,679 |
4,755 |
37 |
2,244 |
50,913 |
7,076 |
110,291 |
10,260 |
77,434 |
26,460 |
5,919 |
10,195 |
83 |
10,935 |
258,653 |
| |
females |
3 |
14 |
2,115 |
7,310 |
17,705 |
10,497 |
10,786 |
31 |
2,468 |
50,929 |
5,696 |
64,922 |
7,240 |
40,860 |
17,548 |
3,195 |
8,761 |
90 |
4,361 |
152,673 |
| |
total |
6 |
21 |
6,368 |
23,566 |
35,384 |
16,176 |
15,541 |
68 |
4,712 |
101,842 |
12,772 |
175,213 |
17,500 |
118,294 |
44,008 |
9,114 |
18,956 |
173 |
15,296 |
411,326 |
| 30-34 |
males |
0 |
13 |
3,725 |
12,654 |
14,280 |
5,000 |
4,513 |
148 |
1,846 |
42,179 |
8,087 |
107,837 |
10,755 |
76,688 |
29,518 |
6,875 |
12,645 |
495 |
52,570 |
305,470 |
| |
females |
2 |
14 |
2,130 |
6,734 |
12,139 |
9,150 |
11,629 |
194 |
2,287 |
44,279 |
4,834 |
56,227 |
6,032 |
33,643 |
17,909 |
3,394 |
9,585 |
258 |
9,823 |
141,705 |
| |
total |
2 |
27 |
5,855 |
19,388 |
26,419 |
14,150 |
16,142 |
342 |
4,133 |
86,458 |
12,921 |
164,064 |
16,787 |
110,331 |
47,427 |
10,269 |
22,230 |
753 |
62,393 |
447,175 |
| 35-39 |
males |
1 |
32 |
4,655 |
10,381 |
10,127 |
4,133 |
4,502 |
199 |
1,735 |
35,765 |
7,430 |
86,504 |
11,728 |
60,307 |
25,216 |
6,193 |
10,741 |
562 |
58,280 |
266,961 |
| |
females |
4 |
25 |
2,502 |
8,283 |
7,568 |
5,760 |
12,778 |
121 |
2,905 |
39,946 |
4,893 |
45,676 |
6,007 |
28,547 |
12,569 |
2,851 |
6,970 |
230 |
11,919 |
119,662 |
| |
total |
5 |
57 |
7,157 |
18,664 |
17,695 |
9,893 |
17,280 |
320 |
4,640 |
75,711 |
12,323 |
132,180 |
17,735 |
88,854 |
37,785 |
9,044 |
17,711 |
792 |
70,199 |
386,623 |
| 40-44 |
males |
1 |
24 |
3,768 |
11,102 |
6,946 |
3,556 |
3,975 |
245 |
1,622 |
31,239 |
9,965 |
69,497 |
10,991 |
50,109 |
24,129 |
5,736 |
9,025 |
469 |
35,451 |
215,372 |
| |
females |
12 |
16 |
2,403 |
9,720 |
6,198 |
4,294 |
9,124 |
125 |
3,334 |
35,226 |
5,252 |
32,237 |
4,098 |
20,699 |
10,371 |
2,362 |
5,140 |
182 |
9,890 |
90,231 |
| |
total |
13 |
40 |
6,171 |
20,822 |
13,144 |
7,850 |
13,099 |
370 |
4,956 |
66,465 |
15,217 |
101,734 |
15,089 |
70,808 |
34,500 |
8,098 |
14,165 |
651 |
45,341 |
305,603 |
| 45-49 |
males |
2 |
8 |
1,740 |
8,622 |
7,175 |
3,452 |
3,949 |
328 |
1,419 |
26,695 |
11,980 |
48,780 |
11,334 |
34,175 |
20,796 |
5,015 |
9,198 |
413 |
21,638 |
163,329 |
| |
females |
47 |
20 |
2,374 |
8,032 |
5,317 |
3,863 |
7,291 |
118 |
3,806 |
30,868 |
5,542 |
21,213 |
3,000 |
12,942 |
8,364 |
1,993 |
3,990 |
139 |
6,787 |
63,970 |
| |
total |
49 |
28 |
4,114 |
16,654 |
12,492 |
7,315 |
11,240 |
446 |
5,225 |
57,563 |
17,522 |
69,993 |
14,334 |
47,117 |
29,160 |
7,008 |
13,188 |
552 |
28,425 |
227,299 |
| 50-54 |
males |
64 |
139 |
1,454 |
5,616 |
4,355 |
3,304 |
4,431 |
460 |
724 |
20,547 |
9,266 |
27,935 |
9,411 |
20,531 |
14,321 |
3,310 |
8,332 |
468 |
10,539 |
104,113 |
| |
females |
1,377 |
609 |
2,032 |
5,317 |
3,656 |
4,249 |
5,105 |
157 |
2,332 |
24,834 |
4,447 |
9,904 |
1,934 |
5,936 |
5,831 |
1,547 |
3,250 |
142 |
3,719 |
36,710 |
| |
total |
1,441 |
748 |
3,486 |
10,933 |
8,011 |
7,553 |
9,536 |
617 |
3,056 |
45,381 |
13,713 |
37,839 |
11,345 |
26,467 |
20,152 |
4,857 |
11,582 |
610 |
14,258 |
140,823 |
| 55-59 |
males |
129 |
343 |
1,333 |
4,178 |
2,527 |
2,459 |
3,149 |
694 |
344 |
15,156 |
5,974 |
15,466 |
6,511 |
11,562 |
10,018 |
2,425 |
6,475 |
492 |
5,383 |
64,306 |
| |
females |
3,904 |
1,414 |
1,953 |
4,006 |
2,010 |
3,212 |
3,167 |
205 |
365 |
20,236 |
3,125 |
4,156 |
1,126 |
2,733 |
3,437 |
1,217 |
2,360 |
127 |
1,484 |
19,765 |
| |
total |
4,033 |
1,757 |
3,286 |
8,184 |
4,537 |
5,671 |
6,316 |
899 |
709 |
35,392 |
9,099 |
19,622 |
7,637 |
14,295 |
13,455 |
3,642 |
8,835 |
619 |
6,867 |
84,071 |
| 60-64 |
males |
127 |
478 |
1,260 |
2,498 |
1,399 |
1,588 |
1,870 |
548 |
262 |
10,030 |
3,214 |
6,309 |
3,212 |
4,480 |
4,710 |
1,411 |
4,771 |
458 |
2,052 |
30,617 |
| |
females |
4,171 |
1,304 |
1,558 |
2,462 |
1,019 |
1,979 |
1,328 |
196 |
281 |
14,298 |
2,179 |
1,921 |
657 |
1,355 |
1,703 |
793 |
1,351 |
95 |
681 |
10,735 |
| |
total |
4,298 |
1,782 |
2,818 |
4,960 |
2,418 |
3,567 |
3,198 |
744 |
543 |
24,328 |
5,393 |
8,230 |
3,869 |
5,835 |
6,413 |
2,204 |
6,122 |
553 |
2,733 |
41,352 |
| >65 |
males |
2,542 |
3,784 |
3,275 |
3,577 |
1,440 |
1,235 |
1,813 |
628 |
875 |
19,169 |
3,141 |
3,718 |
2,156 |
2,525 |
2,474 |
841 |
3,515 |
650 |
1,602 |
20,622 |
| |
females |
14,222 |
3,508 |
1,989 |
2,096 |
751 |
759 |
759 |
143 |
637 |
24,864 |
4,437 |
1,962 |
708 |
1,261 |
1,277 |
443 |
710 |
89 |
939 |
11,826 |
| |
total |
16,764 |
7,292 |
5,264 |
5,673 |
2,191 |
1,994 |
2,572 |
771 |
1,512 |
44,033 |
7,578 |
5,680 |
2,864 |
3,786 |
3,751 |
1,284 |
4,225 |
739 |
2,541 |
32,448 |
| TOTAL |
males |
2,882 |
4,867 |
99,115 |
132,091 |
86,777 |
32,735 |
33,335 |
3,287 |
51,237 |
446,326 |
68,333 |
521,825 |
121,022 |
384,269 |
167,417 |
39,495 |
76,387 |
4,099 |
239,660 |
1,622,507 |
| |
females |
23,758 |
6,964 |
80,672 |
109,948 |
87,209 |
47,302 |
62,413 |
1,291 |
53,756 |
473,313 |
42,850 |
272,448 |
70,702 |
185,388 |
88,541 |
18,798 |
43,504 |
1,354 |
83,159 |
806,744 |
| |
total |
26,640 |
11,831 |
179,787 |
242,039 |
173,986 |
80,037 |
95,748 |
4,578 |
104,993 |
919,639 |
111,183 |
794,273 |
191,724 |
569,657 |
255,958 |
58,293 |
119,891 |
5,453 |
322,819 |
2,429,251 |
Source: PACI
ANNEXED NOTE
1. Characteristics of data and definitions
The source of data used here is the Public Authority for Civil Information (PACI), an independant government body in charge of :
1- centralising all population and labour force data in order to manage a fully computerised population register
2- issuing mandatory civil identification cards to every resident of the country, regardless of age and nationality.
The other source of demographic and socioeconomic data on Kuwait is the Central Statistical Office (CSO), operating within the Planning Ministry. The CSO has conducted ten population and housing censuses since its inception in 1957.
Since 1995 a marked discrepancy was witnessed between PACI’ and CSO’ population figures. PACI’ database is connected electronically with other administrations and bodies registering demographic events and professional/ residency issues (births and death; departures and arrivals; end of service, residency and ID deliveries, etc.).
PACI’s records of residents’ movements is thus regularly updated, which limits the risk of population overcount. Therefore, it is more likely that residents were undercounted during CSO- Ministry of Planning’s census operations (see: Shah, N. Population of Kuwait. Structure and Dynamics, Kuwait: Kuwait University Academic Publication Council, 2010, chapter 1).
(a) Kuwaiti: the Kuwaiti nationality rests upon a document of Kuwaiti nationality or a certificate proving Kuwaiti nationality issued by the Ministry of Interior of Kuwait.
(b) Non-Kuwaiti: his/ her nationality is determined by the name of the State which issued the passport. The foreign national also entered Kuwait legally and has a stamp of residence.
This category includes the Bidoon, a category of stateless persons living in the Emirate. Kuwait’s Bidoon population originates from three broad categories:
1) those whose ancestors failed to apply for nationality or lacked necessary documentation at the time of Kuwait’s independence in 1961;
2) those recruited to work in Kuwait’s army or police force during the 1960s who permanently settled in Kuwait, along with their families;
3) children of Kuwaiti mothers and stateless or foreign fathers (see Human Rights Watch. Prisoners of the Past. Kuwaiti Bidun and the Burden of Statelessness, June 2011, p. 3).
(The children of Kuwaiti mothers and non-Kuwaiti fathers (with specific nationality) inherit the father’s nationality. They are stateless if the father is stateless).
(c) NA: education level is unclear or not reported.
2. Institution which provides data
The Public Authority for Civil Information (PACI)
3. Period of data coverage: December 2013
The database is updated three times a year and the website presents only the most recent data.
4. Data availability
The statistics section of PACI’s website (http://www.paci.gov.kw/en/ (English); http://www.paci.gov.kw/ (Arabic)) provides population and socio-economic data broken down by nationality (Kuwaiti/ non-Kuwaiti). Some data are displayed by nationality groups.
Analytical tables and data crosstabulations are available for download in PDF, html, .png and Excel (.csv) formats.
Date of access: March 2014.
| Age |
KUWAITIS |
NON-KUWAITIS |
| group |
|
Never Married |
Married |
Divorced |
Widowed |
Not Stated |
Total |
Never Married |
Married |
Divorced |
Widowed |
Not Stated |
Total |
| 15-19 |
males |
66,661 |
419 |
47 |
|
65 |
67,192 |
38,253 |
453 |
3 |
1 |
5,716 |
44,426 |
| |
females |
60,060 |
4,050 |
249 |
4 |
57 |
64,420 |
32,612 |
2,370 |
84 |
3 |
5,415 |
40,484 |
| |
total |
126,721 |
4,469 |
296 |
4 |
122 |
131,612 |
70,865 |
2,823 |
87 |
4 |
11,131 |
84,910 |
| 20-24 |
males |
45,942 |
11,161 |
897 |
1 |
32 |
58,033 |
63,755 |
26,471 |
128 |
19 |
6,131 |
96,504 |
| |
females |
33,166 |
20,737 |
2,482 |
31 |
22 |
56,438 |
36,161 |
29,655 |
705 |
35 |
4,330 |
70,886 |
| |
total |
79,108 |
31,898 |
3,379 |
32 |
54 |
114,471 |
99,916 |
56,126 |
833 |
54 |
10,461 |
167,390 |
| 25-29 |
males |
18,693 |
29,632 |
2,545 |
8 |
35 |
50,913 |
146,646 |
110,640 |
605 |
52 |
710 |
258,653 |
| |
females |
13,683 |
32,428 |
4,662 |
129 |
27 |
50,929 |
57,848 |
92,634 |
1,636 |
119 |
436 |
152,673 |
| |
total |
32,376 |
62,060 |
7,207 |
137 |
62 |
101,842 |
204,494 |
203,274 |
2,241 |
171 |
1,146 |
411,326 |
| 30-34 |
males |
6,047 |
33,353 |
2,690 |
22 |
67 |
42,179 |
158,602 |
144,627 |
1,256 |
74 |
911 |
305,470 |
| |
females |
6,783 |
32,522 |
4,685 |
261 |
28 |
44,279 |
39,756 |
99,524 |
2,099 |
220 |
106 |
141,705 |
| |
total |
12,830 |
65,875 |
7,375 |
283 |
95 |
86,458 |
198,358 |
244,151 |
3,355 |
294 |
1,017 |
447,175 |
| 35-39 |
males |
2,792 |
30,582 |
2,278 |
60 |
53 |
35,765 |
117,969 |
146,265 |
1,370 |
105 |
1,252 |
266,961 |
| |
females |
4,550 |
30,316 |
4,496 |
550 |
34 |
39,946 |
28,800 |
88,484 |
1,868 |
354 |
156 |
119,662 |
| |
total |
7,342 |
60,898 |
6,774 |
610 |
87 |
75,711 |
146,769 |
234,749 |
3,238 |
459 |
1,408 |
386,623 |
| 40-44 |
males |
1,722 |
27,409 |
1,981 |
79 |
48 |
31,239 |
87,531 |
125,457 |
1,536 |
108 |
740 |
215,372 |
| |
females |
3,414 |
26,698 |
4,202 |
878 |
34 |
35,226 |
20,471 |
67,382 |
1,718 |
531 |
129 |
90,231 |
| |
total |
5,136 |
54,107 |
6,183 |
957 |
82 |
66,465 |
108,002 |
192,839 |
3,254 |
639 |
869 |
305,603 |
| 45-49 |
males |
1,161 |
23,701 |
1,691 |
108 |
34 |
26,695 |
55,387 |
105,893 |
1,556 |
119 |
374 |
163,329 |
| |
females |
2,484 |
23,052 |
3,856 |
1,436 |
40 |
30,868 |
12,263 |
49,505 |
1,431 |
694 |
77 |
63,970 |
| |
total |
3,645 |
46,753 |
5,547 |
1,544 |
74 |
57,563 |
67,650 |
155,398 |
2,987 |
813 |
451 |
227,299 |
| 50-54 |
males |
737 |
18,322 |
1,312 |
154 |
22 |
20,547 |
26,262 |
76,348 |
1,230 |
110 |
163 |
104,113 |
| |
females |
1,765 |
17,779 |
3,117 |
2,116 |
57 |
24,834 |
5,291 |
29,485 |
1,079 |
815 |
40 |
36,710 |
| |
total |
2,502 |
36,101 |
4,429 |
2,270 |
79 |
45,381 |
31,553 |
105,833 |
2,309 |
925 |
203 |
140,823 |
| 55-59 |
males |
404 |
13,679 |
820 |
237 |
16 |
15,156 |
9,889 |
53,340 |
854 |
135 |
88 |
64,306 |
| |
females |
1,156 |
13,644 |
2,151 |
3,244 |
41 |
20,236 |
1,901 |
16,226 |
647 |
973 |
18 |
19,765 |
| |
total |
1,560 |
27,323 |
2,971 |
3,481 |
57 |
35,392 |
11,790 |
69,566 |
1,501 |
1,108 |
106 |
84,071 |
| 60-64 |
males |
217 |
9,060 |
526 |
217 |
10 |
10,030 |
2,065 |
27,876 |
514 |
137 |
25 |
30,617 |
| |
females |
714 |
8,440 |
1,315 |
3,805 |
24 |
14,298 |
731 |
8,587 |
363 |
1,046 |
8 |
10,735 |
| |
total |
931 |
17,500 |
1,841 |
4,022 |
34 |
24,328 |
2,796 |
36,463 |
877 |
1,183 |
33 |
41,352 |
| >65 |
males |
289 |
16,537 |
859 |
1,460 |
24 |
19,169 |
736 |
18,811 |
472 |
594 |
9 |
20,622 |
| |
females |
613 |
10,108 |
1,811 |
12,270 |
62 |
24,864 |
514 |
7,401 |
398 |
3,497 |
16 |
11,826 |
| |
total |
902 |
26,645 |
2,670 |
13,730 |
86 |
44,033 |
1,250 |
26,212 |
870 |
4,091 |
25 |
32,448 |
| TOTAL |
males |
144,665 |
213,855 |
15,646 |
2,346 |
406 |
376,918 |
707,095 |
836,181 |
9,524 |
1,454 |
16,119 |
1,570,373 |
| |
females |
128,388 |
219,774 |
33,026 |
24,724 |
426 |
406,338 |
236,348 |
491,253 |
12,028 |
8,287 |
10,731 |
758,647 |
| |
total |
273,053 |
433,629 |
48,672 |
27,070 |
832 |
783,256 |
943,443 |
1,327,434 |
21,552 |
9,741 |
26,850 |
2,329,020 |
Source: PACI
ANNEXED NOTE
1. Characteristics of data and definitions
The source of data used here is the Public Authority for Civil Information (PACI), an independant government body in charge of :
1- centralising all population and labour force data in order to manage a fully computerised population register
2- issuing mandatory civil identification cards to every resident of the country, regardless of age and nationality.
The other source of demographic and socioeconomic data on Kuwait is the Central Statistical Office (CSO), operating within the Planning Ministry. The CSO has conducted ten population and housing censuses since its inception in 1957.
Since 1995 a marked discrepancy was witnessed between PACI’ and CSO’ population figures. PACI’ database is connected electronically with other administrations and bodies registering demographic events and professional/ residency issues (births and death; departures and arrivals; end of service, residency and ID deliveries, etc.).
PACI’s records of residents’ movements is thus regularly updated, which limits the risk of population overcount. Therefore, it is more likely that residents were undercounted during CSO- Ministry of Planning’s census operations (see: Shah, N. Population of Kuwait. Structure and Dynamics, Kuwait: Kuwait University Academic Publication Council, 2010, chapter 1).
(a) Kuwaiti: the Kuwaiti nationality rests upon a document of Kuwaiti nationality or a certificate proving Kuwaiti nationality issued by the Ministry of Interior of Kuwait.
(b) Non-Kuwaiti: his/ her nationality is determined by the name of the State which issued the passport. The foreign national also entered Kuwait legally and has a stamp of residence.
This category includes the Bidoon, a category of stateless persons living in the Emirate. Kuwait’s Bidoon population originates from three broad categories:
1) those whose ancestors failed to apply for nationality or lacked necessary documentation at the time of Kuwait’s independence in 1961;
2) those recruited to work in Kuwait’s army or police force during the 1960s who permanently settled in Kuwait, along with their families;
3) children of Kuwaiti mothers and stateless or foreign fathers (see Human Rights Watch. Prisoners of the Past. Kuwaiti Bidun and the Burden of Statelessness, June 2011, p. 3).
(The children of Kuwaiti mothers and non-Kuwaiti fathers (with specific nationality) inherit the father’s nationality. They are stateless if the father is stateless).
2. Institution which provides data
The Public Authority for Civil Information (PACI)
3. Period of data coverage: December 2013
The database is updated three times a year and the website presents only the most recent data.
4. Data availability
The statistics section of PACI’s website (http://www.paci.gov.kw/en/ (English); http://www.paci.gov.kw/ (Arabic)) provides population and socio-economic data broken down by nationality (Kuwaiti/ non-Kuwaiti). Some data are displayed by nationality groups.
Analytical tables and data crosstabulations are available for download in PDF, html, .png and Excel (.csv) formats.
Date of access: March 2014.
| |
Kuwaitis |
Non-Kuwaitis |
|
GRAND |
| |
|
Arabs |
|
|
Asians |
|
Africans |
Europeans |
North Americans |
South Americans |
Australians- Oceanians |
TOTAL non-Kuwaitis |
TOTAL |
| Age group |
males |
females |
total |
males |
females |
total |
males |
females |
total |
males |
females |
total |
males |
females |
total |
males |
females |
total |
males |
females |
total |
males |
females |
total |
males |
females |
total |
males |
females |
total |
| 0-4 |
83,604 |
80,879 |
164,483 |
54,129 |
52,089 |
106,218 |
23,494 |
22,598 |
46,092 |
213 |
194 |
407 |
589 |
583 |
1,172 |
1,209 |
1,067 |
2,276 |
55 |
60 |
115 |
96 |
83 |
179 |
79,785 |
76,674 |
156,459 |
163,389 |
157,553 |
320,942 |
| 5-9 |
80,615 |
77,762 |
158,377 |
48,592 |
45,876 |
94,468 |
19,507 |
19,032 |
38,539 |
159 |
143 |
302 |
634 |
581 |
1,215 |
1,076 |
1,047 |
2,123 |
57 |
47 |
104 |
96 |
88 |
184 |
70,121 |
66,814 |
136,935 |
150,736 |
144,576 |
295,312 |
| 10-14 |
69,408 |
66,975 |
136,383 |
37,872 |
34,662 |
72,534 |
12,500 |
11,829 |
24,329 |
107 |
121 |
228 |
474 |
467 |
941 |
1,049 |
903 |
1,952 |
46 |
40 |
86 |
86 |
75 |
161 |
52,134 |
48,097 |
100,231 |
121,542 |
115,072 |
236,614 |
| 15-19 |
67,192 |
64,420 |
131,612 |
34,201 |
31,284 |
65,485 |
8,750 |
7,873 |
16,623 |
184 |
130 |
314 |
353 |
324 |
677 |
795 |
741 |
1,536 |
57 |
48 |
105 |
86 |
84 |
170 |
44,426 |
40,484 |
84,910 |
111,618 |
104,904 |
216,522 |
| 20-24 |
58,033 |
56,438 |
114,471 |
50,345 |
32,887 |
83,232 |
44,455 |
20,517 |
64,972 |
877 |
16,408 |
17,285 |
238 |
379 |
617 |
476 |
583 |
1,059 |
55 |
63 |
118 |
58 |
49 |
107 |
96,504 |
70,886 |
167,390 |
154,537 |
127,324 |
281,861 |
| 25-29 |
50,913 |
50,929 |
101,842 |
102,757 |
47,616 |
150,373 |
151,400 |
68,733 |
220,133 |
3,240 |
34,763 |
38,003 |
356 |
678 |
1,034 |
777 |
760 |
1,537 |
85 |
69 |
154 |
38 |
54 |
92 |
258,653 |
152,673 |
411,326 |
309,566 |
203,602 |
513,168 |
| 30-34 |
42,179 |
44,279 |
86,458 |
104,054 |
42,443 |
146,497 |
198,102 |
86,198 |
284,300 |
1,622 |
11,446 |
13,068 |
580 |
823 |
1,403 |
997 |
658 |
1,655 |
63 |
74 |
137 |
52 |
63 |
115 |
305,470 |
141,705 |
447,175 |
347,649 |
185,984 |
533,633 |
| 35-39 |
35,765 |
39,946 |
75,711 |
80,108 |
29,950 |
110,058 |
184,468 |
84,664 |
269,132 |
768 |
3,601 |
4,369 |
625 |
786 |
1,411 |
872 |
555 |
1,427 |
64 |
56 |
120 |
56 |
50 |
106 |
266,961 |
119,662 |
386,623 |
302,726 |
159,608 |
462,334 |
| 40-44 |
31,239 |
35,226 |
66,465 |
62,089 |
21,898 |
83,987 |
150,933 |
66,030 |
216,963 |
421 |
991 |
1,412 |
811 |
665 |
1,476 |
977 |
549 |
1,526 |
82 |
37 |
119 |
59 |
61 |
120 |
215,372 |
90,231 |
305,603 |
246,611 |
125,457 |
372,068 |
| 45-49 |
26,695 |
30,868 |
57,563 |
52,659 |
17,175 |
69,834 |
108,164 |
45,359 |
153,523 |
335 |
260 |
595 |
755 |
566 |
1,321 |
1,263 |
506 |
1,769 |
68 |
47 |
115 |
85 |
57 |
142 |
163,329 |
63,970 |
227,299 |
190,024 |
94,838 |
284,862 |
| 50-54 |
20,547 |
24,834 |
45,381 |
37,015 |
12,572 |
49,587 |
64,646 |
22,959 |
87,605 |
185 |
112 |
297 |
761 |
455 |
1,216 |
1,344 |
528 |
1,872 |
78 |
32 |
110 |
84 |
52 |
136 |
104,113 |
36,710 |
140,823 |
124,660 |
61,544 |
186,204 |
| 55-59 |
15,156 |
20,236 |
35,392 |
24,591 |
8,600 |
33,191 |
37,862 |
10,331 |
48,193 |
143 |
97 |
240 |
628 |
318 |
946 |
967 |
368 |
1,335 |
49 |
28 |
77 |
66 |
23 |
89 |
64,306 |
19,765 |
84,071 |
79,462 |
40,001 |
119,463 |
| 60-64 |
10,030 |
14,298 |
24,328 |
14,244 |
5,749 |
19,993 |
15,203 |
4,447 |
19,650 |
67 |
62 |
129 |
437 |
217 |
654 |
594 |
229 |
823 |
31 |
11 |
42 |
41 |
20 |
61 |
30,617 |
10,735 |
41,352 |
40,647 |
25,033 |
65,680 |
| >65 |
19,169 |
24,864 |
44,033 |
12,393 |
8,780 |
21,173 |
7,361 |
2,596 |
9,957 |
32 |
22 |
54 |
349 |
209 |
558 |
444 |
188 |
632 |
17 |
13 |
30 |
26 |
18 |
44 |
20,622 |
11,826 |
32,448 |
39,791 |
36,690 |
76,481 |
| TOTAL |
610,545 |
631,954 |
1,242,499 |
715,049 |
391,581 |
1,106,630 |
1,026,845 |
473,166 |
1,500,011 |
8,353 |
68,350 |
76,703 |
7,590 |
7,051 |
14,641 |
12,840 |
8,682 |
21,522 |
807 |
625 |
1,432 |
929 |
777 |
1,706 |
1,772,413 |
950,232 |
2,722,645 |
2,382,958 |
1,582,186 |
3,965,144 |
Source: PACI
ANNEXED NOTE
1. Characteristics of data and definitions
The source of data used here is the Public Authority for Civil Information (PACI), an independant government body in charge of :
1- centralising all population and labour force data in order to manage a fully computerised population register
2- issuing mandatory civil identification cards to every resident of the country, regardless of age and nationality.
The other source of demographic and socioeconomic data on Kuwait is the Central Statistical Office (CSO), operating within the Planning Ministry. The CSO has conducted ten population and housing censuses since its inception in 1957.
Since 1995 a marked discrepancy was witnessed between PACI’ and CSO’ population figures. PACI’ database is connected electronically with other administrations and bodies registering demographic events and professional/ residency issues (births and death; departures and arrivals; end of service, residency and ID deliveries, etc.).
PACI’s records of residents’ movements is thus regularly updated, which limits the risk of population overcount. Therefore, it is more likely that residents were undercounted during CSO- Ministry of Planning’s census operations (see: Shah, N. Population of Kuwait. Structure and Dynamics, Kuwait: Kuwait University Academic Publication Council, 2010, chapter 1).
(a) Kuwaiti: the Kuwaiti nationality rests upon a document of Kuwaiti nationality or a certificate proving Kuwaiti nationality issued by the Ministry of Interior of Kuwait.
(b) Non-Kuwaiti: his/ her nationality is determined by the name of the State which issued the passport. The foreign national also entered Kuwait legally and has a stamp of residence.
This category includes the Bidoon, a category of stateless persons living in the Emirate. Kuwait’s Bidoon population originates from three broad categories:
1) those whose ancestors failed to apply for nationality or lacked necessary documentation at the time of Kuwait’s independence in 1961;
2) those recruited to work in Kuwait’s army or police force during the 1960s who permanently settled in Kuwait, along with their families;
3) children of Kuwaiti mothers and stateless or foreign fathers (see Human Rights Watch. Prisoners of the Past. Kuwaiti Bidun and the Burden of Statelessness, June 2011, p. 3).
(The children of Kuwaiti mothers and non-Kuwaiti fathers (with specific nationality) inherit the father’s nationality. They are stateless if the father is stateless).
(c) Nationality group: collected according to the nationality of the head of the household.
Nationalities are grouped according to specific features common to certain population subgroups: language, geographic origin, etc. or according to internationally recognized categories such as: (Arab / non-Arab Asian countries / non-Arab African countries; European countries … etc.).
2. Institution which provides data
The Public Authority for Civil Information (PACI)
3. Period of data coverage: 31 December 2013
The database is updated three times a year and the website presents only the most recent data.
4. Data availability
The statistics section of PACI’s website (http://www.paci.gov.kw/en/ (English); http://www.paci.gov.kw/ (Arabic)) provides population and socio-economic data broken down by nationality (Kuwaiti/ non-Kuwaiti). Some data are displayed by nationality groups.
Analytical tables and data crosstabulations are available for download in PDF, html, .png and Excel (.csv) formats.
Date of access: March 2014
|
Kuwaitis |
Non-Kuwaitis |
TOTAL |
| Age group |
Arabs |
Asians |
Africans |
Europeans |
North Americans |
South Americans |
Australians- Oceanians |
TOTAL non-Kuwaitis |
| 0-4 |
164,483 |
106,218 |
46,092 |
407 |
1,172 |
2,276 |
115 |
179 |
156,459 |
320,942 |
| 5-9 |
158,377 |
94,468 |
38,539 |
302 |
1,215 |
2,123 |
104 |
184 |
136,935 |
295,312 |
| 10-14 |
136,383 |
72,534 |
24,329 |
228 |
941 |
1,952 |
86 |
161 |
100,231 |
236,614 |
| 15-19 |
131,612 |
65,485 |
16,623 |
314 |
677 |
1,536 |
105 |
170 |
84,910 |
216,522 |
| 20-24 |
114,471 |
83,232 |
64,972 |
17,285 |
617 |
1,059 |
118 |
107 |
167,390 |
281,861 |
| 25-29 |
101,842 |
150,373 |
220,133 |
38,003 |
1,034 |
1,537 |
154 |
92 |
411,326 |
513,168 |
| 30-34 |
86,458 |
146,497 |
284,300 |
13,068 |
1,403 |
1,655 |
137 |
115 |
447,175 |
533,633 |
| 35-39 |
75,711 |
110,058 |
269,132 |
4,369 |
1,411 |
1,427 |
120 |
106 |
386,623 |
462,334 |
| 40-44 |
66,465 |
83,987 |
216,963 |
1,412 |
1,476 |
1,526 |
119 |
120 |
305,603 |
372,068 |
| 45-49 |
57,563 |
69,834 |
153,523 |
595 |
1,321 |
1,769 |
115 |
142 |
227,299 |
284,862 |
| 50-54 |
45,381 |
49,587 |
87,605 |
297 |
1,216 |
1,872 |
110 |
136 |
140,823 |
186,204 |
| 55-59 |
35,392 |
33,191 |
48,193 |
240 |
946 |
1,335 |
77 |
89 |
84,071 |
119,463 |
| 60-64 |
24,328 |
19,993 |
19,650 |
129 |
654 |
823 |
42 |
61 |
41,352 |
65,680 |
| >65 |
44,033 |
21,173 |
9,957 |
54 |
558 |
632 |
30 |
44 |
32,448 |
76,481 |
| TOTAL |
1,242,499 |
1,106,630 |
1,500,011 |
76,703 |
14,641 |
21,522 |
1,432 |
1,706 |
2,722,645 |
3,965,144 |
Source: PACI
ANNEXED NOTE
1. Characteristics of data and definitions
The source of data used here is the Public Authority for Civil Information (PACI), an independant government body in charge of :
1- centralising all population and labour force data in order to manage a fully computerised population register
2- issuing mandatory civil identification cards to every resident of the country, regardless of age and nationality.
The other source of demographic and socioeconomic data on Kuwait is the Central Statistical Office (CSO), operating within the Planning Ministry. The CSO has conducted ten population and housing censuses since its inception in 1957.
Since 1995 a marked discrepancy was witnessed between PACI’ and CSO’ population figures. PACI’ database is connected electronically with other administrations and bodies registering demographic events and professional/ residency issues (births and death; departures and arrivals; end of service, residency and ID deliveries, etc.).
PACI’s records of residents’ movements is thus regularly updated, which limits the risk of population overcount. Therefore, it is more likely that residents were undercounted during CSO- Ministry of Planning’s census operations (see: Shah, N. Population of Kuwait. Structure and Dynamics, Kuwait: Kuwait University Academic Publication Council, 2010, chapter 1).
(a) Kuwaiti: the Kuwaiti nationality rests upon a document of Kuwaiti nationality or a certificate proving Kuwaiti nationality issued by the Ministry of Interior of Kuwait.
(b) Non-Kuwaiti: his/ her nationality is determined by the name of the State which issued the passport. The foreign national also entered Kuwait legally and has a stamp of residence.
This category includes the Bidoon, a category of stateless persons living in the Emirate. Kuwait’s Bidoon population originates from three broad categories:
1) those whose ancestors failed to apply for nationality or lacked necessary documentation at the time of Kuwait’s independence in 1961;
2) those recruited to work in Kuwait’s army or police force during the 1960s who permanently settled in Kuwait, along with their families;
3) children of Kuwaiti mothers and stateless or foreign fathers (see Human Rights Watch. Prisoners of the Past. Kuwaiti Bidun and the Burden of Statelessness, June 2011, p. 3).
(The children of Kuwaiti mothers and non-Kuwaiti fathers (with specific nationality) inherit the father’s nationality. They are stateless if the father is stateless).
(c) Nationality group: collected according to the nationality of the head of the household.
Nationalities are grouped according to specific features common to certain population subgroups: language, geographic origin, etc. or according to internationally recognized categories such as: (Arab / non-Arab Asian countries / non-Arab African countries; European countries … etc.).
2. Institution which provides data
The Public Authority for Civil Information (PACI)
3. Period of data coverage: 31 December 2013
The database is updated three times a year and the website presents only the most recent data.
4. Data availability
The statistics section of PACI’s website (http://www.paci.gov.kw/en/ (English); http://www.paci.gov.kw/ (Arabic)) provides population and socio-economic data broken down by nationality (Kuwaiti/ non-Kuwaiti). Some data are displayed by nationality groups.
Analytical tables and data crosstabulations are available for download in PDF, html, .png and Excel (.csv) formats.
Date of access: March 2014
| |
Kuwaitis |
Non-Kuwaitis |
Total |
| Age group |
males |
females |
total |
males |
females |
total |
males |
females |
total |
| 0-4 |
83,604 |
80,879 |
164,483 |
79,785 |
76,674 |
156,459 |
163,389 |
157,553 |
320,942 |
| 5-9 |
80,615 |
77,762 |
158,377 |
70,121 |
66,814 |
136,935 |
150,736 |
144,576 |
295,312 |
| 10-14 |
69,408 |
66,975 |
136,383 |
52,134 |
48,097 |
100,231 |
121,542 |
115,072 |
236,614 |
| 15-19 |
67,192 |
64,420 |
131,612 |
44,426 |
40,484 |
84,910 |
111,618 |
104,904 |
216,522 |
| 20-24 |
58,033 |
56,438 |
114,471 |
96,504 |
70,886 |
167,390 |
154,537 |
127,324 |
281,861 |
| 25-29 |
50,913 |
50,929 |
101,842 |
258,653 |
152,673 |
411,326 |
309,566 |
203,602 |
513,168 |
| 30-34 |
42,179 |
44,279 |
86,458 |
305,470 |
141,705 |
447,175 |
347,649 |
185,984 |
533,633 |
| 35-39 |
35,765 |
39,946 |
75,711 |
266,961 |
119,662 |
386,623 |
302,726 |
159,608 |
462,334 |
| 40-44 |
31,239 |
35,226 |
66,465 |
215,372 |
90,231 |
305,603 |
246,611 |
125,457 |
372,068 |
| 45-49 |
26,695 |
30,868 |
57,563 |
163,329 |
63,970 |
227,299 |
190,024 |
94,838 |
284,862 |
| 50-54 |
20,547 |
24,834 |
45,381 |
104,113 |
36,710 |
140,823 |
124,660 |
61,544 |
186,204 |
| 55-59 |
15,156 |
20,236 |
35,392 |
64,306 |
19,765 |
84,071 |
79,462 |
40,001 |
119,463 |
| 60-64 |
10,030 |
14,298 |
24,328 |
30,617 |
10,735 |
41,352 |
40,647 |
25,033 |
65,680 |
| >65 |
19,169 |
24,864 |
44,033 |
20,622 |
11,826 |
32,448 |
39,791 |
36,690 |
76,481 |
| TOTAL |
610,545 |
631,954 |
1,242,499 |
1,772,413 |
950,232 |
2,722,645 |
2,382,958 |
1,582,186 |
3,965,144 |
Source: PACI
ANNEXED NOTE
1. Characteristics of data and definitions
The source of data used here is the Public Authority for Civil Information (PACI), an independant government body in charge of :
1- centralising all population and labour force data in order to manage a fully computerised population register
2- issuing mandatory civil identification cards to every resident of the country, regardless of age and nationality.
The other source of demographic and socioeconomic data on Kuwait is the Central Statistical Office (CSO), operating within the Planning Ministry. The CSO has conducted ten population and housing censuses since its inception in 1957.
Since 1995 a marked discrepancy was witnessed between PACI’ and CSO’ population figures. PACI’ database is connected electronically with other administrations and bodies registering demographic events and professional/ residency issues (births and death; departures and arrivals; end of service, residency and ID deliveries, etc.).
PACI’s records of residents’ movements is thus regularly updated, which limits the risk of population overcount. Therefore, it is more likely that residents were undercounted during CSO- Ministry of Planning’s census operations (see: Shah, N. Population of Kuwait. Structure and Dynamics, Kuwait: Kuwait University Academic Publication Council, 2010, chapter 1).
(a) Kuwaiti: the Kuwaiti nationality rests upon a document of Kuwaiti nationality or a certificate proving Kuwaiti nationality issued by the Ministry of Interior of Kuwait.
(b) Non-Kuwaiti: his/ her nationality is determined by the name of the State which issued the passport. The foreign national also entered Kuwait legally and has a stamp of residence.
This category includes the Bidoon, a category of stateless persons living in the Emirate. Kuwait’s Bidoon population originates from three broad categories:
1) those whose ancestors failed to apply for nationality or lacked necessary documentation at the time of Kuwait’s independence in 1961;
2) those recruited to work in Kuwait’s army or police force during the 1960s who permanently settled in Kuwait, along with their families;
3) children of Kuwaiti mothers and stateless or foreign fathers (see Human Rights Watch. Prisoners of the Past. Kuwaiti Bidun and the Burden of Statelessness, June 2011, p. 3).
(The children of Kuwaiti mothers and non-Kuwaiti fathers (with specific nationality) inherit the father’s nationality. They are stateless if the father is stateless).
2. Institution which provides data
The Public Authority for Civil Information (PACI)
3. Period of data coverage: 31 December 2013
The database is updated three times a year and the website presents only the most recent data.
4. Data availability
The statistics section of PACI’s website (http://www.paci.gov.kw/en/ (English); http://www.paci.gov.kw/ (Arabic)) provides population and socio-economic data broken down by nationality (Kuwaiti/ non-Kuwaiti). Some data are displayed by nationality groups.
Analytical tables and data crosstabulations are available for download in PDF, html, .png and Excel (.csv) formats.
Date of access: March 2014
|
males |
females |
total |
| Kuwaitis |
610,545 |
631,954 |
1,242,499 |
| Arabs |
715,049 |
391,581 |
1,106,630 |
| Asians |
1,026,845 |
473,166 |
1,500,011 |
| Africans |
8,353 |
68,350 |
76,703 |
| Europeans |
7,590 |
7,051 |
14,641 |
| North Americans |
12,840 |
8,682 |
21,522 |
| South Americans |
807 |
625 |
1,432 |
| Australians- Oceanians |
929 |
777 |
1,706 |
| Total |
2,382,958 |
1,582,186 |
3,965,144 |
Source: PACI
ANNEXED NOTE
1. Characteristics of data and definitions
The source of data used here is the Public Authority for Civil Information (PACI), an independant government body in charge of :
1- centralising all population and labour force data in order to manage a fully computerised population register
2- issuing mandatory civil identification cards to every resident of the country, regardless of age and nationality.
The other source of demographic and socioeconomic data on Kuwait is the Central Statistical Office (CSO), operating within the Planning Ministry. The CSO has conducted ten population and housing censuses since its inception in 1957.
Since 1995 a marked discrepancy was witnessed between PACI’ and CSO’ population figures. PACI’ database is connected electronically with other administrations and bodies registering demographic events and professional/ residency issues (births and death; departures and arrivals; end of service, residency and ID deliveries, etc.).
PACI’s records of residents’ movements is thus regularly updated, which limits the risk of population overcount. Therefore, it is more likely that residents were undercounted during CSO- Ministry of Planning’s census operations (see: Shah, N. Population of Kuwait. Structure and Dynamics, Kuwait: Kuwait University Academic Publication Council, 2010, chapter 1).
(a) Kuwaiti: the Kuwaiti nationality rests upon a document of Kuwaiti nationality or a certificate proving Kuwaiti nationality issued by the Ministry of Interior of Kuwait.
(b) Non-Kuwaiti: his/ her nationality is determined by the name of the State which issued the passport. The foreign national also entered Kuwait legally and has a stamp of residence.
This category includes the Bidoon, a category of stateless persons living in the Emirate. Kuwait’s Bidoon population originates from three broad categories:
1) those whose ancestors failed to apply for nationality or lacked necessary documentation at the time of Kuwait’s independence in 1961;
2) those recruited to work in Kuwait’s army or police force during the 1960s who permanently settled in Kuwait, along with their families;
3) children of Kuwaiti mothers and stateless or foreign fathers (see Human Rights Watch. Prisoners of the Past. Kuwaiti Bidun and the Burden of Statelessness, June 2011, p. 3).
(The children of Kuwaiti mothers and non-Kuwaiti fathers (with specific nationality) inherit the father’s nationality. They are stateless if the father is stateless).
(c) Nationality group: collected according to the nationality of the head of the household.
Nationalities are grouped according to specific features common to certain population subgroups: language, geographic origin, etc. or according to internationally recognized categories such as: (Arab / non-Arab Asian countries / non-Arab African countries; European countries … etc.).
2. Institution which provides data
The Public Authority for Civil Information (PACI)
3. Period of data coverage: 31 December 2013
The database is updated three times a year and the website presents only the most recent data.
4. Data availability
The statistics section of PACI’s website (http://www.paci.gov.kw/en/ (English); http://www.paci.gov.kw/ (Arabic)) provides population and socio-economic data broken down by nationality (Kuwaiti/ non-Kuwaiti). Some data are displayed by nationality groups.
Analytical tables and data crosstabulations are available for download in PDF, html, .png and Excel (.csv) formats.
Date of access: March 2014.
| |
Kuwaitis |
Non-Kuwaitis |
Total |
| Year |
Male |
Female |
Total |
Male |
Female |
Total |
Male |
Female |
Total |
| 1990 |
286,299 |
292,212 |
578,511 |
944,585 |
628,584 |
1,573,169 |
1,230,884 |
920,796 |
2,151,680 |
| 1993 |
325,892 |
331,601 |
657,493 |
682,161 |
305,973 |
988,134 |
1,008,053 |
637,574 |
1,645,627 |
| 1995 |
351,314 |
356,801 |
708,115 |
841,320 |
409,359 |
1,250,679 |
1,192,634 |
766,160 |
1,958,794 |
| 1996 |
363,476 |
368,927 |
732,403 |
914,327 |
447,159 |
1,361,486 |
1,277,803 |
816,086 |
2,093,889 |
| 1997 |
n.a. |
n.a. |
n.a. |
n.a. |
n.a. |
n.a. |
n.a. |
n.a. |
n.a. |
| 1998 |
388,687 |
397,323 |
786,010 |
1,002,718 |
482,137 |
1,484,855 |
1,391,405 |
879,460 |
2,270,865 |
| 1999 |
401,433 |
410,822 |
812,255 |
970,865 |
471,834 |
1,442,699 |
1,372,298 |
882,656 |
2,254,954 |
| 2000 |
415,613 |
426,177 |
841,790 |
927,023 |
448,445 |
1,375,468 |
1,342,636 |
874,622 |
2,217,258 |
| 2001 |
429,209 |
441,074 |
870,283 |
960,390 |
478,429 |
1,438,819 |
1,389,599 |
919,503 |
2,309,102 |
| 2002 |
442,310 |
455,975 |
898,285 |
1,020,913 |
500,730 |
1,521,643 |
1,463,223 |
956,705 |
2,419,928 |
| 2003 |
456,226 |
471,460 |
927,686 |
1,098,878 |
520,120 |
1,618,998 |
1,555,104 |
991,580 |
2,546,684 |
| 2004 |
469,327 |
486,907 |
956,234 |
1,240,267 |
557,155 |
1,797,422 |
1,709,594 |
1,044,062 |
2,753,656 |
| 2005 |
486,089 |
506,128 |
992,217 |
1,391,322 |
607,650 |
1,998,972 |
1,877,411 |
1,113,778 |
2,991,189 |
| 2006 |
501,148 |
522,168 |
1,023,316 |
1,510,818 |
648,826 |
2,159,644 |
2,011,966 |
1,170,994 |
3,182,960 |
| 2007 |
516,631 |
537,966 |
1,054,597 |
1,615,273 |
729,767 |
2,345,040 |
2,131,904 |
1,267,733 |
3,399,637 |
| 2008 |
532,566 |
554,985 |
1,087,551 |
1,618,766 |
735,496 |
2,354,262 |
2,151,332 |
1,290,481 |
3,441,813 |
| 2009 |
548,290 |
570,620 |
1,118,910 |
1,591,935 |
774,036 |
2,365,971 |
2,140,225 |
1,344,656 |
3,484,881 |
| 2010 |
563,631 |
584,712 |
1,148,343 |
1,586,716 |
846,995 |
2,433,711 |
2,150,347 |
1,431,707 |
3,582,054 |
| 2011 |
580,558 |
602,616 |
1,183,174 |
1,641,135 |
872,983 |
2,514,118 |
2,221,693 |
1,475,599 |
3,697,292 |
| 2012 |
595,365 |
617,071 |
1,212,436 |
1,705,468 |
905,824 |
2,611,292 |
2,300,833 |
1,522,895 |
3,823,728 |
| 2013 |
610,545 |
631,954 |
1,242,499 |
1,772,413 |
950,232 |
2,722,645 |
2,382,958 |
1,582,186 |
3,965,144 |
Source: PACI
ANNEXED NOTE
1. Characteristics of data and definitions
The source of data used here is the Public Authority for Civil Information (PACI), an independant government body in charge of :
1- centralising all population and labour force data in order to manage a fully computerised population register
2- issuing mandatory civil identification cards to every resident of the country, regardless of age and nationality.
The other source of demographic and socioeconomic data on Kuwait is the Central Statistical Office (CSO), operating within the Planning Ministry. The CSO has conducted ten population and housing censuses since its inception in 1957.
Since 1995 a marked discrepancy was witnessed between PACI’ and CSO’ population figures. PACI’ database is connected electronically with other administrations and bodies registering demographic events and professional/ residency issues (births and death; departures and arrivals; end of service, residency and ID deliveries, etc.).
PACI’s records of residents’ movements is thus regularly updated, which limits the risk of population overcount. Therefore, it is more likely that residents were undercounted during CSO- Ministry of Planning’s census operations (see: Shah, N. Population of Kuwait. Structure and Dynamics, Kuwait: Kuwait University Academic Publication Council, 2010, chapter 1).
(a) Kuwaiti: the Kuwaiti nationality rests upon a document of Kuwaiti nationality or a certificate proving Kuwaiti nationality issued by the Ministry of Interior of Kuwait.
(b) Non-Kuwaiti: his/ her nationality is determined by the name of the State which issued the passport. The foreign national also entered Kuwait legally and has a stamp of residence.
This category includes the Bidoon, a category of stateless persons living in the Emirate. Kuwait’s Bidoon population originates from three broad categories:
1) those whose ancestors failed to apply for nationality or lacked necessary documentation at the time of Kuwait’s independence in 1961;
2) those recruited to work in Kuwait’s army or police force during the 1960s who permanently settled in Kuwait, along with their families;
3) children of Kuwaiti mothers and stateless or foreign fathers (see Human Rights Watch. Prisoners of the Past. Kuwaiti Bidun and the Burden of Statelessness, June 2011, p. 3).
(The children of Kuwaiti mothers and non-Kuwaiti fathers (with specific nationality) inherit the father’s nationality. They are stateless if the father is stateless).
2. Institution which provides data
The Public Authority for Civil Information (PACI)
3. Period of data coverage: 31 December, given years
The database is updated three times a year and the website presents only the most recent data.
4. Data availability
The statistics section of PACI’s website (http://www.paci.gov.kw/en/ (English); http://www.paci.gov.kw/ (Arabic)) provides population and socio-economic data broken down by nationality (Kuwaiti/ non-Kuwaiti). Some data are displayed by nationality groups.
Analytical tables and data crosstabulations are available for download in PDF, html, .png and Excel (.csv) formats.
Date of access: March 2014.
| Nationality |
KUWAITIS |
NON-KUWAITIS |
| Age group/ Place of birth |
Outside Kuwait |
In Kuwait |
Total |
Outside Kuwait |
In Kuwait |
Total |
| 0-4 |
3,964 |
160,519 |
164,483 |
36,764 |
119,695 |
156,459 |
| 5-9 |
4,513 |
153,864 |
158,377 |
51,157 |
85,778 |
136,935 |
| 10-14 |
5,292 |
131,091 |
136,383 |
45,711 |
54,520 |
100,231 |
| 15-19 |
5,137 |
126,475 |
131,612 |
33,815 |
51,095 |
84,910 |
| 20-24 |
9,617 |
104,854 |
114,471 |
130,732 |
36,658 |
167,390 |
| 25-29 |
3,090 |
98,752 |
101,842 |
367,655 |
43,671 |
411,326 |
| 30-34 |
3,544 |
82,914 |
86,458 |
411,670 |
35,505 |
447,175 |
| 35-39 |
3,775 |
71,936 |
75,711 |
362,513 |
24,110 |
386,623 |
| 40-44 |
3,763 |
62,702 |
66,465 |
288,635 |
16,968 |
305,603 |
| 45-49 |
3,464 |
54,099 |
57,563 |
215,262 |
12,037 |
227,299 |
| 50-54 |
3,049 |
42,332 |
45,381 |
134,870 |
5,953 |
140,823 |
| 55-59 |
3,285 |
32,107 |
35,392 |
81,570 |
2,501 |
84,071 |
| 60-64 |
2,894 |
21,434 |
24,328 |
39,897 |
1,455 |
41,352 |
| >64 |
5,165 |
38,868 |
44,033 |
30,742 |
1,706 |
32,448 |
| Total |
60,552 |
1,181,947 |
1,242,499 |
2,230,993 |
491,652 |
2,722,645 |
Source: PACI
ANNEXED NOTE
1. Characteristics of data and definitions
The source of data used here is the Public Authority for Civil Information (PACI), an independant government body in charge of :
1- centralising all population and labour force data in order to manage a fully computerised population register
2- issuing mandatory civil identification cards to every resident of the country, regardless of age and nationality.
The other source of demographic and socioeconomic data on Kuwait is the Central Statistical Office (CSO), operating within the Planning Ministry. The CSO has conducted ten population and housing censuses since its inception in 1957.
Since 1995 a marked discrepancy was witnessed between PACI’ and CSO’ population figures. PACI’ database is connected electronically with other administrations and bodies registering demographic events and professional/ residency issues (births and death; departures and arrivals; end of service, residency and ID deliveries, etc.).
PACI’s records of residents’ movements is thus regularly updated, which limits the risk of population overcount. Therefore, it is more likely that residents were undercounted during CSO- Ministry of Planning’s census operations (see: Shah, N. Population of Kuwait. Structure and Dynamics, Kuwait: Kuwait University Academic Publication Council, 2010, chapter 1).
(a) Kuwaiti: the Kuwaiti nationality rests upon a document of Kuwaiti nationality or a certificate proving Kuwaiti nationality issued by the Ministry of Interior of Kuwait.
(b) Non-Kuwaiti: his/ her nationality is determined by the name of the State which issued the passport. The foreign national also entered Kuwait legally and has a stamp of residence.
This category includes the Bidoon, a category of stateless persons living in the Emirate. Kuwait’s Bidoon population originates from three broad categories:
1) those whose ancestors failed to apply for nationality or lacked necessary documentation at the time of Kuwait’s independence in 1961;
2) those recruited to work in Kuwait’s army or police force during the 1960s who permanently settled in Kuwait, along with their families;
3) children of Kuwaiti mothers and stateless or foreign fathers (see Human Rights Watch. Prisoners of the Past. Kuwaiti Bidun and the Burden of Statelessness, June 2011, p. 3).
(The children of Kuwaiti mothers and non-Kuwaiti fathers (with specific nationality) inherit the father’s nationality. They are stateless if the father is stateless).
2. Institution which provides data
The Public Authority for Civil Information (PACI)
3. Period of data coverage: December 2013
The database is updated three times a year and the website presents only the most recent data.
4. Data availability
The statistics section of PACI’s website (http://www.paci.gov.kw/en/ (English); http://www.paci.gov.kw/ (Arabic)) provides population and socio-economic data broken down by nationality (Kuwaiti/ non-Kuwaiti). Some data are displayed by nationality groups.
Analytical tables and data crosstabulations are available for download in PDF, html, .png and Excel (.csv) formats.
Date of access: March 2014.
| Nationality group |
TOTAL |
| Kuwaitis |
1,242,499 |
| Arabs |
1,106,630 |
| Asians |
1,500,011 |
| Africans |
76,703 |
| Europeans |
14,641 |
| North Americans |
21,522 |
| South Americans |
1,432 |
| Australians- Oceanians |
1,706 |
| Total non-Kuwaitis |
2,722,645 |
| Grand total |
3,965,144 |
Source: PACI
ANNEXED NOTE
1. Characteristics of data and definitions
The source of data used here is the Public Authority for Civil Information (PACI), an independant government body in charge of :
1- centralising all population and labour force data in order to manage a fully computerised population register
2- issuing mandatory civil identification cards to every resident of the country, regardless of age and nationality.
The other source of demographic and socioeconomic data on Kuwait is the Central Statistical Office (CSO), operating within the Planning Ministry. The CSO has conducted ten population and housing censuses since its inception in 1957.
Since 1995 a marked discrepancy was witnessed between PACI’ and CSO’ population figures. PACI’ database is connected electronically with other administrations and bodies registering demographic events and professional/ residency issues (births and death; departures and arrivals; end of service, residency and ID deliveries, etc.).
PACI’s records of residents’ movements is thus regularly updated, which limits the risk of population overcount. Therefore, it is more likely that residents were undercounted during CSO- Ministry of Planning’s census operations (see: Shah, N. Population of Kuwait. Structure and Dynamics, Kuwait: Kuwait University Academic Publication Council, 2010, chapter 1).
(a) Kuwaiti: the Kuwaiti nationality rests upon a document of Kuwaiti nationality or a certificate proving Kuwaiti nationality issued by the Ministry of Interior of Kuwait.
(b) Non-Kuwaiti: his/ her nationality is determined by the name of the State which issued the passport. The foreign national also entered Kuwait legally and has a stamp of residence.
This category includes the Bidoon, a category of stateless persons living in the Emirate. Kuwait’s Bidoon population originates from three broad categories:
1) those whose ancestors failed to apply for nationality or lacked necessary documentation at the time of Kuwait’s independence in 1961;
2) those recruited to work in Kuwait’s army or police force during the 1960s who permanently settled in Kuwait, along with their families;
3) children of Kuwaiti mothers and stateless or foreign fathers (see Human Rights Watch. Prisoners of the Past. Kuwaiti Bidun and the Burden of Statelessness, June 2011, p. 3).
(The children of Kuwaiti mothers and non-Kuwaiti fathers (with specific nationality) inherit the father’s nationality. They are stateless if the father is stateless).
(c) Nationality group: collected according to the nationality of the head of the household.
Nationalities are grouped according to specific features common to certain population subgroups: language, geographic origin, etc. or according to internationally recognized categories such as: (Arab / non-Arab Asian countries / non-Arab African countries; European countries … etc.).
2. Institution which provides data
The Public Authority for Civil Information (PACI)
3. Period of data coverage: 31 December 2013
The database is updated three times a year and the website presents only the most recent data.
4. Data availability
The statistics section of PACI’s website (http://www.paci.gov.kw/en/ (English); http://www.paci.gov.kw/ (Arabic)) provides population and socio-economic data broken down by nationality (Kuwaiti/ non-Kuwaiti). Some data are displayed by nationality groups.
Analytical tables and data crosstabulations are available for download in PDF, html, .png and Excel (.csv) formats.
Date of access: March 2014
| Year |
Kuwaitis |
Non-Kuwaitis |
Total |
| 1990 |
578,511 |
1,573,169 |
2,151,680 |
| 1993 |
657,493 |
988,134 |
1,645,627 |
| 1995 |
708,115 |
1,250,679 |
1,958,794 |
| 1996 |
732,403 |
1,361,486 |
2,093,889 |
| 1998 |
786,010 |
1,484,855 |
2,270,865 |
| 1999 |
812,255 |
1,442,699 |
2,254,954 |
| 2000 |
841,790 |
1,375,468 |
2,217,258 |
| 2001 |
870,283 |
1,438,819 |
2,309,102 |
| 2002 |
898,285 |
1,521,643 |
2,419,928 |
| 2003 |
927,686 |
1,618,998 |
2,546,684 |
| 2004 |
956,234 |
1,797,422 |
2,753,656 |
| 2005 |
992,217 |
1,998,972 |
2,991,189 |
| 2006 |
1,023,316 |
2,159,644 |
3,182,960 |
| 2007 |
1,054,598 |
2,345,039 |
3,399,637 |
| 2008 |
1,087,552 |
2,354,261 |
3,441,813 |
| 2009 |
1,118,911 |
2,365,970 |
3,484,881 |
| 2010 |
1,148,363 |
2,433,691 |
3,582,054 |
| 2011 |
1,183,185 |
2,514,107 |
3,697,292 |
| 2012 |
1,212,436 |
2,611,292 |
3,823,728 |
| 2013 |
1,242,499 |
2,722,645 |
3,965,144 |
Source: PACI
ANNEXED NOTE
1. Characteristics of data and definitions
The source of data used here is the Public Authority for Civil Information (PACI), an independant government body in charge of :
1- centralising all population and labour force data in order to manage a fully computerised population register
2- issuing mandatory civil identification cards to every resident of the country, regardless of age and nationality.
The other source of demographic and socioeconomic data on Kuwait is the Central Statistical Office (CSO), operating within the Planning Ministry. The CSO has conducted ten population and housing censuses since its inception in 1957.
Since 1995 a marked discrepancy was witnessed between PACI’ and CSO’ population figures. PACI’ database is connected electronically with other administrations and bodies registering demographic events and professional/ residency issues (births and death; departures and arrivals; end of service, residency and ID deliveries, etc.).
PACI’s records of residents’ movements is thus regularly updated, which limits the risk of population overcount. Therefore, it is more likely that residents were undercounted during CSO- Ministry of Planning’s census operations (see: Shah, N. Population of Kuwait. Structure and Dynamics, Kuwait: Kuwait University Academic Publication Council, 2010, chapter 1).
(a) Kuwaiti: the Kuwaiti nationality rests upon a document of Kuwaiti nationality or a certificate proving Kuwaiti nationality issued by the Ministry of Interior of Kuwait.
(b) Non-Kuwaiti: his/ her nationality is determined by the name of the State which issued the passport. The foreign national also entered Kuwait legally and has a stamp of residence.
This category includes the Bidoon, a category of stateless persons living in the Emirate. Kuwait’s Bidoon population originates from three broad categories:
1) those whose ancestors failed to apply for nationality or lacked necessary documentation at the time of Kuwait’s independence in 1961;
2) those recruited to work in Kuwait’s army or police force during the 1960s who permanently settled in Kuwait, along with their families;
3) children of Kuwaiti mothers and stateless or foreign fathers (see Human Rights Watch. Prisoners of the Past. Kuwaiti Bidun and the Burden of Statelessness, June 2011, p. 3).
(The children of Kuwaiti mothers and non-Kuwaiti fathers (with specific nationality) inherit the father’s nationality. They are stateless if the father is stateless).
2. Institution which provides data
The Public Authority for Civil Information (PACI)
3. Period of data coverage: 31 December, given years
The database is updated three times a year and the website presents only the most recent data.
4. Data availability
The statistics section of PACI’s website (http://www.paci.gov.kw/en/ (English); http://www.paci.gov.kw/ (Arabic)) provides population and socio-economic data broken down by nationality (Kuwaiti/ non-Kuwaiti). Some data are displayed by nationality groups.
Analytical tables and data crosstabulations are available for download in PDF, html, .png and Excel (.csv) formats.
Date of access: March 2014
|
Workers |
Family dependants |
Total |
| India |
452,578 |
92,224 |
544,802 |
| Philippines |
165,447 |
19,201 |
184,648 |
| Nepal |
339,901 |
778 |
340,679 |
| Bangladesh |
130,630 |
6,615 |
137,245 |
Source: NHRC
1. Data collection methodology
The figures were released during a press conference held October 1, 2013, between NHRC and official representatives of the Nepalese community residing in Qatar.
The press conference followed the publication by the Guardian Newspaper, of reports of fatal work accidents for Nepalese construction workers employed
in the building of 2022′ World Cup facilities.
The figures presented here were quoted in the press. Writers stated they were originally retrieved from a report by Qatar’s National Human Rights Committee (which could not be found).
2. Data availability
The figures have been published in the press:
In Arabic: Al Raya newspaper http://www.raya.com/news/locals (October 1, 2013, p.20)
In English: http://www.arabianbusiness.com/qatar-s-population-exceeds-2m-521314.html (English)
|
Qatari |
Non-Qatari |
Total |
|
Males |
Females |
Total |
Males |
Females |
Total |
Males |
Females |
Total |
| Government Department |
39,139 |
19,630 |
58,769 |
44,458 |
8,425 |
52,883 |
83,597 |
28,055 |
111,652 |
| Government Company/ Corporation |
7,427 |
3,132 |
10,559 |
28,734 |
10,803 |
39,537 |
36,161 |
13,935 |
50,096 |
| Mixed |
4,645 |
986 |
5,631 |
30,157 |
4,757 |
34,914 |
34,802 |
5,743 |
40,545 |
| Private |
4,402 |
3,262 |
7,664 |
963,067 |
25,690 |
988,757 |
967,469 |
28,952 |
996,421 |
| Diplomatic/International/Regional |
15 |
6 |
21 |
1,334 |
325 |
1,659 |
1,349 |
331 |
1,680 |
| Non profit |
113 |
56 |
169 |
439 |
287 |
726 |
552 |
343 |
895 |
| Domestic |
0 |
0 |
0 |
49,543 |
90,361 |
139,904 |
49,543 |
90,361 |
139,904 |
| Total |
55,741 |
27,072 |
82,813 |
1,117,732 |
140,648 |
1,258,380 |
1,173,473 |
167,720 |
1,341,193 |
Source: Labour Force Bulletin 2012, Qatar Statistics Authority
ANNEXED NOTE
1. Technical Notes and Definitions
Sampling frame of LFB 2012: Population Census 2010.
Sample size: 6895 households and 37629 individuals from: 1- Qatari households; 2- Non-Qatari regular (non-collective) households; 3- Non-Qatari small collective households (2 – 6 persons); 4- Non-Qatari large collective households (7 persons or more).
Reference period for data collection: April 2012.
Reference period for the labor force data: the week prior to the reference period for data collection (April 2012).
Population of reference: all Qatari and non-Qatari households present in Qatar on the night of survey, living in normal and collective households.
The collective households are a group of persons not related to each other and sharing living conditions in a residential unit, I.e. labor camps, students living boarding schools, nurses in hospitals… etc. The survey covered the small collective households (includes less than 7 persons) and large collective households (includes 7 persons or more).
The survey did not cover short periods accommodation, i.e. hotels.
The table refers to the economically active population: People in the working age including employed and unemployed.
Employed population:
Persons aged 15 years an above, who during the week preceding the survey:
a) Perform a work for a wage, salary, profits or household gains, whether it was in cash or in kind.
b) Are temporarily not employed, however, they still have an official relation with their work
The table refers to employed workers (15 years or older) having worked no less than one hour during the week prior to data collection day in April 2012.
Unemployed population:
All persons aged 15 years and over who were, during the week preceding the survey, without work and were willing to work and looking seriously for work.
There is a distinction between two kinds of unemployed persons:
a) First time unemployed: They are the persons who never worked previously, and were during the week preceding the survey looking actively for work.
b)Unemployed who previously worked: They are the persons with previous experience work and during the week preceding the survey were actively looking for work.
The present table does not include the persons seeking work for the first time
2. Institution which provides data
Qatar Statistics Authority (QSA)
(https://www.mdps.gov.qa/en/Pages/default.aspx for website in English; https://www.mdps.gov.qa/ar/pages/default.aspx for website in Arabic)
3. Data availability
The Statistics Authority conducted the first labor Force Sample Survey in 2001. Starting from 2006, the execution of these surveys came to be on annual basis.
Most Labour Force Surveys and publications related to the labour force are available on QSA’s website, in PDF format and can be downloaded from:
https://www.mdps.gov.qa/en/statistics1/pages/topicslisting.aspx?parent=Social&child=LaborForce
Annual Bulletin of the Labour Force survey 2012 is available in PDf and Excel formats:
http://www.qix.gov.qa/portal/page/portal/QIXPOC/Documents/QIX%20Knowledge%20Base/Publication/Labor%20Force%20Researches/labor%20force%20sample%20survey/Source_QSA/Labour_Force_Statistics_QSA_Bu_AE_2012.pdf
https://www.mdps.gov.qa/en/statistics1/pages/topicslisting.aspx?parent=Social&child=LaborForce
See also Qatar Information Exchange, an interactive data base compiling data on the labour force taken from available surveys:
http://www.qix.gov.qa/portal/page/portal/qix/subject_area/Statistics?subject_area=183
Date of access: March 2014.
|
|
Government |
Non- |
Domestic |
|
|
|
sector |
governmental |
services |
TOTAL |
|
|
|
sector |
sector |
|
| Kuwaitis |
males |
168,702 |
44,032 |
0 |
212,734 |
| females |
140,715 |
45,276 |
0 |
185,991 |
| Total |
309,417 |
89,308 |
0 |
398,725 |
| Non-Kuwaitis |
males |
87,133 |
1,107,091 |
268,002 |
1,462,226 |
| females |
42,654 |
118,401 |
306,575 |
467,630 |
| Total |
129,787 |
1,225,492 |
574,577 |
1,929,856 |
| Total |
males |
255,835 |
1,151,123 |
268,002 |
1,674,960 |
| females |
183,369 |
163,677 |
306,575 |
653,621 |
| Total |
439,204 |
1,314,800 |
574,577 |
2,328,581 |
Source: PACI
ANNEXED NOTE
1. Characteristics of data and definitions
The source of data used here is the Public Authority for Civil Information (PACI), an independant government body in charge of :
1- centralising all population and labour force data in order to manage a fully computerised population register
2- issuing mandatory civil identification cards to every resident of the country, regardless of age and nationality.
The other source of demographic and socioeconomic data on Kuwait is the Central Statistical Office (CSO), operating within the Planning Ministry. The CSO has conducted ten population and housing censuses since its inception in 1957.
Since 1995 a marked discrepancy was witnessed between PACI’ and CSO’ population figures. PACI’ database is connected electronically with other administrations and bodies registering demographic events and professional/ residency issues (births and death; departures and arrivals; end of service, residency and ID deliveries, etc.).
PACI’s records of residents’ movements is thus regularly updated, which limits the risk of population overcount. Therefore, it is more likely that residents were undercounted during CSO- Ministry of Planning’s census operations (see: Shah, N. Population of Kuwait. Structure and Dynamics, Kuwait: Kuwait University Academic Publication Council, 2010, chapter 1).
(a) Kuwaiti: the Kuwaiti nationality rests upon a document of Kuwaiti nationality or a certificate proving Kuwaiti nationality issued by the Ministry of Interior of Kuwait.
(b) Non-Kuwaiti: his/ her nationality is determined by the name of the State having issued the passport. The foreign national also entered Kuwait legally and has a stamp of residence.
This category includes the Bidoon, a category of stateless persons living in the Emirate. Kuwait’s Bidoon population originates from three broad categories:
1) those whose ancestors failed to apply for nationality or lacked necessary documentation at the time of Kuwait’s independence in 1961;
2) those recruited to work in Kuwait’s army or police force during the 1960s who permanently settled in Kuwait, along with their families;
3) children of Kuwaiti mothers and stateless or foreign fathers (see Human Rights Watch. Prisoners of the Past. Kuwaiti Bidun and the Burden of Statelessness, June 2011, p. 3).
(c) Population in the labour force: population aged 15 years and above, included in the labour market, either employed (in the government or private sector, as itinerant worker, employed in the domestic sector), or unemployed.
(d) Government sector: any organization of the government (organizations, authority and departments), included within the state budget
(Ministries and government departments; authorities with attached budgets; authorities with independent budgets).
(e) Non-governmental sector: any part of the private sector (a company or an individual) or any authority of the non-governmental sector.
(f) Domestic sector: the household/ family sector, where the work is associated with the residence and its inhabitants, their service and their comfort (including maids, nannies, cooks, drivers, etc.).
Note: figures of expatriates differ slightly between PACI’s various sources of data (database; tabulated data).
2. Institution which provides data
The Public Authority for Civil Information (PACI)
3. Period of data coverage: December 2013
The database is updated three times a year and the website presents only the most recent data.
4. Data availability
The statistics section of PACI’s website (http://www.paci.gov.kw/en/ (English); http://www.paci.gov.kw/ (Arabic)) provides population and socio-economic data broken down by nationality (Kuwaiti/ non-Kuwaiti). Some data are displayed by nationality groups.
Analytical tables and data crosstabulations are available for download in PDF, html, .png and Excel (.csv) formats.
Date of access: March 2014.
| Sex |
Age group |
| 24 -15 |
34 – 25 |
44 -35 |
54 – 45 |
64 – 55 |
65 and + |
Total |
| Males |
133.555 |
366.687 |
281.190 |
102.802 |
18.069 |
1.441 |
903.744 |
| Females |
2.689 |
8.132 |
2.544 |
857 |
171 |
13 |
14.406 |
| Total |
136.244 |
374.819 |
283.734 |
103.659 |
18.240 |
1.454 |
918.150 |
Source: census 2010, QSA
1. Technical Notes and Definitions
Reference period for census 2010: the night of April 21st, 2010.
Implementation method: census is based on de jure method; i.e. registering people according to their usual place of residence at time of census.
Populations in transit or visiting Qatar as tourists, as well as residents of public housing or visitors staying in a household for less than two months after night of reference were excluded.
Populations away from usual residence in Qatar for reasons of duty, or on a visit abroad for less than two months, as well as individuals with no personal housing within Qatar staying with a household for more than two months, are counted in their usual/ present residence during census night.
Population of reference: all individuals (nationals and non-nationals) present within the State’s borders during time of reference.
“2010′ census recorded all the residents. Eight questionnaires covering the key census areas were designed, in order to ensure that all units (establishments; buildings; residential units; houses and individuals) are covered by the census.
The eight questionnaires are as follows:
1. Enumeration of buildings;
2. Enumeration of establishments, residential units and houses.
3. Survey of establishments (usage, et cetera);
4. Family living conditions;
5. Survey of labour camp residents;
6. Survey of public housing residents;
7. Survey of hotel residents and transit travellers through airports, ports and land border crossings;
8. Survey of Qataris living abroad.
Public Housing: It is the collective living quarters (e.g. internal wards in hospitals, dormitories for students, jails, etc.) where individuals reside for some reason. The inmates do not form a family or census household but they have common circumstances to be in public housing. They do not have a usual place of residence in Qatar or they may stay in the collective living quarters away from their usual place of residence.
Continuity may be the prevailing characteristic of accommodation in some types of public housing such as the hospital or the jail. The accommodation may not take more than one night or a few nights. Then, they depart after that, e.g. hotel or guest house
Living Household: For census purposes, a living household is defined as an individual or group of individuals who may or may not be relatives. They live together and make common provisions for food, accommodation and other essentials for living. Anyone who is usually living in the housing unit of the household under enumeration is considered a member of that household (including the servants).
For census purposes, the following are considered as members of the household:
1) The person who spent the enumeration night (zero moment 20-21/04/2010) with the household in the housing unit. This person is referred to as “present”.
2) The person who did not spend the census night in the housing unit for one of the following reasons (This person is referred to as “temporary absent”):
- The person on shift in his work e.g. a physician in a hospital.
- The person on permanent night shifts e.g. night watchman.
- The person on fishing trips in the territorial waters.
- Armed forces personnel stationed within the political boundaries of the State.
- The person who is absent for any other reason from the housing units for a period not exceeding two months preceding the enumeration night.
3) A visitor: He/she is the person who happened to be present at the housing unit on the census night. No data should be taken about him/her if he/she has a usual place of residence inside Qatar and not being absent for a period exceeding two months from that place. But, if he/she has not got a place of usual residence inside Qatar, then information about him should be taken together with the household in that housing unit being enumerated. He/she shall be referred to as a “Visitor”.
4) Qatari household members residing outside the country for any reason and for any time period shall be counted among the household members and to be referred to as “Outside the country”.
Labour camps (or Labour gatherings)
Small Clusters (Gatherings) A group of persons of the same gender (male of female) usually staying in the housing unit. They live as a group (collectively) but there is no relationship between them and they do not form a living household. Their number ranges between 2 and 6 persons
Big Clusters (Gatherings) A group of persons of the same gender usually staying in housing units. They live as a group (collectively) but there is no relationship between them and they do not form a living household. They are seven or more persons who usually belong to one organization (company, establishment, etc).
(Definitions taken from Census 2010′ metadata: https://www.mdps.gov.qa/en/statistics/Statistical%20Releases/General/Census/Population_Households_Establishment_QSA_Census_AE_2010_1.pdf)
2. Institution which provides data
Qatar Statistics Authority (QSA), Ministry of Development Planning and Statistics
(http://www.qsa.gov.qa/eng/index.htm for website in English; http://www.qsa.gov.qa/Ar/index.htm for website in Arabic)
3. Data availability
The present table was published in Census 2010′ final results:
(PDF format only)
https://www.mdps.gov.qa/en/statistics1/pages/topicslisting.aspx?parent=General&child=Census
Census 2010′ website:
https://www.mdps.gov.qa/en/statistics1/pages/topicslisting.aspx?parent=General&child=Census
2010′ census in Excel or PDF format individual tables:
http://www.qsa.gov.qa/QatarCensus/Census_Results.aspx
Last date of access: February 19, 2014.
| Sex and educational attainment |
Age group |
Total |
| 24 -15 |
34 – 25 |
44 -35 |
54 – 45 |
64 – 55 |
65 |
| Illiterate |
6.338 |
13348 |
9067 |
4226 |
1827 |
354 |
35.160 |
| Read and write Night school |
46.899 |
101.021 |
67.646 |
36.612 |
5625 |
556 |
258.359 |
| Primary |
42.176 |
100217 |
80997 |
27246 |
4256 |
263 |
255.155 |
| Preparatory |
10.557 |
41.152 |
42.198 |
6.602 |
1199 |
48 |
101.756 |
| Vocational |
3.824 |
9501 |
5566 |
2042 |
339 |
21 |
21.293 |
| Secondary |
17.517 |
72.984 |
60.036 |
18.817 |
2921 |
105 |
172.380 |
| Post secondary |
2.716 |
8644 |
5418 |
2144 |
457 |
18 |
19.397 |
| University and above |
3.528 |
19.820 |
10.262 |
5.113 |
1445 |
76 |
40.244 |
| Total Males |
133.555 |
366.687 |
281.190 |
102.802 |
18.069 |
1.441 |
903.744 |
| Illiterate |
12 |
31 |
19 |
16 |
6 |
2 |
86 |
| Read and write Night school |
242 |
658 |
339 |
139 |
35 |
6 |
1.419 |
| Primary |
244 |
701 |
307 |
77 |
10 |
1 |
1.340 |
| Preparatory |
99 |
198 |
88 |
33 |
7 |
0 |
425 |
| Vocational |
17 |
51 |
19 |
7 |
0 |
1 |
95 |
| Secondary |
1.441 |
3.286 |
460 |
106 |
13 |
1 |
5.307 |
| Post secondary |
152 |
744 |
267 |
81 |
22 |
0 |
1.266 |
| University and above |
482 |
2.463 |
1.045 |
398 |
78 |
2 |
4.468 |
| Total Females |
2.689 |
8.132 |
2.544 |
857 |
171 |
13 |
14.406 |
| Illiterate |
6.350 |
13379 |
9086 |
4242 |
1833 |
356 |
35.246 |
| Read and write Night school |
47.141 |
101.679 |
67.985 |
36.751 |
5660 |
562 |
259.778 |
| Primary |
42.420 |
100.918 |
81.304 |
27.323 |
4266 |
264 |
256.495 |
| Preparatory |
10.656 |
41.350 |
42.286 |
6.635 |
1206 |
48 |
102.181 |
| Vocational |
3.841 |
9.552 |
5.585 |
2049 |
339 |
22 |
21.388 |
| Secondary |
18.958 |
76.270 |
60.496 |
18.923 |
2934 |
106 |
177.687 |
| Post secondary |
2.868 |
9.388 |
5.685 |
2225 |
479 |
18 |
20.663 |
| University and above |
4.010 |
22.283 |
11.307 |
5.511 |
1523 |
78 |
44.712 |
| Total |
136.244 |
374.819 |
283.734 |
103.659 |
18.240 |
1.454 |
918.150 |
Source: census 2010, QSA
1. Technical Notes and Definitions
Reference period for census 2010: the night of April 21st, 2010.
Implementation method: census is based on de jure method; i.e. registering people according to their usual place of residence at time of census.
Populations in transit or visiting Qatar as tourists, as well as residents of public housing or visitors staying in a household for less than two months after night of reference were excluded.
Populations away from usual residence in Qatar for reasons of duty, or on a visit abroad for less than two months, as well as individuals with no personal housing within Qatar staying with a household for more than two months, are counted in their usual/ present residence during census night.
Population of reference: all individuals (nationals and non-nationals) present within the State’s borders during time of reference.
“2010′ census recorded all the residents. Eight questionnaires covering the key census areas were designed, in order to ensure that all units (establishments; buildings; residential units; houses and individuals) are covered by the census.
The eight questionnaires are as follows:
1. Enumeration of buildings;
2. Enumeration of establishments, residential units and houses.
3. Survey of establishments (usage, et cetera);
4. Family living conditions;
5. Survey of labour camp residents;
6. Survey of public housing residents;
7. Survey of hotel residents and transit travellers through airports, ports and land border crossings;
8. Survey of Qataris living abroad.
Public Housing: It is the collective living quarters (e.g. internal wards in hospitals, dormitories for students, jails, etc.) where individuals reside for some reason. The inmates do not form a family or census household but they have common circumstances to be in public housing. They do not have a usual place of residence in Qatar or they may stay in the collective living quarters away from their usual place of residence.
Continuity may be the prevailing characteristic of accommodation in some types of public housing such as the hospital or the jail. The accommodation may not take more than one night or a few nights. Then, they depart after that, e.g. hotel or guest house
Living Household: For census purposes, a living household is defined as an individual or group of individuals who may or may not be relatives. They live together and make common provisions for food, accommodation and other essentials for living. Anyone who is usually living in the housing unit of the household under enumeration is considered a member of that household (including the servants).
For census purposes, the following are considered as members of the household:
1) The person who spent the enumeration night (zero moment 20-21/04/2010) with the household in the housing unit. This person is referred to as “present”.
2) The person who did not spend the census night in the housing unit for one of the following reasons (This person is referred to as “temporary absent”):
- The person on shift in his work e.g. a physician in a hospital.
- The person on permanent night shifts e.g. night watchman.
- The person on fishing trips in the territorial waters.
- Armed forces personnel stationed within the political boundaries of the State.
- The person who is absent for any other reason from the housing units for a period not exceeding two months preceding the enumeration night.
3) A visitor: He/she is the person who happened to be present at the housing unit on the census night. No data should be taken about him/her if he/she has a usual place of residence inside Qatar and not being absent for a period exceeding two months from that place. But, if he/she has not got a place of usual residence inside Qatar, then information about him should be taken together with the household in that housing unit being enumerated. He/she shall be referred to as a “Visitor”.
4) Qatari household members residing outside the country for any reason and for any time period shall be counted among the household members and to be referred to as “Outside the country”.
Labour camps (or Labour gatherings)
Small Clusters (Gatherings) A group of persons of the same gender (male of female) usually staying in the housing unit. They live as a group (collectively) but there is no relationship between them and they do not form a living household. Their number ranges between 2 and 6 persons
Big Clusters (Gatherings) A group of persons of the same gender usually staying in housing units. They live as a group (collectively) but there is no relationship between them and they do not form a living household. They are seven or more persons who usually belong to one organization (company, establishment, etc).
(Definitions taken from Census 2010′ metadata: https://www.mdps.gov.qa/en/statistics/Statistical%20Releases/General/Census/Population_Households_Establishment_QSA_Census_AE_2010_1.pdf)
2. Institution which provides data
Qatar Statistics Authority (QSA), Ministry of Development Planning and Statistics
(http://www.qsa.gov.qa/eng/index.htm for website in English; http://www.qsa.gov.qa/Ar/index.htm for website in Arabic)
3. Data availability
The present table was published in Census 2010′ final results:
(PDF format only)
https://www.mdps.gov.qa/en/statistics1/pages/topicslisting.aspx?parent=General&child=Census
Census 2010′ website:
https://www.mdps.gov.qa/en/statistics1/pages/topicslisting.aspx?parent=General&child=Census
2010′ census in Excel or PDF format individual tables:
http://www.qsa.gov.qa/QatarCensus/Census_Results.aspx
Last date of access: February 19, 2014.
| 2010 |
Saudis |
Non-Saudis |
Total |
| |
males |
females |
total |
males |
females |
total |
males |
females |
total |
| Managers and Business Managers |
7268.95 |
5273.08 |
7186.39 |
7128.46 |
5852.48 |
7123.40 |
7254.32 |
5279.23 |
7180.05 |
| Specialists in Scientific, Technical and Humanities Fields |
5589.58 |
3252.03 |
5318.27 |
3318.86 |
3944.01 |
3337.11 |
3641.73 |
3653.48 |
3642.23 |
| Technicians in Scientific, Technical and Humanities Fields |
4217.73 |
2018.12 |
3773.10 |
1773.70 |
1904.11 |
1787.85 |
2127.24 |
1933.80 |
2103.38 |
| Clerical Workers |
3312.89 |
2769.49 |
3265.65 |
2408.30 |
3846.92 |
2459.45 |
3268.79 |
2790.46 |
3228.35 |
| Sales Workers |
2272.91 |
1654.27 |
2229.17 |
1379.16 |
1968.64 |
1379.37 |
1648.14 |
1657.55 |
1648.36 |
| Service Workers |
2256.92 |
1809.97 |
2234.61 |
796.58 |
725.40 |
795.65 |
913.88 |
1003.49 |
915.33 |
| Agriculture, Animal Husbandry and Fishing |
6426.19 |
1646.07 |
6388.89 |
704.75 |
619.56 |
704.73 |
816.32 |
1041.90 |
816.41 |
| Industrial, Chemical and Food Industries |
4395.01 |
1598.39 |
4195.17 |
887.05 |
894.16 |
887.32 |
1122.54 |
980.14 |
1116.76 |
| Engineering Support |
3068.27 |
2179.78 |
3059.71 |
840.65 |
792.34 |
840.64 |
900.17 |
1573.92 |
900.48 |
| TOTAL |
3562.25 |
2448.35 |
3476.76 |
1031.42 |
1673.70 |
1040.48 |
1278.71 |
1972.83 |
1293.01 |
Source: Ministry of Labour
1. Technical note
Data is collected as part of the implementation of Nitaqat (saudization) project; results are still being updated
As of January 28, 2014, 1 Saudi Riyal (SAR)= 0,195 Euros (EUR) and 0,2667 US Dollar (USD).
2. Institution which provides data
Ministry of Labour, Saudi Arabia
3. Data availability
The present data is published on the Ministry of Labour’s website (open data library) and is available at:
http://portal.mol.gov.sa/ar/opendata/Pages/default.aspx?m=7
(Excel 1997-2003 only)
Date of access: Febuary 2014
| 2012 |
Saudis |
Non-Saudis |
Total |
|
males |
females |
total |
males |
females |
total |
males |
females |
total |
| Managers and Business Managers |
8453.95 |
2655.73 |
7122.75 |
4537.33 |
2258.61 |
4503.01 |
7766.92 |
2651.44 |
6749.02 |
| Specialists in Scientific, Technical and Humanities Fields |
11968.91 |
3929.62 |
10032.54 |
2922.30 |
3366.69 |
2935.09 |
3722.39 |
3653.56 |
3718.80 |
| Technicians in Scientific, Technical and Humanities Fields |
4549.16 |
2967.99 |
4010.24 |
1553.21 |
1480.12 |
1545.85 |
1971.05 |
2116.55 |
1992.04 |
| Clerical Workers |
4959.83 |
2427.99 |
4281.78 |
1869.05 |
2704.16 |
1894.20 |
4871.50 |
2428.68 |
4229.91 |
| Sales Workers |
2961.90 |
2158.77 |
2731.48 |
1392.88 |
1673.02 |
1393.07 |
1896.77 |
2157.06 |
1926.64 |
| Service Workers |
4275.76 |
2318.04 |
4144.40 |
754.94 |
615.61 |
752.84 |
1118.14 |
1212.16 |
1120.09 |
| Agriculture, Animal Husbandry and Fishing |
2654.67 |
2273.05 |
2594.91 |
480.96 |
451.89 |
480.96 |
488.58 |
1875.98 |
489.73 |
| Industrial, Chemical and Food Industries |
5536.70 |
2012.93 |
4873.52 |
894.94 |
622.67 |
878.79 |
1265.89 |
959.10 |
1244.07 |
| Engineering Support |
4978.72 |
2471.46 |
4840.58 |
742.25 |
739.23 |
742.25 |
927.61 |
2359.51 |
931.50 |
| Others |
9872.97 |
13004.99 |
9964.51 |
5255.83 |
212.72 |
4458.09 |
9532.01 |
8754.31 |
9500.84 |
| TOTAL |
5315.44 |
2613.38 |
4801.43 |
934.14 |
1341.18 |
940.16 |
1427.28 |
2187.29 |
1456.34 |
Source: Ministry of Labour
1. Technical note
Data is collected as part of the implementation of Nitaqat (saudization) project; results are still being updated
“Other” occupations is not defined in MoL website (no metadata available)
As of January 28, 2014, 1 Saudi Riyal (SAR)= 0,195 Euros (EUR) and 0,2667 US Dollar (USD).
2. Institution which provides data
Ministry of Labour, Saudi Arabia
3. Data availability
The present data is published on the Ministry of Labour’s website (open data library) and is available at:
http://portal.mol.gov.sa/ar/opendata/Pages/default.aspx?m=7
(Excel 1997-2003 only)
Date of access: February 2014
|
Qataris |
Non-Qataris |
TOTAL |
| Males |
Females |
Total |
Males |
Females |
Total |
Males |
Females |
Total |
| Doha |
3.006 |
3.057 |
6.063 |
29.486 |
4.075 |
33.561 |
32.492 |
7.132 |
39.624 |
| Al Rayyan |
687 |
817 |
1.504 |
4.190 |
1.299 |
5.489 |
4.877 |
2.116 |
6.993 |
| Al Wakrah |
2.500 |
2.601 |
5.101 |
175.493 |
7.557 |
183.050 |
177.993 |
10.158 |
188.151 |
| Umm Slal |
7.756 |
7.928 |
15.684 |
23.932 |
11.217 |
35.149 |
31.688 |
19.145 |
50.833 |
| Al Khor |
5.279 |
5.265 |
10.544 |
103.253 |
15.438 |
118.691 |
108.532 |
20.703 |
129.235 |
| Al Shamal |
39.684 |
39.182 |
78.866 |
228.948 |
82.996 |
311.944 |
268.632 |
122.178 |
390.810 |
| Al Da’ayen |
26.907 |
29.610 |
56.517 |
547.773 |
121.906 |
669.679 |
574.680 |
151.516 |
726.196 |
| Total |
85.819 |
88.460 |
174.279 |
1.113.075 |
244.488 |
1.357.563 |
1.198.894 |
332.948 |
1.531.842 |
Source: census 2010, QSA
ANNEXED NOTE
1. Technical Notes and Definitions
Reference period for census 2010: the night of April 21st, 2010.
Implementation method: census is based on de jure method; i.e. registering people according to their usual place of residence at time of census.
Populations in transit or visiting Qatar as tourists, as well as residents of public housing or visitors staying in a household for less than two months after night of reference were excluded.
Populations away from usual residence in Qatar for reasons of duty, or on a visit abroad for less than two months, as well as individuals with no personal housing within Qatar staying with a household for more than two months, are counted in their usual/ present residence during census night.
Population of reference: all individuals (nationals and non-nationals) present within the State’s borders during time of reference.
“2010′ census recorded all the residents. Eight questionnaires covering the key census areas were designed, in order to ensure that all units (establishments; buildings; residential units; houses and individuals) are covered by the census.
The eight questionnaires are as follows:
1. Enumeration of buildings;
2. Enumeration of establishments, residential units and houses.
3. Survey of establishments (usage, et cetera);
4. Family living conditions;
5. Survey of labour camp residents;
6. Survey of public housing residents;
7. Survey of hotel residents and transit travellers through airports, ports and land border crossings;
8. Survey of Qataris living abroad.
2010′ census was the first conducted with the help of PDA devices (Personal Digital Assistant).
2. Institution which provides data
Qatar Statistics Authority (QSA), Ministry of Development Planning and Statistics
(https://www.mdps.gov.qa/en/Pages/default.aspx for website in English; https://www.mdps.gov.qa/ar/pages/default.aspx for website in Arabic)
3. Data availability
None of Qatar censuses or other sources have ever disclosed figures of total population broken down by country of citizenship or even by nationality (Qatari/non-Qatari).
For 2010 data have been collected but remain withheld. The census only provides detailed data on population 10 or 15 years and above by nationality.
Released parts of census are available on the website of the QSA, in published form in PDF format.
https://www.mdps.gov.qa/en/statistics/Statistical%20Releases/General/Census/Population_Households_Establishment_QSA_Census_AE_2010_1.pdf
Census 2010′ website:
https://www.mdps.gov.qa/en/statistics1/pages/topicslisting.aspx?parent=General&child=Census
2010′ census in Excel or PDF format individual tables:
http://www.qsa.gov.qa/QatarCensus/Census_Results.aspx
The data for the present table have been taken from table 6.8 in the “Education” chapter of 2010 census:
https://www.mdps.gov.qa/en/statistics/Statistical%20Releases/General/Census/Population_Households_Establishment_QSA_Census_AE_2010_1.pdf
Last date of access: 19 February 2014.
| Educational Specialization |
|
Qataris |
Non-Qataris |
| |
24 -15 |
34 – 25 |
44 -35 |
54 – 45 |
64 – 55 |
+ 65 |
Total |
24 -15 |
34 – 25 |
44 -35 |
54 – 45 |
64 – 55 |
+ 65 |
Total |
| 01-09 General Programs |
Males |
22.598 |
11.839 |
7.541 |
5.373 |
2.907 |
3.254 |
15.821 |
153.303 |
362.839 |
283.249 |
114.463 |
25.311 |
3.078 |
28.389 |
| Females |
21.317 |
9.446 |
6.804 |
6.726 |
4.325 |
3.811 |
17.855 |
34.388 |
63.503 |
35.714 |
16.284 |
4.825 |
1.539 |
6.364 |
| Total |
43.915 |
21.285 |
14.345 |
12.099 |
7.232 |
7.065 |
33.676 |
187.691 |
426.342 |
318.963 |
130.747 |
30.136 |
4.617 |
34.753 |
| 14 Education |
Males |
36 |
254 |
313 |
136 |
102 |
10 |
551 |
193 |
1.028 |
1.107 |
734 |
413 |
99 |
512 |
| Females |
273 |
1.241 |
1.391 |
857 |
135 |
5 |
2.383 |
593 |
2.799 |
2.205 |
1.241 |
410 |
70 |
480 |
| Total |
309 |
1.495 |
1.704 |
993 |
237 |
15 |
2.934 |
786 |
3.827 |
3.312 |
1.975 |
823 |
169 |
992 |
| 21-22 Humanitarian Studies |
Males |
98 |
350 |
533 |
461 |
239 |
67 |
1.233 |
599 |
3.349 |
3.069 |
1.711 |
814 |
232 |
1.046 |
| Females |
409 |
1.777 |
1.877 |
1.269 |
185 |
10 |
3.331 |
993 |
4.588 |
3.277 |
1.527 |
532 |
83 |
615 |
| Total |
507 |
2.127 |
2.410 |
1.730 |
424 |
77 |
4.564 |
1.592 |
7.937 |
6.346 |
3.238 |
1.346 |
315 |
1.661 |
| 31-38 Social Sciences, Business and Law |
Males |
656 |
2.355 |
2.515 |
1.449 |
551 |
111 |
4.515 |
3.214 |
16.567 |
12.993 |
7.570 |
3.040 |
526 |
3.566 |
| Females |
814 |
2.773 |
1.837 |
673 |
96 |
9 |
2.606 |
2.289 |
10.852 |
6.542 |
2.792 |
711 |
51 |
762 |
| Total |
1.470 |
5.128 |
4.352 |
2.122 |
647 |
120 |
7.121 |
5.503 |
27.419 |
19.535 |
10.362 |
3.751 |
577 |
4.328 |
| 42-48 Sciences, Mathematics and Computing |
Males |
176 |
542 |
499 |
262 |
83 |
13 |
844 |
1.118 |
4.994 |
3.366 |
1.650 |
612 |
95 |
707 |
| Females |
337 |
1.557 |
907 |
457 |
57 |
3 |
1.421 |
1.072 |
4.212 |
2.115 |
872 |
205 |
25 |
230 |
| |
Total |
513 |
2.099 |
1.406 |
719 |
140 |
16 |
2.265 |
2.190 |
9.206 |
5.481 |
2.522 |
817 |
120 |
937 |
| 52-58 Engineering, Manufacturing and Construction |
Males |
390 |
1.181 |
1.001 |
699 |
236 |
28 |
1.936 |
4.254 |
24.719 |
21.881 |
12.745 |
4.520 |
453 |
4.973 |
| Females |
209 |
396 |
144 |
42 |
9 |
1 |
195 |
718 |
2.967 |
1.511 |
581 |
167 |
15 |
182 |
| Total |
599 |
1.577 |
1.145 |
741 |
245 |
29 |
2.131 |
4.972 |
27.686 |
23.392 |
13.326 |
4.687 |
468 |
5.155 |
| 62-64 Agriculture and Veterinary |
Males |
1 |
88 |
88 |
22 |
11 |
3 |
121 |
79 |
540 |
455 |
305 |
147 |
21 |
168 |
| Females |
10 |
95 |
102 |
15 |
0 |
0 |
117 |
62 |
387 |
229 |
99 |
31 |
3 |
34 |
| Total |
11 |
183 |
190 |
37 |
11 |
3 |
238 |
141 |
927 |
684 |
404 |
178 |
24 |
202 |
| 72-76 Health and Social Services (Welfare) |
Males |
17 |
213 |
221 |
93 |
59 |
9 |
373 |
339 |
1.981 |
2.035 |
1.045 |
492 |
81 |
573 |
| Females |
52 |
646 |
577 |
205 |
37 |
2 |
819 |
843 |
4.951 |
3.463 |
1.432 |
383 |
39 |
422 |
| Total |
69 |
859 |
798 |
298 |
96 |
11 |
1.192 |
1.182 |
6.932 |
5.498 |
2.477 |
875 |
120 |
995 |
| 81-86 Services |
Males |
210 |
500 |
453 |
545 |
136 |
11 |
1.134 |
518 |
2.514 |
1.893 |
1.176 |
474 |
58 |
532 |
| Females |
62 |
264 |
356 |
119 |
3 |
0 |
478 |
257 |
1.123 |
638 |
230 |
88 |
2 |
90 |
| Total |
272 |
764 |
809 |
664 |
139 |
11 |
1.612 |
775 |
3.637 |
2.531 |
1.406 |
562 |
60 |
622 |
| Total |
Males |
24.182 |
17.322 |
13.164 |
9.040 |
4.324 |
3.506 |
26.528 |
163.617 |
418.531 |
330.048 |
141.399 |
35.823 |
4.643 |
40.466 |
| |
Females |
23.483 |
18.195 |
13.995 |
10.363 |
4.847 |
3.841 |
29.205 |
41.215 |
95.382 |
55.694 |
25.058 |
7.352 |
1.827 |
9.179 |
| |
Total |
47.665 |
35.517 |
27.159 |
19.403 |
9.171 |
7.347 |
55.733 |
204.832 |
513.913 |
385.742 |
166.457 |
43.175 |
6.470 |
49.645 |
Source: census 2010, QSA
ANNEXED NOTE
1. Technical Notes and Definitions
Reference period for census 2010: the night of April 21st, 2010.
Implementation method: census is based on de jure method; i.e. registering people according to their usual place of residence at time of census.
Populations in transit or visiting Qatar as tourists, as well as residents of public housing or visitors staying in a household for less than two months after night of reference were excluded.
Populations away from usual residence in Qatar for reasons of duty, or on a visit abroad for less than two months, as well as individuals with no personal housing within Qatar staying with a household for more than two months, are counted in their usual/ present residence during census night.
Population of reference: all individuals (nationals and non-nationals) present within the State’s borders during time of reference.
“2010′ census recorded all the residents. Eight questionnaires covering the key census areas were designed, in order to ensure that all units (establishments; buildings; residential units; houses and individuals) are covered by the census.
The eight questionnaires are as follows:
1. Enumeration of buildings;
2. Enumeration of establishments, residential units and houses.
3. Survey of establishments (usage, et cetera);
4. Family living conditions;
5. Survey of labour camp residents;
6. Survey of public housing residents;
7. Survey of hotel residents and transit travellers through airports, ports and land border crossings;
8. Survey of Qataris living abroad.
Classification used for education specialisation is ISCED (1997)
2. Institution which provides data
Qatar Statistics Authority (QSA), Ministry of Development Planning and Statistics
(http://www.qsa.gov.qa/eng/index.htm for website in English; http://www.qsa.gov.qa/Ar/index.htm for website in Arabic)
3. Data availability
None of Qatar censuses or other sources have ever disclosed figures of total population broken down by country of citizenship or even by nationality (Qatari/non-Qatari).
For 2010 data have been collected but remain withheld. The census only provides detailed data on population 15 years and above by nationality.
Released parts of census are available on the website of the QSA, in published form in PDF format.
https://www.mdps.gov.qa/en/statistics1/pages/topicslisting.aspx?parent=General&child=Census
Census 2010′ website:
https://www.mdps.gov.qa/en/statistics1/pages/topicslisting.aspx?parent=General&child=Census
2010′ census in Excel or PDF format individual tables:
http://www.qsa.gov.qa/QatarCensus/Census_Results.aspx
The data for the present table have been taken from table 6.6 in the “Education” chapter of 2010 census:
https://www.mdps.gov.qa/en/statistics/Statistical%20Releases/General/Census/Population_Households_Establishment_QSA_Census_AE_2010_1.pdf
Last date of access: 19 February 2014.
|
Households |
Labour camps |
Public Housing |
TOTAL |
|
males |
females |
total |
males |
females |
total |
males |
females |
total |
males |
females |
total |
| Doha |
173,792 |
174,866 |
348,658 |
436,539 |
10,954 |
447,493 |
486 |
310 |
796 |
610,817 |
186,130 |
796,947 |
| Al Rayyan |
139,067 |
151,126 |
290,193 |
161,896 |
2,545 |
164,441 |
879 |
110 |
989 |
301,842 |
153,781 |
455,623 |
| Al Wakrah |
25,316 |
26,325 |
51,641 |
89,382 |
199 |
89,581 |
0 |
0 |
0 |
114,698 |
26,524 |
141,222 |
| Umm Slal |
20,022 |
23,616 |
43,638 |
16,678 |
193 |
16,871 |
0 |
0 |
0 |
36,700 |
23,809 |
60,509 |
| Al Khor |
11,925 |
12,527 |
24,452 |
169,028 |
429 |
169,457 |
52 |
22 |
74 |
181,005 |
12,978 |
193,983 |
| Al Shamal |
1,933 |
2,567 |
4,500 |
3,419 |
56 |
3,475 |
0 |
0 |
0 |
5,352 |
2,623 |
7,975 |
| Al Da’ayen |
7,523 |
8,821 |
16,344 |
26,802 |
30 |
26,832 |
0 |
0 |
0 |
34,325 |
8,851 |
43,176 |
| Total |
379,578 |
399,848 |
779,426 |
903,744 |
14,406 |
918,150 |
1,417 |
442 |
1,859 |
1,284,739 |
414,696 |
1,699,435 |
Source: census 2010, QSA
1. Technical Notes and Definitions
Reference period for census 2010: the night of April 21st, 2010.
Implementation method: census is based on de jure method; i.e. registering people according to their usual place of residence at time of census.
Populations in transit or visiting Qatar as tourists, as well as residents of public housing or visitors staying in a household for less than two months after night of reference were excluded.
Populations away from usual residence in Qatar for reasons of duty, or on a visit abroad for less than two months, as well as individuals with no personal housing within Qatar staying with a household for more than two months, are counted in their usual/ present residence during census night.
Population of reference: all individuals (nationals and non-nationals) present within the State’s borders during time of reference.
“2010′ census recorded all the residents. Eight questionnaires covering the key census areas were designed, in order to ensure that all units (establishments; buildings; residential units; houses and individuals) are covered by the census.
The eight questionnaires are as follows:
1. Enumeration of buildings;
2. Enumeration of establishments, residential units and houses.
3. Survey of establishments (usage, et cetera);
4. Family living conditions;
5. Survey of labour camp residents;
6. Survey of public housing residents;
7. Survey of hotel residents and transit travellers through airports, ports and land border crossings;
8. Survey of Qataris living abroad.
Public Housing: It is the collective living quarters (e.g. internal wards in hospitals, dormitories for students, jails, etc.) where individuals reside for some reason. The inmates do not form a family or census household but they have common circumstances to be in public housing. They do not have a usual place of residence in Qatar or they may stay in the collective living quarters away from their usual place of residence.
Continuity may be the prevailing characteristic of accommodation in some types of public housing such as the hospital or the jail. The accommodation may not take more than one night or a few nights. Then, they depart after that, e.g. hotel or guest house
Living Household: For census purposes, a living household is defined as an individual or group of individuals who may or may not be relatives. They live together and make common provisions for food, accommodation and other essentials for living. Anyone who is usually living in the housing unit of the household under enumeration is considered a member of that household (including the servants).
For census purposes, the following are considered as members of the household:
1) The person who spent the enumeration night (zero moment 20-21/04/2010) with the household in the housing unit. This person is referred to as “present”.
2) The person who did not spend the census night in the housing unit for one of the following reasons (This person is referred to as “temporary absent”):
- The person on shift in his work e.g. a physician in a hospital.
- The person on permanent night shifts e.g. night watchman.
- The person on fishing trips in the territorial waters.
- Armed forces personnel stationed within the political boundaries of the State.
- The person who is absent for any other reason from the housing units for a period not exceeding two months preceding the enumeration night.
3) A visitor: He/she is the person who happened to be present at the housing unit on the census night. No data should be taken about him/her if he/she has a usual place of residence inside Qatar and not being absent for a period exceeding two months from that place. But, if he/she has not got a place of usual residence inside Qatar, then information about him should be taken together with the household in that housing unit being enumerated. He/she shall be referred to as a “Visitor”.
4) Qatari household members residing outside the country for any reason and for any time period shall be counted among the household members and to be referred to as “Outside the country”.
Labour camps (or Labour gatherings)
Small Clusters (Gatherings) A group of persons of the same gender (male of female) usually staying in the housing unit. They live as a group (collectively) but there is no relationship between them and they do not form a living household. Their number ranges between 2 and 6 persons
Big Clusters (Gatherings) A group of persons of the same gender usually staying in housing units. They live as a group (collectively) but there is no relationship between them and they do not form a living household. They are seven or more persons who usually belong to one organization (company, establishment, etc).
(Definitions taken from Census 2010′ metadata: https://www.mdps.gov.qa/en/statistics/Statistical%20Releases/General/Census/Population_Households_Establishment_QSA_Census_AE_2010_1.pdf)
2. Institution which provides data
Qatar Statistics Authority (QSA), Ministry of Development Planning and Statistics
(https://www.mdps.gov.qa/en/Pages/default.aspx for website in English; https://www.mdps.gov.qa/ar/pages/default.aspx for website in Arabic)
3. Data availability
The present table was only published in 2013′ Annual Statistical Abstract, Chapter “Population and Social Statistics”:
https://www.mdps.gov.qa/en/statistics/Statistical%20Releases/General/StatisticalAbstract/2012/population-chapters/1_Population_2012.xls
Regarding 2010′ census in general:
Final results of 2010′ census (PDF format only)
https://www.mdps.gov.qa/en/statistics/Statistical%20Releases/General/Census/Population_Households_Establishment_QSA_Census_AE_2010_1.pdf
Census 2010′ website:
https://www.mdps.gov.qa/en/statistics1/pages/topicslisting.aspx?parent=General&child=Census
2010′ census in Excel or PDF format individual tables:
http://www.qsa.gov.qa/QatarCensus/Census_Results.aspx
Last date of access: February 19, 2014.
| duration of |
2 years and less |
3-4 years |
5-9 years |
10-14 years |
15 years and more |
Non-Qatari population |
| stay |
| Municipality |
(aged 10+) |
| Doha |
48.0 |
18.4 |
17.5 |
6.7 |
9.4 |
33,561 |
| Al Rayyan |
44.9 |
22.9 |
14.6 |
6.7 |
11.0 |
5,489 |
| Al Wakrah |
58.8 |
17.7 |
12.0 |
5.2 |
6.3 |
183,050 |
| Umm Slal |
42.4 |
26.4 |
13.6 |
6.0 |
11.7 |
35,149 |
| Al Khor |
63.3 |
16.3 |
16.4 |
2.5 |
1.5 |
118,691 |
| Al Shamal |
34.3 |
22.5 |
17.8 |
13.2 |
12.2 |
311,944 |
| Al Da’ayen |
57.5 |
22.9 |
12.9 |
3.2 |
3.5 |
669,679 |
| Total (%) |
50.2 |
19.4 |
16.0 |
6.0 |
8.4 |
1,357,563 |
|
681,497 |
263,367 |
217,210 |
81,454 |
114,035 |
1,357,563 |
Source: census 2010, QSA (tabulated in Qatar Atlas, QSA and the Centre for GIS, Qatar)
1. Technical Notes and Definitions
Reference period for census 2010: the night of April 21st, 2010.
Implementation method: census is based on de jure method; i.e. registering people according to their usual place of residence at time of census.
Populations in transit or visiting Qatar as tourists, as well as residents of public housing or visitors staying in a household for less than two months after night of reference were excluded.
Populations away from usual residence in Qatar for reasons of duty, or on a visit abroad for less than two months, as well as individuals with no personal housing within Qatar staying with a household for more than two months, are counted in their usual/ present residence during census night.
Population of reference: all individuals (nationals and non-nationals) present within the State’s borders during time of reference.
“2010′ census recorded all the residents. Eight questionnaires covering the key census areas were designed, in order to ensure that all units (establishments; buildings; residential units; houses and individuals) are covered by the census.
The eight questionnaires are as follows:
1. Enumeration of buildings;
2. Enumeration of establishments, residential units and houses.
3. Survey of establishments (usage, et cetera);
4. Family living conditions;
5. Survey of labour camp residents;
6. Survey of public housing residents;
7. Survey of hotel residents and transit travellers through airports, ports and land border crossings;
8. Survey of Qataris living abroad.
2. Institution which provides data
Qatar Statistics Authority (QSA), Ministry of Development Planning and Statistics and the Center for GIS, Ministry of Municipality & Urban Planning, State of Qatar
(https://www.mdps.gov.qa/en/Pages/default.aspx for website in English; https://www.mdps.gov.qa/ar/pages/default.aspx for website in Arabic)
3. Data availability
Data are presented in Qatar Atlas, published by the Qatar Statistics Authority (QSA) and the Center for GIS, Ministry of Municipality & Urban Planning, State of Qatar
https://www.mdps.gov.qa/en/statistics1/GIS/Pages/atlas.aspx
The present data are tabulated and mapped at the municipality and zone levels:
http://gsa.qsa.gov.qa:8080/QATLAS/LOADPDF.aspx?pdfFileName=P242-243.pdf
Last date of access: 19 February 2014.
| |
Kuwaitis |
Arabs |
Asians |
Africans |
Non-Kuwaitis Europeans |
North Americans |
South Americans |
Australians- Oceanians |
TOTAL non-Kuwaitis |
GRAND TOTAL |
| |
| Age group |
males |
females |
total |
males |
females |
total |
males |
females |
total |
males |
females |
total |
males |
females |
total |
males |
females |
total |
males |
females |
total |
males |
females |
total |
males |
females |
total |
males |
females |
total |
| 0-4 |
83.757 |
81.121 |
164.878 |
52.864 |
50.725 |
103.589 |
23.035 |
22.229 |
45.264 |
202 |
195 |
397 |
578 |
559 |
1.137 |
1.193 |
1.086 |
2.279 |
57 |
60 |
117 |
95 |
83 |
178 |
78.024 |
74.937 |
152.961 |
161.781 |
156.058 |
317.839 |
| 5-9 |
79.224 |
76.546 |
155.770 |
45.658 |
43.215 |
88.873 |
18.526 |
17.879 |
36.405 |
147 |
141 |
288 |
606 |
528 |
1.134 |
1.044 |
1.005 |
2.049 |
58 |
47 |
105 |
91 |
84 |
175 |
66.130 |
62.899 |
129.029 |
145.354 |
139.445 |
284.799 |
| 10-14 |
68.745 |
66.175 |
134.920 |
35.288 |
33.094 |
68.382 |
11.781 |
11.161 |
22.942 |
108 |
108 |
216 |
433 |
425 |
858 |
1.031 |
889 |
1.920 |
41 |
40 |
81 |
82 |
78 |
160 |
48.764 |
45.795 |
94.559 |
117.509 |
111.970 |
229.479 |
| 15-19 |
67.164 |
64.571 |
131.735 |
33.843 |
30.161 |
64.004 |
8.402 |
7.535 |
15.937 |
185 |
135 |
320 |
329 |
302 |
631 |
756 |
712 |
1.468 |
60 |
49 |
109 |
81 |
81 |
162 |
43.656 |
38.975 |
82.631 |
110.820 |
103.546 |
214.366 |
| 20-24 |
57.184 |
55.446 |
112.630 |
51.555 |
33.181 |
84.736 |
46.743 |
22.421 |
69.164 |
878 |
17.775 |
18.653 |
220 |
348 |
568 |
487 |
524 |
1.011 |
49 |
62 |
111 |
52 |
49 |
101 |
99.984 |
74.360 |
174.344 |
157.168 |
129.806 |
286.974 |
| 25-29 |
49.855 |
50.276 |
100.131 |
101.643 |
47.180 |
148.823 |
143.595 |
68.537 |
212.132 |
2.899 |
31.457 |
34.356 |
337 |
647 |
984 |
873 |
728 |
1.601 |
89 |
66 |
155 |
36 |
57 |
93 |
249.472 |
148.672 |
398.144 |
299.327 |
198.948 |
498.275 |
| 30-34 |
41.249 |
43.454 |
84.703 |
103.552 |
41.369 |
144.921 |
196.584 |
84.082 |
280.666 |
1.392 |
10.671 |
12.063 |
559 |
754 |
1.313 |
1.110 |
667 |
1.777 |
56 |
66 |
122 |
50 |
52 |
102 |
303.303 |
137.661 |
440.964 |
344.552 |
181.115 |
525.667 |
| 35-39 |
35.389 |
39.620 |
75.009 |
78.407 |
29.188 |
107.595 |
178.439 |
81.920 |
260.359 |
701 |
3.403 |
4.104 |
639 |
748 |
1.387 |
904 |
555 |
1.459 |
62 |
58 |
120 |
47 |
45 |
92 |
259.199 |
115.917 |
375.116 |
294.588 |
155.537 |
450.125 |
| 40-44 |
30.786 |
34.956 |
65.742 |
61.773 |
21.514 |
83.287 |
148.976 |
64.540 |
213.516 |
387 |
829 |
1.216 |
769 |
617 |
1.386 |
1.107 |
537 |
1.644 |
81 |
35 |
116 |
67 |
60 |
127 |
213.160 |
88.132 |
301.292 |
243.946 |
123.088 |
367.034 |
| 45-49 |
26.210 |
30.307 |
56.517 |
52.153 |
16.948 |
69.101 |
105.269 |
44.006 |
149.275 |
309 |
233 |
542 |
777 |
527 |
1.304 |
1.388 |
502 |
1.890 |
70 |
46 |
116 |
79 |
63 |
142 |
160.045 |
62.325 |
222.370 |
186.255 |
92.632 |
278.887 |
| 50-54 |
19.969 |
24.243 |
44.212 |
36.104 |
12.599 |
48.703 |
64.225 |
22.189 |
86.414 |
179 |
119 |
298 |
716 |
427 |
1.143 |
1.387 |
517 |
1.904 |
73 |
26 |
99 |
84 |
49 |
133 |
102.768 |
35.926 |
138.694 |
122.737 |
60.169 |
182.906 |
| 55-59 |
14.779 |
19.671 |
34.450 |
24.423 |
8.712 |
33.135 |
36.717 |
9.897 |
46.614 |
133 |
89 |
222 |
604 |
304 |
908 |
1.009 |
356 |
1.365 |
51 |
26 |
77 |
64 |
26 |
90 |
63.001 |
19.410 |
82.411 |
77.780 |
39.081 |
116.861 |
| 60-64 |
9.535 |
13.756 |
23.291 |
14.001 |
5.791 |
19.792 |
14.525 |
4.110 |
18.635 |
63 |
62 |
125 |
433 |
202 |
635 |
588 |
215 |
803 |
23 |
10 |
33 |
41 |
15 |
56 |
29.674 |
10.405 |
40.079 |
39.209 |
24.161 |
63.370 |
| >65 |
18.843 |
24.190 |
43.033 |
12.505 |
9.087 |
21.592 |
7.002 |
2.484 |
9.486 |
30 |
18 |
48 |
327 |
203 |
530 |
415 |
184 |
599 |
15 |
13 |
28 |
26 |
19 |
45 |
20.320 |
12.008 |
32.328 |
39.163 |
36.198 |
75.361 |
| TOTAL |
602.689 |
624.332 |
1.227.021 |
703.769 |
382.764 |
1.086.533 |
1.003.819 |
462.990 |
1.466.809 |
7.613 |
65.235 |
72.848 |
7.327 |
6.591 |
13.918 |
13.292 |
8.477 |
21.769 |
785 |
604 |
1.389 |
895 |
761 |
1.656 |
1.737.500 |
927.422 |
2.664.922 |
2.340.189 |
1.551.754 |
3.891.943 |
Source: PACI
ANNEXED NOTE
1. Characteristics of data and definitions
The source of data used here is the Public Authority for Civil Information (PACI), an independant government body in charge of :
1- centralising all population and labour force data in order to manage a fully computerised population register
2- issuing mandatory civil identification cards to every resident of the country, regardless of age and nationality.
The other source of demographic and socioeconomic data on Kuwait is the Central Statistical Office (CSO), operating within the Planning Ministry. The CSO has conducted ten population and housing censuses since its inception in 1957.
Since 1995 a marked discrepancy was witnessed between PACI’ and CSO’ population figures. PACI’ database is connected electronically with other administrations and bodies registering demographic events and professional/ residency issues (births and death; departures and arrivals; end of service, residency and ID deliveries, etc.).
PACI’s records of residents’ movements is thus regularly updated, which limits the risk of population overcount. Therefore, it is more likely that residents were undercounted during CSO- Ministry of Planning’s census operations (see: Shah, N. Population of Kuwait. Structure and Dynamics, Kuwait: Kuwait University Academic Publication Council, 2010, chapter 1).
(a) Kuwaiti: the Kuwaiti nationality rests upon a document of Kuwaiti nationality or a certificate proving Kuwaiti nationality issued by the Ministry of Interior of Kuwait.
(b) Non-Kuwaiti: his/ her nationality is determined by the name of the State which issued the passport. The foreign national also entered Kuwait legally and has a stamp of residence.
This category includes the Bidoon, a category of stateless persons living in the Emirate. Kuwait’s Bidoon population originates from three broad categories:
1) those whose ancestors failed to apply for nationality or lacked necessary documentation at the time of Kuwait’s independence in 1961;
2) those recruited to work in Kuwait’s army or police force during the 1960s who permanently settled in Kuwait, along with their families;
3) children of Kuwaiti mothers and stateless or foreign fathers (see Human Rights Watch. Prisoners of the Past. Kuwaiti Bidun and the Burden of Statelessness, June 2011, p. 3).
(The children of Kuwaiti mothers and non-Kuwaiti fathers (with specific nationality) inherit the father’s nationality. They are stateless if the father is stateless).
(c) Nationality group: collected according to the nationality of the head of the household.
Nationalities are grouped according to specific features common to certain population subgroups: language, geographic origin, etc. or according to internationally recognized categories such as: (Arab / non-Arab Asian countries / non-Arab African countries; European countries … etc.).
2. Institution which provides data
The Public Authority for Civil Information (PACI)
3. Period of data coverage: June 2013
The database is updated three times a year and the website presents only the most recent data.
4. Data availability
The statistics section of PACI’s website (http://www.paci.gov.kw/en/ (English); http://www.paci.gov.kw/ (Arabic)) provides population and socio-economic data broken down by nationality (Kuwaiti/ non-Kuwaiti). Some data are displayed by nationality groups.
Analytical tables and data crosstabulations are available for download in PDF, html, .png and Excel (.csv) formats.
Date of access: January 2014
|
Migration Status |
TOTAL |
| Country of citizenship |
Worker |
Family member |
Student |
Other resident |
| ARAB COUNTRIES |
males |
females |
total |
males |
females |
total |
males |
females |
total |
males |
females |
total |
| Iraq |
3,630 |
736 |
4,366 |
3,545 |
6,939 |
10,484 |
0 |
0 |
0 |
158 |
254 |
412 |
15,262 |
| Syria |
53,452 |
4,300 |
57,752 |
30,726 |
45,119 |
75,845 |
3 |
0 |
3 |
1,565 |
389 |
1,954 |
135,554 |
| Lebanon |
13,957 |
4,708 |
18,665 |
8,285 |
15,016 |
23,301 |
1 |
2 |
3 |
423 |
194 |
617 |
42,586 |
| Jordan |
15,893 |
4,609 |
20,502 |
12,220 |
21,532 |
33,752 |
1 |
2 |
3 |
577 |
247 |
824 |
55,081 |
| Yemen |
5,164 |
294 |
5,458 |
1,879 |
3,288 |
5,167 |
2 |
0 |
2 |
111 |
24 |
135 |
10,762 |
| Palestine |
12 |
10 |
22 |
279 |
277 |
556 |
0 |
0 |
0 |
0 |
1 |
1 |
579 |
| Algeria |
242 |
74 |
316 |
182 |
327 |
509 |
1 |
0 |
1 |
12 |
7 |
19 |
845 |
| Egypt |
305,781 |
24,988 |
330,769 |
52,735 |
84,765 |
137,500 |
10 |
2 |
12 |
13,408 |
1,003 |
14,411 |
482,692 |
| Morocco |
849 |
942 |
1,791 |
302 |
1,292 |
1,594 |
0 |
0 |
0 |
49 |
61 |
110 |
3,495 |
| Tunisia |
783 |
1,009 |
1,792 |
340 |
644 |
984 |
2 |
1 |
3 |
36 |
48 |
84 |
2,863 |
| Libya |
35 |
4 |
39 |
34 |
74 |
108 |
1 |
0 |
1 |
1 |
0 |
1 |
149 |
| Palestinian from Egypt |
1,967 |
756 |
2,723 |
1,145 |
2,117 |
3,262 |
0 |
0 |
0 |
133 |
35 |
168 |
6,153 |
| Palestinian from Lebanon |
341 |
123 |
464 |
140 |
341 |
481 |
0 |
0 |
0 |
14 |
3 |
17 |
962 |
| Palestinian from Syria |
119 |
52 |
171 |
69 |
125 |
194 |
0 |
0 |
0 |
5 |
2 |
7 |
372 |
| Palestinian from Iraq |
1 |
1 |
2 |
0 |
1 |
1 |
0 |
0 |
0 |
0 |
0 |
0 |
3 |
| Non-Kuwaiti |
1 |
0 |
1 |
2 |
3 |
5 |
0 |
0 |
0 |
0 |
0 |
0 |
6 |
| Saudi |
0 |
0 |
0 |
0 |
1 |
1 |
0 |
0 |
0 |
0 |
0 |
0 |
1 |
| Total |
402,227 |
42,606 |
444,833 |
111,883 |
181,861 |
293,744 |
21 |
7 |
28 |
16,492 |
2,268 |
18,760 |
757,365 |
| ASIA |
|
|
|
|
|
|
|
|
|
|
|
|
|
| Afghanistan |
10,209 |
46 |
10,255 |
1,234 |
1,810 |
3,044 |
19 |
4 |
23 |
324 |
43 |
367 |
13,689 |
| Uzbekistan |
25 |
22 |
47 |
14 |
51 |
65 |
0 |
0 |
0 |
1 |
1 |
2 |
114 |
| Kyrgyzstan |
7 |
18 |
25 |
6 |
17 |
23 |
5 |
2 |
7 |
1 |
2 |
3 |
58 |
| Tajikstan |
7 |
2 |
9 |
8 |
11 |
19 |
4 |
2 |
6 |
0 |
0 |
0 |
34 |
| Kazakhstan |
6 |
7 |
13 |
4 |
17 |
21 |
0 |
0 |
0 |
0 |
0 |
0 |
34 |
| Mongolia |
3 |
3 |
6 |
3 |
4 |
7 |
3 |
0 |
3 |
0 |
0 |
0 |
16 |
| Turkey |
1,204 |
155 |
1,359 |
275 |
511 |
786 |
1 |
0 |
1 |
102 |
24 |
126 |
2,272 |
| Iran |
23,830 |
1,698 |
25,528 |
5,245 |
11,120 |
16,365 |
3 |
2 |
5 |
619 |
121 |
740 |
42,638 |
| Malaysia |
108 |
53 |
161 |
87 |
166 |
253 |
19 |
3 |
22 |
3 |
2 |
5 |
441 |
| Japan |
49 |
14 |
63 |
7 |
47 |
54 |
3 |
2 |
5 |
4 |
0 |
4 |
126 |
| Indonesia |
1,031 |
11,676 |
12,707 |
292 |
885 |
1,177 |
4 |
5 |
9 |
26 |
117 |
143 |
14,036 |
| Philippines |
29,172 |
122,258 |
151,430 |
2,487 |
5,308 |
7,795 |
17 |
14 |
31 |
768 |
1,718 |
2,486 |
161,742 |
| Pakistan |
89,953 |
1,107 |
91,060 |
9,232 |
17,280 |
26,512 |
27 |
4 |
31 |
2,367 |
70 |
2,437 |
120,040 |
| India |
474,755 |
110,751 |
585,506 |
30,674 |
62,131 |
92,805 |
15 |
1 |
16 |
12,260 |
1,938 |
14,198 |
692,525 |
| China |
2,318 |
577 |
2,895 |
51 |
236 |
287 |
8 |
7 |
15 |
636 |
70 |
706 |
3,903 |
| Taiwan |
6 |
1 |
7 |
1 |
3 |
4 |
5 |
3 |
8 |
0 |
0 |
0 |
19 |
| South Korea |
737 |
16 |
753 |
83 |
160 |
243 |
1 |
6 |
7 |
113 |
2 |
115 |
1,118 |
| Singapore |
18 |
5 |
23 |
1 |
18 |
19 |
14 |
2 |
16 |
0 |
1 |
1 |
59 |
| Bangladesh |
173,484 |
5,001 |
178,485 |
2,556 |
4,380 |
6,936 |
9 |
0 |
9 |
4,520 |
221 |
4,741 |
190,171 |
| Thailand |
1,767 |
300 |
2,067 |
28 |
149 |
177 |
23 |
18 |
41 |
155 |
23 |
178 |
2,463 |
| Sri Lanka |
30,887 |
72,520 |
103,407 |
1,143 |
3,127 |
4,270 |
23 |
1 |
24 |
704 |
1,455 |
2,159 |
109,860 |
| Nepal |
27,861 |
25,792 |
53,653 |
60 |
194 |
254 |
0 |
1 |
1 |
1,017 |
561 |
1,578 |
55,486 |
| Bhutan |
7 |
3 |
10 |
6 |
7 |
13 |
0 |
0 |
0 |
0 |
0 |
0 |
23 |
| North Korea |
3,063 |
2 |
3,065 |
3 |
8 |
11 |
2 |
1 |
3 |
492 |
0 |
492 |
3,571 |
| Vietnam |
496 |
19 |
515 |
4 |
13 |
17 |
0 |
0 |
0 |
66 |
0 |
66 |
598 |
| Cambodia |
5 |
4 |
9 |
2 |
2 |
4 |
28 |
6 |
34 |
0 |
0 |
0 |
47 |
| Myanmar |
241 |
88 |
329 |
2 |
3 |
5 |
0 |
0 |
0 |
15 |
0 |
15 |
349 |
| Other Asian Nationalities |
40 |
13 |
53 |
9 |
19 |
28 |
3 |
2 |
5 |
0 |
1 |
1 |
87 |
| Total |
871,289 |
352,151 |
1,223,440 |
53,517 |
107,677 |
161,194 |
236 |
86 |
322 |
24,193 |
6,370 |
30,563 |
1,415,519 |
| EUROPE |
|
|
|
|
|
0 |
|
|
0 |
|
|
|
|
| Britain |
1,772 |
590 |
2,362 |
620 |
1,104 |
1,724 |
1 |
0 |
1 |
53 |
37 |
90 |
4,177 |
| Ireland |
83 |
41 |
124 |
32 |
52 |
84 |
0 |
0 |
0 |
3 |
2 |
5 |
213 |
| France |
342 |
107 |
449 |
179 |
265 |
444 |
1 |
1 |
2 |
8 |
5 |
13 |
908 |
| Holland |
105 |
19 |
124 |
72 |
91 |
163 |
0 |
0 |
0 |
3 |
2 |
5 |
292 |
| Belgium |
43 |
11 |
54 |
11 |
28 |
39 |
0 |
0 |
0 |
1 |
0 |
1 |
94 |
| Italy |
191 |
35 |
226 |
56 |
104 |
160 |
0 |
2 |
2 |
15 |
2 |
17 |
405 |
| Malta |
17 |
0 |
17 |
1 |
5 |
6 |
0 |
0 |
0 |
0 |
0 |
0 |
23 |
| Sweden |
74 |
19 |
93 |
67 |
103 |
170 |
0 |
0 |
0 |
2 |
3 |
5 |
268 |
| Norway |
17 |
10 |
27 |
10 |
20 |
30 |
0 |
0 |
0 |
0 |
0 |
0 |
57 |
| Switzerland |
21 |
6 |
27 |
4 |
14 |
18 |
0 |
0 |
0 |
0 |
1 |
1 |
46 |
| Austria |
32 |
13 |
45 |
20 |
40 |
60 |
0 |
0 |
0 |
1 |
1 |
2 |
107 |
| Germany |
212 |
51 |
263 |
98 |
170 |
268 |
3 |
2 |
5 |
10 |
6 |
16 |
552 |
| Spain |
82 |
25 |
107 |
27 |
54 |
81 |
1 |
1 |
2 |
9 |
2 |
11 |
201 |
| Portugal |
68 |
26 |
94 |
12 |
28 |
40 |
0 |
0 |
0 |
4 |
0 |
4 |
138 |
| Denmark |
71 |
14 |
85 |
35 |
74 |
109 |
2 |
0 |
2 |
2 |
0 |
2 |
198 |
| Greece |
55 |
20 |
75 |
14 |
32 |
46 |
0 |
0 |
0 |
6 |
10 |
16 |
137 |
| Cyprus |
11 |
4 |
15 |
5 |
11 |
16 |
0 |
0 |
0 |
2 |
0 |
2 |
33 |
| Czech Republic |
33 |
15 |
48 |
5 |
25 |
30 |
0 |
2 |
2 |
0 |
0 |
0 |
80 |
| Hungary |
87 |
36 |
123 |
28 |
58 |
86 |
1 |
2 |
3 |
1 |
4 |
5 |
217 |
| Slovakia |
25 |
18 |
43 |
11 |
43 |
54 |
0 |
0 |
0 |
2 |
3 |
5 |
102 |
| Finland |
9 |
4 |
13 |
3 |
15 |
18 |
0 |
0 |
0 |
0 |
0 |
0 |
31 |
| Lithuania |
4 |
4 |
8 |
3 |
4 |
7 |
0 |
0 |
0 |
0 |
0 |
0 |
15 |
| Poland |
83 |
45 |
128 |
20 |
96 |
116 |
2 |
3 |
5 |
4 |
4 |
8 |
257 |
| Russia and USSR |
219 |
72 |
291 |
138 |
304 |
442 |
2 |
3 |
5 |
10 |
5 |
15 |
753 |
| Ukraine |
66 |
32 |
98 |
43 |
154 |
197 |
0 |
0 |
0 |
3 |
5 |
8 |
303 |
| Moldova |
5 |
15 |
20 |
2 |
7 |
9 |
0 |
0 |
0 |
0 |
4 |
4 |
33 |
| Belarus |
14 |
6 |
20 |
9 |
28 |
37 |
0 |
0 |
0 |
1 |
0 |
1 |
58 |
| Bosnia-Herzegovina |
100 |
34 |
134 |
15 |
53 |
68 |
6 |
3 |
9 |
2 |
1 |
3 |
214 |
| Macedonia |
33 |
10 |
43 |
3 |
16 |
19 |
3 |
0 |
3 |
3 |
0 |
3 |
68 |
| Croatia |
26 |
13 |
39 |
5 |
10 |
15 |
0 |
0 |
0 |
4 |
0 |
4 |
58 |
| Serbia |
86 |
34 |
120 |
24 |
55 |
79 |
0 |
0 |
0 |
8 |
4 |
12 |
211 |
| Yugoslavia |
47 |
15 |
62 |
11 |
31 |
42 |
0 |
0 |
0 |
0 |
0 |
0 |
104 |
| Romania |
168 |
172 |
340 |
60 |
167 |
227 |
0 |
0 |
0 |
20 |
30 |
50 |
617 |
| Bulgaria |
127 |
233 |
360 |
30 |
94 |
124 |
4 |
0 |
4 |
5 |
0 |
5 |
493 |
| Albania |
16 |
2 |
18 |
16 |
30 |
46 |
1 |
1 |
2 |
1 |
1 |
2 |
68 |
| Kosovo |
7 |
3 |
10 |
6 |
6 |
12 |
0 |
0 |
0 |
1 |
0 |
1 |
23 |
| Armenia |
98 |
40 |
138 |
17 |
80 |
97 |
0 |
2 |
2 |
3 |
6 |
9 |
246 |
| Georgia |
37 |
23 |
60 |
13 |
13 |
26 |
0 |
2 |
2 |
4 |
7 |
11 |
99 |
| Azerbaidjan |
14 |
6 |
20 |
16 |
29 |
45 |
0 |
0 |
0 |
1 |
0 |
1 |
66 |
| Other European Nationalities |
32 |
15 |
47 |
10 |
18 |
28 |
0 |
0 |
0 |
0 |
0 |
0 |
75 |
| Total |
4,532 |
1,838 |
6,370 |
1,751 |
3,531 |
5,282 |
27 |
24 |
51 |
192 |
145 |
337 |
12,040 |
| AFRICA |
|
|
|
|
|
|
|
|
|
|
|
|
|
| Ethiopia |
4,984 |
70,826 |
75,810 |
57 |
209 |
266 |
1 |
1 |
2 |
111 |
1,090 |
1,201 |
77,279 |
| Eritrea |
255 |
313 |
568 |
191 |
354 |
545 |
2 |
1 |
3 |
8 |
11 |
19 |
1,135 |
| Sudan |
3,175 |
159 |
3,334 |
330 |
692 |
1,022 |
3 |
0 |
3 |
96 |
96 |
192 |
4,551 |
| Senegal |
48 |
25 |
73 |
20 |
40 |
60 |
32 |
13 |
45 |
1 |
4 |
5 |
183 |
| Gambia |
8 |
4 |
12 |
3 |
4 |
7 |
18 |
0 |
18 |
0 |
0 |
0 |
37 |
| Guinea |
15 |
4 |
19 |
10 |
9 |
19 |
7 |
2 |
9 |
0 |
0 |
0 |
47 |
| Mauritania |
66 |
1 |
67 |
15 |
41 |
56 |
4 |
2 |
6 |
12 |
1 |
13 |
142 |
| Mali |
55 |
3 |
58 |
4 |
8 |
12 |
16 |
5 |
21 |
3 |
0 |
3 |
94 |
| Niger |
44 |
9 |
53 |
28 |
35 |
63 |
21 |
1 |
22 |
1 |
0 |
1 |
139 |
| Burkina Faso |
11 |
1 |
12 |
3 |
6 |
9 |
16 |
4 |
20 |
1 |
0 |
1 |
42 |
| Benin |
53 |
3 |
56 |
12 |
25 |
37 |
51 |
8 |
59 |
6 |
0 |
6 |
158 |
| Liberia |
60 |
19 |
79 |
46 |
70 |
116 |
0 |
0 |
0 |
2 |
3 |
5 |
200 |
| Sierra Leone |
57 |
7 |
64 |
11 |
16 |
27 |
0 |
0 |
0 |
31 |
0 |
31 |
122 |
| Togo |
29 |
31 |
60 |
4 |
6 |
10 |
7 |
2 |
9 |
1 |
1 |
2 |
81 |
| Ivory Coast |
10 |
8 |
18 |
1 |
8 |
9 |
6 |
0 |
6 |
0 |
0 |
0 |
33 |
| Nigeria |
181 |
60 |
241 |
87 |
146 |
233 |
54 |
9 |
63 |
7 |
3 |
10 |
547 |
| South Africa |
258 |
151 |
409 |
53 |
142 |
195 |
0 |
0 |
0 |
8 |
23 |
31 |
635 |
| Swaziland |
3 |
5 |
8 |
5 |
7 |
12 |
0 |
0 |
0 |
0 |
1 |
1 |
21 |
| Zimbabwe |
35 |
3 |
38 |
7 |
17 |
24 |
0 |
0 |
0 |
9 |
1 |
10 |
72 |
| Chad |
79 |
15 |
94 |
25 |
30 |
55 |
11 |
1 |
12 |
1 |
0 |
1 |
162 |
| Cameroon |
6 |
12 |
18 |
2 |
1 |
3 |
3 |
0 |
3 |
0 |
0 |
0 |
24 |
| Somalia |
962 |
410 |
1,372 |
825 |
1,300 |
2,125 |
33 |
5 |
38 |
70 |
56 |
126 |
3,661 |
| Djibouti |
17 |
3 |
20 |
6 |
17 |
23 |
4 |
2 |
6 |
0 |
0 |
0 |
49 |
| Madagascar |
3 |
1,197 |
1,200 |
0 |
3 |
3 |
0 |
0 |
0 |
0 |
22 |
22 |
1,225 |
| Mauritius |
6 |
3 |
9 |
1 |
7 |
8 |
5 |
0 |
5 |
19 |
0 |
19 |
41 |
| Ghana |
380 |
327 |
707 |
13 |
30 |
43 |
13 |
1 |
14 |
15 |
12 |
27 |
791 |
| Uganda |
13 |
247 |
260 |
8 |
4 |
12 |
3 |
1 |
4 |
0 |
4 |
4 |
280 |
| Malawi |
8 |
2 |
10 |
7 |
8 |
15 |
0 |
0 |
0 |
0 |
0 |
0 |
25 |
| Tanzania |
32 |
1 |
33 |
4 |
18 |
22 |
10 |
3 |
13 |
1 |
0 |
1 |
69 |
| Kenya |
117 |
41 |
158 |
36 |
60 |
96 |
0 |
2 |
2 |
4 |
1 |
5 |
261 |
| Comore Islands |
34 |
2 |
36 |
11 |
17 |
28 |
11 |
1 |
12 |
2 |
0 |
2 |
78 |
| Seychelles Islands |
3 |
4 |
7 |
2 |
7 |
9 |
0 |
0 |
0 |
0 |
1 |
1 |
17 |
| Other African Nationalities |
39 |
13 |
52 |
14 |
45 |
59 |
6 |
5 |
11 |
1 |
0 |
1 |
123 |
| Total |
11,046 |
73,909 |
84,955 |
1,841 |
3,382 |
5,223 |
337 |
69 |
406 |
410 |
1,330 |
1,740 |
92,324 |
| AMERICA AND OCEANIA |
|
|
|
|
|
0 |
|
|
0 |
|
|
|
|
| U.S.A |
6,157 |
1,649 |
7,806 |
2,254 |
2,733 |
4,987 |
2 |
3 |
5 |
371 |
98 |
469 |
13,267 |
| Canada |
1,951 |
675 |
2,626 |
1,523 |
2,273 |
3,796 |
5 |
2 |
7 |
72 |
29 |
101 |
6,530 |
| Dominican Republic |
90 |
10 |
100 |
93 |
86 |
179 |
0 |
0 |
0 |
6 |
0 |
6 |
285 |
| Venezuela |
78 |
19 |
97 |
35 |
90 |
125 |
0 |
0 |
0 |
2 |
0 |
2 |
224 |
| Colombia |
39 |
10 |
49 |
12 |
31 |
43 |
0 |
0 |
0 |
1 |
1 |
2 |
94 |
| Trinidad and Tobago |
8 |
3 |
11 |
6 |
6 |
12 |
0 |
0 |
0 |
1 |
0 |
1 |
24 |
| Granada |
10 |
0 |
10 |
1 |
6 |
7 |
0 |
0 |
0 |
0 |
0 |
0 |
17 |
| Jamaica |
6 |
6 |
12 |
1 |
4 |
5 |
0 |
0 |
0 |
0 |
0 |
0 |
17 |
| Mexico |
12 |
4 |
16 |
7 |
35 |
42 |
0 |
0 |
0 |
1 |
1 |
2 |
60 |
| Brasil |
66 |
21 |
87 |
34 |
52 |
86 |
0 |
0 |
0 |
20 |
5 |
25 |
198 |
| Bolivia |
10 |
4 |
14 |
15 |
25 |
40 |
0 |
0 |
0 |
1 |
0 |
1 |
55 |
| Peru |
9 |
2 |
11 |
2 |
5 |
7 |
0 |
0 |
0 |
1 |
0 |
1 |
19 |
| Ecuador |
8 |
0 |
8 |
5 |
7 |
12 |
0 |
0 |
0 |
0 |
1 |
1 |
21 |
| Argentina |
48 |
9 |
57 |
7 |
18 |
25 |
0 |
0 |
0 |
4 |
2 |
6 |
88 |
| Australia |
315 |
85 |
400 |
263 |
382 |
645 |
0 |
0 |
0 |
6 |
7 |
13 |
1,058 |
| New Zealand |
88 |
38 |
126 |
67 |
108 |
175 |
0 |
0 |
0 |
6 |
4 |
10 |
311 |
| Fiji Islands |
47 |
2 |
49 |
2 |
3 |
5 |
0 |
0 |
0 |
2 |
0 |
2 |
56 |
| Other American and Oceanian Nationalities |
44 |
11 |
55 |
12 |
40 |
52 |
0 |
0 |
0 |
2 |
2 |
4 |
111 |
| Total |
8,986 |
2,548 |
11,534 |
4,339 |
5,904 |
10,243 |
8 |
5 |
13 |
496 |
150 |
646 |
22,436 |
| U.N. |
4 |
0 |
4 |
1 |
1 |
2 |
0 |
0 |
0 |
0 |
0 |
0 |
6 |
| Unknown Nationalities |
0 |
1 |
1 |
0 |
0 |
0 |
0 |
0 |
0 |
0 |
0 |
0 |
1 |
| GRAND TOTAL |
1,298,084 |
473,053 |
1,771,137 |
173,332 |
302,356 |
475,688 |
629 |
191 |
820 |
41,783 |
10,263 |
52,046 |
2,299,691 |
Source: Ministry of Interior
ANNEXED NOTE
1. Definitions and data collection method
The migration status is inferred from the distribution of expatriates by type of residence permits they hold as of December 31st, the given year (cf. table in file MOV 2.3).
Workers are holders of permits n°17 (governmental labor), 18 (non-governmental labor); 19 (business) and 20 (domestic help).
Family members are holders of a dependent permit: spouse, children or elderly dependent relatives can join visa holder (sponsor) in Kuwait, if the expatriate has obtained a residency and is earning a minimum of KD250 a month (private and governement sector alike).
A working wife cannot sponsor her husband as a dependent. Also, sons over the age of 21 years cannot be sponsored as dependants, though adult daughters and parents may be permitted. Dependent family members are not allowed to work on a Dependent Visa, unless they transfer it into a work visa under Kuwaiti sponsorship. This can be done only after 6 to 12 months of holding a dependent visa.
Every children including new born babies must hold a residency permit. The application for the infant’s residence must be made within 60 days of the birth
The Dependent Visa holder is permitted to stay as long as the sponsor holds a valid visa.
Students are holders of a study visa
Other residents are holders of:
* Temporary permit: An expatriate may be granted temporary residence under article 14 of the immigration regulations in special cases where he does not need or cannot get ordinary residence.
This allows the expatriate to stay for up to one year, for personal emergencies such as illness, or after resignation from employment in order to settle financial affairs or a court case.
* Self residence permit: Expatriates may sponsor themselves under article 24 of the regulations and obtain a residence for two to five years under several conditions
(among which: being aged 60 and more, having worked no less than 25 years in Kuwait, owning a capital of 10000 KD at least; being able to produce a certificate of good conduct, being effectively residing in Kuwait with his/her family, etc.).
This form of residence can be renewed upon expiry. Self-sponsored expatriates may sponsor their wives and children.
Residency procedures do not apply to GCC nationals.
The bidoun, a stateless population, are not included in the residency documents holders.
The table thus excludes the Bidoun residents, the non-Kuwaiti GCC citizens and those in irregular situation.
2. Institution which provides data
Ministry of Interior
3. Period of data coverage
December 31st, given years
4. Data availability
2012 data is unpublished as of January 2014 and has been obtained from MoI.
|
Saudis |
non-Saudis |
Total |
|
males |
females |
total |
males |
females |
total |
males |
females |
total |
| Agriculture, hunting, forestry and fishing |
3,490.93 |
2,256.28 |
3,228.36 |
529.61 |
653.71 |
529.75 |
571.50 |
1,900.06 |
578.00 |
| Mining, quarrying, oil and gas extraction |
15,496.72 |
16,043.86 |
15,510.90 |
3,677.50 |
4,333.08 |
3,748.08 |
12,826.84 |
9,371.54 |
12,669.09 |
| Manufacturing |
5,915.15 |
2,119.96 |
5,400.62 |
1,120.60 |
639.88 |
1,111.94 |
1,817.44 |
1,517.16 |
1,806.32 |
| Electricity, gas and water supply |
9,302.91 |
2,963.84 |
9,249.69 |
3,301.87 |
5,494.00 |
3,307.24 |
7,599.03 |
3,224.96 |
7,569.66 |
| Construction |
2,959.24 |
1,876.97 |
2,756.53 |
860.74 |
594.31 |
858.82 |
1,031.31 |
1,539.33 |
1,043.90 |
| Wholesale and retail trade |
3,587.17 |
2,348.78 |
3,347.61 |
1,054.78 |
1,130.76 |
1,055.08 |
1,398.13 |
2,232.50 |
1,427.09 |
| Transport, storage and communications |
4,490.83 |
2,189.82 |
4,223.62 |
824.99 |
2,815.42 |
828.67 |
1,229.81 |
2,253.61 |
1,246.09 |
| Finance, insurance, real estate and business activities |
8,983.27 |
6,394.22 |
8,637.88 |
2,742.16 |
1,741.31 |
2,737.79 |
5,129.63 |
6,189.82 |
5,191.14 |
| Community, social and personal service activities |
6,569.84 |
3,021.41 |
5,235.00 |
1,081.99 |
1,714.48 |
1,143.68 |
1,897.38 |
2,359.23 |
1,968.37 |
| Total |
5,315.44 |
2,613.38 |
4,801.43 |
934.14 |
1,341.18 |
940.16 |
1,427.28 |
2,187.29 |
1,456.34 |
Source: Ministry of Labour
1. Technical note
Data is collected as part of the implementation of Nitaqat (saudization) project; results are still being updated
As of January 28, 2014, 1 Saudi Riyal (SAR)= 0,195 Euros (EUR) and 0,2667 US Dollar (USD).
2. Institution which provides data
Ministry of Civil Service, Saudi Arabia
3. Data availability
The present data is published on the Ministry of Labour’s website (open data library) and is available at:
http://portal.mol.gov.sa/ar/opendata/Pages/default.aspx?m=7
Date of access: January 2014
|
|
Saudis |
|
|
non-Saudis |
|
|
Total |
|
|
males |
females |
total |
males |
females |
total |
males |
females |
total |
| General positions |
314,059 |
74,904 |
388,963 |
956 |
98 |
1,054 |
315,015 |
75,002 |
390,017 |
| Teaching staff |
224,955 |
276,793 |
501,748 |
3,051 |
424 |
3,475 |
228,006 |
277,217 |
505,223 |
| Health positions |
62,161 |
39,693 |
101,854 |
20,811 |
33,848 |
54,659 |
82,972 |
73,541 |
156,513 |
| University teaching staff |
17,561 |
15,817 |
33,378 |
10,087 |
3,875 |
13,962 |
27,648 |
19,692 |
47,340 |
| Judges |
1,551 |
0 |
1,551 |
0 |
0 |
0 |
1,551 |
0 |
1,551 |
| Investigation and prosecution staff |
1,977 |
0 |
1,977 |
0 |
0 |
0 |
1,977 |
0 |
1,977 |
| Diplomatic positions |
912 |
38 |
950 |
0 |
0 |
0 |
912 |
38 |
950 |
| Technical and vocational training corporations |
7,068 |
609 |
7,677 |
680 |
44 |
724 |
7,748 |
653 |
8,401 |
| Corporations |
39,523 |
489 |
40,012 |
18 |
0 |
18 |
39,541 |
489 |
40,030 |
| Office attendants |
40,792 |
14,265 |
55,057 |
93 |
4 |
97 |
40,885 |
14,269 |
55,154 |
| Grand Total |
710,559 |
422,608 |
1,133,167 |
35,696 |
38,293 |
73,989 |
746,255 |
460,901 |
1,207,156 |
Source: Ministry of Civil Service
1. Institution which provides data
Ministry of Civil Service, Saudi Arabia
2. Data availability
Data of employment by sector and nationality are not published in CDSI Labour Force Surveys volumes.
Ministry of Civil Service publishes a selection of data in Statistical Yearbooks.
The present data is taken from issue n°2 of the monthly “Ministry of Civil Service Statistical Report”, available at:
http://www.mcs.gov.sa/Statistics/Pages/StatisticalBulletin.aspx
Date of access: January 2014
| Nationality group / Place of birth |
In Kuwait |
Outside Kuwait |
TOTAL |
| Kuwaitis |
1.166.809 |
60.212 |
1.227.021 |
| Arabs |
383.360 |
703.173 |
1.086.533 |
| Asians |
94.148 |
1.372.651 |
1.466.799 |
| Africans |
1.011 |
71.837 |
72.848 |
| Europeans |
2.273 |
11.645 |
13.918 |
| North Americans |
4.886 |
16.883 |
21.769 |
| South Americans |
567 |
822 |
1.389 |
| Australians- Oceanians |
614 |
1.042 |
1.656 |
| Total non-Kuwaitis |
486.859 |
2.178.053 |
2.664.912 |
| Grand total |
1.653.668 |
2.238.265 |
3.891.933 |
Source: PACI
ANNEXED NOTE
1. Characteristics of data and definitions
The source of data used here is the Public Authority for Civil Information (PACI), an independant government body in charge of :
1- centralising all population and labour force data in order to manage a fully computerised population register
2- issuing mandatory civil identification cards to every resident of the country, regardless of age and nationality.
The other source of demographic and socioeconomic data on Kuwait is the Central Statistical Office (CSO), operating within the Planning Ministry. The CSO has conducted ten population and housing censuses since its inception in 1957.
Since 1995 a marked discrepancy was witnessed between PACI’ and CSO’ population figures. PACI’ database is connected electronically with other administrations and bodies registering demographic events and professional/ residency issues (births and death; departures and arrivals; end of service, residency and ID deliveries, etc.).
PACI’s records of residents’ movements is thus regularly updated, which limits the risk of population overcount. Therefore, it is more likely that residents were undercounted during CSO- Ministry of Planning’s census operations (see: Shah, N. Population of Kuwait. Structure and Dynamics, Kuwait: Kuwait University Academic Publication Council, 2010, chapter 1).
(a) Kuwaiti: the Kuwaiti nationality rests upon a document of Kuwaiti nationality or a certificate proving Kuwaiti nationality issued by the Ministry of Interior of Kuwait.
(b) Non-Kuwaiti: his/ her nationality is determined by the name of the State which issued the passport. The foreign national also entered Kuwait legally and has a stamp of residence.
This category includes the Bidoon, a category of stateless persons living in the Emirate. Kuwait’s Bidoon population originates from three broad categories:
1) those whose ancestors failed to apply for nationality or lacked necessary documentation at the time of Kuwait’s independence in 1961;
2) those recruited to work in Kuwait’s army or police force during the 1960s who permanently settled in Kuwait, along with their families;
3) children of Kuwaiti mothers and stateless or foreign fathers (see Human Rights Watch. Prisoners of the Past. Kuwaiti Bidun and the Burden of Statelessness, June 2011, p. 3).
(c) Nationality group: collected according to the nationality of the head of the household.
Nationalities are grouped according to specific features common to certain population subgroups: language, geographic origin, etc. or according to internationally recognized categories such as: (Arab / non-Arab Asian countries / non-Arab African countries; European countries … etc.).
(The children of Kuwaiti mothers and non-Kuwaiti fathers (with specific nationality) inherit the father’s nationality. They are stateless if the father is stateless).
2. Institution which provides data
The Public Authority for Civil Information (PACI)
3. Period of data coverage: June 2013
The database is updated three times a year and the website presents only the most recent data.
4. Data availability
The statistics section of PACI’s website (http://www.paci.gov.kw/en/ (English); http://www.paci.gov.kw/ (Arabic)) provides population and socio-economic data broken down by nationality (Kuwaiti/ non-Kuwaiti). Some data are displayed by nationality groups.
Analytical tables and data crosstabulations are available for download in PDF, html, .png and Excel (.csv) formats.
Date of access: January 2014.
| Nationality group |
TOTAL |
| Kuwaitis |
1.227.021 |
| Arabs |
1.086.533 |
| Asians |
1.466.799 |
| Africans |
72.848 |
| Europeans |
13.918 |
| North Americans |
21.769 |
| South Americans |
1.389 |
| Australians- Oceanians |
1.656 |
| Total non-Kuwaitis |
2.664.912 |
| Grand total |
3.891.933 |
Source: PACI
ANNEXED NOTE
1. Characteristics of data and definitions
The source of data used here is the Public Authority for Civil Information (PACI), an independant government body in charge of :
1- centralising all population and labour force data in order to manage a fully computerised population register
2- issuing mandatory civil identification cards to every resident of the country, regardless of age and nationality.
The other source of demographic and socioeconomic data on Kuwait is the Central Statistical Office (CSO), operating within the Planning Ministry. The CSO has conducted ten population and housing censuses since its inception in 1957.
Since 1995 a marked discrepancy was witnessed between PACI’ and CSO’ population figures. PACI’ database is connected electronically with other administrations and bodies registering demographic events and professional/ residency issues (births and death; departures and arrivals; end of service, residency and ID deliveries, etc.).
PACI’s records of residents’ movements is thus regularly updated, which limits the risk of population overcount. Therefore, it is more likely that residents were undercounted during CSO- Ministry of Planning’s census operations (see: Shah, N. Population of Kuwait. Structure and Dynamics, Kuwait: Kuwait University Academic Publication Council, 2010, chapter 1).
(a) Kuwaiti: the Kuwaiti nationality rests upon a document of Kuwaiti nationality or a certificate proving Kuwaiti nationality issued by the Ministry of Interior of Kuwait.
(b) Non-Kuwaiti: his/ her nationality is determined by the name of the State which issued the passport. The foreign national also entered Kuwait legally and has a stamp of residence.
This category also includes the Bidoon, a category of stateless persons living in the Emirate. Kuwait’s Bidoon population originates from three broad categories:
1) those whose ancestors failed to apply for nationality or lacked necessary documentation at the time of Kuwait’s independence in 1961;
2) those recruited to work in Kuwait’s army or police force during the 1960s who permanently settled in Kuwait, along with their families;
3) children of Kuwaiti mothers and stateless or foreign fathers (see Human Rights Watch. Prisoners of the Past. Kuwaiti Bidun and the Burden of Statelessness, June 2011, p. 3).
(The children of Kuwaiti mothers and non-Kuwaiti fathers (with specific nationality) inherit the father’s nationality. They are stateless if the father is stateless).
(c) Nationality group: collected according to the nationality of the head of the household.
Nationalities are grouped according to specific features common to certain population subgroups: language, geographic origin, etc. or according to internationally recognized categories such as: (Arab / non-Arab Asian countries / non-Arab African countries; European countries … etc.).
2. Institution which provides data
The Public Authority for Civil Information (PACI).
3. Period of data coverage: June 2013
The database is updated three times a year and the website presents only the most recent data.
4. Data availability
The statistics section of PACI’s website (http://www.paci.gov.kw/en/ (English); http://www.paci.gov.kw/ (Arabic)) provides population and socio-economic data broken down by nationality (Kuwaiti/ non-Kuwaiti). Some data are displayed by nationality groups.
Analytical tables and data crosstabulations are available for download in PDF, html, .png and Excel (.csv) formats.
Date of access: January 2014
| 3/2011 |
44,700 |
| 4/2011 |
40,266 |
| 5/2011 |
44,290 |
| 6/2011 |
56,791 |
| 7/2011 |
35,566 |
| 8/2011 |
50,106 |
| 9/2011 |
40,620 |
| 10/2011 |
50,075 |
| 11/2011 |
60,321 |
| 12/2011 |
51,146 |
| Total 3-12/ 2011 |
473,881 |
| 1/2012 |
54,218 |
| 2/2012 |
51,819 |
| 3/2012 |
52,641 |
| 4/2012 |
52,687 |
| 5/2012 |
60,014 |
| 6/2012 |
54,472 |
| 7/2012 |
52,409 |
| 8/2012 |
50,340 |
| 9/2012 |
46,287 |
| 10/2012 |
45,233 |
| 11/2012 |
46,132 |
| 12/2012 |
43,080 |
| Total 2012 |
609,332 |
| 1/2013 |
46,275 |
| 2/2013 |
48,994 |
| 3/2013 |
41,309 |
| 4/2013 |
40,512 |
| 5/2013 |
38,540 |
| 6/2013 |
94,333 |
| 7/2013 |
26,888 |
| 8/2013 |
30,197 |
| 9/2013 |
24,151 |
| Total 1-9/ 2013 |
391,199 |
Source: Ministry of Interior.
1. Definition
Infiltrators are persons who entered illegally into Saudi Arabia’s territory.
Arrests are made by border guards, by the police, by the Passports Department and by the General Administration of Mujahideen (Interior Ministry).
2. Institution which provides data
Ministry of interior
3. Data availability
Monthly figures for irregulars’ arrests and deportation were put online on the Ministry of Interior’s website (chapter “Security News”), until July 2015. Figures were computed by Hijrah months, in Arabic only.
As of 21 September 2015, deportation and arrests’ records are still unavailable online.
Date of access: 21 September 2015
| year |
Temporary visas |
Private companies |
Governmental sector |
Domestic sector |
Total |
| 2004 |
61,184 |
423,172 |
24,821 |
355,395 |
864,572 |
| 2005 |
72,715 |
352,924 |
32,034 |
339,985 |
797,658 |
| 2006 |
65,600 |
716,347 |
42,149 |
441,247 |
1,265,343 |
| 2007 |
66,117 |
1,141,601 |
51,935 |
445,106 |
1,704,759 |
| 2008 |
50,756 |
1,191,204 |
70,924 |
495,885 |
1,808,769 |
| 2009 |
42,926 |
932,494 |
61,143 |
496,092 |
1,532,655 |
| 2010 |
61,530 |
1,061,717 |
68,297 |
565,537 |
1,757,081 |
| 2011 |
69,395 |
1,181,911 |
110,223 |
647,796 |
2,009,325 |
| 2012 |
79,966 |
1,586,532 |
125,909 |
828,425 |
2,620,832 |
Source: Ministry of Labour
1. Definitions
“Temporary or seasonal visas are alloted for short-term and limited employment duration, for example for the provision of sevices during the Hajj season in Makkah and Madina, or in agriculture.
“
2. Data collection methodology
The labour visa allows the worker to enter Saudi Arabia. It is issued by the Ministry of Foreign Affairs.
In order to employ workers from abroad, the sponsoring company must first file a “Block Visa” request with the Ministry of Labor, requesting pre-approval to sponsor foreign employees.
Once the Block Visa request is approved, the sponsoring company in Saudi Arabia should obtain a visa authorization number and an electronic power of attorney authorized by the Ministry of Foreign Affairs in Saudi Arabia.
Foreign nationals may then apply for work visas through Saudi consular posts in their country of residence. Several documents are required before issuance of work visas, including medical certificate.
Therefore, work visas are more than the actual workers present in the country, as some eventually do not terminate the procedure, or are rejected at a later stage (entry visa; residency procedures…).
3. Institution which provides data
Ministry of Labour of Saudi Arabia
4. Data availability
Published in Ministry of Labour’s Statistical Yearbooks
MoL Yearbooks are available online at http://portal.mol.gov.sa/ar/Statistics/Pages/default.aspx (2004-2012)
Date of access: December 2013.
| Occupation group of labour permit’ holder |
|
|
|
year |
|
|
|
| 2005 |
2006 |
2007 |
2008 |
2009 |
2010 |
2011 |
| Managers and Business Managers |
2,734 |
2,696 |
3,074 |
2,805 |
2,195 |
2,571 |
2,917 |
| Specialists in Scientific, Technical and Humanities Fields |
126,026 |
141,212 |
165,374 |
202,815 |
193,168 |
220,620 |
246,072 |
| Technicians in Scientific, Technical and Humanities Fields |
128,777 |
149,232 |
181,873 |
215,444 |
210,863 |
227,939 |
274,137 |
| Clerical Workers |
3,015 |
2,839 |
3,035 |
3,516 |
2,782 |
2,787 |
2,824 |
| Sales Persons |
87,332 |
86,441 |
84,097 |
89,070 |
64,240 |
60,404 |
76,451 |
| Service Persons |
976,412 |
1,052,607 |
1,107,318 |
1,227,295 |
1,097,139 |
1,097,820 |
1,321,468 |
| Agriculture, Animal Husbandry and Fishing |
173,927 |
117,042 |
182,101 |
320,285 |
89,161 |
85,516 |
101,872 |
| Industrial, Chemical and Food Industries |
98,731 |
107,942 |
122,535 |
136,856 |
128,052 |
121,719 |
146,705 |
| Engineering Support |
762,347 |
881,072 |
1,113,632 |
1,400,231 |
1,435,208 |
1,526,254 |
1,915,647 |
| TOTAL |
2,359,301 |
2,541,083 |
2,963,039 |
3,598,317 |
3,222,808 |
3,345,630 |
4,088,093 |
Source: Ministry of Labour
1. Definitions
Classification used for occupations is adapted from ISCO 1988.
2. Data collection methodology
The issuance of the residency and work permits begins with filing an application with the Ministry of Labor.
After its approval, the Ministry of Labor forwards the application to the Ministry of Interior for the issuance of the residency permit.
3. Institution which provides data
Ministry of Labour
4. Data availability
Published in Ministry of Labour’s Statistical Yearbooks
MoL Yearbooks are available online at http://portal.mol.gov.sa/ar/Statistics/Pages/default.aspx (issues 2004-2012)
In 2012′ Yearbook, work permits’ data are not presented in detailed table format.
Date of access: December 2013.
|
Workers |
Accompanying Person |
GRAND |
| year |
male |
female |
total |
male |
female |
total |
TOTAL |
| 1984 |
708,495 |
49,363 |
757,858 |
n.a. |
n.a. |
45,001 |
802,859 |
| 1985 |
465,758 |
61,532 |
527,290 |
n.a. |
n.a. |
36,457 |
563,747 |
| 1986 |
460,330 |
81,675 |
542,005 |
n.a. |
n.a. |
49,256 |
591,261 |
| 1987 |
477,283 |
86,429 |
563,712 |
n.a. |
n.a. |
77,457 |
641,169 |
| 1988 |
476,918 |
78,663 |
555,581 |
26,356 |
33,615 |
59,971 |
615,552 |
| 1989 |
n.a. |
n.a. |
n.a. |
n.a. |
n.a. |
n.a. |
705,679 |
| 1990 |
550,006 |
101,560 |
651,566 |
46,773 |
52,073 |
98,846 |
750,412 |
| 1991 |
737,717 |
130,061 |
867,778 |
22,938 |
29,163 |
52,101 |
919,879 |
| 1992 |
150,802 |
855,837 |
1,006,639 |
30,028 |
25,638 |
55,666 |
1,062,305 |
| 1993 |
848,306 |
193,934 |
1,042,240 |
24,891 |
28,319 |
53,210 |
1,095,450 |
| 1994 |
615,712 |
143,890 |
759,602 |
3,187 |
4,454 |
7,641 |
767,243 |
| 1995 |
500,270 |
102,336 |
602,606 |
5,938 |
10,634 |
16,572 |
619,178 |
| 1996 |
665,731 |
232,184 |
897,915 |
24,557 |
39,763 |
64,320 |
962,235 |
| 1997 |
665,731 |
232,184 |
897,915 |
24,557 |
39,763 |
64,320 |
962,235 |
| 1998 |
597,813 |
228,197 |
826,010 |
18,602 |
31,664 |
50,266 |
876,276 |
| 1999 |
480,314 |
146,742 |
627,056 |
12,773 |
21,698 |
34,471 |
661,527 |
| 2000 |
565,787 |
164,113 |
729,900 |
13,421 |
22,582 |
36,003 |
765,903 |
| 2001 |
604,055 |
167,046 |
771,101 |
14,974 |
24,845 |
39,819 |
810,920 |
| 2002 |
716,714 |
268,061 |
984,775 |
12,447 |
18,929 |
31,376 |
1,016,151 |
| 2003 |
684,782 |
238,230 |
923,012 |
32,233 |
74,328 |
106,561 |
1,029,573 |
| 2004 |
574,129 |
275,831 |
849,960 |
10,766 |
18,535 |
29,301 |
879,261 |
| 2005 |
407,191 |
240,398 |
647,589 |
1,362 |
1,813 |
3,175 |
650,764 |
| 2006 |
532,409 |
317,249 |
849,658 |
94,214 |
140,774 |
234,988 |
1,084,646 |
| 2007 |
868,621 |
294,185 |
1,162,806 |
103,585 |
157,470 |
261,055 |
1,423,861 |
| 2008 |
1,069,265 |
296,672 |
1,365,937 |
108,025 |
167,134 |
275,159 |
1,641,096 |
| 2009 |
n.a. |
n.a. |
n.a. |
n.a. |
n.a. |
n.a. |
n.a. |
| 2010 |
1,080,297 |
322,261 |
1,402,558 |
96,202 |
140,831 |
237,033 |
1,639,591 |
| 2011 |
n.a. |
n.a. |
n.a. |
n.a. |
n.a. |
n.a. |
1,411,688 |
Source: Ministry of Interior, General Directorate of Passports
1. Institution which provides data
Central Department of Statistics and Information (CDSI), Ministry and Economy and Planning
2. Data availability
Published in the CDSI’ Statistical Yearbooks, in Chapter “Social services”
Statistical Yearbooks until 2010′ are available online at: https://www.stats.gov.sa/en/46
2011′ Yearbook is available at: https://www.stats.gov.sa/en/46
Date of access: November 2013.
|
Residence Permits (a) |
Labour permits |
|
Workers |
Accompanying Person |
TOTAL |
|
| 1984 |
757,858 |
45,001 |
802,859 |
|
| 1985 |
527,290 |
36,457 |
563,747 |
|
| 1986 |
542,005 |
49,256 |
591,261 |
|
| 1987 |
563,712 |
77,457 |
641,169 |
|
| 1988 |
555,581 |
59,971 |
615,552 |
|
| 1989 |
n.a. |
n.a. |
705,679 |
|
| 1990 |
651,566 |
98,846 |
750,412 |
|
| 1991 |
867,778 |
52,101 |
919,879 |
|
| 1992 |
1,006,639 |
55,666 |
1,062,305 |
|
| 1993 |
1,042,240 |
53,210 |
1,095,450 |
|
| 1994 |
759,602 |
7,641 |
767,243 |
|
| 1995 |
602,606 |
16,572 |
619,178 |
|
| 1996 |
897,915 |
64,320 |
962,235 |
|
| 1997 |
897,915 |
64,320 |
962,235 |
|
| 1998 |
826,010 |
50,266 |
876,276 |
|
| 1999 |
627,056 |
34,471 |
661,527 |
|
| 2000 |
729,900 |
36,003 |
765,903 |
2,439,672 |
| 2001 |
771,101 |
39,819 |
810,920 |
2,369,611 |
| 2002 |
984,775 |
31,376 |
1,016,151 |
2,663,666 |
| 2003 |
923,012 |
106,561 |
1,029,573 |
2,563,800 |
| 2004 |
849,960 |
29,301 |
879,261 |
2,716,573 |
| 2005 |
647,589 |
3,175 |
650,764 |
2,359,301 |
| 2006 |
849,658 |
234,988 |
1,084,646 |
2,541,083 |
| 2007 |
1,162,806 |
261,055 |
1,423,861 |
2,963,039 |
| 2008 |
1,365,937 |
275,159 |
1,641,096 |
3,598,317 |
| 2009 |
n.a. |
n.a. |
n.a. |
3,222,809 |
| 2010 |
1,402,558 |
237,033 |
1,639,591 |
3,345,630 |
| 2011 |
n.a. |
n.a. |
1,411,688 |
4,088,093 |
Sources: (a) General Directorate of Passports, Ministry of Interior; (b) Ministry of Labour
1. Data collection methodology
The issuance of the residency and work permits begins with filing an application with the Ministry of Labor.
After its approval, the Ministry of Labor forwards the application to the Ministry of Interior for the issuance of the residency permit.
2. Institution which provides data
(a) Central Department of Statistics and Information (CDSI), Ministry and Economy and Planning
(b) Ministry of Labour
3. Data availability
(a) Published in the CDSI’ Statistical Yearbooks, in Chapter “Social services”
Statistical Yearbooks until 2010′ are available online at: https://www.stats.gov.sa/en/46
2011′ Yearbook is available at: https://www.stats.gov.sa/en/46
Date of access: November 2013.
(b) Published in Ministry of Labour’s Statistical Yearbooks
MoL Yearbooks are available online at http://portal.mol.gov.sa/ar/Statistics/Pages/default.aspx (2004-2012, with labour permits figures since 2000)
Date of access: December 2013.
|
males |
females |
total |
| 1974 |
234 |
379 |
613 |
| 1975 |
244 |
397 |
641 |
| 1976 |
110 |
501 |
611 |
| 1977 |
364 |
648 |
1,012 |
| 1978 |
560 |
638 |
1,198 |
| 1979 |
794 |
612 |
1,406 |
| 1980 |
825 |
576 |
1,401 |
| 1981 |
824 |
841 |
1,665 |
| 1982 |
1,042 |
856 |
1,898 |
| 1983 |
1,348 |
376 |
1,724 |
| 1984 |
907 |
398 |
1,305 |
| 1985 |
1,928 |
1,312 |
3,240 |
| 1986 |
1,663 |
1,289 |
2,952 |
| 1987 |
1,186 |
1,396 |
2,582 |
| 1988 |
1,477 |
1,489 |
2,966 |
| 1989 |
1,092 |
1,686 |
2,778 |
| 1990 |
597 |
1,563 |
2,160 |
| 1991 |
764 |
2,995 |
3,759 |
| 1992 |
449 |
2,734 |
3,183 |
| 1993 |
674 |
2,866 |
3,540 |
| 1994 |
650 |
3,926 |
4,576 |
| 1995 |
448 |
3,848 |
4,296 |
| 1996 |
615 |
3,948 |
4,563 |
| 1997 |
564 |
3,075 |
3,639 |
| 1998 |
618 |
4,536 |
5,154 |
| 1999 |
837 |
3,576 |
4,413 |
| 2000 |
903 |
3766 |
4,669 |
Source: Ministry of Interior, General Directorate of Passports
1. Definitions
Saudi Arabia does not allow double nationality. Becoming Saudi implies renouncing one’s previous citizenship.
A person born in the Kingdom to a Saudi mother and a foreign father may be eligible for Saudi nationality if the following conditions are met:
– permanent residence at the time of maturity;
– good conduct which includes not being punished for a penal crime or imprisoned for more than six months;
– good command of the Arabic language;
– submitting the application for nationality within one year of coming of age
(Art. 8, The Nationality Law 1954).
2. Institution which provides data
Ministry of Interior, General Directorate of Passports
3. Data availability
Published in the CDSI’ Statistical Yearbooks, in Chapter “Social services”, by previous nationality of recipient
Statistical Yearbooks until 2010′ are available online at: https://www.stats.gov.sa/en/46
No data on naturalisations is published fter 1420H (1999-2000G).
Date of access: November 2013.
| Estimates of non-national populations in Saudi Arabia, |
| selected nationalities (figures up till November 3, 2013) |
| Country of citizenship |
lower est. |
upper est. |
| 1 |
India |
2,000,000 |
2,800,000 |
| 2 |
Pakistan |
1,500,000 |
| 3 |
Bangladesh |
1,500,000 |
| 4 |
Indonesia |
1,500,000 |
| 5 |
Egypt |
1,000,000 |
2,000,000 |
| 6 |
Syria |
1,000,000 |
| 7 |
Sudan |
500,000 |
900,000 |
| 8 |
Yemen |
800,000 |
1,000,000 |
| 9 |
Philippines |
670,000 |
| 10 |
Sri Lanka |
550,000 |
| 11 |
Afghanistan |
500,000 |
| 12 |
Nepal |
500,000 |
| 13 |
Palestine (holders of |
500,000 |
1,000,000 |
| travel documents) |
| 14 |
Burma |
250,000 |
600,000 |
| 15 |
Jordan (late 2000s) |
250,000 |
300,000 |
| 16 |
Lebanon (2009, workers only) |
160,000 |
| 17 |
Ethiopia |
>150 000 |
700,000 |
| 18 |
Somalia-Erythrea |
? |
Source: Saudi government officials and sending countries’ diplomatic missions
1. Data collection methodology
Figures have been compiled from Saudi press articles (whenever possible).
The figures quoted reflect most recent rough estimates released in press conferences and interviews by Saudi government officials and sending countries’ diplomatic missions.
They reflect the stocks of non-nationals before the completion of the regularisation and crackdowns campaigns targeting foreigners in irregular situation.
Therefore, they are bound to be revised once the campaigns are over.
2. Data availability
1 http://www.indianembassy.org.sa/Content.aspx?ID=790&PID=691
2 http://www.arabnews.com/number-pakistani-expats-exceeds-15-m
3 http://www.arabnews.com/news/451289
4 http://www.arabnews.com/saudi-arabia/indonesian-president-coming-jeddah-visit
5 http://www.arabnews.com/news/483296; http://english.ahram.org.eg/NewsContent/3/12/87637/Business/Economy/Thousands-of-Egyptians-facing-visa-troubles-in-Sau.aspx
6 http://www.arabnews.com/news/470216
7 http://gulfnews.com/news/region/sudan/11-678-sudanese-leave-saudi-arabia-during-amnesty-1.1261853; http://www.sudantribune.com/spip.php?article48701
8 http://www.arabnews.com/news/473621
9 http://www.saudigazette.com.sa/index.cfm?method=home.regcon&contentid=20130520166522
10 http://www.arabnews.com/news/452033
11 http://www.arabnews.com/news/481321
12 http://www.arabnews.com/news/470136
13 http://www.arabnews.com/news/482836; http://www.arabnews.com/news/485266
14 http://www.arabnews.com/news/459726; http://www.saudigazette.com.sa/index.cfm?method=home.regcon&contentid=20130411160940
15 http://hdl.handle.net/1814/13447
16 http://www.saudigazette.com.sa/index.cfm?method=home.regcon&contentid=2009051738185
17 http://www.aljazeera.com/news/africa/2013/12/saudis-expel-100000-illegal-ethiopians-201312591727221329.html; http://gulfnews.com/news/region/sudan/11-678-sudanese-leave-saudi-arabia-during-amnesty-1.1261853
Last date of access: January 2014
| year |
Saudis |
Non-Saudis |
Total |
| 1974 |
6,163,805 |
774,397 |
6,938,202 |
| 1975 |
6,429,179 |
857,831 |
7,287,010 |
| 1976 |
6,703,441 |
949,911 |
7,653,352 |
| 1977 |
6,986,636 |
1,051,478 |
8,038,114 |
| 1978 |
7,278,777 |
1,163,442 |
8,442,219 |
| 1979 |
7,579,846 |
1,286,793 |
8,866,639 |
| 1980 |
7,889,794 |
1,422,602 |
9,312,396 |
| 1981 |
8,208,534 |
1,572,028 |
9,780,562 |
| 1982 |
8,535,941 |
1,736,324 |
10,272,265 |
| 1983 |
8,871,851 |
1,916,839 |
10,788,690 |
| 1984 |
9,216,049 |
2,115,025 |
11,331,074 |
| 1985 |
9,568,281 |
2,332,446 |
11,900,727 |
| 1986 |
9,928,242 |
2,570,776 |
12,499,018 |
| 1987 |
10,295,578 |
2,831,810 |
13,127,388 |
| 1988 |
10,669,880 |
3,117,467 |
13,787,347 |
| 1989 |
11,050,692 |
3,429,794 |
14,480,486 |
| 1990 |
11,437,500 |
3,770,971 |
15,208,471 |
| 1991 |
11,829,739 |
4,143,316 |
15,973,055 |
| 1992 |
12,218,200 |
4,540,179 |
16,758,379 |
| 1993 |
12,551,696 |
4,725,476 |
17,277,172 |
| 1994 |
12,863,710 |
4,837,899 |
17,701,609 |
| 1995 |
13,183,469 |
4,953,006 |
18,136,475 |
| 1996 |
13,511,162 |
5,070,860 |
18,582,022 |
| 1997 |
13,846,988 |
5,191,528 |
19,038,516 |
| 1998 |
14,191,149 |
5,315,076 |
19,506,225 |
| 1999 |
14,543,849 |
5,441,575 |
19,985,424 |
| 2000 |
14,905,300 |
5,571,093 |
20,476,393 |
| 2001 |
15,275,721 |
5,703,704 |
20,979,425 |
| 2002 |
15,655,332 |
5,839,481 |
21,494,813 |
| 2003 |
16,044,362 |
5,978,502 |
22,022,864 |
| 2004 |
16,443,987 |
6,119,899 |
22,563,886 |
| 2005 |
16,854,157 |
6,475,427 |
23,329,584 |
| 2006 |
17,270,181 |
6,851,709 |
24,121,890 |
| 2007 |
17,691,336 |
7,249,962 |
24,941,298 |
| 2008 |
18,115,550 |
7,671,475 |
25,787,025 |
| 2009 |
18,543,246 |
8,117,611 |
26,660,857 |
| 2010* |
18,973,615 |
8,589,817 |
27,563,432 |
| 2011** |
19,405,685 |
8,970,670 |
28,376,355 |
| 2012** |
19,838,448 |
9,357,447 |
29,195,895 |
| 2013** |
20,271,058 |
9,723,214 |
29,994,272 |
Source: Population estimates based on the results of population censuses (1974; 1992; 2004; 2010 preliminary results), Central Department for Statistics and Information (CDSI)
* preliminary results
** estimates from census 2010′ preliminary figures
ANNEXED NOTE
1. Technical Notes and Definitions
Reference periods: middle of given years
Population of reference: all individuals (nationals and non-nationals) present within the Kingdom’s borders during time of reference, be they permanent or temporary residents.
Implementation method: the Censuses are carried out according to de facto methodology, i.e. counting persons where they are during time of reference, be they usual residents of the place or temporary residents.
Estimates are based upon censuses’ results.
The first Saudi census was launched in 1962. It is usually not used, as it did not cover the whole of the resident population. 1974 census is the first comprehensive one in Saudi history. However, its rate of coverage and accuracy of data are considered weak.
1992 census’ population figures, along with ensuing estimates of Saudi population and rates of demographic growth for the following years, were shown to be inflated (see Winckler, O. “The Surprising Results of the Saudi Arabian 2004 Demographic Census”, IJMES, n°40, 2008, pp. 12-15).
Between 2004 and 2010 censuses, Saudi population figures seem consistent with natural increase figures. As non-national population is concerned, it is probably underestimated in official counts. Irregular workers and sojourners are also many (non-official, hence unverifiable estimates range between 1 and 2 millions).
Regarding mid-year estimates, it has to be noted that after each census CDSI has readjusted past figures for Saudi and non-Saudi populations, intercensal data as well as data for census years. Therefore, present data differ significantly from available census figures.
2. Institution which provides data
Central Department of Statistics and Information (CDSI), Ministry and Economy and Planning
3. Data availability
Parts of censuses conducted in 1992 and 2004 are available on the website of the CDSI, in published form in PDF format.
https://www.stats.gov.sa/en/13
https://www.stats.gov.sa/ar/13
For 1992 all published data is broken down by nationality (Saudi/non-Saudi). For 2004, only the data on sex and administrative regions and sub-regions of residence is broken down by nationality (Saudi/ Non-Saudi).
As of November 25th, 2013, only preliminary results of 2010′ census have been published: total population by sex and nationality (Saudi/ non-Saudi), as well as total population by nationality, sex, and administrative region (governorate) of residence.
CDSI’s mid-year estimates of population by nationality (Saudi / non-Saudi) are only available in Saudi Arabia Monetary Agency (SAMA) Annual Reports, available online.
Data presented here are taken from SAMA Annual Report n°48 (2013), p. 361 (estimates for 1974-2012) and from https://www.stats.gov.sa/en/indicators (2013 estimates).
Date of access: November 25th, 2013.
| Census |
Qataris |
Non-Qataris |
Total |
| 1970 |
45,039 |
66,094 |
111,133 |
| 1986 |
99,754 |
273,638 |
373,392 |
| 1997 |
151,673 |
384,801 |
536,474 |
| 2004 |
192,586 |
605,475 |
798,061 |
| 2010 |
243,073 |
1,456,362 |
1,699,435 |
Source: GLMM calculations on the basis of QSA’ data
ANNEXED NOTE
1. Technical Notes and Definitions
Reference periods for each census: 1970: unknown; the nights of March 16th, 1986; March 1st, 1997; March 16th, 2004 and April 21st, 2010 respectively.
Implementation method: censuses are based on de jure method; i.e. registering people according to their usual place of residence at time of census.
Populations in transit or visiting Qatar as tourists, as well as residents of public housing or visitors staying in a household for less than two months after night of reference were excluded.
Populations away from usual residence in Qatar for reasons of duty, or on a visit abroad for less than two months, as well as individuals with no personal housing within Qatar staying with a household for more than two months, are counted in their usual/ present residence during census night.
Population of reference: all individuals (nationals and non-nationals) present within the State’s borders during time of reference.
Prior to 2010′ census, only a sample of foreign residents was covered in census.
“2010′ census recorded all the residents. Eight questionnaires covering the key census areas were designed, in order to ensure that all units (establishments; buildings; residential units; houses and individuals) are covered by the census.”
The eight questionnaires are as follows:
1. Enumeration of buildings;
2. Enumeration of establishments, residential units and houses.
3. Survey of establishments (usage, et cetera);
4. Family living conditions;
5. Survey of labour camp residents;
6. Survey of public housing residents;
7. Survey of hotel residents and transit travellers through airports, ports and land border crossings;
8. Survey of Qataris living abroad.
2010′ census was the first conducted with the help of PDA devices (Personal Digital Assistant).
2. Institution which provides data
Qatar Statistics Authority (QSA)
(http://www.qsa.gov.qa/eng/index.htm for website in English; http://www.qsa.gov.qa/Ar/index.htm for website in Arabic)
3. Data availability
Released parts of censuses (1986; 1997; 2004; 2010) are available on the website of the QSA, in published form in PDF format.
https://www.mdps.gov.qa/en/statistics1/pages/topicslisting.aspx?parent=General&child=Census
Census 2010′ website:
https://www.mdps.gov.qa/en/statistics1/pages/topicslisting.aspx?parent=General&child=Census
2010′ census in Excel or PDF format individual tables:
http://www.qsa.gov.qa/QatarCensus/Census_Results.aspx
Date of access: June 2013.
| |
|
Saudis |
|
|
Non-Saudis |
|
|
Total |
|
| year |
males |
females |
total |
males |
females |
total |
males |
females |
total |
| 1974 |
3.166.013 |
2.997.792 |
6.163.805 |
517.178 |
257.219 |
774.397 |
3.683.191 |
3.255.011 |
6.938.202 |
| 1975 |
3.299.247 |
3.129.932 |
6.429.179 |
574.639 |
283.192 |
857.831 |
3.873.886 |
3.413.124 |
7.287.010 |
| 1976 |
3.436.784 |
3.266.657 |
6.703.441 |
638.241 |
311.670 |
949.911 |
4.075.025 |
3.578.327 |
7.653.352 |
| 1977 |
3.578.634 |
3.408.002 |
6.986.636 |
708.602 |
342.876 |
1.051.478 |
4.287.236 |
3.750.878 |
8.038.114 |
| 1978 |
3.724.791 |
3.553.986 |
7.278.777 |
786.393 |
377.049 |
1.163.442 |
4.511.184 |
3.931.035 |
8.442.219 |
| 1979 |
3.875.233 |
3.704.613 |
7.579.846 |
872.345 |
414.448 |
1.286.793 |
4.747.578 |
4.119.061 |
8.866.639 |
| 1980 |
4.029.922 |
3.859.872 |
7.889.794 |
967.252 |
455.350 |
1.422.602 |
4.997.174 |
4.315.222 |
9.312.396 |
| 1981 |
4.188.801 |
4.019.733 |
8.208.534 |
1.071.977 |
500.051 |
1.572.028 |
5.260.778 |
4.519.784 |
9.780.562 |
| 1982 |
4.351.793 |
4.184.148 |
8.535.941 |
1.187.454 |
548.870 |
1.736.324 |
5.539.247 |
4.733.018 |
10.272.265 |
| 1983 |
4.518.803 |
4.353.048 |
8.871.851 |
1.314.694 |
602.145 |
1.916.839 |
5.833.497 |
4.955.193 |
10.788.690 |
| 1984 |
4.689.709 |
4.526.340 |
9.216.049 |
1.454.788 |
660.237 |
2.115.025 |
6.144.497 |
5.186.577 |
11.331.074 |
| 1985 |
4.864.370 |
4.703.911 |
9.568.281 |
1.608.915 |
723.531 |
2.332.446 |
6.473.285 |
5.427.442 |
11.900.727 |
| 1986 |
5.042.619 |
4.885.623 |
9.928.242 |
1.778.342 |
792.434 |
2.570.776 |
6.820.961 |
5.678.057 |
12.499.018 |
| 1987 |
5.224.266 |
5.071.312 |
10.295.578 |
1.964.432 |
867.378 |
2.831.810 |
7.188.698 |
5.938.690 |
13.127.388 |
| 1988 |
5.409.093 |
5.260.787 |
10.669.880 |
2.168.647 |
948.820 |
3.117.467 |
7.577.740 |
6.209.607 |
13.787.347 |
| 1989 |
5.596.859 |
5.453.833 |
11.050.692 |
2.392.552 |
1.037.242 |
3.429.794 |
7.989.411 |
6.491.075 |
14.480.486 |
| 1990 |
5.787.294 |
5.650.206 |
11.437.500 |
2.637.820 |
1.133.151 |
3.770.971 |
8.425.114 |
6.783.357 |
15.208.471 |
| 1991 |
5.980.104 |
5.849.635 |
11.829.739 |
2.906.237 |
1.237.079 |
4.143.316 |
8.886.341 |
7.086.714 |
15.973.055 |
| 1992 |
6.170.757 |
6.047.443 |
12.218.200 |
3.193.111 |
1.347.068 |
4.540.179 |
9.363.868 |
7.394.511 |
16.758.379 |
| 1993 |
6.334.907 |
6.216.789 |
12.551.696 |
3.322.551 |
1.402.925 |
4.725.476 |
9.657.458 |
7.619.714 |
17.277.172 |
| 1994 |
6.488.628 |
6.375.082 |
12.863.710 |
3.397.772 |
1.440.127 |
4.837.899 |
9.886.400 |
7.815.209 |
17.701.609 |
| 1995 |
6.646.071 |
6.537.398 |
13.183.469 |
3.474.692 |
1.478.314 |
4.953.006 |
10.120.763 |
8.015.712 |
18.136.475 |
| 1996 |
6.807.325 |
6.703.837 |
13.511.162 |
3.553.349 |
1.517.511 |
5.070.860 |
10.360.674 |
8.221.348 |
18.582.022 |
| 1997 |
6.972.483 |
6.874.505 |
13.846.988 |
3.633.782 |
1.557.746 |
5.191.528 |
10.606.265 |
8.432.251 |
19.038.516 |
| 1998 |
7.141.639 |
7.049.510 |
14.191.149 |
3.716.031 |
1.599.045 |
5.315.076 |
10.857.670 |
8.648.555 |
19.506.225 |
| 1999 |
7.314.889 |
7.228.960 |
14.543.849 |
3.800.137 |
1.641.438 |
5.441.575 |
11.115.026 |
8.870.398 |
19.985.424 |
| 2000 |
7.492.332 |
7.412.968 |
14.905.300 |
3.886.141 |
1.684.952 |
5.571.093 |
11.378.473 |
9.097.920 |
20.476.393 |
| 2001 |
7.674.070 |
7.601.651 |
15.275.721 |
3.974.087 |
1.729.617 |
5.703.704 |
11.648.157 |
9.331.268 |
20.979.425 |
| 2002 |
7.860.206 |
7.795.126 |
15.655.332 |
4.064.017 |
1.775.464 |
5.839.481 |
11.924.223 |
9.570.590 |
21.494.813 |
| 2003 |
8.050.847 |
7.993.515 |
16.044.362 |
4.155.978 |
1.822.524 |
5.978.502 |
12.206.825 |
9.816.039 |
22.022.864 |
| 2004 |
8.245.575 |
8.198.412 |
16.443.987 |
4.248.335 |
1.871.564 |
6.119.899 |
12.493.910 |
10.069.976 |
22.563.886 |
| 2005 |
8.453.097 |
8.401.060 |
16.854.157 |
4.506.528 |
1.968.899 |
6.475.427 |
12.959.625 |
10.369.959 |
23.329.584 |
| 2006 |
8.663.597 |
8.606.584 |
17.270.181 |
4.780.413 |
2.071.296 |
6.851.709 |
13.444.010 |
10.677.880 |
24.121.890 |
| 2007 |
8.876.666 |
8.814.670 |
17.691.336 |
5.070.944 |
2.179.018 |
7.249.962 |
13.947.610 |
10.993.688 |
24.941.298 |
| 2008 |
9.091.249 |
9.024.301 |
18.115.550 |
5.379.132 |
2.292.343 |
7.671.475 |
14.470.381 |
11.316.644 |
25.787.025 |
| 2009 |
9.307.550 |
9.235.696 |
18.543.246 |
5.706.050 |
2.411.561 |
8.117.611 |
15.013.600 |
11.647.257 |
26.660.857 |
| 2010* |
9.525.178 |
9.448.437 |
18.973.615 |
6.052.837 |
2.536.980 |
8.589.817 |
15.578.015 |
11.985.417 |
27.563.432 |
| 2011** |
9.743.626 |
9.662.059 |
19.405.685 |
6.297.735 |
2.672.935 |
8.970.670 |
16.041.361 |
12.334.994 |
28.376.355 |
| 2012** |
9.962.431 |
9.876.017 |
19.838.448 |
6.591.296 |
2.766.151 |
9.357.447 |
16.553.727 |
12.642.168 |
29.195.895 |
| 2013** |
n.a. |
n.a. |
20.271.058 |
n.a. |
n.a. |
9.723.214 |
n.a. |
n.a. |
29.994.272 |
Source: Population estimates based on the results of population censuses (1974; 1992; 2004; 2010 preliminary results), Central Department for Statistics and Information (CDSI)
* preliminary results
** estimates from census 2010′ preliminary figures
ANNEXED NOTE
1. Technical Notes and Definitions
Reference periods: middle of given years
Population of reference: all individuals (nationals and non-nationals) present within the Kingdom’s borders during time of reference, be they permanent or temporary residents.
Implementation method: the Censuses are carried out according to de facto methodology, i.e. counting persons where they are during time of reference, be they usual residents of the place or temporary residents.
Estimates are based upon censuses’ results.
The first Saudi census was launched in 1962. It is usually not used, as it did not cover the whole of the resident population. 1974 census is the first comprehensive one in Saudi history. However, its rate of coverage and accuracy of data are considered weak.
1992 census’ population figures, along with ensuing estimates of Saudi population and rates of demographic growth for the following years, were shown to be inflated (see Winckler, O. “The Surprising Results of the Saudi Arabian 2004 Demographic Census”, IJMES, n°40, 2008, pp. 12-15).
Between 2004 and 2010 censuses, Saudi population figures seem consistent with natural increase figures. As non-national population is concerned, it is probably underestimated in official counts. Irregular workers and sojourners are also many (non-official, hence unverifiable estimates range between 1 and 2 millions).
Regarding mid-year estimates, it has to be noted that after each census CDSI has readjusted past figures for Saudi and non-Saudi populations, intercensal data as well as data for census years. Therefore, present data differ significantly from available census figures.
2. Institution which provides data
Central Department of Statistics and Information (CDSI), Ministry and Economy and Planning
3. Data availability
Parts of censuses conducted in 1992 and 2004 are available on the website of the CDSI (http://www.cdsi.gov.sa/), in published form in PDF format.
https://www.stats.gov.sa/en/13
https://www.stats.gov.sa/ar/13
For 1992 all published data is broken down by nationality (Saudi/non-Saudi). For 2004, only the data on sex and administrative regions and sub-regions of residence is broken down by nationality (Saudi/ Non-Saudi).
As of November 25th, 2013, only preliminary results of 2010′ census have been published: total population by sex and nationality (Saudi/ non-Saudi), as well as total population by nationality, sex, and administrative region (governorate) of residence.
CDSI’s mid-year estimates are only available in Saudi Arabia Monetary Agency (SAMA) Annual Reports, available online at: http://www.sama.gov.sa/sites/samaen/ReportsStatistics/Pages/AnnualReport.aspx.
Data presented here are taken from SAMA Annual Report n°48 (2013), p. 361 1974-2012) and from CDSI (https://www.stats.gov.sa/en/indicators), for 2013′ estimates.
Date of access: November 25th, 2013.
|
|
|
Employed nationals |
Employed non-nationals |
Total employed population |
| Country |
date/ period |
sex |
numbers |
men per 100 women |
numbers |
men per 100 women |
numbers |
men per 100 women |
| Bahrain (1) |
April 2010 |
males |
120.550 |
213 |
437.394 |
493 |
557.944 |
384 |
| |
|
females |
56.482 |
88.781 |
145.263 |
| Kuwait (2) |
December 2013 |
males |
212.734 |
114 |
1.462.226 |
313 |
1.674.960 |
256 |
| |
|
females |
185.991 |
467.630 |
653.621 |
| Oman(3) |
December 2012 |
males |
235.422 |
228 |
1.206.174 |
879 |
1.441.596 |
583 |
| |
|
females |
103.448 |
137.204 |
240.652 |
| Qatar (4) |
Q4 2013 |
males |
63.752 |
206 |
1.286.829 |
803 |
1.350.581 |
701 |
| |
|
females |
31.000 |
160.173 |
191.173 |
| Saudi Arabia (5) |
June 2013 |
males |
3.989.632 |
548 |
5.342.675 |
798 |
9.332.307 |
705 |
| |
|
females |
727.495 |
669.321 |
1.396.816 |
| United Arab Emirates (6) |
May 2009 |
males |
170.000 |
321 |
2.548.000 |
696 |
2.718.000 |
649 |
| |
|
females |
53.000 |
366.000 |
419.000 |
| GCC Total* |
|
males |
4.792.090 |
414 |
12.283.298 |
650 |
17.075.388 |
574 |
| |
|
females |
1.157.416 |
1.889.109 |
3.046.525 |
Sources: national institutes of statistics, latest year or period available as of April 2014.
* Total provides the sum of population numbers at different dates between May 2009 and December 2013. It is not exactly the total population at any of these dates.
1- Definition:
Non-nationals are:
1- persons bearing nationality of a foreign State other than the GCC State of residence, or bearing no proof of nationality from any given state (stateless persons and holders of refugee status and travel document in a third country) ;
2- Holders of residence permit residing in the given GCC country at date of census, as per definition of residence used in each of the countries.
Employment refers to a person aged 15 years and above who during the reference period:
– worked for one hour or more for wage or salary, in cash or in kind
– worked for one hour or more for profit or family gain, in cash or in kind
2- Sources of data:
(1) Bahrain Central Informatics Organisation (CIO), Census 2010;
(2) Kuwait Public Authority for Civil Information (PACI), Dec. 2012
(3) National Centre for Statistical Information (NCSI), Statistical Yearbook 2013 (Data does not include nationals and non-nationals in the “Public administration and defense, compulsory social security”.)
(4) Qatar Statistics Authority (QSA), Quarterly Labor Force Survey 2013 (Q4, September-December 2013).
(5) Saudi Arabia Central Department for Statistics and Information (CDSI), Labor Force Survey 2013, Round 2
(6) UAE National Bureau of Statistics (NBS), Labor Force Survey 2009.
|
|
Employed |
% in employed population |
| Country |
date/ period |
population |
Nationals |
Non-nationals |
| Bahrain (1) |
April 2010 |
703.207 |
25,2 |
74,8 |
| Kuwait (2) |
December 2013 |
2.328.581 |
17,1 |
82,9 |
| Oman (3) |
December 2012 |
1.682.248 |
20,1 |
79,9 |
| Qatar (4) |
Q4 2013 |
1.541.754 |
6,1 |
93,9 |
| Saudi Arabia (5) |
June 2013 |
10.729.123 |
44,0 |
56,0 |
| United Arab Emirates (6) |
May 2009 |
3.137.000 |
7,1 |
92,9 |
| Total* |
|
20.121.913 |
29,6 |
70,4 |
Sources: national institutes of statistics, latest year or period available as of April 2014.
* Total provides the sum of population numbers at different dates between May 2009 and December 2013. It is not exactly the total population at any of these dates.
1- Definition:
Non-nationals are:
1- persons bearing nationality of a foreign State other than the GCC State of residence, or bearing no proof of nationality from any given state (stateless persons and holders of refugee status and travel document in a third country) ;
2- Holders of residence permit residing in the given GCC country at date of census, as per definition of residence used in each of the countries.
Employment refers to a person aged 15 years and above who during the reference period:
– worked for one hour or more for wage or salary, in cash or in kind
– worked for one hour or more for profit or family gain, in cash or in kind
2- Sources of data:
(1) Bahrain Central Informatics Organisation (CIO), Census 2010;
(2) Kuwait Public Authority for Civil Information (PACI), Dec. 2012
(3) National Centre for Statistical Information (NCSI), Statistical Yearbook 2013 (Data does not include nationals and non-nationals in the “Public administration and defense, compulsory social security”.)
(4) Qatar Statistics Authority (QSA), Quarterly Labor Force Survey 2013 (Q4, September-December 2013).
(5) Saudi Arabia Central Department for Statistics and Information (CDSI), Labor Force Survey 2013, Round 2
(6) UAE National Bureau of Statistics (NBS), Labor Force Survey 2009.
|
|
age |
Nationals |
Non-nationals |
Total population |
% non-nationals |
| Country |
date/ period |
group |
numbers |
% |
numbers |
% |
numbers |
% |
in each age group |
| Bahrain (1) |
April 2010 |
0-14 |
180.934 |
32 |
66.669 |
10 |
247.603 |
20 |
27 |
| |
|
15-64 |
363.888 |
64 |
596.846 |
90 |
960.734 |
78 |
62 |
| |
|
65+ |
23.577 |
4 |
2.657 |
0 |
26.234 |
2 |
10 |
| Kuwait (2) |
December 2013 |
0-14 |
459.243 |
37 |
393.625 |
14 |
852.868 |
22 |
46 |
| |
|
15-64 |
739.223 |
59 |
2.296.572 |
84 |
3.035.795 |
77 |
76 |
| |
|
65+ |
44.033 |
4 |
32.448 |
1 |
76.481 |
2 |
42 |
| Oman(3) |
mid-2013 |
0-14 |
745.182 |
34 |
90.057 |
5 |
835.239 |
22 |
11 |
| |
|
15-64 |
1.334.312 |
61 |
1.587.051 |
94 |
2.921.363 |
76 |
54 |
| |
|
65+ |
92.508 |
4 |
6.096 |
0 |
98.604 |
3 |
6 |
| Qatar (4) |
April 2010 |
0-14 |
96.811 |
40 |
135.773 |
9 |
232.584 |
14 |
58 |
| |
|
15-64 |
138.915 |
57 |
1.314.119 |
90 |
1.453.034 |
86 |
90 |
| |
|
65+ |
7.347 |
3 |
6.471 |
0 |
13.818 |
1 |
47 |
| Saudi Arabia (5) |
February 2007 |
0-14 |
6.512.096 |
37 |
1.270.900 |
20 |
7.782.996 |
32 |
16 |
| |
|
15-64 |
10.371.695 |
59 |
5.149.958 |
79 |
15.521.653 |
65 |
33 |
| |
|
65+ |
609.573 |
3 |
66.612 |
1 |
676.185 |
3 |
10 |
| United Arab Emirates (6) |
December 2005 |
0-14 |
313.872 |
38 |
486.699 |
15 |
800.571 |
20 |
61 |
| |
|
15-64 |
488.592 |
59 |
2.780.314 |
85 |
3.268.906 |
80 |
85 |
| |
|
65+ |
21.708 |
3 |
13.919 |
0 |
35.627 |
1 |
39 |
| GCC Total* |
|
0-14 |
8.308.138 |
37 |
2.443.723 |
15 |
10.751.861 |
28 |
23 |
| |
|
15-64 |
13.436.625 |
60 |
13.724.860 |
84 |
27.161.485 |
70 |
51 |
| |
|
65+ |
798.746 |
4 |
128.203 |
1 |
926.949 |
2 |
14 |
Sources: national institutes of statistics.
* Total provides the sum of population numbers at different dates between December 2005 and mid- 2013. It is not exactly the total population at any of these dates.
1- Definition:
Non-nationals are:
1- persons bearing nationality of a foreign State other than the GCC State of residence, or bearing no proof of nationality from any given state (stateless persons and holders of refugee status and travel document in a third country) ;
2- Holders of residence permit residing in the given GCC country at date of census, as per definition of residence used in each of the countries.
2- Sources of data:
(1) Bahrain Central Informatics Organisation (CIO), Census 2010;
(2) Kuwait Public Authority for Civil Information (PACI); http://gulfmigration.eu/population-by-nationality-kuwaiti-non-kuwaiti-sex-and-age-group-2012/
(3) National Centre for Statistical Information (NCSI), Bulletin of Population Statistics n°3, 2013;
(4) Qatar Statistics Authority (QSA), Census 2010; http://gulfmigration.eu/population-aged-15-years-and-above-by-sex-10-years-age-groups-and-nationality-qatari-non-qatari-and-total-population-by-sex-and-5-years-age-groups-2010/
(5) Saudi Arabia Central Department for Statistics and Information (CDSI), Demographic Survey 2007.
(6) UAE National Bureau of Statistics (NBS), Census 2005.
|
|
|
Nationals |
Non-nationals |
Total population |
| Country |
date/ period |
sex |
numbers |
men per 100 women |
numbers |
men per 100 women |
numbers |
men per 100 women |
| Bahrain (1) |
April 2010 |
males |
194.643 |
101 |
447.078 |
293 |
641.721 |
186 |
| |
|
females |
192.822 |
152.425 |
345.247 |
| Kuwait (2) |
December 2013 |
males |
610.545 |
97 |
1.772.413 |
187 |
2.382.958 |
151 |
| |
|
females |
631.954 |
950.232 |
1.582.186 |
| Oman(3) |
mid-2013 |
males |
720.955 |
102 |
1.354.994 |
569 |
2.075.949 |
220 |
| |
|
females |
705.865 |
238.153 |
944.018 |
| Qatar (4) |
Q4 2013 |
males |
89.995 |
99 |
1.314.251 |
493 |
1.404.246 |
393 |
| |
|
females |
90.616 |
266.805 |
357.421 |
| Saudi Arabia (5) |
January 2013 |
males |
6.569.143 |
102 |
5.713.631 |
287 |
12.282.774 |
145 |
| |
|
females |
6.469.156 |
1.988.687 |
8.457.843 |
| United Arab Emirates* (6) |
mid-2010 |
males |
293.981 |
100 |
5.076.366 |
420 |
5.370.347 |
357 |
| |
|
females |
293.571 |
1.209.178 |
1.502.749 |
| GCC Total** |
|
males |
8.479.262 |
101 |
15.678.733 |
326 |
24.157.995 |
183 |
| |
|
females |
8.383.984 |
4.805.480 |
13.189.464 |
Sources: national institutes of statistics, latest year available as of November 2013.
* our estimates.
** Total provides the sum of population numbers at different dates between April 2010 and end of 2013. It is not exactly the total population at any of these dates.
1- Definition:
Non-nationals are:
1- persons bearing nationality of a foreign State other than the GCC State of residence, or bearing no proof of nationality from any given state (stateless persons and holders of refugee status and travel document in a third country) ;
2- Holders of residence permit residing in the given GCC country at date of census, as per definition of residence used in each of the countries.
2- Sources of data:
(1) Bahrain Central Informatics Organisation (CIO), Census 2010;
(2) Kuwait Public Authority for Civil Information (PACI); http://gulfmigration.eu/kuwait-population-by-nationality-kuwaiti-non-kuwaiti-sex-and-age-group-december-2013/
(3) National Centre for Statistical Information (NCSI), Bulletin of Population Statistics n°3, 2013;
(4) Qatar Statistics Authority (QSA), Quarterly Labor Force Survey Q4 2013. Also available in GLMM database: http://gulfmigration.eu/population-15-years-and-above-by-nationality-qatari-non-qatari-sex-and-age-group-2012/
(5) Saudi Arabia Central Department for Statistics and Information (CDSI), Labour Force Survey 2013 (Round 1); http://gulfmigration.eu/population-aged-15-and-above-by-nationality-saudi-non-saudi-sex-and-education-level-2013/
(6) UAE National Bureau of Statistics (NBS), our estimates from: http://www.uaestatistics.gov.ae/EnglishHome/ReportDetailsEnglish/tabid/121/Default.aspx?ItemId=1914&PTID=104&MenuId=1
|
Absolute numbers |
% |
% |
| Country |
|
|
Total |
Percentage of |
Intercensal annual growth rates |
| |
Nationals |
Non-nationals |
population |
non-nationals |
Nationals |
Foreigners |
| Bahrain(a) |
| 1971 |
178.193 |
37.885 |
216.071 |
17,5 |
|
|
| 1991 |
323.305 |
184.732 |
508.037 |
36,4 |
3,0 |
7,9 |
| 2001 |
405.667 |
244.937 |
650.604 |
37,6 |
2,3 |
2,8 |
| 2010 |
568.399 |
666.172 |
1.234.571 |
54,0 |
3,7 |
11,1 |
| Kuwait(b) |
| 1975(c) |
307.755 |
687.082 |
994.837 |
69,1 |
|
|
| 1990 |
578.511 |
1.573.169 |
2.151.680 |
73,1 |
4,2 |
5,5 |
| 1993 |
657.493 |
988.134 |
1.645.627 |
60,0 |
4,3 |
-15,5 |
| 2000 |
841.790 |
1.375.468 |
2.217.258 |
62,0 |
3,5 |
4,7 |
| 2010 |
1.148.363 |
2.433.691 |
3.582.054 |
67,9 |
3,1 |
5,7 |
| Oman(d) |
| 1975(e) |
822.503 |
75.328 |
897.831 |
8,4 |
|
|
| 1993 |
1.465.000 |
535.000 |
2.000.000 |
26,8 |
3,2 |
10,9 |
| 2003 |
1.781.558 |
559.257 |
2.340.815 |
23,9 |
2,0 |
0,4 |
| 2010 |
1.957.336 |
816.143 |
2.773.479 |
29,4 |
1,3 |
5,4 |
| Qatar(f) |
| 1970 |
45.039 |
66.094 |
111.133 |
59,5 |
|
|
| 1997 |
151.673 |
384.801 |
536.474 |
71,7 |
4,5 |
6,5 |
| 2004 |
192.586 |
605.475 |
798.061 |
75,9 |
3,4 |
6,5 |
| 2010 |
243.073 |
1.456.362 |
1.699.435 |
85,7 |
3,9 |
14,6 |
| Saudi Arabia(g) |
| 1974 |
6.218.361 |
791.105 |
7.009.466 |
11,3 |
|
|
| 1992 |
12.310.053 |
4.638.335 |
16.948.388 |
27,4 |
3,8 |
9,8 |
| 2004 |
16.529.302 |
6.150.922 |
22.680.224 |
27,1 |
2,5 |
2,4 |
| 2010* |
18.707.576 |
8.429.401 |
27.136.977 |
31,1 |
2,1 |
5,3 |
| United Arab Emirates(h) |
| 1975 |
201.544 |
356.343 |
557.887 |
63,9 |
|
|
| 1995 |
587.330 |
1.823.711 |
2.411.041 |
75,6 |
5,3 |
8,2 |
| 2005 |
825.495 |
3.280.932 |
4.106.427 |
79,9 |
3,4 |
5,9 |
| 2010(i) |
947.997 |
7.316.073 |
8.264.070 |
88,5 |
2,8 |
16,0 |
| GCC total |
| 1970-1975 |
7.773.395 |
2.013.837 |
9.787.225 |
20,6 |
|
|
| 1990-1995 |
15.494.854 |
8.554.713 |
24.049.567 |
35,6 |
3,4 |
7,2 |
| 2000-2005 |
20.576.398 |
12.216.991 |
32.793.389 |
37,3 |
2,8 |
3,6 |
| 2010 |
23.572.744 |
21.117.842 |
44.690.586 |
47,3 |
2,3 |
9,1 |
Sources: national institutes of statistics.
* preliminary results.
ANNEXED NOTE
1- Definition:
Non-nationals counted above are:
1- persons bearing nationality of a foreign State other than the GCC State of residence, or bearing no proof of nationality from any given state (stateless persons and holders of refugee status and travel document in a third country) ;
2- residents in the given GCC country at date of census, as per definition of residence used in each of the countries.
2- Sources and availability of data:
Bahrain:
(a)National census data, given years.
http://www.cio.gov.bh/CIO_ENG/SubDetailed.aspx?subcatid=604
Kuwait
– (b)Kuwait Public Authority for Civil Information (PACI)
Available in GLMM database:
http://gulfmigration.eu/kuwait-population-by-nationality-kuwaiti-non-kuwaiti-1990-2013/
– (c)National census data for 1975.
http://www.csb.gov.kw/Socan_Statistic_EN.aspx
Oman:
– (d)National census data, given years.
http://www.ncsi.gov.om/NCSI_website/N_viewPublications_EN.aspx?id=1540 for SYB 2012.
– (e)United Nations Population Division, Trends in Total Migrant Stock: 2008 Revision
Qatar:
(f)National census data, given years.
Available in GLMM database:
http://gulfmigration.eu/population-by-nationality-qatari-non-qatari-census-1970-2010/
Saudi Arabia
(g)National census data, given years.
Available in GLMM database:
http://gulfmigration.eu/population-by-citizenship-saudi-non-saudi-1974-1992-2004-2010/
United Arab Emirates
-(h)National census data, given years.
http://www.uaestatistics.gov.ae/ReportPDF/DSS_CENSUS_Population%20by%20Emirates%201975-2005.xls
“- (i): UAE National Bureau of Statstics’ estimates. http://www.uaestatistics.gov.ae/EnglishHome/ReportDetailsEnglish/tabid/121/Default.aspx?ItemId=1914&PTID=104&MenuId=1
| Activity status |
In the Labour Force |
Out of the Labour Force |
Total |
| |
Male |
Female |
Total |
Male |
Female |
Total |
Male |
Female |
Total |
| Saudis |
4,042,461 |
1,038,638 |
5,081,099 |
1,976,527 |
4,880,670 |
6,857,197 |
6,018,988 |
5,919,308 |
11,938,296 |
| Non-Saudis |
5,226,875 |
648,097 |
5,874,972 |
294,779 |
1,282,002 |
1,576,781 |
5,521,654 |
1,930,099 |
7,451,753 |
| Total |
9,269,336 |
1,686,735 |
10,956,071 |
2,271,306 |
6,162,672 |
8,433,978 |
11,540,642 |
7,849,407 |
19,390,049 |
source: Labour Force Survey 2013 (Round 1)
ANNEXED NOTE
1. Technical Notes and Definitions
Sampling frame of LFS 2013 Round 1: Population Census 2010.
Sample size: 33500 households
Reference period: January 13th-February 5th, 2013
Population of reference: all individuals (nationals and non-nationals) residing in the Kingdom during the period of reference.
The ultimate sampling unit is the household.
(a) Working age population: the population aged 15 to 60 (retirement age for Saudis), even though (as of mid-2013) there is no maximum working age on foreign nationals.
(b) Person in the labour force: a person aged 15 years and over, employed or unemployed. Here, concerned population is aged 15 to 60 years.
(c) Person out of the labour force: A person aged 15 years and over who is not included in the labour force, among which: the persons staying home for domestics activities, the students, the retired, the self sufficients, the ones unable to enrol in labour, who are not working and do not look for employment for any other reason. Here, concerned population is aged 15 to 60 years.
2. Institution which provides data
Central Department of Statistics and Information (CDSI), Ministry and Economy and Planning
3. Data availability
Surveys conducted since 1999 are available on the website of the CDSI, in published form in PDF format. A selection of tables is also available in PDF or Excel format.
https://www.stats.gov.sa/en/814
https://www.stats.gov.sa/ar/814
The technical notes and tables of contents are in Arabic and the tables are in both languages.
Date of access: September 2013.
Since 2007, Statistical Yearbooks have introduced a section on “Labour Statistics”, which presents a selection of tables from Manpower Surveys.
https://www.stats.gov.sa/en/46
Date of access: May 2013.
| |
2008/2009 |
2009/2010 |
2010/2011 |
| |
Scholarships |
Graduates |
Scholarships |
Graduates |
Scholarships |
Graduates |
| |
Males |
Females |
Total |
Males |
Females |
Total |
Males |
Females |
Total |
Males |
Females |
Total |
Males |
Females |
Total |
Males |
Females |
Total |
| Doctorate |
4 |
3 |
7 |
2 |
5 |
7 |
3 |
0 |
3 |
5 |
4 |
9 |
4 |
4 |
8 |
3 |
5 |
8 |
| Master |
8 |
6 |
14 |
9 |
8 |
17 |
17 |
8 |
25 |
2 |
4 |
6 |
16 |
18 |
34 |
7 |
4 |
11 |
| Bachelor |
57 |
14 |
71 |
48 |
21 |
69 |
87 |
32 |
119 |
31 |
30 |
61 |
98 |
40 |
138 |
35 |
21 |
56 |
| Associate |
0 |
0 |
0 |
0 |
0 |
0 |
0 |
0 |
0 |
0 |
0 |
0 |
0 |
0 |
0 |
0 |
0 |
0 |
| Diploma |
0 |
0 |
0 |
0 |
0 |
0 |
0 |
0 |
0 |
0 |
0 |
0 |
0 |
0 |
0 |
0 |
0 |
0 |
| Other Degree |
4 |
0 |
4 |
0 |
2 |
2 |
6 |
2 |
8 |
7 |
0 |
7 |
10 |
1 |
11 |
3 |
0 |
3 |
| Total |
73 |
23 |
96 |
59 |
36 |
95 |
113 |
42 |
155 |
45 |
38 |
83 |
128 |
63 |
191 |
48 |
30 |
78 |
Source: Qatar Foundation, Supreme Council for Education, Universities
ANNEXED NOTE
Students on scholarship are sponsored by the State of Qatar or by another body. The figures presented here do not take into account Qatar students abroad, living on their own expense, if any.
Institution which provides data
Qatar Statistics Authority
Data availability
These data on education have been found in the “Education” chapter of 2012’s Statistical Yearbook.
https://www.mdps.gov.qa/en/statistics1/pages/topicslisting.aspx?parent=General&child=StatisticalAbstract
QSA publishes Statistical Yearbooks available online, in Excel (certain thematic chapters since 2010) and PDF format, up to 1980’s issue. However, recently they seem not to be published yearly as a complete volume and thematic chapters are published separately.
Issues 1980 to 2009 are available on the Qatar Information Exchange website, accessible from QSA’ website (English and Arabic website)
http://www.qix.gov.qa/portal/page/portal/QIXPOC/Documents/QIX%20Knowledge%20Base/Publication/General%20Statistics/Annual%20Abstract
Last date of access: June 27th, 2013.
| |
|
Saudis |
|
|
Non-Saudis |
|
|
Total |
|
| |
males |
females |
total |
males |
females |
total |
males |
females |
total |
| Never married |
796,696 |
143,058 |
939,754 |
680,199 |
112,293 |
792,492 |
1,476,895 |
255,351 |
1,732,246 |
| Married |
3,108,204 |
497,379 |
3,605,583 |
4,656,105 |
512,840 |
5,168,945 |
7,764,309 |
1,010,219 |
8,774,528 |
| Divorced |
35,648 |
25,628 |
61,276 |
14,906 |
10,725 |
25,631 |
50,554 |
36,353 |
86,907 |
| Widower |
10,707 |
13,797 |
24,504 |
10,917 |
5,631 |
16,548 |
21,624 |
19,428 |
41,052 |
| Total |
3,951,255 |
679,862 |
4,631,117 |
5,362,127 |
641,489 |
6,003,616 |
9,313,382 |
1,321,351 |
10,634,733 |
Source: Labour Force Survey 2013 (Round 1)
ANNEXED NOTE
1. Technical Notes and Definitions
Sampling frame of LFS 2013 Round 1: Population Census 2010.
Sample size: 33500 households
Reference period: January 13th-February 5th, 2013
Population of reference: all individuals (nationals and non-nationals) residing in the Kingdom during the period of reference.
The ultimate sampling unit is the household.
(a) Household and household members: A person or group of persons, related or not related, who share housing and food.
Servants, drivers and similar categories are considered to be part of the household if they live in the same housing unit.
(b) Employed person: A person aged 15 years and above who worked during the reference week for at least one hour for pay or profit, or who had a job but were temporarily absent from work.
Employment refers to people who during the reference period:
– worked for one hour or more for wage or salary, in cash or in kind
– worked for one hour or more for profit or family gain, in cash or in kind
– worked for at least 15 hours without pay on a family business or farm
– did volunteer work
Reference period for employment: The seven days preceding the interview date.
2. Institution which provides data
Central Department of Statistics and Information (CDSI), Ministry and Economy and Planning
3. Data availability
Surveys conducted since 1999 are available on the website of the CDSI (http://www.cdsi.gov.sa/), in published form in PDF format. A selection of tables is also available in PDF or Excel format.
The technical notes and tables of contents are in Arabic and the tables are in both languages.
https://www.stats.gov.sa/en/814
https://www.stats.gov.sa/ar/814
Date of access: September 2013.
Since 2007, Statistical Yearbooks have introduced a section on “Labour Statistics”, which presents a selection of tables from Manpower Surveys.
https://www.stats.gov.sa/en/46
Date of access: May 2013.
| |
Saudis |
Non-Saudis |
|
TOTAL |
|
Male |
Female |
Total |
Male |
Female |
Total |
Male |
Female |
Total |
| 19-15 |
19,767 |
967 |
20,734 |
28,231 |
5,195 |
33,426 |
47,998 |
6,162 |
54,160 |
| 24-20 |
294,494 |
45,736 |
340,230 |
189,022 |
41,003 |
230,025 |
483,516 |
86,739 |
570,255 |
| 29-25 |
723,933 |
123,774 |
847,707 |
477,135 |
82,567 |
559,702 |
1,201,068 |
206,341 |
1,407,409 |
| 34-30 |
724,692 |
164,830 |
889,522 |
971,422 |
148,496 |
1,119,918 |
1,696,114 |
313,326 |
2,009,440 |
| 39-35 |
637,777 |
154,522 |
792,299 |
1,205,179 |
193,646 |
1,398,825 |
1,842,956 |
348,168 |
2,191,124 |
| 44-40 |
520,374 |
95,933 |
616,307 |
956,063 |
118,283 |
1,074,346 |
1,476,437 |
214,216 |
1,690,653 |
| 49-45 |
415,606 |
58,908 |
474,514 |
702,225 |
29,302 |
731,527 |
1,117,831 |
88,210 |
1,206,041 |
| 54-50 |
273,190 |
21,878 |
295,068 |
436,938 |
11,772 |
448,710 |
710,128 |
33,650 |
743,778 |
| 59-55 |
167,203 |
8,471 |
175,674 |
248,475 |
7,051 |
255,526 |
415,678 |
15,522 |
431,200 |
| 64-60 |
75,826 |
2,777 |
78,603 |
108,736 |
3,877 |
112,613 |
184,562 |
6,654 |
191,216 |
| 65+ |
98,393 |
2,066 |
100,459 |
38,701 |
297 |
38,998 |
137,094 |
2,363 |
139,457 |
| Total |
3,951,255 |
679,862 |
4,631,117 |
5,362,127 |
641,489 |
6,003,616 |
9,313,382 |
1,321,351 |
10,634,733 |
source: Labour Force Survey 2013 (Round 1)
ANNEXED NOTE
1. Technical Notes and Definitions
Sampling frame of LFS 2013 Round 1: Population Census 2010.
Sample size: 33500 households
Reference period: January 13th-February 5th, 2013
Population of reference: all individuals (nationals and non-nationals) residing in the Kingdom during the period of reference.
The ultimate sampling unit is the household.
(a) Household and household members: A person or group of persons, related or not related, who share housing and food.
Servants, drivers and similar categories are considered to be part of the household if they live in the same housing unit.
(b) Employed person: A person aged 15 years and above who worked during the reference week for at least one hour for pay or profit, or who had a job but were temporarily absent from work.
Employment refers to people who during the reference period:
– worked for one hour or more for wage or salary, in cash or in kind
– worked for one hour or more for profit or family gain, in cash or in kind
– worked for at least 15 hours without pay on a family business or farm
– did volunteer work
Reference period for employment: The seven days preceding the interview date.
2. Institution which provides data
Central Department of Statistics and Information (CDSI), Ministry and Economy and Planning
3. Data availability
Surveys conducted since 1999 are available on the website of the CDSI (http://www.cdsi.gov.sa/), in published form in PDF format. A selection of tables is also available in PDF or Excel format.
The technical notes and tables of contents are in Arabic and the tables are in both languages.
ENGLISH
ARABIC
Date of access: September 2013.
Since 2007, Statistical Yearbooks have introduced a section on “Labour Statistics”, which presents a selection of tables from Manpower Surveys.
http://www.cdsi.gov.sa/2010-08-08-05-41-26
Date of access: May 2013. http://www.cdsi.gov.sa/english/index.php?option=com_docman&task=cat_view&gid=233&Itemid=162
http://www.cdsi.gov.sa/socandpub/manpower
| Education Status |
|
Saudis |
|
|
Non-Saudis |
|
|
Total |
|
| |
Males |
Females |
Total |
Males |
Females |
Total |
Males |
Females |
Total |
| Illiterate |
68.467 |
5.399 |
73.866 |
167.324 |
28.699 |
196.023 |
235.791 |
34.098 |
269.889 |
| Read and Write |
136.435 |
6.565 |
143.000 |
783.565 |
177.233 |
960.798 |
920.000 |
183.798 |
1.103.798 |
| Primary |
364.047 |
13.362 |
377.409 |
1.028.468 |
149.935 |
1.178.403 |
1.392.515 |
163.297 |
1.555.812 |
| Intermediate |
583.759 |
16.497 |
600.256 |
1.255.532 |
149.513 |
1.405.045 |
1.839.291 |
166.010 |
2.005.301 |
| Secondary or Equivalent |
1.489.174 |
81.976 |
1.571.150 |
901.239 |
31.538 |
932.777 |
2.390.413 |
113.514 |
2.503.927 |
| Diploma |
343.306 |
88.583 |
431.889 |
214.354 |
31.971 |
246.325 |
557.660 |
120.554 |
678.214 |
| Bachelor Degree |
896.687 |
448.844 |
1.345.531 |
897.538 |
58.768 |
956.306 |
1.794.225 |
507.612 |
2.301.837 |
| Master Degree |
47.766 |
12.998 |
60.764 |
68.840 |
7.508 |
76.348 |
116.606 |
20.506 |
137.112 |
| Doctorate |
21.614 |
5.638 |
27.252 |
45.267 |
6.324 |
51.591 |
66.881 |
11.962 |
78.843 |
| Total |
3.951.255 |
679.862 |
4.631.117 |
5.362.127 |
641.489 |
6.003.616 |
9.313.382 |
1.321.351 |
10.634.733 |
Source: Labour Force Survey 2013 (Round 1).
ANNEXED NOTE
1. Technical Notes and Definitions
Sampling frame of LFS 2013 Round 1: Population Census 2010.
Sample size: 33500 households
Reference period: January 13th-February 5th, 2013
Population of reference: all individuals (nationals and non-nationals) residing in the Kingdom during the period of reference.
The ultimate sampling unit is the household.
(a) Household and household members: A person or group of persons, related or not related, who share housing and food.
Servants, drivers and similar categories are considered to be part of the household if they live in the same housing unit.
(b) Employed person: A person aged 15 years and above who worked during the reference week for at least one hour for pay or profit, or who had a job but were temporarily absent from work.
Employment refers to people who during the reference period:
– worked for one hour or more for wage or salary, in cash or in kind
– worked for one hour or more for profit or family gain, in cash or in kind
– worked for at least 15 hours without pay on a family business or farm
– did volunteer work
Reference period for employment: The seven days preceding the interview date.
Classification used for education statuses is ISCED.
2. Institution which provides data
Central Department of Statistics and Information (CDSI), Ministry and Economy and Planning
3. Data availability
Surveys conducted since 1999 are available on the website of the CDSI (http://www.cdsi.gov.sa/), in published form in PDF format. A selection of tables is also available in PDF or Excel format.
https://www.stats.gov.sa/en/814https://www.stats.gov.sa/ar/814
The technical notes and tables of contents are in Arabic and the tables are in both languages.
Date of access: September 2013.
Since 2007, Statistical Yearbooks have introduced a section on “Labour Statistics”, which presents a selection of tables from Manpower Surveys.
https://www.stats.gov.sa/en/46
Date of access: May 2013.
| |
Saudis |
Non-Saudis |
TOTAL |
| |
males |
females |
total |
males |
females |
total |
males |
females |
total |
| Agriculture, hunting, forestry and fishing |
234.428 |
1.975 |
236.403 |
335.152 |
864 |
336.016 |
569.580 |
2.839 |
572.419 |
| Mining and quarrying |
87.280 |
731 |
88.011 |
26.254 |
362 |
26.616 |
113.534 |
1.093 |
114.627 |
| Manufacturing |
145.329 |
7.090 |
152.419 |
481.700 |
2.816 |
484.516 |
627.029 |
9.906 |
636.935 |
| Electricity, gas, steam and air conditioning supply |
56.925 |
106 |
57.031 |
20.503 |
0 |
20.503 |
77.428 |
106 |
77.534 |
| Water supply, sewerage, waste management and remediation act. |
21.448 |
386 |
21.834 |
32.857 |
369 |
33.226 |
54.305 |
755 |
55.060 |
| Construction |
138.765 |
1.420 |
140.185 |
1.583.963 |
7.560 |
1.591.523 |
1.722.728 |
8.980 |
1.731.708 |
| Wholesale and retail trade; repair of motor vehicles…..goods |
234.525 |
11.985 |
246.510 |
1.333.182 |
8.573 |
1.341.755 |
1.567.707 |
20.558 |
1.588.265 |
| Transport and storage |
166.572 |
822 |
167.394 |
149.166 |
1.664 |
150.830 |
315.738 |
2.486 |
318.224 |
| Accommodation and food services activities |
21.622 |
3.678 |
25.300 |
227.236 |
323 |
227.559 |
248.858 |
4.001 |
252.859 |
| Information and communication |
53.108 |
1.253 |
54.361 |
52.201 |
203 |
52.404 |
105.309 |
1.456 |
106.765 |
| Financial and insurance activities |
78.185 |
7.198 |
85.383 |
30.499 |
0 |
30.499 |
108.684 |
7.198 |
115.882 |
| Real estate activities |
54.626 |
266 |
54.892 |
34.707 |
0 |
34.707 |
89.333 |
266 |
89.599 |
| Professional, scientific and technical activities |
16.003 |
2.363 |
18.366 |
80.769 |
460 |
81.229 |
96.772 |
2.823 |
99.595 |
| Administrative and support services activities |
71.295 |
5.708 |
77.003 |
135.756 |
102 |
135.858 |
207.051 |
5.810 |
212.861 |
| Public adm. and defense, compulsory social security |
1.717.132 |
47.725 |
1.764.857 |
30.313 |
1.144 |
31.457 |
1.747.445 |
48.869 |
1.796.314 |
| Education |
584.939 |
505.024 |
1.089.963 |
124.683 |
29.273 |
153.956 |
709.622 |
534.297 |
1.243.919 |
| Human health and social work activities |
217.266 |
75.099 |
292.365 |
145.737 |
68.707 |
214.444 |
363.003 |
143.806 |
506.809 |
| Arts, entertainment and recreation |
3.482 |
301 |
3.783 |
4.670 |
495 |
5.165 |
8.152 |
796 |
8.948 |
| Other service activities |
45.406 |
6.111 |
51.517 |
132.092 |
8.557 |
140.649 |
177.498 |
14.668 |
192.166 |
| Activities of private households as employers and undifferentiated … |
1.170 |
621 |
1.791 |
392.778 |
510.017 |
902.795 |
393.948 |
510.638 |
904.586 |
| Extraterritorial organizations and bodies |
1.749 |
0 |
1.749 |
7.909 |
0 |
7.909 |
9.658 |
0 |
9.658 |
| Total |
3.951.255 |
679.862 |
4.631.117 |
5.362.127 |
641.489 |
6.003.616 |
9.313.382 |
1.321.351 |
10.634.733 |
Source: Manpower Survey, 2013 (Round 1).
ANNEXED NOTE
1. Technical Notes and Definitions
Sampling frame of LFS 2013 Round 1: Population Census 2010.
Sample size: 33500 households
Reference period: January 13th-February 5th, 2013
Population of reference: all individuals (nationals and non-nationals) residing in the Kingdom during the period of reference.
The ultimate sampling unit is the household.
(a) Household and household members: A person or group of persons, related or not related, who share housing and food.
Servants, drivers and similar categories are considered to be part of the household if they live in the same housing unit.
(b) Employed person: A person aged 15 years and above who worked during the reference week for at least one hour for pay or profit, or who had a job but were temporarily absent from work.
Employment refers to people who during the reference period:
– worked for one hour or more for wage or salary, in cash or in kind
– worked for one hour or more for profit or family gain, in cash or in kind
– worked for at least 15 hours without pay on a family business or farm
– did volunteer work
Reference period for employment: The seven days preceding the interview date.
Classification used for economic activity is ISIC Rev. 4
2. Institution which provides data
Central Department of Statistics and Information (CDSI), Ministry and Economy and Planning
3. Data availability
Surveys conducted since 1999 are available on the website of the CDSI (http://www.cdsi.gov.sa/), in published form in PDF format. A selection of tables is also available in PDF or Excel format.
https://www.stats.gov.sa/en/814https://www.stats.gov.sa/ar/814
The technical notes and tables of contents are in Arabic and the tables are in both languages.
Date of access: September 2013.
Since 2007, Statistical Yearbooks have introduced a section on “Labour Statistics”, which presents a selection of tables from Manpower Surveys.
https://www.stats.gov.sa/en/46
Date of access: May 2013.
| |
|
Managers and |
Specialists in scientific, technical |
Technicians in scientific, technical |
Clerical workers |
Sales workers |
Service workers |
Agriculture, animal |
Industrial, chemical |
Engineering support |
TOTAL |
| |
|
business managers |
and humanities fields |
and humanities fields |
husbandry and fishing |
and food industries |
| |
|
males |
females |
total |
males |
females |
total |
males |
females |
total |
males |
females |
total |
males |
females |
total |
males |
females |
total |
males |
females |
total |
males |
females |
total |
males |
females |
total |
males |
females |
total |
| Saudis |
Illiterate |
374 |
0 |
374 |
0 |
0 |
0 |
0 |
0 |
0 |
0 |
0 |
0 |
10.752 |
0 |
10.752 |
11.134 |
4.512 |
15.646 |
39.507 |
887 |
40.394 |
404 |
0 |
404 |
6.296 |
0 |
6.296 |
68.467 |
5.399 |
73.866 |
| Read and Write |
3.189 |
157 |
3.346 |
0 |
0 |
0 |
0 |
0 |
0 |
577 |
257 |
834 |
16.433 |
556 |
16.989 |
38.239 |
5.595 |
43.834 |
56.103 |
0 |
56.103 |
332 |
0 |
332 |
21.562 |
0 |
21.562 |
136.435 |
6.565 |
143.000 |
| Primary |
9.355 |
0 |
9.355 |
0 |
0 |
0 |
353 |
0 |
353 |
31.581 |
1.278 |
32.859 |
30.604 |
1.327 |
31.931 |
160.053 |
9.802 |
169.855 |
63.581 |
72 |
63.653 |
5.027 |
155 |
5.182 |
63.493 |
728 |
64.221 |
364.047 |
13.362 |
377.409 |
| Intermediate |
15.260 |
331 |
15.591 |
0 |
0 |
0 |
0 |
0 |
0 |
85.841 |
6.445 |
92.286 |
47.408 |
960 |
48.368 |
318.700 |
7.163 |
325.863 |
39.615 |
370 |
39.985 |
6.932 |
933 |
7.865 |
70.003 |
295 |
70.298 |
583.759 |
16.497 |
600.256 |
| Secondary or Equivalent |
72.756 |
931 |
73.687 |
2.269 |
65 |
2.334 |
71.981 |
14.487 |
86.468 |
334.783 |
44.618 |
379.401 |
73.361 |
3.740 |
77.101 |
825.346 |
14.046 |
839.392 |
27.045 |
0 |
27.045 |
22.172 |
2.494 |
24.666 |
59.461 |
1.595 |
61.056 |
1.489.174 |
81.976 |
1.571.150 |
| Diploma |
21.750 |
2.589 |
24.339 |
633 |
0 |
633 |
186.056 |
73.616 |
259.672 |
66.231 |
10.767 |
76.998 |
13.428 |
329 |
13.757 |
44.168 |
1.094 |
45.262 |
1.275 |
0 |
1.275 |
2.057 |
188 |
2.245 |
7.708 |
0 |
7.708 |
343.306 |
88.583 |
431.889 |
| Bachelor Degree |
99.328 |
14.479 |
113.807 |
291.870 |
145.270 |
437.140 |
321.788 |
253.019 |
574.807 |
76.284 |
32.394 |
108.678 |
16.101 |
1.160 |
17.261 |
85.473 |
1.863 |
87.336 |
2.527 |
0 |
2.527 |
764 |
659 |
1.423 |
2.552 |
0 |
2.552 |
896.687 |
448.844 |
1.345.531 |
| Master Degree |
12.961 |
1.154 |
14.115 |
22.667 |
7.902 |
30.569 |
4.224 |
2.496 |
6.720 |
2.796 |
1.446 |
4.242 |
985 |
0 |
985 |
4.031 |
0 |
4.031 |
102 |
0 |
102 |
0 |
0 |
0 |
0 |
0 |
0 |
47.766 |
12.998 |
60.764 |
| Doctorate |
5.846 |
422 |
6.268 |
14.255 |
5.216 |
19.471 |
178 |
0 |
178 |
0 |
0 |
0 |
0 |
0 |
0 |
1.335 |
0 |
1.335 |
0 |
0 |
0 |
0 |
0 |
0 |
0 |
0 |
0 |
21.614 |
5.638 |
27.252 |
| Total |
240.819 |
20.063 |
260.882 |
331.694 |
158.453 |
490.147 |
584.580 |
343.618 |
928.198 |
598.093 |
97.205 |
695.298 |
209.072 |
8.072 |
217.144 |
1.488.479 |
44.075 |
1.532.554 |
229.755 |
1.329 |
231.084 |
37.688 |
4.429 |
42.117 |
231.075 |
2.618 |
233.693 |
3.951.255 |
679.862 |
4.631.117 |
| Non-Saudis |
Illiterate |
0 |
0 |
0 |
0 |
0 |
0 |
0 |
0 |
0 |
0 |
0 |
0 |
15.649 |
361 |
16.010 |
31.815 |
27.682 |
59.497 |
31.366 |
216 |
31.582 |
4.782 |
0 |
4.782 |
83.712 |
440 |
84.152 |
167.324 |
28.699 |
196.023 |
| Read and Write |
0 |
0 |
0 |
0 |
0 |
0 |
0 |
0 |
0 |
6.957 |
0 |
6.957 |
67.325 |
0 |
67.325 |
144.659 |
172.895 |
317.554 |
105.885 |
0 |
105.885 |
21.802 |
716 |
22.518 |
436.937 |
3.622 |
440.559 |
783.565 |
177.233 |
960.798 |
| Primary |
385 |
0 |
385 |
0 |
0 |
0 |
0 |
0 |
0 |
6.980 |
0 |
6.980 |
105.299 |
816 |
106.115 |
205.012 |
146.269 |
351.281 |
84.976 |
0 |
84.976 |
48.161 |
879 |
49.040 |
577.655 |
1.971 |
579.626 |
1.028.468 |
149.935 |
1.178.403 |
| Intermediate |
801 |
0 |
801 |
88 |
0 |
88 |
504 |
0 |
504 |
22.416 |
0 |
22.416 |
206.470 |
889 |
207.359 |
236.329 |
141.615 |
377.944 |
51.971 |
429 |
52.400 |
45.397 |
1.441 |
46.838 |
691.556 |
5.139 |
696.695 |
1.255.532 |
149.513 |
1.405.045 |
| Secondary or Equivalent |
14.123 |
0 |
14.123 |
365 |
0 |
365 |
48.968 |
3.354 |
52.322 |
51.879 |
491 |
52.370 |
232.345 |
724 |
233.069 |
111.810 |
25.310 |
137.120 |
33.947 |
176 |
34.123 |
22.799 |
318 |
23.117 |
385.003 |
1.165 |
386.168 |
901.239 |
31.538 |
932.777 |
| Diploma |
8.661 |
0 |
8.661 |
2.349 |
0 |
2.349 |
100.051 |
26.474 |
126.525 |
9.507 |
1.511 |
11.018 |
32.574 |
0 |
32.574 |
7.001 |
3.502 |
10.503 |
2.207 |
0 |
2.207 |
4.987 |
189 |
5.176 |
47.017 |
295 |
47.312 |
214.354 |
31.971 |
246.325 |
| Bachelor Degree |
92.861 |
215 |
93.076 |
540.847 |
29.432 |
570.279 |
67.717 |
21.415 |
89.132 |
35.675 |
1.796 |
37.471 |
98.868 |
1.196 |
100.064 |
18.487 |
2.880 |
21.367 |
4.227 |
0 |
4.227 |
3.042 |
622 |
3.664 |
35.814 |
1.212 |
37.026 |
897.538 |
58.768 |
956.306 |
| Master Degree |
10.978 |
293 |
11.271 |
50.532 |
6.805 |
57.337 |
2.840 |
410 |
3.250 |
1.146 |
0 |
1.146 |
2.341 |
0 |
2.341 |
839 |
0 |
839 |
0 |
0 |
0 |
0 |
0 |
0 |
164 |
0 |
164 |
68.840 |
7.508 |
76.348 |
| Doctorate |
1.613 |
0 |
1.613 |
43.182 |
6.212 |
49.394 |
472 |
112 |
584 |
0 |
0 |
0 |
0 |
0 |
0 |
0 |
0 |
0 |
0 |
0 |
0 |
0 |
0 |
0 |
0 |
0 |
0 |
45.267 |
6.324 |
51.591 |
| Total |
129.422 |
508 |
129.930 |
637.363 |
42.449 |
679.812 |
220.552 |
51.765 |
272.317 |
134.560 |
3.798 |
138.358 |
760.871 |
3.986 |
764.857 |
755.952 |
520.153 |
1.276.105 |
314.579 |
821 |
315.400 |
150.970 |
4.165 |
155.135 |
2.257.858 |
13.844 |
2.271.702 |
5.362.127 |
641.489 |
6.003.616 |
| Total |
Illiterate |
374 |
0 |
374 |
0 |
0 |
0 |
0 |
0 |
0 |
0 |
0 |
0 |
26.401 |
361 |
26.762 |
42.949 |
32.194 |
75.143 |
70.873 |
1.103 |
71.976 |
5.186 |
0 |
5.186 |
90.008 |
440 |
90.448 |
235.791 |
34.098 |
269.889 |
| Read and Write |
3.189 |
157 |
3.346 |
0 |
0 |
0 |
0 |
0 |
0 |
7.534 |
257 |
7.791 |
83.758 |
556 |
84.314 |
182.898 |
178.490 |
361.388 |
161.988 |
0 |
161.988 |
22.134 |
716 |
22.850 |
458.499 |
3.622 |
462.121 |
920.000 |
183.798 |
1.103.798 |
| Primary |
9.740 |
0 |
9.740 |
0 |
0 |
0 |
353 |
0 |
353 |
38.561 |
1.278 |
39.839 |
135.903 |
2.143 |
138.046 |
365.065 |
156.071 |
521.136 |
148.557 |
72 |
148.629 |
53.188 |
1.034 |
54.222 |
641.148 |
2.699 |
643.847 |
1.392.515 |
163.297 |
1.555.812 |
| Intermediate |
16.061 |
331 |
16.392 |
88 |
0 |
88 |
504 |
0 |
504 |
108.257 |
6.445 |
114.702 |
253.878 |
1.849 |
255.727 |
555.029 |
148.778 |
703.807 |
91.586 |
799 |
92.385 |
52.329 |
2.374 |
54.703 |
761.559 |
5.434 |
766.993 |
1.839.291 |
166.010 |
2.005.301 |
| Secondary or Equivalent |
86.879 |
931 |
87.810 |
2.634 |
65 |
2.699 |
120.949 |
17.841 |
138.790 |
386.662 |
45.109 |
431.771 |
305.706 |
4.464 |
310.170 |
937.156 |
39.356 |
976.512 |
60.992 |
176 |
61.168 |
44.971 |
2.812 |
47.783 |
444.464 |
2.760 |
447.224 |
2.390.413 |
113.514 |
2.503.927 |
| Diploma |
30.411 |
2.589 |
33.000 |
2.982 |
0 |
2.982 |
286.107 |
100.090 |
386.197 |
75.738 |
12.278 |
88.016 |
46.002 |
329 |
46.331 |
51.169 |
4.596 |
55.765 |
3.482 |
0 |
3.482 |
7.044 |
377 |
7.421 |
54.725 |
295 |
55.020 |
557.660 |
120.554 |
678.214 |
| Bachelor Degree |
192.189 |
14.694 |
206.883 |
832.717 |
174.702 |
1.007.419 |
389.505 |
274.434 |
663.939 |
111.959 |
34.190 |
146.149 |
114.969 |
2.356 |
117.325 |
103.960 |
4.743 |
108.703 |
6.754 |
0 |
6.754 |
3.806 |
1.281 |
5.087 |
38.366 |
1.212 |
39.578 |
1.794.225 |
507.612 |
2.301.837 |
| Master Degree |
23.939 |
1.447 |
25.386 |
73.199 |
14.707 |
87.906 |
7.064 |
2.906 |
9.970 |
3.942 |
1.446 |
5.388 |
3.326 |
0 |
3.326 |
4.870 |
0 |
4.870 |
102 |
0 |
102 |
0 |
0 |
0 |
164 |
0 |
164 |
116.606 |
20.506 |
137.112 |
| Doctorate |
7.459 |
422 |
7.881 |
57.437 |
11.428 |
68.865 |
650 |
112 |
762 |
0 |
0 |
0 |
0 |
0 |
0 |
1.335 |
0 |
1.335 |
0 |
0 |
0 |
0 |
0 |
0 |
0 |
0 |
0 |
66.881 |
11.962 |
78.843 |
| Total |
370.241 |
20.571 |
390.812 |
969.057 |
200.902 |
1.169.959 |
805.132 |
395.383 |
1.200.515 |
732.653 |
101.003 |
833.656 |
969.943 |
12.058 |
982.001 |
2.244.431 |
564.228 |
2.808.659 |
544.334 |
2.150 |
546.484 |
188.658 |
8.594 |
197.252 |
2.488.933 |
16.462 |
2.505.395 |
9.313.382 |
1.321.351 |
10.634.733 |
source: Labour Force Survey 2013 (Round 1).
ANNEXED NOTE
1. Technical Notes and Definitions
Sampling frame of LFS 2013 Round 1: Population Census 2010.
Sample size: 33500 households
Reference period: January 13th-February 5th, 2013
Population of reference: all individuals (nationals and non-nationals) residing in the Kingdom during the period of reference.
The ultimate sampling unit is the household.
(a) Household and household members: A person or group of persons, related or not related, who share housing and food.
Servants, drivers and similar categories are considered to be part of the household if they live in the same housing unit.
(b) Employed person: A person aged 15 years and above who worked during the reference week for at least one hour for pay or profit, or who had a job but were temporarily absent from work.
Employment refers to people who during the reference period:
– worked for one hour or more for wage or salary, in cash or in kind
– worked for one hour or more for profit or family gain, in cash or in kind
– worked for at least 15 hours without pay on a family business or farm
– did volunteer work
Reference period for employment: The seven days preceding the interview date.
Classification used for occupations is adapted from ISCO 1988.
Classification used for education levels is ISCED.
2. Institution which provides data
Central Department of Statistics and Information (CDSI), Ministry and Economy and Planning
3. Data availability
Surveys conducted since 1999 are available on the website of the CDSI (http://www.cdsi.gov.sa/), in published form in PDF format. A selection of tables is also available in PDF or Excel format.
https://www.stats.gov.sa/en/814https://www.stats.gov.sa/ar/814
The technical notes and tables of contents are in Arabic and the tables are in both languages.
Date of access: September 2013.
Since 2007, Statistical Yearbooks have introduced a section on “Labour Statistics”, which presents a selection of tables from Manpower Surveys.
https://www.stats.gov.sa/en/46
Date of access: May 2013.
| |
|
|
Specialists in Scientific, |
Technicians in Scientific, |
|
|
|
Agriculture, |
Industrial, |
|
|
| |
sex |
Managers and |
Technical and |
Technical and |
Clerical Workers |
Sales |
Service |
Animal Husbandry |
Chemical |
Engineering |
TOTAL |
| |
|
Business Managers |
Humanities Fields |
Humanities Fields |
|
Workers |
Workers |
and Fishing |
and Food Industries |
Support |
|
| Saudis |
males |
240.819 |
331.694 |
584.580 |
598.093 |
209.072 |
1.488.479 |
229.755 |
37.688 |
231.075 |
3.951.255 |
| females |
20.063 |
158.453 |
343.618 |
97.205 |
8.072 |
44.075 |
1.329 |
4.429 |
2.618 |
679.862 |
| total |
260.882 |
490.147 |
928.198 |
695.298 |
217.144 |
1.532.554 |
231.084 |
42.117 |
233.693 |
4.631.117 |
| Non-Saudis |
males |
129.422 |
637.363 |
220.552 |
134.560 |
760.871 |
755.952 |
314.579 |
150.970 |
2.257.858 |
5.362.127 |
| females |
508 |
42.449 |
51.765 |
3.798 |
3.986 |
520.153 |
821 |
4.165 |
13.844 |
641.489 |
| total |
129.930 |
679.812 |
272.317 |
138.358 |
764.857 |
1.276.105 |
315.400 |
155.135 |
2.271.702 |
6.003.616 |
| Total |
males |
370.241 |
969.057 |
805.132 |
732.653 |
969.943 |
2.244.431 |
544.334 |
188.658 |
2.488.933 |
9.313.382 |
| females |
20.571 |
200.902 |
395.383 |
101.003 |
12.058 |
564.228 |
2.150 |
8.594 |
16.462 |
1.321.351 |
| total |
390.812 |
1.169.959 |
1.200.515 |
833.656 |
982.001 |
2.808.659 |
546.484 |
197.252 |
2.505.395 |
10.634.733 |
source: Labour Force Survey 2013 (Round 1).
ANNEXED NOTE
1. Technical Notes and Definitions
Sampling frame of LFS 2013 Round 1: Population Census 2010.
Sample size: 33500 households
Reference period: January 13th-February 5th, 2013
Population of reference: all individuals (nationals and non-nationals) residing in the Kingdom during the period of reference.
The ultimate sampling unit is the household.
(a) Household and household members: A person or group of persons, related or not related, who share housing and food.
Servants, drivers and similar categories are considered to be part of the household if they live in the same housing unit.
(b) Employed person: A person aged 15 years and above who worked during the reference week for at least one hour for pay or profit, or who had a job but were temporarily absent from work.
Employment refers to people who during the reference period:
– worked for one hour or more for wage or salary, in cash or in kind
– worked for one hour or more for profit or family gain, in cash or in kind
– worked for at least 15 hours without pay on a family business or farm
– did volunteer work
Reference period for employment: The seven days preceding the interview date.
Classification used for occupations is adapted from ISCO 1988.
2. Institution which provides data
Central Department of Statistics and Information (CDSI), Ministry and Economy and Planning
3. Data availability
Surveys conducted since 1999 are available on the website of the CDSI (http://www.cdsi.gov.sa/), in published form in PDF format. A selection of tables is also available in PDF or Excel format.
https://www.stats.gov.sa/en/814https://www.stats.gov.sa/ar/814
The technical notes and tables of contents are in Arabic and the tables are in both languages.
Date of access: September 2013.
Since 2007, Statistical Yearbooks have introduced a section on “Labour Statistics”, which presents a selection of tables from Manpower Surveys.
https://www.stats.gov.sa/en/46
Date of access: May 2013.
| Activity status |
|
In the Labour Force |
|
|
Out of the Labour Force |
|
|
Total |
|
| |
Male |
Female |
Total |
Male |
Female |
Total |
Male |
Female |
Total |
| Saudis |
4.042.461 |
1.038.638 |
5.081.099 |
1.976.527 |
4.880.670 |
6.857.197 |
6.018.988 |
5.919.308 |
11.938.296 |
| Non-Saudis |
5.226.875 |
648.097 |
5.874.972 |
294.779 |
1.282.002 |
1.576.781 |
5.521.654 |
1.930.099 |
7.451.753 |
| Total |
9.269.336 |
1.686.735 |
10.956.071 |
2.271.306 |
6.162.672 |
8.433.978 |
11.540.642 |
7.849.407 |
19.390.049 |
source: Labour Force Survey 2013 (Round 1).
ANNEXED NOTE
1. Technical Notes and Definitions
Sampling frame of LFS 2013 Round 1: Population Census 2010.
Sample size: 33500 households
Reference period: January 13th-February 5th, 2013
Population of reference: all individuals (nationals and non-nationals) residing in the Kingdom during the period of reference.
The ultimate sampling unit is the household.
(a) Working age population: the population aged 15 to 60 (retirement age for Saudis), even though (as of mid-2013) there is no maximum working age on foreign nationals.
(b) Person in the labour force: a person aged 15 years and over, employed or unemployed. Here, concerned population is aged 15 to 60 years.
(c) Person out of the labour force: A person aged 15 years and over who is not included in the labour force, among which: the persons staying home for domestics activities, the students, the retired, the self sufficients,
the ones unable to enrol in labour, who are not working and do not look for employment for any other reason. Here, concerned population is aged 15 to 60 years.
2. Institution which provides data
Central Department of Statistics and Information (CDSI), Ministry and Economy and Planning
3. Data availability
Surveys conducted since 1999 are available on the website of the CDSI http://www.cdsi.gov.sab/), in published form in PDF format. A selection of tables is also available in PDF or Excel format.
https://www.stats.gov.sa/en/814https://www.stats.gov.sa/ar/814
The technical notes and tables of contents are in Arabic and the tables are in both languages.
Date of access: September 2013.
Since 2007, Statistical Yearbooks have introduced a section on “Labour Statistics”, which presents a selection of tables from Manpower Surveys.
https://www.stats.gov.sa/en/46
Date of access: May 2013.
| year |
|
|
|
|
2013 |
|
|
|
|
| Citizenship |
|
Saudis |
|
|
Non-Saudis |
|
|
TOTAL |
|
| Age Groups |
Males |
Females |
Total |
Males |
Females |
Total |
Males |
Females |
Total |
| 15 – 19 |
1.062.242 |
1.029.893 |
2.092.135 |
234.597 |
185.946 |
420.543 |
1.296.839 |
1.215.839 |
2.512.678 |
| 20 – 24 |
992.886 |
977.074 |
1.969.960 |
243.746 |
166.500 |
410.246 |
1.236.632 |
1.143.574 |
2.380.206 |
| 25 – 29 |
889.545 |
882.469 |
1.772.014 |
490.221 |
234.040 |
724.261 |
1.379.766 |
1.116.509 |
2.496.275 |
| 30 – 34 |
780.116 |
770.253 |
1.550.369 |
978.772 |
369.661 |
1.348.433 |
1.758.888 |
1.139.914 |
2.898.802 |
| 35 – 39 |
666.963 |
658.879 |
1.325.842 |
1.209.446 |
443.723 |
1.653.169 |
1.876.409 |
1.102.602 |
2.979.011 |
| 40 – 44 |
547.506 |
547.066 |
1.094.572 |
959.593 |
306.500 |
1.266.093 |
1.507.099 |
853.566 |
2.360.665 |
| 45 – 49 |
451.189 |
443.700 |
894.889 |
706.608 |
117.178 |
823.786 |
1.157.797 |
560.878 |
1.718.675 |
| 50 – 54 |
356.681 |
344.855 |
701.536 |
443.535 |
63.309 |
506.844 |
800.216 |
408.164 |
1.208.380 |
| 55 – 59 |
271.860 |
265.119 |
536.979 |
255.136 |
43.242 |
298.378 |
526.996 |
308.361 |
835.357 |
| Total |
6.018.988 |
5.919.308 |
11.938.296 |
5.521.654 |
1.930.099 |
7.451.753 |
11.540.642 |
7.849.407 |
19.390.049 |
source: Labour Force Survey 2013 (Round 1).
ANNEXED NOTE
1. Technical Notes and Definitions
Sampling frame of LFS 2013 Round 1: Population Census 2010 (final results not released as of September 2013).
Sample size: 33500 households
Reference period: January 13th-February 5th, 2013
Population of reference: all individuals (nationals and non-nationals) residing in the Kingdom during the period of reference.
The ultimate sampling unit is the household.
Working age population: the population aged 15 to 60 (retirement age for Saudis), even though (as of mid-2013) there is no maximum working age on foreign nationals.
2. Institution which provides data
Central Department of Statistics and Information (CDSI), Ministry and Economy and Planning
3. Data availability
Surveys conducted since 1999 are available on the website of the CDSI (http://www.cdsi.gov.sa/), in published form in PDF format. A selection of tables is also available in PDF or Excel format.
https://www.stats.gov.sa/en/814https://www.stats.gov.sa/ar/814
The technical notes and tables of contents are in Arabic and the tables are in both languages.
Date of access: September 2013.
Since 2007, Statistical Yearbooks have introduced a section on “Labour Statistics”, which presents a selection of tables from Manpower Surveys.
https://www.stats.gov.sa/en/46
Date of access: May 2013.
| Country of citizenship |
Saudi spouse |
Non-Saudi spouse |
Total |
| Saudi spouse |
Non-Saudi groom |
Non-Saudi bride |
The qadî (judge) represents the female’s guardian* |
Non-Saudi spouse |
| of spouse |
Non-Saudi bride |
Saudi bride |
| Saudi Arabia |
142.132 |
|
|
|
|
|
142.132 |
| UAE |
|
112 |
6 |
0 |
0 |
38 |
156 |
| Kuwait |
|
375 |
25 |
2 |
1 |
18 |
421 |
| Bahrain |
|
20 |
8 |
0 |
0 |
15 |
43 |
| Oman |
|
11 |
3 |
0 |
0 |
5 |
19 |
| Qatar |
|
307 |
13 |
0 |
0 |
4 |
324 |
| Egypt |
|
62 |
111 |
1 |
0 |
516 |
690 |
| Sudan |
|
12 |
23 |
0 |
0 |
241 |
276 |
| Palestine |
|
65 |
133 |
1 |
0 |
776 |
975 |
| Yemen |
|
544 |
1.182 |
12 |
2 |
3.582 |
5.322 |
| Jordan |
|
53 |
88 |
1 |
0 |
504 |
646 |
| Lebanon |
|
10 |
16 |
1 |
0 |
66 |
93 |
| Syria |
|
120 |
199 |
3 |
1 |
1.164 |
1.487 |
| Iraq |
|
9 |
23 |
0 |
0 |
12 |
44 |
| Morocco |
|
6 |
77 |
3 |
0 |
57 |
143 |
| Algeria |
|
2 |
2 |
0 |
0 |
5 |
9 |
| Tunisia |
|
2 |
3 |
0 |
0 |
5 |
10 |
| Mauritania |
|
6 |
19 |
0 |
0 |
63 |
88 |
| Djibouti |
|
0 |
3 |
0 |
0 |
15 |
18 |
| India |
|
7 |
9 |
8 |
0 |
264 |
288 |
| Sri Lanka |
|
0 |
0 |
6 |
0 |
12 |
18 |
| Philippines |
|
1 |
9 |
218 |
11 |
222 |
461 |
| Thailand |
|
3 |
4 |
0 |
0 |
43 |
50 |
| Bangladesh |
|
17 |
27 |
2 |
0 |
457 |
503 |
| Turkey |
|
3 |
11 |
3 |
1 |
43 |
61 |
| Afghanistan |
|
17 |
55 |
3 |
0 |
631 |
706 |
| Indonesia |
|
3 |
23 |
2 |
0 |
51 |
79 |
| Malaysia |
|
0 |
0 |
0 |
0 |
4 |
4 |
| Burma |
|
15 |
23 |
2 |
0 |
1.368 |
1.408 |
| Turkestan |
|
13 |
4 |
0 |
0 |
29 |
46 |
| Pakistan |
|
72 |
135 |
6 |
0 |
1.560 |
1.773 |
| Mali |
|
12 |
12 |
0 |
0 |
105 |
129 |
| Erythrea |
|
3 |
3 |
4 |
1 |
244 |
255 |
| Ethiopia |
|
2 |
14 |
8 |
0 |
146 |
170 |
| Kenya |
|
0 |
0 |
1 |
0 |
7 |
8 |
| Nigeria |
|
28 |
47 |
0 |
0 |
249 |
324 |
| Burkina Faso |
|
2 |
0 |
0 |
0 |
3 |
5 |
| Chad |
|
3 |
5 |
1 |
0 |
93 |
102 |
| Europe |
|
1 |
2 |
0 |
0 |
17 |
20 |
| U.K. |
|
3 |
4 |
1 |
0 |
39 |
47 |
| USA |
|
5 |
6 |
7 |
0 |
35 |
53 |
| Others |
|
149 |
256 |
4 |
47 |
409 |
865 |
| Total |
142.132 |
2.075 |
2.583 |
300 |
64 |
13.117 |
160.271 |
Source: Ministry of Justice
ANNEXED NOTE
1. Definition
In an Islamic marriage, the formal consent of the bride’s male guardian in mandatory.
In the absence of the guardian, the judge (qâdi) takes responsibility.
2. Institution which provides data
Ministry of Justice (MoJ)
3. Data availability
As of mid-2013, MoJ has issued 37 Annual statistical abstracts.
Years 1431, 1432 and 1433 (H) (circa 2010; 2011; 2012 (AD)) are available online in PdF format and can be downloaded from:
https://www.moj.gov.sa/
date of access: September 2013
| marital status |
|
house keeping |
student/ in training |
retired/ elderly |
does not want to work |
disability/ health reasons |
Others |
Total |
| |
m. |
0 |
1,575,205 |
4,487 |
8,249 |
51,597 |
66,866 |
1,706,404 |
| never married |
f. |
351,979 |
1,371,033 |
1,205 |
4,163 |
25,255 |
37,846 |
1,791,481 |
| |
total |
351,979 |
2,946,238 |
5,692 |
12,412 |
76,852 |
104,712 |
3,497,885 |
| |
m. |
0 |
20,103 |
529,938 |
5,570 |
37,450 |
16,547 |
609,608 |
| married |
f. |
2,971,677 |
87,662 |
32,386 |
3,439 |
8,019 |
34,120 |
3,137,303 |
| |
total |
2,971,677 |
107,765 |
562,324 |
9,009 |
45,469 |
50,667 |
3,746,911 |
| |
m. |
0 |
600 |
5,365 |
405 |
2,848 |
622 |
9,840 |
| divorced |
f. |
79,292 |
5,348 |
3,245 |
409 |
2,558 |
4,551 |
95,403 |
| |
total |
79,292 |
5,948 |
8,610 |
814 |
5,406 |
5,173 |
105,243 |
| |
m |
0 |
26 |
22,764 |
614 |
3,207 |
0 |
26,611 |
| widower |
f. |
358,754 |
143 |
24,049 |
786 |
17,349 |
407 |
401,488 |
| |
total |
358,754 |
169 |
46,813 |
1,400 |
20,556 |
407 |
428,099 |
| |
m |
0 |
1,595,934 |
562,554 |
14,838 |
95,102 |
84,035 |
2,352,463 |
| total |
f |
3,761,702 |
1,464,186 |
60,885 |
8,797 |
53,181 |
76,924 |
5,425,675 |
| |
total |
3,761,702 |
3,060,120 |
623,439 |
23,635 |
148,283 |
160,959 |
7,778,138 |
| |
m. |
0 |
250,671 |
0 |
2,262 |
3,012 |
10,804 |
266,749 |
| never married |
f. |
67,774 |
186,477 |
0 |
684 |
3,153 |
3,218 |
261,306 |
| |
total |
67,774 |
437,148 |
0 |
2,946 |
6,165 |
14,022 |
528,055 |
| |
m. |
0 |
3,037 |
28,506 |
6,144 |
15,563 |
14,036 |
67,286 |
| married |
f. |
1,005,473 |
4,863 |
21 |
2,174 |
331 |
4,250 |
1,017,112 |
| |
total |
1,005,473 |
7,900 |
28,527 |
8,318 |
15,894 |
18,286 |
1,084,398 |
| |
m. |
0 |
0 |
0 |
0 |
894 |
0 |
894 |
| divorced |
f. |
10,529 |
0 |
326 |
237 |
0 |
577 |
11,669 |
| |
total |
10,529 |
0 |
326 |
237 |
894 |
577 |
12,563 |
| |
m |
0 |
0 |
2,712 |
0 |
1,678 |
0 |
4,390 |
| widower |
f. |
41,341 |
0 |
2,771 |
0 |
1,983 |
234 |
46,329 |
| |
total |
41,341 |
0 |
5,483 |
0 |
3,661 |
234 |
50,719 |
| |
m |
0 |
253,708 |
31,218 |
8,406 |
21,147 |
24,840 |
339,319 |
| total |
f. |
1,125,117 |
191,340 |
3,118 |
3,095 |
5,467 |
8,279 |
1,336,416 |
| |
total |
1,125,117 |
445,048 |
34,336 |
11,501 |
26,614 |
33,119 |
1,675,735 |
| |
m. |
0 |
1,825,876 |
4,487 |
10,511 |
54,609 |
77,670 |
1,973,153 |
| never married |
f. |
419,753 |
1,557,510 |
1,205 |
4,847 |
28,408 |
41,064 |
2,052,787 |
| |
total |
419,753 |
3,383,386 |
5,692 |
15,358 |
83,017 |
118,734 |
4,025,940 |
| |
m. |
0 |
23,140 |
558,444 |
11,714 |
53,013 |
30,583 |
676,894 |
| married |
f. |
3,977,150 |
92,525 |
32,407 |
5,613 |
8,350 |
38,370 |
4,154,415 |
| |
total |
3,977,150 |
115,665 |
590,851 |
17,327 |
61,363 |
68,953 |
4,831,309 |
| |
m. |
0 |
600 |
5,365 |
405 |
3,742 |
622 |
10,734 |
| divorced |
f. |
89,821 |
5,348 |
3,571 |
646 |
2,558 |
5,128 |
107,072 |
| |
total |
89,821 |
5,948 |
8,936 |
1,051 |
6,300 |
5,750 |
117,806 |
| |
m |
0 |
26 |
25,476 |
614 |
4,885 |
0 |
31,001 |
| widower |
f. |
400,095 |
143 |
26,820 |
786 |
19,332 |
641 |
447,817 |
| |
total |
400,095 |
169 |
52,296 |
1,400 |
24,217 |
641 |
478,818 |
| |
m |
0 |
1,849,642 |
593,772 |
23,244 |
116,249 |
108,875 |
2,691,782 |
| total |
f. |
4,886,819 |
1,655,526 |
64,003 |
11,892 |
58,648 |
85,203 |
6,762,091 |
| |
total |
4,886,819 |
3,505,168 |
657,775 |
35,136 |
174,897 |
194,078 |
9,453,873 |
source: Labour Force Survey 2013 (Round 1).
ANNEXED NOTE
1. Technical Notes and Definitions
Sampling frame of LFS 2013 Round 1: Population Census 2010.
Sample size: 33500 households
Reference period: January 13th-February 5th, 2013
Population of reference: all individuals (nationals and non-nationals) residing in the Kingdom during the period of reference.
The ultimate sampling unit is the household.
(a) Household and household members: A person or group of persons, related or not related, who share housing and food.
Servants, drivers and similar categories are considered to be part of the household if they live in the same housing unit.
(b) Person out of the labour force: A person aged 15 years and over who is not included in the labour force, among which: the persons staying home for domestics activities, the students, the retired, the self sufficients,
the ones unable to enrol in labour, who are not working and do not look for employment for any other reason.
2. Institution which provides data
Central Department of Statistics and Information (CDSI), Ministry and Economy and Planning
3. Data availability
Surveys conducted since 1999 are available on the website of the CDSI (https://www.stats.gov.sa/en), in published form in PDF format. A selection of tables is also available in PDF or Excel format.
https://www.stats.gov.sa/en/814 (website English version) or https://www.stats.gov.sa/ar/814 (website Arabic version). The technical notes and tables of contents are in Arabic and the tables are in both languages.
Date of access:September 2013.
| Activity status |
|
In the Labour Force |
|
|
Out of the Labour Force |
|
|
Total |
|
| |
Male |
Female |
Total |
Male |
Female |
Total |
Male |
Female |
Total |
| Saudis |
4.216.680 |
1.043.481 |
5.260.161 |
2.352.463 |
5.425.675 |
7.778.138 |
6.569.143 |
6.469.156 |
13.038.299 |
| Non-Saudis |
5.374.312 |
652.271 |
6.026.583 |
339.319 |
1.336.416 |
1.675.735 |
5.713.631 |
1.988.687 |
7.702.318 |
| Total |
9.590.992 |
1.695.752 |
11.286.744 |
2.691.782 |
6.762.091 |
9.453.873 |
12.282.774 |
8.457.843 |
20.740.617 |
source: Labour Force Survey 2013 (Round 1).
ANNEXED NOTE
1. Technical Notes and Definitions
Sampling frame of LFS 2013 Round 1: Population Census 2010.
Sample size: 33500 households
Reference period: January 13th-February 5th, 2013
Population of reference: all individuals (nationals and non-nationals) residing in the Kingdom during the period of reference.
The ultimate sampling unit is the household.
(a) Person in the labour force: a person aged 15 years and over, employed or unemployed.
(b) Person out of the labour force: A person aged 15 years and over who is not included in the labour force, among which: the persons staying home for domestics activities, the students, the retired, the self sufficients,
the ones unable to enrol in labour, who are not working and do not look for employment for any other reason.
2. Institution which provides data
Central Department of Statistics and Information (CDSI), Ministry and Economy and Planning
3. Data availability
Surveys conducted since 1999 are available on the website of the CDSI (http://www.cdsi.gov.sa/), in published form in PDF format. A selection of tables is also available in PDF or Excel format.
https://www.stats.gov.sa/en/814https://www.stats.gov.sa/ar/814The technical notes and tables of contents are in Arabic and the tables are in both languages.
Date of access: September 2013.
Since 2007, Statistical Yearbooks have introduced a section on “Labour Statistics”, which presents a selection of tables from Manpower Surveys.
https://www.stats.gov.sa/en/46
Date of access: May 2013.
| Education Status |
|
Saudis |
|
|
Non-Saudis |
|
|
Total |
|
| |
Males |
Females |
Total |
Males |
Females |
Total |
Males |
Females |
Total |
| Illiterate |
178.250 |
614.959 |
793.209 |
179.690 |
88.140 |
267.830 |
357.940 |
703.099 |
1.061.039 |
| Read and Write |
267.222 |
635.424 |
902.646 |
804.275 |
309.696 |
1.113.971 |
1.071.497 |
945.120 |
2.016.617 |
| Primary |
723.340 |
806.057 |
1.529.397 |
1.076.547 |
291.389 |
1.367.936 |
1.799.887 |
1.097.446 |
2.897.333 |
| Intermediate |
1.434.302 |
1.278.496 |
2.712.798 |
1.401.010 |
445.512 |
1.846.522 |
2.835.312 |
1.724.008 |
4.559.320 |
| Secondary or Equivalent |
2.464.034 |
1.905.374 |
4.369.408 |
997.094 |
399.293 |
1.396.387 |
3.461.128 |
2.304.667 |
5.765.795 |
| Diploma |
420.086 |
159.068 |
579.154 |
219.565 |
81.050 |
300.615 |
639.651 |
240.118 |
879.769 |
| Bachelor Degree |
1.002.537 |
1.043.432 |
2.045.969 |
918.178 |
348.925 |
1.267.103 |
1.920.715 |
1.392.357 |
3.313.072 |
| Master Degree |
55.675 |
19.901 |
75.576 |
70.186 |
16.432 |
86.618 |
125.861 |
36.333 |
162.194 |
| Doctorate |
23.697 |
6.445 |
30.142 |
47.086 |
8.250 |
55.336 |
70.783 |
14.695 |
85.478 |
| Total |
6.569.143 |
6.469.156 |
13.038.299 |
5.713.631 |
1.988.687 |
7.702.318 |
12.282.774 |
8.457.843 |
20.740.617 |
source: Labour Force Survey 2013 (Round 1).
ANNEXED NOTE
1. Technical Notes and Definitions
Sampling frame of LFS 2013 Round 1: Population Census 2010.
Sample size: 33500 households
Reference period: January 13th-February 5th, 2013
Population of reference: all individuals (nationals and non-nationals) residing in the Kingdom during the period of reference.
The ultimate sampling unit is the household.
Classification used for education statuses is ISCED.
2. Institution which provides data
Central Department of Statistics and Information (CDSI), Ministry and Economy and Planning
3. Data availability
Surveys conducted since 1999 are available on the website of the CDSI (http://www.cdsi.gov.sa/), in published form in PDF format. A selection of tables is also available in PDF or Excel format.
https://www.stats.gov.sa/en/814https://www.stats.gov.sa/ar/814The technical notes and tables of contents are in Arabic and the tables are in both languages.
Date of access: September 2013.
Since 2007, Statistical Yearbooks have introduced a section on “Labour Statistics”, which presents a selection of tables from Manpower Surveys.
https://www.stats.gov.sa/en/46
Date of access: May 2013.
| |
|
house keeping |
student/ in training |
retired/ elderly |
does not want to work |
disability/ health reasons |
Others |
Total |
| |
m. |
0 |
0 |
72,852 |
910 |
30,123 |
5,729 |
109,614 |
| Illiterate |
f. |
557,454 |
48 |
18,184 |
79 |
33,279 |
516 |
609,560 |
| |
total |
557,454 |
48 |
91,036 |
989 |
63,402 |
6,245 |
719,174 |
| |
m. |
0 |
5,723 |
100,957 |
1,390 |
15,698 |
4,897 |
128,665 |
| Read and write |
f. |
605,493 |
4,184 |
11,321 |
274 |
6,479 |
411 |
628,162 |
| |
total |
605,493 |
9,907 |
112,278 |
1,664 |
22,177 |
5,308 |
756,827 |
| |
m. |
0 |
179,200 |
135,966 |
2,998 |
15,186 |
11,230 |
344,580 |
| Primary |
f. |
619,556 |
157,772 |
2,272 |
491 |
4,925 |
3,981 |
788,997 |
| |
total |
619,556 |
336,972 |
138,238 |
3,489 |
20,111 |
15,211 |
1,133,577 |
| |
m |
0 |
681,018 |
102,139 |
3,931 |
18,601 |
17,321 |
823,010 |
| Intermediate |
f. |
652,181 |
592,722 |
434 |
355 |
2,167 |
5,049 |
1,254,908 |
| |
total |
652,181 |
1,273,740 |
102,573 |
4,286 |
20,768 |
22,370 |
2,077,918 |
| |
m |
0 |
695,914 |
85,161 |
4,863 |
12,817 |
30,766 |
829,521 |
| secondary or equivalent |
f. |
1,034,040 |
677,982 |
6,833 |
4,119 |
1,898 |
24,266 |
1,749,138 |
| |
total |
1,034,040 |
1,373,896 |
91,994 |
8,982 |
14,715 |
55,032 |
2,578,659 |
| |
m |
0 |
11,124 |
19,083 |
98 |
788 |
5,568 |
36,661 |
| Diploma |
f. |
35,705 |
3,905 |
5,636 |
345 |
118 |
5,221 |
50,930 |
| |
total |
35,705 |
15,029 |
24,719 |
443 |
906 |
10,789 |
87,591 |
| |
m |
0 |
21,457 |
39,076 |
648 |
1,889 |
8,524 |
71,594 |
| Bachelor Degree |
f. |
255,818 |
24,782 |
14,801 |
3,134 |
2,315 |
37,070 |
337,920 |
| |
total |
255,818 |
46,239 |
53,877 |
3,782 |
4,204 |
45,594 |
409,514 |
| |
m |
0 |
1,498 |
5,237 |
0 |
0 |
0 |
6,735 |
| Higher Diploma/ Master |
f. |
1,455 |
2,791 |
597 |
0 |
0 |
410 |
5,253 |
| |
total |
1,455 |
4,289 |
5,834 |
0 |
0 |
410 |
11,988 |
| |
m |
0 |
0 |
2,083 |
0 |
0 |
0 |
2,083 |
| Doctorate |
f. |
0 |
0 |
807 |
0 |
0 |
0 |
807 |
| |
total |
0 |
0 |
2,890 |
0 |
0 |
0 |
2,890 |
| |
m |
0 |
1,595,934 |
562,554 |
14,838 |
95,102 |
84,035 |
2,352,463 |
| total |
f |
3,761,702 |
1,464,186 |
60,885 |
8,797 |
51,181 |
76,924 |
5,425,675 |
| |
total |
3,761,702 |
3,060,120 |
623,439 |
23,635 |
148,283 |
160,959 |
7,778,138 |
| |
m. |
0 |
0 |
6,110 |
911 |
4,155 |
1,190 |
12,366 |
| Illiterate |
f. |
56,429 |
0 |
658 |
0 |
2,185 |
169 |
59,441 |
| |
total |
56,429 |
0 |
6,768 |
911 |
6,340 |
1,359 |
71,807 |
| |
m. |
0 |
1,130 |
9,662 |
870 |
6,648 |
1,882 |
20,192 |
| Read and write |
f. |
128,703 |
721 |
1,816 |
0 |
1,068 |
155 |
132,463 |
| |
total |
128,703 |
1,851 |
11,478 |
870 |
7,716 |
2,037 |
152,655 |
| |
m. |
0 |
36,559 |
4,057 |
1,567 |
3,229 |
2,244 |
47,656 |
| Primary |
f. |
117,073 |
22,302 |
0 |
471 |
1,200 |
408 |
141,454 |
| |
total |
117,073 |
58,861 |
4,057 |
2,038 |
4,429 |
2,652 |
189,110 |
| |
m |
0 |
134,835 |
2,144 |
2,183 |
1,569 |
2,826 |
143,557 |
| Intermediary |
f. |
189,627 |
105,706 |
15 |
6,199 |
2,651 |
0 |
304,198 |
| |
total |
189,627 |
240,541 |
2,159 |
8,382 |
4,220 |
2,826 |
447,755 |
| |
m |
0 |
74,510 |
3,786 |
2,495 |
2,693 |
7,259 |
90,743 |
| Secondary or equivalent |
f. |
301,553 |
59,084 |
303 |
1,191 |
363 |
3,341 |
365,835 |
| |
total |
301,553 |
133,594 |
4,089 |
3,686 |
3,056 |
10,600 |
456,578 |
| |
m |
0 |
850 |
885 |
0 |
1,287 |
1,274 |
4,296 |
| Diploma |
f. |
46,699 |
129 |
326 |
0 |
0 |
738 |
47,892 |
| |
total |
46,699 |
979 |
1,211 |
0 |
1,287 |
2,012 |
52,188 |
| |
m |
0 |
5,677 |
3,868 |
380 |
1,233 |
6,186 |
17,344 |
| Bachelor Degree |
f. |
275,282 |
3,240 |
0 |
1,433 |
0 |
2,557 |
282,512 |
| |
total |
275,282 |
8,917 |
3,868 |
1,813 |
1,233 |
8,743 |
299,856 |
| |
m |
0 |
147 |
0 |
0 |
333 |
866 |
1,346 |
| Higher Diploma/ Master |
f. |
7,825 |
158 |
0 |
0 |
0 |
911 |
8,894 |
| |
total |
7,825 |
305 |
0 |
0 |
333 |
1,777 |
10,240 |
| |
m |
0 |
0 |
706 |
0 |
0 |
1,113 |
1,819 |
| Doctorate |
f. |
1,926 |
0 |
0 |
0 |
0 |
0 |
1,926 |
| |
total |
1,926 |
0 |
706 |
0 |
0 |
1,113 |
3,745 |
| |
m |
0 |
253,708 |
31,218 |
8,406 |
21,147 |
24,840 |
339,319 |
| total |
f |
1,125,117 |
191,340 |
3,118 |
9,294 |
7,467 |
8,279 |
1,344,615 |
| |
total |
1,125,117 |
445,048 |
34,336 |
11,501 |
26,614 |
33,119 |
1,675,735 |
| |
m. |
0 |
0 |
78,962 |
1,821 |
34,278 |
6,919 |
121,980 |
| Illiterate |
f. |
613,883 |
48 |
18,842 |
79 |
35,464 |
685 |
669,001 |
| |
total |
613,883 |
48 |
97,804 |
1,900 |
69,742 |
7,604 |
790,981 |
| |
m. |
0 |
6,853 |
110,619 |
2,260 |
22,346 |
6,779 |
148,857 |
| Read and write |
f. |
734,196 |
4,905 |
13,137 |
274 |
7,547 |
566 |
760,625 |
| |
total |
734,196 |
11,758 |
123,756 |
2,534 |
29,893 |
7,345 |
909,482 |
| |
m. |
0 |
215,759 |
140,023 |
4,565 |
18,415 |
13,474 |
392,236 |
| Primary |
f. |
736,629 |
180,074 |
2,272 |
962 |
6,125 |
4,389 |
930,451 |
| |
total |
736,629 |
395,833 |
142,295 |
5,527 |
24,540 |
17,863 |
1,322,687 |
| |
m |
0 |
815,853 |
104,283 |
6,114 |
20,170 |
20,147 |
966,567 |
| Intermediate |
f. |
841,808 |
698,428 |
449 |
6,554 |
4,818 |
5,049 |
1,550,907 |
| |
total |
841,808 |
1,514,281 |
104,732 |
12,668 |
24,988 |
25,196 |
2,517,474 |
| |
m |
0 |
770,424 |
88,947 |
7,358 |
15,510 |
38,025 |
920,264 |
| Secondary or equivalent |
f. |
1,335,593 |
737,066 |
7,136 |
5,310 |
2,261 |
27,607 |
2,114,973 |
| |
total |
1,335,593 |
1,507,490 |
96,083 |
12,668 |
17,771 |
65,632 |
3,035,237 |
| |
m |
0 |
11,974 |
19,968 |
98 |
2,075 |
6,842 |
40,957 |
| Diploma |
f. |
82,404 |
4,034 |
5,962 |
345 |
118 |
5,959 |
98,822 |
| |
total |
82,404 |
16,008 |
25,930 |
443 |
2,193 |
12,801 |
139,779 |
| |
m |
0 |
27,134 |
42,944 |
1,028 |
3,122 |
14,710 |
88,938 |
| Bachelor Degree |
f. |
531,100 |
28,022 |
14,801 |
4,567 |
2,315 |
39,627 |
620,432 |
| |
total |
531,100 |
55,156 |
57,745 |
5,595 |
5,437 |
54,337 |
709,370 |
| |
m |
0 |
1,645 |
5,237 |
0 |
333 |
866 |
8,081 |
| Higher Diploma/ Master |
f. |
9,280 |
2,949 |
597 |
0 |
0 |
1,321 |
14,147 |
| |
total |
9,280 |
4,594 |
5,834 |
0 |
333 |
2,187 |
22,228 |
| |
m |
0 |
0 |
2,789 |
0 |
0 |
1,113 |
3,902 |
| Doctorate |
f. |
1,926 |
0 |
807 |
0 |
0 |
0 |
2,733 |
| |
total |
1,926 |
0 |
3,596 |
0 |
0 |
1,113 |
6,635 |
| |
m |
0 |
1,849,642 |
593,772 |
23,244 |
116,249 |
108,875 |
2,691,782 |
| total |
f |
4,886,819 |
1,655,526 |
64,003 |
18,091 |
58,648 |
85,203 |
6,762,091 |
| |
total |
4,886,819 |
3,505,168 |
657,775 |
35,136 |
174,897 |
194,078 |
9,453,873 |
source: Labour Force Survey 2013 (Round 1).
ANNEXED NOTE
1. Technical Notes and Definitions
Sampling frame of LFS 2013 Round 1: Population Census 2010.
Sample size: 33500 households
Reference period: January 13th-February 5th, 2013
Population of reference: all individuals (nationals and non-nationals) residing in the Kingdom during the period of reference.
The ultimate sampling unit is the household.
(a) Household and household members: A person or group of persons, related or not related, who share housing and food.
Servants, drivers and similar categories are considered to be part of the household if they live in the same housing unit.
(b) Person out of the labour force: A person aged 15 years and over who is not included in the labour force, among which: the persons staying home for domestics activities, the students, the retired, the self sufficients,
the ones unable to enrol in labour, who are not working and do not look for employment for any other reason.
Classification used for education statuses is ISCED.
2. Institution which provides data
Central Department of Statistics and Information (CDSI), Ministry and Economy and Planning
3. Data availability
Surveys conducted since 1999 are available on the website of the CDSI (http://www.cdsi.gov.sa/), in published form in PDF format. A selection of tables is also available in PDF or Excel format.
https://www.stats.gov.sa/en/814 (website English version) or https://www.stats.gov.sa/ar/814 (website Arabic version). The technical notes and tables of contents are in Arabic and the tables are in both languages.
Date of access:September 2013.
| Degree prepared |
Doctorate |
Master |
Bachelor |
Associate |
Diploma |
Other |
Total |
| Specialization |
Males |
Females |
Males |
Females |
Males |
Females |
Males |
Females |
Males |
Females |
Males |
Females |
Males |
Females |
| Economy and Administration |
|
|
|
|
|
|
|
|
|
|
|
|
|
|
| Business , Management, and Related Support Services |
0 |
0 |
3 |
6 |
36 |
11 |
0 |
0 |
0 |
0 |
0 |
0 |
39 |
17 |
| Public Administration and Social Service professions |
0 |
0 |
0 |
0 |
1 |
0 |
0 |
0 |
0 |
0 |
0 |
0 |
1 |
0 |
| Engineering |
|
|
|
|
|
|
|
|
|
|
|
|
|
|
| Architecture and Related Services |
0 |
0 |
0 |
0 |
1 |
1 |
0 |
0 |
0 |
0 |
0 |
0 |
1 |
1 |
| Engineering Technologies / Technicians |
0 |
0 |
0 |
0 |
2 |
1 |
0 |
0 |
0 |
0 |
0 |
0 |
2 |
1 |
| Engineering |
1 |
0 |
0 |
0 |
41 |
10 |
0 |
0 |
0 |
0 |
0 |
0 |
42 |
10 |
| Arts and Sciences |
|
|
|
|
|
|
|
|
|
|
|
|
|
|
| Biological and Biomedical Sciences |
0 |
1 |
0 |
0 |
1 |
2 |
0 |
0 |
0 |
0 |
0 |
0 |
1 |
3 |
| college preparation |
0 |
0 |
2 |
0 |
0 |
0 |
0 |
0 |
0 |
0 |
6 |
0 |
8 |
0 |
| Communication , Journalism, and Related Programs |
0 |
0 |
0 |
0 |
1 |
0 |
0 |
0 |
0 |
0 |
0 |
0 |
1 |
0 |
| Computer and information Sciences and Support Services |
0 |
0 |
0 |
1 |
1 |
1 |
0 |
0 |
0 |
0 |
0 |
0 |
1 |
2 |
| Education |
0 |
2 |
0 |
2 |
0 |
0 |
0 |
0 |
0 |
0 |
0 |
0 |
0 |
4 |
| English Language and Litterature/Humanities |
0 |
0 |
0 |
1 |
0 |
0 |
0 |
0 |
0 |
0 |
0 |
0 |
0 |
1 |
| Family and Consumer Sciences/Human sciences |
0 |
0 |
0 |
1 |
0 |
0 |
0 |
0 |
0 |
0 |
0 |
0 |
0 |
1 |
| Foreign Languages, litteratures and linguistics |
0 |
0 |
0 |
0 |
0 |
0 |
0 |
0 |
0 |
0 |
3 |
1 |
3 |
1 |
| Health Professions and Related Clinical Sciences |
0 |
0 |
0 |
1 |
3 |
2 |
0 |
0 |
0 |
0 |
0 |
0 |
3 |
3 |
| Liberal Art and Science, General Studies and Humanities |
0 |
0 |
0 |
1 |
1 |
1 |
0 |
0 |
0 |
0 |
0 |
0 |
1 |
2 |
| Library Science |
0 |
0 |
0 |
1 |
0 |
0 |
0 |
0 |
0 |
0 |
0 |
0 |
0 |
1 |
| Philosophy and Religious Studies |
1 |
0 |
6 |
1 |
0 |
0 |
0 |
0 |
0 |
0 |
0 |
0 |
7 |
1 |
| Physical Sciences |
0 |
0 |
0 |
0 |
1 |
0 |
0 |
0 |
0 |
0 |
0 |
0 |
1 |
0 |
| Social Sciences |
0 |
0 |
1 |
2 |
4 |
8 |
0 |
0 |
0 |
0 |
0 |
0 |
5 |
10 |
| Visual and Performing Arts |
0 |
0 |
0 |
0 |
1 |
0 |
0 |
0 |
0 |
0 |
0 |
0 |
1 |
0 |
| Other |
0 |
0 |
0 |
0 |
0 |
0 |
0 |
0 |
0 |
0 |
1 |
0 |
1 |
0 |
| Law and Political Science |
|
|
|
|
|
|
|
|
|
|
|
|
|
|
| legal Professions and Studies |
2 |
1 |
4 |
1 |
4 |
3 |
0 |
0 |
0 |
0 |
0 |
0 |
10 |
5 |
| GRAND TOTAL |
4 |
4 |
16 |
18 |
98 |
40 |
0 |
0 |
0 |
0 |
10 |
1 |
128 |
63 |
Source: Qatar Foundation, Supreme Council for Education, Universities
ANNEXED NOTE
Students on scholarship are sponsored by the State of Qatar or by another body. The figures presented here do not take into account Qatar students abroad, living on their own expense, if any.
Institution which provides data
Qatar Statistics Authority
Data availability
These data on education have been found in the “Education” chapter of 2012’s Statistical Yearbook.
https://www.mdps.gov.qa/en/statistics1/pages/topicslisting.aspx?parent=General&child=StatisticalAbstract
QSA publishes Statistical Yearbooks available online, in Excel (certain thematic chapters since 2010) and PDF format, up to 1980’s issue. However, recently they seem not to be published yearly as a complete volume and thematic chapters are published separately.
Issues 1980 to 2009 are available on the Qatar Information Exchange website, accessible from QSA’ website (English and Arabic website)
http://www.qix.gov.qa/portal/page/portal/QIXPOC/Documents/QIX%20Knowledge%20Base/Publication/General%20Statistics/Annual%20Abstract
Last date of access: June 27th, 2013.
| |
2008/2009 |
2009/2010 |
2010/2011 |
| |
|
Scholarships |
|
Graduates |
|
|
Scholarships |
|
Graduates |
|
|
Scholarships |
|
Graduates |
|
| |
Males |
Females |
Total |
Males |
Females |
Total |
Males |
Females |
Total |
Males |
Females |
Total |
Males |
Females |
Total |
Males |
Females |
Total |
| Doctorate |
4 |
3 |
7 |
2 |
5 |
7 |
3 |
0 |
3 |
5 |
4 |
9 |
4 |
4 |
8 |
3 |
5 |
8 |
| Master |
8 |
6 |
14 |
9 |
8 |
17 |
17 |
8 |
25 |
2 |
4 |
6 |
16 |
18 |
34 |
7 |
4 |
11 |
| Bachelor |
57 |
14 |
71 |
48 |
21 |
69 |
87 |
32 |
119 |
31 |
30 |
61 |
98 |
40 |
138 |
35 |
21 |
56 |
| Associate |
0 |
0 |
0 |
0 |
0 |
0 |
0 |
0 |
0 |
0 |
0 |
0 |
0 |
0 |
0 |
0 |
0 |
0 |
| Diploma |
0 |
0 |
0 |
0 |
0 |
0 |
0 |
0 |
0 |
0 |
0 |
0 |
0 |
0 |
0 |
0 |
0 |
0 |
| Other Degree |
4 |
0 |
4 |
0 |
2 |
2 |
6 |
2 |
8 |
7 |
0 |
7 |
10 |
1 |
11 |
3 |
0 |
3 |
| Total |
73 |
23 |
96 |
59 |
36 |
95 |
113 |
42 |
155 |
45 |
38 |
83 |
128 |
63 |
191 |
48 |
30 |
78 |
Source: Qatar Foundation, Supreme Council for Education, Universities
ANNEXED NOTE
Students on scholarship are sponsored by the State of Qatar or by another body. The figures presented here do not take into account Qatar students abroad, living on their own expense, if any.
Institution which provides data
Qatar Statistics Authority
Data availability
These data on education have been found in the “Education” chapter of 2012’s Statistical Yearbook.
https://www.mdps.gov.qa/en/statistics1/pages/topicslisting.aspx?parent=General&child=StatisticalAbstract
QSA publishes Statistical Yearbooks available online, in Excel (certain thematic chapters since 2010) and PDF format, up to 1980’s issue. However, recently they seem not to be published yearly as a complete volume and thematic chapters are published separately.
Issues 1980 to 2009 are available on the Qatar Information Exchange website, accessible from QSA’ website (English and Arabic website)
http://www.qix.gov.qa/portal/page/portal/QIXPOC/Documents/QIX%20Knowledge%20Base/Publication/General%20Statistics/Annual%20Abstract
Last date of access: June 27th, 2013.
|
|
Saudis |
|
|
Non-Saudis |
|
|
Total |
|
|
males |
females |
total |
males |
females |
total |
males |
females |
total |
| Never married |
796,696 |
143,058 |
939,754 |
680,199 |
112,293 |
792,492 |
1,476,895 |
255,351 |
1,732,246 |
| Married |
3,108,204 |
497,379 |
3,605,583 |
4,656,105 |
512,840 |
5,168,945 |
7,764,309 |
1,010,219 |
8,774,528 |
| Divorced |
35,648 |
25,628 |
61,276 |
14,906 |
10,725 |
25,631 |
50,554 |
36,353 |
86,907 |
| Widower |
10,707 |
13,797 |
24,504 |
10,917 |
5,631 |
16,548 |
21,624 |
19,428 |
41,052 |
| Total |
3,951,255 |
679,862 |
4,631,117 |
5,362,127 |
641,489 |
6,003,616 |
9,313,382 |
1,321,351 |
10,634,733 |
Source: Labour Force Survey 2013 (Round 1).
ANNEXED NOTE
1. Technical Notes and Definitions
Sampling frame of LFS 2013 Round 1: Population Census 2010.
Sample size: 33500 households
Reference period: January 13th-February 5th, 2013
Population of reference: all individuals (nationals and non-nationals) residing in the Kingdom during the period of reference.
The ultimate sampling unit is the household.
(a) Household and household members: A person or group of persons, related or not related, who share housing and food.
Servants, drivers and similar categories are considered to be part of the household if they live in the same housing unit.
(b) Employed person: A person aged 15 years and above who worked during the reference week for at least one hour for pay or profit, or who had a job but were temporarily absent from work.
Employment refers to people who during the reference period:
– worked for one hour or more for wage or salary, in cash or in kind
– worked for one hour or more for profit or family gain, in cash or in kind
– worked for at least 15 hours without pay on a family business or farm
– did volunteer work
Reference period for employment: The seven days preceding the interview date.
2. Institution which provides data
Central Department of Statistics and Information (CDSI), Ministry and Economy and Planning
3. Data availability
Surveys conducted since 1999 are available on the website of the CDSI (http://www.cdsi.gov.sa/), in published form in PDF format. A selection of tables is also available in PDF or Excel format.
https://www.stats.gov.sa/en/814 (website English version) or https://www.stats.gov.sa/ar/814 (website Arabic version). The technical notes and tables of contents are in Arabic and the tables are in both languages.
Date of access: September 2013.
Since 2007, Statistical Yearbooks have introduced a section on “Labour Statistics”, which presents a selection of tables from Manpower Surveys.
https://www.stats.gov.sa/en/46
Date of access: May 2013.
| |
|
Qataris |
Non-Qataris |
| |
|
15-24 |
25-34 |
35-44 |
45-54 |
55-64 |
>65 |
Total |
15-24 |
25-34 |
35-44 |
45-54 |
55-64 |
>65 |
Total |
| |
Males |
14.035 |
674 |
2 |
0 |
0 |
0 |
14.711 |
18.060 |
1.102 |
5 |
0 |
0 |
0 |
19.167 |
| Student |
Females |
14.644 |
679 |
4 |
0 |
0 |
0 |
15.327 |
17.018 |
1.088 |
17 |
0 |
0 |
0 |
18.123 |
| |
Total |
28.679 |
1.353 |
6 |
0 |
0 |
0 |
30.038 |
35.078 |
2.190 |
22 |
0 |
0 |
0 |
37.290 |
| |
Males |
0 |
0 |
0 |
0 |
0 |
0 |
0 |
0 |
0 |
0 |
0 |
0 |
0 |
0 |
| Homemaker |
Females |
3.358 |
6.030 |
5.051 |
5.647 |
3.779 |
2.757 |
26.622 |
7.931 |
28.927 |
21.576 |
11.029 |
4.496 |
1.417 |
75.376 |
| |
Total |
3.358 |
6.030 |
5.051 |
5.647 |
3.779 |
2.757 |
26.622 |
7.931 |
28.927 |
21.576 |
11.029 |
4.496 |
1.417 |
75.376 |
| |
Males |
0 |
91 |
594 |
1.967 |
2.216 |
886 |
5.754 |
0 |
0 |
0 |
0 |
0 |
0 |
0 |
| Retired |
Females |
0 |
43 |
527 |
1.658 |
394 |
0 |
2.622 |
0 |
0 |
0 |
0 |
0 |
0 |
0 |
| |
Total |
0 |
134 |
1.121 |
3.625 |
2.610 |
886 |
8.376 |
0 |
0 |
0 |
0 |
0 |
0 |
0 |
| |
Males |
128 |
142 |
115 |
103 |
96 |
1.768 |
2.352 |
138 |
121 |
63 |
44 |
102 |
237 |
705 |
| Unable to Work |
Females |
70 |
65 |
72 |
148 |
267 |
706 |
1.328 |
57 |
57 |
34 |
27 |
55 |
139 |
369 |
| |
Total |
198 |
207 |
187 |
251 |
363 |
2.474 |
3.680 |
195 |
178 |
97 |
71 |
157 |
376 |
1.074 |
| |
Males |
436 |
216 |
141 |
154 |
183 |
443 |
1.573 |
192 |
119 |
54 |
111 |
242 |
333 |
1.051 |
| Not Seeking Work |
Females |
543 |
269 |
224 |
165 |
155 |
359 |
1.715 |
539 |
476 |
269 |
136 |
95 |
64 |
1.579 |
| |
Total |
979 |
485 |
365 |
319 |
338 |
802 |
3.288 |
731 |
595 |
323 |
247 |
337 |
397 |
2.630 |
| |
Males |
18 |
58 |
53 |
34 |
4 |
2 |
169 |
256 |
473 |
284 |
156 |
143 |
129 |
1.441 |
| Other |
Females |
0 |
2 |
0 |
0 |
0 |
0 |
2 |
111 |
305 |
196 |
138 |
100 |
44 |
894 |
| |
Total |
18 |
60 |
53 |
34 |
4 |
2 |
171 |
367 |
778 |
480 |
294 |
243 |
173 |
2.335 |
| |
Males |
14.617 |
1.181 |
905 |
2.258 |
2.499 |
3.099 |
24.559 |
18.646 |
1.815 |
406 |
311 |
487 |
699 |
22.364 |
| TOTAL |
Females |
18.615 |
7.088 |
5.878 |
7.618 |
4.595 |
3.822 |
47.616 |
25.656 |
30.853 |
22.092 |
11.330 |
4.746 |
1.664 |
96.341 |
| |
Total |
33.232 |
8.269 |
6.783 |
9.876 |
7.094 |
6.921 |
72.175 |
44.302 |
32.668 |
22.498 |
11.641 |
5.233 |
2.363 |
118.705 |
Source: census 2010, QSA
ANNEXED NOTE
1. Technical Notes and Definitions
Reference period for census 2010: the night of April 21st, 2010.
Implementation method: census is based on de jure method; i.e. registering people according to their usual place of residence at time of census.
Populations in transit or visiting Qatar as tourists, as well as residents of public housing or visitors staying in a household for less than two months after night of reference were excluded.
Populations away from usual residence in Qatar for reasons of duty, or on a visit abroad for less than two months, as well as individuals with no personal housing within Qatar staying with a household for more than two months, are counted in their usual/ present residence during census night.
Population of reference: all individuals (nationals and non-nationals) present within the State’s borders during time of reference, including in labour camps.
Inactive population:
Full-time student: The person (15 years or older) enrolled in any educational institution as a full-time persistent student with purpose of attaining an academic degree, irrespective of whether the schooling hours are in the morning or evening. Any trainee enrolled in vocational training institutes is regarded as a full-time student.
Full-time housewife: The female (15 years or older) who is fully engaged in home management and family care, and does not practice any other work
Retired: The person who is not working but capable of work, does not look for work during the week ending on 20/04/2010 and gets a fixed pension for work he had joined before
Disabled: The person (15 years or older) who is not capable of work due to illness, handicap or old age.
Not searching for work: The person (15 years or older) who is capable of work but not working or searching for work and he is not enrolled in any of the educational institutes. Such person is called “economically self-sufficient”.
Others: Any cases encountered by the enumerator other than the above mentioned e.g. inmates of jails, health resorts, hospitals, etc not engaged with work).
2. Institution which provides data
Qatar Statistics Authority (QSA)
English
Arabic
3. Data availability
None of Qatar censuses or other sources have ever disclosed figures of total population broken down by country of citizenship or even by nationality (Qatari/non-Qatari).
For 2010 data have been collected but remain withheld. The census only provides detailed data on population 15 years and above by nationality.
Released parts of census are available on the website of the QSA, in published form in PDF format.
https://www.mdps.gov.qa/en/statistics1/pages/topicslisting.aspx?parent=General&child=Census
Census 2010′ website:
https://www.mdps.gov.qa/en/statistics1/pages/topicslisting.aspx?parent=General&child=Census
2010′ census in Excel or PDF format individual tables:
http://www.qsa.gov.qa/QatarCensus/Census_Results.aspx
Date of access: June 2013.
| Age |
Saudis |
Non-Saudis |
Total |
| group |
Male |
Female |
Total |
Male |
Female |
Total |
Male |
Female |
Total |
| 19-15 |
16,305 |
7,301 |
23,606 |
1,247 |
58 |
1,305 |
17,552 |
7,359 |
24,911 |
| 24-20 |
123,626 |
104,591 |
228,217 |
2,378 |
5,634 |
8,012 |
126,004 |
110,225 |
236,229 |
| 29-25 |
80,552 |
147,562 |
228,114 |
2,904 |
1,512 |
4,416 |
83,456 |
149,074 |
232,530 |
| 34-30 |
28,763 |
73,238 |
102,001 |
2,577 |
1,096 |
3,673 |
31,340 |
74,334 |
105,674 |
| 39-35 |
10,466 |
24,697 |
35,163 |
945 |
1,326 |
2,271 |
11,411 |
26,023 |
37,434 |
| 44-40 |
3,485 |
5,048 |
8,533 |
1,279 |
1,126 |
2,405 |
4,764 |
6,174 |
10,938 |
| 49-45 |
824 |
822 |
1,646 |
470 |
30 |
500 |
1,294 |
852 |
2,146 |
| 54-50 |
983 |
0 |
983 |
385 |
0 |
385 |
1,368 |
0 |
1,368 |
| 59-55 |
421 |
360 |
781 |
0 |
0 |
0 |
421 |
360 |
781 |
| 64-60 |
0 |
0 |
0 |
0 |
0 |
0 |
0 |
0 |
0 |
| 65+ |
0 |
0 |
0 |
0 |
0 |
0 |
0 |
0 |
0 |
| Total |
265,425 |
363,619 |
629,044 |
12,185 |
10,782 |
22,967 |
277,610 |
374,401 |
652,011 |
source: Labour Force Survey 2013 (Round 1).
ANNEXED NOTE
1. Technical Notes and Definitions
Sampling frame of LFS 2013 Round 1: Population Census 2010.
Sample size: 33500 households
Reference period: January 13th-February 5th, 2013
Population of reference: all individuals (nationals and non-nationals) residing in the Kingdom during the period of reference.
The ultimate sampling unit is the household.
(a) Household and household members: A person or group of persons, related or not related, who share housing and food.
Servants, drivers and similar categories are considered to be part of the household if they live in the same housing unit.
(b) Unemployed person: A person aged 15 years and over who did not work during the reference week, was able and ready to work and had been actively looking for work during the last four weeks, but did not find any.
Unemployment refers to people who during the reference period: Are without work, available to work and actively seeking work
Reference period for seeking work: The latest full calendar month preceding the period of data collection
Reference period for availability for work: The seven days preceding the period of data collection
2. Institution which provides data
Central Department of Statistics and Information (CDSI), Ministry and Economy and Planning
3. Data availability
Surveys conducted since 1999 are available on the website of the CDSI (http://www.cdsi.gov.sa/), in published form in PDF format. A selection of tables is also available in PDF or Excel format.
https://www.stats.gov.sa/en/814 (website English version) or https://www.stats.gov.sa/ar/814 (website Arabic version). The technical notes and tables of contents are in Arabic and the tables are in both languages.
Date of access:September 2013.
Since 2007, Statistical Yearbooks have introduced a section on “Labour Statistics”, which presents a selection of tables from Manpower Surveys.
https://www.stats.gov.sa/en/46
Date of access: May 2013.
| Education Status |
|
Saudis |
|
|
Non-Saudis |
|
|
Total |
|
| |
Males |
Females |
Total |
Males |
Females |
Total |
Males |
Females |
Total |
| Illiterate |
169 |
0 |
169 |
0 |
0 |
0 |
169 |
0 |
169 |
| Read and Write |
2,122 |
697 |
2,819 |
518 |
0 |
518 |
2,640 |
697 |
3,337 |
| Primary |
14,713 |
3,698 |
18,411 |
423 |
0 |
423 |
15,136 |
3,698 |
18,834 |
| Intermediate |
27,533 |
7,091 |
34,624 |
1,921 |
0 |
1,921 |
29,454 |
7,091 |
36,545 |
| Secondary or Equivalent |
145,339 |
74,260 |
219,599 |
5,112 |
1,920 |
7,032 |
150,451 |
76,180 |
226,631 |
| Diploma |
40,119 |
19,555 |
59,674 |
915 |
1,187 |
2,102 |
41,034 |
20,742 |
61,776 |
| Bachelor Degree |
34,256 |
256,668 |
290,924 |
3,296 |
7,645 |
10,941 |
37,552 |
264,313 |
301,865 |
| Master Degree |
1,174 |
1,650 |
2,824 |
0 |
30 |
30 |
1,174 |
1,680 |
2,854 |
| Doctorate |
0 |
0 |
0 |
0 |
0 |
0 |
0 |
0 |
0 |
| Total |
265,425 |
363,619 |
629,044 |
12,185 |
10,782 |
22,967 |
277,610 |
374,401 |
652,011 |
Source: Labour Force Survey 2013 (Round 1).
ANNEXED NOTE
1. Technical Notes and Definitions
Sampling frame of LFS 2013 Round 1: Population Census 2010.
Sample size: 33500 households
Reference period: January 13th-February 5th, 2013
Population of reference: all individuals (nationals and non-nationals) residing in the Kingdom during the period of reference.
The ultimate sampling unit is the household.
(a) Household and household members: A person or group of persons, related or not related, who share housing and food.
Servants, drivers and similar categories are considered to be part of the household if they live in the same housing unit.
(b) Unemployed person: A person aged 15 years and over who did not work during the reference week, was able and ready to work and had been actively looking for work during the last four weeks, but did not find any.
Unemployment refers to people who during the reference period: Are without work, available to work and actively seeking work
Reference period for seeking work: The latest full calendar month preceding the period of data collection
Reference period for availability for work: The seven days preceding the period of data collection
Classification used for education statuses is ISCED.
2. Institution which provides data
Central Department of Statistics and Information (CDSI), Ministry and Economy and Planning
3. Data availability
Surveys conducted since 1999 are available on the website of the CDSI (http://www.cdsi.gov.sa/), in published form in PDF format. A selection of tables is also available in PDF or Excel format.
https://www.stats.gov.sa/en/814 (website English version) or https://www.stats.gov.sa/ar/814 (website Arabic version). The technical notes and tables of contents are in Arabic and the tables are in both languages.
Date of access: September 2013.
Since 2007, Statistical Yearbooks have introduced a section on “Labour Statistics”, which presents a selection of tables from Manpower Surveys.
https://www.stats.gov.sa/en/46
Date of access: May 2013.
| |
|
Qataris |
|
|
Non-Qataris |
|
|
TOTAL |
|
| |
Males |
Females |
Total |
Males |
Females |
Total |
Males |
Females |
Total |
| 15-24 |
14.617 |
18615 |
33232 |
18.646 |
25.656 |
44.302 |
33.263 |
44.271 |
77.534 |
| 25-34 |
1.181 |
7088 |
8269 |
1.815 |
30.853 |
32.668 |
2.996 |
37.941 |
40.937 |
| 35-44 |
905 |
5878 |
6783 |
406 |
22.092 |
22.498 |
1.311 |
27.970 |
29.281 |
| 45-54 |
2.258 |
7618 |
9876 |
311 |
11.330 |
11.641 |
2.569 |
18.948 |
21.517 |
| 55-64 |
2.499 |
4595 |
7094 |
487 |
4.746 |
5.233 |
2.986 |
9.341 |
12.327 |
| >65 |
3.099 |
3822 |
6921 |
699 |
1.664 |
2.363 |
3.798 |
5.486 |
9.284 |
| Total |
24.559 |
47.616 |
72.175 |
22.364 |
96.341 |
118.705 |
46.923 |
143.957 |
190.880 |
Source: census 2010, QSA
ANNEXED NOTE
1. Technical Notes and Definitions
Reference period for census 2010: the night of April 21st, 2010.
Implementation method: census is based on de jure method; i.e. registering people according to their usual place of residence at time of census.
Populations in transit or visiting Qatar as tourists, as well as residents of public housing or visitors staying in a household for less than two months after night of reference were excluded.
Populations away from usual residence in Qatar for reasons of duty, or on a visit abroad for less than two months, as well as individuals with no personal housing within Qatar staying with a household for more than two months, are counted in their usual/ present residence during census night.
Population of reference: all individuals (nationals and non-nationals) present within the State’s borders during time of reference, including in labour camps.
Inactive population:
Full-time student: The person (15 years or older) enrolled in any educational institution as a full-time persistent student with purpose of attaining an academic degree, irrespective of whether the schooling hours are in the morning or evening. Any trainee enrolled in vocational training institutes is regarded as a full-time student.
Full-time housewife: The female (15 years or older) who is fully engaged in home management and family care, and does not practice any other work
Retired: The person who is not working but capable of work, does not look for work during the week ending on 20/04/2010 and gets a fixed pension for work he had joined before
Disabled: The person (15 years or older) who is not capable of work due to illness, handicap or old age.
Not searching for work: The person (15 years or older) who is capable of work but not working or searching for work and he is not enrolled in any of the educational institutes. Such person is called “economically self-sufficient”.
Others: Any cases encountered by the enumerator other than the above mentioned e.g. inmates of jails, health resorts, hospitals, etc not engaged with work).
2. Institution which provides data
Qatar Statistics Authority (QSA)
English
Arabic
3. Data availability
None of Qatar censuses or other sources have ever disclosed figures of total population broken down by country of citizenship or even by nationality (Qatari/non-Qatari).
For 2010 data have been collected but remain withheld. The census only provides detailed data on population 15 years and above by nationality.
Released parts of census are available on the website of the QSA, in published form in PDF format.
https://www.mdps.gov.qa/en/statistics1/pages/topicslisting.aspx?parent=General&child=Census
Census 2010′ website:
http://www.qsa.gov.qa/QatarCensus/
2010′ census in Excel or PDF format individual tables:
http://www.qsa.gov.qa/QatarCensus/Census_Results.aspx
Date of access: June 2013.
|
|
Saudis |
|
|
Non-Saudis |
|
|
Total |
|
|
males |
females |
total |
males |
females |
total |
males |
females |
total |
| Never married |
226,441 |
162,332 |
388,773 |
8,285 |
4,000 |
12,285 |
234,726 |
166,332 |
401,058 |
| Married |
36,733 |
192,724 |
229,457 |
3,900 |
6,330 |
10,230 |
40,633 |
199,054 |
239,687 |
| Divorced |
2,197 |
8,117 |
10,314 |
0 |
0 |
0 |
2,197 |
8,117 |
10,314 |
| Widower |
54 |
446 |
500 |
0 |
452 |
452 |
54 |
898 |
952 |
| Total |
265,425 |
363,619 |
629,044 |
12,185 |
10,782 |
22,967 |
277,610 |
374,401 |
652,011 |
Source: Labour Force Survey 2013 (Round 1)
ANNEXED NOTE
1. Technical Notes and Definitions
Sampling frame of LFS 2013 Round 1: Population Census 2010.
Sample size: 33500 households
Reference period: January 13th-February 5th, 2013
Population of reference: all individuals (nationals and non-nationals) residing in the Kingdom during the period of reference.
The ultimate sampling unit is the household.
(a) Household and household members: A person or group of persons, related or not related, who share housing and food.
Servants, drivers and similar categories are considered to be part of the household if they live in the same housing unit.
(b) Unemployed person: A person aged 15 years and over who did not work during the reference week, was able and ready to work and had been actively looking for work during the last four weeks, but did not find any.
Unemployment refers to people who during the reference period: Are without work, available to work and actively seeking work
Reference period for seeking work: The latest full calendar month preceding the period of data collection
Reference period for availability for work: The seven days preceding the period of data collection
2. Institution which provides data
Central Department of Statistics and Information (CDSI), Ministry and Economy and Planning
3. Data availability
Surveys conducted since 1999 are available on the website of the CDSI (http://www.cdsi.gov.sa/), in published form in PDF format. A selection of tables is also available in PDF or Excel format.
https://www.stats.gov.sa/en/814 (website English version) or https://www.stats.gov.sa/ar/814 (website Arabic version). The technical notes and tables of contents are in Arabic and the tables are in both languages.
Date of access: September 2013.
Since 2007, Statistical Yearbooks have introduced a section on “Labour Statistics”, which presents a selection of tables from Manpower Surveys.
https://www.stats.gov.sa/en/46
Date of access: May 2013.
| Sector of higher education |
Establishment |
|
Qatari |
|
|
Non-Qatari |
|
|
Total |
|
| Males |
Females |
Total |
Males |
Females |
Total |
Males |
Females |
Total |
| Public |
Qatar University and Community College |
1.089 |
4.920 |
6.009 |
1.250 |
2.534 |
3.784 |
2.339 |
7.454 |
9.793 |
| |
Qatar Foundation(a) |
272 |
557 |
829 |
581 |
482 |
1.063 |
853 |
1.039 |
1.892 |
| |
North Atlantic College |
1.252 |
470 |
1.722 |
443 |
327 |
770 |
1.695 |
797 |
2.492 |
| Private |
Stenden University Qatar |
74 |
136 |
210 |
125 |
147 |
272 |
199 |
283 |
482 |
| |
Calgary University Qatar |
2 |
64 |
66 |
15 |
98 |
113 |
17 |
162 |
179 |
| |
Qatar College of Aeronautics |
233 |
95 |
328 |
162 |
24 |
186 |
395 |
119 |
514 |
| |
Total |
1.833 |
1.322 |
3.155 |
1.326 |
1.078 |
2.404 |
3.159 |
2.400 |
5.559 |
| TOTAL |
2.922 |
6.242 |
9.164 |
2.576 |
3.612 |
6.188 |
5.498 |
9.854 |
15.352 |
Source: Qatar Foundation and Universities
ANNEXED NOTE
(a) Includes the Academic Bridge Program (a programme at Qatar Foundation which aims at preparing graduates of high schools in Qatar for admission to foreign English language universities);
Texas A&M; Virginia U.; Georgetown U.; Carnegie Mellon U.; Weill Cornell U.; Islamic studies; Northwestern U.
Institution which provides data
Qatar Statistics Authority
Data availability
These data on education have been found in the “Education” chapter of 2012’s Statistical Yearbook.
https://www.mdps.gov.qa/en/statistics1/pages/topicslisting.aspx?parent=General&child=StatisticalAbstract
QSA publishes Statistical Yearbooks available online, in Excel (certain thematic chapters since 2010) and PDF format, up to 1980’s issue. However, recently they seem not to be published yearly as a complete volume and thematic chapters are published separately.
Issues 1980 to 2009 are available on the Qatar Information Exchange website, accessible from QSA’ website (English and Arabic website)
http://www.qix.gov.qa/portal/page/portal/QIXPOC/Documents/QIX%20Knowledge%20Base/Publication/General%20Statistics/Annual%20Abstract
Last date of access: June 27th, 2013.
| |
house keeping |
student/ in training |
retired/ elderly |
does not want to work |
disability/ health reasons |
Others |
Total |
| Saudis |
3,761,702 |
3,060,120 |
623,439 |
23,635 |
148,283 |
160,959 |
7,778,138 |
| non-Saudis |
1,125,117 |
445,048 |
34,336 |
11,501 |
26,614 |
33,119 |
1,675,735 |
| Total |
4,886,819 |
3,505,168 |
657,775 |
35,136 |
174,897 |
194,078 |
9,453,873 |
source: Labour Force Survey 2013 (Round 1)
ANNEXED NOTE
1. Technical Notes and Definitions
Sampling frame of LFS 2013 Round 1: Population Census 2010.
Sample size: 33500 households
Reference period: January 13th-February 5th, 2013
Population of reference: all individuals (nationals and non-nationals) residing in the Kingdom during the period of reference.
The ultimate sampling unit is the household.
(a) Household and household members: A person or group of persons, related or not related, who share housing and food.
Servants, drivers and similar categories are considered to be part of the household if they live in the same housing unit.
(b) Person out of the labour force: A person aged 15 years and over who is not included in the labour force, among which: the persons staying home for domestics activities, the students, the retired, the self sufficients,
the ones unable to enrol in labour, who are not working and do not look for employment for any other reason.
2. Institution which provides data
Central Department of Statistics and Information (CDSI), Ministry and Economy and Planning
3. Data availability
Surveys conducted since 1999 are available on the website of the CDSI (http://www.cdsi.gov.sa/), in published form in PDF format. A selection of tables is also available in PDF or Excel format.
https://www.stats.gov.sa/en/814 (website English version) or https://www.stats.gov.sa/ar/814(website Arabic version). The technical notes and tables of contents are in Arabic and the tables are in both languages.
Date of access:September 2013.
| |
|
Student |
Homemaker |
Retired |
Unable to Work |
Not Seeking Work |
Other |
Total |
| |
Males |
14.711 |
0 |
5.754 |
2.352 |
1.573 |
169 |
24.559 |
| Qataris |
Females |
15.327 |
26.622 |
2.622 |
1.328 |
1.715 |
2 |
47.616 |
| |
Total |
30.038 |
26.622 |
8.376 |
3.680 |
3.288 |
171 |
72.175 |
| |
Males |
19.167 |
0 |
0 |
705 |
1.051 |
1.441 |
22.364 |
| Non-Qataris |
Females |
18.123 |
75.376 |
0 |
369 |
1.579 |
894 |
96.341 |
| |
Total |
37.290 |
75.376 |
0 |
1.074 |
2.630 |
2.335 |
118.705 |
| |
Males |
33.878 |
0 |
5.754 |
3.057 |
2.624 |
1.610 |
46.923 |
| TOTAL |
Females |
33.450 |
101.998 |
2.622 |
1.697 |
3.294 |
896 |
143.957 |
| |
Total |
67.328 |
101.998 |
8.376 |
4.754 |
5.918 |
2.506 |
190.880 |
Source: census 2010, QSA
ANNEXED NOTE
1. Technical Notes and Definitions
Reference period for census 2010: the night of April 21st, 2010.
Implementation method: census is based on de jure method; i.e. registering people according to their usual place of residence at time of census.
Populations in transit or visiting Qatar as tourists, as well as residents of public housing or visitors staying in a household for less than two months after night of reference were excluded.
Populations away from usual residence in Qatar for reasons of duty, or on a visit abroad for less than two months, as well as individuals with no personal housing within Qatar staying with a household for more than two months, are counted in their usual/ present residence during census night.
Population of reference: all individuals (nationals and non-nationals) present within the State’s borders during time of reference, including in labour camps.
Inactive population:
Full-time student: The person (15 years or older) enrolled in any educational institution as a full-time persistent student with purpose of attaining an academic degree, irrespective of whether the schooling hours are in the morning or evening. Any trainee enrolled in vocational training institutes is regarded as a full-time student.
Full-time housewife: The female (15 years or older) who is fully engaged in home management and family care, and does not practice any other work
Retired: The person who is not working but capable of work, does not look for work during the week ending on 20/04/2010 and gets a fixed pension for work he had joined before
Disabled: The person (15 years or older) who is not capable of work due to illness, handicap or old age.
Not searching for work: The person (15 years or older) who is capable of work but not working or searching for work and he is not enrolled in any of the educational institutes. Such person is called “economically self-sufficient”.
Others: Any cases encountered by the enumerator other than the above mentioned e.g. inmates of jails, health resorts, hospitals, etc not engaged with work).
Data related to work force include individuals of 15 years old or more (born before April 1995) and refer to the week preceding the enumeration period.
2. Institution which provides data
Qatar Statistics Authority (QSA)
English
Arabic
3. Data availability
None of Qatar censuses or other sources have ever disclosed figures of total population broken down by country of citizenship or even by nationality (Qatari/non-Qatari).
For 2010 data have been collected but remain withheld. The census only provides detailed data on population 15 years and above by nationality.
Released parts of census are available on the website of the QSA, in published form in PDF format.
https://www.mdps.gov.qa/en/statistics1/pages/topicslisting.aspx?parent=General&child=Census
Census 2010′ website:
https://www.mdps.gov.qa/en/statistics1/pages/topicslisting.aspx?parent=General&child=Census
2010′ census in Excel or PDF format individual tables:
http://www.qsa.gov.qa/QatarCensus/Census_Results.aspx
Date of access: June 2013.
| |
|
Saudis |
|
|
non-Saudis |
|
|
Total |
|
| |
males |
females |
total |
males |
females |
total |
males |
females |
total |
| 15-19 |
1,026,170 |
1,021,625 |
2,047,795 |
205,119 |
180,693 |
385,812 |
1,231,289 |
1,202,318 |
2,433,607 |
| 20-24 |
574,766 |
826,747 |
1,401,513 |
52,346 |
119,863 |
172,209 |
627,112 |
946,610 |
1,573,722 |
| 25-29 |
85,060 |
611,133 |
696,193 |
10,182 |
149,961 |
160,143 |
95,242 |
761,094 |
856,336 |
| 30-34 |
26,661 |
532,185 |
558,846 |
4,773 |
220,069 |
224,842 |
31,434 |
752,254 |
783,688 |
| 35-39 |
18,720 |
479,660 |
498,380 |
3,322 |
248,751 |
252,073 |
22,042 |
728,411 |
750,453 |
| 40-44 |
23,647 |
446,085 |
469,732 |
2,251 |
187,091 |
189,342 |
25,898 |
633,176 |
659,074 |
| 45-49 |
34,759 |
383,970 |
418,729 |
3,913 |
87,846 |
91,759 |
38,672 |
471,816 |
510,488 |
| 50-54 |
82,508 |
322,977 |
405,485 |
6,212 |
51,537 |
57,749 |
88,720 |
374,514 |
463,234 |
| 55-59 |
104,236 |
256,288 |
360,524 |
6,661 |
36,191 |
42,852 |
110,897 |
292,479 |
403,376 |
| 60-64 |
118,643 |
186,244 |
304,887 |
10,219 |
22,067 |
32,286 |
128,862 |
208,311 |
337,173 |
| 65+ |
257,293 |
358,761 |
616,054 |
34,321 |
32,347 |
66,668 |
291,614 |
391,108 |
682,722 |
| Total |
2,352,463 |
5,425,675 |
7,778,138 |
339,319 |
1,336,416 |
1,675,735 |
2,691,782 |
6,762,091 |
9,453,873 |
source: Labour Force Survey 2013 (Round 1)
ANNEXED NOTE
1. Technical Notes and Definitions
Sampling frame of LFS 2013 Round 1: Population Census 2010.
Sample size: 33500 households
Reference period: January 13th-February 5th, 2013
Population of reference: all individuals (nationals and non-nationals) residing in the Kingdom during the period of reference.
The ultimate sampling unit is the household.
(a) Household and household members: A person or group of persons, related or not related, who share housing and food.
Servants, drivers and similar categories are considered to be part of the household if they live in the same housing unit.
(b) Person out of the labour force: A person aged 15 years and over who is not included in the labour force, among which: the persons staying home for domestics activities, the students, the retired, the self sufficients,
the ones unable to enrol in labour, who are not working and do not look for employment for any other reason.
2. Institution which provides data
Central Department of Statistics and Information (CDSI), Ministry and Economy and Planning
3. Data availability
Surveys conducted since 1999 are available on the website of the CDSI (http://www.cdsi.gov.sa/), in published form in PDF format. A selection of tables is also available in PDF or Excel format.
https://www.stats.gov.sa/en/814 (website English version) or https://www.stats.gov.sa/ar/814 (website Arabic version). The technical notes and tables of contents are in Arabic and the tables are in both languages.
Date of access:September 2013.
| Country of citizenship |
Males |
Females |
Total |
| Qatar |
1.089 |
4.920 |
6.009 |
| U.A.E. |
2 |
31 |
33 |
| Bahrain |
22 |
107 |
129 |
| Kuwait |
3 |
11 |
14 |
| Saudi Arabia |
32 |
117 |
149 |
| Oman |
40 |
142 |
182 |
| Gulf Countries |
1.188 |
5.328 |
6.516 |
| Iraq |
38 |
70 |
108 |
| Yemen |
98 |
270 |
368 |
| Palestine |
181 |
371 |
552 |
| Jordan |
141 |
285 |
426 |
| Egypt |
174 |
219 |
393 |
| Syria |
59 |
112 |
171 |
| Lebanon |
15 |
33 |
48 |
| Sudan |
89 |
189 |
278 |
| Somalia |
32 |
45 |
77 |
| Tunisia |
12 |
36 |
48 |
| Algeria |
14 |
39 |
53 |
| Mauritania |
23 |
12 |
35 |
| Other Arab countries |
19 |
48 |
67 |
| Arab Countries |
895 |
1.729 |
2.624 |
| United States |
11 |
29 |
40 |
| United Kingdom |
2 |
11 |
13 |
| Canada |
3 |
18 |
21 |
| Iran |
64 |
160 |
224 |
| Pakistan |
32 |
59 |
91 |
| India |
20 |
31 |
51 |
| Other |
124 |
89 |
213 |
| Other Countries |
256 |
397 |
653 |
| Total |
2.339 |
7.454 |
9.793 |
Source: Universities
ANNEXED NOTE
The table refers to the students in Qatar University and Community College
Institution which provides data
Qatar Statistics Authority
Data availability
These data on education have been found in the “Education” chapter of 2012’s Statistical Yearbook.
https://www.mdps.gov.qa/en/statistics1/pages/topicslisting.aspx?parent=General&child=StatisticalAbstract
QSA publishes Statistical Yearbooks available online, in Excel (certain thematic chapters since 2010) and PDF format, up to 1980’s issue. However, recently they seem not to be published yearly as a complete volume and thematic chapters are published separately.
Issues 1980 to 2009 are available on the Qatar Information Exchange website, accessible from QSA’ website (English and Arabic website)
http://www.qix.gov.qa/portal/page/portal/QIXPOC/Documents/QIX%20Knowledge%20Base/Publication/General%20Statistics/Annual%20Abstract
Last date of access: June 27th, 2013.
| |
|
Saudis |
|
|
Non-Saudis |
|
|
TOTAL |
|
| |
males |
females |
total |
males |
females |
total |
males |
females |
total |
| Illiterate |
109,614 |
609,560 |
719,174 |
12,366 |
59,441 |
71,807 |
121,980 |
669,001 |
790,981 |
| Read and write |
128,665 |
628,162 |
756,827 |
20,192 |
132,463 |
152,655 |
148,857 |
760,625 |
909,482 |
| Primary |
344,580 |
788,997 |
1,133,577 |
47,656 |
141,454 |
189,110 |
392,236 |
930,451 |
1,322,687 |
| Intermediate |
823,010 |
1,254,908 |
2,077,918 |
143,557 |
295,999 |
439,556 |
966,567 |
1,550,907 |
2,517,474 |
| Secondary or equivalent |
829,521 |
1,749,138 |
2,578,659 |
90,743 |
365,835 |
456,578 |
920,264 |
2,114,973 |
3,035,237 |
| Diploma |
36,661 |
50,930 |
87,591 |
4,296 |
47,892 |
52,188 |
40,957 |
98,822 |
139,779 |
| Bachelor Degree |
71,594 |
337,920 |
409,514 |
17,344 |
282,512 |
299,856 |
88,938 |
620,432 |
709,370 |
| Higher Diploma/ Master |
6,735 |
5,253 |
11,988 |
1,346 |
8,894 |
10,240 |
8,081 |
14,147 |
22,228 |
| Doctorate |
2,083 |
807 |
2,890 |
1,819 |
1,926 |
3,745 |
3,902 |
2,733 |
6,635 |
| total |
2,352,463 |
5,425,675 |
7,778,138 |
339,319 |
1,336,416 |
1,675,735 |
2,691,782 |
6,762,091 |
9,453,873 |
source: Labour Force Survey 2013 (Round 1)
ANNEXED NOTE
1. Technical Notes and Definitions
Sampling frame of LFS 2013 Round 1: Population Census 2010.
Sample size: 33500 households
Reference period: January 13th-February 5th, 2013
Population of reference: all individuals (nationals and non-nationals) residing in the Kingdom during the period of reference.
The ultimate sampling unit is the household.
(a) Household and household members: A person or group of persons, related or not related, who share housing and food.
Servants, drivers and similar categories are considered to be part of the household if they live in the same housing unit.
(b) Person out of the labour force: A person aged 15 years and over who is not included in the labour force, among which: the persons staying home for domestics activities, the students, the retired, the self sufficients,
the ones unable to enrol in labour, who are not working and do not look for employment for any other reason.
Classification used for education statuses is ISCED.
2. Institution which provides data
Central Department of Statistics and Information (CDSI), Ministry and Economy and Planning
3. Data availability
Surveys conducted since 1999 are available on the website of the CDSI (http://www.cdsi.gov.sa/), in published form in PDF format. A selection of tables is also available in PDF or Excel format.
https://www.stats.gov.sa/en/814 (website English version) or https://www.stats.gov.sa/ar/814 (website Arabic version). The technical notes and tables of contents are in Arabic and the tables are in both languages.
Date of access:September 2013.
| |
QATARI |
NON-QATARI |
Total |
| |
Males |
Females |
Total |
Males |
Females |
Total |
Males |
Females |
Total |
| 2007 |
40.322 |
21.223 |
61.545 |
686.430 |
79.608 |
766.038 |
726.752 |
100.831 |
827.583 |
| 2010 |
46.168 |
24.908 |
71.076 |
1.070.973 |
128.134 |
1.199.107 |
1.117.141 |
153.042 |
1.270.183 |
| 2011 |
49.228 |
25.145 |
74.373 |
1.068.083 |
127.789 |
1.195.872 |
1.117.311 |
152.934 |
1.270.245 |
| 2012 |
55.609 |
26.992 |
82.601 |
1.117.577 |
140.404 |
1.257.981 |
1.173.186 |
167.396 |
1.340.582 |
Source: Bulletins of Labour Force Sample Surveys, 2007 to 2009 and 2011 to 2012; *: census 2010
ANNEXED NOTE
1. Technical Notes and Definitions
Census 2010:
Reference period for census 2010: the night of April 21st, 2010.
Implementation method: census is based on de jure method; i.e. registering people according to their usual place of residence at time of census.
Populations in transit or visiting Qatar as tourists, as well as residents of public housing or visitors staying in a household for less than two months after night of reference were excluded.
Populations away from usual residence in Qatar for reasons of duty, or on a visit abroad for less than two months, as well as individuals with no personal housing within Qatar staying with a household for more than two months, are counted in their usual/ present residence during census night.
Population of reference: all individuals (nationals and non-nationals) present within the State’s borders during time of reference, including in labour camps.
Labour force Sample Surveys:
The Statistics Authority conducted the first labor Force Sample Survey in 2001. Starting from 2006, the execution of these surveys came to be on annual basis.
| Labor Force |
Sampling |
Sample size |
|
| Sample Surveys |
frame |
(households) |
individuals |
Reference period |
| 2007 |
nd |
5.492 |
31.439 |
October 2007 |
| 2008 |
nd |
6.104 |
nd |
December 2008 |
| 2009 |
nd |
6.109 |
35.839 |
October 2009 |
| 2011 |
nd |
6.920 |
35.839 |
March 2011 |
| 2012 |
Census 2010 |
6.895 |
37.629 |
April 2012 |
Reference period for the labor force data: the week prior to the reference period for data collection.
Population of reference: all Qatari and non-Qatari households present in Qatar on the night of survey, living in normal and collective households.
The collective households are a group of persons not related to each other and sharing living conditions in a residential unit, I.e. labor camps, students living boarding schools, nurses in hospitals… etc. The survey covered the small collective households (includes less than 7 persons) and large collective households (includes 7 persons or more).
The survey did not cover short periods accommodation, i.e. hotels.
Employed population:
Persons aged 15 years an above, who during the week preceding the survey:
a) Perform a work for a wage, salary, profits or household gains, whether it was in cash or in kind.
b) Are temporarily not employed, however, they still have an official relation with their work
2. Institution which provides data
Qatar Statistics Authority (QSA)
English
Arabic
3. Data availability
Most Labour Force Surveys and publications related to the labour force are available on QSA’s website, in PDF format and can be downloaded from:
https://www.mdps.gov.qa/en/statistics1/pages/topicslisting.aspx?parent=Social&child=LaborForce
Annual Bulletin of the Labour Force survey 2012 is available in PDf and Excel formats:
http://www.qix.gov.qa/portal/page/portal/QIXPOC/Documents/QIX%20Knowledge%20Base/Publication/Labor%20Force%20Researches/labor%20force%20sample%20survey/Source_QSA/Labour_Force_Statistics_QSA_Bu_AE_2012.pdf
https://www.mdps.gov.qa/en/statistics1/pages/topicslisting.aspx?parent=Social&child=LaborForce
See also Qatar Information Exchange, an interactive data base compiling data on the labour force taken from available surveys:
http://www.qix.gov.qa/portal/page/portal/qix/subject_area/Statistics?subject_area=183
Date of access: September 2013.
| |
|
In the labor force |
Out of the labor force |
GRAND |
| |
|
Employed |
Unemployed |
Total in |
Housewife |
Student |
Disabled |
Retired |
Other |
Total out of |
TOTAL |
| |
|
Seeking work for 1st time |
Unpd. with previous employment |
labor force |
labor force |
| Qatari |
Males |
55.609 |
615 |
132 |
56.356 |
0 |
13.687 |
1.278 |
10.196 |
1.266 |
26.427 |
82.783 |
| Females |
26.992 |
1.759 |
80 |
28.831 |
25.345 |
19.799 |
2.028 |
5.739 |
1.488 |
54.399 |
83.230 |
| Total |
82.601 |
2.374 |
212 |
85.187 |
25.345 |
33.486 |
3.306 |
15.935 |
2.754 |
80.826 |
166.013 |
| Non-Qatari |
Males |
1.117.577 |
723 |
155 |
1.118.455 |
0 |
22.084 |
2.179 |
0 |
2.305 |
26.568 |
1.145.023 |
| Females |
140.404 |
2.770 |
244 |
143.418 |
76.217 |
22.542 |
1.078 |
0 |
2.248 |
102.085 |
245.503 |
| Total |
1.257.981 |
3.493 |
399 |
1.261.873 |
76.217 |
44.626 |
3.257 |
0 |
4.553 |
128.653 |
1.390.526 |
| Total |
Males |
1.173.186 |
1.338 |
287 |
1.174.811 |
0 |
35.771 |
3.457 |
10.196 |
3.571 |
52.995 |
1.227.806 |
| Females |
167.396 |
4.529 |
324 |
172.249 |
101.562 |
42.341 |
3.106 |
5.739 |
3.736 |
156.484 |
328.733 |
| Total |
1.340.582 |
5.867 |
611 |
1.347.060 |
101.562 |
78.112 |
6.563 |
15.935 |
7.307 |
209.479 |
1.556.539 |
Source: Labour Force Bulletin 2012
ANNEXED NOTE
1. Technical Notes and Definitions
Sampling frame of LFB 2012: Population Census 2010.
Sample size: 6895 households and 37629 individuals from: 1- Qatari households; 2- Non-Qatari regular (non-collective) households; 3- Non-Qatari small collective households (2 – 6 persons); 4- Non-Qatari large collective households (7 persons or more).
Reference period for data collection: April 2012.
Reference period for the labor force data: the week prior to the reference period for data collection (April 2012).
Population of reference: all Qatari and non-Qatari households present in Qatar on the night of survey, living in normal and collective households.
The collective households are a group of persons not related to each other and sharing living conditions in a residential unit, I.e. labor camps, students living boarding schools, nurses in hospitals… etc. The survey covered the small collective households (includes less than 7 persons) and large collective households (includes 7 persons or more).
The survey did not cover short periods accommodation, i.e. hotels.
Relation to labor force (for persons aged 15 and above)
In the labor force (= economically active):
1) Employed.
All persons aged 15 years an above, who during the week preceding the survey:
a) Perform a work for a wage, salary, profits or household gains, whether it was in cash or in kind.
b) Are temporarily not employed, however, they still have an official relation with their work
2) Unemployed.
All persons aged 15 years and over who were, during the week preceding the survey, without employment, willing to work and looking seriously for a job.
There is a distinction between two kinds of unemployed persons:
a) First time unemployed: They are the persons who never worked previously, and were during the week preceding the survey looking actively for work.
b) Unemployed who previously worked: They are the persons with a work experience, who during the week preceding the survey were actively looking for a job
Outside the labor force (=economically inactive):
Full-time student: The person (15 years or older) enrolled in any educational institution as a full-time persistent student with purpose of attaining an academic degree, irrespective of whether the schooling hours are in the morning or evening. Any trainee enrolled in vocational training institutes is regarded as a full-time student.
Full-time housewife: The female (15 years or older) who is fully engaged in home management and family care, and does not practice any other work
Retired: The person who does not look for a job during the week preceding the survey and gets a fixed pension for work he/she had joined before
Disabled: The person (15 years or older) who is not capable of work due to illness, handicap or old age.
Others: Those able to work but not willing to, not enrolled in education, as well as any other cases encountered by the enumerator other than the above mentioned.
2. Institution which provides data
Qatar Statistics Authority (QSA)
English
Arabic
3. Data availability
The Statistics Authority conducted the first labor Force Sample Survey in 2001. Starting from 2006, the execution of these surveys came to be on annual basis.
Most Labour Force Surveys and publications related to the labour force are available on QSA’s website, in PDF format and can be downloaded from:
https://www.mdps.gov.qa/en/statistics1/pages/topicslisting.aspx?parent=Social&child=LaborForce
Annual Bulletin of the Labour Force survey 2012 is available in PDf and Excel formats:
http://www.qix.gov.qa/portal/page/portal/QIXPOC/Documents/QIX%20Knowledge%20Base/Publication/Labor%20Force%20Researches/labor%20force%20sample%20survey/Source_QSA/Labour_Force_Statistics_QSA_Bu_AE_2012.pdf
https://www.mdps.gov.qa/en/statistics1/pages/topicslisting.aspx?parent=Social&child=LaborForce
See also Qatar Information Exchange, an interactive data base compiling data on the labour force taken from available surveys:
http://www.qix.gov.qa/portal/page/portal/qix/subject_area/Statistics?subject_area=183
Date of access: September 2013.
| |
Qatari |
Non-Qatari |
Total |
| |
Males |
Females |
Total |
Males |
Females |
Total |
Males |
Females |
Total |
| Never Married |
29.433 |
31.035 |
60.468 |
251.968 |
51.499 |
303.467 |
281.401 |
82.534 |
363.935 |
| Married |
51.549 |
44.078 |
95.627 |
888.224 |
190.400 |
1.078.624 |
939.773 |
234.478 |
1.174.251 |
| Divorced |
1.187 |
2.956 |
4.143 |
4.503 |
1.539 |
6.042 |
5.690 |
4.495 |
10.185 |
| Widowed |
614 |
5.161 |
5.775 |
328 |
2.065 |
2.393 |
942 |
7.226 |
8.168 |
| Total |
82.783 |
83.230 |
166.013 |
1.145.023 |
245.503 |
1.390.526 |
1.227.806 |
328.733 |
1.556.539 |
Source: Labour Force Bulletin 2012
ANNEXED NOTE
1. Technical Notes and Definitions
Sampling frame of LFB 2012: Population Census 2010.
Sample size: 6895 households and 37629 individuals from: 1- Qatari households; 2- Non-Qatari regular (non-collective) households; 3- Non-Qatari small collective households (2 – 6 persons); 4- Non-Qatari large collective households (7 persons or more).
Reference period for data collection: April 2012.
Population of reference: all Qatari and non-Qatari households present in Qatar on the night of survey, living in normal and collective households.
The collective households are a group of persons not related to each other and sharing living conditions in a residential unit, I.e. labor camps, students living boarding schools, nurses in hospitals… etc. The survey covered the small collective households (includes less than 7 persons) and large collective households (includes 7 persons or more).
The survey did not cover short periods accommodation, i.e. hotels.
2. Institution which provides data
Qatar Statistics Authority (QSA)
English
Arabic
3. Data availability
The Statistics Authority conducted the first labor Force Sample Survey in 2001. Starting from 2006, the execution of these surveys came to be on annual basis.
Most Labour Force Surveys and publications related to the labour force are available on QSA’s website, in PDF format and can be downloaded from:
https://www.mdps.gov.qa/en/statistics1/pages/topicslisting.aspx?parent=Social&child=LaborForce
Annual Bulletin of the Labour Force survey 2012 is available in PDf and Excel formats:
https://www.mdps.gov.qa/en/statistics1/pages/topicslisting.aspx?parent=Social&child=LaborForce
https://www.mdps.gov.qa/en/statistics1/pages/topicslisting.aspx?parent=Social&child=LaborForce
https://www.mdps.gov.qa/en/statistics1/pages/topicslisting.aspx?parent=Social&child=LaborForce
See also Qatar Information Exchange, an interactive data base compiling data on the labour force taken from available surveys:
http://www.qix.gov.qa/portal/page/portal/qix/subject_area/Statistics?subject_area=183
Date of access: September 2013.
| |
14 |
17 |
18 |
19 |
20 |
22 |
23 |
24 |
TOTAL |
| Country of citizenship |
Temporary permits |
Governmental sector permits |
Private sector permits |
Business |
Domestic help |
Dependant permits |
Study |
Self residence permits |
| ARAB COUNTRIES |
|
|
|
|
|
|
|
|
total |
| Iraq |
90 |
173 |
4,184 |
5 |
79 |
10,596 |
0 |
251 |
15,378 |
| Syria |
1,380 |
5,248 |
51,583 |
76 |
332 |
73,141 |
2 |
239 |
132,001 |
| Lebanon |
379 |
1,082 |
17,563 |
48 |
31 |
23,066 |
0 |
142 |
42,311 |
| Jordan |
443 |
2,610 |
17,211 |
28 |
15 |
32,641 |
3 |
204 |
53,155 |
| Palestine |
64 |
242 |
3,137 |
4 |
8 |
4,471 |
0 |
122 |
8,048 |
| Egypt |
8,109 |
45,710 |
273,654 |
26 |
1,502 |
128,272 |
13 |
305 |
457,591 |
| Other Arabs |
330 |
2,574 |
9,881 |
1 |
832 |
10,894 |
41 |
76 |
24,629 |
| Total Arab nationalities |
10,795 |
57,639 |
377,213 |
188 |
2,799 |
283,081 |
59 |
1,339 |
733,113 |
| OTHER COUNTRIES |
|
|
|
|
|
|
|
|
|
| Iran |
543 |
699 |
24,999 |
53 |
562 |
16,700 |
9 |
228 |
43,793 |
| Philippines |
1,832 |
3,489 |
47,857 |
0 |
79,346 |
7,360 |
33 |
47 |
139,964 |
| Pakistan |
1,880 |
2,730 |
88,307 |
22 |
2,659 |
26,981 |
32 |
20 |
122,631 |
| India |
9,582 |
20,739 |
287,789 |
47 |
242,368 |
86,705 |
18 |
47 |
647,295 |
| Bangladesh |
5,422 |
6,619 |
114,636 |
4 |
61,915 |
6,932 |
7 |
5 |
195,540 |
| Sri Lanka |
1,658 |
572 |
17,066 |
0 |
87,482 |
4,020 |
21 |
11 |
110,830 |
| Other nationalities |
5,570 |
4,258 |
60,335 |
28 |
116,139 |
23,338 |
586 |
137 |
210,391 |
| TOTAL ALL NATIONALITIES |
37,282 |
96,745 |
1,018,202 |
342 |
593,270 |
455,117 |
765 |
1,834 |
2,203,557 |
Source: Ministry of Interior
ANNEXED NOTE
1. Definitions
Residency procedures do not apply to GCC nationals.
The bidoun, a stateless population, are not included in the residency documents holders.
Data presented in the table are stock data: all the non-national residents holding a residence permit on December 31st, the given year. The table excludes the Bedoon, the non-Kuwaiti GCC citizens and those in irregular situation.
Temporary permit: An expatriate may be granted temporary residence under article 14 of the immigration regulations in special cases where he does not need or cannot get ordinary residence.
This allows the expatriate to stay for up to one year, for personal emergencies such as illness, or after resignation from employment in order to settle financial affairs or a court case.
Dependent permit: spouse, children or elderly dependent relatives can join visa holder (sponsor) in Kuwait, if the expatriate has obtained a residency and is earning a minimum of KD250 a month (private and governement sector alike).
A working wife cannot sponsor her husband as a dependent. Also, sons over the age of 21 years cannot be sponsored as dependants, though adult daughters and parents may be permitted. Dependent family members are not allowed to work on a Dependent Visa, unless they transfer it into a work visa under Kuwaiti sponsorship. This can be done only after 6 to 12 months of holding a dependent visa.
Every children including new born babies must hold a residency permit. The application for the infant’s residence must be made within 60 days of the birth
The Dependent Visa holder is permitted to stay as long as the sponsor holds a valid visa.
Self residence permit: Expatriates may sponsor themselves under article 24 of the regulations and obtain a residence for two to five years under several conditions
(among which: being aged 60 and more, having worked no less than 25 years in Kuwait, owning a capital of 10000 KD at least; being able to produce a certificate of good conduct, being effectively residing in Kuwait with his/her family, etc.).
This form of residence can be renewed upon expiry. Self-sponsored expatriates may sponsor their wives and children.
Permits 17, 18, 19 and 20 are only granted after Ministry of Labour issues a work permit.
2. Institution which provides data
Ministry of Interior
3. Period of data coverage
December 31st, 2011
4. Data availability
2011′ data is tabulated in MoI’ 2011 Statistical Yearbook, in Chapter “Immigration statistics” (not available online). The volume may be directly obtained from MoI.
|
14 |
17 |
18 |
19 |
20 |
22 |
23 |
24 |
TOTAL ALL PERMITS |
| Country of citizenship |
Temporary permits |
Government sector permits |
Private sector permits |
Business |
Domestic help |
Dependant permits |
Study |
Self residence permits |
| ARAB COUNTRIES |
|
|
|
|
|
|
|
|
total |
| Iraq |
87 |
153 |
4,324 |
4 |
78 |
10,597 |
0 |
252 |
15,495 |
| Syria |
994 |
4,801 |
52,261 |
90 |
383 |
72,387 |
2 |
197 |
131,115 |
| Lebanon |
215 |
1,074 |
19,056 |
53 |
33 |
22,779 |
3 |
132 |
43,345 |
| Jordan |
284 |
2,322 |
16,659 |
27 |
12 |
30,588 |
7 |
205 |
50,104 |
| Palestine |
0 |
0 |
0 |
0 |
0 |
0 |
0 |
0 |
0 |
| Egypt |
3,828 |
42,103 |
268,120 |
22 |
1,570 |
111,058 |
18 |
298 |
427,017 |
| Other Arabs |
225 |
2,474 |
12,477 |
5 |
666 |
13,879 |
29 |
181 |
29,936 |
| Total Arab nationalities |
5,633 |
52,927 |
372,897 |
201 |
2,742 |
261,288 |
59 |
1,265 |
697,012 |
| OTHER COUNTRIES |
|
|
|
|
|
|
|
|
|
| Iran |
316 |
691 |
28,305 |
55 |
649 |
16,545 |
7 |
231 |
46,799 |
| Philippines |
1,239 |
3,058 |
42,727 |
0 |
55,985 |
6,769 |
32 |
42 |
109,852 |
| Pakistan |
1,195 |
2,825 |
94,782 |
41 |
2,931 |
25,613 |
27 |
19 |
127,433 |
| India |
5,188 |
16,373 |
267,158 |
46 |
229,724 |
76,504 |
15 |
46 |
595,054 |
| Bangladesh |
2,146 |
6,376 |
122,552 |
2 |
70,181 |
7,351 |
3 |
3 |
208,614 |
| Sri Lanka |
1,360 |
484 |
14,550 |
0 |
81,291 |
3,706 |
14 |
13 |
101,418 |
| Other nationalities |
3,481 |
3,920 |
50,200 |
30 |
110,994 |
22,481 |
529 |
129 |
191,764 |
| TOTAL ALL NATIONALITIES |
20,558 |
86,654 |
993,171 |
375 |
554,497 |
420,257 |
686 |
1,748 |
2,077,946 |
Source: Ministry of Interior
ANNEXED NOTE
1. Definitions
Residency procedures do not apply to GCC nationals.
The bidoun, a stateless population, are not included in the residency documents holders.
Data presented in the table are stock data: all the non-national residents holding a residence permit on December 31st, the given year. The table excludes the Bedoon, the non-Kuwaiti GCC citizens and those in irregular situation.
Temporary permit: An expatriate may be granted temporary residence under article 14 of the immigration regulations in special cases where he does not need or cannot get ordinary residence.
This allows the expatriate to stay for up to one year, for personal emergencies such as illness, or after resignation from employment in order to settle financial affairs or a court case.
Dependent permit: spouse, children or elderly dependent relatives can join visa holder (sponsor) in Kuwait, if the expatriate has obtained a residency and is earning a minimum of KD250 a month (private and governement sector alike).
A working wife cannot sponsor her husband as a dependent. Also, sons over the age of 21 years cannot be sponsored as dependants, though adult daughters and parents may be permitted. Dependent family members are not allowed to work on a Dependent Visa, unless they transfer it into a work visa under Kuwaiti sponsorship. This can be done only after 6 to 12 months of holding a dependent visa.
Every children including new born babies must hold a residency permit. The application for the infant’s residence must be made within 60 days of the birth
The Dependent Visa holder is permitted to stay as long as the sponsor holds a valid visa.
Self residence permit: Expatriates may sponsor themselves under article 24 of the regulations and obtain a residence for two to five years under several conditions
(among which: being aged 60 and more, having worked no less than 25 years in Kuwait, owning a capital of 10000 KD at least; being able to produce a certificate of good conduct, being effectively residing in Kuwait with his/her family, etc.).
This form of residence can be renewed upon expiry. Self-sponsored expatriates may sponsor their wives and children.
Permits 17, 18, 19 and 20 are only granted after Ministry of Labour issues a work permit.
2. Institution which provides data
Ministry of Interior
3. Period of data coverage
December 31st, 2009
4. Data availability
2009′ data is published in MoI’ 2009 Statistical Yearbook, in Chapter “Immigration statistics”, available online at: http://www.moi.gov.kw/portal/varabic/statistics/stats.htm
Last date of access: September 5th, 2013.
| |
|
Saudis |
|
|
Non-Saudis |
|
|
TOTAL |
|
| years |
Male |
Female |
Total |
Male |
Female |
Total |
Male |
Female |
Total |
| 1999 |
163,286 |
65,339 |
228,625 |
20,494 |
4,935 |
25,429 |
183,780 |
70,274 |
254,054 |
| 2000 |
164,606 |
75,245 |
239,851 |
29,721 |
4,071 |
33,792 |
194,327 |
79,316 |
273,643 |
| 2001 |
176,616 |
76,083 |
252,699 |
25,950 |
2,503 |
28,453 |
202,566 |
78,586 |
281,152 |
| 2002 |
203,155 |
100,972 |
304,127 |
21,828 |
2,690 |
24,518 |
224,983 |
103,662 |
328,645 |
| 2006 |
292,906 |
176,112 |
469,018 |
26,154 |
6,729 |
32,883 |
319,060 |
182,841 |
501,901 |
| 2007 R1 |
280,411 |
164,787 |
445,198 |
15,062 |
3,053 |
18,115 |
295,473 |
167,840 |
463,313 |
| 2007 R2 |
271,007 |
182,987 |
453,994 |
20,264 |
5,820 |
26,084 |
291,271 |
188,807 |
480,078 |
| 2008 R1 |
236,230 |
163,789 |
400,019 |
14,172 |
3,871 |
18,043 |
250,402 |
167,660 |
418,062 |
| 2008 R2 |
239,176 |
177,174 |
416,350 |
17,055 |
4,243 |
21,298 |
256,231 |
181,417 |
437,648 |
| 2009 |
248,162 |
200,385 |
448,547 |
10,380 |
4,082 |
14,462 |
258,542 |
204,467 |
463,009 |
| 2011 |
282,930 |
302,797 |
585,727 |
15,997 |
6,831 |
22,828 |
298,927 |
309,628 |
608,555 |
| 2012 R1 |
269,675 |
318,756 |
588,431 |
20,645 |
6,173 |
26,818 |
290,320 |
324,929 |
615,249 |
| 2012 R2 |
243,983 |
358,870 |
602,853 |
4,233 |
446 |
4,679 |
248,216 |
359,316 |
607,532 |
| 2013 R1 |
265,425 |
363,619 |
629,044 |
12,185 |
10,782 |
22,967 |
277,610 |
374,401 |
652,011 |
R= Round
source: Labour Force Surveys (1999 to 2002; 2006 to 2009; 2011 to 2013 R1)
ANNEXED NOTE
1. Technical Notes and Definitions
| |
sampling |
sample size |
|
| |
frame |
(households) |
reference period |
| 1999 |
Population Census1992 |
15,000 |
April 16th-May 16th, 1999 |
| 2000 |
15,000 |
April 2000 |
| 2001 |
15,000 |
March 2001 |
| 2002 |
15,000 |
April 2002 |
| 2006 |
23,000 |
May 2006 |
| 2007 R1 |
Population Census2004 |
23,000 |
February 19th-March 20th, 2007 |
| 2007 R2 |
23,000 |
August 15th-September 13th, 2007 |
| 2008 R1 |
23,000 |
February 2008 |
| 2008 R2 |
23,000 |
August 2008 |
| 2009 |
23,000 |
July 24th-August 22nd, 2009 |
| 2011 |
Population Census2010 |
29,000 |
October 2011 |
| 2012 R1 |
29,000 |
January 25th-February 17th, 2012 |
| 2012 R2 |
|
|
| 2013 R1 |
33,500 |
January 13th-February 5th, 2013 |
Population of reference: all individuals (nationals and non-nationals) residing in the Kingdom during the period of reference.
The ultimate sampling unit is the household.
(a) Household and household members: A person or group of persons, related or not related, who share housing and food.
Servants, drivers and similar categories are considered to be part of the household if they live in the same housing unit.
(b) Unemployed person: A person aged 15 years and over who did not work during the reference week, was able and ready to work and had been actively looking for work during the last four weeks, but did not find any.
Unemployment refers to people who during the reference period: Are without work, available to work and actively seeking work
Reference period for seeking work: The latest full calendar month preceding the period of data collection
Reference period for availability for work: The seven days preceding the period of data collection
2. Institution which provides data
Central Department of Statistics and Information (CDSI), Ministry and Economy and Planning
3. Data availability
Surveys conducted since 1999 are available on the website of the CDSI (http://www.cdsi.gov.sa/), in published form in PDF format. A selection of tables is also available in PDF or Excel format for 2012.
https://www.stats.gov.sa/en/814
https://www.stats.gov.sa/ar/814
Date of access: September 2013.
Since 2007, Statistical Yearbooks have introduced a section on “Labour Statistics”, which presents a selection of tables from Manpower Surveys.
https://www.stats.gov.sa/en/46
Date of access: May 2013.
| |
Qataris |
Non-Qataris |
Total |
| |
Males |
Females |
Total |
Males |
Females |
Total |
Males |
Females |
Total |
| Never Married |
14,007 |
20,518 |
34,525 |
22,521 |
24,073 |
46,594 |
36,528 |
44,591 |
81,119 |
| Married |
11,772 |
28,444 |
40,216 |
3,988 |
76,351 |
80,339 |
15,760 |
104,795 |
120,555 |
| Divorced |
291 |
982 |
1,273 |
59 |
217 |
276 |
350 |
1,199 |
1,549 |
| Widowed |
357 |
4,455 |
4,812 |
0 |
1,444 |
1,444 |
357 |
5,899 |
6,256 |
| Total |
26,427 |
54,399 |
80,826 |
26,568 |
102,085 |
128,653 |
52,995 |
156,484 |
209,479 |
Source: Labour Force Bulletin 2012, Qatar Statistics Authority
ANNEXED NOTE
1. Technical Notes and Definitions
Sampling frame of LFB 2012: Population Census 2010.
Sample size: 6895 households and 37629 individuals from: 1- Qatari households; 2- Non-Qatari regular (non-collective) households; 3- Non-Qatari small collective households (2 – 6 persons); 4- Non-Qatari large collective households (7 persons or more).
Reference period for data collection: April 2012.
Reference period for the labor force data: the week prior to the reference period for data collection (April 2012).
Population of reference: all Qatari and non-Qatari households present in Qatar on the night of survey, living in normal and collective households.
The collective households are a group of persons not related to each other and sharing living conditions in a residential unit, I.e. labor camps, students living boarding schools, nurses in hospitals… etc. The survey covered the small collective households (includes less than 7 persons) and large collective households (includes 7 persons or more).
The survey did not cover short periods accommodation, i.e. hotels.
Inactive population:
Full-time student: The person (15 years or older) enrolled in any educational institution as a full-time persistent student with purpose of attaining an academic degree, irrespective of whether the schooling hours are in the morning or evening. Any trainee enrolled in vocational training institutes is regarded as a full-time student.
Full-time housewife: The female (15 years or older) who is fully engaged in home management and family care, and does not practice any other work
Retired: The person who does not look for a job during the week preceding the survey and gets a fixed pension for work he/she had joined before
Disabled: The person (15 years or older) who is not capable of work due to illness, handicap or old age.
Others: Those able to work but not willing to, not enrolled in education, as well as any other cases encountered by the enumerator other than the above mentioned.
2. Institution which provides data
Qatar Statistics Authority (QSA)
English
Arabic
3. Data availability
The Statistics Authority conducted the first labor Force Sample Survey in 2001. Starting from 2006, the execution of these surveys came to be on annual basis.
Most Labour Force Surveys and publications related to the labour force are available on QSA’s website, in PDF format and can be downloaded from:
https://www.mdps.gov.qa/en/statistics1/pages/topicslisting.aspx?parent=Social&child=LaborForce
Annual Bulletin of the Labour Force survey 2012 is available in PDf and Excel formats:
http://www.qix.gov.qa/portal/page/portal/QIXPOC/Documents/QIX%20Knowledge%20Base/Publication/Labor%20Force%20Researches/labor%20force%20sample%20survey/Source_QSA/Labour_Force_Statistics_QSA_Bu_AE_2012.pdf
https://www.mdps.gov.qa/en/statistics1/pages/topicslisting.aspx?parent=Social&child=LaborForce
See also Qatar Information Exchange, an interactive data base compiling data on the labour force taken from available surveys:
http://www.qix.gov.qa/portal/page/portal/qix/subject_area/Statistics?subject_area=183
Date of access: September 2013.
https://www.mdps.gov.qa/en/statistics1/pages/topicslisting.aspx?parent=Social&child=LaborForce
| |
Qataris |
Non-Qataris |
Total |
| |
Males |
Females |
Total |
Males |
Females |
Total |
Males |
Females |
Total |
| Illiterate |
1,473 |
5,389 |
6,862 |
0 |
4,096 |
4,096 |
1,473 |
9,485 |
10,958 |
| Reads and writes |
5,061 |
5,917 |
10,978 |
188 |
14,536 |
14,724 |
5,249 |
20,453 |
25,702 |
| Primary |
2,472 |
8,437 |
10,909 |
2,321 |
9,957 |
12,278 |
4,793 |
18,394 |
23,187 |
| Preparatory |
5,261 |
9,745 |
15,006 |
9,340 |
7,464 |
16,804 |
14,601 |
17,209 |
31,810 |
| Secondary |
7,596 |
15,276 |
22,872 |
9,998 |
32,805 |
42,803 |
17,594 |
48,081 |
65,675 |
| Diploma |
525 |
578 |
1,103 |
759 |
5,236 |
5,995 |
1,284 |
5,814 |
7,098 |
| University and above |
4,039 |
9,057 |
13,096 |
3,962 |
27,991 |
31,953 |
8,001 |
37,048 |
45,049 |
| Total |
26,427 |
54,399 |
80,826 |
26,568 |
102,085 |
128,653 |
52,995 |
156,484 |
209,479 |
Source: Labour Force Bulletin 2012, Qatar Statistics Authority
ANNEXED NOTE
1. Technical Notes and Definitions
Sampling frame of LFB 2012: Population Census 2010.
Sample size: 6895 households and 37629 individuals from: 1- Qatari households; 2- Non-Qatari regular (non-collective) households; 3- Non-Qatari small collective households (2 – 6 persons); 4- Non-Qatari large collective households (7 persons or more).
Reference period for data collection: April 2012.
Reference period for the labor force data: the week prior to the reference period for data collection (April 2012).
Population of reference: all Qatari and non-Qatari households present in Qatar on the night of survey, living in normal and collective households.
The collective households are a group of persons not related to each other and sharing living conditions in a residential unit, I.e. labor camps, students living boarding schools, nurses in hospitals… etc. The survey covered the small collective households (includes less than 7 persons) and large collective households (includes 7 persons or more).
The survey did not cover short periods accommodation, i.e. hotels.
Inactive population:
Full-time student: The person (15 years or older) enrolled in any educational institution as a full-time persistent student with purpose of attaining an academic degree, irrespective of whether the schooling hours are in the morning or evening. Any trainee enrolled in vocational training institutes is regarded as a full-time student.
Full-time housewife: The female (15 years or older) who is fully engaged in home management and family care, and does not practice any other work
Retired: The person who does not look for a job during the week preceding the survey and gets a fixed pension for work he/she had joined before
Disabled: The person (15 years or older) who is not capable of work due to illness, handicap or old age.
Others: Those able to work but not willing to, not enrolled in education, as well as any other cases encountered by the enumerator other than the above mentioned.
2. Institution which provides data
Qatar Statistics Authority (QSA)
English
Arabic
3. Data availability
The Statistics Authority conducted the first labor Force Sample Survey in 2001. Starting from 2006, the execution of these surveys came to be on annual basis.
Most Labour Force Surveys and publications related to the labour force are available on QSA’s website, in PDF format and can be downloaded from:
https://www.mdps.gov.qa/en/statistics1/pages/topicslisting.aspx?parent=Social&child=LaborForce
Annual Bulletin of the Labour Force survey 2012 is available in PDf and Excel formats:
http://www.qix.gov.qa/portal/page/portal/QIXPOC/Documents/QIX%20Knowledge%20Base/Publication/Labor%20Force%20Researches/labor%20force%20sample%20survey/Source_QSA/Labour_Force_Statistics_QSA_Bu_AE_2012.pdf
https://www.mdps.gov.qa/en/statistics1/pages/topicslisting.aspx?parent=Social&child=LaborForce
See also Qatar Information Exchange, an interactive data base compiling data on the labour force taken from available surveys:
http://www.qix.gov.qa/portal/page/portal/qix/subject_area/Statistics?subject_area=183
Date of access: September 2013.
https://www.mdps.gov.qa/en/statistics1/pages/topicslisting.aspx?parent=Social&child=LaborForce
| |
Qataris |
Non-Qataris |
Total |
| |
Males |
Females |
Total |
Males |
Females |
Total |
Males |
Females |
Total |
| 15 – 19 |
8,588 |
13,485 |
22,073 |
15,321 |
15,754 |
31,075 |
23,909 |
29,239 |
53,148 |
| 20 – 24 |
4,383 |
7,478 |
11,861 |
5,881 |
10,902 |
16,783 |
10,264 |
18,380 |
28,644 |
| 25 – 29 |
1,008 |
3,766 |
4,774 |
1,032 |
13,762 |
14,794 |
2,040 |
17,528 |
19,568 |
| 30 – 34 |
581 |
3,280 |
3,861 |
731 |
16,229 |
16,960 |
1,312 |
19,509 |
20,821 |
| 35 – 39 |
695 |
3,162 |
3,857 |
406 |
14,007 |
14,413 |
1,101 |
17,169 |
18,270 |
| 40 – 44 |
886 |
3,764 |
4,650 |
163 |
11,149 |
11,312 |
1,049 |
14,913 |
15,962 |
| 45 – 49 |
981 |
4,632 |
5,613 |
268 |
7,750 |
8,018 |
1,249 |
12,382 |
13,631 |
| 50 – 54 |
2,064 |
4,242 |
6,306 |
294 |
5,205 |
5,499 |
2,358 |
9,447 |
11,805 |
| 55 – 59 |
1,845 |
3,810 |
5,655 |
137 |
3,683 |
3,820 |
1,982 |
7,493 |
9,475 |
| 60 – 64 |
1,800 |
2,871 |
4,671 |
558 |
1,782 |
2,340 |
2,358 |
4,653 |
7,011 |
| 65 + |
3,596 |
3,909 |
7,505 |
1,777 |
1,862 |
3,639 |
5,373 |
5,771 |
11,144 |
| TOTAL |
26,427 |
54,399 |
80,826 |
26,568 |
102,085 |
128,653 |
52,995 |
156,484 |
209,479 |
Source: Labour Force Bulletin 2012, Qatar Statistics Authority
ANNEXED NOTE
1. Technical Notes and Definitions
Sampling frame of LFB 2012: Population Census 2010.
Sample size: 6895 households and 37629 individuals from: 1- Qatari households; 2- Non-Qatari regular (non-collective) households; 3- Non-Qatari small collective households (2 – 6 persons); 4- Non-Qatari large collective households (7 persons or more).
Reference period for data collection: April 2012.
Reference period for the labor force data: the week prior to the reference period for data collection (April 2012).
Population of reference: all Qatari and non-Qatari households present in Qatar on the night of survey, living in normal and collective households.
The collective households are a group of persons not related to each other and sharing living conditions in a residential unit, I.e. labor camps, students living boarding schools, nurses in hospitals… etc. The survey covered the small collective households (includes less than 7 persons) and large collective households (includes 7 persons or more).
The survey did not cover short periods accommodation, i.e. hotels.
Inactive population:
Full-time student: The person (15 years or older) enrolled in any educational institution as a full-time persistent student with purpose of attaining an academic degree, irrespective of whether the schooling hours are in the morning or evening. Any trainee enrolled in vocational training institutes is regarded as a full-time student.
Full-time housewife: The female (15 years or older) who is fully engaged in home management and family care, and does not practice any other work
Retired: The person who does not look for a job during the week preceding the survey and gets a fixed pension for work he/she had joined before
Disabled: The person (15 years or older) who is not capable of work due to illness, handicap or old age.
Others: Those able to work but not willing to, not enrolled in education, as well as any other cases encountered by the enumerator other than the above mentioned.
2. Institution which provides data
Qatar Statistics Authority (QSA)
English
Arabic
3. Data availability
The Statistics Authority conducted the first labor Force Sample Survey in 2001. Starting from 2006, the execution of these surveys came to be on annual basis.
Most Labour Force Surveys and publications related to the labour force are available on QSA’s website, in PDF format and can be downloaded from:
https://www.mdps.gov.qa/en/statistics1/pages/topicslisting.aspx?parent=Social&child=LaborForce
Annual Bulletin of the Labour Force survey 2012 is available in PDf and Excel formats:
http://www.qix.gov.qa/portal/page/portal/QIXPOC/Documents/QIX%20Knowledge%20Base/Publication/Labor%20Force%20Researches/labor%20force%20sample%20survey/Source_QSA/Labour_Force_Statistics_QSA_Bu_AE_2012.pdf
https://www.mdps.gov.qa/en/statistics1/pages/topicslisting.aspx?parent=Social&child=LaborForce
See also Qatar Information Exchange, an interactive data base compiling data on the labour force taken from available surveys:
http://www.qix.gov.qa/portal/page/portal/qix/subject_area/Statistics?subject_area=183
Date of access: September 2013.
https://www.mdps.gov.qa/en/statistics1/pages/topicslisting.aspx?parent=Social&child=LaborForce
| |
|
Housewife |
Student |
Disabled |
Retired |
Other |
Total |
| Qatari |
Males |
0 |
13687 |
1,278 |
10,196 |
1,266 |
26,427 |
| |
Females |
25,345 |
19,799 |
2,028 |
5,739 |
1,488 |
54,399 |
| |
Total |
25,345 |
33,486 |
3,306 |
15,935 |
2,754 |
80,826 |
| Non-Qatari |
Males |
0 |
22,084 |
2,179 |
0 |
2,305 |
26,568 |
| |
Females |
76,217 |
22,542 |
1,078 |
0 |
2,248 |
102,085 |
| |
Total |
76,217 |
44,626 |
3,257 |
0 |
4,553 |
128,653 |
| Total |
Males |
0 |
35,771 |
3,457 |
10,196 |
3,571 |
52,995 |
| |
Females |
101,562 |
42,341 |
3,106 |
5,739 |
3,736 |
156,484 |
| |
Total |
101,562 |
78,112 |
6,563 |
15,935 |
7,307 |
209,479 |
Source: Labour Force Bulletin 2012, Qatar Statistics Authority
ANNEXED NOTE
1. Technical Notes and Definitions
Sampling frame of LFB 2012: Population Census 2010.
Sample size: 6895 households and 37629 individuals from: 1- Qatari households; 2- Non-Qatari regular (non-collective) households; 3- Non-Qatari small collective households (2 – 6 persons); 4- Non-Qatari large collective households (7 persons or more).
Reference period for data collection: April 2012.
Reference period for the labor force data: the week prior to the reference period for data collection (April 2012).
Population of reference: all Qatari and non-Qatari households present in Qatar on the night of survey, living in normal and collective households.
The collective households are a group of persons not related to each other and sharing living conditions in a residential unit, I.e. labor camps, students living boarding schools, nurses in hospitals… etc. The survey covered the small collective households (includes less than 7 persons) and large collective households (includes 7 persons or more).
The survey did not cover short periods accommodation, i.e. hotels.
Inactive population:
Full-time student: The person (15 years or older) enrolled in any educational institution as a full-time persistent student with purpose of attaining an academic degree, irrespective of whether the schooling hours are in the morning or evening. Any trainee enrolled in vocational training institutes is regarded as a full-time student.
Full-time housewife: The female (15 years or older) who is fully engaged in home management and family care, and does not practice any other work
Retired: The person who does not look for a job during the week preceding the survey and gets a fixed pension for work he/she had joined before
Disabled: The person (15 years or older) who is not capable of work due to illness, handicap or old age.
Others: Those able to work but not willing to, not enrolled in education, as well as any other cases encountered by the enumerator other than the above mentioned.
2. Institution which provides data
Qatar Statistics Authority (QSA)
English
Arabic
3. Data availability
The Statistics Authority conducted the first labor Force Sample Survey in 2001. Starting from 2006, the execution of these surveys came to be on annual basis.
Most Labour Force Surveys and publications related to the labour force are available on QSA’s website, in PDF format and can be downloaded from:
https://www.mdps.gov.qa/en/statistics1/pages/topicslisting.aspx?parent=Social&child=LaborForce
Annual Bulletin of the Labour Force survey 2012 is available in PDf and Excel formats:
http://www.qix.gov.qa/portal/page/portal/QIXPOC/Documents/QIX%20Knowledge%20Base/Publication/Labor%20Force%20Researches/labor%20force%20sample%20survey/Source_QSA/Labour_Force_Statistics_QSA_Bu_AE_2012.pdf
https://www.mdps.gov.qa/en/statistics1/pages/topicslisting.aspx?parent=Social&child=LaborForce
See also Qatar Information Exchange, an interactive data base compiling data on the labour force taken from available surveys:
http://www.qix.gov.qa/portal/page/portal/qix/subject_area/Statistics?subject_area=183
Date of access: September 2013.
https://www.mdps.gov.qa/en/statistics1/pages/topicslisting.aspx?parent=Social&child=LaborForce
| |
QATARIS |
NON-QATARI |
TOTAL |
TOTAL |
| |
Males |
Females |
Males |
Females |
Qataris |
non-Qataris |
Males |
Females |
| |
Employees |
Average work hours |
Employees |
Average work hours |
Employees |
Average work hours |
Employees |
Average work hours |
Employees |
Average work hours |
Employees |
Average work hours |
Employees |
Average work hours |
Employees |
Average work hours |
| Legislators, Senior Officials and Managers |
6,555 |
40.66 |
1,598 |
38.33 |
24,723 |
47.22 |
2,247 |
41.79 |
8,153 |
40.20 |
26,970 |
46.76 |
31,278 |
44.54 |
3,845 |
39.66 |
| Professionals |
10,357 |
39.49 |
13,791 |
38.65 |
81,379 |
46.07 |
22,711 |
40.53 |
24,148 |
39.01 |
104,090 |
44.86 |
91,736 |
44.32 |
36,502 |
39.40 |
| Technicians and Associate Professionals |
9,350 |
39.42 |
3,958 |
38.88 |
57,440 |
47.86 |
7,209 |
43.74 |
13,308 |
39.26 |
64,649 |
47.40 |
66,790 |
45.01 |
11,167 |
40.86 |
| Clerks |
13,971 |
40.71 |
7,021 |
38.89 |
39,892 |
47.42 |
7,992 |
44.45 |
20,992 |
40.10 |
47,884 |
46.93 |
53,863 |
43.87 |
15,013 |
40.38 |
| Service Workers and Shop and Market Sales Workers |
4,619 |
41.22 |
351 |
37.42 |
74,425 |
51.44 |
13,448 |
51.12 |
4,970 |
40.95 |
87,873 |
51.39 |
79,044 |
49.78 |
13,799 |
50.14 |
| Skilled Agricultural And Fishery Workers |
34 |
42.00 |
0 |
0 |
9,857 |
50.11 |
0 |
0 |
34 |
42.00 |
9,857 |
50.11 |
9,891 |
49.97 |
0 |
0 |
| Craft and Related Trades Workers |
4,588 |
41.60 |
0 |
0 |
467,065 |
52.74 |
81 |
50.00 |
4,588 |
41.60 |
467,146 |
52.74 |
471,653 |
52.26 |
81 |
50.00 |
| Plant and Machine Operators and Assemblers |
1,292 |
39.11 |
0 |
0 |
146,890 |
51.33 |
486 |
47.15 |
1,292 |
39.11 |
147,376 |
51.32 |
148,182 |
51.05 |
486 |
47.15 |
| Elementary Occupations |
4,843 |
40.28 |
273 |
38.53 |
215,906 |
52.68 |
86,230 |
57.47 |
5,116 |
40.18 |
302,136 |
54.05 |
220,749 |
51.63 |
86,503 |
57.40 |
| Total |
55,609 |
40.28 |
26,992 |
38.71 |
1,117,577 |
50.94 |
140,404 |
52.38 |
82,601 |
39.78 |
1,257,981 |
51.50 |
1,173,186 |
49.76 |
167,396 |
49.81 |
ANNEXED NOTE
1. Technical Notes and Definitions
Sampling frame of LFB 2012: Population Census 2010.
Sample size: 6895 households and 37629 individuals from: 1- Qatari households; 2- Non-Qatari regular (non-collective) households; 3- Non-Qatari small collective households (2 – 6 persons); 4- Non-Qatari large collective households (7 persons or more).
Reference period for data collection: April 2012.
Reference period for the labor force data: the week prior to the reference period for data collection (April 2012).
Population of reference: all Qatari and non-Qatari households present in Qatar on the night of survey, living in normal and collective households.
The collective households are a group of persons not related to each other and sharing living conditions in a residential unit, I.e. labor camps, students living boarding schools, nurses in hospitals… etc. The survey covered the small collective households (includes less than 7 persons) and large collective households (includes 7 persons or more).
The survey did not cover short periods accommodation, i.e. hotels.
Occupations are categorised according to ISCO 88 international classification of occupations (major (1-digit) group titles).
Employed population:
Persons aged 15 years an above, who during the week preceding the survey:
a) Perform a work for a wage, salary, profits or household gains, whether it was in cash or in kind.
b) Are temporarily not employed, however, they still have an official relation with their work
The table refers to employed workers (15 years or older) having worked no less than one hour during the week prior to data collection day in April 2012.
2. Institution which provides data
Qatar Statistics Authority (QSA)
ENGLISH
ARABIC
3. Data availability
The Statistics Authority conducted the first labor Force Sample Survey in 2001. Starting from 2006, the execution of these surveys came to be on annual basis.
Most Labour Force Surveys and publications related to the labour force are available on QSA’s website, in PDF format and can be downloaded from:
https://www.mdps.gov.qa/en/statistics1/pages/topicslisting.aspx?parent=Social&child=LaborForce
Annual Bulletin of the Labour Force survey 2012 is available in PDf and Excel formats:
http://www.qix.gov.qa/portal/page/portal/QIXPOC/Documents/QIX%20Knowledge%20Base/Publication/Labor%20Force%20Researches/labor%20force%20sample%20survey/Source_QSA/Labour_Force_Statistics_QSA_Bu_AE_2012.pdf
https://www.mdps.gov.qa/en/statistics1/pages/topicslisting.aspx?parent=Social&child=LaborForce
See also Qatar Information Exchange, an interactive data base compiling data on the labour force taken from available surveys:
http://www.qix.gov.qa/portal/page/portal/qix/subject_area/Statistics?subject_area=183
Date of access: September 2013.
https://www.mdps.gov.qa/en/statistics1/pages/topicslisting.aspx?parent=Social&child=LaborForce
| Economic activity |
|
Qataris |
Non-Qataris |
TOTAL EMPLOYED POPULATION |
| |
|
15-24 |
25-34 |
35-44 |
45-54 |
55-64 |
>65 |
Total |
15-24 |
25-34 |
35-44 |
45-54 |
55-64 |
>65 |
Total |
15-24 |
25-34 |
35-44 |
45-54 |
55-64 |
>65 |
Total |
| |
Males |
2 |
14 |
13 |
7 |
3 |
5 |
44 |
2636 |
6097 |
5220 |
2452 |
518 |
103 |
17,026 |
2638 |
6111 |
5233 |
2459 |
521 |
108 |
17,070 |
| 01-03 Agriculture and fishing |
Females |
0 |
0 |
2 |
0 |
0 |
0 |
2 |
11 |
20 |
7 |
6 |
0 |
0 |
44 |
11 |
20 |
9 |
6 |
0 |
0 |
46 |
| |
Total |
2 |
14 |
15 |
7 |
3 |
5 |
46 |
2647 |
6117 |
5227 |
2458 |
518 |
103 |
17,070 |
2649 |
6131 |
5242 |
2465 |
521 |
108 |
17,116 |
| |
Males |
1,063 |
1,877 |
804 |
497 |
109 |
6 |
4,356 |
8972 |
31379 |
24902 |
10984 |
2791 |
132 |
79,160 |
10035 |
33256 |
25706 |
11481 |
2900 |
138 |
83,516 |
| 05-09 Mining and quarrying |
Females |
234 |
384 |
67 |
19 |
1 |
0 |
705 |
39 |
621 |
518 |
262 |
54 |
0 |
1,494 |
273 |
1005 |
585 |
281 |
55 |
0 |
2,199 |
| |
Total |
1,297 |
2,261 |
871 |
516 |
110 |
6 |
5,061 |
9011 |
32000 |
25420 |
11246 |
2845 |
132 |
80,654 |
10308 |
34261 |
26291 |
11762 |
2955 |
138 |
85,715 |
| |
Males |
111 |
252 |
184 |
133 |
36 |
6 |
722 |
13904 |
40471 |
30880 |
11724 |
2138 |
204 |
99,321 |
14015 |
40723 |
31064 |
11857 |
2174 |
210 |
100,043 |
| 10-33 Manufacturing |
Females |
12 |
35 |
7 |
1 |
1 |
0 |
56 |
44 |
248 |
159 |
74 |
24 |
1 |
550 |
56 |
283 |
166 |
75 |
25 |
1 |
606 |
| |
Total |
123 |
287 |
191 |
134 |
37 |
6 |
778 |
13948 |
40719 |
31039 |
11798 |
2162 |
205 |
99,871 |
14071 |
41006 |
31230 |
11932 |
2199 |
211 |
100,649 |
| |
Males |
287 |
476 |
449 |
156 |
28 |
14 |
1,410 |
135 |
759 |
1137 |
813 |
406 |
15 |
3,265 |
422 |
1235 |
1586 |
969 |
434 |
29 |
4,675 |
| 35-39 Electricity, gas, water supply and waste management |
Females |
76 |
131 |
28 |
3 |
1 |
0 |
239 |
3 |
21 |
14 |
7 |
0 |
0 |
45 |
79 |
152 |
42 |
10 |
1 |
0 |
284 |
| |
Total |
363 |
607 |
477 |
159 |
29 |
14 |
1,649 |
138 |
780 |
1151 |
820 |
406 |
15 |
3,310 |
501 |
1387 |
1628 |
979 |
435 |
29 |
4,959 |
| |
Males |
43 |
130 |
133 |
137 |
56 |
34 |
533 |
72381 |
203493 |
160280 |
55279 |
10459 |
1221 |
503,113 |
72424 |
203623 |
160413 |
55416 |
10515 |
1255 |
503,646 |
| 41-43 Construction |
Females |
19 |
36 |
12 |
3 |
3 |
1 |
74 |
235 |
1412 |
645 |
265 |
44 |
7 |
2,608 |
254 |
1448 |
657 |
268 |
47 |
8 |
2,682 |
| |
Total |
62 |
166 |
145 |
140 |
59 |
35 |
607 |
72616 |
204905 |
160925 |
55544 |
10503 |
1228 |
505,721 |
72678 |
205071 |
161070 |
55684 |
10562 |
1263 |
506,328 |
| |
Males |
193 |
366 |
368 |
322 |
124 |
134 |
1,507 |
18421 |
51741 |
42558 |
17832 |
4363 |
731 |
135,646 |
18614 |
52107 |
42926 |
18154 |
4487 |
865 |
137,153 |
| 45-47 Wholesale and retail trade; repair of motor vehicles |
Females |
85 |
101 |
108 |
54 |
4 |
0 |
352 |
596 |
3051 |
1178 |
391 |
74 |
4 |
5,294 |
681 |
3152 |
1286 |
445 |
78 |
4 |
5,646 |
| |
Total |
278 |
467 |
476 |
376 |
128 |
134 |
1,859 |
19017 |
54792 |
43736 |
18223 |
4437 |
735 |
140,940 |
19295 |
55259 |
44212 |
18599 |
4565 |
869 |
142,799 |
| |
Males |
96 |
197 |
156 |
51 |
19 |
6 |
525 |
2701 |
11501 |
9648 |
4354 |
932 |
68 |
29,204 |
2797 |
11698 |
9804 |
4405 |
951 |
74 |
29,729 |
| 49-53 Transportation and storage |
Females |
27 |
76 |
50 |
16 |
0 |
0 |
169 |
1046 |
2585 |
308 |
91 |
15 |
0 |
4,045 |
1073 |
2661 |
358 |
107 |
15 |
0 |
4,214 |
| |
Total |
123 |
273 |
206 |
67 |
19 |
6 |
694 |
3747 |
14086 |
9956 |
4445 |
947 |
68 |
33,249 |
3870 |
14359 |
10162 |
4512 |
966 |
74 |
33,943 |
| |
Males |
4 |
12 |
5 |
10 |
3 |
0 |
34 |
4906 |
10992 |
6944 |
2799 |
479 |
32 |
26,152 |
4910 |
11004 |
6949 |
2809 |
482 |
32 |
26,186 |
| 55-56 Accommodation and food service activities |
Females |
3 |
5 |
0 |
2 |
0 |
0 |
10 |
523 |
1688 |
471 |
108 |
16 |
3 |
2,809 |
526 |
1693 |
471 |
110 |
16 |
3 |
2,819 |
| |
Total |
7 |
17 |
5 |
12 |
3 |
0 |
44 |
5429 |
12680 |
7415 |
2907 |
495 |
35 |
28,961 |
5436 |
12697 |
7420 |
2919 |
498 |
35 |
29,005 |
| |
Males |
236 |
509 |
427 |
292 |
126 |
12 |
1,602 |
291 |
1892 |
1987 |
1127 |
459 |
52 |
5,808 |
527 |
2401 |
2414 |
1419 |
585 |
64 |
7,410 |
| 58-63 Information and communication |
Females |
128 |
328 |
139 |
35 |
5 |
0 |
635 |
116 |
566 |
256 |
102 |
25 |
4 |
1,069 |
244 |
894 |
395 |
137 |
30 |
4 |
1,704 |
| |
Total |
364 |
837 |
566 |
327 |
131 |
12 |
2,237 |
407 |
2458 |
2243 |
1229 |
484 |
56 |
6,877 |
771 |
3295 |
2809 |
1556 |
615 |
68 |
9,114 |
| |
Males |
323 |
456 |
239 |
125 |
41 |
3 |
1,187 |
340 |
2468 |
1819 |
1215 |
453 |
56 |
6,351 |
663 |
2924 |
2058 |
1340 |
494 |
59 |
7,538 |
| 64-66 Financial and insurance activities |
Females |
431 |
615 |
175 |
43 |
1 |
0 |
1,265 |
121 |
819 |
441 |
155 |
24 |
0 |
1,560 |
552 |
1434 |
616 |
198 |
25 |
0 |
2,825 |
| |
Total |
754 |
1,071 |
414 |
168 |
42 |
3 |
2,452 |
461 |
3287 |
2260 |
1370 |
477 |
56 |
7,911 |
1215 |
4358 |
2674 |
1538 |
519 |
59 |
10,363 |
| |
Males |
38 |
119 |
104 |
63 |
18 |
9 |
351 |
796 |
4041 |
1911 |
801 |
237 |
30 |
7,816 |
834 |
4160 |
2015 |
864 |
255 |
39 |
8,167 |
| 68 Real estate activities |
Females |
50 |
79 |
13 |
1 |
0 |
0 |
143 |
28 |
185 |
76 |
24 |
3 |
0 |
316 |
78 |
264 |
89 |
25 |
3 |
0 |
459 |
| |
Total |
88 |
198 |
117 |
64 |
18 |
9 |
494 |
824 |
4226 |
1987 |
825 |
240 |
30 |
8,132 |
912 |
4424 |
2104 |
889 |
258 |
39 |
8,626 |
| |
Males |
8 |
71 |
65 |
39 |
30 |
5 |
218 |
2103 |
7746 |
5652 |
2513 |
782 |
132 |
18,928 |
2111 |
7817 |
5717 |
2552 |
812 |
137 |
19,146 |
| 69-75 Professional, scientific and technical activities |
Females |
13 |
45 |
30 |
5 |
0 |
0 |
93 |
101 |
597 |
266 |
140 |
27 |
8 |
1,139 |
114 |
642 |
296 |
145 |
27 |
8 |
1,232 |
| |
Total |
21 |
116 |
95 |
44 |
30 |
5 |
311 |
2204 |
8343 |
5918 |
2653 |
809 |
140 |
20,067 |
2225 |
8459 |
6013 |
2697 |
839 |
145 |
20,378 |
| |
Males |
72 |
135 |
63 |
25 |
14 |
1 |
310 |
7063 |
15142 |
9423 |
4152 |
582 |
69 |
36,431 |
7135 |
15277 |
9486 |
4177 |
596 |
70 |
36,741 |
| 77-82 Administrative and support service activities |
Females |
9 |
38 |
20 |
9 |
0 |
0 |
76 |
447 |
1162 |
578 |
138 |
36 |
3 |
2,364 |
456 |
1200 |
598 |
147 |
36 |
3 |
2,440 |
| |
Total |
81 |
173 |
83 |
34 |
14 |
1 |
386 |
7510 |
16304 |
10001 |
4290 |
618 |
72 |
38,795 |
7591 |
16477 |
10084 |
4324 |
632 |
73 |
39,181 |
| |
Males |
6,246 |
10,088 |
7,952 |
4,392 |
1,050 |
156 |
29,884 |
2755 |
6567 |
9065 |
7027 |
2734 |
336 |
28,484 |
9001 |
16655 |
17017 |
11419 |
3784 |
492 |
58,368 |
| 84 Public administration and defence |
Females |
1,889 |
5,012 |
3,685 |
1,243 |
118 |
13 |
11,960 |
146 |
658 |
493 |
284 |
54 |
5 |
1,640 |
2035 |
5670 |
4178 |
1527 |
172 |
18 |
13,600 |
| |
Total |
8,135 |
15,100 |
11,637 |
5,635 |
1,168 |
169 |
41,844 |
2901 |
7225 |
9558 |
7311 |
2788 |
341 |
30,124 |
11036 |
22325 |
21195 |
12946 |
3956 |
510 |
71,968 |
| |
Males |
139 |
557 |
647 |
211 |
66 |
3 |
1,623 |
382 |
2352 |
3137 |
1970 |
947 |
156 |
8,944 |
521 |
2909 |
3784 |
2181 |
1013 |
159 |
10,567 |
| 85 Education |
Females |
572 |
2,352 |
2,662 |
876 |
75 |
3 |
6,540 |
582 |
3484 |
3017 |
1617 |
490 |
37 |
9,227 |
1154 |
5836 |
5679 |
2493 |
565 |
40 |
15,767 |
| |
Total |
711 |
2,909 |
3,309 |
1,087 |
141 |
6 |
8,163 |
964 |
5836 |
6154 |
3587 |
1437 |
193 |
18,171 |
1675 |
8745 |
9463 |
4674 |
1578 |
199 |
26,334 |
| |
Males |
126 |
404 |
334 |
191 |
66 |
3 |
1,124 |
209 |
1900 |
2753 |
1988 |
643 |
80 |
7,573 |
335 |
2304 |
3087 |
2179 |
709 |
83 |
8,697 |
| 86-88 Human health and social work activities |
Females |
231 |
877 |
756 |
346 |
40 |
2 |
2,252 |
297 |
3567 |
2633 |
1196 |
289 |
15 |
7,997 |
528 |
4444 |
3389 |
1542 |
329 |
17 |
10,249 |
| |
Total |
357 |
1,281 |
1,090 |
537 |
106 |
5 |
3,376 |
506 |
5467 |
5386 |
3184 |
932 |
95 |
15,570 |
863 |
6748 |
6476 |
3721 |
1038 |
100 |
18,946 |
| |
Males |
63 |
227 |
214 |
103 |
26 |
3 |
636 |
476 |
1310 |
1153 |
645 |
272 |
41 |
3,897 |
539 |
1537 |
1367 |
748 |
298 |
44 |
4,533 |
| 90-93 Arts, entertainment and recreation |
Females |
51 |
129 |
51 |
15 |
0 |
0 |
246 |
55 |
212 |
130 |
46 |
9 |
1 |
453 |
106 |
341 |
181 |
61 |
9 |
1 |
699 |
| |
Total |
114 |
356 |
265 |
118 |
26 |
3 |
882 |
531 |
1522 |
1283 |
691 |
281 |
42 |
4,350 |
645 |
1878 |
1548 |
809 |
307 |
45 |
5,232 |
| |
Males |
8 |
13 |
8 |
6 |
2 |
0 |
37 |
699 |
1728 |
1233 |
453 |
122 |
27 |
4,262 |
707 |
1741 |
1241 |
459 |
124 |
27 |
4,299 |
| 94-96 Other service activities |
Females |
9 |
39 |
17 |
10 |
2 |
0 |
77 |
105 |
416 |
308 |
182 |
33 |
1 |
1,045 |
114 |
455 |
325 |
192 |
35 |
1 |
1,122 |
| |
Total |
17 |
52 |
25 |
16 |
4 |
0 |
114 |
804 |
2144 |
1541 |
635 |
155 |
28 |
5,307 |
821 |
2196 |
1566 |
651 |
159 |
28 |
5,421 |
| |
Males |
0 |
19 |
14 |
11 |
4 |
7 |
55 |
5625 |
14250 |
9383 |
12652 |
5889 |
438 |
48,237 |
5625 |
14269 |
9397 |
12663 |
5893 |
445 |
48,292 |
| 97-98 Activities of households as employers |
Females |
0 |
1 |
3 |
0 |
1 |
0 |
5 |
10658 |
41809 |
21752 |
8505 |
1368 |
72 |
84,164 |
10658 |
41810 |
21755 |
8505 |
1369 |
72 |
84,169 |
| |
Total |
0 |
20 |
17 |
11 |
5 |
7 |
60 |
16283 |
56059 |
31135 |
21157 |
7257 |
510 |
132,401 |
16283 |
56079 |
31152 |
21168 |
7262 |
517 |
132,461 |
| |
Males |
0 |
2 |
2 |
2 |
4 |
0 |
10 |
81 |
349 |
479 |
295 |
130 |
21 |
1,355 |
81 |
351 |
481 |
297 |
134 |
21 |
1,365 |
| 99 Activities of extraterritorial organizations and bodies |
Females |
1 |
4 |
1 |
3 |
0 |
0 |
9 |
15 |
96 |
79 |
58 |
21 |
2 |
271 |
16 |
100 |
80 |
61 |
21 |
2 |
280 |
| |
Total |
1 |
6 |
3 |
5 |
4 |
0 |
19 |
96 |
445 |
558 |
353 |
151 |
23 |
1,626 |
97 |
451 |
561 |
358 |
155 |
23 |
1,645 |
| |
Males |
9,058 |
15,924 |
12,181 |
6,773 |
1,825 |
407 |
46,168 |
144,876 |
416,178 |
329,564 |
141,075 |
35,336 |
3,944 |
1,070,973 |
153,934 |
432,102 |
341,745 |
147,848 |
37,161 |
4,351 |
1,117,141 |
| Total |
Females |
3,840 |
10,287 |
7,826 |
2,684 |
252 |
19 |
24,908 |
15,168 |
63,217 |
33,329 |
13,651 |
2,606 |
163 |
128,134 |
19,008 |
73,504 |
41,155 |
16,335 |
2,858 |
182 |
153,042 |
| |
Total |
12,898 |
26,211 |
20,007 |
9,457 |
2,077 |
426 |
71,076 |
160,044 |
479,395 |
362,893 |
154,726 |
37,942 |
4,107 |
1,199,107 |
172,942 |
505,606 |
382,900 |
164,183 |
40,019 |
4,533 |
1,270,183 |
Source: census 2010, QSA
ANNEXED NOTE
1. Technical Notes and Definitions
Reference period for census 2010: the night of April 21st, 2010.
Implementation method: census is based on de jure method; i.e. registering people according to their usual place of residence at time of census.
Populations in transit or visiting Qatar as tourists, as well as residents of public housing or visitors staying in a household for less than two months after night of reference were excluded.
Populations away from usual residence in Qatar for reasons of duty, or on a visit abroad for less than two months, as well as individuals with no personal housing within Qatar staying with a household for more than two months, are counted in their usual/ present residence during census night.
Population of reference: all individuals (nationals and non-nationals) present within the State’s borders during time of reference, including in labour camps.
Data related to work force include individuals of 15 years old or more (born before April 1995) and refer to the week preceding the enumeration period.
The employed population here also includes paid trainees.
Employed: The person (15 years or older) engaged in work or who works for profit, whether for his own account, for wages or for a family without being paid, during the week ending on 20/04/2010 provided that working hours should not be less than one hour during that week, and the sick, regular or other temporary leave should not be counted in the absence days.
Trainee getting a salary: The person (15 years or older) who joins any of the training institutes, whether morning or evening study, and gets a salary during the training period
Economic activities are categorised according to ISIC( Rev. 4) international classification of industries.
2. Institution which provides data
Qatar Statistics Authority (QSA)
ENGLISH
ARBIC
3. Data availability
None of Qatar censuses or other sources have ever disclosed figures of total population broken down by country of citizenship or even by nationality (Qatari/non-Qatari).
For 2010 data have been collected but remain withheld. The census only provides detailed data on population 15 years and above by nationality.
Released parts of census are available on the website of the QSA, in published form in PDF format.
https://www.mdps.gov.qa/en/statistics1/pages/topicslisting.aspx?parent=General&child=Census
Census 2010′ website:
https://www.mdps.gov.qa/en/statistics1/pages/topicslisting.aspx?parent=General&child=Census
2010′ census in Excel or PDF format individual tables:
http://www.qsa.gov.qa/QatarCensus/Census_Results.aspx
Date of access: June 2013.
| |
QATARI |
NON-QATARI |
Total |
| age group |
Males |
Females |
Total |
Males |
Females |
Total |
Males |
Females |
Total |
| 15-19 |
19 |
323 |
342 |
243 |
218 |
461 |
262 |
541 |
803 |
| 20-24 |
319 |
729 |
1,048 |
350 |
800 |
1,150 |
669 |
1,529 |
2,198 |
| 25-29 |
135 |
310 |
445 |
140 |
795 |
935 |
275 |
1,105 |
1,380 |
| 30-34 |
170 |
137 |
307 |
97 |
405 |
502 |
267 |
542 |
809 |
| 35-39 |
55 |
225 |
280 |
0 |
389 |
389 |
55 |
614 |
669 |
| 40-44 |
49 |
95 |
144 |
0 |
304 |
304 |
49 |
399 |
448 |
| 45-49 |
0 |
20 |
20 |
48 |
103 |
151 |
48 |
123 |
171 |
| Total |
747 |
1,839 |
2,586 |
878 |
3,014 |
3,892 |
1,625 |
4,853 |
6,478 |
Source: Labour Force Bulletin 2012
ANNEXED NOTE
1. Technical Notes and Definitions
Sampling frame of LFB 2012: Population Census 2010.
Sample size: 6895 households and 37629 individuals from: 1- Qatari households; 2- Non-Qatari regular (non-collective) households; 3- Non-Qatari small collective households (2 – 6 persons); 4- Non-Qatari large collective households (7 persons or more).
Reference period for data collection: April 2012.
Reference period for the labor force data: the week prior to the reference period for data collection (April 2012).
Population of reference: all Qatari and non-Qatari households present in Qatar on the night of survey, living in normal and collective households.
The collective households are a group of persons not related to each other and sharing living conditions in a residential unit, I.e. labor camps, students living boarding schools, nurses in hospitals… etc. The survey covered the small collective households (includes less than 7 persons) and large collective households (includes 7 persons or more).
The survey did not cover short periods accommodation, i.e. hotels.
Unemployed population:
Persons aged 15 years and over who were, during the week preceding the survey, without employment, willing to work and looking seriously for a job.
There is a distinction between two kinds of unemployed persons:
a) First time unemployed: They are the persons who never worked previously, and were during the week preceding the survey looking actively for work.
b) Unemployed who previously worked: They are the persons with a work experience, who during the week preceding the survey were actively looking for a job
2. Institution which provides data
Qatar Statistics Authority (QSA)
English
Arabic
3. Data availability
The Statistics Authority conducted the first labor Force Sample Survey in 2001. Starting from 2006, the execution of these surveys came to be on annual basis.
Most Labour Force Surveys and publications related to the labour force are available on QSA’s website, in PDF format and can be downloaded from:
https://www.mdps.gov.qa/en/statistics1/pages/topicslisting.aspx?parent=Social&child=LaborForce
Annual Bulletin of the Labour Force survey 2012 is available in PDf and Excel formats:
http://www.qix.gov.qa/portal/page/portal/QIXPOC/Documents/QIX%20Knowledge%20Base/Publication/Labor%20Force%20Researches/labor%20force%20sample%20survey/Source_QSA/Labour_Force_Statistics_QSA_Bu_AE_2012.pdf
http://www.qsa.gov.qa/Eng/publication/Social_publications/LaborForce/Bulletin_labor_force_2012-1.xls
See also Qatar Information Exchange, an interactive data base compiling data on the labour force taken from available surveys:
http://www.qix.gov.qa/portal/page/portal/qix/subject_area/Statistics?subject_area=183
Date of access: September 2013.
| |
QATARIS |
NON-QATARIS |
TOTAL |
| |
Males |
Females |
Total |
Males |
Females |
Total |
Males |
Females |
Total |
| 15-24 |
507 |
1,028 |
1,535 |
95 |
391 |
486 |
602 |
1,419 |
2,021 |
| 25-34 |
217 |
820 |
1,037 |
538 |
1,312 |
1,850 |
755 |
2,132 |
2,887 |
| 35-44 |
78 |
291 |
369 |
78 |
273 |
351 |
156 |
564 |
720 |
| 45-54 |
9 |
61 |
70 |
13 |
77 |
90 |
22 |
138 |
160 |
| 55-64 |
0 |
0 |
0 |
0 |
0 |
0 |
0 |
0 |
0 |
| >65 |
0 |
0 |
0 |
0 |
0 |
0 |
0 |
0 |
0 |
|
Total |
811 |
2,200 |
3,011 |
724 |
2,053 |
2,777 |
1,535 |
4,253 |
5,788 |
Source: census 2010, QSA
ANNEXED NOTE
1. Technical Notes and Definitions
Reference period for census 2010: the night of April 21st, 2010.
Implementation method: census is based on de jure method; i.e. registering people according to their usual place of residence at time of census.
Populations in transit or visiting Qatar as tourists, as well as residents of public housing or visitors staying in a household for less than two months after night of reference were excluded.
Populations away from usual residence in Qatar for reasons of duty, or on a visit abroad for less than two months, as well as individuals with no personal housing within Qatar staying with a household for more than two months, are counted in their usual/ present residence during census night.
Population of reference: all individuals (nationals and non-nationals) present within the State’s borders during time of reference, including in labour camps.
Unemployed population:
Persons aged 15 years and over who were, during the week preceding the survey, without employment, willing to work and looking seriously for a job.
There is a distinction between two kinds of unemployed persons:
a) First time unemployed: They are the persons who never worked previously, and were during the week preceding the survey looking actively for work.
b) Unemployed who previously worked: They are the persons with a work experience, who during the week preceding the survey were actively looking for a job
2. Institution which provides data
Qatar Statistics Authority (QSA)
English
Arabic
3. Data availability
None of Qatar censuses or other sources have ever disclosed figures of total population broken down by country of citizenship or even by nationality (Qatari/non-Qatari).
For 2010 data have been collected but remain withheld. The census only provides detailed data on population 15 years and above by nationality.
Released parts of census are available on the website of the QSA, in published form in PDF format.
https://www.mdps.gov.qa/en/statistics1/pages/topicslisting.aspx?parent=General&child=Census
Census 2010′ website:
https://www.mdps.gov.qa/en/statistics1/pages/topicslisting.aspx?parent=General&child=Census
2010′ census in Excel or PDF format individual tables:
http://www.qsa.gov.qa/QatarCensus/Census_Results.aspx
Date of access: June 2013.
| |
QATARI |
NON-QATARI |
TOTAL |
| |
Males |
Females |
Total |
Males |
Females |
Total |
Males |
Females |
Total |
| Primary |
108 |
233 |
341 |
103 |
197 |
300 |
211 |
430 |
641 |
| Preparatory |
180 |
344 |
524 |
209 |
297 |
506 |
389 |
641 |
1,030 |
| Secondary |
252 |
750 |
1,002 |
371 |
743 |
1,114 |
623 |
1,493 |
2,116 |
| Pre.U. Diploma |
36 |
49 |
85 |
48 |
0 |
48 |
84 |
49 |
133 |
| University and above |
171 |
463 |
634 |
147 |
1,777 |
1,924 |
318 |
2,240 |
2,558 |
| Total |
747 |
1,839 |
2,586 |
878 |
3,014 |
3,892 |
1,625 |
4,853 |
6,478 |
ANNEXED NOTE
1. Technical Notes and Definitions
Sampling frame of LFB 2012: Population Census 2010.
Sample size: 6895 households and 37629 individuals from: 1- Qatari households; 2- Non-Qatari regular (non-collective) households; 3- Non-Qatari small collective households (2 – 6 persons); 4- Non-Qatari large collective households (7 persons or more).
Reference period for data collection: April 2012.
Reference period for the labor force data: the week prior to the reference period for data collection (April 2012).
Population of reference: all Qatari and non-Qatari households present in Qatar on the night of survey, living in normal and collective households.
The collective households are a group of persons not related to each other and sharing living conditions in a residential unit, I.e. labor camps, students living boarding schools, nurses in hospitals… etc. The survey covered the small collective households (includes less than 7 persons) and large collective households (includes 7 persons or more).
The survey did not cover short periods accommodation, i.e. hotels.
Unemployed population:
Persons aged 15 years and over who were, during the week preceding the survey, without employment, willing to work and looking seriously for a job.
There is a distinction between two kinds of unemployed persons:
a) First time unemployed: They are the persons who never worked previously, and were during the week preceding the survey looking actively for work.
b) Unemployed who previously worked: They are the persons with a work experience, who during the week preceding the survey were actively looking for a job
2. Institution which provides data
Qatar Statistics Authority (QSA)
English
Arabic
3. Data availability
The Statistics Authority conducted the first labor Force Sample Survey in 2001. Starting from 2006, the execution of these surveys came to be on annual basis.
Most Labour Force Surveys and publications related to the labour force are available on QSA’s website, in PDF format and can be downloaded from:
https://www.mdps.gov.qa/en/statistics1/pages/topicslisting.aspx?parent=Social&child=LaborForce
Annual Bulletin of the Labour Force survey 2012 is available in PDf and Excel formats:
http://www.qix.gov.qa/portal/page/portal/QIXPOC/Documents/QIX%20Knowledge%20Base/Publication/Labor%20Force%20Researches/labor%20force%20sample%20survey/Source_QSA/Labour_Force_Statistics_QSA_Bu_AE_2012.pdf
https://www.mdps.gov.qa/en/statistics1/pages/topicslisting.aspx?parent=Social&child=LaborForce
See also Qatar Information Exchange, an interactive data base compiling data on the labour force taken from available surveys:
http://www.qix.gov.qa/portal/page/portal/qix/subject_area/Statistics?subject_area=183
Date of access: September 2013.
|
Educational Attainment |
QATARIS |
NON-QATARIS |
TOTAL POPULATION |
| Males |
Females |
Total |
Males |
Females |
Total |
Males |
Females |
Total |
| Illiterate |
35 |
24 |
59 |
3 |
0 |
3 |
38 |
24 |
62 |
| Read and Write & Night School |
86 |
81 |
167 |
41 |
4 |
45 |
127 |
85 |
212 |
| Primary |
227 |
121 |
348 |
82 |
5 |
87 |
309 |
126 |
435 |
| Preparatory |
208 |
250 |
458 |
73 |
22 |
95 |
281 |
272 |
553 |
| Vocational |
3 |
2 |
5 |
0 |
2 |
2 |
3 |
4 |
7 |
| Secondary |
240 |
971 |
1,211 |
109 |
185 |
294 |
349 |
1,156 |
1,505 |
| Post. Secondary |
5 |
44 |
49 |
0 |
60 |
60 |
5 |
104 |
109 |
| University and Above |
6 |
707 |
713 |
414 |
1,775 |
2,189 |
420 |
2,482 |
2,902 |
| Other |
1 |
0 |
1 |
2 |
0 |
2 |
3 |
0 |
3 |
| Total |
811 |
2,200 |
3,011 |
724 |
2,053 |
2,777 |
1,535 |
4,253 |
5,788 |
Source: census 2010, QSA
ANNEXED NOTE
1. Technical Notes and Definitions
Reference period for census 2010: the night of April 21st, 2010.
Implementation method: census is based on de jure method; i.e. registering people according to their usual place of residence at time of census.
Populations in transit or visiting Qatar as tourists, as well as residents of public housing or visitors staying in a household for less than two months after night of reference were excluded.
Populations away from usual residence in Qatar for reasons of duty, or on a visit abroad for less than two months, as well as individuals with no personal housing within Qatar staying with a household for more than two months, are counted in their usual/ present residence during census night.
Population of reference: all individuals (nationals and non-nationals) present within the State’s borders during time of reference, including in labour camps.
Unemployed population:
Persons aged 15 years and over who were, during the week preceding the survey, without employment, willing to work and looking seriously for a job.
There is a distinction between two kinds of unemployed persons:
a) First time unemployed: They are the persons who never worked previously, and were during the week preceding the survey looking actively for work.
b) Unemployed who previously worked: They are the persons with a work experience, who during the week preceding the survey were actively looking for a job
2. Institution which provides data
Qatar Statistics Authority (QSA)
English
Arabic
3. Data availability
None of Qatar censuses or other sources have ever disclosed figures of total population broken down by country of citizenship or even by nationality (Qatari/non-Qatari).
For 2010 data have been collected but remain withheld. The census only provides detailed data on population 15 years and above by nationality.
Released parts of census are available on the website of the QSA, in published form in PDF format.
https://www.mdps.gov.qa/en/statistics1/pages/topicslisting.aspx?parent=General&child=Census
Census 2010′ website:
https://www.mdps.gov.qa/en/statistics1/pages/topicslisting.aspx?parent=General&child=Census
2010′ census in Excel or PDF format individual tables:
http://www.qsa.gov.qa/QatarCensus/Census_Results.aspx
Date of access: June 2013.
Date of access: September 2013.
| |
|
Qataris |
|
|
Non-Qataris |
|
|
TOTAL |
|
| |
Males |
Females |
Total |
Males |
Females |
Total |
Males |
Females |
Total |
| 15 – 19 |
11,602 |
14,341 |
25,943 |
25,711 |
26,914 |
52,625 |
37,313 |
41,255 |
78,568 |
| 20 – 24 |
12,076 |
12,276 |
24,352 |
128,790 |
34,158 |
162,948 |
140,866 |
46,434 |
187,300 |
| 25 – 29 |
9,992 |
9,579 |
19,571 |
223,859 |
43,825 |
267,684 |
233,851 |
53,404 |
287,255 |
| 30 – 34 |
9,859 |
8,908 |
18,767 |
228,707 |
41,974 |
270,681 |
238,566 |
50,882 |
289,448 |
| 35 – 39 |
7,670 |
7,631 |
15,301 |
181,631 |
31,069 |
212,700 |
189,301 |
38,700 |
228,001 |
| 40 – 44 |
7,966 |
7,228 |
15,194 |
149,355 |
25,674 |
175,029 |
157,321 |
32,902 |
190,223 |
| 45 – 49 |
6,147 |
6,904 |
13,051 |
95,857 |
16,525 |
112,382 |
102,004 |
23,429 |
125,433 |
| 50 – 54 |
6,475 |
5,250 |
11,725 |
60,782 |
11,517 |
72,299 |
67,257 |
16,767 |
84,024 |
| 55 – 59 |
4,026 |
4,206 |
8,232 |
30,269 |
6,659 |
36,928 |
34,295 |
10,865 |
45,160 |
| 60 – 64 |
2,717 |
2,954 |
5,671 |
10,643 |
3,443 |
14,086 |
13,360 |
6,397 |
19,757 |
| Total |
78,530 |
79,277 |
157,807 |
1,135,604 |
241,758 |
1,377,362 |
1,214,134 |
321,035 |
1,535,169 |
Source: Labour Force Bulletin 2012
ANNEXED NOTE
1. Technical Notes and Definitions
Sampling frame of LFB 2012: Population Census 2010.
Sample size: 6895 households and 37629 individuals from: 1- Qatari households; 2- Non-Qatari regular (non-collective) households; 3- Non-Qatari small collective households (2 – 6 persons); 4- Non-Qatari large collective households (7 persons or more).
Reference period for data collection: April 2012.
Population of reference: all Qatari and non-Qatari households present in Qatar on the night of survey, living in normal and collective households.
The collective households are a group of persons not related to each other and sharing living conditions in a residential unit, I.e. labor camps, students living boarding schools, nurses in hospitals… etc. The survey covered the small collective households (includes less than 7 persons) and large collective households (includes 7 persons or more).
The survey did not cover short periods accommodation, i.e. hotels.
The working age population is defined as the population aged 15 to 65.
2. Institution which provides data
Qatar Statistics Authority (QSA)
ENGLISH
ARABIC
3. Data availability
The Statistics Authority conducted the first labor Force Sample Survey in 2001. Starting from 2006, the execution of these surveys came to be on annual basis.
Most Labour Force Surveys and publications related to the labour force are available on QSA’s website, in PDF format and can be downloaded from:
https://www.mdps.gov.qa/en/statistics1/pages/topicslisting.aspx?parent=Social&child=LaborForce
Annual Bulletin of the Labour Force survey 2012 is available in PDf and Excel formats:
http://www.qix.gov.qa/portal/page/portal/QIXPOC/Documents/QIX%20Knowledge%20Base/Publication/Labor%20Force%20Researches/labor%20force%20sample%20survey/Source_QSA/Labour_Force_Statistics_QSA_Bu_AE_2012.pdf
https://www.mdps.gov.qa/en/statistics1/pages/topicslisting.aspx?parent=Social&child=LaborForce
See also Qatar Information Exchange, an interactive data base compiling data on the labour force taken from available surveys:
http://www.qix.gov.qa/portal/page/portal/qix/subject_area/Statistics?subject_area=183
Date of access: September 2013.
| |
|
Qataris |
|
|
Non-Qataris |
|
|
TOTAL |
|
| |
males |
females |
total |
males |
females |
total |
males |
females |
total |
| Illiterate |
764 |
4,427 |
5,191 |
35,976 |
7,260 |
43,236 |
36,740 |
11,687 |
48,427 |
| Read & Write |
5,480 |
5,503 |
10,983 |
275,933 |
25,222 |
301,155 |
281,413 |
30,725 |
312,138 |
| Primary |
5,545 |
7,500 |
13,045 |
169,632 |
35,088 |
204,720 |
175,177 |
42,588 |
217,765 |
| Preparatory |
13,972 |
10,892 |
24,864 |
243,524 |
46,907 |
290,431 |
257,496 |
57,799 |
315,295 |
| Secondary |
26,571 |
22,847 |
49,418 |
179,431 |
52,553 |
231,984 |
206,002 |
75,400 |
281,402 |
| Pre.U. Diploma |
2,262 |
1,235 |
3,497 |
53,813 |
8,885 |
62,698 |
56,075 |
10,120 |
66,195 |
| University and above |
23,936 |
26,873 |
50,809 |
177,295 |
65,843 |
243,138 |
201,231 |
92,716 |
293,947 |
| Total |
78,530 |
79,277 |
157,807 |
1,135,604 |
241,758 |
1,377,362 |
1,214,134 |
321,035 |
1,535,169 |
Source: Labour Force Bulletin 2012
ANNEXED NOTE
1. Technical Notes and Definitions
Sampling frame of LFB 2012: Population Census 2010.
Sample size: 6895 households and 37629 individuals from: 1- Qatari households; 2- Non-Qatari regular (non-collective) households; 3- Non-Qatari small collective households (2 – 6 persons); 4- Non-Qatari large collective households (7 persons or more).
Reference period for data collection: April 2012.
Population of reference: all Qatari and non-Qatari households present in Qatar on the night of survey, living in normal and collective households.
The collective households are a group of persons not related to each other and sharing living conditions in a residential unit, I.e. labor camps, students living boarding schools, nurses in hospitals… etc. The survey covered the small collective households (includes less than 7 persons) and large collective households (includes 7 persons or more).
The survey did not cover short periods accommodation, i.e. hotels.
The working age population is defined as the population aged 15 to 65.
2. Institution which provides data
Qatar Statistics Authority (QSA)
ENGLISH
ARABIC
3. Data availability
The Statistics Authority conducted the first labor Force Sample Survey in 2001. Starting from 2006, the execution of these surveys came to be on annual basis.
Most Labour Force Surveys and publications related to the labour force are available on QSA’s website, in PDF format and can be downloaded from:
https://www.mdps.gov.qa/en/statistics1/pages/topicslisting.aspx?parent=Social&child=LaborForce
Annual Bulletin of the Labour Force survey 2012 is available in PDf and Excel formats:
http://www.qix.gov.qa/portal/page/portal/QIXPOC/Documents/QIX%20Knowledge%20Base/Publication/Labor%20Force%20Researches/labor%20force%20sample%20survey/Source_QSA/Labour_Force_Statistics_QSA_Bu_AE_2012.pdf
https://www.mdps.gov.qa/en/statistics1/pages/topicslisting.aspx?parent=Social&child=LaborForce
See also Qatar Information Exchange, an interactive data base compiling data on the labour force taken from available surveys:
http://www.qix.gov.qa/portal/page/portal/qix/subject_area/Statistics?subject_area=183
Date of access: September 2013.
| Husband |
Wife |
| Qatar |
Other GCC national |
Arab |
Asian |
European |
Other |
total |
| Qatari |
1,792 |
97 |
109 |
47 |
7 |
1 |
2,053 |
| Other GCC national |
202 |
14 |
14 |
4 |
1 |
0 |
235 |
| Arab |
59 |
5 |
608 |
69 |
34 |
34 |
809 |
| Asian |
7 |
0 |
17 |
302 |
8 |
2 |
336 |
| European |
3 |
0 |
23 |
6 |
2 |
1 |
35 |
| Other |
4 |
0 |
33 |
12 |
4 |
11 |
64 |
| total |
2,067 |
116 |
804 |
440 |
56 |
49 |
3,532 |
Source: Supreme Judiciary Council/ QSA
ANNEXED NOTE
1. Characteristics of data and definitions
The table refers to Muslim marriages celebrated and registered in Qatar. Marriages of Qataris which took place abroad are not included.
Databases of QSA and Supreme Judiciary council (the religious administration in charge of registering personal status events such as marriages and divorces) are electronically linked up for simultaneous registration of events, to enhance data accuracy.
The nationality group which the newborn belongs to is collected according to the nationality of the father/ head of the household.
2. Institution which provides data
Supreme Judiciary Council/ Qatar Statistics Authority.
3. Period of data coverage:
January 1st-December 31st, 2012.
4. Data availability
Yearly Vital Statistics Annual Bulletin of Marriages and Divorces, publishing data taken from Shari’a courts’ records are available for download in PDF format on QSA website/ Qatar Information exchange portal:
https://www.mdps.gov.qa/en/statistics1/pages/topicslisting.aspx?parent=Population&child=MarriagesDivorces
As of September 2013, issues available online are the following: 1984 to 2012.
Bulletins of Marriages and divorces provide some data disagregated by nationality group of spouses.
the 2012′ Bulletin is available for download in PDF format:
https://www.mdps.gov.qa/en/statistics1/pages/topicslisting.aspx?parent=Population&child=MarriagesDivorces
Date of access: September 2013.
| |
|
Qataris |
Non-Qataris |
total |
| |
Males |
174 |
125 |
299 |
| Unemployed worked before |
Females |
323 |
647 |
970 |
| |
Total |
497 |
772 |
1,269 |
| |
Males |
637 |
599 |
1,236 |
| Unemployed never worked before |
Females |
1,877 |
1,406 |
3,283 |
| |
Total |
2,514 |
2,005 |
4,519 |
| |
Males |
811 |
724 |
1,535 |
| Total unemployed |
Females |
2,200 |
2,053 |
4,253 |
| |
Total |
3,011 |
2,777 |
5,788 |
Source: Labour Force Bulletin 2012
ANNEXED NOTE
1. Technical Notes and Definitions
Sampling frame of LFB 2012: Population Census 2010.
Sample size: 6895 households and 37629 individuals from: 1- Qatari households; 2- Non-Qatari regular (non-collective) households; 3- Non-Qatari small collective households (2 – 6 persons); 4- Non-Qatari large collective households (7 persons or more).
Reference period for data collection: April 2012.
Reference period for the labor force data: the week prior to the reference period for data collection (April 2012).
Population of reference: all Qatari and non-Qatari households present in Qatar on the night of survey, living in normal and collective households.
The collective households are a group of persons not related to each other and sharing living conditions in a residential unit, I.e. labor camps, students living boarding schools, nurses in hospitals… etc. The survey covered the small collective households (includes less than 7 persons) and large collective households (includes 7 persons or more).
The survey did not cover short periods accommodation, i.e. hotels.
Unemployed population:
Persons aged 15 years and over who were, during the week preceding the survey, without employment, willing to work and looking seriously for a job.
There is a distinction between two kinds of unemployed persons:
a) First time unemployed: They are the persons who never worked previously, and were during the week preceding the survey looking actively for work.
b) Unemployed who previously worked: They are the persons with a work experience, who during the week preceding the survey were actively looking for a job
2. Institution which provides data
Qatar Statistics Authority (QSA)
English
Arabic
3. Data availability
The Statistics Authority conducted the first labor Force Sample Survey in 2001. Starting from 2006, the execution of these surveys came to be on annual basis.
Most Labour Force Surveys and publications related to the labour force are available on QSA’s website, in PDF format and can be downloaded from:
https://www.mdps.gov.qa/en/statistics1/pages/topicslisting.aspx?parent=Social&child=LaborForce
Annual Bulletin of the Labour Force survey 2012 is available in PDf and Excel formats:
https://www.mdps.gov.qa/en/statistics1/pages/topicslisting.aspx?parent=Social&child=LaborForce
See also Qatar Information Exchange, an interactive data base compiling data on the labour force taken from available surveys:
http://www.qix.gov.qa/portal/page/portal/qix/subject_area/Statistics?subject_area=183
Date of access: September 2013.
| |
QATARI |
NON-QATARI |
Total |
| duration of search |
Males |
Females |
Total |
Males |
Females |
Total |
Males |
Females |
Total |
| 1-6 months |
202 |
570 |
772 |
311 |
1,510 |
1,821 |
513 |
2,080 |
2,593 |
| 7-12 months |
333 |
505 |
838 |
336 |
758 |
1,094 |
669 |
1,263 |
1,932 |
| one year and more |
212 |
764 |
976 |
231 |
746 |
977 |
443 |
1,510 |
1,953 |
| Total |
747 |
1,839 |
2,586 |
878 |
3,014 |
3,892 |
1,625 |
4,853 |
6,478 |
Source: Labour Force Bulletin 2012
ANNEXED NOTE
1. Technical Notes and Definitions
Sampling frame of LFB 2012: Population Census 2010.
Sample size: 6895 households and 37629 individuals from: 1- Qatari households; 2- Non-Qatari regular (non-collective) households; 3- Non-Qatari small collective households (2 – 6 persons); 4- Non-Qatari large collective households (7 persons or more).
Reference period for data collection: April 2012.
Reference period for the labor force data: the week prior to the reference period for data collection (April 2012).
Population of reference: all Qatari and non-Qatari households present in Qatar on the night of survey, living in normal and collective households.
The collective households are a group of persons not related to each other and sharing living conditions in a residential unit, I.e. labor camps, students living boarding schools, nurses in hospitals… etc. The survey covered the small collective households (includes less than 7 persons) and large collective households (includes 7 persons or more).
The survey did not cover short periods accommodation, i.e. hotels.
Unemployed population:
Persons aged 15 years and over who were, during the week preceding the survey, without employment, willing to work and looking seriously for a job.
There is a distinction between two kinds of unemployed persons:
a) First time unemployed: They are the persons who never worked previously, and were during the week preceding the survey looking actively for work.
b) Unemployed who previously worked: They are the persons with a work experience, who during the week preceding the survey were actively looking for a job
2. Institution which provides data
Qatar Statistics Authority (QSA)
English
Arabic
3. Data availability
The Statistics Authority conducted the first labor Force Sample Survey in 2001. Starting from 2006, the execution of these surveys came to be on annual basis.
Most Labour Force Surveys and publications related to the labour force are available on QSA’s website, in PDF format and can be downloaded from:
https://www.mdps.gov.qa/en/statistics1/pages/topicslisting.aspx?parent=Social&child=LaborForce
Annual Bulletin of the Labour Force survey 2012 is available in PDf and Excel formats:
http://www.qix.gov.qa/portal/page/portal/QIXPOC/Documents/QIX%20Knowledge%20Base/Publication/Labor%20Force%20Researches/labor%20force%20sample%20survey/Source_QSA/Labour_Force_Statistics_QSA_Bu_AE_2012.pdf
http://www.qsa.gov.qa/Eng/publication/Social_publications/LaborForce/Bulletin_labor_force_2012-1.xls
https://www.mdps.gov.qa/en/statistics1/pages/topicslisting.aspx?parent=Social&child=LaborForce
See also Qatar Information Exchange, an interactive data base compiling data on the labour force taken from available surveys:
http://www.qix.gov.qa/portal/page/portal/qix/subject_area/Statistics?subject_area=183
Date of access: September 2013.
| |
|
QATARIS |
|
|
NON-QATARIS |
|
TOTAL |
| |
Males |
Females |
Total |
Males |
Females |
Total |
Males |
Females |
Total |
| 15 – 19 |
11,602 |
14,341 |
25,943 |
25,711 |
26,914 |
52,625 |
37,313 |
41,255 |
78,568 |
| 20 – 24 |
12,076 |
12,276 |
24,352 |
128,790 |
34,158 |
162,948 |
140,866 |
46,434 |
187,300 |
| 25 – 29 |
9,992 |
9,579 |
19,571 |
223,859 |
43,825 |
267,684 |
233,851 |
53,404 |
287,255 |
| 30 – 34 |
9,859 |
8,908 |
18,767 |
228,707 |
41,974 |
270,681 |
238,566 |
50,882 |
289,448 |
| 35 – 39 |
7,670 |
7,631 |
15,301 |
181,631 |
31,069 |
212,700 |
189,301 |
38,700 |
228,001 |
| 40 – 44 |
7,966 |
7,228 |
15,194 |
149,355 |
25,674 |
175,029 |
157,321 |
32,902 |
190,223 |
| 45 – 49 |
6,147 |
6,904 |
13,051 |
95,857 |
16,525 |
112,382 |
102,004 |
23,429 |
125,433 |
| 50 – 54 |
6,475 |
5,250 |
11,725 |
60,782 |
11,517 |
72,299 |
67,257 |
16,767 |
84,024 |
| 55 – 59 |
4,026 |
4,206 |
8,232 |
30,269 |
6,659 |
36,928 |
34,295 |
10,865 |
45,160 |
| 60 – 64 |
2,717 |
2,954 |
5,671 |
10,643 |
3,443 |
14,086 |
13,360 |
6,397 |
19,757 |
| >65 |
4,253 |
3,953 |
8,206 |
9,419 |
3,745 |
13,164 |
13,672 |
7,698 |
21,370 |
| Total Q. |
82,783 |
83,230 |
166,013 |
1,145,023 |
245,503 |
1,390,526 |
1,227,806 |
328,733 |
1,556,539 |
Source: Labour Force Bulletin 2012
ANNEXED NOTE
1. Technical Notes and Definitions
Sampling frame of LFB 2012: Population Census 2010.
Sample size: 6895 households and 37629 individuals from: 1- Qatari households; 2- Non-Qatari regular (non-collective) households; 3- Non-Qatari small collective households (2 – 6 persons); 4- Non-Qatari large collective households (7 persons or more).
Reference period for data collection: April 2012.
Population of reference: all Qatari and non-Qatari households present in Qatar on the night of survey, living in normal and collective households.
The collective households are a group of persons not related to each other and sharing living conditions in a residential unit, I.e. labor camps, students living boarding schools, nurses in hospitals… etc. The survey covered the small collective households (includes less than 7 persons) and large collective households (includes 7 persons or more).
The survey did not cover short periods accommodation, i.e. hotels.
2. Institution which provides data
Qatar Statistics Authority (QSA)
ENGLISH
ARABIC
3. Data availability
The Statistics Authority conducted the first labor Force Sample Survey in 2001. Starting from 2006, the execution of these surveys came to be on annual basis.
Most Labour Force Surveys and publications related to the labour force are available on QSA’s website, in PDF format and can be downloaded from:
https://www.mdps.gov.qa/en/statistics1/pages/topicslisting.aspx?parent=Social&child=LaborForce
Annual Bulletin of the Labour Force survey 2012 is available in PDf and Excel formats:
https://www.mdps.gov.qa/en/statistics1/pages/topicslisting.aspx?parent=Social&child=LaborForce
https://www.mdps.gov.qa/en/statistics1/pages/topicslisting.aspx?parent=Social&child=LaborForce
See also Qatar Information Exchange, an interactive data base compiling data on the labour force taken from available surveys:
http://www.qix.gov.qa/portal/page/portal/qix/subject_area/Statistics?subject_area=183
Date of access: September 2013.
| |
QATARI |
NON-QATARI |
Total |
| |
Males |
Females |
Total |
Males |
Females |
Total |
Males |
Females |
Total |
| 2007 |
701 |
1,348 |
2,049 |
868 |
1,386 |
2,254 |
1,569 |
2,734 |
4,303 |
| 2010 |
811 |
2,200 |
3,011 |
724 |
2,053 |
2,777 |
1,535 |
4,253 |
5,788 |
| 2011 |
865 |
2,172 |
3,037 |
1,081 |
3,082 |
4,163 |
1,946 |
5,254 |
7,200 |
| 2012 |
747 |
1,839 |
2,586 |
878 |
3,014 |
3,892 |
1,625 |
4,853 |
6,478 |
Source: Bulletins of Labour Force Sample Surveys, 2007 to 2009 and 2011 to 2012; *: census 2010
ANNEXED NOTE
1. Technical Notes and Definitions
Census 2010:
Reference period for census 2010: the night of April 21st, 2010.
Implementation method: census is based on de jure method; i.e. registering people according to their usual place of residence at time of census.
Populations in transit or visiting Qatar as tourists, as well as residents of public housing or visitors staying in a household for less than two months after night of reference were excluded.
Populations away from usual residence in Qatar for reasons of duty, or on a visit abroad for less than two months, as well as individuals with no personal housing within Qatar staying with a household for more than two months, are counted in their usual/ present residence during census night.
Population of reference: all individuals (nationals and non-nationals) present within the State’s borders during time of reference, including in labour camps.
Labour force Sample Surveys:
The Statistics Authority conducted the first labor Force Sample Survey in 2001. Starting from 2006, the execution of these surveys came to be on annual basis.
| Labor Force |
Sampling |
Sample size |
|
| Sample Surveys |
frame |
(households) |
individuals |
Reference period |
| 2007 |
nd |
5,492 |
31,439 |
October 2007 |
| 2008 |
nd |
6,104 |
nd |
December 2008 |
| 2009 |
nd |
6,109 |
35,839 |
October 2009 |
| 2011 |
nd |
6,920 |
35,839 |
March 2011 |
| 2012 |
Census 2010 |
6,895 |
37,629 |
April 2012 |
Reference period for the labor force data: the week prior to the reference period for data collection.
Population of reference: all Qatari and non-Qatari households present in Qatar on the night of survey, living in normal and collective households.
The collective households are a group of persons not related to each other and sharing living conditions in a residential unit, I.e. labor camps, students living boarding schools, nurses in hospitals… etc. The survey covered the small collective households (includes less than 7 persons) and large collective households (includes 7 persons or more).
The survey did not cover short periods accommodation, i.e. hotels.
Unemployed population:
Persons aged 15 years and over who were, during the week preceding the survey, without employment, willing to work and looking seriously for a job.
There is a distinction between two kinds of unemployed persons:
a) First time unemployed: They are the persons who never worked previously, and were during the week preceding the survey looking actively for work.
b) Unemployed who previously worked: They are the persons with a work experience, who during the week preceding the survey were actively looking for a job
2. Institution which provides data
Qatar Statistics Authority (QSA)
English
Arabic
3. Data availability
Most Labour Force Surveys and publications related to the labour force are available on QSA’s website, in PDF format and can be downloaded from:
https://www.mdps.gov.qa/en/statistics1/pages/topicslisting.aspx?parent=Social&child=LaborForce
Annual Bulletin of the Labour Force survey 2012 is available in PDf and Excel formats:
http://www.qix.gov.qa/portal/page/portal/QIXPOC/Documents/QIX%20Knowledge%20Base/Publication/Labor%20Force%20Researches/labor%20force%20sample%20survey/Source_QSA/Labour_Force_Statistics_QSA_Bu_AE_2012.pdf
https://www.mdps.gov.qa/en/statistics1/pages/topicslisting.aspx?parent=Social&child=LaborForce
https://www.mdps.gov.qa/en/statistics1/pages/topicslisting.aspx?parent=Social&child=LaborForce
See also Qatar Information Exchange, an interactive data base compiling data on the labour force taken from available surveys:
http://www.qix.gov.qa/portal/page/portal/qix/subject_area/Statistics?subject_area=183
Date of access: September 2013.
| |
QATARIS |
NON-QATARIS |
|
| Males |
15 – 19 |
20 – 24 |
25 – 29 |
30 – 34 |
35 – 39 |
40 – 44 |
45 – 49 |
50 – 54 |
55 – 59 |
60 – 64 |
>65 |
Total Q. |
15 – 19 |
20 – 24 |
25 – 29 |
30 – 34 |
35 – 39 |
40 – 44 |
45 – 49 |
50 – 54 |
55 – 59 |
60 – 64 |
>65 |
Total N-Q. |
|
| Illiterate |
12 |
49 |
0 |
75 |
14 |
31 |
51 |
169 |
198 |
165 |
976 |
1,740 |
58 |
2,223 |
5,777 |
7,181 |
3,146 |
2,386 |
5,854 |
7,346 |
1,921 |
84 |
91 |
36,067 |
|
| Read & Write |
267 |
399 |
462 |
748 |
425 |
415 |
386 |
863 |
855 |
660 |
1,500 |
6,980 |
3,314 |
35,532 |
56,211 |
56,694 |
47,343 |
48,999 |
19,593 |
5,116 |
2,681 |
450 |
407 |
276,340 |
|
| Primary |
446 |
440 |
409 |
725 |
411 |
695 |
556 |
704 |
631 |
528 |
657 |
6,202 |
2,947 |
23,787 |
33,471 |
33,145 |
30,738 |
15,032 |
14,761 |
7,602 |
5,952 |
2,197 |
2,469 |
172,101 |
|
| Preparatory |
4,217 |
945 |
1,519 |
1,648 |
1,559 |
1,403 |
903 |
942 |
422 |
414 |
535 |
14,507 |
9,809 |
22,091 |
50,000 |
47,222 |
38,282 |
27,069 |
22,044 |
17,651 |
7,433 |
1,923 |
1,639 |
245,163 |
|
| Secondary |
5,802 |
7,112 |
4,111 |
3,390 |
1,978 |
1,699 |
1,042 |
937 |
448 |
52 |
111 |
26,682 |
7,393 |
24,999 |
39,902 |
38,853 |
26,926 |
17,983 |
12,197 |
5,885 |
3,378 |
1,915 |
705 |
180,136 |
|
| Pre.U. Diploma |
85 |
210 |
205 |
224 |
322 |
489 |
323 |
153 |
138 |
113 |
98 |
2,360 |
228 |
8,401 |
10,091 |
10,566 |
9,057 |
8,140 |
3,623 |
2,568 |
893 |
246 |
411 |
54,224 |
|
| University and above |
773 |
2,921 |
3,286 |
3,049 |
2,961 |
3,234 |
2,886 |
2,707 |
1,334 |
785 |
376 |
24,312 |
1,962 |
11,757 |
28,407 |
35,046 |
26,139 |
29,746 |
17,785 |
14,614 |
8,011 |
3,828 |
3,697 |
180,992 |
|
| Total |
11,602 |
12,076 |
9,992 |
9,859 |
7,670 |
7,966 |
6,147 |
6,475 |
4,026 |
2,717 |
4,253 |
82,783 |
25,711 |
128,790 |
223,859 |
228,707 |
181,631 |
149,355 |
95,857 |
60,782 |
30,269 |
10,643 |
9,419 |
1,145,023 |
|
| Females |
|
|
|
|
|
|
|
|
|
|
|
|
|
|
|
|
|
|
|
|
|
|
|
|
|
| Illiterate |
0 |
0 |
39 |
19 |
36 |
598 |
827 |
978 |
1,061 |
869 |
998 |
5,425 |
0 |
145 |
230 |
447 |
521 |
420 |
1,682 |
2,010 |
1,302 |
503 |
1,207 |
8,467 |
|
| Read & Write |
138 |
92 |
136 |
85 |
786 |
708 |
1,201 |
1,138 |
719 |
500 |
1,032 |
6,535 |
892 |
2,398 |
4,671 |
4,015 |
4,055 |
3,918 |
2,522 |
1,310 |
1,036 |
405 |
865 |
26,087 |
|
| Primary |
713 |
409 |
531 |
371 |
508 |
894 |
945 |
997 |
1,174 |
958 |
1,540 |
9,040 |
1,806 |
4,641 |
6,650 |
6,937 |
4,580 |
3,451 |
3,013 |
1,714 |
1,441 |
855 |
928 |
36,016 |
|
| Preparatory |
5,918 |
1,160 |
1,171 |
1,171 |
477 |
213 |
194 |
109 |
201 |
278 |
184 |
11,076 |
16,126 |
10,802 |
6,968 |
4,308 |
3,380 |
2,397 |
1,213 |
941 |
169 |
603 |
183 |
47,090 |
|
| Secondary |
6,519 |
6,438 |
2,956 |
2,641 |
1,614 |
1,228 |
877 |
332 |
195 |
47 |
0 |
22,847 |
7,021 |
10,182 |
9,513 |
7,652 |
6,666 |
5,023 |
2,881 |
2,245 |
1,066 |
304 |
309 |
52,862 |
|
| Pre.U. Diploma |
125 |
178 |
215 |
179 |
156 |
165 |
68 |
84 |
22 |
43 |
19 |
1,254 |
49 |
489 |
1,254 |
2,093 |
1,795 |
1,263 |
856 |
630 |
242 |
214 |
52 |
8,937 |
|
| University and above |
928 |
3,999 |
4,531 |
4,442 |
4,054 |
3,422 |
2,792 |
1,612 |
834 |
259 |
180 |
27,053 |
1,020 |
5,501 |
14,539 |
16,522 |
10,072 |
9,202 |
4,358 |
2,667 |
1,403 |
559 |
201 |
66,044 |
|
| Total |
14,341 |
12,276 |
9,579 |
8,908 |
7,631 |
7,228 |
6,904 |
5,250 |
4,206 |
2,954 |
3,953 |
83,230 |
26,914 |
34,158 |
43,825 |
41,974 |
31,069 |
25,674 |
16,525 |
11,517 |
6,659 |
3,443 |
3,745 |
245,503 |
|
| Total |
|
|
|
|
|
|
|
|
|
|
|
|
|
|
|
|
|
|
|
|
|
|
|
|
|
| Illiterate |
12 |
49 |
39 |
94 |
50 |
629 |
878 |
1,147 |
1,259 |
1,034 |
1,974 |
7,165 |
58 |
2,368 |
6,007 |
7,628 |
3,667 |
2,806 |
7,536 |
9,356 |
3,223 |
587 |
1,298 |
44,534 |
|
| Read & Write |
405 |
491 |
598 |
833 |
1,211 |
1,123 |
1,587 |
2,001 |
1,574 |
1,160 |
2,532 |
13,515 |
4,206 |
37,930 |
60,882 |
60,709 |
51,398 |
52,917 |
22,115 |
6,426 |
3,717 |
855 |
1,272 |
302,427 |
|
| Primary |
1,159 |
849 |
940 |
1,096 |
919 |
1,589 |
1,501 |
1,701 |
1,805 |
1,486 |
2,197 |
15,242 |
4,753 |
28,428 |
40,121 |
40,082 |
35,318 |
18,483 |
17,774 |
9,316 |
7,393 |
3,052 |
3,397 |
208,117 |
|
| Preparatory |
10,135 |
2,105 |
2,690 |
2,819 |
2,036 |
1,616 |
1,097 |
1,051 |
623 |
692 |
719 |
25,583 |
25,935 |
32,893 |
56,968 |
51,530 |
41,662 |
29,466 |
23,257 |
18,592 |
7,602 |
2,526 |
1,822 |
292,253 |
|
| Secondary |
12,321 |
13,550 |
7,067 |
6,031 |
3,592 |
2,927 |
1,919 |
1,269 |
643 |
99 |
111 |
49,529 |
14,414 |
35,181 |
49,415 |
46,505 |
33,592 |
23,006 |
15,078 |
8,130 |
4,444 |
2,219 |
1,014 |
232,998 |
|
| Pre.U. Diploma |
210 |
388 |
420 |
403 |
478 |
654 |
391 |
237 |
160 |
156 |
117 |
3,614 |
277 |
8,890 |
11,345 |
12,659 |
10,852 |
9,403 |
4,479 |
3,198 |
1,135 |
460 |
463 |
63,161 |
|
| University and above |
1,701 |
6,920 |
7,817 |
7,491 |
7,015 |
6,656 |
5,678 |
4,319 |
2,168 |
1,044 |
556 |
51,365 |
2,982 |
17,258 |
42,946 |
51,568 |
36,211 |
38,948 |
22,143 |
17,281 |
9,414 |
4,387 |
3,898 |
247,036 |
|
| Total |
25,943 |
24,352 |
19,571 |
18,767 |
15,301 |
15,194 |
13,051 |
11,725 |
8,232 |
5,671 |
8,206 |
166,013 |
52,625 |
162,948 |
267,684 |
270,681 |
212,700 |
175,029 |
112,382 |
72,299 |
36,928 |
14,086 |
13,164 |
1,390,526 |
1,556,539 |
Source: Labour Force Bulletin 2012
ANNEXED NOTE
1. Technical Notes and Definitions
Sampling frame of LFB 2012: Population Census 2010.
Sample size: 6895 households and 37629 individuals from: 1- Qatari households; 2- Non-Qatari regular (non-collective) households; 3- Non-Qatari small collective households (2 – 6 persons); 4- Non-Qatari large collective households (7 persons or more).
Reference period for data collection: April 2012.
Population of reference: all Qatari and non-Qatari households present in Qatar on the night of survey, living in normal and collective households.
The collective households are a group of persons not related to each other and sharing living conditions in a residential unit, I.e. labor camps, students living boarding schools, nurses in hospitals… etc. The survey covered the small collective households (includes less than 7 persons) and large collective households (includes 7 persons or more).
The survey did not cover short periods accommodation, i.e. hotels.
2. Institution which provides data
Qatar Statistics Authority (QSA)
ENGLISH
ARABIC
3. Data availability
The Statistics Authority conducted the first labor Force Sample Survey in 2001. Starting from 2006, the execution of these surveys came to be on annual basis.
Most Labour Force Surveys and publications related to the labour force are available on QSA’s website, in PDF format and can be downloaded from:
https://www.mdps.gov.qa/en/statistics1/pages/topicslisting.aspx?parent=Social&child=LaborForce
Annual Bulletin of the Labour Force survey 2012 is available in PDf and Excel formats:
http://www.qix.gov.qa/portal/page/portal/QIXPOC/Documents/QIX%20Knowledge%20Base/Publication/Labor%20Force%20Researches/labor%20force%20sample%20survey/Source_QSA/Labour_Force_Statistics_QSA_Bu_AE_2012.pdf
https://www.mdps.gov.qa/en/statistics1/pages/topicslisting.aspx?parent=Social&child=LaborForce
See also Qatar Information Exchange, an interactive data base compiling data on the labour force taken from available surveys:
http://www.qix.gov.qa/portal/page/portal/qix/subject_area/Statistics?subject_area=183
Date of access: September 2013.
|
QATARIS |
NON-QATARIS |
NON-QATARIS |
|
Males |
Females |
Total |
Males |
Females |
Total |
Males |
Females |
Total |
| Illiterate |
1,740 |
5,425 |
7,165 |
36,067 |
8,467 |
44,534 |
37,807 |
13,892 |
51,699 |
| Read & Write |
6,980 |
6,535 |
13,515 |
276,340 |
26,087 |
302,427 |
283,320 |
32,622 |
315,942 |
| Primary |
6,202 |
9,040 |
15,242 |
172,101 |
36,016 |
208,117 |
178,303 |
45,056 |
223,359 |
| Preparatory |
14,507 |
11,076 |
25,583 |
245,163 |
47,090 |
292,253 |
259,670 |
58,166 |
317,836 |
| Secondary |
26,682 |
22,847 |
49,529 |
180,136 |
52,862 |
232,998 |
206,818 |
75,709 |
282,527 |
| Pre.U. Diploma |
2,360 |
1,254 |
3,614 |
54,224 |
8,937 |
63,161 |
56,584 |
10,191 |
66,775 |
| University and above |
24,312 |
27,053 |
51,365 |
180,992 |
66,044 |
247,036 |
205,304 |
93,097 |
298,401 |
| Total |
82,783 |
83,230 |
166,013 |
1,145,023 |
245,503 |
1,390,526 |
1,227,806 |
328,733 |
1,556,539 |
Source: Labour Force Bulletin 2012
ANNEXED NOTE
1. Technical Notes and Definitions
Sampling frame of LFB 2012: Population Census 2010.
Sample size: 6895 households and 37629 individuals from: 1- Qatari households; 2- Non-Qatari regular (non-collective) households; 3- Non-Qatari small collective households (2 – 6 persons); 4- Non-Qatari large collective households (7 persons or more).
Reference period for data collection: April 2012.
Population of reference: all Qatari and non-Qatari households present in Qatar on the night of survey, living in normal and collective households.
The collective households are a group of persons not related to each other and sharing living conditions in a residential unit, I.e. labor camps, students living boarding schools, nurses in hospitals… etc. The survey covered the small collective households (includes less than 7 persons) and large collective households (includes 7 persons or more).
The survey did not cover short periods accommodation, i.e. hotels.
2. Institution which provides data
Qatar Statistics Authority (QSA)
ENGLISH
ARABIC
3. Data availability
The Statistics Authority conducted the first labor Force Sample Survey in 2001. Starting from 2006, the execution of these surveys came to be on annual basis.
Most Labour Force Surveys and publications related to the labour force are available on QSA’s website, in PDF format and can be downloaded from:
https://www.mdps.gov.qa/en/statistics1/pages/topicslisting.aspx?parent=Social&child=LaborForce
Annual Bulletin of the Labour Force survey 2012 is available in PDf and Excel formats:
http://www.qix.gov.qa/portal/page/portal/QIXPOC/Documents/QIX%20Knowledge%20Base/Publication/Labor%20Force%20Researches/labor%20force%20sample%20survey/Source_QSA/Labour_Force_Statistics_QSA_Bu_AE_2012.pdf
https://www.mdps.gov.qa/en/statistics1/pages/topicslisting.aspx?parent=Social&child=LaborForce
See also Qatar Information Exchange, an interactive data base compiling data on the labour force taken from available surveys:
http://www.qix.gov.qa/portal/page/portal/qix/subject_area/Statistics?subject_area=183
Date of access: September 2013.
| University |
Academic year |
Total enrolled |
Graduates |
| |
Kuwaitis |
|
|
Non-Kuwaitis |
|
|
Total |
|
|
Kuwaitis |
|
|
Non-Kuwaitis |
|
|
Total |
|
| males |
females |
total |
males |
females |
total |
males |
females |
total |
males |
females |
total |
males |
females |
total |
males |
females |
total |
| Kuwait University (Public) |
2008/2009 |
18,318 |
40,451 |
58,769 |
2,487 |
4,338 |
6,825 |
20,805 |
44,789 |
65,594 |
995 |
2,412 |
3,407 |
103 |
254 |
357 |
1,098 |
2,666 |
3,764 |
| 2009/2010 |
19,790 |
44,328 |
64,118 |
2,861 |
4,824 |
7,685 |
22,651 |
49,152 |
71,803 |
1,124 |
2,657 |
3,781 |
139 |
282 |
421 |
1,263 |
2,939 |
4,202 |
| 2010/2011 |
22,378 |
49,984 |
72,362 |
3,283 |
5,397 |
8,680 |
25,661 |
55,381 |
81,042 |
1,140 |
2,753 |
3,893 |
120 |
271 |
391 |
1,260 |
3,024 |
4,284 |
| 2011/2012 |
25,506 |
56,211 |
81,717 |
3,800 |
6,143 |
9,943 |
29,306 |
62,354 |
91,660 |
1,199 |
2,875 |
4,074 |
165 |
295 |
460 |
1,364 |
3,170 |
4,534 |
| Private universities and colleges |
2008/2009 |
9,134 |
11,554 |
20,688 |
4,738 |
5,705 |
10,443 |
13,872 |
17,259 |
31,131 |
701 |
753 |
1,454 |
383 |
510 |
893 |
1,084 |
1,263 |
2,347 |
| 2009/2010 |
12,400 |
15,520 |
27,920 |
5,631 |
6,794 |
12,425 |
18,031 |
22,314 |
40,345 |
804 |
793 |
1,597 |
372 |
413 |
785 |
1,176 |
1,206 |
2,382 |
| 2010/2011 |
12,986 |
16,954 |
29,940 |
5,473 |
6,354 |
11,827 |
18,459 |
23,308 |
41,767 |
727 |
831 |
1,558 |
321 |
369 |
690 |
1,048 |
1,200 |
2,248 |
| 2011/2012 |
12818* |
16803* |
29621* |
5516* |
6453* |
11969* |
18334* |
23256* |
41590* |
314** |
443** |
757** |
154** |
144** |
298** |
468** |
587** |
1055** |
| Total |
2008/2009 |
27,452 |
52,005 |
79,457 |
7,225 |
10,043 |
17,268 |
34,677 |
62,048 |
96,725 |
1,696 |
3,165 |
4,861 |
486 |
764 |
1,250 |
2,182 |
3,929 |
6,111 |
| 2009/2010 |
32,190 |
59,848 |
92,038 |
8,492 |
11,618 |
20,110 |
40,682 |
71,466 |
112,148 |
1,928 |
3,450 |
5,378 |
511 |
695 |
1,206 |
2,439 |
4,145 |
6,584 |
| 2010/2011 |
35,364 |
66,938 |
102,302 |
8,756 |
11,751 |
20,507 |
44,120 |
78,689 |
122,809 |
1,867 |
3,584 |
5,451 |
441 |
640 |
1,081 |
2,308 |
4,224 |
6,532 |
| 2011/2012 |
38,324 |
73,014 |
111,338 |
9,316 |
12,596 |
21,912 |
47,640 |
85,610 |
133,250 |
1,513 |
3,318 |
4,831 |
319 |
439 |
758 |
1,832 |
3,757 |
5,589 |
Source: Ministry of Higher Education
*does not comprise the figures of registered students enrolled for Summer semester
** Data for the first semester only
ANNEXED NOTE
“Enrolled students” refers to the students classified as “newly admitted” and “registered” for the academic years 2008-2009 to 2011-2012.
“Graduates” includes Bachelor, Diploma and Master Degree graduates.
Institution which provides data
Kuwaiti Ministry of Higher Education.
Data availability
Published in Kuwaiti CSB’ annual Statistical Reviews, in chapter “Education”, as well as in the Annual Statistical Abstracts, in chapter “Educational Services”
Annual Statistical Abstracts are available online at: http://www.csb.gov.kw/Socan_Statistic_EN.aspx?ID=18 (website in English) and at http://www.csb.gov.kw/Socan_Statistic.aspx (Arabic website).
Volumes are bilingual (English and Arabic). Starting with 2000′ issue, yearbooks are published online in PDF format; a selection of 1964 to 1999 printed volumes is also available in one online publication.
Date of access: August 2013.
| Nationality group |
TOTAL |
| Kuwaitis |
1.212.436 |
| Arabs |
1.064.607 |
| Asians |
1.440.511 |
| Africans |
67.363 |
| Europeans |
13.534 |
| North Americans |
22.208 |
| South Americans |
1.448 |
| Australians- Oceanians |
1.621 |
| Total non-Kuwaitis |
2.611.292 |
| Grand total |
3.823.728 |
Source: PACI
ANNEXED NOTE
1. Characteristics of data and definitions
The source of data used here is the Public Authority for Civil Information (PACI), an independant government body in charge of :
1- centralising all population and labour force data in order to manage a fully computerised population register
2- issuing mandatory civil identification cards to every resident of the country, regardless of age and nationality.
The other source of demographic and socioeconomic data on Kuwait is the Central Statistical Office (CSO), operating within the Planning Ministry. The CSO has conducted ten population and housing censuses since its inception in 1957.
Since 1995 a marked discrepancy was witnessed between PACI’ and CSO’ population figures. PACI’ database is connected electronically with other administrations and bodies registering demographic events and professional/ residency issues (births and death; departures and arrivals; end of service, residency and ID deliveries, etc.).
PACI’s records of residents’ movements is thus regularly updated, which limits the risk of population overcount. Therefore, it is more likely that residents were undercounted during CSO- Ministry of Planning’s census operations (see: Shah, N. Population of Kuwait. Structure and Dynamics, Kuwait: Kuwait University Academic Publication Council, 2010, chapter 1).
(a) Kuwaiti: the Kuwaiti nationality rests upon a document of Kuwaiti nationality or a certificate proving Kuwaiti nationality issued by the Ministry of Interior of Kuwait.
(b) Non-Kuwaiti: his/ her nationality is determined by the name of the State which issued the passport. The foreign national also entered Kuwait legally and has a stamp of residence.
This category also includes the Bidoon, a category of stateless persons living in the Emirate. Kuwait’s Bidoon population originates from three broad categories:
1) those whose ancestors failed to apply for nationality or lacked necessary documentation at the time of Kuwait’s independence in 1961;
2) those recruited to work in Kuwait’s army or police force during the 1960s who permanently settled in Kuwait, along with their families;
3) children of Kuwaiti mothers and stateless or foreign fathers (see Human Rights Watch. Prisoners of the Past. Kuwaiti Bidun and the Burden of Statelessness, June 2011, p. 3).
(c) Nationality group: collected according to the nationality of the head of the household.
Nationalities are grouped according to specific features common to certain population subgroups: language, geographic origin, etc. or according to internationally recognized categories such as: (Arab / non-Arab Asian countries / non-Arab African countries; European countries … etc.).
2. Institution which provides data
The Public Authority for Civil Information (PACI)
3. Period of data coverage: December 2012
The database is updated three times a year and the website presents only the most recent data.
4. Data availability
The statistics section of PACI’s website (http://www.paci.gov.kw/en/ (English); http://www.paci.gov.kw/ (Arabic)) provides population and socio-economic data broken down by nationality (Kuwaiti/ non-Kuwaiti). Some data are displayed by nationality groups.
Analytical tables and data crosstabulations are available for download in PDF, html, .png and Excel (.csv) formats.
Date of access: June 2013.
| |
Activity status |
In the labour Force |
Out of the Labour Force |
|
Total |
|
| year |
|
Male |
Female |
Total |
Male |
Female |
Total |
Male |
Female |
Total |
| |
Saudis |
2.559.360 |
460.786 |
3.020.146 |
1.427.869 |
3.765.464 |
5.193.333 |
3.987.229 |
4.226.250 |
8.213.479 |
| 2002 |
Non-Saudis |
2.566.431 |
431.851 |
2.998.282 |
246.192 |
722.603 |
968.795 |
2.812.623 |
1.154.454 |
3.967.077 |
| |
Total |
5.125.791 |
892.637 |
6.018.428 |
1.674.061 |
4.488.067 |
6.162.128 |
6.799.852 |
5.380.704 |
12.180.556 |
| |
Saudis |
3.228.840 |
660.637 |
3.889.477 |
1.791.603 |
4.359.533 |
6.151.136 |
5.020.443 |
5.020.170 |
10.040.613 |
| 2007 R1 |
Non-Saudis |
3.536.929 |
600.077 |
4.137.006 |
202.950 |
748.739 |
951.689 |
3.739.879 |
1.348.816 |
5.088.695 |
| |
Total |
6.765.769 |
1.260.714 |
8.026.483 |
1.994.553 |
5.108.272 |
7.102.825 |
8.760.322 |
6.368.986 |
15.129.308 |
| |
Saudis |
3.760.573 |
935.327 |
4.695.900 |
2.048.850 |
4.898.860 |
6.947.710 |
5.809.423 |
5.834.187 |
11.643.610 |
| 2012 R1 |
Non-Saudis |
5.085.230 |
698.758 |
5.783.988 |
274.577 |
1.140.336 |
1.414.913 |
5.359.807 |
1.839.094 |
7.198.901 |
| |
Total |
8.845.803 |
1.634.085 |
10.479.888 |
2.323.427 |
6.039.196 |
8.362.623 |
11.169.230 |
7.673.281 |
18.842.511 |
Source: Manpower Surveys 2002; 2007 Round 1; 2012 Round 1.
ANNEXED NOTE
1. Technical Notes and Definitions
| |
sampling |
sample size |
|
| Survey |
frame |
(households) |
reference period |
| 2002 |
Census 1992 |
15.000 |
April 2002 |
| 2007 R1 |
Census 2004 |
23.000 |
February 19th-March 20th, 2007 |
| 2012 R1 |
Census 2010 |
29.000 |
January 25th-February 17th, 2012 |
Population of reference: all individuals (nationals and non-nationals) residing in the Kingdom during the period of reference.
The ultimate sampling unit is the household.
(a) Working age population: the population aged 15 to 60 (retirement age for Saudis), even though (as of mid-2013) there is no maximum working age on foreign nationals.
(b) Person in the labour force: a person aged 15 years and over, employed or unemployed. Here, concerned population is aged 15 to 60 years.
(c) Person out of the labour force: A person aged 15 years and over who is not included in the labour force, among which: the persons staying home for domestics activities, the students, the retired, the self sufficients,
the ones unable to enrol in labour, who are not working and do not look for employment for any other reason. Here, concerned population is aged 15 to 60 years.
2. Institution which provides data
Central Department of Statistics and Information (CDSI), Ministry and Economy and Planning
3. Data availability
Surveys conducted since 1999 are available on the website of the CDSI (http://www.cdsi.gov.sa/), in published form in PDF format. A selection of tables is also available in PDF or Excel format.
https://www.stats.gov.sa/en/814 (website English version) or https://www.stats.gov.sa/ar/814 (website Arabic version). The technical notes and tables of contents are in Arabic and the tables are in both languages.
Date of access: May 2013.
| Place of |
Nationality |
| birth |
Kuwaitis |
Non-Kuwaitis |
| Outside Kuwait |
38.318 |
1.948.785 |
| In Kuwait |
659.019 |
228.815 |
| Total |
697.337 |
2.177.600 |
Source: PACI
ANNEXED NOTE
1. Characteristics of data and definitions
The source of data used here is the Public Authority for Civil Information (PACI), an independant government body in charge of :
1- centralising all population and labour force data in order to manage a fully computerised population register
2- issuing mandatory civil identification cards to every resident of the country, regardless of age and nationality.
The other source of demographic and socioeconomic data on Kuwait is the Central Statistical Office (CSO), operating within the Planning Ministry. The CSO has conducted ten population and housing censuses since its inception in 1957.
Since 1995 a marked discrepancy was witnessed between PACI’ and CSO’ population figures. PACI’ database is connected electronically with other administrations and bodies registering demographic events and professional/ residency issues (births and death; departures and arrivals; end of service, residency and ID deliveries, etc.).
PACI’s records of residents’ movements is thus regularly updated, which limits the risk of population overcount. Therefore, it is more likely that residents were undercounted during CSO- Ministry of Planning’s census operations (see: Shah, N. Population of Kuwait. Structure and Dynamics, Kuwait: Kuwait University Academic Publication Council, 2010, chapter 1).
(a) Kuwaiti: the Kuwaiti nationality rests upon a document of Kuwaiti nationality or a certificate proving Kuwaiti nationality issued by the Ministry of Interior of Kuwait.
(b) Non-Kuwaiti: his/ her nationality is determined by the name of the State which issued the passport. The foreign national also entered Kuwait legally and has a stamp of residence.
This category includes the Bidoon, a category of stateless persons living in the Emirate. Kuwait’s Bidoon population originates from three broad categories:
1) those whose ancestors failed to apply for nationality or lacked necessary documentation at the time of Kuwait’s independence in 1961;
2) those recruited to work in Kuwait’s army or police force during the 1960s who permanently settled in Kuwait, along with their families;
3) children of Kuwaiti mothers and stateless or foreign fathers (see Human Rights Watch. Prisoners of the Past. Kuwaiti Bidun and the Burden of Statelessness, June 2011, p. 3).
(c) Working age population: population aged 15 to 60.
2. Institution which provides data
The Public Authority for Civil Information (PACI)
3. Period of data coverage: December 2012
The database is updated three times a year and the website presents only the most recent data.
4. Data availability
The statistics section of PACI’s website (http://www.paci.gov.kw/en/ (English); http://www.paci.gov.kw/ (Arabic)) provides population and socio-economic data broken down by nationality (Kuwaiti/ non-Kuwaiti). Some data are displayed by nationality groups.
Analytical tables and data crosstabulations are available for download in PDF, html, .png and Excel (.csv) formats.
Date of access: June 2013.
| |
administrative deportations |
legal deportations |
Total deportations |
| year |
All charges |
Residence law violations |
All charges |
Residence law violations |
All charges |
Residence law violations |
| 2008 |
20.457 |
15.467 |
819 |
28 |
21.276 |
15.495 |
| 2009 |
23.024 |
16.141 |
925 |
24 |
23.949 |
16.165 |
| 2010 |
24.138 |
9.750 |
1.011 |
33 |
25.149 |
9.783 |
| 2011 |
14.679 |
4.708 |
1.242 |
54 |
15.921 |
4.762 |
Source: Ministry of Interior; Ministry of Justice
ANNEXED NOTE
1. Definitions
all charges’ includes ‘residence law violation’
The Interior Minister can issue an order to deport a foreigner in the following cases:
1. If there is a court ruling ordering the deportation of the foreigner after serving a prison sentence (legal deportation).
2. If his/her presence in the country is judged detrimental to public order and security and 3. If he/she does not have an apparent source of income (administrative deportation). The foreigner is then turned over to the Deportation Department, upon decision from the Ministry of Interior.
A deported foreigner will have his dependent family deported with him. Once the deported foreigner leaves the country, he/she is not allowed back to Kuwait, unless the Interior Minister issues amnesty or pardon.
2. Institution which provides data
Central Statistical Bureau (CSB), Ministry of Planning
3. Data availability
Published in the CSB’ Statistical Yearbooks, in Chapter “Social Services and Security”
Statistical Yearbooks are available online at: http://www.csb.gov.kw/Socan_Statistic_EN.aspx?ID=18 (website in English) and at http://www.csb.gov.kw/Socan_Statistic.aspx (Arabic website).
Volumes are bilingual (English and Arabic). Every Yearbook is published in PDF format since 2000 and a selection of 1964 to 1999 volumes is also available in one publication.
Date of access: August 2013.
| |
|
|
Kuwaitis |
|
|
Non-Kuwaitis |
|
|
Total |
|
| |
Academic year |
males |
females |
total |
males |
females |
total |
males |
females |
total |
| Kuwait University (Public) |
2008/2009 |
1618 |
3572 |
5.190 |
236 |
386 |
622 |
1.854 |
3.958 |
5.812 |
| 2009/2010 |
1936 |
4097 |
6.033 |
283 |
458 |
741 |
2.219 |
4.555 |
6.774 |
| 2010/2011 |
2.418 |
4.970 |
7.388 |
318 |
525 |
843 |
2.736 |
5.495 |
8.231 |
| 2011/2012 |
3.019 |
5.495 |
8.514 |
402 |
609 |
1.011 |
3.421 |
6.104 |
9.525 |
| Private universities and colleges |
2008/2009 |
1.575 |
2.076 |
3.651 |
660 |
703 |
1.363 |
2.235 |
2.779 |
5.014 |
| 2009/2010 |
2.044 |
2.291 |
4.335 |
878 |
993 |
1.871 |
2.922 |
3.284 |
6.206 |
| 2010/2011 |
2.152 |
2.411 |
4.563 |
698 |
676 |
1.374 |
2.850 |
3.087 |
5.937 |
| 2011/2012 |
2.745 |
3.175 |
5.920 |
1.234 |
1.278 |
2.512 |
3.979 |
4.453 |
8.432 |
| Total |
2008/2009 |
3.193 |
5.648 |
8.841 |
896 |
1.089 |
1.985 |
4.089 |
6.737 |
10.826 |
| 2009/2010 |
3.980 |
6.388 |
10.368 |
1.161 |
1.451 |
2.612 |
5.141 |
7.839 |
12.980 |
| 2010/2011 |
4.570 |
7.381 |
11.951 |
1.016 |
1.201 |
2.217 |
5.586 |
8.582 |
14.168 |
| 2011/2012 |
5.764 |
8.670 |
14.434 |
1.636 |
1.887 |
3.523 |
7.400 |
10.557 |
17.957 |
Source: Ministry of Higher Education
ANNEXED NOTE
The table refers to the students classified as “newly admitted” for the academic years 2010-2011 and 2011-2012.
Institution which provides data
Kuwaiti Ministry of Higher Education.
Data availability
Published in the CSB’ Statistical Yearbooks, in Chapter “Educational Services”
Statistical Yearbooks are available online at: http://www.csb.gov.kw/Socan_Statistic_EN.aspx?ID=18 (website in English) and at http://www.csb.gov.kw/Socan_Statistic.aspx (Arabic website).
Volumes are bilingual (English and Arabic). Starting with 2000′ issue, yearbooks are published online in PDF format; a selection of 1964 to 1999 printed volumes is also available in one online publication.
Date of access: August 2013.
| Nationality group |
|
age group |
Total |
| year |
15-30 |
31-40 |
41-50 |
50 and more |
| Arabs |
2009 |
1.171 |
687 |
575 |
310 |
2.743 |
| |
2011 |
1.350 |
666 |
514 |
275 |
2.805 |
| Europeans/ Americans |
2009 |
3 |
3 |
0 |
2 |
8 |
| |
2011 |
5 |
2 |
3 |
1 |
11 |
| Asians |
2009 |
386.058 |
117.208 |
22.300 |
2.102 |
527.668 |
| |
2011 |
395.643 |
108.814 |
17.658 |
1.635 |
523.750 |
| Africans |
2009 |
23.516 |
274 |
82 |
23 |
23.895 |
| |
2011 |
66.307 |
308 |
75 |
16 |
66.706 |
| Total |
2009 |
410.748 |
118.172 |
22.957 |
2.437 |
554.314 |
| |
2011 |
463.305 |
109.790 |
18.250 |
1.927 |
593.272 |
Source: Ministry of Interior
ANNEXED NOTE
1. Definitions
Residency procedures do not apply to GCC nationals.
The bidoun, a stateless population, are not included in the residency documents holders.
Data presented in the table are stock data: non-national residents holding a residence permit under Article 20 (domestic labor) on December 31st, the given year. The table excludes the Bedoon, the non-Kuwaiti GCC citizens and those in irregular situation.
2. Institution which provides data
Ministry of Interior
3. Period of data coverage
December 31st, 2009 and 2011
4. Data availability
2009′ data is published in MoI’ 2009 Statistical Yearbook, in Chapter “Immigration statistics”, available online at: http://www.moi.gov.kw/portal/varabic/statistics/stats.htm
Last date of access: September 2013.
2011′ data is tabulated in MoI’ 2011 Statistical Yearbook, in Chapter “Immigration statistics” (not available online). The volume may be directly obtained from MoI.
| Nationality group |
|
age group |
Total |
| year |
15-30 |
31-40 |
41-50 |
50 and more |
| Arabs |
2009 |
236.897 |
86.630 |
37.757 |
11.755 |
373.039 |
| |
2011 |
255.915 |
78.961 |
32.763 |
9.608 |
377.247 |
| Europeans/ Americans |
2009 |
6.346 |
4.864 |
3.584 |
1.338 |
16.132 |
| |
2011 |
6.812 |
4.714 |
3.266 |
998 |
15.790 |
| Asians |
2009 |
365.276 |
155.206 |
67.566 |
13.791 |
601.839 |
| |
2011 |
405.273 |
145.939 |
59.364 |
10.680 |
621.256 |
| Africans |
2009 |
1.475 |
597 |
271 |
59 |
2.402 |
| |
2011 |
3.141 |
520 |
227 |
52 |
3.940 |
| Total |
2009 |
609.994 |
247.297 |
109.178 |
26.943 |
993.412 |
| |
2011 |
671.141 |
230.134 |
95.620 |
21.338 |
1.018.233 |
Source: Ministry of Interior
ANNEXED NOTE
1. Definitions
Residency procedures do not apply to GCC nationals.
The bidoun, a stateless population, are not included in the residency documents holders.
Data presented in the table are stock data: non-national residents holding a residence permit under Article 18 (non-governmetal labor) on December 31st, the given year. The table excludes the Bedoon, the non-Kuwaiti GCC citizens and those in irregular situation.
2. Institution which provides data
Ministry of Interior
3. Period of data coverage
December 31st, 2009 and 2011
4. Data availability
2009′ data is published in MoI’ 2009 Statistical Yearbook, in Chapter “Immigration statistics”, available online at: http://www.moi.gov.kw/portal/varabic/statistics/stats.htm
Last date of access: September 2013.
2011′ data is tabulated in MoI’ 2011 Statistical Yearbook, in Chapter “Immigration statistics” (not available online). The volume may be directly obtained from MoI.
| reference of permit |
14 |
17-18-19 |
20 |
22 |
23-24 |
Total permits |
| type/ purpose |
Temporary |
Labour |
Domestic help |
Dependant |
Other permits |
| of permit |
| |
| year |
males |
females |
total |
males |
females |
total |
males |
females |
total |
males |
females |
total |
males |
females |
total |
males |
females |
total |
| 2001 |
32,881 |
19,081 |
51,962 |
42,925 |
3,814 |
46,739 |
10,401 |
35,081 |
45,482 |
3,142 |
5,988 |
9,130 |
1,558 |
96 |
1,654 |
90,907 |
64,060 |
154,967 |
| 2002 |
49,559 |
33,460 |
83,019 |
49,260 |
4,320 |
53,580 |
9,374 |
28,476 |
37,850 |
3,327 |
5,781 |
9,108 |
1,389 |
59 |
1,448 |
112,909 |
72,096 |
185,005 |
| 2003 |
55,055 |
24,291 |
79,346 |
93,589 |
7,876 |
101,465 |
10,827 |
24,865 |
35,692 |
4,101 |
6,780 |
10,881 |
623 |
77 |
700 |
164,195 |
63,889 |
228,084 |
| 2004 |
141,923 |
48,378 |
190,301 |
117,924 |
10,660 |
128,584 |
35,147 |
71,452 |
106,599 |
5,429 |
8,153 |
13,582 |
280 |
232 |
512 |
300,703 |
138,875 |
439,578 |
| 2005 |
183,631 |
45,707 |
229,338 |
150,667 |
11,549 |
162,216 |
43,231 |
71,897 |
115,128 |
6,660 |
9,218 |
15,878 |
340 |
200 |
540 |
384,529 |
138,571 |
523,100 |
| 2006 |
157,878 |
36,626 |
194,504 |
152,617 |
10,942 |
163,559 |
43,899 |
74,444 |
118,343 |
5,489 |
8,678 |
14,167 |
300 |
130 |
430 |
360,183 |
130,820 |
491,003 |
| 2007 |
22,709 |
81,045 |
103,754 |
7,870 |
86,603 |
94,473 |
75,088 |
37,696 |
112,784 |
7,875 |
4,538 |
12,413 |
123 |
345 |
468 |
113,665 |
210,227 |
323,892 |
| 2008 |
48,490 |
16,566 |
65,056 |
82,803 |
6,567 |
89,370 |
28,088 |
64,213 |
92,301 |
4,291 |
8,297 |
12,588 |
168 |
47 |
215 |
163,840 |
95,690 |
259,530 |
| 2009 |
54,941 |
13,160 |
68,101 |
89,180 |
6,738 |
95,918 |
21,453 |
57,027 |
78,480 |
3,674 |
6,232 |
9,906 |
72 |
35 |
107 |
169,320 |
83,192 |
252,512 |
| 2010 |
81,999 |
17,534 |
99,533 |
119,478 |
10,162 |
129,640 |
20,378 |
61,792 |
82,170 |
2,974 |
5,477 |
8,451 |
146 |
53 |
199 |
224,975 |
95,018 |
319,993 |
| 2011 |
61,269 |
11,992 |
73,261 |
59,483 |
5,288 |
64,771 |
15,643 |
46,859 |
62,502 |
2,393 |
4,493 |
6,886 |
91 |
56 |
147 |
138,879 |
68,688 |
207,567 |
| 2012 |
59,906 |
8,486 |
68,392 |
52,453 |
4,978 |
57,431 |
12,456 |
32,744 |
45,200 |
2,638 |
4,874 |
7,512 |
68 |
35 |
103 |
127,521 |
51,117 |
178,638 |
| 2013 |
47,665 |
6,757 |
54,422 |
39,895 |
3,924 |
43,819 |
8,068 |
18,044 |
26,112 |
4,323 |
8,114 |
12,437 |
36 |
27 |
63 |
99,987 |
36,866 |
136,853 |
Source: Ministry of Interior’s records
ANNEXED NOTE
1. Definitions
The table refers to all types of residency permits, i.e. granted under articles 14, 17, 18, 19, 20, 22, 23, 24 of the immigration regulations, cancelled during the given years.
A residence visa is cancelled if the holder leaves Kuwait for a continuous period of six months, after termination of his employment period or not. The only exceptions are for those who:
· Are studying abroad
· Are receiving necessary treatment abroad, or
· Are required by virtue of their work to be abroad,
In all three cases, permission has to be obtained before leaving Kuwait.
The bidoun, a stateless population, are not included in the residency documents holders.
Residency procedures do not apply to GCC nationals.
2. Institution which provides data
Ministry of Interior (MoI) and Central Statistical Bureau (CSB), Ministry of Planning.
3. Period of data coverage
January 1st- December 31st, given years
4. Data availability
a- 2005-2009′ data is published in MoI’ 2009 Statistical Yearbook, in Chapter “Immigration statistics”, available online at: http://www.moi.gov.kw/portal/varabic/statistics/stats.htm
Last date of access: Sept.3rd, 2013.
b- 2007-2011′ data is tabulated in MoI’ 2011 Statistical Yearbook, in Chapter “Immigration statistics” (not available online). The volume may be directly obtained from MoI.
c- 2001-2010′ data is also available in the “Annual Bulletins of Social Statistics”, given years (data is not disagregated by nationality group or by citizenship of permit holder), available for download in PDF format of Central Statistical Bureau (CSB) website.
http://www.csb.gov.kw/Socan_Statistic_EN.aspx?ID=38
d- 2010-2013′ data is available in the report “Migration Statistics 2013”, published by the CSB.
The report (in Arabic, PDF format with Excel tables) is available on CSB’s website (Population Statistics, then Migration Statistics)
http://www.csb.gov.kw/Socan_Statistic.aspx?ID=56
Date of access: May 2015.
| Category of issuance |
reference of permit |
14 |
17-18-19 |
20 |
22 |
23-24 |
Total permits |
| type/ purpose |
Temporary |
Labour |
Domestic help |
Dependant |
Other permits |
| of permit |
| |
| year |
males |
females |
total |
males |
females |
total |
males |
females |
total |
males |
females |
total |
males |
females |
total |
males |
females |
total |
| First issuance |
2001 |
28.187 |
16.605 |
44.792 |
27.018 |
3.120 |
30.138 |
5.116 |
8.519 |
13.635 |
2.476 |
6.482 |
8.958 |
96 |
45 |
141 |
62.893 |
34.771 |
97.664 |
| 2002 |
28.417 |
20.216 |
48.633 |
40.060 |
4.749 |
44.809 |
4.607 |
8.691 |
13.298 |
2.298 |
7.043 |
9.341 |
99 |
42 |
141 |
75.481 |
40.741 |
116.222 |
| 2003 |
16.440 |
3.372 |
19.812 |
305.086 |
27.959 |
333.045 |
36.139 |
39.232 |
75.371 |
25.379 |
61.753 |
87.132 |
904 |
413 |
1.317 |
383.948 |
132.729 |
516.677 |
| 2004 |
86.548 |
31.531 |
118.079 |
128.487 |
12.356 |
140.843 |
17.711 |
24.256 |
41.967 |
5.124 |
13.584 |
18.708 |
143 |
70 |
213 |
238.013 |
81.797 |
319.810 |
| 2005 |
119.118 |
23.351 |
142.469 |
144.588 |
11.441 |
156.029 |
23.127 |
27.049 |
50.176 |
5.640 |
15.643 |
21.283 |
179 |
71 |
250 |
292.652 |
77.555 |
370.207 |
| 2006 |
173.381 |
64.089 |
237.470 |
161.119 |
12.404 |
173.523 |
21.130 |
25.509 |
46.639 |
4.706 |
12.890 |
17.596 |
295 |
84 |
379 |
360.631 |
114.976 |
475.607 |
| 2007 |
89.922 |
132.117 |
222.039 |
8.585 |
93.737 |
102.322 |
20.918 |
13.916 |
34.834 |
10.117 |
3.448 |
13.565 |
73 |
90 |
163 |
129.615 |
243.308 |
372.923 |
| 2008 |
120.348 |
79.592 |
199.940 |
55.226 |
5.886 |
61.112 |
12.021 |
17.234 |
29.255 |
3.133 |
9.290 |
12.423 |
61 |
35 |
96 |
190.789 |
112.037 |
302.826 |
| 2009 |
107.386 |
63.309 |
170.695 |
61.404 |
5.310 |
66.714 |
10.874 |
16.384 |
27.258 |
2.932 |
8.390 |
11.322 |
55 |
29 |
84 |
182.651 |
93.422 |
276.073 |
| 2010 |
146.670 |
71.315 |
217.985 |
80.968 |
7.925 |
88.893 |
11.707 |
18.770 |
30.477 |
2.621 |
7.382 |
10.003 |
105 |
66 |
171 |
242.071 |
105.458 |
347.529 |
| 2011 |
88.203 |
51.805 |
140.008 |
63.265 |
5.679 |
68.944 |
10.194 |
16.581 |
26.775 |
2.362 |
6.396 |
8.758 |
91 |
110 |
201 |
164.115 |
80.571 |
244.686 |
| Renewal |
2001 |
18.583 |
10.222 |
28.805 |
313.907 |
27.619 |
341.526 |
40.601 |
50.871 |
91.472 |
18.260 |
45.094 |
63.354 |
967 |
404 |
1.371 |
392.318 |
134.210 |
526.528 |
| 2002 |
7.687 |
4.748 |
12.435 |
311.919 |
28.971 |
340.890 |
36.308 |
44.493 |
80.801 |
22.249 |
55.577 |
77.826 |
527 |
364 |
891 |
378.690 |
134.153 |
512.843 |
| 2003 |
45.663 |
22.313 |
67.976 |
69.203 |
3.056 |
72.259 |
17.944 |
27.505 |
45.449 |
7.498 |
10.303 |
17.801 |
349 |
48 |
397 |
140.657 |
63.225 |
203.882 |
| 2004 |
42.707 |
9.252 |
51.959 |
275.919 |
24.644 |
300.563 |
80.355 |
89.562 |
169.917 |
24.880 |
62.281 |
87.161 |
924 |
443 |
1.367 |
424.785 |
186.182 |
610.967 |
| 2005 |
62.848 |
11.877 |
74.725 |
307.573 |
27.653 |
335.226 |
86.543 |
93.622 |
180.165 |
30.013 |
66.368 |
96.381 |
790 |
314 |
1.104 |
487.767 |
199.834 |
687.601 |
| 2006 |
96.227 |
19.562 |
115.789 |
320.305 |
30.961 |
351.266 |
103.602 |
98.401 |
202.003 |
38.431 |
77.491 |
115.922 |
881 |
411 |
1.292 |
559.446 |
226.826 |
786.272 |
| 2007 |
55.410 |
18.336 |
73.746 |
408.907 |
36.382 |
445.289 |
127.937 |
117.014 |
244.951 |
39.042 |
86.858 |
125.900 |
845 |
409 |
1.254 |
632.141 |
258.999 |
891.140 |
| 2008 |
52.196 |
18.684 |
70.880 |
491.239 |
44.840 |
536.079 |
116.849 |
123.767 |
240.616 |
48.498 |
106.517 |
155.015 |
770 |
448 |
1.218 |
709.552 |
294.256 |
1.003.808 |
| 2009 |
27.513 |
6.388 |
33.901 |
466.450 |
46.782 |
513.232 |
99.001 |
110.756 |
209.757 |
57.688 |
120.214 |
177.902 |
757 |
498 |
1.255 |
651.409 |
284.638 |
936.047 |
| 2010 |
55.919 |
9.733 |
65.652 |
406.014 |
47.306 |
453.320 |
110.746 |
132.125 |
242.871 |
64.042 |
123.159 |
187.201 |
771 |
597 |
1.368 |
637.492 |
312.920 |
950.412 |
| 2011 |
49.764 |
9.476 |
59.240 |
487.291 |
55.450 |
542.741 |
103.130 |
132.173 |
235.303 |
71.479 |
146.192 |
217.671 |
894 |
638 |
1.532 |
712.558 |
343.929 |
1.056.487 |
| Total |
2001 |
46.770 |
26.827 |
73.597 |
340.925 |
30.739 |
371.664 |
45.717 |
59.390 |
105.107 |
20.736 |
51.576 |
72.312 |
1.063 |
449 |
1.512 |
455.211 |
168.981 |
624.192 |
| 2002 |
36.104 |
24.964 |
61.068 |
351.979 |
33.720 |
385.699 |
40.915 |
53.184 |
94.099 |
24.547 |
62.620 |
87.167 |
626 |
406 |
1.032 |
454.171 |
174.894 |
629.065 |
| 2003 |
62.103 |
25.685 |
87.788 |
374.289 |
31.015 |
405.304 |
54.083 |
66.737 |
120.820 |
32.877 |
72.056 |
104.933 |
1.253 |
461 |
1.714 |
524.605 |
195.954 |
720.559 |
| 2004 |
129.255 |
40.783 |
170.038 |
404.406 |
37.000 |
441.406 |
98.066 |
113.818 |
211.884 |
30.004 |
75.865 |
105.869 |
1.067 |
513 |
1.580 |
662.798 |
267.979 |
930.777 |
| 2005 |
181.966 |
35.228 |
217.194 |
452.161 |
39.094 |
491.255 |
109.670 |
120.671 |
230.341 |
35.653 |
82.011 |
117.664 |
969 |
385 |
1.354 |
780.419 |
277.389 |
1.057.808 |
| 2006 |
269.608 |
83.651 |
353.259 |
481.424 |
43.365 |
524.789 |
124.732 |
123.910 |
248.642 |
43.137 |
90.381 |
133.518 |
1.176 |
495 |
1.671 |
920.077 |
341.802 |
1.261.879 |
| 2007 |
145.332 |
150.453 |
295.785 |
417.492 |
130.119 |
547.611 |
148.855 |
130.930 |
279.785 |
49.159 |
90.306 |
139.465 |
918 |
499 |
1.417 |
761.756 |
502.307 |
1.264.063 |
| 2008 |
172.544 |
98.276 |
270.820 |
546.465 |
50.726 |
597.191 |
128.870 |
141.001 |
269.871 |
51.631 |
115.807 |
167.438 |
831 |
483 |
1.314 |
900.341 |
406.293 |
1.306.634 |
| 2009 |
134.899 |
69.697 |
204.596 |
527.854 |
52.092 |
579.946 |
109.875 |
127.140 |
237.015 |
60.620 |
128.604 |
189.224 |
812 |
527 |
1.339 |
834.060 |
378.060 |
1.212.120 |
| 2010 |
202.589 |
81.048 |
283.637 |
486.982 |
55.231 |
542.213 |
122.453 |
150.895 |
273.348 |
66.663 |
130.541 |
197.204 |
876 |
663 |
1.539 |
879.563 |
418.378 |
1.297.941 |
| 2011 |
137.967 |
61.281 |
199.248 |
550.556 |
61.129 |
611.685 |
113.324 |
148.754 |
262.078 |
73.841 |
152.588 |
226.429 |
985 |
748 |
1.733 |
876.673 |
424.500 |
1.301.173 |
Source: Ministry of Interior’s records
ANNEXED NOTE
1. Definitions
Temporary permit: An expatriate may be granted temporary residence under article 14 of the immigration regulations in special cases where he does not need or cannot get ordinary residence.
This allows the expatriate to stay for up to one year, for personal emergencies such as illness, or after resignation from employment in order to settle financial affairs or a court case.
Dependent permit: spouse, children or elderly dependent relatives can join visa holder (sponsor) in Kuwait, if the expatriate has obtained a residency and is earning a minimum of KD250 a month (private and governement sector alike).
A working wife cannot sponsor her husband as a dependent. Also, sons over the age of 21 years cannot be sponsored as dependants, though adult daughters and parents may be permitted. Dependent family members are not allowed to work on a Dependent Visa, unless they transfer it into a work visa under Kuwaiti sponsorship. This can be done only after 6 to 12 months of holding a dependent visa.
Every children including new born babies must hold a residency permit. The application for the infant’s residence must be made within 60 days of the birth
The Dependent Visa holder is permitted to stay as long as the sponsor holds a valid visa.
Self residence permit: Expatriates may sponsor themselves under article 24 of the regulations and obtain a residence for two to five years under several conditions
(among which: being aged 60 and more, having worked no less than 25 years in Kuwait, owning a capital of 10000 KD at least; being able to produce a certificate of good conduct, being effectively residing in Kuwait with his/her family, etc.).
This form of residence can be renewed upon expiry. Self-sponsored expatriates may sponsor their wives and children.
Permits 17, 18, 19 and 20 are only granted or renewed after Ministry of Labour issues a work permit.
The bidoun, a stateless population, are not included in the residency documents holders.
Residency procedures do not apply to GCC nationals.
2. Institution which provides data
Ministry of Interior
3. Period of data coverage
January 1st- December 31st, given years
4. Data availability
a- 2005-2009′ data is published in MoI’ 2009 Statistical Yearbook, in Chapter “Immigration statistics”, available online at: http://www.moi.gov.kw/portal/varabic/statistics/stats.htm
Last date of access: September 3rd, 2013.
b- 2007-2011′ data is tabulated in MoI’ 2011 Statistical Yearbook, in Chapter “Immigration statistics” (not available online). The volume may be directly obtained from MoI.
c- 2001-2010 data is also available in the “Annual Bulletins of Social Statistics”, given years (data is not disagregated by nationality group or by citizenship of permit holder), available for download in PDF format of Central Statistical Bureau (CSB) website: http://www.csb.gov.kw/Socan_Statistic_EN.aspx?ID=38
| Nationality group |
year of cancellation |
| |
2005 |
2006 |
2007 |
2008 |
2009 |
2010 |
2011 |
2012 |
2013 |
| Arabs |
152,866 |
117,840 |
52,307 |
41,310 |
54,672 |
75,189 |
43,100 |
42,501 |
38,123 |
| Europeans/ Americans |
11,124 |
12,065 |
8,408 |
7,487 |
7,402 |
8,428 |
7,277 |
6,680 |
4,896 |
| Asians |
357,053 |
358,879 |
260,467 |
206,823 |
184,648 |
226,242 |
147,772 |
120,621 |
87,582 |
| Africans |
2,057 |
2,219 |
2,710 |
3,910 |
5,790 |
10,134 |
9,418 |
8,836 |
6,252 |
| Total |
523,100 |
491,003 |
323,892 |
259,530 |
252,512 |
319,993 |
207,567 |
178,638 |
136,853 |
Source: Ministry of Interior’s records
ANNEXED NOTE
1. Definitions
The table refers to all types of residency permits, i.e. granted under articles 14, 17, 18, 19, 20, 22, 23, 24 of the immigration regulations, cancelled during the given years.
A residence visa is cancelled if the holder leaves Kuwait for a continuous period of six months, after termination of his employment period or not. The only exceptions are for those who:
· Are studying abroad
· Are receiving necessary treatment abroad, or
· Are required by virtue of their work to be abroad,
In all three cases, permission has to be obtained before leaving Kuwait.
The bidoun, a stateless population, are not included in the residency documents holders.
Residency procedures do not apply to GCC nationals.
2. Institution which provides data
Ministry of Interior
3. Period of data coverage
January 1st- December 31st, given years
4. Data availability
a- 2005-2009′ data is published in MoI’ 2009 Statistical Yearbook, in Chapter “Immigration statistics”, available online at: http://www.moi.gov.kw/portal/varabic/statistics/stats.htm
Last date of access: June 23rd, 2013.
b- 2007-2011′ data is tabulated in MoI’ 2011 Statistical Yearbook, in Chapter “Immigration statistics” (not available online). The volume may be directly obtained from MoI.
| Category of issuance |
nationality group |
year of issuance |
| 2005 |
2006 |
2007 |
2008 |
2009 |
2010 |
2011 |
| First issuance |
Arabs |
119.420 |
128.186 |
75.243 |
59.114 |
60.864 |
80.939 |
51.108 |
| Europeans/ Americans |
9.693 |
12.234 |
10.820 |
9.380 |
8.204 |
9.703 |
9.424 |
| Asians |
239.534 |
333.237 |
283.947 |
230.467 |
201.182 |
246.366 |
174.145 |
| Africans |
1.560 |
1.950 |
2.913 |
3.865 |
5.823 |
10.521 |
10.009 |
| Total |
370.207 |
475.607 |
372.923 |
302.826 |
276.073 |
347.529 |
244.686 |
| Renewal |
Arabs |
198.589 |
228.713 |
249.202 |
297.309 |
298.473 |
306.582 |
354.245 |
| Europeans/ Americans |
10.227 |
12.182 |
13.536 |
14.833 |
14.839 |
15.883 |
18.286 |
| Asians |
476.564 |
542.739 |
624.439 |
684.757 |
609.862 |
618.254 |
654.960 |
| Africans |
2.221 |
2.638 |
3.963 |
6.909 |
12.873 |
19.693 |
28.996 |
| Total |
687.601 |
786.272 |
891.140 |
1.003.808 |
936.047 |
960.412 |
1.056.487 |
| Total |
Arabs |
318.009 |
356.899 |
324.445 |
356.423 |
359.337 |
387.521 |
405.353 |
| Europeans/ Americans |
19.920 |
24.416 |
24.356 |
24.213 |
23.043 |
25.586 |
27.710 |
| Asians |
716.098 |
875.976 |
908.386 |
915.224 |
811.044 |
864.620 |
829.105 |
| Africans |
3.781 |
4.588 |
6.876 |
10.774 |
18.696 |
30.214 |
39.005 |
| Total |
1.057.808 |
1.261.879 |
1.264.063 |
1.306.634 |
1.212.120 |
1.307.941 |
1.301.173 |
Source: Ministry of Interior’s records
ANNEXED NOTE
1. Definitions
The table refers to all types of residency permits, i.e. granted under articles 14, 17, 18, 19, 20, 22, 23, 24 of the immigration regulations, first issued or renewed during the given years.
The residency can be valid for a minimum of 1 month to a year (temporary permits granted under article 14 of the immigration regulations), and for a maximum of five years (some of the residence permits granted to public and private sector employees under Articles 17 and 18).
When the initial residence document expires, the expatriate will have to keep the same sponsor if the permit has to be renewed. It will have to be renewed first with the Labour Ministry, before renewal of the residence application.
The bidoun, a stateless population, are not included in the residency documents holders.
Residency procedures do not apply to GCC nationals.
2. Institution which provides data
Ministry of Interior
3. Period of data coverage
January 1st- December 31st, given years
4. Data availability
a- 2005-2009′ data is published in MoI’ 2009 Statistical Yearbook, in Chapter “Immigration statistics”, available online at: http://www.moi.gov.kw/portal/varabic/statistics/stats.htm
Last date of access: June 23rd, 2013.
b- 2007-2011′ data is tabulated in MoI’ 2011 Statistical Yearbook, in Chapter “Immigration statistics” (not available online). The volume may be directly obtained from MoI.
| year |
Cancellations of permits |
| 2001 |
154,967 |
| 2002 |
185,005 |
| 2003 |
228,084 |
| 2004 |
439,578 |
| 2005 |
523,100 |
| 2006 |
491,003 |
| 2007 |
323,892 |
| 2008 |
259,530 |
| 2009 |
252,512 |
| 2010 |
319,993 |
| 2011 |
207,567 |
| 2012 |
178,638 |
| 2013 |
136,853 |
Source: Ministry of Interior’s records
ANNEXED NOTE
1. Definitions
The table refers to all types of residency permits, i.e. granted under articles 14, 17, 18, 19, 20, 22, 23, 24 of the immigration regulations, cancelled during the given years.
A residence visa is cancelled if the holder leaves Kuwait for a continuous period of six months, after termination of his employment period or not. The only exceptions are for those who:
· Are studying abroad
· Are receiving necessary treatment abroad, or
· Are required by virtue of their work to be abroad,
In all three cases, permission has to be obtained before leaving Kuwait.
The bidoun, a stateless population, are not included in the residency documents holders.
Residency procedures do not apply to GCC nationals.
2. Institution which provides data
Ministry of Interior (MoI) and Central Statistical Bureau (CSB), Ministry of Planning.
3. Period of data coverage
January 1st- December 31st, given years
4. Data availability
a- 2005-2009′ data is published in MoI’ 2009 Statistical Yearbook, in Chapter “Immigration statistics”, available online at: http://www.moi.gov.kw/portal/varabic/statistics/stats.htm
Last date of access: Sept.3rd, 2013.
b- 2007-2011′ data is tabulated in MoI’ 2011 Statistical Yearbook, in Chapter “Immigration statistics” (not available online). The volume may be directly obtained from MoI.
c- 2001-2010′ data is also available in the “Annual Bulletins of Social Statistics”, given years (data is not disagregated by nationality group or by citizenship of permit holder), available for download in PDF format of Central Statistical Bureau (CSB) website.
http://www.csb.gov.kw/Socan_Statistic_EN.aspx?ID=38
d- 2010-2013′ data is available in the report “Migration Statistics 2013”, published by the CSB.
The report (in Arabic, PDF format with Excel tables) is available on CSB’s website (Population Statistics, then Migration Statistics)
http://www.csb.gov.kw/Socan_Statistic.aspx?ID=56
Date of access: May 2015.
| year of issuance |
Category |
Total |
| First issuance |
Renewal |
| 2001 |
97.664 |
526.528 |
624.192 |
| 2002 |
116.222 |
512.843 |
629.065 |
| 2003 |
516.677 |
203.882 |
720.559 |
| 2004 |
319.810 |
610.967 |
930.777 |
| 2005 |
370.207 |
687.601 |
624.192 |
| 2006 |
475.607 |
786.272 |
629.065 |
| 2007 |
372.923 |
891.140 |
720.559 |
| 2008 |
302.826 |
1.003.808 |
930.777 |
| 2009 |
276.073 |
936.047 |
1.057.808 |
| 2010 |
347.529 |
960.412 |
1.261.879 |
| 2011 |
244.686 |
1.056.487 |
1.264.063 |
Source: Ministry of Interior’s records
ANNEXED NOTE
1. Definitions
The table refers to all types of residency permits, i.e. granted under articles 14, 17, 18, 19, 20, 22, 23, 24 of the immigration regulations, first issued or renewed during the given years.
The residency can be valid for a minimum of 1 month to a year (temporary permits granted under article 14 of the immigration regulations), and for a maximum of five years (some of the residence permits granted to public and private sector employees under Articles 17 and 18). When the initial residence document expires, the expatriate will have to keep the same sponsor if the permit has to be renewed. It will have to be renewed first with the Labour Ministry, before renewal of the residence application.
The bidoun, a stateless population, are not included in the residency documents holders. Residency procedures do not apply to GCC nationals.
2. Institution which provides data
Ministry of Interior
3. Period of data coverage
January 1st- December 31st, given years
4. Data availability
a- 2005-2009′ data is published in MoI’ 2009 Statistical Yearbook, in Chapter “Immigration statistics”, available online at: http://www.moi.gov.kw/portal/varabic/statistics/stats.htm Last date of access: September 3rd, 2013. b- 2007-2011′ data is tabulated in MoI’ 2011 Statistical Yearbook, in Chapter “Immigration statistics” (not available online). The volume may be directly obtained from MoI. c- 2001-2010 data is also available in the “Annual Bulletins of Social Statistics”, given years (data is not disagregated by nationality group or by citizenship of permit holder), available for download in PDF format of Central Statistical Bureau (CSB) website: http://www.csb.gov.kw/Socan_Statistic_EN.aspx?ID=38
| |
14 |
17 |
18 |
19 |
20 |
22 |
23 |
24 |
|
| Country of citizenship |
Temporary permits |
Governmental sector permits |
Private sector permits |
Business |
Domestic help |
Dependant permits |
Study |
Self residence permits |
TOTAL |
| ARAB COUNTRIES |
males |
females |
males |
females |
males |
females |
males |
females |
males |
females |
males |
females |
males |
females |
males |
females |
|
| Iraq |
66 |
34 |
128 |
67 |
3.448 |
638 |
6 |
0 |
48 |
31 |
3.545 |
6.939 |
0 |
0 |
92 |
220 |
15.262 |
| Syria |
1.435 |
246 |
3.922 |
1.335 |
49.192 |
2.923 |
76 |
2 |
262 |
40 |
30.726 |
45.119 |
3 |
0 |
130 |
143 |
135.554 |
| Lebanon |
343 |
138 |
650 |
445 |
13.253 |
4.239 |
46 |
3 |
8 |
21 |
8.285 |
15.016 |
1 |
2 |
80 |
56 |
42.586 |
| Jordan |
458 |
155 |
1.543 |
1.177 |
14.310 |
3.423 |
29 |
1 |
11 |
8 |
12.220 |
21.532 |
1 |
2 |
119 |
92 |
55.081 |
| Yemen |
91 |
13 |
754 |
128 |
4.033 |
160 |
0 |
0 |
377 |
6 |
1.879 |
3.288 |
2 |
0 |
20 |
11 |
10.762 |
| Palestine |
0 |
1 |
0 |
2 |
12 |
8 |
0 |
0 |
0 |
0 |
279 |
277 |
0 |
0 |
0 |
0 |
579 |
| Algeria |
12 |
6 |
47 |
11 |
193 |
63 |
1 |
0 |
1 |
0 |
182 |
327 |
1 |
0 |
0 |
1 |
845 |
| Egypt |
13.259 |
833 |
30.892 |
15.185 |
273.456 |
9.716 |
25 |
5 |
1.408 |
82 |
52.735 |
84.765 |
10 |
2 |
149 |
170 |
482.692 |
| Morocco |
48 |
30 |
77 |
129 |
763 |
772 |
0 |
0 |
9 |
41 |
302 |
1.292 |
0 |
0 |
1 |
31 |
3.495 |
| Tunisia |
36 |
46 |
364 |
533 |
417 |
472 |
0 |
0 |
2 |
4 |
340 |
644 |
2 |
1 |
0 |
2 |
2.863 |
| Libya |
1 |
0 |
19 |
2 |
16 |
2 |
0 |
0 |
0 |
0 |
34 |
74 |
1 |
0 |
0 |
0 |
149 |
| Palestinian from Egypt |
41 |
20 |
102 |
97 |
1.863 |
659 |
2 |
0 |
0 |
0 |
1.145 |
2.117 |
0 |
0 |
92 |
15 |
6.153 |
| Palestinian from Lebanon |
4 |
2 |
18 |
11 |
320 |
109 |
1 |
0 |
2 |
3 |
140 |
341 |
0 |
0 |
10 |
1 |
962 |
| Palestinian from Syria |
2 |
0 |
5 |
7 |
113 |
43 |
0 |
0 |
1 |
2 |
69 |
125 |
0 |
0 |
3 |
2 |
372 |
| Palestinian from Iraq |
0 |
0 |
0 |
0 |
1 |
1 |
0 |
0 |
0 |
0 |
0 |
1 |
0 |
0 |
0 |
0 |
3 |
| Non-Kuwaiti |
0 |
0 |
0 |
0 |
1 |
0 |
0 |
0 |
0 |
0 |
2 |
3 |
0 |
0 |
0 |
0 |
6 |
| Saudi |
0 |
0 |
0 |
0 |
0 |
0 |
0 |
0 |
0 |
0 |
0 |
1 |
0 |
0 |
0 |
0 |
1 |
| Total |
15.796 |
1.524 |
38.521 |
19.129 |
361.391 |
23.228 |
186 |
11 |
2.129 |
238 |
111.883 |
181.861 |
21 |
7 |
696 |
744 |
757.365 |
| ASIA |
|
|
|
|
|
|
|
|
|
|
|
|
|
|
|
|
|
| Afghanistan |
321 |
41 |
121 |
6 |
9.433 |
38 |
4 |
0 |
651 |
2 |
1.234 |
1.810 |
19 |
4 |
3 |
2 |
13.689 |
| Uzbekistan |
1 |
0 |
16 |
13 |
9 |
9 |
0 |
0 |
0 |
0 |
14 |
51 |
0 |
0 |
0 |
1 |
114 |
| Kyrgyzstan |
1 |
2 |
3 |
4 |
4 |
14 |
0 |
0 |
0 |
0 |
6 |
17 |
5 |
2 |
0 |
0 |
58 |
| Tajikstan |
0 |
0 |
4 |
2 |
3 |
0 |
0 |
0 |
0 |
0 |
8 |
11 |
4 |
2 |
0 |
0 |
34 |
| Kazakhstan |
0 |
0 |
0 |
0 |
6 |
7 |
0 |
0 |
0 |
0 |
4 |
17 |
0 |
0 |
0 |
0 |
34 |
| Mongolia |
0 |
0 |
3 |
1 |
0 |
0 |
0 |
0 |
0 |
2 |
3 |
4 |
3 |
0 |
0 |
0 |
16 |
| Turkey |
101 |
23 |
56 |
9 |
1.141 |
146 |
0 |
0 |
7 |
0 |
275 |
511 |
1 |
0 |
1 |
1 |
2.272 |
| Iran |
481 |
29 |
468 |
240 |
22.856 |
1.405 |
51 |
0 |
455 |
53 |
5.245 |
11.120 |
3 |
2 |
138 |
92 |
42.638 |
| Malaysia |
3 |
2 |
9 |
32 |
99 |
21 |
0 |
0 |
0 |
0 |
87 |
166 |
19 |
3 |
0 |
0 |
441 |
| Japan |
4 |
0 |
23 |
4 |
25 |
10 |
1 |
0 |
0 |
0 |
7 |
47 |
3 |
2 |
0 |
0 |
126 |
| Indonesia |
26 |
113 |
443 |
258 |
541 |
797 |
0 |
0 |
47 |
10.621 |
292 |
885 |
4 |
5 |
0 |
4 |
14.036 |
| Philippines |
767 |
1.668 |
1.784 |
1.758 |
26.637 |
27.489 |
1 |
0 |
750 |
93.011 |
2.487 |
5.308 |
17 |
14 |
1 |
50 |
161.742 |
| Pakistan |
2.348 |
66 |
2.462 |
199 |
85.059 |
874 |
19 |
0 |
2.413 |
34 |
9.232 |
17.280 |
27 |
4 |
19 |
4 |
120.040 |
| India |
12.243 |
1.905 |
9.233 |
11.613 |
294.309 |
18.140 |
42 |
1 |
171.171 |
80.997 |
30.674 |
62.131 |
15 |
1 |
17 |
33 |
692.525 |
| China |
635 |
70 |
67 |
34 |
2.251 |
541 |
0 |
0 |
0 |
2 |
51 |
236 |
8 |
7 |
1 |
0 |
3.903 |
| Taiwan |
0 |
0 |
4 |
1 |
2 |
0 |
0 |
0 |
0 |
0 |
1 |
3 |
5 |
3 |
0 |
0 |
19 |
| South Korea |
113 |
2 |
12 |
3 |
725 |
13 |
0 |
0 |
0 |
0 |
83 |
160 |
1 |
6 |
0 |
0 |
1.118 |
| Singapore |
0 |
0 |
9 |
2 |
9 |
3 |
0 |
0 |
0 |
0 |
1 |
18 |
14 |
2 |
0 |
1 |
59 |
| Bangladesh |
4.518 |
219 |
6.390 |
335 |
110.983 |
3.396 |
4 |
0 |
56.107 |
1.270 |
2.556 |
4.380 |
9 |
0 |
2 |
2 |
190.171 |
| Thailand |
155 |
18 |
27 |
66 |
1.739 |
229 |
0 |
0 |
1 |
5 |
28 |
149 |
23 |
18 |
0 |
5 |
2.463 |
| Sri Lanka |
704 |
1.443 |
406 |
189 |
13.969 |
4.794 |
0 |
0 |
16.512 |
67.537 |
1.143 |
3.127 |
23 |
1 |
0 |
12 |
109.860 |
| Nepal |
1.017 |
561 |
205 |
6 |
23.617 |
1.280 |
0 |
0 |
4.039 |
24.506 |
60 |
194 |
0 |
1 |
0 |
0 |
55.486 |
| Bhutan |
0 |
0 |
3 |
2 |
4 |
0 |
0 |
0 |
0 |
1 |
6 |
7 |
0 |
0 |
0 |
0 |
23 |
| North Korea |
492 |
0 |
7 |
0 |
3.056 |
2 |
0 |
0 |
0 |
0 |
3 |
8 |
2 |
1 |
0 |
0 |
3.571 |
| Vietnam |
66 |
0 |
5 |
1 |
491 |
5 |
0 |
0 |
0 |
13 |
4 |
13 |
0 |
0 |
0 |
0 |
598 |
| Cambodia |
0 |
0 |
5 |
3 |
0 |
0 |
0 |
0 |
0 |
1 |
2 |
2 |
28 |
6 |
0 |
0 |
47 |
| Myanmar |
15 |
0 |
3 |
1 |
238 |
85 |
0 |
0 |
0 |
2 |
2 |
3 |
0 |
0 |
0 |
0 |
349 |
| Other Asian Nationalities |
0 |
1 |
6 |
0 |
34 |
12 |
0 |
0 |
0 |
1 |
9 |
19 |
3 |
2 |
0 |
0 |
87 |
| Total |
24.011 |
6.163 |
21.774 |
14.782 |
597.240 |
59.310 |
122 |
1 |
252.153 |
278.058 |
53.517 |
107.677 |
236 |
86 |
182 |
207 |
1.415.519 |
| EUROPE |
|
|
|
|
|
|
|
|
|
|
|
|
|
|
|
|
|
| Britain |
42 |
28 |
190 |
34 |
1.581 |
553 |
1 |
0 |
0 |
3 |
620 |
1.104 |
1 |
0 |
11 |
9 |
4.177 |
| Ireland |
3 |
1 |
10 |
2 |
73 |
39 |
0 |
0 |
0 |
0 |
32 |
52 |
0 |
0 |
0 |
1 |
213 |
| France |
7 |
3 |
132 |
17 |
210 |
89 |
0 |
1 |
0 |
0 |
179 |
265 |
1 |
1 |
1 |
2 |
908 |
| Holland |
3 |
1 |
7 |
2 |
97 |
17 |
1 |
0 |
0 |
0 |
72 |
91 |
0 |
0 |
0 |
1 |
292 |
| Belgium |
1 |
0 |
8 |
1 |
35 |
10 |
0 |
0 |
0 |
0 |
11 |
28 |
0 |
0 |
0 |
0 |
94 |
| Italy |
14 |
0 |
19 |
11 |
172 |
24 |
0 |
0 |
0 |
0 |
56 |
104 |
0 |
2 |
1 |
2 |
405 |
| Malta |
0 |
0 |
1 |
0 |
16 |
0 |
0 |
0 |
0 |
0 |
1 |
5 |
0 |
0 |
0 |
0 |
23 |
| Sweden |
1 |
2 |
6 |
2 |
68 |
17 |
0 |
0 |
0 |
0 |
67 |
103 |
0 |
0 |
1 |
1 |
268 |
| Norway |
0 |
0 |
6 |
1 |
11 |
8 |
0 |
1 |
0 |
0 |
10 |
20 |
0 |
0 |
0 |
0 |
57 |
| Switzerland |
0 |
1 |
8 |
3 |
13 |
3 |
0 |
0 |
0 |
0 |
4 |
14 |
0 |
0 |
0 |
0 |
46 |
| Austria |
0 |
0 |
9 |
6 |
23 |
7 |
0 |
0 |
0 |
0 |
20 |
40 |
0 |
0 |
1 |
1 |
107 |
| Germany |
9 |
4 |
32 |
9 |
177 |
42 |
3 |
0 |
0 |
0 |
98 |
170 |
3 |
2 |
1 |
2 |
552 |
| Spain |
8 |
2 |
18 |
6 |
64 |
19 |
0 |
0 |
0 |
0 |
27 |
54 |
1 |
1 |
1 |
0 |
201 |
| Portugal |
4 |
0 |
5 |
2 |
62 |
23 |
0 |
0 |
1 |
1 |
12 |
28 |
0 |
0 |
0 |
0 |
138 |
| Denmark |
2 |
0 |
2 |
3 |
69 |
11 |
0 |
0 |
0 |
0 |
35 |
74 |
2 |
0 |
0 |
0 |
198 |
| Greece |
6 |
10 |
7 |
2 |
48 |
17 |
0 |
0 |
0 |
1 |
14 |
32 |
0 |
0 |
0 |
0 |
137 |
| Cyprus |
2 |
0 |
2 |
0 |
9 |
4 |
0 |
0 |
0 |
0 |
5 |
11 |
0 |
0 |
0 |
0 |
33 |
| Czech Republic |
0 |
0 |
16 |
5 |
17 |
10 |
0 |
0 |
0 |
0 |
5 |
25 |
0 |
2 |
0 |
0 |
80 |
| Hungary |
1 |
4 |
14 |
4 |
73 |
32 |
0 |
0 |
0 |
0 |
28 |
58 |
1 |
2 |
0 |
0 |
217 |
| Slovakia |
2 |
3 |
8 |
10 |
17 |
8 |
0 |
0 |
0 |
0 |
11 |
43 |
0 |
0 |
0 |
0 |
102 |
| Finland |
0 |
0 |
2 |
2 |
7 |
2 |
0 |
0 |
0 |
0 |
3 |
15 |
0 |
0 |
0 |
0 |
31 |
| Lithuania |
0 |
0 |
1 |
0 |
2 |
4 |
0 |
0 |
1 |
0 |
3 |
4 |
0 |
0 |
0 |
0 |
15 |
| Poland |
4 |
2 |
17 |
7 |
66 |
38 |
0 |
0 |
0 |
0 |
20 |
96 |
2 |
3 |
0 |
2 |
257 |
| Russia and USSR |
7 |
5 |
117 |
20 |
102 |
51 |
0 |
0 |
0 |
1 |
138 |
304 |
2 |
3 |
3 |
0 |
753 |
| Ukraine |
3 |
5 |
18 |
1 |
48 |
31 |
0 |
0 |
0 |
0 |
43 |
154 |
0 |
0 |
0 |
0 |
303 |
| Moldova |
0 |
4 |
0 |
0 |
5 |
15 |
0 |
0 |
0 |
0 |
2 |
7 |
0 |
0 |
0 |
0 |
33 |
| Belarus |
1 |
0 |
1 |
0 |
13 |
6 |
0 |
0 |
0 |
0 |
9 |
28 |
0 |
0 |
0 |
0 |
58 |
| Bosnia-Herzegovina |
2 |
1 |
25 |
16 |
75 |
18 |
0 |
0 |
0 |
0 |
15 |
53 |
6 |
3 |
0 |
0 |
214 |
| Macedonia |
3 |
0 |
3 |
3 |
30 |
7 |
0 |
0 |
0 |
0 |
3 |
16 |
3 |
0 |
0 |
0 |
68 |
| Croatia |
4 |
0 |
4 |
2 |
22 |
11 |
0 |
0 |
0 |
0 |
5 |
10 |
0 |
0 |
0 |
0 |
58 |
| Serbia |
8 |
4 |
12 |
7 |
74 |
27 |
0 |
0 |
0 |
0 |
24 |
55 |
0 |
0 |
0 |
0 |
211 |
| Yugoslavia |
0 |
0 |
5 |
1 |
42 |
13 |
0 |
1 |
0 |
0 |
11 |
31 |
0 |
0 |
0 |
0 |
104 |
| Romania |
20 |
30 |
16 |
23 |
152 |
148 |
0 |
0 |
0 |
1 |
60 |
167 |
0 |
0 |
0 |
0 |
617 |
| Bulgaria |
5 |
0 |
53 |
145 |
74 |
88 |
0 |
0 |
0 |
0 |
30 |
94 |
4 |
0 |
0 |
0 |
493 |
| Albania |
1 |
1 |
4 |
2 |
12 |
0 |
0 |
0 |
0 |
0 |
16 |
30 |
1 |
1 |
0 |
0 |
68 |
| Kosovo |
1 |
0 |
4 |
2 |
3 |
1 |
0 |
0 |
0 |
0 |
6 |
6 |
0 |
0 |
0 |
0 |
23 |
| Armenia |
3 |
6 |
4 |
4 |
94 |
36 |
0 |
0 |
0 |
0 |
17 |
80 |
0 |
2 |
0 |
0 |
246 |
| Georgia |
4 |
7 |
3 |
2 |
34 |
21 |
0 |
0 |
0 |
0 |
13 |
13 |
0 |
2 |
0 |
0 |
99 |
| Azerbaidjan |
1 |
0 |
6 |
1 |
8 |
5 |
0 |
0 |
0 |
0 |
16 |
29 |
0 |
0 |
0 |
0 |
66 |
| Other European Nationalities |
0 |
0 |
4 |
4 |
27 |
11 |
1 |
0 |
0 |
0 |
10 |
18 |
0 |
0 |
0 |
0 |
75 |
| Total |
172 |
124 |
799 |
362 |
3.725 |
1.466 |
6 |
3 |
2 |
7 |
1.751 |
3.531 |
27 |
24 |
20 |
21 |
12.040 |
| AFRICA |
|
|
|
|
|
|
|
|
|
|
|
|
|
|
|
|
|
| Ethiopia |
111 |
1.086 |
32 |
30 |
1.869 |
1.285 |
0 |
0 |
3.083 |
69.511 |
57 |
209 |
1 |
1 |
0 |
4 |
77.279 |
| Eritrea |
3 |
7 |
69 |
38 |
178 |
81 |
0 |
0 |
8 |
194 |
191 |
354 |
2 |
1 |
5 |
4 |
1.135 |
| Sudan |
91 |
94 |
181 |
46 |
2.652 |
107 |
0 |
0 |
342 |
6 |
330 |
692 |
3 |
0 |
5 |
2 |
4.551 |
| Senegal |
1 |
4 |
27 |
8 |
17 |
10 |
0 |
0 |
4 |
7 |
20 |
40 |
32 |
13 |
0 |
0 |
183 |
| Gambia |
0 |
0 |
3 |
0 |
4 |
1 |
0 |
0 |
1 |
3 |
3 |
4 |
18 |
0 |
0 |
0 |
37 |
| Guinea |
0 |
0 |
2 |
0 |
13 |
3 |
0 |
0 |
0 |
1 |
10 |
9 |
7 |
2 |
0 |
0 |
47 |
| Mauritania |
12 |
1 |
50 |
1 |
12 |
0 |
0 |
0 |
4 |
0 |
15 |
41 |
4 |
2 |
0 |
0 |
142 |
| Mali |
3 |
0 |
2 |
0 |
13 |
1 |
0 |
0 |
40 |
2 |
4 |
8 |
16 |
5 |
0 |
0 |
94 |
| Niger |
1 |
0 |
14 |
3 |
30 |
6 |
0 |
0 |
0 |
0 |
28 |
35 |
21 |
1 |
0 |
0 |
139 |
| Burkina Faso |
1 |
0 |
2 |
0 |
8 |
1 |
0 |
0 |
1 |
0 |
3 |
6 |
16 |
4 |
0 |
0 |
42 |
| Benin |
6 |
0 |
16 |
1 |
36 |
0 |
0 |
0 |
1 |
2 |
12 |
25 |
51 |
8 |
0 |
0 |
158 |
| Liberia |
0 |
0 |
16 |
4 |
43 |
13 |
0 |
0 |
1 |
2 |
46 |
70 |
0 |
0 |
2 |
3 |
200 |
| Sierra Leone |
31 |
0 |
11 |
2 |
45 |
1 |
0 |
0 |
1 |
4 |
11 |
16 |
0 |
0 |
0 |
0 |
122 |
| Togo |
1 |
1 |
5 |
1 |
13 |
1 |
0 |
0 |
11 |
29 |
4 |
6 |
7 |
2 |
0 |
0 |
81 |
| Ivory Coast |
0 |
0 |
0 |
0 |
9 |
1 |
0 |
0 |
1 |
7 |
1 |
8 |
6 |
0 |
0 |
0 |
33 |
| Nigeria |
7 |
3 |
89 |
22 |
91 |
35 |
0 |
0 |
1 |
3 |
87 |
146 |
54 |
9 |
0 |
0 |
547 |
| South Africa |
8 |
22 |
59 |
5 |
199 |
145 |
0 |
0 |
0 |
1 |
53 |
142 |
0 |
0 |
0 |
1 |
635 |
| Swaziland |
0 |
1 |
3 |
4 |
0 |
1 |
0 |
0 |
0 |
0 |
5 |
7 |
0 |
0 |
0 |
0 |
21 |
| Zimbabwe |
9 |
1 |
4 |
2 |
31 |
0 |
0 |
0 |
0 |
1 |
7 |
17 |
0 |
0 |
0 |
0 |
72 |
| Chad |
1 |
0 |
8 |
3 |
65 |
11 |
0 |
0 |
6 |
1 |
25 |
30 |
11 |
1 |
0 |
0 |
162 |
| Cameroon |
0 |
0 |
0 |
0 |
5 |
12 |
0 |
0 |
1 |
0 |
2 |
1 |
3 |
0 |
0 |
0 |
24 |
| Somalia |
63 |
54 |
211 |
163 |
743 |
219 |
0 |
0 |
8 |
28 |
825 |
1.300 |
33 |
5 |
7 |
2 |
3.661 |
| Djibouti |
0 |
0 |
8 |
1 |
8 |
2 |
0 |
0 |
1 |
0 |
6 |
17 |
4 |
2 |
0 |
0 |
49 |
| Madagascar |
0 |
22 |
0 |
0 |
1 |
0 |
0 |
0 |
2 |
1.197 |
0 |
3 |
0 |
0 |
0 |
0 |
1.225 |
| Mauritius |
19 |
0 |
3 |
0 |
3 |
1 |
0 |
0 |
0 |
2 |
1 |
7 |
5 |
0 |
0 |
0 |
41 |
| Ghana |
15 |
12 |
10 |
5 |
346 |
49 |
0 |
0 |
24 |
273 |
13 |
30 |
13 |
1 |
0 |
0 |
791 |
| Uganda |
0 |
4 |
3 |
0 |
10 |
8 |
0 |
0 |
0 |
239 |
8 |
4 |
3 |
1 |
0 |
0 |
280 |
| Malawi |
0 |
0 |
8 |
2 |
0 |
0 |
0 |
0 |
0 |
0 |
7 |
8 |
0 |
0 |
0 |
0 |
25 |
| Tanzania |
1 |
0 |
6 |
1 |
25 |
0 |
0 |
0 |
1 |
0 |
4 |
18 |
10 |
3 |
0 |
0 |
69 |
| Kenya |
4 |
1 |
16 |
11 |
99 |
23 |
0 |
0 |
2 |
7 |
36 |
60 |
0 |
2 |
0 |
0 |
261 |
| Comore Islands |
1 |
0 |
4 |
0 |
30 |
1 |
0 |
0 |
0 |
1 |
11 |
17 |
11 |
1 |
1 |
0 |
78 |
| Seychelles Islands |
0 |
1 |
1 |
1 |
2 |
2 |
0 |
0 |
0 |
1 |
2 |
7 |
0 |
0 |
0 |
0 |
17 |
| Other African Nationalities |
1 |
0 |
14 |
6 |
24 |
5 |
0 |
0 |
1 |
2 |
14 |
45 |
6 |
5 |
0 |
0 |
123 |
| Total |
390 |
1.314 |
877 |
360 |
6.624 |
2.025 |
0 |
0 |
3.545 |
71.524 |
1.841 |
3.382 |
337 |
69 |
20 |
16 |
92.324 |
| AMERICA AND OCEANIA |
|
|
|
|
|
|
|
|
|
|
|
|
|
|
|
|
|
| U.S.A |
363 |
86 |
502 |
84 |
5.645 |
1.562 |
8 |
1 |
2 |
2 |
2.254 |
2.733 |
2 |
3 |
8 |
12 |
13.267 |
| Canada |
43 |
25 |
202 |
88 |
1.739 |
587 |
9 |
0 |
1 |
0 |
1.523 |
2.273 |
5 |
2 |
29 |
4 |
6.530 |
| Dominican Republic |
4 |
0 |
17 |
5 |
72 |
5 |
0 |
0 |
1 |
0 |
93 |
86 |
0 |
0 |
2 |
0 |
285 |
| Venezuela |
2 |
0 |
5 |
4 |
73 |
15 |
0 |
0 |
0 |
0 |
35 |
90 |
0 |
0 |
0 |
0 |
224 |
| Colombia |
0 |
1 |
2 |
0 |
37 |
10 |
0 |
0 |
0 |
0 |
12 |
31 |
0 |
0 |
1 |
0 |
94 |
| Trinidad and Tobago |
1 |
0 |
0 |
0 |
8 |
3 |
0 |
0 |
0 |
0 |
6 |
6 |
0 |
0 |
0 |
0 |
24 |
| Granada |
0 |
0 |
6 |
0 |
4 |
0 |
0 |
0 |
0 |
0 |
1 |
6 |
0 |
0 |
0 |
0 |
17 |
| Jamaica |
0 |
0 |
3 |
1 |
3 |
4 |
0 |
0 |
0 |
1 |
1 |
4 |
0 |
0 |
0 |
0 |
17 |
| Mexico |
1 |
1 |
3 |
0 |
9 |
4 |
0 |
0 |
0 |
0 |
7 |
35 |
0 |
0 |
0 |
0 |
60 |
| Brasil |
19 |
5 |
10 |
6 |
56 |
15 |
0 |
0 |
0 |
0 |
34 |
52 |
0 |
0 |
1 |
0 |
198 |
| Bolivia |
0 |
0 |
2 |
0 |
8 |
4 |
0 |
0 |
0 |
0 |
15 |
25 |
0 |
0 |
1 |
0 |
55 |
| Peru |
1 |
0 |
4 |
0 |
5 |
2 |
0 |
0 |
0 |
0 |
2 |
5 |
0 |
0 |
0 |
0 |
19 |
| Ecuador |
0 |
0 |
0 |
0 |
8 |
0 |
0 |
0 |
0 |
0 |
5 |
7 |
0 |
0 |
0 |
1 |
21 |
| Argentina |
3 |
2 |
4 |
0 |
44 |
9 |
0 |
0 |
0 |
0 |
7 |
18 |
0 |
0 |
1 |
0 |
88 |
| Australia |
5 |
4 |
40 |
9 |
275 |
76 |
0 |
0 |
0 |
0 |
263 |
382 |
0 |
0 |
1 |
3 |
1.058 |
| New Zealand |
6 |
3 |
4 |
1 |
84 |
37 |
0 |
0 |
0 |
0 |
67 |
108 |
0 |
0 |
0 |
1 |
311 |
| Fiji Islands |
2 |
0 |
5 |
1 |
42 |
1 |
0 |
0 |
0 |
0 |
2 |
3 |
0 |
0 |
0 |
0 |
56 |
| Other American and Oceanian Nationalities |
2 |
1 |
11 |
2 |
33 |
6 |
0 |
0 |
0 |
3 |
12 |
40 |
0 |
0 |
0 |
1 |
111 |
| Total |
452 |
128 |
820 |
201 |
8.145 |
2.340 |
17 |
1 |
4 |
6 |
4.339 |
5.904 |
8 |
5 |
44 |
22 |
22.436 |
| U.N. |
0 |
0 |
4 |
0 |
0 |
0 |
0 |
0 |
0 |
0 |
1 |
1 |
0 |
0 |
0 |
0 |
6 |
| Unknown Nationalities |
0 |
0 |
0 |
0 |
0 |
0 |
0 |
0 |
0 |
1 |
0 |
0 |
0 |
0 |
0 |
0 |
1 |
| TOTAL |
40.821 |
9.253 |
62.795 |
34.834 |
977.125 |
88.369 |
331 |
16 |
257.833 |
349.834 |
173.332 |
302.356 |
629 |
191 |
962 |
1.010 |
2.299.691 |
| GRAND TOTAL |
50.074 |
97.629 |
1.065.494 |
347 |
607.667 |
475.688 |
820 |
1.972 |
2.299.691 |
Source: Ministry of Interior
ANNEXED NOTE
1. Definitions
Residency procedures do not apply to GCC nationals.
The bidoun, a stateless population, are not included in the residency documents holders.
Data presented in the table are stock data: all the non-national residents holding a residence permit on December 31st, the given year. The table excludes the Bedoon, the non-Kuwaiti GCC citizens and those in irregular situation.
Temporary permit: An expatriate may be granted temporary residence under article 14 of the immigration regulations in special cases where he does not need or cannot get ordinary residence.
This allows the expatriate to stay for up to one year, for personal emergencies such as illness, or after resignation from employment in order to settle financial affairs or a court case.
Dependent permit: spouse, children or elderly dependent relatives can join visa holder (sponsor) in Kuwait, if the expatriate has obtained a residency and is earning a minimum of KD250 a month (private and governement sector alike).
A working wife cannot sponsor her husband as a dependent. Also, sons over the age of 21 years cannot be sponsored as dependants, though adult daughters and parents may be permitted. Dependent family members are not allowed to work on a Dependent Visa, unless they transfer it into a work visa under Kuwaiti sponsorship. This can be done only after 6 to 12 months of holding a dependent visa.
Every children including new born babies must hold a residency permit. The application for the infant’s residence must be made within 60 days of the birth
The Dependent Visa holder is permitted to stay as long as the sponsor holds a valid visa.
Self residence permit: Expatriates may sponsor themselves under article 24 of the regulations and obtain a residence for two to five years under several conditions
(among which: being aged 60 and more, having worked no less than 25 years in Kuwait, owning a capital of 10000 KD at least; being able to produce a certificate of good conduct, being effectively residing in Kuwait with his/her family, etc.).
This form of residence can be renewed upon expiry. Self-sponsored expatriates may sponsor their wives and children.
Permits 17, 18, 19 and 20 are only granted after Ministry of Labour issues a work permit.
2. Institution which provides data
Ministry of Interior
3. Period of data coverage
December 31st, 2012
4. Data availability
Data on residence permits by country of citizenship is not published by Kuwaiti authorities (as of September 2013). The present data has been obtained from MoI.
|
14 |
17 |
18 |
19 |
20 |
22 |
23 |
24 |
TOTAL ALL PERMITS |
TOTAL |
| Country of citizenship |
Temporary permits |
Governmental sector permits |
Private sector permits |
Business |
Domestic help |
Dependant permits |
Study |
Self residence permits |
| ARAB COUNTRIES |
males |
females |
males |
females |
males |
females |
males |
females |
males |
females |
males |
females |
males |
females |
males |
females |
males |
females |
total |
| Iraq |
63 |
27 |
118 |
55 |
3.541 |
643 |
5 |
0 |
49 |
30 |
3.557 |
7.039 |
0 |
0 |
67 |
184 |
7.400 |
7.978 |
15.378 |
| Syria |
1.211 |
169 |
3.935 |
1.313 |
48.822 |
2.761 |
74 |
2 |
296 |
36 |
30.178 |
42.963 |
2 |
0 |
110 |
129 |
84.628 |
47.373 |
132.001 |
| Lebanon |
269 |
110 |
654 |
428 |
13.401 |
4.162 |
46 |
2 |
9 |
22 |
8.204 |
14.862 |
0 |
0 |
80 |
62 |
22.663 |
19.648 |
42.311 |
| Jordan |
334 |
109 |
1.527 |
1.083 |
13.954 |
3.257 |
27 |
1 |
11 |
4 |
11.818 |
20.823 |
1 |
2 |
114 |
90 |
27.786 |
25.369 |
53.155 |
| Palestine |
48 |
16 |
129 |
113 |
2.314 |
823 |
4 |
0 |
3 |
5 |
1.621 |
2.850 |
0 |
0 |
105 |
17 |
4.224 |
3.824 |
8.048 |
| Egypt |
7.595 |
514 |
30.732 |
14.978 |
264.118 |
9.536 |
21 |
5 |
1.413 |
89 |
49.326 |
78.946 |
8 |
5 |
132 |
173 |
353.345 |
104.246 |
457.591 |
| Other Arabs |
230 |
100 |
1.609 |
965 |
8.192 |
1.689 |
1 |
0 |
734 |
98 |
3.666 |
7.228 |
38 |
3 |
30 |
46 |
14.500 |
10.129 |
24.629 |
| Total Arab nationalities |
9.750 |
1.045 |
38.704 |
18.935 |
354.342 |
22.871 |
178 |
10 |
2.515 |
284 |
108.370 |
174.711 |
49 |
10 |
638 |
701 |
514.546 |
218.567 |
733.113 |
| OTHER COUNTRIES |
|
|
|
|
|
|
|
|
|
|
|
|
|
|
|
|
|
|
0 |
| Iran |
491 |
52 |
467 |
232 |
23.648 |
1.351 |
53 |
0 |
509 |
53 |
5.398 |
11.302 |
4 |
5 |
141 |
87 |
30.711 |
13.082 |
43.793 |
| Philippines |
469 |
1.363 |
1.732 |
1.757 |
23.967 |
23.890 |
0 |
0 |
690 |
78.656 |
2.362 |
4.998 |
17 |
16 |
1 |
46 |
29.238 |
110.726 |
139.964 |
| Pakistan |
1.839 |
41 |
2.531 |
199 |
87.477 |
830 |
22 |
0 |
2.622 |
37 |
9.294 |
17.687 |
29 |
3 |
17 |
3 |
103.831 |
18.800 |
122.631 |
| India |
8.374 |
1.208 |
9.106 |
11.633 |
270.800 |
16.989 |
46 |
1 |
165.251 |
77.117 |
28.625 |
58.080 |
16 |
2 |
15 |
32 |
482.233 |
165.062 |
647.295 |
| Bangladesh |
5.080 |
342 |
6.300 |
319 |
111.214 |
3.422 |
4 |
0 |
60.531 |
1.384 |
2.519 |
4.413 |
7 |
0 |
3 |
2 |
185.658 |
9.882 |
195.540 |
| Sri Lanka |
482 |
1.176 |
386 |
186 |
12.818 |
4.248 |
0 |
0 |
15.620 |
71.862 |
1.054 |
2.966 |
21 |
0 |
0 |
11 |
30.381 |
80.449 |
110.830 |
| Other nationalities |
3.361 |
2.209 |
3.095 |
1.163 |
52.784 |
7.551 |
24 |
4 |
7.595 |
108.544 |
8.632 |
14.706 |
436 |
150 |
71 |
66 |
75.998 |
134.393 |
210.391 |
| TOTAL ALL NATIONALITIES |
29.846 |
7.436 |
62.321 |
34.424 |
937.050 |
81.152 |
327 |
15 |
255.333 |
337.937 |
166.254 |
288.863 |
579 |
186 |
886 |
948 |
1.452.596 |
750.961 |
2.203.557 |
| GRAND TOTAL |
37.282 |
96.745 |
1.018.202 |
342 |
593.270 |
455.117 |
765 |
1.834 |
2.203.557 |
Source: Ministry of Interior
ANNEXED NOTE
1. Definitions
Residency procedures do not apply to GCC nationals.
The bidoun, a stateless population, are not included in the residency documents holders.
Data presented in the table are stock data: all the non-national residents holding a residence permit on December 31st, the given year. The table excludes the Bedoon, the non-Kuwaiti GCC citizens and those in irregular situation.
Temporary permit: An expatriate may be granted temporary residence under article 14 of the immigration regulations in special cases where he does not need or cannot get ordinary residence.
This allows the expatriate to stay for up to one year, for personal emergencies such as illness, or after resignation from employment in order to settle financial affairs or a court case.
Dependent permit: spouse, children or elderly dependent relatives can join visa holder (sponsor) in Kuwait, if the expatriate has obtained a residency and is earning a minimum of KD250 a month (private and governement sector alike).
A working wife cannot sponsor her husband as a dependent. Also, sons over the age of 21 years cannot be sponsored as dependants, though adult daughters and parents may be permitted. Dependent family members are not allowed to work on a Dependent Visa, unless they transfer it into a work visa under Kuwaiti sponsorship. This can be done only after 6 to 12 months of holding a dependent visa.
Every children including new born babies must hold a residency permit. The application for the infant’s residence must be made within 60 days of the birth
The Dependent Visa holder is permitted to stay as long as the sponsor holds a valid visa.
Self residence permit: Expatriates may sponsor themselves under article 24 of the regulations and obtain a residence for two to five years under several conditions
(among which: being aged 60 and more, having worked no less than 25 years in Kuwait, owning a capital of 10000 KD at least; being able to produce a certificate of good conduct, being effectively residing in Kuwait with his/her family, etc.).
This form of residence can be renewed upon expiry. Self-sponsored expatriates may sponsor their wives and children.
Permits 17, 18, 19 and 20 are only granted after Ministry of Labour issues a work permit.
2. Institution which provides data
Ministry of Interior
3. Period of data coverage
December 31st, 2011
4. Data availability
2011′ data is tabulated in MoI’ 2011 Statistical Yearbook, in Chapter “Immigration statistics” (not available online). The volume may be directly obtained from MoI.
| |
14 |
17 |
18 |
19 |
20 |
22 |
23 |
24 |
TOTAL ALL PERMITS |
TOTAL |
| Country of citizenship |
Temporary permits |
Governmental sector permits |
Private sector permits |
Business |
Domestic help |
Dependant permits |
Study |
Self residence permits |
| ARAB COUNTRIES |
males |
females |
males |
females |
males |
females |
males |
females |
males |
females |
males |
females |
males |
females |
males |
females |
males |
females |
total |
| Iraq |
59 |
28 |
105 |
48 |
3.695 |
629 |
4 |
0 |
43 |
35 |
3.502 |
7.095 |
0 |
0 |
68 |
184 |
7.476 |
8.019 |
15.495 |
| Syria |
848 |
146 |
3.574 |
1.227 |
49.579 |
2.682 |
88 |
2 |
346 |
37 |
30.819 |
41.568 |
2 |
0 |
87 |
110 |
85.343 |
45.772 |
131.115 |
| Lebanon |
143 |
72 |
644 |
430 |
14.823 |
4.233 |
50 |
3 |
9 |
24 |
8.038 |
14.741 |
2 |
1 |
75 |
57 |
23.784 |
19.561 |
43.345 |
| Jordan |
221 |
63 |
1.376 |
946 |
13.567 |
3.092 |
26 |
1 |
7 |
5 |
11.126 |
19.462 |
5 |
2 |
107 |
98 |
26.435 |
23.669 |
50.104 |
| Palestine |
0 |
0 |
0 |
0 |
0 |
0 |
0 |
0 |
0 |
0 |
0 |
0 |
0 |
0 |
0 |
0 |
0 |
0 |
0 |
| Egypt |
3.478 |
350 |
28.107 |
13.996 |
259.305 |
8.815 |
19 |
3 |
1.468 |
102 |
42.748 |
68.310 |
12 |
6 |
121 |
177 |
335.258 |
91.759 |
427.017 |
| Other Arabs |
168 |
57 |
1.568 |
906 |
10.045 |
2.432 |
5 |
0 |
565 |
101 |
4.771 |
9.108 |
26 |
3 |
135 |
46 |
17.283 |
12.653 |
29.936 |
| Total Arab nationalities |
4.917 |
716 |
35.374 |
17.553 |
351.014 |
21.883 |
192 |
9 |
2.438 |
304 |
101.004 |
160.284 |
47 |
12 |
593 |
672 |
495.579 |
201.433 |
697.012 |
| OTHER COUNTRIES |
|
|
|
|
|
|
|
|
|
|
|
|
|
|
|
|
|
|
0 |
| Iran |
275 |
41 |
494 |
197 |
26.989 |
1.316 |
55 |
0 |
591 |
58 |
5.421 |
11.124 |
6 |
1 |
149 |
82 |
33.980 |
12.819 |
46.799 |
| Philippines |
270 |
969 |
1.493 |
1.565 |
22.661 |
20.066 |
0 |
0 |
530 |
55.455 |
2.149 |
4.620 |
15 |
17 |
1 |
41 |
27.119 |
82.733 |
109.852 |
| Pakistan |
1.164 |
31 |
2.636 |
189 |
94.032 |
750 |
41 |
0 |
2.889 |
42 |
8.834 |
16.779 |
23 |
4 |
15 |
4 |
109.634 |
17.799 |
127.433 |
| India |
4.081 |
1.107 |
7.893 |
8.480 |
251.845 |
15.313 |
45 |
1 |
153.454 |
76.270 |
24.773 |
51.731 |
13 |
2 |
14 |
32 |
442.118 |
152.936 |
595.054 |
| Bangladesh |
2.055 |
91 |
6.315 |
61 |
118.920 |
3.632 |
2 |
0 |
68.464 |
1.717 |
2.467 |
4.884 |
3 |
0 |
2 |
1 |
198.228 |
10.386 |
208.614 |
| Sri Lanka |
221 |
1.139 |
370 |
114 |
10.860 |
3.690 |
0 |
0 |
12.638 |
68.653 |
984 |
2.722 |
14 |
0 |
0 |
13 |
25.087 |
76.331 |
101.418 |
| Other nationalities |
1.237 |
2.244 |
2.903 |
1.017 |
43.839 |
6.361 |
27 |
3 |
4.734 |
106.260 |
8.356 |
14.125 |
389 |
140 |
71 |
58 |
61.556 |
130.208 |
191.764 |
| TOTAL ALL NATIONALITIES |
14.220 |
6.338 |
57.478 |
29.176 |
920.160 |
73.011 |
362 |
13 |
245.738 |
308.759 |
153.988 |
266.269 |
510 |
176 |
845 |
903 |
1.393.301 |
684.645 |
2.077.946 |
| GRAND TOTAL |
20.558 |
86.654 |
993.171 |
375 |
554.497 |
420.257 |
686 |
1.748 |
2.077.946 |
Source: Ministry of Interior
ANNEXED NOTE
1. Definitions
Residency procedures do not apply to GCC nationals.
The bidoun, a stateless population, are not included in the residency documents holders.
Data presented in the table are stock data: all the non-national residents holding a residence permit on December 31st, the given year. The table excludes the Bedoon, the non-Kuwaiti GCC citizens and those in irregular situation.
Temporary permit: An expatriate may be granted temporary residence under article 14 of the immigration regulations in special cases where he does not need or cannot get ordinary residence.
This allows the expatriate to stay for up to one year, for personal emergencies such as illness, or after resignation from employment in order to settle financial affairs or a court case.
Dependent permit: spouse, children or elderly dependent relatives can join visa holder (sponsor) in Kuwait, if the expatriate has obtained a residency and is earning a minimum of KD250 a month (private and governement sector alike).
A working wife cannot sponsor her husband as a dependent. Also, sons over the age of 21 years cannot be sponsored as dependants, though adult daughters and parents may be permitted. Dependent family members are not allowed to work on a Dependent Visa, unless they transfer it into a work visa under Kuwaiti sponsorship. This can be done only after 6 to 12 months of holding a dependent visa.
Every children including new born babies must hold a residency permit. The application for the infant’s residence must be made within 60 days of the birth
The Dependent Visa holder is permitted to stay as long as the sponsor holds a valid visa.
Self residence permit: Expatriates may sponsor themselves under article 24 of the regulations and obtain a residence for two to five years under several conditions
(among which: being aged 60 and more, having worked no less than 25 years in Kuwait, owning a capital of 10000 KD at least; being able to produce a certificate of good conduct, being effectively residing in Kuwait with his/her family, etc.).
This form of residence can be renewed upon expiry. Self-sponsored expatriates may sponsor their wives and children.
Permits 17, 18, 19 and 20 are only granted after Ministry of Labour issues a work permit.
2. Institution which provides data
Ministry of Interior
3. Period of data coverage
December 31st, 2009
4. Data availability
2009′ data is published in MoI’ 2009 Statistical Yearbook, in Chapter “Immigration statistics”, available online at: http://www.moi.gov.kw/portal/varabic/statistics/stats.htm
Last date of access: September 5th, 2013.
| |
14 |
17 |
18 |
19 |
20 |
22 |
23 |
24 |
|
| Country of citizenship |
Temporary permits |
Governmental sector permits |
Private sector permits |
Business |
Domestic help |
Dependant permits |
Study |
Self residence permits |
TOTAL |
| ARAB COUNTRIES |
|
|
|
|
|
|
|
|
|
| Iraq |
100 |
195 |
4.086 |
6 |
79 |
10.484 |
0 |
312 |
15.262 |
| Syria |
1.681 |
5.257 |
52.115 |
78 |
302 |
75.845 |
3 |
273 |
135.554 |
| Lebanon |
481 |
1.095 |
17.492 |
49 |
29 |
23.301 |
3 |
136 |
42.586 |
| Jordan |
613 |
2.720 |
17.733 |
30 |
19 |
33.752 |
3 |
211 |
55.081 |
| Yemen |
104 |
882 |
4.193 |
0 |
383 |
5.167 |
2 |
31 |
10.762 |
| Palestine |
1 |
2 |
20 |
0 |
0 |
556 |
0 |
0 |
579 |
| Algeria |
18 |
58 |
256 |
1 |
1 |
509 |
1 |
1 |
845 |
| Egypt |
14.092 |
46.077 |
283.172 |
30 |
1.490 |
137.500 |
12 |
319 |
482.692 |
| Morocco |
78 |
206 |
1.535 |
0 |
50 |
1.594 |
0 |
32 |
3.495 |
| Tunisia |
82 |
897 |
889 |
0 |
6 |
984 |
3 |
2 |
2.863 |
| Libya |
1 |
21 |
18 |
0 |
0 |
108 |
1 |
0 |
149 |
| Palestinian from Egypt |
61 |
199 |
2.522 |
2 |
0 |
3.262 |
0 |
107 |
6.153 |
| Palestinian from Lebanon |
6 |
29 |
429 |
1 |
5 |
481 |
0 |
11 |
962 |
| Palestinian from Syria |
2 |
12 |
156 |
0 |
3 |
194 |
0 |
5 |
372 |
| Palestinian from Iraq |
0 |
0 |
2 |
0 |
0 |
1 |
0 |
0 |
3 |
| Non-Kuwaiti |
0 |
0 |
1 |
0 |
0 |
5 |
0 |
0 |
6 |
| Saudi |
0 |
0 |
0 |
0 |
0 |
1 |
0 |
0 |
1 |
| Total |
17.320 |
57.650 |
384.619 |
197 |
2.367 |
293.744 |
28 |
1.440 |
757.365 |
| ASIA |
|
|
|
|
|
|
|
|
|
| Afghanistan |
362 |
127 |
9.471 |
4 |
653 |
3.044 |
23 |
5 |
13.689 |
| Uzbekistan |
1 |
29 |
18 |
0 |
0 |
65 |
0 |
1 |
114 |
| Kyrgyzstan |
3 |
7 |
18 |
0 |
0 |
23 |
7 |
0 |
58 |
| Tajikstan |
0 |
6 |
3 |
0 |
0 |
19 |
6 |
0 |
34 |
| Kazakhstan |
0 |
0 |
13 |
0 |
0 |
21 |
0 |
0 |
34 |
| Mongolia |
0 |
4 |
0 |
0 |
2 |
7 |
3 |
0 |
16 |
| Turkey |
124 |
65 |
1.287 |
0 |
7 |
786 |
1 |
2 |
2.272 |
| Iran |
510 |
708 |
24.261 |
51 |
508 |
16.365 |
5 |
230 |
42.638 |
| Malaysia |
5 |
41 |
120 |
0 |
0 |
253 |
22 |
0 |
441 |
| Japan |
4 |
27 |
35 |
1 |
0 |
54 |
5 |
0 |
126 |
| Indonesia |
139 |
701 |
1.338 |
0 |
10.668 |
1.177 |
9 |
4 |
14.036 |
| Philippines |
2.435 |
3.542 |
54.126 |
1 |
93.761 |
7.795 |
31 |
51 |
161.742 |
| Pakistan |
2.414 |
2.661 |
85.933 |
19 |
2.447 |
26.512 |
31 |
23 |
120.040 |
| India |
14.148 |
20.846 |
312.449 |
43 |
252.168 |
92.805 |
16 |
50 |
692.525 |
| China |
705 |
101 |
2.792 |
0 |
2 |
287 |
15 |
1 |
3.903 |
| Taiwan |
0 |
5 |
2 |
0 |
0 |
4 |
8 |
0 |
19 |
| South Korea |
115 |
15 |
738 |
0 |
0 |
243 |
7 |
0 |
1.118 |
| Singapore |
0 |
11 |
12 |
0 |
0 |
19 |
16 |
1 |
59 |
| Bangladesh |
4.737 |
6.725 |
114.379 |
4 |
57.377 |
6.936 |
9 |
4 |
190.171 |
| Thailand |
173 |
93 |
1.968 |
0 |
6 |
177 |
41 |
5 |
2.463 |
| Sri Lanka |
2.147 |
595 |
18.763 |
0 |
84.049 |
4.270 |
24 |
12 |
109.860 |
| Nepal |
1.578 |
211 |
24.897 |
0 |
28.545 |
254 |
1 |
0 |
55.486 |
| Bhutan |
0 |
5 |
4 |
0 |
1 |
13 |
0 |
0 |
23 |
| North Korea |
492 |
7 |
3.058 |
0 |
0 |
11 |
3 |
0 |
3.571 |
| Vietnam |
66 |
6 |
496 |
0 |
13 |
17 |
0 |
0 |
598 |
| Cambodia |
0 |
8 |
0 |
0 |
1 |
4 |
34 |
0 |
47 |
| Myanmar |
15 |
4 |
323 |
0 |
2 |
5 |
0 |
0 |
349 |
| Other Asian Nationalities |
1 |
6 |
46 |
0 |
1 |
28 |
5 |
0 |
87 |
| Total |
30.174 |
36.556 |
656.550 |
123 |
530.211 |
161.194 |
322 |
389 |
1.415.519 |
| EUROPE |
0 |
0 |
0 |
0 |
0 |
0 |
0 |
0 |
|
| Britain |
70 |
224 |
2.134 |
1 |
3 |
1.724 |
1 |
20 |
4.177 |
| Ireland |
4 |
12 |
112 |
0 |
0 |
84 |
0 |
1 |
213 |
| France |
10 |
149 |
299 |
1 |
0 |
444 |
2 |
3 |
908 |
| Holland |
4 |
9 |
114 |
1 |
0 |
163 |
0 |
1 |
292 |
| Belgium |
1 |
9 |
45 |
0 |
0 |
39 |
0 |
0 |
94 |
| Italy |
14 |
30 |
196 |
0 |
0 |
160 |
2 |
3 |
405 |
| Malta |
0 |
1 |
16 |
0 |
0 |
6 |
0 |
0 |
23 |
| Sweden |
3 |
8 |
85 |
0 |
0 |
170 |
0 |
2 |
268 |
| Norway |
0 |
7 |
19 |
1 |
0 |
30 |
0 |
0 |
57 |
| Switzerland |
1 |
11 |
16 |
0 |
0 |
18 |
0 |
0 |
46 |
| Austria |
0 |
15 |
30 |
0 |
0 |
60 |
0 |
2 |
107 |
| Germany |
13 |
41 |
219 |
3 |
0 |
268 |
5 |
3 |
552 |
| Spain |
10 |
24 |
83 |
0 |
0 |
81 |
2 |
1 |
201 |
| Portugal |
4 |
7 |
85 |
0 |
2 |
40 |
0 |
0 |
138 |
| Denmark |
2 |
5 |
80 |
0 |
0 |
109 |
2 |
0 |
198 |
| Greece |
16 |
9 |
65 |
0 |
1 |
46 |
0 |
0 |
137 |
| Cyprus |
2 |
2 |
13 |
0 |
0 |
16 |
0 |
0 |
33 |
| Czech Republic |
0 |
21 |
27 |
0 |
0 |
30 |
2 |
0 |
80 |
| Hungary |
5 |
18 |
105 |
0 |
0 |
86 |
3 |
0 |
217 |
| Slovakia |
5 |
18 |
25 |
0 |
0 |
54 |
0 |
0 |
102 |
| Finland |
0 |
4 |
9 |
0 |
0 |
18 |
0 |
0 |
31 |
| Lithuania |
0 |
1 |
6 |
0 |
1 |
7 |
0 |
0 |
15 |
| Poland |
6 |
24 |
104 |
0 |
0 |
116 |
5 |
2 |
257 |
| Russia and USSR |
12 |
137 |
153 |
0 |
1 |
442 |
5 |
3 |
753 |
| Ukraine |
8 |
19 |
79 |
0 |
0 |
197 |
0 |
0 |
303 |
| Moldova |
4 |
0 |
20 |
0 |
0 |
9 |
0 |
0 |
33 |
| Belarus |
1 |
1 |
19 |
0 |
0 |
37 |
0 |
0 |
58 |
| Bosnia-Herzegovina |
3 |
41 |
93 |
0 |
0 |
68 |
9 |
0 |
214 |
| Macedonia |
3 |
6 |
37 |
0 |
0 |
19 |
3 |
0 |
68 |
| Croatia |
4 |
6 |
33 |
0 |
0 |
15 |
0 |
0 |
58 |
| Serbia |
12 |
19 |
101 |
0 |
0 |
79 |
0 |
0 |
211 |
| Yugoslavia |
0 |
6 |
55 |
1 |
0 |
42 |
0 |
0 |
104 |
| Romania |
50 |
39 |
300 |
0 |
1 |
227 |
0 |
0 |
617 |
| Bulgaria |
5 |
198 |
162 |
0 |
0 |
124 |
4 |
0 |
493 |
| Albania |
2 |
6 |
12 |
0 |
0 |
46 |
2 |
0 |
68 |
| Kosovo |
1 |
6 |
4 |
0 |
0 |
12 |
0 |
0 |
23 |
| Armenia |
9 |
8 |
130 |
0 |
0 |
97 |
2 |
0 |
246 |
| Georgia |
11 |
5 |
55 |
0 |
0 |
26 |
2 |
0 |
99 |
| Azerbaidjan |
1 |
7 |
13 |
0 |
0 |
45 |
0 |
0 |
66 |
| Other European Nationalities |
0 |
8 |
38 |
1 |
0 |
28 |
0 |
0 |
75 |
| Total |
296 |
1.161 |
5.191 |
9 |
9 |
5.282 |
51 |
41 |
12.040 |
| AFRICA |
0 |
0 |
0 |
0 |
0 |
0 |
0 |
0 |
|
| Ethiopia |
1.197 |
62 |
3.154 |
0 |
72.594 |
266 |
2 |
4 |
77.279 |
| Eritrea |
10 |
107 |
259 |
0 |
202 |
545 |
3 |
9 |
1.135 |
| Sudan |
185 |
227 |
2.759 |
0 |
348 |
1.022 |
3 |
7 |
4.551 |
| Senegal |
5 |
35 |
27 |
0 |
11 |
60 |
45 |
0 |
183 |
| Gambia |
0 |
3 |
5 |
0 |
4 |
7 |
18 |
0 |
37 |
| Guinea |
0 |
2 |
16 |
0 |
1 |
19 |
9 |
0 |
47 |
| Mauritania |
13 |
51 |
12 |
0 |
4 |
56 |
6 |
0 |
142 |
| Mali |
3 |
2 |
14 |
0 |
42 |
12 |
21 |
0 |
94 |
| Niger |
1 |
17 |
36 |
0 |
0 |
63 |
22 |
0 |
139 |
| Burkina Faso |
1 |
2 |
9 |
0 |
1 |
9 |
20 |
0 |
42 |
| Benin |
6 |
17 |
36 |
0 |
3 |
37 |
59 |
0 |
158 |
| Liberia |
0 |
20 |
56 |
0 |
3 |
116 |
0 |
5 |
200 |
| Sierra Leone |
31 |
13 |
46 |
0 |
5 |
27 |
0 |
0 |
122 |
| Togo |
2 |
6 |
14 |
0 |
40 |
10 |
9 |
0 |
81 |
| Ivory Coast |
0 |
0 |
10 |
0 |
8 |
9 |
6 |
0 |
33 |
| Nigeria |
10 |
111 |
126 |
0 |
4 |
233 |
63 |
0 |
547 |
| South Africa |
30 |
64 |
344 |
0 |
1 |
195 |
0 |
1 |
635 |
| Swaziland |
1 |
7 |
1 |
0 |
0 |
12 |
0 |
0 |
21 |
| Zimbabwe |
10 |
6 |
31 |
0 |
1 |
24 |
0 |
0 |
72 |
| Chad |
1 |
11 |
76 |
0 |
7 |
55 |
12 |
0 |
162 |
| Cameroon |
0 |
0 |
17 |
0 |
1 |
3 |
3 |
0 |
24 |
| Somalia |
117 |
374 |
962 |
0 |
36 |
2.125 |
38 |
9 |
3.661 |
| Djibouti |
0 |
9 |
10 |
0 |
1 |
23 |
6 |
0 |
49 |
| Madagascar |
22 |
0 |
1 |
0 |
1.199 |
3 |
0 |
0 |
1.225 |
| Mauritius |
19 |
3 |
4 |
0 |
2 |
8 |
5 |
0 |
41 |
| Ghana |
27 |
15 |
395 |
0 |
297 |
43 |
14 |
0 |
791 |
| Uganda |
4 |
3 |
18 |
0 |
239 |
12 |
4 |
0 |
280 |
| Malawi |
0 |
10 |
0 |
0 |
0 |
15 |
0 |
0 |
25 |
| Tanzania |
1 |
7 |
25 |
0 |
1 |
22 |
13 |
0 |
69 |
| Kenya |
5 |
27 |
122 |
0 |
9 |
96 |
2 |
0 |
261 |
| Comore Islands |
1 |
4 |
31 |
0 |
1 |
28 |
12 |
1 |
78 |
| Seychelles Islands |
1 |
2 |
4 |
0 |
1 |
9 |
0 |
0 |
17 |
| Other African Nationalities |
1 |
20 |
29 |
0 |
3 |
59 |
11 |
0 |
123 |
| Total |
1.704 |
1.237 |
8.649 |
0 |
75.069 |
5.223 |
406 |
36 |
92.324 |
| AMERICA AND OCEANIA |
0 |
0 |
0 |
0 |
0 |
0 |
0 |
0 |
|
| U.S.A |
449 |
586 |
7.207 |
9 |
4 |
4.987 |
5 |
20 |
13.267 |
| Canada |
68 |
290 |
2.326 |
9 |
1 |
3.796 |
7 |
33 |
6.530 |
| Dominican Republic |
4 |
22 |
77 |
0 |
1 |
179 |
0 |
2 |
285 |
| Venezuela |
2 |
9 |
88 |
0 |
0 |
125 |
0 |
0 |
224 |
| Colombia |
1 |
2 |
47 |
0 |
0 |
43 |
0 |
1 |
94 |
| Trinidad and Tobago |
1 |
0 |
11 |
0 |
0 |
12 |
0 |
0 |
24 |
| Granada |
0 |
6 |
4 |
0 |
0 |
7 |
0 |
0 |
17 |
| Jamaica |
0 |
4 |
7 |
0 |
1 |
5 |
0 |
0 |
17 |
| Mexico |
2 |
3 |
13 |
0 |
0 |
42 |
0 |
0 |
60 |
| Brasil |
24 |
16 |
71 |
0 |
0 |
86 |
0 |
1 |
198 |
| Bolivia |
0 |
2 |
12 |
0 |
0 |
40 |
0 |
1 |
55 |
| Peru |
1 |
4 |
7 |
0 |
0 |
7 |
0 |
0 |
19 |
| Ecuador |
0 |
0 |
8 |
0 |
0 |
12 |
0 |
1 |
21 |
| Argentina |
5 |
4 |
53 |
0 |
0 |
25 |
0 |
1 |
88 |
| Australia |
9 |
49 |
351 |
0 |
0 |
645 |
0 |
4 |
1.058 |
| New Zealand |
9 |
5 |
121 |
0 |
0 |
175 |
0 |
1 |
311 |
| Fiji Islands |
2 |
6 |
43 |
0 |
0 |
5 |
0 |
0 |
56 |
| Other American and Oceanian Nationalities |
3 |
13 |
39 |
0 |
3 |
52 |
0 |
1 |
111 |
| Total |
580 |
1.021 |
10.485 |
18 |
10 |
10.243 |
13 |
66 |
22.436 |
| U.N. |
0 |
4 |
0 |
0 |
0 |
2 |
0 |
0 |
6 |
| Unknown Nationalities |
0 |
0 |
0 |
0 |
1 |
0 |
0 |
0 |
1 |
| GRAND TOTAL |
50.074 |
97.629 |
1.065.494 |
347 |
607.667 |
475.688 |
820 |
1.972 |
2.299.691 |
Source: Ministry of Interior
ANNEXED NOTE
1. Definitions
Residency procedures do not apply to GCC nationals.
The bidoun, a stateless population, are not included in the residency documents holders.
Data presented in the table are stock data: all the non-national residents holding a residence permit on December 31st, the given year. The table excludes the Bedoon, the non-Kuwaiti GCC citizens and those in irregular situation.
Temporary permit: An expatriate may be granted temporary residence under article 14 of the immigration regulations in special cases where he does not need or cannot get ordinary residence.
This allows the expatriate to stay for up to one year, for personal emergencies such as illness, or after resignation from employment in order to settle financial affairs or a court case.
Dependent permit: spouse, children or elderly dependent relatives can join visa holder (sponsor) in Kuwait, if the expatriate has obtained a residency and is earning a minimum of KD250 a month (private and governement sector alike).
A working wife cannot sponsor her husband as a dependent. Also, sons over the age of 21 years cannot be sponsored as dependants, though adult daughters and parents may be permitted. Dependent family members are not allowed to work on a Dependent Visa, unless they transfer it into a work visa under Kuwaiti sponsorship. This can be done only after 6 to 12 months of holding a dependent visa.
Every children including new born babies must hold a residency permit. The application for the infant’s residence must be made within 60 days of the birth
The Dependent Visa holder is permitted to stay as long as the sponsor holds a valid visa.
Self residence permit: Expatriates may sponsor themselves under article 24 of the regulations and obtain a residence for two to five years under several conditions
(among which: being aged 60 and more, having worked no less than 25 years in Kuwait, owning a capital of 10000 KD at least; being able to produce a certificate of good conduct, being effectively residing in Kuwait with his/her family, etc.).
This form of residence can be renewed upon expiry. Self-sponsored expatriates may sponsor their wives and children.
Permits 17, 18, 19 and 20 are only granted after Ministry of Labour issues a work permit.
2. Institution which provides data
Ministry of Interior
3. Period of data coverage
December 31st, 2012
4. Data availability
Data on residence permits by country of citizenship is not published by Kuwaiti authorities (as of September 2013). The present data has been obtained from MoI.
| reference |
Type / purpose of permit |
|
2009 |
|
|
2011 |
|
|
2012 |
|
| of permit |
|
males |
females |
total |
males |
females |
total |
males |
females |
total |
| 14 |
Temporary permits |
14.220 |
6.338 |
20.558 |
29.846 |
7.436 |
37.282 |
40.821 |
9.253 |
50.074 |
| 17 |
Governmental sector permits |
57.478 |
29.176 |
86.654 |
62.321 |
34.424 |
96.745 |
62.795 |
34.834 |
97.629 |
| 18 |
Private sector permits |
920.160 |
73.011 |
993.171 |
937.050 |
81.152 |
1.018.202 |
977.139 |
88.355 |
1.065.494 |
| 19 |
Business |
362 |
13 |
375 |
327 |
15 |
342 |
331 |
16 |
347 |
| 20 |
Domestic help |
245.738 |
308.759 |
554.497 |
255.333 |
337.937 |
593.270 |
257.834 |
349.833 |
607.667 |
| 22 |
Dependant permits |
153.988 |
266.269 |
420.257 |
166.254 |
288.863 |
455.117 |
173.332 |
302.356 |
475.688 |
| 23 |
Study |
510 |
176 |
686 |
579 |
186 |
765 |
629 |
191 |
820 |
| 24 |
Self residence permits |
845 |
903 |
1.748 |
886 |
948 |
1.834 |
962 |
1.010 |
1.972 |
| |
TOTAL |
1.393.301 |
684.645 |
2.077.946 |
1.452.596 |
750.961 |
2.203.557 |
1.513.843 |
785.848 |
2.299.691 |
Source: Ministry of Interior
ANNEXED NOTE
1. Definitions
Residency procedures do not apply to GCC nationals.
The bidoun, a stateless population, are not included in the residency documents holders.
Data presented in the table are stock data: all the non-national residents holding a residence permit on December 31st, the given year. The table excludes the Bedoon, the non-Kuwaiti GCC citizens and those in irregular situation.
Temporary permit: An expatriate may be granted temporary residence under article 14 of the immigration regulations in special cases where he does not need or cannot get ordinary residence.
This allows the expatriate to stay for up to one year, for personal emergencies such as illness, or after resignation from employment in order to settle financial affairs or a court case.
Dependent permit: spouse, children or elderly dependent relatives can join visa holder (sponsor) in Kuwait, if the expatriate has obtained a residency and is earning a minimum of KD250 a month (private and governement sector alike).
A working wife cannot sponsor her husband as a dependent. Also, sons over the age of 21 years cannot be sponsored as dependants, though adult daughters and parents may be permitted. Dependent family members are not allowed to work on a Dependent Visa, unless they transfer it into a work visa under Kuwaiti sponsorship. This can be done only after 6 to 12 months of holding a dependent visa.
Every children including new born babies must hold a residency permit. The application for the infant’s residence must be made within 60 days of the birth
The Dependent Visa holder is permitted to stay as long as the sponsor holds a valid visa.
Self residence permit: Expatriates may sponsor themselves under article 24 of the regulations and obtain a residence for two to five years under several conditions
(among which: being aged 60 and more, having worked no less than 25 years in Kuwait, owning a capital of 10000 KD at least; being able to produce a certificate of good conduct, being effectively residing in Kuwait with his/her family, etc.).
This form of residence can be renewed upon expiry. Self-sponsored expatriates may sponsor their wives and children.
Permits 17, 18, 19 and 20 are only granted after Ministry of Labour issues a work permit.
2. Institution which provides data
Ministry of Interior
3. Period of data coverage
December 31st, given years.
4. Data availability
a- 2009′ data is published in MoI’ 2009 Statistical Yearbook, in Chapter “Immigration statistics”, available online at: http://www.moi.gov.kw/portal/varabic/statistics/stats.htm
Last date of access: September 3rd, 2013.
b- 2011′ data is tabulated in MoI’ 2011 Statistical Yearbook, in Chapter “Immigration statistics” (not available online). The volume may be directly obtained from MoI.
c- 2012 data is unpublished as of June 2013 and has been obtained from MoI.
| reference number of permit |
Type of permit |
2009 |
2011 |
2012 |
| 14 |
Temporary permits |
20,558 |
37,282 |
50,074 |
| 17 |
Governmental sector permits |
86,654 |
96,745 |
97,629 |
| 18 |
Private sector permits |
893,171 |
1,018,202 |
1,065,494 |
| 19 |
Business |
375 |
342 |
347 |
| 20 |
Domestic help |
654,497 |
593,270 |
607,667 |
| 22 |
Dependant permits |
420,257 |
455,117 |
475,688 |
| 23 |
Study |
686 |
765 |
820 |
| 24 |
Self residence permits |
1,748 |
1,834 |
1,972 |
|
TOTAL |
2,077,946 |
2,203,557 |
2,299,691 |
Source: Ministry of Interior
ANNEXED NOTE
1. Definitions
Residency procedures do not apply to GCC nationals.
The bidoun, a stateless population, are not included in the residency documents holders.
Data presented in the table are stock data: all the non-national residents holding a residence permit on December 31st, the given year. The table excludes the Bedoon, the non-Kuwaiti GCC citizens and those in irregular situation.
Temporary permit: An expatriate may be granted temporary residence under article 14 of the immigration regulations in special cases where he does not need or cannot get ordinary residence.
This allows the expatriate to stay for up to one year, for personal emergencies such as illness, or after resignation from employment in order to settle financial affairs or a court case.
Dependent permit: spouse, children or elderly dependent relatives can join visa holder (sponsor) in Kuwait, if the expatriate has obtained a residency and is earning a minimum of KD250 a month (private and governement sector alike).
A working wife cannot sponsor her husband as a dependent. Also, sons over the age of 21 years cannot be sponsored as dependants, though adult daughters and parents may be permitted. Dependent family members are not allowed to work on a Dependent Visa, unless they transfer it into a work visa under Kuwaiti sponsorship. This can be done only after 6 to 12 months of holding a dependent visa.
Every children including new born babies must hold a residency permit. The application for the infant’s residence must be made within 60 days of the birth
The Dependent Visa holder is permitted to stay as long as the sponsor holds a valid visa.
Self residence permit: Expatriates may sponsor themselves under article 24 of the regulations and obtain a residence for two to five years under several conditions
(among which: being aged 60 and more, having worked no less than 25 years in Kuwait, owning a capital of 10000 KD at least; being able to produce a certificate of good conduct, being effectively residing in Kuwait with his/her family, etc.).
This form of residence can be renewed upon expiry. Self-sponsored expatriates may sponsor their wives and children.
Permits 17, 18, 19 and 20 are only granted after Ministry of Labour issues a work permit.
2. Institution which provides data
Ministry of Interior
3. Period of data coverage
December 31st, given years.
4. Data availability
a- 2009′ data is published in MoI’ 2009 Statistical Yearbook, in Chapter “Immigration statistics”, available online at: http://www.moi.gov.kw/portal/varabic/statistics/stats.htm
Last date of access: September 3rd, 2013.
b- 2011′ data is tabulated in MoI’ 2011 Statistical Yearbook, in Chapter “Immigration statistics” (not available online). The volume may be directly obtained from MoI.
c- 2012 data is unpublished as of June 2013 and has been obtained from MoI.
| Country of citizenship |
2.009 |
2011 |
2012 |
| ARAB COUNTRIES |
| Iraq |
15.495 |
15.378 |
15.162 |
| Syria |
131.115 |
132.001 |
133.873 |
| Lebanon |
43.345 |
42.311 |
42.105 |
| Jordan |
50.104 |
53.155 |
54.468 |
| Palestine |
0 |
8.048 |
578 |
| Egypt |
427.017 |
457.591 |
468.600 |
| Other Arabs |
29.936 |
24.629 |
25.259 |
| Total Arab nationalities |
697.012 |
733.113 |
740.045 |
| OTHER COUNTRIES |
| Iran |
46.799 |
43.793 |
42.128 |
| Philippines |
109.852 |
139.964 |
159.307 |
| Pakistan |
127.433 |
122.631 |
117.626 |
| India |
595.054 |
647.295 |
678.377 |
| Bangladesh |
208.614 |
195.540 |
185.434 |
| Sri Lanka |
101.418 |
110.830 |
107.713 |
| Other nationalities |
191.764 |
210.391 |
269.061 |
| TOTAL ALL NATIONALITIES |
2.077.946 |
2.203.557 |
2.299.691 |
Source: Ministry of Interior
ANNEXED NOTE
1. Definitions
Residency procedures do not apply to GCC nationals.
The bidoun, a stateless population, are not included in the residency documents holders.
The table refers to all types of residency permits, i.e. granted under articles 14, 17, 18, 19, 20, 22, 23, 24 of the immigration regulations.
Data presented in the table are stock data: all the non-national residents holding a residence permit on December 31st, the given year. The table excludes the Bidoun, the non-Kuwaiti GCC citizens and those in irregular situation.
2. Institution which provides data
Ministry of Interior
3. Period of data coverage
December 31st, 2011
4. Data availability
a- 2009′ data is published in MoI’ 2009 Statistical Yearbook, in Chapter “Immigration statistics”, available online at: http://www.moi.gov.kw/portal/varabic/statistics/stats.htm
Last date of access: September 3rd, 2013.
b- 2011′ data is tabulated in MoI’ 2011 Statistical Yearbook, in Chapter “Immigration statistics” (not available online). The volume may be directly obtained from MoI.
c- 2012 data is unpublished as of September 2013 and has been obtained from MoI.
| Country of citizenship |
All residence permits |
| ARAB COUNTRIES |
|
| Iraq |
15.262 |
| Syria |
135.554 |
| Lebanon |
42.586 |
| Jordan |
55.081 |
| Yemen |
10.762 |
| Palestine |
579 |
| Algeria |
845 |
| Egypt |
482.692 |
| Morocco |
3.495 |
| Tunisia |
2.863 |
| Libya |
149 |
| Palestinian from Egypt |
6.153 |
| Palestinian from Lebanon |
962 |
| Palestinian from Syria |
372 |
| Palestinian from Iraq |
3 |
| Non-Kuwaiti |
6 |
| Saudi |
1 |
| Total |
757.365 |
| ASIA |
|
| Afghanistan |
13.689 |
| Uzbekistan |
114 |
| Kyrgyzstan |
58 |
| Tajikstan |
34 |
| Kazakhstan |
34 |
| Mongolia |
16 |
| Turkey |
2.272 |
| Iran |
42.638 |
| Malaysia |
441 |
| Japan |
126 |
| Indonesia |
14.036 |
| Philippines |
161.742 |
| Pakistan |
120.040 |
| India |
692.525 |
| China |
3.903 |
| Taiwan |
19 |
| South Korea |
1.118 |
| Singapore |
59 |
| Bangladesh |
190.171 |
| Thailand |
2.463 |
| Sri Lanka |
109.860 |
| Nepal |
55.486 |
| Bhutan |
23 |
| North Korea |
3.571 |
| Vietnam |
598 |
| Cambodia |
47 |
| Myanmar |
349 |
| Other Asian Nationalities |
87 |
| Total |
1.415.519 |
| EUROPE |
|
| Britain |
4.177 |
| Ireland |
213 |
| France |
908 |
| Holland |
292 |
| Belgium |
94 |
| Italy |
405 |
| Malta |
23 |
| Sweden |
268 |
| Norway |
57 |
| Switzerland |
46 |
| Austria |
107 |
| Germany |
552 |
| Spain |
201 |
| Portugal |
138 |
| Denmark |
198 |
| Greece |
137 |
| Cyprus |
33 |
| Czech Republic |
80 |
| Hungary |
217 |
| Slovakia |
102 |
| Finland |
31 |
| Lithuania |
15 |
| Poland |
257 |
| Russia and USSR |
753 |
| Ukraine |
303 |
| Moldova |
33 |
| Belarus |
58 |
| Bosnia-Herzegovina |
214 |
| Macedonia |
68 |
| Croatia |
58 |
| Serbia |
211 |
| Yugoslavia |
104 |
| Romania |
617 |
| Bulgaria |
493 |
| Albania |
68 |
| Kosovo |
23 |
| Armenia |
246 |
| Georgia |
99 |
| Azerbaidjan |
66 |
| Other European Nationalities |
75 |
| Total |
12.040 |
| AFRICA |
|
| Ethiopia |
77.279 |
| Eritrea |
1.135 |
| Sudan |
4.551 |
| Senegal |
183 |
| Gambia |
37 |
| Guinea |
47 |
| Mauritania |
142 |
| Mali |
94 |
| Niger |
139 |
| Burkina Faso |
42 |
| Benin |
158 |
| Liberia |
200 |
| Sierra Leone |
122 |
| Togo |
81 |
| Ivory Coast |
33 |
| Nigeria |
547 |
| South Africa |
635 |
| Swaziland |
21 |
| Zimbabwe |
72 |
| Chad |
162 |
| Cameroon |
24 |
| Somalia |
3.661 |
| Djibouti |
49 |
| Madagascar |
1.225 |
| Mauritius |
41 |
| Ghana |
791 |
| Uganda |
280 |
| Malawi |
25 |
| Tanzania |
69 |
| Kenya |
261 |
| Comore Islands |
78 |
| Seychelles Islands |
17 |
| Other African Nationalities |
123 |
| Total |
92.324 |
| AMERICA AND OCEANIA |
|
| U.S.A |
13.267 |
| Canada |
6.530 |
| Dominican Republic |
285 |
| Venezuela |
224 |
| Colombia |
94 |
| Trinidad and Tobago |
24 |
| Granada |
17 |
| Jamaica |
17 |
| Mexico |
60 |
| Brasil |
198 |
| Bolivia |
55 |
| Peru |
19 |
| Ecuador |
21 |
| Argentina |
88 |
| Australia |
1.058 |
| New Zealand |
311 |
| Fiji Islands |
56 |
| Other American and Oceanian Nationalities |
111 |
| Total |
22.436 |
| U.N. |
6 |
| Unknown Nationalities |
1 |
| GRAND TOTAL |
2.299.691 |
Source: Ministry of Interior
ANNEXED NOTE
1. Definitions
Residency procedures do not apply to GCC nationals.
The bidoun, a stateless population, are not included in the residency documents holders.
The table refers to all types of residency permits, i.e. granted under articles 14, 17, 18, 19, 20, 22, 23, 24 of the immigration regulations.
Data presented in the table are stock data: all the non-national residents holding a residence permit on December 31st, the given year. The table excludes the Bedoon, the non-Kuwaiti GCC citizens and those in irregular situation.
2. Institution which provides data
Ministry of Interior
3. Period of data coverage
December 31st, 2012
4. Data availability
Data on residence permits by country of citizenship is not published by Kuwaiti authorities (as of September 15th, 2013). The present data has been obtained from MoI.
ARRIVALS
| Groups of countries |
1995 |
1996 |
1997 |
1998 |
1999 |
2000 |
2001 |
2002 |
2003 |
2004 |
2005 |
2006 |
2007 |
2008 |
2009 |
2010 |
2011 |
| Kuwait |
847.846 |
971.637 |
1.066.757 |
1.223.459 |
1.191.092 |
1.354.962 |
1.638.307 |
1.693.212 |
1.753.923 |
1.909.480 |
2.149.827 |
2.456.901 |
2.714.495 |
2.866.762 |
3.234.577 |
3.323.671 |
3.481.257 |
| GCC Countries |
n.a. |
939.134 |
993.233 |
1.058.316 |
1.130.123 |
971.329 |
1.277.051 |
1.409.905 |
1.523.604 |
1.788.683 |
1.185.704 |
1.320.989 |
1.531.896 |
1.620.195 |
1.830.066 |
1.925.718 |
2.281.844 |
| Other Arab countries |
841.251 |
926.387 |
1.115.053 |
1.188.381 |
1.199.130 |
1.212.091 |
1.186.927 |
| Non-Arab Asian countries |
n.a. |
521.209 |
530.615 |
584.287 |
621.884 |
510.266 |
678.210 |
767.481 |
872.359 |
1.016.171 |
1.164.862 |
1.322.351 |
1.429.068 |
1.468.120 |
1.561.287 |
1.554.207 |
1.578.496 |
| Non-Arab African countries |
n.a. |
4.304 |
4.116 |
6.184 |
5.349 |
467.120 |
5.551 |
5.798 |
8.298 |
9.681 |
13.109 |
18.602 |
26.265 |
34.258 |
40.533 |
60.665 |
78.728 |
| Europe |
n.a. |
55.999 |
59.948 |
60.491 |
68.684 |
66.121 |
63.455 |
73.939 |
85.137 |
112.152 |
121.507 |
135.618 |
157.487 |
163.041 |
167.479 |
175.406 |
172.922 |
| America |
n.a. |
27.215 |
31.815 |
33.392 |
39.191 |
39.479 |
39.261 |
50.267 |
103.447 |
115.260 |
131.644 |
155.203 |
189.775 |
219.039 |
229.288 |
226.943 |
222.973 |
| Australia and Pacific |
n.a. |
3.463 |
3.621 |
3.769 |
4.327 |
4.529 |
4.453 |
5.230 |
7.219 |
10.922 |
13.002 |
16.339 |
18.243 |
19.179 |
21.286 |
19.198 |
15.479 |
| Other |
n.a. |
13.736 |
14.472 |
16.200 |
14.071 |
23.384 |
3.635 |
2.950 |
2.236 |
3.224 |
3.188 |
3.616 |
13.847 |
23.697 |
38.712 |
33.557 |
36.933 |
| Total non-Kuwaitis |
0 |
1.565.060 |
1.637.820 |
1.762.639 |
1.883.629 |
2.082.228 |
2.071.616 |
2.315.570 |
2.602.300 |
3.056.093 |
3.474.267 |
3.899.105 |
4.481.634 |
4.735.910 |
5.087.781 |
5.207.785 |
5.574.302 |
| Grand total |
847.846 |
2.536.697 |
2.704.577 |
2.986.098 |
3.074.721 |
3.437.190 |
3.709.923 |
4.008.782 |
4.356.223 |
4.965.573 |
5.624.094 |
6.356.006 |
7.196.129 |
7.602.672 |
8.322.358 |
8.531.456 |
9.055.559 |
DEPARTURES
| Groups of countries |
1995 |
1996 |
1997 |
1998 |
1999 |
2000 |
2001 |
2002 |
2003 |
2004 |
2005 |
2006 |
2007 |
2008 |
2009 |
2010 |
2011 |
| Kuwait |
878.222 |
1.050.877 |
1.097.410 |
1.263.584 |
1.208.742 |
1.236.431 |
1.666.029 |
1.725.271 |
1.773.781 |
1.927.851 |
2.172.839 |
2.529.313 |
2.648.845 |
2.899.114 |
3.251.020 |
3.330.064 |
3.484.743 |
| GCC Countries |
687.198 |
952.727 |
1.008.681 |
1.078.016 |
1.144.389 |
870.636 |
1.637.747 |
1.409.434 |
1.505.863 |
1.749.208 |
1.178.081 |
1.308.567 |
1.539.347 |
1.626.516 |
1.817.341 |
1.921.482 |
2.274.580 |
| Other Arab countries |
825.887 |
920.807 |
1.077.131 |
1.182.075 |
1.215.340 |
1.207.493 |
1.167.598 |
| Non-Arab Asian countries |
423.764 |
482.795 |
516.468 |
561.388 |
601.052 |
490.443 |
659.906 |
722.515 |
782.746 |
897.580 |
1.071.383 |
1.270.153 |
1.422.153 |
1.496.161 |
1.569.585 |
1.543.328 |
1.575.576 |
| Non-Arab African countries |
195.443 |
3.858 |
4.258 |
6.221 |
5.452 |
487.793 |
5.728 |
6.234 |
7.917 |
9.336 |
12.601 |
16.894 |
20.118 |
24.575 |
32.963 |
39.478 |
49.865 |
| Europe |
49.776 |
55.943 |
60.572 |
61.104 |
68.206 |
66.884 |
63.789 |
72.276 |
80.450 |
108.584 |
119.276 |
134.754 |
153.714 |
157.415 |
167.541 |
173.568 |
171.244 |
| America |
24.784 |
27.917 |
32.540 |
34.223 |
39.206 |
304.101 |
273.924 |
47.731 |
77.212 |
106.068 |
122.644 |
142.924 |
169.549 |
192.728 |
209.929 |
203.706 |
195.533 |
| Australia and Pacific |
3.106 |
3.845 |
4.028 |
4.066 |
4.617 |
4.591 |
4.526 |
5.192 |
6.635 |
10.390 |
12.908 |
15.868 |
17.031 |
17.999 |
20.773 |
19.154 |
15.540 |
| Other |
11.295 |
15.367 |
15.846 |
17.619 |
15.356 |
13.084 |
3.832 |
3.079 |
2.359 |
3.337 |
3.622 |
4.242 |
14.339 |
24.548 |
39.297 |
34.686 |
37.330 |
| Total non-Kuwaitis |
1.395.366 |
1.542.452 |
1.642.393 |
1.762.637 |
1.878.278 |
2.237.532 |
2.649.452 |
2.266.461 |
2.463.182 |
2.884.503 |
3.346.402 |
3.814.209 |
4.413.382 |
4.722.017 |
5.072.769 |
5.142.895 |
5.487.266 |
| Grand total |
2.273.588 |
2.593.329 |
2.739.803 |
3.026.221 |
3.087.020 |
3.473.963 |
4.315.481 |
3.991.732 |
4.236.963 |
4.812.354 |
5.519.241 |
6.343.522 |
7.062.227 |
7.621.131 |
8.323.789 |
8.472.959 |
8.972.009 |
Source: Ministry of Interior
ANNEXED NOTE
1. Definitions
Kuwait and the countries classified as “Arab countries” are the 22 members of the League of the Arab States:
Kuwait and the other Gulf Cooperation Council member states (Saudi Arabia; the UAE; Bahrain; Oman, Qatar), as well as Yemen; Syria; Lebanon; Jordan; Palestine; Iraq; Egypt; Libya; Tunisia; Algeria; Morocco; Mauritania; Sudan; Djibouti; Comores Islands; Somalia.
2. Institution which provides data
Central Statistical Bureau (CSB), Ministry of Planning
3. Data availability
Published in the CSB’ Statistical Yearbooks, in Chapter “Transport and Communication”
Statistical Yearbooks are available online at: http://www.csb.gov.kw/Socan_Statistic_EN.aspx?ID=18 (website in English) and at http://www.csb.gov.kw/Socan_Statistic.aspx (Arabic website).
Volumes are bilingual (English and Arabic). Every Yearbook is published in PDF format since 2000 and a selection of 1964 to 1999 volumes is also available in one publication.
Date of access: May 2013.
| Country of citizenship |
estimate of irregular residents |
| Afghanistan |
1.015 |
| Albania |
9 |
| Algeria |
55 |
| Armenia |
6 |
| Australia |
240 |
| Austria |
39 |
| Bangladesh |
19.857 |
| Belgium |
0 |
| Benin |
4 |
| Bosnia-Herzegovina |
18 |
| Brasil |
15 |
| Britain |
996 |
| Canada |
184 |
| Chad |
25 |
| China |
280 |
| Croatia |
7 |
| Cyprus |
1 |
| Czech Republic |
56 |
| Denmark |
82 |
| Djibouti |
0 |
| Dominican Republic |
45 |
| Egypt |
4.066 |
| Eritrea |
63 |
| Ethiopia |
741 |
| France |
175 |
| Gambia |
5 |
| Georgia |
4 |
| Germany |
143 |
| Ghana |
11 |
| Holland |
83 |
| Hungary |
9 |
| India |
12.184 |
| Indonesia |
6.684 |
| Iran |
1.493 |
| Iraq |
762 |
| Ireland |
40 |
| Italy |
160 |
| Japan |
69 |
| Jordan |
979 |
| Kazakhstan |
10 |
| Kenya |
9 |
| Lebanon |
664 |
| Liberia |
30 |
| Libya |
21 |
| Macedonia |
4 |
| Madagascar |
1 |
| Malaysia |
56 |
| Mali |
0 |
| Mexico |
9 |
| Morocco |
94 |
| Myanmar |
0 |
| Nepal |
1.266 |
| New Zealand |
29 |
| Niger |
5 |
| Nigeria |
26 |
| Non-Kuwaiti |
26 |
| North Korea |
28 |
| Other African Nationalities |
2 |
| Other American Nationalities |
0 |
| Pakistan |
2.808 |
| Palestine |
3 |
| Palestinian from Egypt |
217 |
| Palestinian from Lebanon |
28 |
| Palestinian from Syria |
15 |
| Philippines |
4.437 |
| Poland |
32 |
| Portugal |
14 |
| Romania |
26 |
| Russia and USSR |
84 |
| Saudi |
7 |
| Serbia |
7 |
| Seychelles Islands |
0 |
| Sierra Leone |
4 |
| Slovakia |
12 |
| Somalia |
167 |
| South Africa |
93 |
| South Korea |
43 |
| Spain |
51 |
| Sri Lanka |
10.382 |
| Sudan |
216 |
| Sweden |
41 |
| Switzerland |
16 |
| Syria |
2.092 |
| Thailand |
60 |
| Tunisia |
41 |
| Turkey |
506 |
| U.S.A |
3.914 |
| Ukraine |
21 |
| Venezuela |
9 |
| Yemen |
222 |
| GRAND TOTAL |
78.453 |
Source: Ministry of Interior
ANNEXED NOTE
1. Data collection methodology
Upon ministerial decision 1054/2011, a grace period extending from March 1st to June 30st, 2011 has been granted to illegal expatriates willing to either regularize their status with Ministry of Interior (for residency) and Ministry of Social Affairs and Labour (MOSAL) (labour permits), or leave the country without penalty.
The illegal residents’ figure is obtained by substracting the regularized cases (departed, having adjusted their status) from the Ministry’s records on expatriates having failed to renew their residency documents upon expiry of the grace period (see table IRR 1.2).
The bidoun, a stateless population, are not included in the residency documents holders.
2. Institution which provides data
Ministry of Interior, General Department of Immigration
3. Data availability
Data have been obtained from the Ministry of Interior. They are not published or made available to the public.
|
residency law violators |
| 2007 |
4,236 |
| 2008 |
4,322 |
| 2009 |
4,817 |
| 2010 |
5,900 |
| 2011 |
16,315 |
Source: Ministry of Interior records.
ANNEXED NOTE
1. Definitions
The figure is a record of routinely apprehended migrants in all categories of irregular sojourn:
tourist visa or expired residency overstayers, persons without residency document, having crossed the border illegally, etc.
The bidoun, a stateless population, are not included in the residency documents holders.
2. Institution which provides data
Ministry of Interior
3. Period of data coverage
December 31st, given years
4. Data availability
Figures of violators of residency law only appear in MoI’ 2011 Statistical Yearbook, in Chapter “Immigration statistics” (not available online). The volume may be directly obtained from MoI.
Date of access: August 2013
| Country of citizenship |
Residency law violators as of |
Regularized cases |
Remaining irregulars |
| February 28th, 2011 |
Departure |
Regularization of status |
| Afghanistan |
1.477 |
246 |
216 |
1.015 |
| Albania |
14 |
4 |
1 |
9 |
| Algeria |
60 |
2 |
3 |
55 |
| Armenia |
8 |
0 |
2 |
6 |
| Australia |
244 |
2 |
2 |
240 |
| Austria |
41 |
0 |
2 |
39 |
| Bangladesh |
26.019 |
4.891 |
1.271 |
19.857 |
| Belgium |
1 |
1 |
0 |
0 |
| Benin |
5 |
0 |
1 |
4 |
| Bosnia-Herzegovina |
20 |
1 |
1 |
18 |
| Brasil |
20 |
4 |
1 |
15 |
| Britain |
1.027 |
14 |
17 |
996 |
| Canada |
227 |
15 |
28 |
184 |
| Chad |
32 |
3 |
4 |
25 |
| China |
421 |
101 |
40 |
280 |
| Croatia |
9 |
2 |
0 |
7 |
| Cyprus |
3 |
2 |
0 |
1 |
| Czech Republic |
58 |
2 |
0 |
56 |
| Denmark |
83 |
0 |
1 |
82 |
| Djibouti |
1 |
0 |
1 |
0 |
| Dominican Republic |
49 |
0 |
4 |
45 |
| Egypt |
9.338 |
2.532 |
2.740 |
4.066 |
| Eritrea |
100 |
24 |
13 |
63 |
| Ethiopia |
2.055 |
732 |
582 |
741 |
| France |
184 |
7 |
2 |
175 |
| Gambia |
6 |
0 |
1 |
5 |
| Georgia |
7 |
3 |
0 |
4 |
| Germany |
149 |
2 |
4 |
143 |
| Ghana |
24 |
6 |
7 |
11 |
| Holland |
87 |
2 |
2 |
83 |
| Hungary |
16 |
4 |
3 |
9 |
| India |
24.433 |
9.585 |
2.664 |
12.184 |
| Indonesia |
9.199 |
2.116 |
399 |
6.684 |
| Iran |
1.961 |
164 |
304 |
1.493 |
| Iraq |
945 |
47 |
136 |
762 |
| Ireland |
42 |
0 |
2 |
40 |
| Italy |
163 |
1 |
2 |
160 |
| Japan |
74 |
3 |
2 |
69 |
| Jordan |
1.342 |
89 |
274 |
979 |
| Kazakhstan |
11 |
1 |
0 |
10 |
| Kenya |
10 |
0 |
1 |
9 |
| Lebanon |
961 |
69 |
228 |
664 |
| Liberia |
35 |
0 |
5 |
30 |
| Libya |
24 |
3 |
0 |
21 |
| Macedonia |
5 |
1 |
0 |
4 |
| Madagascar |
3 |
1 |
1 |
1 |
| Malaysia |
68 |
11 |
1 |
56 |
| Mali |
1 |
1 |
0 |
0 |
| Mexico |
10 |
0 |
1 |
9 |
| Morocco |
142 |
15 |
33 |
94 |
| Myanmar |
1 |
0 |
1 |
0 |
| Nepal |
3.788 |
2.035 |
487 |
1.266 |
| New Zealand |
32 |
2 |
1 |
29 |
| Niger |
6 |
1 |
0 |
5 |
| Nigeria |
31 |
3 |
2 |
26 |
| Non-Kuwaiti |
28 |
1 |
1 |
26 |
| North Korea |
45 |
6 |
11 |
28 |
| Other African Nationalities |
5 |
1 |
2 |
2 |
| Other American Nationalities |
2 |
1 |
1 |
0 |
| Pakistan |
5.225 |
1.366 |
1.051 |
2.808 |
| Palestine |
10 |
1 |
6 |
3 |
| Palestinian from Egypt |
249 |
2 |
30 |
217 |
| Palestinian from Lebanon |
31 |
1 |
2 |
28 |
| Palestinian from Syria |
21 |
0 |
6 |
15 |
| Philippines |
7.498 |
2.055 |
1.006 |
4.437 |
| Poland |
37 |
1 |
4 |
32 |
| Portugal |
15 |
1 |
0 |
14 |
| Romania |
29 |
1 |
2 |
26 |
| Russia and USSR |
86 |
0 |
2 |
84 |
| Saudi |
8 |
0 |
1 |
7 |
| Serbia |
9 |
1 |
1 |
7 |
| Seychelles Islands |
1 |
1 |
0 |
0 |
| Sierra Leone |
5 |
1 |
0 |
4 |
| Slovakia |
13 |
0 |
1 |
12 |
| Somalia |
216 |
17 |
32 |
167 |
| South Africa |
98 |
4 |
1 |
93 |
| South Korea |
52 |
3 |
6 |
43 |
| Spain |
52 |
1 |
0 |
51 |
| Sri Lanka |
16.267 |
4.969 |
916 |
10.382 |
| Sudan |
396 |
148 |
32 |
216 |
| Sweden |
43 |
2 |
0 |
41 |
| Switzerland |
17 |
0 |
1 |
16 |
| Syria |
3.442 |
477 |
873 |
2.092 |
| Thailand |
76 |
13 |
3 |
60 |
| Tunisia |
66 |
11 |
14 |
41 |
| Turkey |
544 |
20 |
18 |
506 |
| U.S.A |
4.117 |
131 |
72 |
3.914 |
| Ukraine |
26 |
1 |
4 |
21 |
| Venezuela |
11 |
1 |
1 |
9 |
| Yemen |
330 |
48 |
60 |
222 |
| GRAND TOTAL |
124.142 |
32.036 |
13.653 |
78.453 |
Source: Ministry of Interior
ANNEXED NOTE
1. Data collection methodology
Ministerial decision 1054/2011 granted a four-months grace period (March 1st to June 30st, 2011) to illegal expatriates willing to regularize their status with Ministry of Interior (residency) and Ministry of Social Affairs and Labour (MOSAL) (labour permits), or leave the country without penalty.
The estimate of the residency law violators on the eve of the amnesty period is obtained by adding subsequent regularizations (departures, regularizations of status),to estimates of remaining irregular migrants.
The illegal residents’ figure is obtained by substracting the regularized cases (departed, having adjusted their status) from the Ministry’s records on expatriates having failed to renew their residency documents.
The bidoun, a stateless population, are not included in the residency documents holders.
2. Institution which provides data
Ministry of Interior, General Department of Immigration
3. Data availability
Data have been obtained from the Ministry of Interior. They are not published or made available to the public.
| Country of citizenship |
Regularizations of status |
| Afghanistan |
216 |
| Albania |
1 |
| Algeria |
3 |
| Armenia |
2 |
| Australia |
2 |
| Austria |
2 |
| Bangladesh |
1.271 |
| Belgium |
0 |
| Benin |
1 |
| Bosnia-Herzegovina |
1 |
| Brasil |
1 |
| Britain |
17 |
| Canada |
28 |
| Chad |
4 |
| China |
40 |
| Croatia |
0 |
| Cyprus |
0 |
| Czech Republic |
0 |
| Denmark |
1 |
| Djibouti |
1 |
| Dominican Republic |
4 |
| Egypt |
2.740 |
| Eritrea |
13 |
| Ethiopia |
582 |
| France |
2 |
| Gambia |
1 |
| Georgia |
0 |
| Germany |
4 |
| Ghana |
7 |
| Holland |
2 |
| Hungary |
3 |
| India |
2.664 |
| Indonesia |
399 |
| Iran |
304 |
| Iraq |
136 |
| Ireland |
2 |
| Italy |
2 |
| Japan |
2 |
| Jordan |
274 |
| Kazakhstan |
0 |
| Kenya |
1 |
| Lebanon |
228 |
| Liberia |
5 |
| Libya |
0 |
| Macedonia |
0 |
| Madagascar |
1 |
| Malaysia |
1 |
| Mali |
0 |
| Mexico |
1 |
| Morocco |
33 |
| Myanmar |
1 |
| Nepal |
487 |
| New Zealand |
1 |
| Niger |
0 |
| Nigeria |
2 |
| Non-Kuwaiti |
1 |
| North Korea |
11 |
| Other African Nationalities |
2 |
| Other American Nationalities |
1 |
| Pakistan |
1.051 |
| Palestine |
6 |
| Palestinian from Egypt |
30 |
| Palestinian from Lebanon |
2 |
| Palestinian from Syria |
6 |
| Philippines |
1.006 |
| Poland |
4 |
| Portugal |
0 |
| Romania |
2 |
| Russia and USSR |
2 |
| Saudi |
1 |
| Serbia |
1 |
| Seychelles Islands |
0 |
| Sierra Leone |
0 |
| Slovakia |
1 |
| Somalia |
32 |
| South Africa |
1 |
| South Korea |
6 |
| Spain |
0 |
| Sri Lanka |
916 |
| Sudan |
32 |
| Sweden |
0 |
| Switzerland |
1 |
| Syria |
873 |
| Thailand |
3 |
| Tunisia |
14 |
| Turkey |
18 |
| U.S.A |
72 |
| Ukraine |
4 |
| Venezuela |
1 |
| Yemen |
60 |
| GRAND TOTAL |
13.653 |
Source: Ministry of Interior
ANNEXED NOTE
1. Data collection methodology
Ministerial decision 1054/2011 granted a four-months grace period (March 1st to June 30st, 2011) to illegal expatriates willing to regularize their status with Ministry of Interior (residency) and Ministry of Social Affairs and Labour (MOSAL) (labour permits), or leave the country without penalty.
The regularizations’ figure is taken from the Ministry of Interior’s records upon expiry of the grace period.
The bidoun, a stateless population, are not included in the residency documents holders.
2. Institution which provides data
Ministry of Interior, General Department of Immigration
3. Data availability
Data have been obtained from the Ministry of Interior. They are not published or made available to the public.
|
Migration Status |
TOTAL |
| Country of citizenship |
Worker |
Family member |
Student |
Other resident |
| ARAB COUNTRIES |
|
|
|
|
| Iraq |
4.366 |
10.484 |
0 |
412 |
15.262 |
| Syria |
57.752 |
75.845 |
3 |
1.954 |
135.554 |
| Lebanon |
18.665 |
23.301 |
3 |
617 |
42.586 |
| Jordan |
20.502 |
33.752 |
3 |
824 |
55.081 |
| Yemen |
5.458 |
5.167 |
2 |
135 |
10.762 |
| Palestine |
22 |
556 |
0 |
1 |
579 |
| Algeria |
316 |
509 |
1 |
19 |
845 |
| Egypt |
330.769 |
137.500 |
12 |
14.411 |
482.692 |
| Morocco |
1.791 |
1.594 |
0 |
110 |
3.495 |
| Tunisia |
1.792 |
984 |
3 |
84 |
2.863 |
| Libya |
39 |
108 |
1 |
1 |
149 |
| Palestinian from Egypt |
2.723 |
3.262 |
0 |
168 |
6.153 |
| Palestinian from Lebanon |
464 |
481 |
0 |
17 |
962 |
| Palestinian from Syria |
171 |
194 |
0 |
7 |
372 |
| Palestinian from Iraq |
2 |
1 |
0 |
0 |
3 |
| Non-Kuwaiti |
1 |
5 |
0 |
0 |
6 |
| Saudi |
0 |
1 |
0 |
0 |
1 |
| Total |
444.833 |
293.744 |
28 |
18.760 |
757.365 |
| ASIA |
|
|
|
|
|
| Afghanistan |
10.255 |
3.044 |
23 |
367 |
13.689 |
| Uzbekistan |
47 |
65 |
0 |
2 |
114 |
| Kyrgyzstan |
25 |
23 |
7 |
3 |
58 |
| Tajikstan |
9 |
19 |
6 |
0 |
34 |
| Kazakhstan |
13 |
21 |
0 |
0 |
34 |
| Mongolia |
6 |
7 |
3 |
0 |
16 |
| Turkey |
1.359 |
786 |
1 |
126 |
2.272 |
| Iran |
25.528 |
16.365 |
5 |
740 |
42.638 |
| Malaysia |
161 |
253 |
22 |
5 |
441 |
| Japan |
63 |
54 |
5 |
4 |
126 |
| Indonesia |
12.707 |
1.177 |
9 |
143 |
14.036 |
| Philippines |
151.430 |
7.795 |
31 |
2.486 |
161.742 |
| Pakistan |
91.060 |
26.512 |
31 |
2.437 |
120.040 |
| India |
585.506 |
92.805 |
16 |
14.198 |
692.525 |
| China |
2.895 |
287 |
15 |
706 |
3.903 |
| Taiwan |
7 |
4 |
8 |
0 |
19 |
| South Korea |
753 |
243 |
7 |
115 |
1.118 |
| Singapore |
23 |
19 |
16 |
1 |
59 |
| Bangladesh |
178.485 |
6.936 |
9 |
4.741 |
190.171 |
| Thailand |
2.067 |
177 |
41 |
178 |
2.463 |
| Sri Lanka |
103.407 |
4.270 |
24 |
2.159 |
109.860 |
| Nepal |
53.653 |
254 |
1 |
1.578 |
55.486 |
| Bhutan |
10 |
13 |
0 |
0 |
23 |
| North Korea |
3.065 |
11 |
3 |
492 |
3.571 |
| Vietnam |
515 |
17 |
0 |
66 |
598 |
| Cambodia |
9 |
4 |
34 |
0 |
47 |
| Myanmar |
329 |
5 |
0 |
15 |
349 |
| Other Asian Nationalities |
53 |
28 |
5 |
1 |
87 |
| Total |
1.223.440 |
161.194 |
322 |
30.563 |
1.415.519 |
| EUROPE |
|
0 |
0 |
|
|
| Britain |
2.362 |
1.724 |
1 |
90 |
4.177 |
| Ireland |
124 |
84 |
0 |
5 |
213 |
| France |
449 |
444 |
2 |
13 |
908 |
| Holland |
124 |
163 |
0 |
5 |
292 |
| Belgium |
54 |
39 |
0 |
1 |
94 |
| Italy |
226 |
160 |
2 |
17 |
405 |
| Malta |
17 |
6 |
0 |
0 |
23 |
| Sweden |
93 |
170 |
0 |
5 |
268 |
| Norway |
27 |
30 |
0 |
0 |
57 |
| Switzerland |
27 |
18 |
0 |
1 |
46 |
| Austria |
45 |
60 |
0 |
2 |
107 |
| Germany |
263 |
268 |
5 |
16 |
552 |
| Spain |
107 |
81 |
2 |
11 |
201 |
| Portugal |
94 |
40 |
0 |
4 |
138 |
| Denmark |
85 |
109 |
2 |
2 |
198 |
| Greece |
75 |
46 |
0 |
16 |
137 |
| Cyprus |
15 |
16 |
0 |
2 |
33 |
| Czech Republic |
48 |
30 |
2 |
0 |
80 |
| Hungary |
123 |
86 |
3 |
5 |
217 |
| Slovakia |
43 |
54 |
0 |
5 |
102 |
| Finland |
13 |
18 |
0 |
0 |
31 |
| Lithuania |
8 |
7 |
0 |
0 |
15 |
| Poland |
128 |
116 |
5 |
8 |
257 |
| Russia and USSR |
291 |
442 |
5 |
15 |
753 |
| Ukraine |
98 |
197 |
0 |
8 |
303 |
| Moldova |
20 |
9 |
0 |
4 |
33 |
| Belarus |
20 |
37 |
0 |
1 |
58 |
| Bosnia-Herzegovina |
134 |
68 |
9 |
3 |
214 |
| Macedonia |
43 |
19 |
3 |
3 |
68 |
| Croatia |
39 |
15 |
0 |
4 |
58 |
| Serbia |
120 |
79 |
0 |
12 |
211 |
| Yugoslavia |
62 |
42 |
0 |
0 |
104 |
| Romania |
340 |
227 |
0 |
50 |
617 |
| Bulgaria |
360 |
124 |
4 |
5 |
493 |
| Albania |
18 |
46 |
2 |
2 |
68 |
| Kosovo |
10 |
12 |
0 |
1 |
23 |
| Armenia |
138 |
97 |
2 |
9 |
246 |
| Georgia |
60 |
26 |
2 |
11 |
99 |
| Azerbaidjan |
20 |
45 |
0 |
1 |
66 |
| Other European Nationalities |
47 |
28 |
0 |
0 |
75 |
| Total |
6.370 |
5.282 |
51 |
337 |
12.040 |
| AFRICA |
0 |
0 |
0 |
0 |
|
| Ethiopia |
75.810 |
266 |
2 |
1.201 |
77.279 |
| Eritrea |
568 |
545 |
3 |
19 |
1.135 |
| Sudan |
3.334 |
1.022 |
3 |
192 |
4.551 |
| Senegal |
73 |
60 |
45 |
5 |
183 |
| Gambia |
12 |
7 |
18 |
0 |
37 |
| Guinea |
19 |
19 |
9 |
0 |
47 |
| Mauritania |
67 |
56 |
6 |
13 |
142 |
| Mali |
58 |
12 |
21 |
3 |
94 |
| Niger |
53 |
63 |
22 |
1 |
139 |
| Burkina Faso |
12 |
9 |
20 |
1 |
42 |
| Benin |
56 |
37 |
59 |
6 |
158 |
| Liberia |
79 |
116 |
0 |
5 |
200 |
| Sierra Leone |
64 |
27 |
0 |
31 |
122 |
| Togo |
60 |
10 |
9 |
2 |
81 |
| Ivory Coast |
18 |
9 |
6 |
0 |
33 |
| Nigeria |
241 |
233 |
63 |
10 |
547 |
| South Africa |
409 |
195 |
0 |
31 |
635 |
| Swaziland |
8 |
12 |
0 |
1 |
21 |
| Zimbabwe |
38 |
24 |
0 |
10 |
72 |
| Chad |
94 |
55 |
12 |
1 |
162 |
| Cameroon |
18 |
3 |
3 |
0 |
24 |
| Somalia |
1.372 |
2.125 |
38 |
126 |
3.661 |
| Djibouti |
20 |
23 |
6 |
0 |
49 |
| Madagascar |
1.200 |
3 |
0 |
22 |
1.225 |
| Mauritius |
9 |
8 |
5 |
19 |
41 |
| Ghana |
707 |
43 |
14 |
27 |
791 |
| Uganda |
260 |
12 |
4 |
4 |
280 |
| Malawi |
10 |
15 |
0 |
0 |
25 |
| Tanzania |
33 |
22 |
13 |
1 |
69 |
| Kenya |
158 |
96 |
2 |
5 |
261 |
| Comore Islands |
36 |
28 |
12 |
2 |
78 |
| Seychelles Islands |
7 |
9 |
0 |
1 |
17 |
| Other African Nationalities |
52 |
59 |
11 |
1 |
123 |
| Total |
84.955 |
5.223 |
406 |
1.740 |
92.324 |
| AMERICA AND OCEANIA |
|
0 |
0 |
|
|
| U.S.A |
7.806 |
4.987 |
5 |
469 |
13.267 |
| Canada |
2.626 |
3.796 |
7 |
101 |
6.530 |
| Dominican Republic |
100 |
179 |
0 |
6 |
285 |
| Venezuela |
97 |
125 |
0 |
2 |
224 |
| Colombia |
49 |
43 |
0 |
2 |
94 |
| Trinidad and Tobago |
11 |
12 |
0 |
1 |
24 |
| Granada |
10 |
7 |
0 |
0 |
17 |
| Jamaica |
12 |
5 |
0 |
0 |
17 |
| Mexico |
16 |
42 |
0 |
2 |
60 |
| Brasil |
87 |
86 |
0 |
25 |
198 |
| Bolivia |
14 |
40 |
0 |
1 |
55 |
| Peru |
11 |
7 |
0 |
1 |
19 |
| Ecuador |
8 |
12 |
0 |
1 |
21 |
| Argentina |
57 |
25 |
0 |
6 |
88 |
| Australia |
400 |
645 |
0 |
13 |
1.058 |
| New Zealand |
126 |
175 |
0 |
10 |
311 |
| Fiji Islands |
49 |
5 |
0 |
2 |
56 |
| Other American and Oceanian Nationalities |
55 |
52 |
0 |
4 |
111 |
| Total |
11.534 |
10.243 |
13 |
646 |
22.436 |
| U.N. |
4 |
2 |
0 |
0 |
6 |
| Unknown Nationalities |
1 |
0 |
0 |
0 |
1 |
| GRAND TOTAL |
1.771.137 |
475.688 |
820 |
52.046 |
2.299.691 |
Source: Ministry of Interior
ANNEXED NOTE
1. Definitions and data collection method
The migration status is inferred from the distribution of expatriates by type of residence permits they hold as of December 31st, the given year (cf. table in file MOV 2.3).
Workers are holders of permits n°17 (governmental labor), 18 (non-governmental labor); 19 (business) and 20 (domestic help).
Family members are holders of a dependent permit: spouse, children or elderly dependent relatives can join visa holder (sponsor) in Kuwait, if the expatriate has obtained a residency and is earning a minimum of KD250 a month (private and governement sector alike).
A working wife cannot sponsor her husband as a dependent. Also, sons over the age of 21 years cannot be sponsored as dependants, though adult daughters and parents may be permitted. Dependent family members are not allowed to work on a Dependent Visa, unless they transfer it into a work visa under Kuwaiti sponsorship. This can be done only after 6 to 12 months of holding a dependent visa.
Every children including new born babies must hold a residency permit. The application for the infant’s residence must be made within 60 days of the birth
The Dependent Visa holder is permitted to stay as long as the sponsor holds a valid visa.
Students are holders of a study visa
Other residents are holders of:
* Temporary permit: An expatriate may be granted temporary residence under article 14 of the immigration regulations in special cases where he does not need or cannot get ordinary residence.
This allows the expatriate to stay for up to one year, for personal emergencies such as illness, or after resignation from employment in order to settle financial affairs or a court case.
* Self residence permit: Expatriates may sponsor themselves under article 24 of the regulations and obtain a residence for two to five years under several conditions
(among which: being aged 60 and more, having worked no less than 25 years in Kuwait, owning a capital of 10000 KD at least; being able to produce a certificate of good conduct, being effectively residing in Kuwait with his/her family, etc.).
This form of residence can be renewed upon expiry. Self-sponsored expatriates may sponsor their wives and children.
Residency procedures do not apply to GCC nationals.
The bidoun, a stateless population, are not included in the residency documents holders.
The table thus excludes the Bidoun residents, the non-Kuwaiti GCC citizens and those in irregular situation.
2. Institution which provides data
Ministry of Interior
3. Period of data coverage
December 31st, given years
4. Data availability
2012 data is unpublished as of September 15th, 2013 and has been obtained from MoI.
| |
Migration Status |
TOTAL |
| Country of citizenship |
Worker |
Family member |
Student |
Other resident |
| ARAB COUNTRIES |
|
|
|
|
| Iraq |
4.441 |
10.596 |
0 |
341 |
15.378 |
| Syria |
57.239 |
73.141 |
2 |
1.619 |
132.001 |
| Lebanon |
18.724 |
23.066 |
0 |
521 |
42.311 |
| Jordan |
19.864 |
32.641 |
3 |
647 |
53.155 |
| Palestine |
3.391 |
4.471 |
0 |
186 |
8.048 |
| Egypt |
320.892 |
128.272 |
13 |
8.414 |
457.591 |
| Other Arabs |
13.288 |
10.894 |
41 |
406 |
24.629 |
| Total Arab nationalities |
437.839 |
283.081 |
59 |
12.134 |
733.113 |
| OTHER COUNTRIES |
|
|
|
|
|
| Iran |
26.313 |
16.700 |
9 |
771 |
43.793 |
| Philippines |
130.692 |
7.360 |
33 |
1.879 |
139.964 |
| Pakistan |
93.718 |
26.981 |
32 |
1.900 |
122.631 |
| India |
550.943 |
86.705 |
18 |
9.629 |
647.295 |
| Bangladesh |
183.174 |
6.932 |
7 |
5.427 |
195.540 |
| Sri Lanka |
105.120 |
4.020 |
21 |
1.669 |
110.830 |
| Other nationalities |
180.760 |
23.338 |
586 |
5.707 |
210.391 |
| TOTAL ALL NATIONALITIES |
1.708.559 |
455.117 |
765 |
39.116 |
2.203.557 |
Source: Ministry of Interior
ANNEXED NOTE
1. Definitions and data collection method
The migration status is inferred from the distribution of expatriates by type of residence permits they hold as of December 31st, the given year (cf. tables in files MOV 2.3).
Workers are holders of permits n°17 (governmental labor), 18 (non-governmental labor); 19 (business) and 20 (domestic help).
Family members are holders of a dependent permit: spouse, children or elderly dependent relatives can join visa holder (sponsor) in Kuwait, if the expatriate has obtained a residency and is earning a minimum of KD250 a month (private and governement sector alike).
A working wife cannot sponsor her husband as a dependent. Also, sons over the age of 21 years cannot be sponsored as dependants, though adult daughters and parents may be permitted. Dependent family members are not allowed to work on a Dependent Visa, unless they transfer it into a work visa under Kuwaiti sponsorship. This can be done only after 6 to 12 months of holding a dependent visa.
Every children including new born babies must hold a residency permit. The application for the infant’s residence must be made within 60 days of the birth
The Dependent Visa holder is permitted to stay as long as the sponsor holds a valid visa.
Students are holders of a study visa
Other residents are holders of:
* Temporary permit: An expatriate may be granted temporary residence under article 14 of the immigration regulations in special cases where he does not need or cannot get ordinary residence.
This allows the expatriate to stay for up to one year, for personal emergencies such as illness, or after resignation from employment in order to settle financial affairs or a court case.
* Self residence permit: Expatriates may sponsor themselves under article 24 of the regulations and obtain a residence for two to five years under several conditions
(among which: being aged 60 and more, having worked no less than 25 years in Kuwait, owning a capital of 10000 KD at least; being able to produce a certificate of good conduct, being effectively residing in Kuwait with his/her family, etc.).
This form of residence can be renewed upon expiry. Self-sponsored expatriates may sponsor their wives and children.
Residency procedures do not apply to GCC nationals.
The bidoun, a stateless population, are not included in the residency documents holders.
The table thus excludes the Bidoun residents, the non-Kuwaiti GCC citizens and those in irregular situation.
2. Institution which provides data
Ministry of Interior
3. Period of data coverage
December 31st, given years
4. Data availability
b- 2011′ data is tabulated in MoI’ 2011 Statistical Yearbook, in Chapter “Immigration statistics” (not available online). The volume may be directly obtained from MoI.
| |
Migration Status |
TOTAL |
| Country of citizenship |
Worker |
Family member |
Student |
Other resident |
| ARAB COUNTRIES |
|
|
|
|
| Iraq |
4.559 |
10.597 |
0 |
339 |
15.495 |
| Syria |
57.535 |
72.387 |
2 |
1.191 |
131.115 |
| Lebanon |
20.216 |
22.779 |
3 |
347 |
43.345 |
| Jordan |
19.020 |
30.588 |
7 |
489 |
50.104 |
| Palestine |
0 |
0 |
0 |
0 |
0 |
| Egypt |
311.815 |
111.058 |
18 |
4.126 |
427.017 |
| Other Arabs |
15.622 |
13.879 |
29 |
406 |
29.936 |
| Total Arab nationalities |
428.767 |
261.288 |
59 |
6.898 |
697.012 |
| OTHER COUNTRIES |
|
|
|
|
|
| Iran |
29.700 |
16.545 |
7 |
547 |
46.799 |
| Philippines |
101.770 |
6.769 |
32 |
1.281 |
109.852 |
| Pakistan |
100.579 |
25.613 |
27 |
1.214 |
127.433 |
| India |
513.301 |
76.504 |
15 |
5.234 |
595.054 |
| Bangladesh |
199.111 |
7.351 |
3 |
2.149 |
208.614 |
| Sri Lanka |
96.325 |
3.706 |
14 |
1.373 |
101.418 |
| Other nationalities |
165.144 |
22.481 |
529 |
3.610 |
191.764 |
| TOTAL ALL NATIONALITIES |
1.634.697 |
420.257 |
686 |
22.306 |
2.077.946 |
Source: Ministry of Interior
ANNEXED NOTE
1. Definitions and data collection method
The migration status is inferred from the distribution of expatriates by type of residence permits they hold as of December 31st, the given year (cf. table in files MOV 2.3).
Workers are holders of permits n°17 (governmental labor), 18 (non-governmental labor); 19 (business) and 20 (domestic help).
Family members are holders of a dependent permit: spouse, children or elderly dependent relatives can join visa holder (sponsor) in Kuwait, if the expatriate has obtained a residency and is earning a minimum of KD250 a month (private and governement sector alike).
A working wife cannot sponsor her husband as a dependent. Also, sons over the age of 21 years cannot be sponsored as dependants, though adult daughters and parents may be permitted. Dependent family members are not allowed to work on a Dependent Visa, unless they transfer it into a work visa under Kuwaiti sponsorship. This can be done only after 6 to 12 months of holding a dependent visa.
Every children including new born babies must hold a residency permit. The application for the infant’s residence must be made within 60 days of the birth
The Dependent Visa holder is permitted to stay as long as the sponsor holds a valid visa.
Students are holders of a study visa
Other residents are holders of:
* Temporary permit: An expatriate may be granted temporary residence under article 14 of the immigration regulations in special cases where he does not need or cannot get ordinary residence.
This allows the expatriate to stay for up to one year, for personal emergencies such as illness, or after resignation from employment in order to settle financial affairs or a court case.
* Self residence permit: Expatriates may sponsor themselves under article 24 of the regulations and obtain a residence for two to five years under several conditions
(among which: being aged 60 and more, having worked no less than 25 years in Kuwait, owning a capital of 10000 KD at least; being able to produce a certificate of good conduct, being effectively residing in Kuwait with his/her family, etc.).
This form of residence can be renewed upon expiry. Self-sponsored expatriates may sponsor their wives and children.
Residency procedures do not apply to GCC nationals.
The bidoun, a stateless population, are not included in the residency documents holders.
The table thus excludes the Bidoun residents, the non-Kuwaiti GCC citizens and those in irregular situation.
2. Institution which provides data
Ministry of Interior
3. Period of data coverage
December 31st, given years
4. Data availability
2009′ data is published in MoI’ 2009 Statistical Yearbook, in Chapter “Immigration statistics”, available online at: http://www.moi.gov.kw/portal/varabic/statistics/stats.htm
Last date of access: September 3rd, 2013.
| Migration status |
|
2009 |
|
|
2011 |
|
|
2012 |
|
Permit holders by type / |
| |
males |
females |
total |
males |
females |
total |
males |
females |
total |
purpose of permit |
| Worker |
1.223.738 |
410.959 |
1.634.697 |
1.255.031 |
453.528 |
1.708.559 |
1.298.099 |
473.038 |
1.771.137 |
Work permit holders (17; 18; 19; 20) |
| Family member |
153.988 |
266.269 |
420.257 |
166.254 |
288.863 |
455.117 |
173.332 |
302.356 |
475.688 |
Dependant permit holders (22) |
| Student |
510 |
176 |
686 |
579 |
186 |
765 |
629 |
191 |
820 |
Study permit holders(23) |
| Other resident |
15.065 |
7.241 |
22.306 |
30.732 |
8.384 |
39.116 |
41.783 |
10.263 |
52.046 |
Temporary permit (14) and self residence permit holders (24) |
| TOTAL |
1.378.236 |
677.404 |
2.055.640 |
1.421.864 |
742.577 |
2.164.441 |
1.472.060 |
775.585 |
2.299.691 |
TOTAL |
Source: Ministry of Interior
ANNEXED NOTE
1. Definitions and data collection method
The migration status is inferred from the distribution of expatriates by type of residence permits they hold as of December 31st, the given year (cf. table in file MOV 2.3).
Workers are holders of permits n°17 (governmental labor), 18 (non-governmental labor); 19 (business) and 20 (domestic help).
Family members are holders of a dependent permit: spouse, children or elderly dependent relatives can join visa holder (sponsor) in Kuwait, if the expatriate has obtained a residency and is earning a minimum of KD250 a month (private and governement sector alike).
A working wife cannot sponsor her husband as a dependent. Also, sons over the age of 21 years cannot be sponsored as dependants, though adult daughters and parents may be permitted. Dependent family members are not allowed to work on a Dependent Visa, unless they transfer it into a work visa under Kuwaiti sponsorship. This can be done only after 6 to 12 months of holding a dependent visa.
Every children including new born babies must hold a residency permit. The application for the infant’s residence must be made within 60 days of the birth
The Dependent Visa holder is permitted to stay as long as the sponsor holds a valid visa.
Students are holders of a study visa
Other residents are holders of:
* Temporary permit: An expatriate may be granted temporary residence under article 14 of the immigration regulations in special cases where he does not need or cannot get ordinary residence.
This allows the expatriate to stay for up to one year, for personal emergencies such as illness, or after resignation from employment in order to settle financial affairs or a court case.
* Self residence permit: Expatriates may sponsor themselves under article 24 of the regulations and obtain a residence for two to five years under several conditions
(among which: being aged 60 and more, having worked no less than 25 years in Kuwait, owning a capital of 10000 KD at least; being able to produce a certificate of good conduct, being effectively residing in Kuwait with his/her family, etc.).
This form of residence can be renewed upon expiry. Self-sponsored expatriates may sponsor their wives and children.
Residency procedures do not apply to GCC nationals.
The bidoun, a stateless population, are not included in the residency documents holders.
The table thus excludes the Bidoun residents, the non-Kuwaiti GCC citizens and those in irregular situation.
2. Institution which provides data
Ministry of Interior
3. Period of data coverage
December 31st, given years
4. Data availability
a- 2009′ data is published in MoI’ 2009 Statistical Yearbook, in Chapter “Immigration statistics”, available online at: http://www.moi.gov.kw/portal/varabic/statistics/stats.htm
Last date of access: September 3rd, 2013.
b- 2011′ data is tabulated in MoI’ 2011 Statistical Yearbook, in Chapter “Immigration statistics” (not available online). The volume may be directly obtained from MoI.
c- 2012 data is unpublished as of June 2013 and has been obtained from MoI.
| Migration status |
2009 |
2011 |
2012 |
Permit holders by type / purpose of permit |
| Worker |
1.634.697 |
1.708.559 |
1.771.137 |
Work permit holders (17; 18; 19; 20) |
| Family member |
420.257 |
455.117 |
475.688 |
Dependant permit holders (22) |
| Student |
686 |
765 |
820 |
Study permit holders(23) |
| Other resident |
22.306 |
39.116 |
52.046 |
Temporary permit (14) and self residence permit holders (24) |
| TOTAL |
2.055.640 |
2.164.441 |
2.247.645 |
TOTAL |
Source: Ministry of Interior
ANNEXED NOTE
1. Definitions and data collection method
The migration status is inferred from the distribution of expatriates by type of residence permits they hold as of December 31st, the given year (cf. table in file MOV 2.2).
Workers are holders of permits n°17 (governmental labor), 18 (non-governmental labor); 19 (business) and 20 (domestic help).
Family members are holders of a dependent permit: spouse, children or elderly dependent relatives can join visa holder (sponsor) in Kuwait, if the expatriate has obtained a residency and is earning a minimum of KD250 a month (private and governement sector alike).
A working wife cannot sponsor her husband as a dependent. Also, sons over the age of 21 years cannot be sponsored as dependants, though adult daughters and parents may be permitted. Dependent family members are not allowed to work on a Dependent Visa, unless they transfer it into a work visa under Kuwaiti sponsorship. This can be done only after 6 to 12 months of holding a dependent visa.
Every children including new born babies must hold a residency permit. The application for the infant’s residence must be made within 60 days of the birth
The Dependent Visa holder is permitted to stay as long as the sponsor holds a valid visa.
Students are holders of a study visa
Other residents are holders of:
* Temporary permit: An expatriate may be granted temporary residence under article 14 of the immigration regulations in special cases where he does not need or cannot get ordinary residence.
This allows the expatriate to stay for up to one year, for personal emergencies such as illness, or after resignation from employment in order to settle financial affairs or a court case.
* Self residence permit: Expatriates may sponsor themselves under article 24 of the regulations and obtain a residence for two to five years under several conditions
(among which: being aged 60 and more, having worked no less than 25 years in Kuwait, owning a capital of 10000 KD at least; being able to produce a certificate of good conduct, being effectively residing in Kuwait with his/her family, etc.).
This form of residence can be renewed upon expiry. Self-sponsored expatriates may sponsor their wives and children.
Residency procedures do not apply to GCC nationals.
The bidoun, a stateless population, are not included in the residency documents holders.
The table thus excludes the Bidoun residents, the non-Kuwaiti GCC citizens and those in irregular situation.
2. Institution which provides data
Ministry of Interior
3. Period of data coverage
December 31st, given years
4. Data availability
a- 2009′ data is published in MoI’ 2009 Statistical Yearbook, in Chapter “Immigration statistics”, available online at: http://www.moi.gov.kw/portal/varabic/statistics/stats.htm
Last date of access: September 3rd, 2013.
b- 2011′ data is tabulated in MoI’ 2011 Statistical Yearbook, in Chapter “Immigration statistics” (not available online). The volume may be directly obtained from MoI.
c- 2012 data is unpublished as of June 2013 and has been obtained from MoI.
| year |
|
|
|
|
1992 |
|
|
|
|
| Citizenship |
|
Saudis |
|
|
Non-Saudis |
|
|
TOTAL |
|
| Age Groups |
Males |
Females |
Total |
Males |
Females |
Total |
Males |
Females |
Total |
| 15 – 19 |
660.372 |
674.584 |
1.334.956 |
80.154 |
80.695 |
160.849 |
740.526 |
755.279 |
1.495.805 |
| 20 – 24 |
525.534 |
516.615 |
1.042.149 |
259.179 |
101.744 |
360.923 |
784.713 |
618.359 |
1.403.072 |
| 25 – 29 |
415.443 |
455.358 |
870.801 |
612.593 |
156.401 |
768.994 |
1.028.036 |
611.759 |
1.639.795 |
| 30 – 34 |
326.933 |
320.143 |
647.076 |
633.639 |
226.364 |
860.003 |
960.572 |
546.507 |
1.507.079 |
| 35 – 39 |
264.540 |
283.492 |
548.032 |
499.700 |
143.272 |
642.972 |
764.240 |
426.764 |
1.191.004 |
| 40 – 44 |
180.207 |
186.672 |
366.879 |
320.615 |
72.340 |
392.955 |
500.822 |
259.012 |
759.834 |
| 45 – 49 |
153.968 |
161.226 |
315.194 |
171.716 |
36.619 |
208.335 |
325.684 |
197.845 |
523.529 |
| 50 – 54 |
143.948 |
147.998 |
291.946 |
92.104 |
23.011 |
115.115 |
236.052 |
171.009 |
407.061 |
| 55 – 59 |
117.397 |
92.678 |
210.075 |
39.890 |
10.313 |
50.203 |
157.287 |
102.991 |
260.278 |
| Total |
2.788.342 |
2.838.766 |
5.627.108 |
2.709.590 |
850.759 |
3.560.349 |
5.497.932 |
3.689.525 |
9.187.457 |
| |
|
|
|
|
|
|
|
|
|
| |
|
|
|
|
2004 |
|
|
|
|
| 15 – 19 |
948.707 |
938.982 |
1.887.689 |
150.298 |
142.200 |
292.498 |
1.099.005 |
1.081.182 |
2.180.187 |
| 20 – 24 |
760.146 |
786.510 |
1.546.656 |
298.251 |
159.920 |
458.171 |
1.058.397 |
946.430 |
2.004.827 |
| 25 – 29 |
725.413 |
701.326 |
1.426.739 |
626.706 |
240.156 |
866.862 |
1.352.119 |
941.482 |
2.293.601 |
| 30 – 34 |
569.152 |
575.126 |
1.144.278 |
709.730 |
271.093 |
980.823 |
1.278.882 |
846.219 |
2.125.101 |
| 35 – 39 |
492.543 |
498.170 |
990.713 |
674.734 |
190.103 |
864.837 |
1.167.277 |
688.273 |
1.855.550 |
| 40 – 44 |
411.890 |
372.981 |
784.871 |
511.983 |
121.907 |
633.890 |
923.873 |
494.888 |
1.418.761 |
| 45 – 49 |
313.340 |
277.511 |
590.851 |
338.148 |
72.775 |
410.923 |
651.488 |
350.286 |
1.001.774 |
| 50 – 54 |
222.166 |
199.415 |
421.581 |
193.133 |
43.516 |
236.649 |
415.299 |
242.931 |
658.230 |
| 55 – 59 |
146.079 |
153.194 |
299.273 |
84.880 |
21.644 |
106.524 |
230.959 |
174.838 |
405.797 |
| Total |
4.589.436 |
4.503.215 |
9.092.651 |
3.587.863 |
1.263.314 |
4.851.177 |
8.177.299 |
5.766.529 |
13.943.828 |
Source: national censuses, given years
ANNEXED NOTE
1. Technical Notes and Definitions
Reference periods for each census: the nights of October 13th, 1992; September 15th, 2004; April 27th, 2010.
Implementation method: the Censuses are carried out according to de facto methodology, i.e. counting persons where they are during time of reference, be they usual residents of the place or temporary residents.
Population of reference: all individuals (nationals and non-nationals) present within the Kingdom’s borders during time of reference, be they permanent or temporary residents.
The census also includes: Saudi diplomats posted abroad (their details are provided by the Ministry of Foreign Affairs) and Saudis temporarily out of the Kingdom for reasons such as treatment, business, tourism, studies…, counted with their family members residing in the Kingdom.
The working age population is defined as the population aged 15 to 60 (retirement age for Saudis), even though (as of mid-2013) there is no maximum working age on foreign nationals.
2. Institution which provides data
Central Department of Statistics and Information (CDSI), Ministry and Economy and Planning
3. Data availability
As of May 31st, 2013, only preliminary results of 2010′ census have been published online.
Parts of censuses conducted in 1992 and 2004 are available on the website of the CDSI (http://www.cdsi.gov.sa/), in published form in PDF format.
https://www.stats.gov.sa/en/13 (English)
https://www.stats.gov.sa/ar/13 (Arabic)
For 1992 all published data is broken down by nationality (Saudi/non-Saudi). For 2004, only the data on sex and on administrative regions and sub-regions of residence is broken down by nationality (Saudi/ Non-Saudi).
Date of access: May 2013.
| |
|
Saudis |
|
|
Non-Saudis |
|
|
TOTAL |
|
| |
Males |
Females |
Total |
Males |
Females |
Total |
Males |
Females |
Total |
| 1992 |
2.788.342 |
2.838.766 |
5.627.108 |
2.709.590 |
850.759 |
3.560.349 |
5.497.932 |
3.689.525 |
9.187.457 |
| 2004 |
4.589.436 |
4.503.215 |
9.092.651 |
3.587.863 |
1.263.314 |
4.851.177 |
8.177.299 |
5.766.529 |
13.943.828 |
Source: national censuses, given years
ANNEXED NOTE
1. Technical Notes and Definitions
Reference periods for each census: the nights of October 13th, 1992; September 15th, 2004; April 27th, 2010.
Implementation method: the Censuses are carried out according to de facto methodology, i.e. counting persons where they are during time of reference, be they usual residents of the place or temporary residents.
Population of reference: all individuals (nationals and non-nationals) present within the Kingdom’s borders during time of reference, be they permanent or temporary residents.
The census also includes: Saudi diplomats posted abroad (their details are provided by the Ministry of Foreign Affairs) and Saudis temporarily out of the Kingdom for reasons such as treatment, business, tourism, studies…, counted with their family members residing in the Kingdom.
The working age population is defined as the population aged 15 to 60 (retirement age for Saudis), even though (as of mid-2013) there is no maximum working age on foreign nationals.
2. Institution which provides data
Central Department of Statistics and Information (CDSI), Ministry and Economy and Planning
3. Data availability
As of May 31st, 2013, only preliminary results of 2010′ census have been published online.
Parts of censuses conducted in 1992 and 2004 are available on the website of the CDSI (https://www.stats.gov.sa/en), in published form in PDF format.
https://www.stats.gov.sa/en/13 (English)
https://www.stats.gov.sa/ar/13 (Arabic)
For 1992 all published data is broken down by nationality (Saudi/non-Saudi). For 2004, only the data on sex and on administrative regions and sub-regions of residence is broken down by nationality (Saudi/ Non-Saudi).
Date of access: May 2013.
| Education Status |
|
|
Saudi |
|
|
Non-Saudi |
|
|
Total |
|
| |
year |
Males |
Females |
Total |
Males |
Females |
Total |
Males |
Females |
Total |
| |
2.006 |
4.370 |
143 |
4.513 |
869 |
0 |
869 |
5.239 |
143 |
5.382 |
| Illiterate |
2.009 |
850 |
141 |
991 |
145 |
262 |
407 |
995 |
403 |
1.398 |
| |
2.012 |
288 |
702 |
990 |
457 |
0 |
457 |
745 |
702 |
1.447 |
| |
2.006 |
8.658 |
90 |
8.748 |
4.571 |
337 |
4.908 |
13.229 |
427 |
13.656 |
| Read and Write |
2.009 |
3.235 |
0 |
3.235 |
1.041 |
0 |
1.041 |
4.276 |
0 |
4.276 |
| |
2.012 |
3.051 |
606 |
3.657 |
847 |
343 |
1.190 |
3.898 |
949 |
4.847 |
| |
2.006 |
56.306 |
1.538 |
57.844 |
3.581 |
374 |
3.955 |
59.887 |
1.912 |
61.799 |
| Primary |
2.009 |
29.107 |
348 |
29.455 |
800 |
157 |
957 |
29.907 |
505 |
30.412 |
| |
2.012 |
25.290 |
1.864 |
27.154 |
3.883 |
0 |
3.883 |
29.173 |
1.864 |
31.037 |
| |
2.006 |
67.782 |
2.858 |
70.640 |
5.908 |
354 |
6.262 |
73.690 |
3.212 |
76.902 |
| Intermediate |
2.009 |
42.875 |
1.613 |
44.488 |
2.010 |
314 |
2.324 |
44.885 |
1.927 |
46.812 |
| |
2.012 |
41.030 |
5.577 |
46.607 |
3.270 |
605 |
3.875 |
44.300 |
6.182 |
50.482 |
| Secondary or |
2.006 |
98.544 |
34.121 |
132.665 |
6.750 |
3.825 |
10.575 |
105.294 |
37.946 |
143.240 |
| Equivalent |
2.009 |
99.019 |
16.292 |
115.311 |
4.289 |
1.773 |
6.062 |
103.308 |
18.065 |
121.373 |
| |
2.012 |
122.943 |
55.496 |
178.439 |
5.749 |
1.442 |
7.191 |
128.692 |
56.938 |
185.630 |
| |
2.006 |
23.740 |
21.233 |
44.973 |
834 |
450 |
1.284 |
24.574 |
21.683 |
46.257 |
| Diploma |
2.009 |
31.168 |
24.707 |
55.875 |
977 |
0 |
977 |
32.145 |
24.707 |
56.852 |
| |
2.012 |
43.536 |
25.783 |
69.319 |
1.150 |
584 |
1.734 |
44.686 |
26.367 |
71.053 |
| |
2.006 |
33.505 |
115.504 |
149.009 |
3.642 |
1.391 |
5.033 |
37.147 |
116.895 |
154.042 |
| Bachelor Degree |
2.009 |
41.563 |
156.826 |
198.389 |
1.118 |
1.576 |
2.694 |
42.681 |
158.402 |
201.083 |
| |
2.012 |
32.803 |
227.264 |
260.067 |
4.979 |
3.199 |
8.178 |
37.782 |
230.463 |
268.245 |
| |
2.006 |
0 |
623 |
623 |
0 |
0 |
0 |
0 |
623 |
623 |
| Master Degree |
2.009 |
345 |
458 |
803 |
0 |
0 |
0 |
345 |
458 |
803 |
| |
2.012 |
734 |
1.464 |
2.198 |
0 |
0 |
0 |
734 |
1.464 |
2.198 |
| |
2.006 |
0 |
0 |
0 |
0 |
0 |
0 |
0 |
0 |
0 |
| Doctorate |
2.009 |
0 |
0 |
0 |
0 |
0 |
0 |
0 |
0 |
0 |
| |
2.012 |
0 |
0 |
0 |
310 |
0 |
310 |
310 |
0 |
310 |
| |
2.006 |
292.905 |
176.110 |
469.015 |
26.155 |
6.731 |
32.886 |
319.060 |
182.841 |
501.901 |
| Total |
2.009 |
248.162 |
200.385 |
448.547 |
10.380 |
4.082 |
14.462 |
258.542 |
204.467 |
463.009 |
| |
2.012 |
269.675 |
318.756 |
588.431 |
20.645 |
6.173 |
26.818 |
290.320 |
324.929 |
615.249 |
Source: Labour Force Surveys, 2006; 2009; 2012 (Round 1).
ANNEXED NOTE
1. Technical Notes and Definitions
| ManpowerSurveys |
Sampling frame |
Sample size(households) |
|
| Reference period |
| 2006 |
Census2004 |
23.000 |
May 2006 |
| 2009 |
23.000 |
July 24th-August 22nd, 2009 |
| 2012 R1 |
Census 2010 |
29.000 |
January 25th-February 17th, 2012 |
Population of reference: all individuals (nationals and non-nationals) residing in the Kingdom during the period of reference.
The ultimate sampling unit is the household.
(a) Household and household members: A person or group of persons, related or not related, who share housing and food.
Servants, drivers and similar categories are considered to be part of the household if they live in the same housing unit.
(b) Unemployed person: A person aged 15 years and over who did not work during the reference week, was able and ready to work and had been actively looking for work during the last four weeks, but did not find any.
Unemployment refers to people who during the reference period: Are without work, available to work and actively seeking work
Reference period for seeking work: The latest full calendar month preceding the period of data collection
Reference period for availability for work: The seven days preceding the period of data collection
Classification used for education statuses is ISCED.
2. Institution which provides data
Central Department of Statistics and Information (CDSI), Ministry and Economy and Planning
3. Data availability
Surveys conducted since 1999 are available on the website of the CDSI (http://www.cdsi.gov.sa/), in published form in PDF format. A selection of tables is also available in PDF or Excel format.
https://www.stats.gov.sa/en/814 (website English version) or https://www.stats.gov.sa/ar/814 (website Arabic version). The technical notes and tables of contents are in Arabic and the tables are in both languages.
Since 2007, Statistical Yearbooks have introduced a section on “Labour Statistics”, which presents a selection of tables from Manpower Surveys.
https://www.stats.gov.sa/en/46
Date of access: May 2013.
| Age |
|
Saudis |
|
|
Non-Saudis |
|
|
Total |
|
| group |
Male |
Female |
Total |
Male |
Female |
Total |
Male |
Female |
Total |
| 19-15 |
9.148 |
3.137 |
12.285 |
3.754 |
219 |
3.973 |
12.902 |
3.356 |
16.258 |
| 24-20 |
117.344 |
81.960 |
199.304 |
6.461 |
2.708 |
9.169 |
123.805 |
84.668 |
208.473 |
| 29-25 |
89.553 |
135.329 |
224.882 |
4.729 |
1.681 |
6.410 |
94.282 |
137.010 |
231.292 |
| 34-30 |
34.202 |
68.338 |
102.540 |
2.546 |
813 |
3.359 |
36.748 |
69.151 |
105.899 |
| 39-35 |
14.260 |
22.709 |
36.969 |
166 |
570 |
736 |
14.426 |
23.279 |
37.705 |
| 44-40 |
2.833 |
6.414 |
9.247 |
1.226 |
0 |
1.226 |
4.059 |
6.414 |
10.473 |
| 49-45 |
1.606 |
496 |
2.102 |
382 |
182 |
564 |
1.988 |
678 |
2.666 |
| 54-50 |
729 |
373 |
1.102 |
1.271 |
0 |
1.271 |
2.000 |
373 |
2.373 |
| 59-55 |
0 |
0 |
0 |
0 |
0 |
0 |
0 |
0 |
0 |
| 64-60 |
0 |
0 |
0 |
0 |
0 |
0 |
0 |
0 |
0 |
| 65+ |
0 |
0 |
0 |
110 |
0 |
110 |
110 |
0 |
110 |
| Total |
269.675 |
318.756 |
588.431 |
15.997 |
6.831 |
26.818 |
285.672 |
325.587 |
615.249 |
source: Labour Force Survey 2012 (Round 1).
ANNEXED NOTE
1. Technical Notes and Definitions
Sampling frame of LFS 2012 Round 1: Population Census 2010.
Sample size: 29 000 households
Reference period: January 25th-February 17th, 2012
Population of reference: all individuals (nationals and non-nationals) residing in the Kingdom during the period of reference.
The ultimate sampling unit is the household.
(a) Household and household members: A person or group of persons, related or not related, who share housing and food.
Servants, drivers and similar categories are considered to be part of the household if they live in the same housing unit.
(b) Unemployed person: A person aged 15 years and over who did not work during the reference week, was able and ready to work and had been actively looking for work during the last four weeks, but did not find any.
Unemployment refers to people who during the reference period: Are without work, available to work and actively seeking work
Reference period for seeking work: The latest full calendar month preceding the period of data collection
Reference period for availability for work: The seven days preceding the period of data collection
2. Institution which provides data
Central Department of Statistics and Information (CDSI), Ministry and Economy and Planning
3. Data availability
Surveys conducted since 1999 are available on the website of the CDSI (https://www.stats.gov.sa/en), in published form in PDF format. A selection of tables is also available in PDF or Excel format for 2012.
https://www.stats.gov.sa/en/814 (website English version) or https://www.stats.gov.sa/ar/814 (website Arabic version). The technical notes and tables of contents are in Arabic and the tables are in both languages.
Since 2007, Statistical Yearbooks have introduced a section on “Labour Statistics”, which presents a selection of tables from Manpower Surveys.
https://www.stats.gov.sa/en/46
Date of access: May 2013.
| |
Activity status |
|
In the Labour Force |
|
|
Out of the Labour Force |
|
|
Total |
|
| year |
|
Male |
Female |
Total |
Male |
Female |
Total |
Male |
Female |
Total |
| |
Saudis |
2.683.381 |
465.338 |
3.148.719 |
1.627.215 |
4.146.465 |
5.773.680 |
4.310.596 |
4.611.803 |
8.922.399 |
| 2002 |
Non-Saudis |
2.657.429 |
435.505 |
3.092.934 |
290.704 |
761.795 |
1.052.499 |
2.948.133 |
1.197.300 |
4.145.433 |
| |
Total |
5.340.810 |
900.843 |
6.241.653 |
1.917.919 |
4.908.260 |
6.826.179 |
7.258.729 |
5.809.103 |
13.067.832 |
| |
Saudis |
3.362.715 |
667.242 |
4.029.957 |
2.113.402 |
4.800.148 |
6.913.550 |
5.476.117 |
5.467.390 |
10.943.507 |
| 2007 R1 |
Non-Saudis |
3.596.775 |
602.924 |
4.199.699 |
225.818 |
784.376 |
1.010.194 |
3.822.593 |
1.387.300 |
5.209.893 |
| |
Total |
6.959.490 |
1.270.166 |
8.229.656 |
2.339.220 |
5.584.524 |
7.923.744 |
9.298.710 |
6.854.690 |
16.153.400 |
| |
Saudis |
3.901.818 |
938.336 |
4.840.154 |
2.439.096 |
5.428.542 |
7.867.638 |
6.340.914 |
6.366.878 |
12.707.792 |
| 2012 R1 |
Non-Saudis |
5.207.250 |
704.238 |
5.911.488 |
308.767 |
1.191.521 |
1.500.288 |
5.516.017 |
1.895.759 |
7.411.776 |
| |
Total |
9.109.068 |
1.642.574 |
10.751.642 |
2.747.863 |
6.620.063 |
9.367.926 |
11.856.931 |
8.262.637 |
20.119.568 |
Source: Manpower Surveys 2002; 2007 Round 1; 2012 Round 1.
ANNEXED NOTE
1. Technical Notes and Definitions
| |
sampling |
sample size |
|
| Survey |
frame |
(households) |
reference period |
| 2002 |
Census 1992 |
15.000 |
April 2002 |
| 2007 R1 |
Census 2004 |
23.000 |
February 19th-March 20th, 2007 |
| 2012 R1 |
Census 2010 |
29.000 |
January 25th-February 17th, 2012 |
Population of reference: all individuals (nationals and non-nationals) residing in the Kingdom during the period of reference.
The ultimate sampling unit is the household.
(a) Person in the labour force: a person aged 15 years and over, employed or unemployed.
(b) Person out of the labour force: A person aged 15 years and over who is not included in the labour force, among which: the persons staying home for domestics activities, the students, the retired, the self sufficients,
the ones unable to enrol in labour, who are not working and do not look for employment for any other reason.
2. Institution which provides data
Central Department of Statistics and Information (CDSI), Ministry and Economy and Planning
3. Data availability
Surveys conducted since 1999 are available on the website of the CDSI (http://www.cdsi.gov.sa/), in published form in PDF format. A selection of tables is also available in PDF or Excel format.
https://www.stats.gov.sa/en/814 (website English version) or https://www.stats.gov.sa/ar/814 (website Arabic version). The technical notes and tables of contents are in Arabic and the tables are in both languages.
Date of access: May 2013.
| |
|
1992 |
|
|
2004 |
|
|
2010* |
|
| Governorate |
Saudis |
Non-Saudis |
total |
Saudis |
Non-Saudis |
total |
Saudis |
Non-Saudis |
total |
| Riyadh |
2613915 |
1221071 |
3.834.986 |
3.725.557 |
1.732.716 |
5.458.273 |
4.296.745 |
2.480.401 |
6.777.146 |
| Mekkah |
2781075 |
1686595 |
4.467.670 |
3.584.628 |
2.212.556 |
5.797.184 |
4.116.065 |
2.798.941 |
6.915.006 |
| Al-Madinah |
837695 |
247252 |
1.084.947 |
1.144.271 |
368.453 |
1.512.724 |
1.262.512 |
515.421 |
1.777.933 |
| Al-Qassem |
610566 |
140413 |
750.979 |
817.271 |
198.701 |
1.015.972 |
928.491 |
287.367 |
1.215.858 |
| Eastern Region |
1902108 |
673712 |
2.575.820 |
2.555.502 |
804.529 |
3.360.031 |
2.891.115 |
1.214.665 |
4.105.780 |
| Assir |
1150089 |
190079 |
1.340.168 |
1.434.842 |
253.097 |
1.687.939 |
1.590.847 |
322.545 |
1.913.392 |
| Tabuk |
401917 |
84217 |
486.134 |
594.271 |
97.445 |
691.716 |
661.153 |
130.382 |
791.535 |
| Hail |
346177 |
65107 |
411.284 |
451.747 |
75.135 |
526.882 |
487.204 |
109.940 |
597.144 |
| Northern Border |
178610 |
50450 |
229.060 |
239.834 |
40.137 |
279.971 |
268.177 |
52.347 |
320.524 |
| Jizan |
733968 |
131993 |
865.961 |
994.025 |
193.562 |
1.187.587 |
1.105.095 |
260.015 |
1.365.110 |
| Najran |
240581 |
60413 |
300.994 |
349.041 |
71.304 |
420.345 |
402.424 |
103.228 |
505.652 |
| Al-Baha |
289946 |
42211 |
332.157 |
328.317 |
49.583 |
377.900 |
348.636 |
63.252 |
411.888 |
| Al-Jouf |
223406 |
44822 |
268.228 |
308.034 |
53.704 |
361.738 |
349.112 |
90.897 |
440.009 |
| TOTAL |
12.310.053 |
4.638.335 |
16.948.388 |
16.527.340 |
6.150.922 |
22.678.262 |
18.707.576 |
8.429.401 |
27.136.977 |
*preliminary results
Source: national censuses, given years
ANNEXED NOTE
1. Technical Notes and Definitions
Reference periods for each census: the nights of October 13th, 1992; September 15th, 2004; April 27th, 2010.
Implementation method: the Censuses are carried out according to de facto methodology, i.e. counting persons where they are during time of reference, be they usual residents of the place or temporary residents.
Population of reference: all individuals (nationals and non-nationals) present within the Kingdom’s borders during time of reference, be they permanent or temporary residents.
The census also includes: Saudi diplomats posted abroad (their details are provided by the Ministry of Foreign Affairs) and Saudis temporarily out of the Kingdom for reasons such as treatment, business, tourism, studies…, counted with their family members residing in the Kingdom.
2. Institution which provides data
Central Department of Statistics and Information (CDSI), Ministry and Economy and Planning
3. Data availability
As of May 31st, 2013, only preliminary results for 2010 census have been published online.
Parts of censuses conducted in 1992 and 2004 are available on the website of the CDSI (http://www.cdsi.gov.sa/), in published form in PDF format.
https://www.stats.gov.sa/en/13 (English)
https://www.stats.gov.sa/ar/13 (Arabic)
For 1992 all published data is broken down by nationality (Saudi/non-Saudi). For 2004, only the data on sex and administrative regions and sub-regions of residence is broken down by nationality (Saudi/ Non-Saudi).
Date of access: May 2013.
|
|
Saudis |
|
|
Non-Saudis |
|
|
Total |
|
| Education Status |
Males |
Females |
Total |
Males |
Females |
Total |
Males |
Females |
Total |
| Illiterate |
280.670 |
957.953 |
1.238.623 |
274.899 |
126.917 |
401.816 |
555.569 |
1.084.870 |
1.640.439 |
| Read and Write |
228.315 |
463.612 |
691.927 |
752.290 |
264.170 |
1.016.460 |
980.605 |
727.782 |
1.708.387 |
| Primary |
801.920 |
802.507 |
1.604.427 |
957.909 |
303.168 |
1.261.077 |
1.759.829 |
1.105.675 |
2.865.504 |
| Intermediate |
1.437.949 |
1.216.508 |
2.654.457 |
1.363.006 |
426.916 |
1.789.922 |
2.800.955 |
1.643.424 |
4.444.379 |
| Secondary or equivalent |
2.164.351 |
1.719.313 |
3.883.664 |
909.363 |
372.687 |
1.282.050 |
3.073.714 |
2.092.000 |
5.165.714 |
| Diploma |
404.066 |
186.299 |
590.365 |
285.030 |
59.607 |
344.637 |
689.096 |
245.906 |
935.002 |
| Bachelor Degree |
950.454 |
1.001.115 |
1.951.569 |
853.585 |
315.313 |
1.168.898 |
1.804.039 |
1.316.428 |
3.120.467 |
| Master Degree |
52.018 |
13.499 |
65.517 |
72.720 |
17.563 |
90.283 |
124.738 |
31.062 |
155.800 |
| Doctorate |
21.171 |
6.072 |
27.243 |
47.215 |
9.418 |
56.633 |
68.386 |
15.490 |
83.876 |
| Total |
6.340.914 |
6.366.878 |
12.707.792 |
5.516.017 |
1.895.759 |
7.411.776 |
11.856.931 |
8.262.637 |
20.119.568 |
Source: Labour Force Survey 2012 (Round 1).
ANNEXED NOTE
1. Technical Notes and Definitions
Sampling frame of LFS 2012 Round 1: Population Census 2010.
Sample size: 29 000 households
Reference period: January 25th-February 17th, 2012
Population of reference: all individuals (nationals and non-nationals) residing in the Kingdom during the period of reference.
The ultimate sampling unit is the household.
Classification used for education statuses is ISCED.
2. Institution which provides data
Central Department of Statistics and Information (CDSI), Ministry and Economy and Planning
3. Data availability
Surveys conducted since 1999 are available on the website of the CDSI (http://www.cdsi.gov.sa/), in published form in PDF format. A selection of tables is also available in PDF or Excel format.
https://www.stats.gov.sa/en/814 (website English version) or https://www.stats.gov.sa/ar/814 (website Arabic version). The technical notes and tables of contents are in Arabic and the tables are in both languages.
Since 2007, Statistical Yearbooks have introduced a section on “Labour Statistics”, which presents a selection of tables from Manpower Surveys.
https://www.stats.gov.sa/en/46
Date of access: May 2013.
| |
|
Saudis |
|
|
Non-Saudis |
|
|
Total |
|
| |
males |
females |
total |
males |
females |
total |
males |
females |
total |
| Never married |
2.764.009 |
2.213.540 |
4.977.549 |
1.010.570 |
370.320 |
1.380.890 |
3.774.579 |
2.583.860 |
6.358.439 |
| Married |
3.495.842 |
3.617.699 |
7.113.541 |
4.472.799 |
1.446.609 |
5.919.408 |
7.968.641 |
5.064.308 |
13.032.949 |
| Divorced |
46.427 |
136.301 |
182.728 |
18.053 |
22.444 |
40.497 |
64.480 |
158.745 |
223.225 |
| Widower |
34.636 |
399.338 |
433.974 |
14.595 |
56.386 |
70.981 |
49.231 |
455.724 |
504.955 |
| Total |
6.340.914 |
6.366.878 |
12.707.792 |
5.516.017 |
1.895.759 |
7.411.776 |
11.856.931 |
8.262.637 |
20.119.568 |
Source: Manpower Survey, 2012 (Round 1).
ANNEXED NOTE
1. Technical Notes and Definitions
Sampling frame of LFS 2012 Round 1: Population Census 2010.
Sample size: 29 000 households
Reference period: January 25th-February 17th, 2012
Population of reference: all individuals (nationals and non-nationals) residing in the Kingdom during the period of reference.
The ultimate sampling unit is the household.
2. Institution which provides data
Central Department of Statistics and Information (CDSI), Ministry and Economy and Planning
3. Data availability
Surveys conducted since 1999 are available on the website of the CDSI (http://www.cdsi.gov.sa/), in published form in PDF format. A selection of tables is also available in PDF or Excel format.
https://www.stats.gov.sa/en/814 (website English version) or https://www.stats.gov.sa/ar/814 (website Arabic version). The technical notes and tables of contents are in Arabic and the tables are in both languages.
Date of access: May 2013.
| year |
|
|
|
|
1992 |
|
|
|
|
|
|
|
|
2004 |
|
|
|
|
| Citizenship |
|
Saudis |
|
|
Non-Saudis |
|
|
TOTAL |
|
|
Saudis |
|
|
Non-Saudis |
|
|
TOTAL |
|
| Age Groups |
Males |
Females |
Total |
Males |
Females |
Total |
Males |
Females |
Total |
Males |
Females |
Total |
Males |
Females |
Total |
Males |
Females |
Total |
| Less than 1 |
223.025 |
213.981 |
437.006 |
39.320 |
37.524 |
76.844 |
262.345 |
251.505 |
513.850 |
210.963 |
206.990 |
417.953 |
41.790 |
39.991 |
81.781 |
252.753 |
246.981 |
499.734 |
| 1 – 4 |
873.488 |
845.523 |
1.719.011 |
163.996 |
157.368 |
321.364 |
1.037.484 |
1.002.891 |
2.040.375 |
855.047 |
847.535 |
1.702.582 |
181.591 |
175.756 |
357.347 |
1.036.638 |
1.023.291 |
2.059.929 |
| 5 – 9 |
1.061.429 |
1.046.203 |
2.107.632 |
182.545 |
179.478 |
362.023 |
1.243.974 |
1.225.681 |
2.469.655 |
1.127.253 |
1.112.582 |
2.239.835 |
207.007 |
197.901 |
404.908 |
1.334.260 |
1.310.483 |
2.644.743 |
| 10 – 14 |
913.956 |
883.052 |
1.797.008 |
129.577 |
125.665 |
255.242 |
1.043.533 |
1.008.717 |
2.052.250 |
1.081.884 |
1.155.728 |
2.237.612 |
176.568 |
167.659 |
344.227 |
1.258.452 |
1.323.387 |
2.581.839 |
| 15 – 19 |
660.372 |
674.584 |
1.334.956 |
80.154 |
80.695 |
160.849 |
740.526 |
755.279 |
1.495.805 |
948.707 |
938.982 |
1.887.689 |
150.298 |
142.200 |
292.498 |
1.099.005 |
1.081.182 |
2.180.187 |
| 20 – 24 |
525.534 |
516.615 |
1.042.149 |
259.179 |
101.744 |
360.923 |
784.713 |
618.359 |
1.403.072 |
760.146 |
786.510 |
1.546.656 |
298.251 |
159.920 |
458.171 |
1.058.397 |
946.430 |
2.004.827 |
| 25 – 29 |
415.443 |
455.358 |
870.801 |
612.593 |
156.401 |
768.994 |
1.028.036 |
611.759 |
1.639.795 |
725.413 |
701.326 |
1.426.739 |
626.706 |
240.156 |
866.862 |
1.352.119 |
941.482 |
2.293.601 |
| 30 – 34 |
326.933 |
320.143 |
647.076 |
633.639 |
226.364 |
860.003 |
960.572 |
546.507 |
1.507.079 |
569.152 |
575.126 |
1.144.278 |
709.730 |
271.093 |
980.823 |
1.278.882 |
846.219 |
2.125.101 |
| 35 – 39 |
264.540 |
283.492 |
548.032 |
499.700 |
143.272 |
642.972 |
764.240 |
426.764 |
1.191.004 |
492.543 |
498.170 |
990.713 |
674.734 |
190.103 |
864.837 |
1.167.277 |
688.273 |
1.855.550 |
| 40 – 44 |
180.207 |
186.672 |
366.879 |
320.615 |
72.340 |
392.955 |
500.822 |
259.012 |
759.834 |
411.890 |
372.981 |
784.871 |
511.983 |
121.907 |
633.890 |
923.873 |
494.888 |
1.418.761 |
| 45 – 49 |
153.968 |
161.226 |
315.194 |
171.716 |
36.619 |
208.335 |
325.684 |
197.845 |
523.529 |
313.340 |
277.511 |
590.851 |
338.148 |
72.775 |
410.923 |
651.488 |
350.286 |
1.001.774 |
| 50 – 54 |
143.948 |
147.998 |
291.946 |
92.104 |
23.011 |
115.115 |
236.052 |
171.009 |
407.061 |
222.166 |
199.415 |
421.581 |
193.133 |
43.516 |
236.649 |
415.299 |
242.931 |
658.230 |
| 55 – 59 |
117.397 |
92.678 |
210.075 |
39.890 |
10.313 |
50.203 |
157.287 |
102.991 |
260.278 |
146.079 |
153.194 |
299.273 |
84.880 |
21.644 |
106.524 |
230.959 |
174.838 |
405.797 |
| 60 – 64 |
127.584 |
92.843 |
220.427 |
20.711 |
9.488 |
30.199 |
148.295 |
102.331 |
250.626 |
126.594 |
134.390 |
260.984 |
39.555 |
14.973 |
54.528 |
166.149 |
149.363 |
315.512 |
| 65 – 69 |
71.059 |
48.789 |
119.848 |
7.939 |
4.280 |
12.219 |
78.998 |
53.069 |
132.067 |
103.245 |
101.213 |
204.458 |
16.678 |
7.846 |
24.524 |
119.923 |
109.059 |
228.982 |
| 70 – 74 |
65.096 |
52.577 |
117.673 |
5.200 |
4.534 |
9.734 |
70.296 |
57.111 |
127.407 |
77.277 |
84.898 |
162.175 |
9.837 |
6.381 |
16.218 |
87.114 |
91.279 |
178.393 |
| 75 – 79 |
33.012 |
23.705 |
56.717 |
2.058 |
1.715 |
3.773 |
35.070 |
25.420 |
60.490 |
49.598 |
37.629 |
87.227 |
4.193 |
2.767 |
6.960 |
53.791 |
40.396 |
94.187 |
| 80+ |
58.802 |
48.821 |
107.623 |
3.244 |
3.344 |
6.588 |
62.046 |
52.165 |
114.211 |
66.073 |
55.790 |
121.863 |
4.788 |
4.464 |
9.252 |
70.861 |
60.254 |
131.115 |
| Total |
6.215.793 |
6.094.260 |
12.310.053 |
3.264.180 |
1.374.155 |
4.638.335 |
9.479.973 |
7.468.415 |
16.948.388 |
8.287.370 |
8.239.970 |
16.527.340 |
4.269.870 |
1.881.052 |
6.150.922 |
12.557.240 |
10.121.022 |
22.678.262 |
Source: national censuses, given years
ANNEXED NOTE
1. Technical Notes and Definitions
Reference periods for each census: the nights of October 13th, 1992; September 15th, 2004; April 27th, 2010.
Implementation method: the Censuses are carried out according to de facto methodology, i.e. counting persons where they are during time of reference, be they usual residents of the place or temporary residents.
Population of reference: all individuals (nationals and non-nationals) present within the Kingdom’s borders during time of reference, be they permanent or temporary residents.
The census also includes: Saudi diplomats posted abroad (their details are provided by the Ministry of Foreign Affairs) and Saudis temporarily out of the Kingdom for reasons such as treatment, business, tourism, studies…, counted with their family members residing in the Kingdom.
2. Institution which provides data
Central Department of Statistics and Information (CDSI), Ministry and Economy and Planning
3. Data availability
As of May 31st, 2013, only preliminary results of 2010′ census have been published online.
Parts of censuses conducted in 1992 and 2004 are available on the website of the CDSI (http://www.cdsi.gov.sa/), in published form in PDF format.
https://www.stats.gov.sa/en/13 (English)
https://www.stats.gov.sa/ar/13 (Arabic)
For 1992 all published data is broken down by nationality (Saudi/non-Saudi). For 2004, only the data on sex and administrative regions and sub-regions of residence is broken down by nationality (Saudi/ Non-Saudi).
Date of access: May 2013.
| |
|
Saudis |
|
|
Non-Saudis |
|
|
Total |
|
| year |
males |
females |
total |
males |
females |
total |
males |
females |
total |
| 1974 |
3.193.544 |
3.024.817 |
6.218.361 |
528.671 |
262.434 |
791.105 |
3.722.215 |
3.287.251 |
7.009.466 |
| 1992 |
6.215.793 |
6.094.260 |
12.310.053 |
3.264.180 |
1.374.155 |
4.638.335 |
9.479.973 |
7.468.415 |
16.948.388 |
| 2004 |
8.287.370 |
8.239.970 |
16.527.340 |
4.269.870 |
1.881.052 |
6.150.922 |
12.557.240 |
10.121.022 |
22.678.262 |
| 2010* |
9.527.173 |
9.180.403 |
18.707.576 |
5.932.974 |
2.496.427 |
8.429.401 |
15.460.147 |
11.676.830 |
27.136.977 |
Source: national censuses, given years
* preliminary results
ANNEXED NOTE
1. Technical Notes and Definitions
Reference periods for each census: the nights of October 13th, 1992; September 15th, 2004; April 27th, 2010.
Implementation method: the Censuses are carried out according to de facto methodology, i.e. counting persons where they are during time of reference, be they usual residents of the place or temporary residents.
Population of reference: all individuals (nationals and non-nationals) present within the Kingdom’s borders during time of reference, be they permanent or temporary residents.
The census also includes: Saudi diplomats posted abroad (their details are provided by the Ministry of Foreign Affairs) and Saudis temporarily out of the Kingdom for reasons such as treatment, business, tourism, studies…, counted with their family members residing in the Kingdom.
2. Institution which provides data
Central Department of Statistics and Information (CDSI), Ministry and Economy and Planning
3. Data availability
As of May 31st, 2013, only preliminary results of 2010′ census have been published.
Parts of censuses conducted in 1992 and 2004 are available on the website of the CDSI (http://www.cdsi.gov.sa/), in published form in PDF format.
https://www.stats.gov.sa/en/13 (English)
https://www.stats.gov.sa/ar/13 (Arabic)
For 1992 all published data is broken down by nationality (Saudi/non-Saudi). For 2004, only the data on sex and administrative regions and sub-regions of residence is broken down by nationality (Saudi/ Non-Saudi).
Date of access: May 2013.
| year |
Saudis |
Non-Saudis |
Total |
| 1974 |
6.218.361 |
791.105 |
7.009.466 |
| 1992 |
12.310.053 |
4.638.335 |
16.948.388 |
| 2004 |
16.527.340 |
6.150.922 |
22.678.262 |
| 2010 |
18 707 576* |
8 429 401* |
27 136 977* |
Source: national censuses, given years
* preliminary results
ANNEXED NOTE
1. Technical Notes and Definitions
Reference periods for each census: the nights of October 13th, 1992; September 15th, 2004; April 27th, 2010.
Implementation method: the Censuses are carried out according to de facto methodology, i.e. counting persons where they are during time of reference, be they usual residents of the place or temporary residents.
Population of reference: all individuals (nationals and non-nationals) present within the Kingdom’s borders during time of reference, be they permanent or temporary residents.
The census also includes: Saudi diplomats posted abroad (their details are provided by the Ministry of Foreign Affairs) and Saudis temporarily out of the Kingdom for reasons such as treatment, business, tourism, studies…, counted with their family members residing in the Kingdom.
2. Institution which provides data
Central Department of Statistics and Information (CDSI), Ministry and Economy and Planning
3. Data availability
As of May 31st, 2013, only preliminary results of 2010′ census have been published.
Parts of censuses conducted in 1992 and 2004 are available on the website of the CDSI (http://www.cdsi.gov.sa/), in published form in PDF format.
https://www.stats.gov.sa/en/13 (English)
https://www.stats.gov.sa/ar/13 (Arabic)
For 1992 all published data is broken down by nationality (Saudi/non-Saudi). For 2004, only the data on sex and administrative regions and sub-regions of residence is broken down by nationality (Saudi/ Non-Saudi).
Date of access: May 2013.
| Public Universities |
|
Saudis |
|
|
Non-Saudis |
|
|
Total |
|
| males |
females |
total |
males |
females |
total |
males |
females |
total |
| Intermediate Diploma |
7132 |
8389 |
15521 |
319 |
232 |
551 |
7451 |
8621 |
16072 |
| B.Sc and B.A. |
132759 |
127679 |
260438 |
7455 |
4585 |
12040 |
140214 |
132264 |
272478 |
| Higher Diploma |
3642 |
2818 |
6460 |
153 |
14 |
167 |
3795 |
2832 |
6627 |
| Master |
4252 |
3750 |
8002 |
915 |
106 |
1021 |
5167 |
3856 |
9023 |
| Fellowship |
75 |
27 |
102 |
0 |
0 |
0 |
75 |
27 |
102 |
| Doctorate |
542 |
332 |
874 |
192 |
10 |
202 |
734 |
342 |
1076 |
| Total |
148402 |
142995 |
291397 |
9034 |
4947 |
13981 |
157436 |
147942 |
305378 |
| Private universities and colleges |
|
|
|
|
|
|
|
|
|
|
|
|
|
|
|
|
|
|
| Intermediate Diploma |
0 |
0 |
0 |
0 |
0 |
0 |
0 |
0 |
0 |
| B.Sc and B.A. |
5835 |
5269 |
11104 |
1348 |
1163 |
2511 |
7183 |
6432 |
13615 |
| Higher Diploma |
354 |
158 |
512 |
1 |
4 |
5 |
355 |
162 |
517 |
| Master |
395 |
250 |
645 |
14 |
17 |
31 |
409 |
267 |
676 |
| Fellowship |
0 |
0 |
0 |
0 |
0 |
0 |
0 |
0 |
0 |
| Doctorate |
0 |
0 |
0 |
0 |
0 |
0 |
0 |
0 |
0 |
| Total |
6584 |
5677 |
12261 |
1363 |
1184 |
2547 |
7947 |
6861 |
14808 |
| Other higher education institutions |
|
|
|
|
|
|
|
|
|
|
|
|
|
|
|
|
|
|
| Intermediate Diploma |
38929 |
4067 |
42996 |
3 |
0 |
3 |
38932 |
4067 |
42999 |
| B.Sc and B.A. |
1723 |
1137 |
2860 |
9 |
7 |
16 |
1732 |
1144 |
2876 |
| Higher Diploma |
150 |
0 |
150 |
0 |
0 |
0 |
150 |
0 |
150 |
| Master |
5 |
0 |
5 |
0 |
0 |
0 |
5 |
0 |
5 |
| Fellowship |
0 |
0 |
0 |
0 |
0 |
0 |
0 |
0 |
0 |
| Doctorate |
0 |
0 |
0 |
0 |
0 |
0 |
0 |
0 |
0 |
| Total |
40807 |
5204 |
46011 |
12 |
7 |
19 |
40819 |
5211 |
46030 |
| TOTAL |
|
|
|
|
|
|
|
|
|
|
|
|
|
|
|
|
|
|
| Intermediate Diploma |
46061 |
12456 |
58517 |
322 |
232 |
554 |
46383 |
12688 |
59071 |
| B.Sc and B.A. |
140317 |
134085 |
274402 |
8812 |
5755 |
14567 |
149129 |
139840 |
288969 |
| Higher Diploma |
4146 |
2976 |
7122 |
154 |
18 |
172 |
4300 |
2994 |
7294 |
| Master |
4652 |
4000 |
8652 |
929 |
123 |
1052 |
5581 |
4123 |
9704 |
| Fellowship |
75 |
27 |
102 |
0 |
0 |
0 |
75 |
27 |
102 |
| Doctorate |
542 |
332 |
874 |
192 |
10 |
202 |
734 |
342 |
1076 |
| Total |
195793 |
153876 |
349669 |
10409 |
6138 |
16547 |
206202 |
160014 |
366216 |
Source: Ministry of Higher Education
ANNEXED NOTE
The table refers to the students classified as “new entrants” (mustajiddoûn) for the university year 1432-1433H (2011-2012D).
Institution which provides data
Saudi Ministry of Higher Education.
Data availability
MoHE yearly compilation of statistical data tables back to 1980, are available on the website of the Ministry of Higher Education (Arabic website), in Excel and in html format.
http://www.mohe.gov.sa/ar/Ministry/Deputy-Ministry-for-Planning-and-Information-affairs/HESC/Ehsaat/Pages/default.aspx
Date of access: June 2013.
| Duration of validity |
|
One-year |
|
|
Two-years |
|
|
TOTAL WORK PERMITS |
|
| Category |
males |
females |
total |
males |
females |
total |
TOT. MALES |
TOT. FEMALES |
GRAND TOTAL |
| First issuance |
2.291.073 |
47.255 |
2.338.328 |
296.360 |
7.025 |
303.385 |
2.587.433 |
54.280 |
2.641.713 |
| Renewal |
995.499 |
15.235 |
1.010.734 |
354.654 |
5.278 |
359.932 |
1.350.153 |
20.513 |
1.370.666 |
| Change of profession |
4.133 |
23 |
4.156 |
1.895 |
21 |
1.916 |
6.028 |
44 |
6.072 |
| Exchange after loss or deterioration |
36.386 |
503 |
36.889 |
29.575 |
315 |
29.890 |
65.961 |
818 |
66.779 |
| Change of sponsor |
1.728 |
24 |
1.752 |
1.091 |
20 |
1.111 |
2.819 |
44 |
2.863 |
| Total |
3.328.819 |
63.040 |
3.391.859 |
683.575 |
12.659 |
696.234 |
4.012.394 |
75.699 |
4.088.093 |
Source: Ministry of Labour
1. Data collection methodology
Ahead of any application for first granting or renewal of residency permits from the Passports Directorate, a labour permit has first to be issued by the Labour Ministry.
2. Institution which provides data
Ministry of Labour
3. Data availability
Published in Ministry of Labour’s Statistical Yearbooks
MoL Yearbooks are available online at http://portal.mol.gov.sa/ar/Statistics/Pages/default.aspx (all issues since 2004)
Date of access: May 2013.
| Economic activity sector of work permit’ holder |
year |
| 2010 |
2011 |
| Agriculture, Forests, Hunting and Fishing |
97.414 |
135.689 |
| Mines, Oil, Gas and Quarries |
13.691 |
11.355 |
| Manufacturing industries |
342.181 |
418.885 |
| Electricity, Gas and Water |
10.483 |
7.340 |
| Construction |
1.762.186 |
2.263.656 |
| Retails and Hotels |
636.953 |
691.985 |
| Transports and Storage |
92.733 |
133.215 |
| Finance, Insurance, Real estate services and Businesses |
51.272 |
55.550 |
| Collective, Social, and Personal services |
323.033 |
370.418 |
| Not stated |
15.684 |
0 |
| TOTAL |
3.345.630 |
4.088.093 |
Source: Ministry of Labour
1. Definitions
Classification used for occupations is adapted from ISCO 1988.
2. Data collection methodology
The issuance of the residency and work permits begins with filing an application with the Ministry of Labor.
After its approval, the Ministry of Labor forwards the application to the Ministry of Interior for the issuance of the residency permit.
3. Institution which provides data
Ministry of Labour
4. Data availability
Published in Ministry of Labour’s Statistical Yearbooks
MoL Yearbooks are available online at http://portal.mol.gov.sa/ar/Statistics/Pages/default.aspx (all issues since 2004)
Date of access: May 2013.
| |
|
2011 |
|
| |
Male |
Female |
Total |
| Riyadh |
410.634 |
94.880 |
505.514 |
| Makkah |
175.339 |
50.137 |
225.476 |
| Madinah |
41.638 |
14.482 |
56.120 |
| Al-Qasseem |
81.761 |
14.786 |
96.547 |
| Eastern |
264.372 |
47.054 |
311.426 |
| Assir |
49.408 |
14.101 |
63.509 |
| Tabouk |
13.384 |
5.820 |
19.204 |
| Hail |
30.190 |
7.606 |
37.796 |
| Northern Border |
8.328 |
3.468 |
11.796 |
| Jazan |
10.395 |
4.789 |
15.184 |
| Najran |
27.811 |
3.933 |
31.744 |
| Al-Baha |
8.904 |
3.823 |
12.727 |
| Al-Jouf |
18.977 |
5.668 |
24.645 |
| Total |
1.141.141 |
270.547 |
1.411.688 |
Source: Ministry of Interior, General Directorate of Passports.
1. Institution which provides data
Central Department of Statistics and Information (CDSI), Ministry and Economy and Planning
2. Data availability
Published in the CDSI’ Statistical Yearbooks, in Chapter “Social services”
All Statistical Yearbooks are available online at: https://www.stats.gov.sa/en/46
Date of access: May 2013.
| Year |
2000 |
| |
|
Workers |
|
|
Accompanying Persons |
|
GRAND |
| Governorate |
Male |
Female |
Total |
Male |
Female |
Total |
TOTAL |
| Riyadh |
225.358 |
50.827 |
276.185 |
5.531 |
9.568 |
15.099 |
291.284 |
| Makkah |
108.613 |
40.898 |
149.511 |
3.204 |
5.503 |
8.707 |
158.218 |
| Madinah |
26.682 |
8.707 |
35.389 |
446 |
714 |
1.160 |
36.549 |
| Al-Qasseem |
100.902 |
30.390 |
131.292 |
2.323 |
3.938 |
6.261 |
137.553 |
| Eastern |
3.641 |
1.406 |
5.047 |
97 |
108 |
205 |
5.252 |
| Assir |
10.556 |
3.751 |
14.307 |
221 |
325 |
546 |
14.853 |
| Tabouk |
11.780 |
3.975 |
15.755 |
168 |
297 |
465 |
16.220 |
| Hail |
23.322 |
7.191 |
30.513 |
381 |
563 |
944 |
31.457 |
| Northern Border |
7.837 |
2.800 |
10.637 |
163 |
236 |
399 |
11.036 |
| Jazan |
28.068 |
7.939 |
36.007 |
503 |
728 |
1.231 |
37.238 |
| Najran |
6.506 |
2.528 |
9.034 |
135 |
210 |
345 |
9.379 |
| Al-Baha |
6.932 |
1.474 |
8.406 |
132 |
226 |
358 |
8.764 |
| Al-Jouf |
5.590 |
2.227 |
7.817 |
117 |
166 |
283 |
8.100 |
| Total |
565.787 |
164.113 |
729.900 |
13.421 |
22.582 |
36.003 |
765.903 |
| Year |
2005 |
| |
|
Workers |
|
|
Accompanying Persons |
|
GRAND |
| Governorate |
Male |
Female |
Total |
Male |
Female |
Total |
TOTAL |
| Riyadh |
149.804 |
94.314 |
244.118 |
289 |
411 |
700 |
244.818 |
| Makkah |
57.564 |
37.224 |
94.788 |
154 |
255 |
409 |
95.197 |
| Madinah |
15.548 |
11.452 |
27.000 |
87 |
130 |
217 |
27.217 |
| Al-Qasseem |
99.548 |
46.527 |
146.075 |
263 |
359 |
622 |
146.697 |
| Eastern |
3.560 |
3.068 |
6.628 |
55 |
79 |
134 |
6.762 |
| Assir |
5.738 |
5.317 |
11.055 |
37 |
47 |
84 |
11.139 |
| Tabouk |
8.721 |
6.386 |
15.107 |
23 |
47 |
70 |
15.177 |
| Hail |
24.420 |
11.550 |
35.970 |
162 |
186 |
348 |
36.318 |
| Northern Border |
7.225 |
4.764 |
11.989 |
18 |
31 |
49 |
12.038 |
| Jazan |
19.881 |
10.522 |
30.403 |
187 |
177 |
364 |
30.767 |
| Najran |
4.235 |
3.987 |
8.222 |
48 |
37 |
85 |
8.307 |
| Al-Baha |
6.511 |
2.418 |
8.929 |
12 |
23 |
35 |
8.964 |
| Al-Jouf |
4.436 |
2.869 |
7.305 |
27 |
31 |
58 |
7.363 |
| Total |
407.191 |
240.398 |
647.589 |
1.362 |
1.813 |
3.175 |
650.764 |
| Year |
2010 |
| |
|
Workers |
|
|
Accompanying Persons |
|
GRAND |
| Governorate |
Male |
Female |
Total |
Male |
Female |
Total |
TOTAL |
| Riyadh |
383.028 |
112.729 |
495.757 |
31.999 |
49.351 |
81.350 |
577.107 |
| Makkah |
178.593 |
56.748 |
235.341 |
31.022 |
42.464 |
73.486 |
308.827 |
| Madinah |
42.582 |
18.464 |
61.046 |
5.270 |
7.202 |
12.472 |
73.518 |
| Al-Qasseem |
87.558 |
16.993 |
104.551 |
2.806 |
3.784 |
6.590 |
111.141 |
| Eastern |
232.570 |
58.301 |
290.871 |
13.958 |
22.259 |
36.217 |
327.088 |
| Assir |
44.678 |
16.989 |
61.667 |
2.912 |
4.196 |
7.108 |
68.775 |
| Tabouk |
12.855 |
7.213 |
20.068 |
1.676 |
2.387 |
4.063 |
24.131 |
| Hail |
30.324 |
8.949 |
39.273 |
1.206 |
1.652 |
2.858 |
42.131 |
| Northern Border |
8.391 |
4.213 |
12.604 |
563 |
815 |
1.378 |
13.982 |
| Jazan |
9.669 |
5.494 |
15.163 |
1.594 |
2.298 |
3.892 |
19.055 |
| Najran |
23.694 |
4.707 |
28.401 |
1.521 |
2.014 |
3.535 |
31.936 |
| Al-Baha |
7.963 |
4.592 |
12.555 |
726 |
1.086 |
1.812 |
14.367 |
| Al-Jouf |
18.392 |
6.869 |
25.261 |
949 |
1.323 |
2.272 |
27.533 |
| Total |
1.080.297 |
322.261 |
1.402.558 |
96.202 |
140.831 |
237.033 |
1.639.591 |
Source: Ministry of Interior, General Directorate of Passports.
1. Institution which provides data
Central Department of Statistics and Information (CDSI), Ministry and Economy and Planning
2. Data availability
Published in the CDSI’ Statistical Yearbooks, in Chapter “Social services”
All Statistical Yearbooks are available online at: https://www.stats.gov.sa/en/46
Date of access: May 2013.
ARRIVALS
| Nationality |
2000 |
2001 |
2002 |
2003 |
2004 |
2005 |
2006 |
2007 |
2008 |
2009 |
2010 |
2011 |
| ARAB COUNTRIES |
|
|
|
|
|
|
|
|
|
|
|
|
| Iraq |
7.410 |
10.741 |
10.359 |
10.223 |
34.896 |
n.a. |
45.638 |
71.245 |
95.854 |
182.354 |
238.949 |
339.698 |
| Syria |
778.342 |
865.143 |
923.436 |
953.977 |
1.041.337 |
n.a. |
1.210.545 |
1.365.094 |
1.395.903 |
1.492.121 |
1.596.094 |
1.333.538 |
| Lebanon |
118.073 |
132.456 |
149.924 |
158.856 |
180.652 |
n.a. |
217.343 |
257.068 |
273.894 |
295.701 |
325.815 |
283.435 |
| Jordan |
455.460 |
472.469 |
508.874 |
526.282 |
571.570 |
n.a. |
729.727 |
796.945 |
865.868 |
944.952 |
1.054.166 |
1.117.081 |
| Kuwait |
1.348.492 |
1.347.382 |
1.512.632 |
1.451.385 |
1.584.531 |
n.a. |
2.032.634 |
2.142.925 |
2.378.318 |
2.496.382 |
2.459.935 |
1.994.658 |
| Yemen |
309.082 |
411.259 |
498.787 |
510.822 |
530.823 |
n.a. |
603.998 |
662.000 |
717.437 |
752.469 |
831.990 |
813.663 |
| Bahrain |
952.184 |
1.049.049 |
1.128.634 |
1.291.062 |
1.407.001 |
n.a. |
1.561.882 |
1.767.358 |
1.679.447 |
1.425.553 |
1.600.619 |
1.184.801 |
| Qatar |
451.946 |
480.142 |
509.960 |
553.701 |
604.441 |
n.a. |
801.392 |
925.516 |
946.890 |
918.916 |
937.669 |
755.511 |
| UAE |
191.895 |
209.164 |
216.049 |
236.422 |
259.785 |
n.a. |
320.252 |
383.663 |
401.744 |
366.111 |
420.162 |
349.388 |
| Oman |
102.389 |
121.604 |
144.244 |
160.814 |
174.154 |
n.a. |
237.325 |
251.178 |
236.121 |
201.317 |
248.187 |
165.589 |
| Palestine |
86.637 |
89.444 |
94.310 |
65.088 |
66.411 |
n.a. |
103.983 |
82.932 |
94.348 |
100.498 |
111.787 |
109.673 |
| Algeria |
57.121 |
52.068 |
59.835 |
65.219 |
83.858 |
n.a. |
107.411 |
120.228 |
127.408 |
141.141 |
159.464 |
188.549 |
| Mauritania |
3.259 |
2.784 |
3.762 |
2.966 |
3.856 |
n.a. |
4.436 |
4.194 |
4.258 |
3.185 |
4.258 |
5.733 |
| Egypt |
1.363.965 |
1.457.416 |
1.555.376 |
1.509.117 |
1.714.341 |
n.a. |
1.793.629 |
1.957.763 |
2.114.774 |
2.096.942 |
2.353.159 |
2.544.702 |
| Morocco |
55.356 |
41.210 |
56.000 |
53.907 |
59.657 |
n.a. |
74.994 |
93.078 |
95.176 |
93.503 |
110.318 |
131.841 |
| Sudan |
279.433 |
310.708 |
337.496 |
311.170 |
342.656 |
n.a. |
339.551 |
358.516 |
363.287 |
372.662 |
403.828 |
444.032 |
| Tunisia |
39.006 |
31.653 |
37.819 |
37.882 |
41.574 |
n.a. |
48.270 |
51.298 |
54.663 |
42.601 |
66.815 |
73.856 |
| Libya |
25.958 |
21.508 |
26.341 |
28.114 |
40.754 |
n.a. |
57.041 |
60.134 |
63.251 |
67.043 |
86.536 |
2.430 |
| Somalia |
11.125 |
11.427 |
15.994 |
15.497 |
14.799 |
n.a. |
12.661 |
11.075 |
9.837 |
9.515 |
9.621 |
8.884 |
| Djibouti |
1.383 |
969 |
1.042 |
997 |
1.075 |
n.a. |
1.073 |
1.290 |
1.288 |
1.428 |
1.757 |
1.774 |
| Displaced Arab Tribes |
6.220 |
6.545 |
7.978 |
9.093 |
517 |
n.a. |
1.599 |
705 |
428 |
461 |
283 |
447 |
| Comore Islands |
402 |
256 |
267 |
183 |
180 |
n.a. |
214 |
284 |
320 |
493 |
1.991 |
3.941 |
| Kuwait (No-Nationality) |
7.171 |
2.090 |
1.528 |
1.262 |
1.237 |
n.a. |
1.466 |
8.180 |
|
|
|
|
| Other Arab Nationalities |
12.101 |
14.785 |
15.867 |
23.413 |
56.125 |
n.a. |
19.760 |
7.405 |
55.814 |
60.094 |
65.272 |
62.490 |
| Total |
6.664.410 |
7.142.272 |
7.816.514 |
7.977.452 |
8.816.230 |
n.a. |
10.326.824 |
11.380.074 |
11.976.328 |
12.065.442 |
13.088.675 |
11.915.714 |
| ASIA |
|
|
|
|
|
|
|
|
|
|
|
|
| Afghanistan |
12.282 |
11.792 |
14.021 |
12.876 |
11.590 |
n.a. |
19.627 |
17.471 |
33.767 |
35.722 |
42.652 |
47.557 |
| Turkey |
109.893 |
99.180 |
121.199 |
134.484 |
165.487 |
n.a. |
239.484 |
276.236 |
322.355 |
327.513 |
434.185 |
562.490 |
| Iran |
230.876 |
220.264 |
286.709 |
548.796 |
504.572 |
n.a. |
577.628 |
621.946 |
642.492 |
803.425 |
415.075 |
792.377 |
| Malaysia |
59.451 |
48.213 |
57.413 |
43.170 |
61.235 |
n.a. |
66.483 |
77.824 |
90.480 |
98.376 |
123.536 |
157.199 |
| Japan |
10.928 |
10.174 |
12.586 |
11.547 |
10.470 |
n.a. |
15.915 |
20.353 |
20.721 |
20.126 |
20.942 |
22.432 |
| Indonesia |
282.475 |
266.025 |
323.951 |
295.175 |
363.012 |
n.a. |
448.490 |
452.540 |
472.731 |
498.326 |
545.756 |
550.969 |
| Philippines |
260.179 |
272.149 |
287.905 |
295.052 |
310.347 |
n.a. |
411.012 |
457.409 |
494.324 |
534.395 |
556.273 |
556.977 |
| Pakistan |
695.197 |
697.403 |
823.379 |
887.404 |
957.363 |
n.a. |
1.127.905 |
1.195.555 |
1.272.313 |
1.367.031 |
1.522.400 |
1.770.065 |
| India |
765.505 |
802.943 |
904.003 |
961.300 |
1.046.523 |
n.a. |
1.376.865 |
1.596.975 |
1.762.780 |
2.008.212 |
2.241.884 |
2.463.612 |
| China |
1.211 |
1.163 |
1.951 |
1.544 |
2.079 |
n.a. |
2.178 |
2.309 |
3.030 |
3.313 |
3.007 |
3.400 |
| South Korea |
5.983 |
5.965 |
6.264 |
6.207 |
6.826 |
n.a. |
9.906 |
14.898 |
20.099 |
27.043 |
32.449 |
38.464 |
| Singapore |
13.803 |
11.045 |
9.226 |
4.866 |
7.469 |
n.a. |
8.113 |
8.617 |
9.782 |
9.015 |
10.111 |
11.891 |
| Bangladesh |
330.435 |
351.163 |
411.266 |
413.491 |
433.953 |
n.a. |
458.689 |
589.994 |
537.798 |
463.300 |
475.331 |
520.598 |
| Hong Kong |
22 |
28 |
17 |
35 |
53 |
n.a. |
|
|
743 |
521 |
132 |
63 |
| Thailand |
7.318 |
7.110 |
9.261 |
8.128 |
8.337 |
n.a. |
9.327 |
8.311 |
9.450 |
8.452 |
9.517 |
11.643 |
| Sri Lanka |
109.384 |
117.215 |
127.843 |
137.073 |
133.371 |
n.a. |
132.713 |
140.404 |
153.240 |
167.230 |
173.762 |
176.069 |
| Other Asian Nationalities |
55.685 |
59.812 |
73.922 |
97.765 |
72.605 |
n.a. |
128.116 |
179.809 |
214.090 |
252.994 |
261.418 |
275.655 |
| Total |
6.664.410 |
7.142.272 |
7.816.514 |
7.977.452 |
4.095.292 |
n.a. |
5.032.451 |
329.078 |
6.573.320 |
6.624.994 |
6.868.430 |
7.961.461 |
| EUROPE |
|
|
|
|
|
|
|
|
|
|
|
|
| Britain |
161.721 |
155.196 |
168.635 |
164.845 |
180.015 |
n.a. |
221.539 |
238.142 |
246.293 |
269.565 |
287.774 |
309.200 |
| France |
23.089 |
23.562 |
27.393 |
26.551 |
26.843 |
n.a. |
35.120 |
38.447 |
45.824 |
50.162 |
56.658 |
65.013 |
| Holland |
9.850 |
8.177 |
9.588 |
9.878 |
11.531 |
n.a. |
15.799 |
18.031 |
18.841 |
20.925 |
20.200 |
23.713 |
| Belgium |
3.154 |
2.949 |
3.563 |
3.371 |
4.037 |
n.a. |
5.119 |
7.517 |
9.632 |
10.062 |
10.235 |
11.429 |
| Italy |
11.046 |
11.230 |
12.341 |
11.780 |
12.363 |
n.a. |
16.554 |
20.973 |
24.525 |
26.548 |
28.916 |
33.023 |
| Sweden |
6.744 |
6.298 |
7.065 |
6.440 |
6.319 |
n.a. |
6.913 |
7.459 |
7.638 |
7.631 |
7.999 |
8.619 |
| Norway |
2.551 |
2.369 |
2.564 |
2.259 |
2.258 |
n.a. |
3.091 |
3.489 |
4.357 |
3.717 |
3.875 |
4.316 |
| Switzerland |
2.729 |
2.763 |
3.373 |
3.484 |
3.315 |
n.a. |
4.726 |
5.371 |
5.961 |
6.414 |
6.100 |
6.342 |
| Austria |
2.031 |
2.067 |
2.140 |
2.597 |
3.023 |
n.a. |
5.166 |
5.721 |
5.476 |
5.970 |
6.366 |
7.095 |
| Germany |
16.804 |
16.360 |
17.851 |
18.285 |
23.035 |
n.a. |
31.804 |
37.099 |
42.797 |
48.002 |
54.488 |
58.575 |
| Spain |
2.731 |
2.668 |
3.053 |
3.092 |
3.078 |
n.a. |
5.250 |
7.199 |
9.974 |
10.534 |
12.455 |
15.322 |
| Denmark |
3.317 |
2.818 |
3.173 |
2.859 |
2.834 |
n.a. |
2.920 |
3.464 |
4.204 |
4.702 |
5.561 |
6.440 |
| Greece |
3.555 |
3.712 |
3.665 |
3.240 |
3.505 |
n.a. |
4.600 |
4.640 |
4.745 |
4.540 |
5.326 |
7.354 |
| Cyprus |
1.816 |
1.825 |
1.675 |
1.278 |
1.250 |
n.a. |
1.381 |
1.708 |
1.988 |
1.782 |
1.767 |
1.911 |
| Finland |
1.349 |
1.466 |
1.759 |
1.459 |
1.056 |
n.a. |
1.264 |
2.245 |
2.509 |
2.709 |
3.103 |
3.840 |
| Other European Nationalities |
18.998 |
18.604 |
17.808 |
20.943 |
23.767 |
n.a. |
41.376 |
33.783 |
46.502 |
45.146 |
49.569 |
62.117 |
| Total |
271.485 |
262.064 |
285.646 |
282.361 |
308.229 |
n.a. |
402.622 |
435.288 |
481.266 |
518.409 |
560.392 |
624.309 |
| AFRICA |
|
|
|
|
|
|
|
|
|
|
|
|
| Ethiopia |
27.593 |
24.888 |
37.051 |
40.294 |
51.472 |
n.a. |
21.761 |
28.977 |
40.365 |
54.225 |
49.634 |
95.605 |
| Mali |
3.201 |
2.132 |
2.623 |
2.147 |
2.368 |
n.a. |
2.941 |
3.715 |
2.883 |
2.771 |
3.467 |
6.047 |
| Nigeria |
37.431 |
37.567 |
45.489 |
49.424 |
54.547 |
n.a. |
51.879 |
38.386 |
34.693 |
36.254 |
50.748 |
73.969 |
| South Africa |
20.314 |
19.908 |
23.242 |
27.688 |
34.748 |
n.a. |
34.772 |
37.291 |
44.667 |
44.878 |
50.545 |
58.411 |
| Chad |
11.411 |
9.097 |
11.549 |
9.251 |
11.343 |
n.a. |
7.903 |
5.343 |
3.985 |
4.181 |
4.613 |
6.098 |
| Other African Nationalities |
44.294 |
37.091 |
42.819 |
39.148 |
47.853 |
n.a. |
50.554 |
47.319 |
51.693 |
50.194 |
58.426 |
80.581 |
| Total |
144.244 |
130.683 |
162.773 |
167.952 |
202.331 |
n.a. |
169.810 |
161.031 |
178.286 |
192.503 |
217.433 |
320.711 |
| AMERICA AND OCEANIA |
|
|
|
|
|
|
|
|
|
|
|
|
| U.S.A |
137.982 |
137.483 |
145.713 |
143.170 |
138.397 |
n.a. |
161.447 |
176.503 |
193.032 |
216.691 |
241.863 |
243.953 |
| Canada |
36.608 |
40.195 |
46.301 |
48.045 |
53.897 |
n.a. |
63.430 |
71.114 |
78.759 |
87.799 |
96.994 |
96.601 |
| Australia |
15.317 |
17.090 |
18.032 |
18.514 |
20.767 |
n.a. |
26.527 |
28.186 |
30.707 |
31.398 |
32.634 |
33.335 |
| Other American and Oceanian Nationalities |
8.329 |
9.996 |
11.760 |
5.040 |
11.430 |
n.a. |
11.301 |
25.998 |
32.301 |
37.081 |
37.216 |
34.505 |
| Total |
198.236 |
204.764 |
221.806 |
214.769 |
224.491 |
n.a. |
262.705 |
301.801 |
334.799 |
372.969 |
408.707 |
408.394 |
| Unknown Nationalities |
91 |
169 |
564 |
5 |
12 |
n.a. |
30 |
4.459 |
208 |
1.337 |
940 |
996 |
| TOTAL ARRIVALS |
10.229.093 |
10.721.596 |
11.958.219 |
12.501.452 |
13.646.585 |
14.846.151 |
16.194.442 |
12.611.731 |
19.633.321 |
19.775.654 |
21.144.577 |
21.231.585 |
DEPARTURES
| Nationality |
2000 |
2001 |
2002 |
2003 |
2004 |
2005 |
2006 |
2007 |
2008 |
2009 |
2010 |
2011 |
| ARAB COUNTRIES |
|
|
|
|
|
|
|
|
|
|
|
|
| Iraq |
7.453 |
10.502 |
10.194 |
9.915 |
34.330 |
n.a. |
44.368 |
69.017 |
95.519 |
181.936 |
238.560 |
338.757 |
| Syria |
743.773 |
836.774 |
893.608 |
933.916 |
1.016.640 |
n.a. |
1.176.649 |
1.355.700 |
1.376.027 |
1.478.275 |
1.586.058 |
1.299.071 |
| Lebanon |
116.144 |
130.633 |
147.619 |
158.658 |
181.171 |
n.a. |
212.309 |
255.526 |
275.697 |
292.345 |
322.496 |
281.795 |
| Jordan |
448.127 |
463.607 |
495.960 |
510.955 |
565.535 |
n.a. |
715.760 |
793.940 |
862.670 |
940.337 |
1.045.651 |
1.110.183 |
| Kuwait |
1.337.749 |
1.343.607 |
1.524.084 |
1.434.248 |
1.576.592 |
n.a. |
2.057.560 |
2.145.795 |
2.373.458 |
2.479.194 |
2.461.288 |
1.860.219 |
| Yemen |
293.668 |
351.280 |
426.217 |
452.532 |
506.077 |
n.a. |
578.613 |
624.631 |
668.472 |
690.703 |
787.336 |
749.879 |
| Bahrain |
949.308 |
1.041.334 |
1.127.520 |
1.281.834 |
1.396.272 |
n.a. |
1.543.006 |
1.755.354 |
1.639.589 |
1.396.175 |
1.588.018 |
1.134.931 |
| Qatar |
451.083 |
475.358 |
512.613 |
547.616 |
600.541 |
n.a. |
796.137 |
928.381 |
930.518 |
905.707 |
933.276 |
729.302 |
| UAE |
191.582 |
205.364 |
212.422 |
236.513 |
256.198 |
n.a. |
311.429 |
368.036 |
346.758 |
334.952 |
407.112 |
326.061 |
| Oman |
100.609 |
115.148 |
136.489 |
160.938 |
168.827 |
n.a. |
211.916 |
202.274 |
179.891 |
173.387 |
203.301 |
139.451 |
| Palestine |
88.586 |
88.420 |
93.127 |
64.378 |
66.621 |
n.a. |
103.859 |
83.262 |
94.114 |
101.008 |
111.792 |
109.914 |
| Algeria |
56.967 |
51.706 |
58.827 |
64.798 |
83.276 |
n.a. |
106.101 |
119.967 |
127.395 |
140.410 |
158.926 |
187.190 |
| Mauritania |
2.763 |
2.672 |
2.779 |
2.823 |
3.002 |
n.a. |
4.050 |
4.207 |
3.983 |
3.699 |
4.327 |
5.538 |
| Egypt |
1.322.384 |
1.384.880 |
1.486.682 |
1.449.794 |
1.673.279 |
n.a. |
1.738.408 |
1.872.108 |
2.004.612 |
2.016.450 |
2.290.923 |
2.491.795 |
| Morocco |
55.827 |
40.068 |
54.196 |
52.323 |
60.080 |
n.a. |
74.080 |
92.486 |
93.049 |
91.808 |
108.782 |
129.611 |
| Sudan |
270.239 |
282.604 |
307.755 |
319.365 |
338.635 |
n.a. |
353.900 |
370.685 |
363.581 |
368.929 |
393.596 |
429.333 |
| Tunisia |
38.552 |
31.392 |
37.299 |
37.655 |
42.041 |
n.a. |
47.869 |
50.689 |
54.550 |
42.333 |
65.836 |
71.707 |
| Libya |
25.756 |
21.335 |
26.108 |
27.948 |
40.589 |
n.a. |
56.741 |
60.038 |
62.989 |
66.695 |
86.404 |
2.417 |
| Somalia |
8.620 |
8.658 |
9.638 |
8.549 |
8.237 |
n.a. |
10.016 |
12.000 |
9.917 |
9.984 |
9.986 |
9.424 |
| Djibouti |
1.404 |
1.001 |
1.037 |
1.045 |
1.091 |
n.a. |
1.076 |
1.292 |
1.282 |
1.490 |
1.777 |
1.755 |
| Displaced Arab Tribes |
7.719 |
6.498 |
8.069 |
9.382 |
487 |
n.a. |
1.606 |
726 |
422 |
441 |
360 |
408 |
| Comore Islands |
438 |
371 |
345 |
179 |
204 |
n.a. |
214 |
237 |
262 |
449 |
1.919 |
3.414 |
| Kuwait (No-Nationality) |
6.197 |
1.724 |
1.401 |
1.110 |
1.116 |
n.a. |
1.252 |
7.082 |
|
|
|
|
| Other Arab Nationalities |
12.335 |
14.750 |
15.948 |
23.061 |
56.295 |
n.a. |
17.746 |
7.400 |
55.586 |
60.307 |
65.391 |
62.170 |
| Total |
6.537.283 |
6.909.686 |
7.589.937 |
7.789.535 |
8.677.136 |
n.a. |
10.164.665 |
11.180.833 |
11.620.341 |
11.777.014 |
12.873.115 |
11.474.325 |
| ASIA |
|
|
|
|
|
|
|
|
|
|
|
|
| Afghanistan |
10.523 |
11.246 |
13.611 |
11.626 |
13.010 |
n.a. |
15.748 |
20.701 |
39.589 |
37.303 |
44.140 |
50.619 |
| Turkey |
107.972 |
93.270 |
116.920 |
134.406 |
165.011 |
n.a. |
237.770 |
275.109 |
323.452 |
325.260 |
434.063 |
560.735 |
| Iran |
229.086 |
218.803 |
284.939 |
546.200 |
502.003 |
n.a. |
576.022 |
620.791 |
641.516 |
802.919 |
414.741 |
791.610 |
| Malaysia |
59.151 |
47.822 |
56.949 |
42.906 |
61.052 |
n.a. |
65.288 |
77.088 |
89.948 |
96.627 |
124.111 |
155.921 |
| Japan |
11.071 |
10.098 |
12.453 |
11.432 |
10.599 |
n.a. |
15.498 |
20.083 |
21.076 |
20.005 |
20.810 |
21.923 |
| Indonesia |
254.428 |
245.377 |
271.665 |
268.455 |
317.340 |
n.a. |
359.916 |
380.500 |
452.313 |
447.976 |
524.160 |
607.642 |
| Philippines |
255.458 |
262.021 |
270.435 |
286.514 |
311.017 |
n.a. |
366.036 |
417.393 |
458.547 |
479.156 |
506.962 |
528.899 |
| Pakistan |
637.377 |
607.102 |
719.057 |
791.881 |
909.804 |
n.a. |
1.130.614 |
1.162.163 |
1.191.326 |
1.223.756 |
1.399.779 |
1.619.795 |
| India |
760.661 |
769.665 |
831.961 |
900.373 |
1.005.039 |
n.a. |
1.289.859 |
1.479.434 |
1.627.748 |
1.812.981 |
2.084.061 |
2.319.324 |
| China |
1.232 |
1.246 |
2.029 |
1.442 |
2.126 |
n.a. |
2.074 |
2.322 |
3.037 |
3.407 |
3.029 |
3.109 |
| South Korea |
6.138 |
5.983 |
6.295 |
6.214 |
6.992 |
n.a. |
9.702 |
14.182 |
19.803 |
26.922 |
31.807 |
35.958 |
| Singapore |
13.708 |
10.947 |
9.163 |
4.863 |
7.475 |
n.a. |
8.018 |
8.577 |
9.751 |
8.964 |
10.035 |
11.593 |
| Bangladesh |
232.334 |
256.292 |
282.487 |
295.693 |
325.068 |
n.a. |
391.030 |
436.112 |
470.707 |
508.827 |
526.168 |
552.218 |
| Hong Kong |
20 |
29 |
17 |
34 |
55 |
n.a. |
|
|
754 |
521 |
135 |
57 |
| Thailand |
7.796 |
7.973 |
9.110 |
8.032 |
8.118 |
n.a. |
9.339 |
9.274 |
9.441 |
8.929 |
9.595 |
11.508 |
| Sri Lanka |
105.470 |
106.411 |
120.339 |
127.427 |
136.024 |
n.a. |
138.931 |
141.852 |
142.300 |
147.278 |
164.763 |
172.945 |
| Other Asian Nationalities |
44.111 |
49.114 |
59.252 |
89.921 |
66.403 |
n.a. |
98.455 |
132.223 |
169.729 |
202.572 |
238.057 |
242.408 |
| Total |
6.537.283 |
6.909.686 |
7.589.937 |
7.789.535 |
3.847.136 |
n.a. |
4.714.300 |
283.894 |
6.116.327 |
6.153.403 |
6.536.416 |
7.686.264 |
| EUROPE |
|
|
|
|
|
|
|
|
|
|
|
|
| Britain |
162.151 |
155.930 |
168.788 |
166.292 |
182.996 |
n.a. |
220.690 |
237.932 |
247.307 |
267.624 |
283.930 |
306.034 |
| France |
22.977 |
23.303 |
27.009 |
26.397 |
27.258 |
n.a. |
34.898 |
38.318 |
46.439 |
48.970 |
55.586 |
63.629 |
| Holland |
9.943 |
8.200 |
9.539 |
9.856 |
11.794 |
n.a. |
15.657 |
17.984 |
18.920 |
20.792 |
20.002 |
23.071 |
| Belgium |
3.115 |
2.995 |
3.538 |
3.355 |
4.085 |
n.a. |
5.061 |
7.421 |
9.601 |
9.965 |
10.144 |
10.967 |
| Italy |
10.911 |
11.296 |
12.218 |
11.815 |
12.566 |
n.a. |
16.395 |
20.829 |
24.834 |
26.251 |
28.346 |
32.101 |
| Sweden |
6.714 |
6.374 |
7.004 |
6.632 |
6.535 |
n.a. |
6.929 |
7.520 |
7.692 |
7.518 |
7.887 |
8.317 |
| Norway |
2.518 |
2.389 |
2.553 |
2.294 |
2.326 |
n.a. |
3.082 |
3.480 |
4.371 |
3.682 |
3.812 |
4.086 |
| Switzerland |
2.693 |
2.747 |
3.321 |
3.468 |
3.355 |
n.a. |
4.725 |
5.355 |
5.987 |
6.352 |
6.032 |
6.162 |
| Austria |
2.061 |
2.074 |
2.138 |
2.587 |
3.021 |
n.a. |
5.114 |
5.810 |
5.521 |
5.929 |
6.261 |
6.801 |
| Germany |
16.749 |
16.354 |
17.829 |
18.143 |
23.044 |
n.a. |
31.569 |
37.006 |
43.198 |
47.222 |
53.596 |
57.713 |
| Spain |
2.730 |
2.667 |
3.009 |
3.052 |
3.082 |
n.a. |
5.223 |
7.141 |
10.026 |
10.346 |
12.231 |
14.567 |
| Denmark |
3.284 |
2.854 |
3.075 |
2.908 |
2.941 |
n.a. |
2.922 |
3.484 |
4.242 |
4.659 |
5.457 |
6.062 |
| Greece |
3.517 |
3.688 |
3.716 |
3.268 |
3.550 |
n.a. |
4.591 |
4.703 |
4.775 |
4.482 |
5.119 |
6.778 |
| Cyprus |
1.823 |
1.866 |
1.769 |
1.358 |
1.244 |
n.a. |
1.395 |
1.733 |
1.995 |
1.789 |
1.737 |
1.698 |
| Finland |
1.320 |
1.428 |
1.787 |
1.512 |
1.123 |
n.a. |
1.264 |
2.216 |
2.509 |
2.677 |
3.058 |
3.574 |
| Other European Nationalities |
18.107 |
19.759 |
19.212 |
20.248 |
24.504 |
n.a. |
40.724 |
33.401 |
46.609 |
44.096 |
47.849 |
56.608 |
| Total |
270.613 |
263.924 |
286.505 |
283.185 |
313.424 |
n.a. |
400.239 |
434.333 |
484.026 |
512.354 |
551.047 |
608.168 |
| AFRICA |
|
|
|
|
|
|
|
|
|
|
|
|
| Ethiopia |
16.806 |
15.496 |
16.408 |
17.577 |
19.346 |
n.a. |
23.528 |
29.370 |
37.052 |
44.160 |
48.327 |
55.633 |
| Mali |
2.377 |
1.996 |
2.105 |
2.043 |
2.147 |
n.a. |
2.561 |
3.203 |
2.885 |
2.846 |
3.381 |
5.440 |
| Nigeria |
26.923 |
29.465 |
34.449 |
33.414 |
38.032 |
n.a. |
42.644 |
47.667 |
38.067 |
38.026 |
49.820 |
72.568 |
| South Africa |
19.843 |
19.331 |
22.558 |
27.460 |
35.250 |
n.a. |
34.852 |
37.267 |
44.290 |
44.238 |
50.261 |
57.221 |
| Chad |
7.103 |
7.148 |
8.175 |
7.351 |
7.007 |
n.a. |
7.731 |
7.200 |
5.395 |
5.222 |
5.353 |
6.519 |
| Other African Nationalities |
38.253 |
39.821 |
40.941 |
37.221 |
45.323 |
n.a. |
48.689 |
46.821 |
48.445 |
47.222 |
55.101 |
63.810 |
| Total |
111.305 |
113.257 |
124.636 |
125.066 |
147.105 |
n.a. |
160.005 |
171.528 |
176.134 |
181.714 |
212.243 |
261.191 |
| AMERICA AND OCEANIA |
|
|
|
|
|
|
|
|
|
|
|
|
| U.S.A |
137.482 |
137.382 |
144.798 |
143.704 |
141.600 |
n.a. |
160.051 |
175.825 |
193.396 |
214.500 |
237.598 |
240.622 |
| Canada |
36.286 |
40.039 |
46.152 |
48.528 |
55.022 |
n.a. |
62.932 |
70.673 |
78.736 |
87.351 |
95.673 |
95.162 |
| Australia |
15.268 |
16.963 |
18.066 |
18.867 |
21.279 |
n.a. |
26.300 |
28.087 |
30.786 |
31.087 |
32.297 |
32.438 |
| Other American and Oceanian Nationalities |
8.236 |
9.054 |
9.496 |
5.061 |
11.604 |
n.a. |
11.099 |
25.932 |
32.415 |
36.711 |
36.682 |
31.944 |
| Total |
197.272 |
203.438 |
218.512 |
216.160 |
229.505 |
n.a. |
260.382 |
300.517 |
335.333 |
369.649 |
402.250 |
400.166 |
| Unknown Nationalities |
40 |
94 |
341 |
8 |
13 |
n.a. |
34 |
3.909 |
235 |
1.305 |
872 |
847 |
| GRAND TOTAL |
9.853.049 |
10.193.798 |
11.286.613 |
11.941.373 |
13.214.319 |
14.396.811 |
15.699.625 |
12.375.014 |
18.889.069 |
18.995.439 |
20.575.943 |
20.430.961 |
NET MIGRATION
| Nationality |
2000 |
2001 |
2002 |
2003 |
2004 |
2005 |
2006 |
2007 |
2008 |
2009 |
2010 |
2011 |
| ARAB COUNTRIES |
|
|
|
|
|
|
|
|
|
|
|
|
| Iraq |
-43 |
239 |
165 |
308 |
566 |
n.a. |
1.270 |
2.228 |
335 |
418 |
389 |
941 |
| Syria |
34.569 |
28.369 |
29.828 |
20.061 |
24.697 |
n.a. |
33.896 |
9.394 |
19.876 |
13.846 |
10.036 |
34.467 |
| Lebanon |
1.929 |
1.823 |
2.305 |
198 |
-519 |
n.a. |
5.034 |
1.542 |
-1.803 |
3.356 |
3.319 |
1.640 |
| Jordan |
7.333 |
8.862 |
12.914 |
15.327 |
6.035 |
n.a. |
13.967 |
3.005 |
3.198 |
4.615 |
8.515 |
6.898 |
| Kuwait |
10.743 |
3.775 |
-11.452 |
17.137 |
7.939 |
n.a. |
-24.926 |
-2.870 |
4.860 |
17.188 |
-1.353 |
134.439 |
| Yemen |
15.414 |
59.979 |
72.570 |
58.290 |
24.746 |
n.a. |
25.385 |
37.369 |
48.965 |
61.766 |
44.654 |
63.784 |
| Bahrain |
2.876 |
7.715 |
1.114 |
9.228 |
10.729 |
n.a. |
18.876 |
12.004 |
39.858 |
29.378 |
12.601 |
49.870 |
| Qatar |
863 |
4.784 |
-2.653 |
6.085 |
3.900 |
n.a. |
5.255 |
-2.865 |
16.372 |
13.209 |
4.393 |
26.209 |
| UAE |
313 |
3.800 |
3.627 |
-91 |
3.587 |
n.a. |
8.823 |
15.627 |
54.986 |
31.159 |
13.050 |
23.327 |
| Oman |
1.780 |
6.456 |
7.755 |
-124 |
5.327 |
n.a. |
25.409 |
48.904 |
56.230 |
27.930 |
44.886 |
26.138 |
| Palestine |
-1.949 |
1.024 |
1.183 |
710 |
-210 |
n.a. |
124 |
-330 |
234 |
-510 |
-5 |
-241 |
| Algeria |
154 |
362 |
1.008 |
421 |
582 |
n.a. |
1.310 |
261 |
13 |
731 |
538 |
1.359 |
| Mauritania |
496 |
112 |
983 |
143 |
854 |
n.a. |
386 |
-13 |
275 |
-514 |
-69 |
195 |
| Egypt |
41.581 |
72.536 |
68.694 |
59.323 |
41.062 |
n.a. |
55.221 |
85.655 |
110.162 |
80.492 |
62.236 |
52.907 |
| Morocco |
-471 |
1.142 |
1.804 |
1.584 |
-423 |
n.a. |
914 |
592 |
2.127 |
1.695 |
1.536 |
2.230 |
| Sudan |
9.194 |
28.104 |
29.741 |
-8.195 |
4.021 |
n.a. |
-14.349 |
-12.169 |
-294 |
3.733 |
10.232 |
14.699 |
| Tunisia |
454 |
261 |
520 |
227 |
-467 |
n.a. |
401 |
609 |
113 |
268 |
979 |
2.149 |
| Libya |
202 |
173 |
233 |
166 |
165 |
n.a. |
300 |
96 |
262 |
348 |
132 |
13 |
| Somalia |
2.505 |
2.769 |
6.356 |
6.948 |
6.562 |
n.a. |
2.645 |
-925 |
-80 |
-469 |
-365 |
-540 |
| Djibouti |
-21 |
-32 |
5 |
-48 |
-16 |
n.a. |
-3 |
-2 |
6 |
-62 |
-20 |
19 |
| Displaced Arab Tribes |
-1.499 |
47 |
-91 |
-289 |
30 |
n.a. |
-7 |
-21 |
6 |
20 |
-77 |
39 |
| Comore Islands |
-36 |
-115 |
-78 |
4 |
-24 |
n.a. |
0 |
47 |
58 |
44 |
72 |
527 |
| Kuwait (No-Nationality) |
974 |
366 |
127 |
152 |
121 |
n.a. |
214 |
1.098 |
0 |
0 |
0 |
0 |
| Other Arab Nationalities |
-234 |
35 |
-81 |
352 |
-170 |
n.a. |
2.014 |
5 |
228 |
-213 |
-119 |
320 |
| Total |
127.127 |
232.586 |
226.577 |
187.917 |
139.094 |
n.a. |
162.159 |
199.241 |
355.987 |
288.428 |
215.560 |
441.389 |
| ASIA |
|
|
|
|
|
|
|
|
|
|
|
|
| Afghanistan |
1.759 |
546 |
410 |
1.250 |
-1.420 |
n.a. |
3.879 |
-3.230 |
-5.822 |
-1.581 |
-1.488 |
-3.062 |
| Turkey |
1.921 |
5.910 |
4.279 |
78 |
476 |
n.a. |
1.714 |
1.127 |
-1.097 |
2.253 |
122 |
1.755 |
| Iran |
1.790 |
1.461 |
1.770 |
2.596 |
2.569 |
n.a. |
1.606 |
1.155 |
976 |
506 |
334 |
767 |
| Malaysia |
300 |
391 |
464 |
264 |
183 |
n.a. |
1.195 |
736 |
532 |
1.749 |
-575 |
1.278 |
| Japan |
-143 |
76 |
133 |
115 |
-129 |
n.a. |
417 |
270 |
-355 |
121 |
132 |
509 |
| Indonesia |
28.047 |
20.648 |
52.286 |
26.720 |
45.672 |
n.a. |
88.574 |
72.040 |
20.418 |
50.350 |
21.596 |
-56.673 |
| Philippines |
4.721 |
10.128 |
17.470 |
8.538 |
-670 |
n.a. |
44.976 |
40.016 |
35.777 |
55.239 |
49.311 |
28.078 |
| Pakistan |
57.820 |
90.301 |
104.322 |
95.523 |
47.559 |
n.a. |
-2.709 |
33.392 |
80.987 |
143.275 |
122.621 |
150.270 |
| India |
4.844 |
33.278 |
72.042 |
60.927 |
41.484 |
n.a. |
87.006 |
117.541 |
135.032 |
195.231 |
157.823 |
144.288 |
| China |
-21 |
-83 |
-78 |
102 |
-47 |
n.a. |
104 |
-13 |
-7 |
-94 |
-22 |
291 |
| South Korea |
-155 |
-18 |
-31 |
-7 |
-166 |
n.a. |
204 |
716 |
296 |
121 |
642 |
2.506 |
| Singapore |
95 |
98 |
63 |
3 |
-6 |
n.a. |
95 |
40 |
31 |
51 |
76 |
298 |
| Bangladesh |
98.101 |
94.871 |
128.779 |
117.798 |
108.885 |
n.a. |
67.659 |
153.882 |
67.091 |
-45.527 |
-50.837 |
-31.620 |
| Hong Kong |
2 |
-1 |
0 |
1 |
-2 |
n.a. |
0 |
0 |
-11 |
0 |
-3 |
6 |
| Thailand |
-478 |
-863 |
151 |
96 |
219 |
n.a. |
-12 |
-963 |
9 |
-477 |
-78 |
135 |
| Sri Lanka |
3.914 |
10.804 |
7.504 |
9.646 |
-2.653 |
n.a. |
-6.218 |
-1.448 |
10.940 |
19.952 |
8.999 |
3.124 |
| Other Asian Nationalities |
11.574 |
10.698 |
14.670 |
7.844 |
6.202 |
n.a. |
29.661 |
47.586 |
44.361 |
50.422 |
23.361 |
33.247 |
| Total |
127.127 |
232.586 |
226.577 |
187.917 |
248.156 |
n.a. |
318.151 |
45.184 |
456.993 |
471.591 |
332.014 |
275.197 |
| EUROPE |
|
|
|
|
|
|
|
|
|
|
|
|
| Britain |
-430 |
-734 |
-153 |
-1.447 |
-2.981 |
n.a. |
849 |
210 |
-1.014 |
1.941 |
3.844 |
3.166 |
| France |
112 |
259 |
384 |
154 |
-415 |
n.a. |
222 |
129 |
-615 |
1.192 |
1.072 |
1.384 |
| Holland |
-93 |
-23 |
49 |
22 |
-263 |
n.a. |
142 |
47 |
-79 |
133 |
198 |
642 |
| Belgium |
39 |
-46 |
25 |
16 |
-48 |
n.a. |
58 |
96 |
31 |
97 |
91 |
462 |
| Italy |
135 |
-66 |
123 |
-35 |
-203 |
n.a. |
159 |
144 |
-309 |
297 |
570 |
922 |
| Sweden |
30 |
-76 |
61 |
-192 |
-216 |
n.a. |
-16 |
-61 |
-54 |
113 |
112 |
302 |
| Norway |
33 |
-20 |
11 |
-35 |
-68 |
n.a. |
9 |
9 |
-14 |
35 |
63 |
230 |
| Switzerland |
36 |
16 |
52 |
16 |
-40 |
n.a. |
1 |
16 |
-26 |
62 |
68 |
180 |
| Austria |
-30 |
-7 |
2 |
10 |
2 |
n.a. |
52 |
-89 |
-45 |
41 |
105 |
294 |
| Germany |
55 |
6 |
22 |
142 |
-9 |
n.a. |
235 |
93 |
-401 |
780 |
892 |
862 |
| Spain |
1 |
1 |
44 |
40 |
-4 |
n.a. |
27 |
58 |
-52 |
188 |
224 |
755 |
| Denmark |
33 |
-36 |
98 |
-49 |
-107 |
n.a. |
-2 |
-20 |
-38 |
43 |
104 |
378 |
| Greece |
38 |
24 |
-51 |
-28 |
-45 |
n.a. |
9 |
-63 |
-30 |
58 |
207 |
576 |
| Cyprus |
-7 |
-41 |
-94 |
-80 |
6 |
n.a. |
-14 |
-25 |
-7 |
-7 |
30 |
213 |
| Finland |
29 |
38 |
-28 |
-53 |
-67 |
n.a. |
0 |
29 |
0 |
32 |
45 |
266 |
| Other European Nationalities |
891 |
-1.155 |
-1.404 |
695 |
-737 |
n.a. |
652 |
382 |
-107 |
1.050 |
1.720 |
5.509 |
| Total |
872 |
-1.860 |
-859 |
-824 |
-5.195 |
n.a. |
2.383 |
955 |
-2.760 |
6.055 |
9.345 |
16.141 |
| AFRICA |
|
|
|
|
|
|
|
|
|
|
|
|
| Ethiopia |
10.787 |
9.392 |
20.643 |
22.717 |
32.126 |
n.a. |
-1.767 |
-393 |
3.313 |
10.065 |
1.307 |
39.972 |
| Mali |
824 |
136 |
518 |
104 |
221 |
n.a. |
380 |
512 |
-2 |
-75 |
86 |
607 |
| Nigeria |
10.508 |
8.102 |
11.040 |
16.010 |
16.515 |
n.a. |
9.235 |
-9.281 |
-3.374 |
-1.772 |
928 |
1.401 |
| South Africa |
471 |
577 |
684 |
228 |
-502 |
n.a. |
-80 |
24 |
377 |
640 |
284 |
1.190 |
| Chad |
4.308 |
1.949 |
3.374 |
1.900 |
4.336 |
n.a. |
172 |
-1.857 |
-1.410 |
-1.041 |
-740 |
-421 |
| Other African Nationalities |
6.041 |
-2.730 |
1.878 |
1.927 |
2.530 |
n.a. |
1.865 |
498 |
3.248 |
2.972 |
3.325 |
16.771 |
| Total |
32.939 |
17.426 |
38.137 |
42.886 |
55.226 |
n.a. |
9.805 |
-10.497 |
2.152 |
10.789 |
5.190 |
59.520 |
| AMERICA OCEANIA |
|
|
|
|
|
|
|
|
|
|
|
|
| U.S.A |
500 |
101 |
915 |
-534 |
-3.203 |
n.a. |
1.396 |
678 |
-364 |
2.191 |
4.265 |
3.331 |
| Canada |
322 |
156 |
149 |
-483 |
-1.125 |
n.a. |
498 |
441 |
23 |
448 |
1.321 |
1.439 |
| Australia |
49 |
127 |
-34 |
-353 |
-512 |
n.a. |
227 |
99 |
-79 |
311 |
337 |
897 |
| Other American and Oceanian Nationalities |
93 |
942 |
2.264 |
-21 |
-174 |
n.a. |
202 |
66 |
-114 |
370 |
534 |
2.561 |
| Total |
964 |
1.326 |
3.294 |
-1.391 |
-5.014 |
n.a. |
2.323 |
1.284 |
-534 |
3.320 |
6.457 |
8.228 |
| Unknown Nationalities |
51 |
75 |
223 |
-3 |
-1 |
n.a. |
-4 |
550 |
-27 |
32 |
68 |
149 |
| GRAND TOTAL |
376.044 |
527.798 |
671.606 |
560.079 |
432.266 |
449.340 |
494.817 |
236.717 |
744.252 |
780.215 |
568.634 |
800.624 |
Source: Ministry of Interior, General Directorate of Passports
n.a.: not available by nationality for 2005.
1. Institution which provides data
Central Department of Statistics and Information (CDSI), Ministry and Economy and Planning
2. Data availability
Published in the CDSI’ Statistical Yearbooks, in Chapter “Social services”
All Statistical Yearbooks are available online at: https://www.stats.gov.sa/en/46
Date of access: May 2013.
| date of record |
23/06/2013 |
06/07/2013 |
01/09/2013 |
| Transfer of sponsorship |
329.468 |
1.183.022 |
1.500.000 |
| Change of profession |
141.000 |
1.122.125 |
1.300.000 |
| Issuance or renewal of work permits |
926.330 |
1.617.779 |
2.500.000 |
| Total of corrections |
1.396.798 |
3.922.926 |
5.300.000 |
Source: Ministry of Labour
1. Definition
Ahead of a crackdown on irregular workers/ sojourners, an amnesty period was decided, starting April 3rd, 2013 and due to expire on November 3rd, 2013. The amnesty allows workers to try to sort out their administrative situation (renew expired documents; register their current employer as their sponsor; register changes in profession and in activity sector, etc.), or leave without paying a penalty.
Foreigners who came for Haj, Umrah or visit before 3/7/2008 could also rectify their status at the passport department.
The regularization campaign was decided within the process of undertaking a massive program of saudization of the work force, called ‘Nitaqat’.
Nitaqat (“ranges” or “zones”) was formally launched by the Saudi Ministry of Labour in September 2011 (Ministerial Resolution n°4040, dated 12/10/1432 H.). The regulation establishes minimum shares reserved for Saudi citizens in a company’s labor force, depending on the size and on the activity sector of the business.
The companies with less than 10 employees are exempt from the program, but still need to employ at least one Saudi citizen.
Based on their level of compliance to Saudization quotas, the program classifies the private firms into four categories: Premium, Green, Yellow and Red. Premium and Green categories include the companies with highest Saudization rates, while Yellow and Red include the ones with low rates.
Color/ category of company is henceforth bound to the company’s ability to secure or renew its employees’ work permits, as well as registering any new branch of activity with the Labor ministry.
Nitaqat’ is ongoing and new measures are being added to the program’s tasks.
2. Institution which provides data
Ministry of Labour
3. Data availability
The figures are retrieved from press releases quoting officials of the Labor ministry, sometimes published on the Ministry of Labour’s website, “News” section.
23/06 figures: http://www.arabnews.com/news/455911
03/07 figures: http://portal.mol.gov.sa/en/News/Pages/4_million_corrective_procedures_recorded_up_to_27_Shaba%E2%80%99n_1434H.aspx
http://portal.mol.gov.sa/ar/News/Pages/4%D9%85%D9%84%D8%A7%D9%8A%D9%8A%D9%86_%D8%B9%D9%85%D9%84%D9%8A%D8%A9_%D8%AA%D8%B5%D8%AD%D9%8A%D8%AD_%D8%AD%D8%AA%D9%89_27_%D9%85%D9%86_%D8%B4%D9%87%D8%B1_%D8%B4%D8%B9%D8%A8%D8%A7%D9%86_%D8%A7%D9%84%D9%85%D8%A7%D8%B6%D9%8A_.aspx
01/09 figures: http://www.arabnews.com/news/463365
| |
|
Saudis |
|
|
Non-Saudis |
|
|
TOTAL |
|
| |
males |
females |
total |
males |
females |
total |
males |
females |
total |
| Illiterate |
174.049 |
949.235 |
1.123.284 |
14.176 |
97.157 |
111.333 |
188.225 |
1.046.392 |
1.234.617 |
| Read and write |
119.748 |
456.735 |
576.483 |
15.661 |
106.182 |
121.843 |
135.409 |
562.917 |
698.326 |
| Primary |
416.384 |
787.842 |
1.204.226 |
41.782 |
121.353 |
163.135 |
458.166 |
909.195 |
1.367.361 |
| Intermediate |
831.105 |
1.197.382 |
2.028.487 |
143.661 |
246.519 |
390.180 |
974.766 |
1.443.901 |
2.418.667 |
| Secondary or equivalent |
779.565 |
1.602.380 |
2.381.945 |
72.822 |
315.016 |
387.838 |
852.387 |
1.917.396 |
2.769.783 |
| Diploma |
44.258 |
56.329 |
100.587 |
2.377 |
42.977 |
45.354 |
46.635 |
99.306 |
145.941 |
| Bachelor Degree |
67.878 |
373.655 |
441.533 |
16.608 |
247.419 |
264.027 |
84.486 |
621.074 |
705.560 |
| Higher Diploma/ Master |
4.485 |
4.055 |
8.540 |
1.328 |
12.251 |
13.579 |
5.813 |
16.306 |
22.119 |
| Doctorate |
1.624 |
929 |
2.553 |
352 |
2.647 |
2.999 |
1.976 |
3.576 |
5.552 |
| total |
2.439.096 |
5.428.542 |
7.867.638 |
308.767 |
1.191.521 |
1.500.288 |
2.747.863 |
6.620.063 |
9.367.926 |
Source: Manpower Survey, 2012 (Round 1)
ANNEXED NOTE
1. Technical Notes and Definitions
Sampling frame of LFS 2012 Round 1: Population Census 2010.
Sample size: 29 000 households
Reference period: January 25th-February 17th, 2012
Population of reference: all individuals (nationals and non-nationals) residing in the Kingdom during the period of reference.
The ultimate sampling unit is the household.
(a) Household and household members: A person or group of persons, related or not related, who share housing and food.
Servants, drivers and similar categories are considered to be part of the household if they live in the same housing unit.
(b) Person out of the labour force: A person aged 15 years and over who is not included in the labour force, among which: the persons staying home for domestics activities, the students, the retired, the self sufficients,
the ones unable to enrol in labour, who are not working and do not look for employment for any other reason.
2. Institution which provides data
Central Department of Statistics and Information (CDSI), Ministry and Economy and Planning
3. Data availability
Surveys conducted since 1999 are available on the website of the CDSI (http://www.cdsi.gov.sa/), in published form in PDF format. A selection of tables is also available in PDF or Excel format.
https://www.stats.gov.sa/en/814 (website English version) or https://www.stats.gov.sa/ar/814 (website Arabic version). The technical notes and tables of contents are in Arabic and the tables are in both languages.
Date of access: May 2013.
| |
|
Saudis |
|
|
non-Saudis |
|
|
Total |
|
| |
males |
females |
total |
males |
females |
total |
males |
females |
total |
| 15-19 |
1.011.394 |
1.039.796 |
2.051.190 |
191.679 |
180.601 |
372.280 |
1.203.073 |
1.220.397 |
2.423.470 |
| 20-24 |
560.706 |
861.229 |
1.421.935 |
45.363 |
126.532 |
171.895 |
606.069 |
987.761 |
1.593.830 |
| 25-29 |
117.890 |
618.041 |
735.931 |
12.006 |
142.435 |
154.441 |
129.896 |
760.476 |
890.372 |
| 30-34 |
42.065 |
545.319 |
587.384 |
6.764 |
184.313 |
191.077 |
48.829 |
729.632 |
778.461 |
| 35-39 |
27.615 |
475.102 |
502.717 |
3.261 |
209.117 |
212.378 |
30.876 |
684.219 |
715.095 |
| 40-44 |
26.703 |
430.647 |
457.350 |
2.634 |
144.448 |
147.082 |
29.337 |
575.095 |
604.432 |
| 45-49 |
49.424 |
380.684 |
430.108 |
2.719 |
70.479 |
73.198 |
52.143 |
451.163 |
503.306 |
| 50-54 |
99.017 |
308.774 |
407.791 |
2.542 |
46.225 |
48.767 |
101.559 |
354.999 |
456.558 |
| 55-59 |
114.036 |
239.268 |
353.304 |
7.609 |
36.186 |
43.795 |
121.645 |
275.454 |
397.099 |
| 60-64 |
128.155 |
180.193 |
308.348 |
6.706 |
19.772 |
26.478 |
134.861 |
199.965 |
334.826 |
| 65+ |
262.091 |
349.489 |
611.580 |
27.484 |
31.413 |
58.897 |
289.575 |
380.902 |
670.477 |
| Total |
2.439.096 |
5.428.542 |
7.867.638 |
308.767 |
1.191.521 |
1.500.288 |
2.747.863 |
6.620.063 |
9.367.926 |
Source: Manpower Survey, 2012 (Round 1)
ANNEXED NOTE
1. Technical Notes and Definitions
Sampling frame of LFS 2012 Round 1: Population Census 2010.
Sample size: 29 000 households
Reference period: January 25th-February 17th, 2012
Population of reference: all individuals (nationals and non-nationals) residing in the Kingdom during the period of reference.
The ultimate sampling unit is the household.
(a) Household and household members: A person or group of persons, related or not related, who share housing and food.
Servants, drivers and similar categories are considered to be part of the household if they live in the same housing unit.
(b) Person out of the labour force: A person aged 15 years and over who is not included in the labour force, among which: the persons staying home for domestics activities, the students, the retired, the self sufficients,
the ones unable to enrol in labour, who are not working and do not look for employment for any other reason.
2. Institution which provides data
Central Department of Statistics and Information (CDSI), Ministry and Economy and Planning
3. Data availability
Surveys conducted since 1999 are available on the website of the CDSI (http://www.cdsi.gov.sa/), in published form in PDF format. A selection of tables is also available in PDF or Excel format.
https://www.stats.gov.sa/en/814 (website English version) or https://www.stats.gov.sa/ar/814 (website Arabic version). The technical notes and tables of contents are in Arabic and the tables are in both languages.
Date of access: May 2013.
| 2011-2012 |
|
Currently enrolled |
2011′ Graduates |
| Sex |
Saudis |
Non-Saudis |
Total |
Saudis |
Non-Saudis |
Total |
| Intermediate |
males |
141.520 |
1.087 |
142.607 |
28.058 |
641 |
28.699 |
| Diploma |
females |
43.591 |
821 |
44.412 |
10.013 |
148 |
10.161 |
| |
total |
185.111 |
1.908 |
187.019 |
38.071 |
789 |
38.860 |
| |
males |
605.618 |
31.537 |
637.155 |
30.053 |
1.425 |
31.478 |
| Bachelor Degree |
females |
657.101 |
24.317 |
681.418 |
58.059 |
1.025 |
59.084 |
| |
total |
1.262.719 |
55.854 |
1.318.573 |
88.112 |
2.450 |
90.562 |
| |
males |
10.372 |
392 |
10.764 |
2.191 |
89 |
2.280 |
| Higher Diploma |
females |
7.458 |
54 |
7.512 |
1.848 |
19 |
1.867 |
| |
total |
17.830 |
446 |
18.276 |
4.039 |
108 |
4.147 |
| |
males |
19.998 |
3.351 |
23.349 |
1.564 |
197 |
1.761 |
| Master |
females |
18.075 |
568 |
18.643 |
1.194 |
38 |
1.232 |
| |
total |
38.073 |
3.919 |
41.992 |
2.758 |
235 |
2.993 |
| |
males |
582 |
28 |
610 |
66 |
4 |
70 |
| Fellowship |
females |
275 |
14 |
289 |
55 |
3 |
58 |
| |
total |
857 |
42 |
899 |
121 |
7 |
128 |
| |
males |
2.693 |
885 |
3.578 |
200 |
39 |
239 |
| Doctorate |
females |
1.827 |
59 |
1.886 |
188 |
2 |
190 |
| |
total |
4.520 |
944 |
5.464 |
388 |
41 |
429 |
| |
males |
780.783 |
37.280 |
818.063 |
62.132 |
2.395 |
64.527 |
| TOTAL |
females |
728.327 |
25.833 |
754.160 |
71.357 |
1.235 |
72.592 |
| |
total |
1.509.110 |
63.113 |
1.572.223 |
133.489 |
3.630 |
137.119 |
Source: Ministry of Higher Education
ANNEXED NOTE
The table refers to all the students at a given level, i.e. the “new entrants” (mustajiddoûn) and the “previously enrolled” (muqayydoûn)
Institution which provides data
Saudi Ministry of Higher Education.
Data availability
MoHE yearly compilation of statistical data tables back to 1980, are available on the website of the Ministry of Higher Education (Arabic website), in Excel and in html format.
http://www.mohe.gov.sa/ar/Ministry/Deputy-Ministry-for-Planning-and-Information-affairs/HESC/Ehsaat/Pages/default.aspx
Date of access: June 5th, 2013.
| University |
|
Saudis |
|
|
non-Saudis |
|
|
TOTAL |
|
| Year |
males |
females |
total |
males |
females |
total |
males |
females |
total |
| 2006-2007 |
401.024 |
472.181 |
873.205 |
14.584 |
14.407 |
28.991 |
415.608 |
486.588 |
902.196 |
| 2007-2008 |
440.112 |
505.063 |
945.175 |
15.684 |
9.639 |
25.323 |
455.796 |
514.702 |
970.498 |
| 2008-2009 |
469.069 |
535.064 |
1.004.133 |
16.712 |
9.779 |
26.491 |
485.781 |
544.843 |
1.030.624 |
| 2009-2010 |
573.187 |
593.214 |
1.166.401 |
21.442 |
13.356 |
34.798 |
594.629 |
606.570 |
1.201.199 |
| 2010-2011 |
656.484 |
647.667 |
1.304.151 |
26.387 |
19.650 |
46.037 |
682.871 |
667.317 |
1.350.188 |
| 2011-2012 |
780.783 |
728.327 |
1.509.110 |
37.280 |
25.833 |
63.113 |
818.063 |
754.160 |
1.572.223 |
Source: Ministry of Higher Education
ANNEXED NOTE
The table refers to all the students at a given level, i.e. the “new entrants” (mustajiddoûn) and the “previously enrolled” (muqayydoûn)
Institution which provides data
Saudi Ministry of Higher Education.
Data availability
MoHE yearly compilation of statistical data tables back to 1980, are available on the website of the Ministry of Higher Education (Arabic website), in Excel and in html format.
http://www.mohe.gov.sa/ar/Ministry/Deputy-Ministry-for-Planning-and-Information-affairs/HESC/Ehsaat/Pages/default.aspx
Date of access: June 5th, 2013.
| |
|
house keeping |
student |
retired |
self sufficient |
disabled |
Others |
Total |
| |
2007 |
3.445.036 |
2.599.134 |
483.344 |
50.432 |
134.898 |
357.619 |
7.070.463 |
| Saudis |
2009 |
3.617.265 |
2.945.067 |
536.150 |
15.024 |
93.871 |
297.098 |
7.504.475 |
| |
2012 |
3.707.141 |
3.078.397 |
612.495 |
38.656 |
123.229 |
307.720 |
7.867.638 |
| |
2007 |
734.648 |
289.937 |
4.118 |
4.337 |
16.584 |
46.525 |
1.096.149 |
| non-Saudis |
2009 |
747.284 |
344.056 |
4.611 |
2.089 |
12.235 |
33.911 |
1.144.186 |
| |
2012 |
992.747 |
408.737 |
14.353 |
14.591 |
20.696 |
49.164 |
1.500.288 |
| |
2007 |
4.179.684 |
2.889.071 |
487.462 |
54.769 |
151.482 |
404.144 |
8.166.612 |
| Total |
2009 |
4.364.549 |
3.289.123 |
540.761 |
17.113 |
106.106 |
331.009 |
8.648.661 |
| |
2012 |
4.699.888 |
3.487.134 |
626.848 |
53.247 |
143.925 |
356.884 |
9.367.926 |
Source: Manpower Surveys, 2077 (Round 1); 2009; 2012 (Round 1)
ANNEXED NOTE
1. Technical Notes and Definitions
| Manpower |
Sampling |
Sample size |
|
| Surveys |
frame |
(households) |
Reference period |
| 2007 |
Census |
23.000 |
February 19th-March 20th, 2007 |
| 2009 |
2004 |
23.000 |
July 24th-August 22nd, 2009 |
| 2012 R1 |
Census 2010 |
29.000 |
January 25th-February 17th, 2012 |
Population of reference: all individuals (nationals and non-nationals) residing in the Kingdom during the period of reference.
The ultimate sampling unit is the household.
(a) Household and household members: A person or group of persons, related or not related, who share housing and food.
Servants, drivers and similar categories are considered to be part of the household if they live in the same housing unit.
(b) Person out of the labour force: A person aged 15 years and over who is not included in the labour force, among which: the persons staying home for domestics activities, the students, the retired, the self-sufficients,
the ones unable to enrol in labour, who are not working and do not look for a job for any other reason.
2. Institution which provides data
Central Department of Statistics and Information (CDSI), Ministry and Economy and Planning
3. Data availability
Surveys conducted since 1999 are available on the website of the CDSI (http://www.cdsi.gov.sa/), in published form in PDF format. A selection of tables is also available in PDF or Excel format.
https://www.stats.gov.sa/en/814 (website English version) or https://www.stats.gov.sa/ar/814 (website Arabic version). The technical notes and tables of contents are in Arabic and the tables are in both languages.
Date of access: May 2013.
| Country |
|
2011-2012 |
|
| |
males |
females |
total |
| Algeria |
39 |
24 |
63 |
| Qatar |
71 |
49 |
120 |
| Kuwait |
1.271 |
2.282 |
3.553 |
| Syria |
111 |
68 |
179 |
| Oman |
88 |
23 |
111 |
| UAE |
656 |
890 |
1.546 |
| Morocco |
28 |
60 |
88 |
| Tunisia |
38 |
24 |
62 |
| Bahrain |
546 |
747 |
1.293 |
| Egypt |
6.301 |
1.442 |
7.743 |
| Sudan |
112 |
50 |
162 |
| Jordan |
6.809 |
1.306 |
8.115 |
| Lebanon |
139 |
180 |
319 |
| Yemen |
781 |
213 |
994 |
| Arab countries |
16.990 |
7.358 |
24.348 |
| Turkey |
144 |
103 |
247 |
| Pakistan |
175 |
106 |
281 |
| Malaysia |
1.218 |
291 |
1.509 |
| India |
854 |
105 |
959 |
| Japan |
499 |
153 |
652 |
| South Korea |
247 |
43 |
290 |
| China |
1.145 |
175 |
1.320 |
| Singapore |
46 |
42 |
88 |
| Asia |
4.328 |
1.018 |
5.346 |
| Australia |
10.328 |
2.705 |
14.050 |
| New Zealand |
3.269 |
369 |
3.638 |
| Oceania |
13.597 |
3.074 |
17.688 |
| Germany |
478 |
662 |
2.652 |
| Austria |
578 |
203 |
781 |
| U.K. |
16.331 |
1.927 |
21.471 |
| France |
1.115 |
659 |
1.774 |
| Italy |
40 |
52 |
92 |
| Irland |
458 |
272 |
730 |
| Europe |
19.000 |
3.775 |
27.500 |
| USA |
76.962 |
22.694 |
99.656 |
| Canada |
14.313 |
4.611 |
18.924 |
| America |
91.275 |
27.305 |
118.580 |
| TOTAL |
145.190 |
42.530 |
193.462 |
Source : Ministry of Higher Education.
ANNEXED NOTE
The tables refer to all the students at a given level, i.e. the “new entrants” (mustajidoûn) and the “previously enrolled” (muqayydoûn)
Institution which provides data
Saudi Ministry of Higher Education.
Data availability
MoHE yearly compilations of statistical data tables back to 1980, are available on the website of the Ministry of Higher Education (Arabic website), in Excel and in html format.
http://www.mohe.gov.sa/ar/Ministry/Deputy-Ministry-for-Planning-and-Information-affairs/HESC/Ehsaat/Pages/default.aspx
A selection of tables is also available in Central Department of Statistics and Information (CDSI)’ Statistical Yearbooks (available online at: https://www.stats.gov.sa/en/46).
Date of access: June 5th, 2013.
| 2009-2010 |
|
Intermediate Diploma |
|
|
B.Sc and B.A. |
|
|
Higher Diploma |
|
|
Master |
|
|
Doctorate |
|
|
Fellowship |
|
|
Other |
|
|
Total |
|
| |
M. |
F. |
T. |
M. |
F. |
T. |
M. |
F. |
T. |
M. |
F. |
T. |
M. |
F. |
T. |
M. |
F. |
T. |
M. |
F. |
T. |
M. |
F. |
T. |
| Arab Countries |
817 |
718 |
1.535 |
9.139 |
3.292 |
12.431 |
43 |
12 |
55 |
2.102 |
708 |
2.810 |
530 |
95 |
625 |
10 |
2 |
12 |
607 |
88 |
695 |
13.248 |
4.915 |
18.163 |
| U.S.A. |
9 |
17 |
26 |
11.616 |
1.473 |
13.089 |
0 |
0 |
0 |
3.178 |
1.593 |
4.771 |
614 |
236 |
850 |
389 |
156 |
545 |
3.006 |
2.001 |
5.007 |
18.812 |
5.476 |
24.288 |
| Canada |
32 |
5 |
37 |
4.814 |
277 |
5.091 |
3 |
2 |
5 |
1.239 |
1.090 |
2.329 |
165 |
56 |
221 |
505 |
139 |
644 |
589 |
63 |
652 |
7.347 |
1.632 |
8.979 |
| Australia and New Zealand |
58 |
2 |
60 |
2.537 |
291 |
2.828 |
0 |
0 |
0 |
2.361 |
816 |
3.177 |
318 |
56 |
374 |
27 |
4 |
31 |
647 |
83 |
730 |
5.948 |
1.252 |
7.200 |
| U.K. |
8 |
2 |
10 |
5.214 |
755 |
5.969 |
3 |
0 |
3 |
4.273 |
2.027 |
6.300 |
1.299 |
611 |
1.910 |
10 |
15 |
25 |
811 |
157 |
968 |
11.618 |
3.567 |
15.185 |
| Other European Countries |
5 |
63 |
68 |
2.327 |
435 |
2.762 |
2 |
0 |
2 |
459 |
240 |
699 |
91 |
22 |
113 |
300 |
34 |
334 |
377 |
52 |
429 |
3.561 |
846 |
4.407 |
| Asian Countries |
2 |
0 |
2 |
1.617 |
162 |
1.779 |
0 |
0 |
0 |
302 |
232 |
534 |
120 |
33 |
153 |
2 |
0 |
2 |
116 |
19 |
135 |
2.159 |
446 |
2.605 |
| Grand Total |
931 |
807 |
1.738 |
37.264 |
6.685 |
43.949 |
51 |
14 |
65 |
13.914 |
6.706 |
20.620 |
3.137 |
1.109 |
4.246 |
1.243 |
350 |
1.593 |
6.153 |
2.463 |
8.616 |
62.693 |
18.134 |
80.827 |
| 2011-2012 |
|
Intermediate Diploma |
|
|
B.Sc and B.A. |
|
|
Higher Diploma |
|
|
Master |
|
|
Doctorate |
|
|
Fellowship |
|
|
Other |
|
|
Total |
|
| |
M. |
F. |
T. |
M. |
F. |
T. |
M. |
F. |
T. |
M. |
F. |
T. |
M. |
F. |
T. |
M. |
F. |
T. |
M. |
F. |
T. |
M. |
F. |
T. |
| Arab Countries |
1.069 |
971 |
2.040 |
10.952 |
3.676 |
15.816 |
44 |
12 |
56 |
2.659 |
1.077 |
3.736 |
661 |
166 |
827 |
13 |
2 |
15 |
1.592 |
266 |
1.858 |
16.990 |
7.358 |
24.348 |
| U.S.A. |
102 |
28 |
130 |
49.848 |
5.824 |
55.672 |
8 |
4 |
12 |
3.945 |
10.493 |
25.616 |
1.977 |
1.133 |
3.110 |
955 |
509 |
1.464 |
8.949 |
4.703 |
13.652 |
76.962 |
22.694 |
99.656 |
| Canada |
20 |
6 |
26 |
9.431 |
787 |
10.218 |
2 |
1 |
3 |
1.823 |
3.049 |
4.872 |
391 |
198 |
589 |
667 |
227 |
894 |
1.979 |
343 |
2.322 |
14.313 |
4.611 |
18.924 |
| Australia and New Zealand |
177 |
4 |
181 |
8.198 |
921 |
6.752 |
10 |
2 |
12 |
3.954 |
460 |
5.629 |
909 |
297 |
1.206 |
56 |
13 |
69 |
1.310 |
162 |
1.472 |
13.597 |
3.074 |
17.688 |
| U.K. |
1 |
0 |
1 |
7.598 |
1.512 |
9.110 |
2 |
0 |
2 |
5.139 |
3.289 |
8.428 |
2.479 |
1.636 |
4.115 |
19 |
21 |
40 |
1.093 |
1.184 |
2.277 |
16.331 |
1.927 |
21.471 |
| Other European Countries |
4 |
62 |
66 |
2.455 |
909 |
3.364 |
5 |
0 |
5 |
478 |
593 |
1.071 |
146 |
64 |
210 |
653 |
99 |
752 |
440 |
121 |
561 |
2.669 |
1.848 |
6.029 |
| Asian Countries |
3 |
0 |
3 |
3.114 |
449 |
3.563 |
0 |
0 |
0 |
455 |
379 |
834 |
266 |
118 |
384 |
4 |
3 |
7 |
486 |
69 |
555 |
4.328 |
1.018 |
5.346 |
| Grand Total |
1.376 |
1.071 |
2.447 |
91.596 |
14.078 |
104.495 |
71 |
19 |
90 |
18.453 |
19.340 |
50.186 |
6.829 |
3.612 |
10.441 |
2.367 |
874 |
3.241 |
15.849 |
6.848 |
22.697 |
145.190 |
42.530 |
193.462 |
Source : Ministry of Higher Education.
ANNEXED NOTE
The tables refer to all the students at a given level, i.e. the “new entrants” (mustajidoûn) and the “previously enrolled” (muqayydoûn)
Institution which provides data
Saudi Ministry of Higher Education.
Data availability
MoHE yearly compilations of statistical data tables back to 1980, are available on the website of the Ministry of Higher Education (Arabic website), in Excel and in html format.
http://www.mohe.gov.sa/ar/Ministry/Deputy-Ministry-for-Planning-and-Information-affairs/HESC/Ehsaat/Pages/default.aspx
A selection of tables is also available in Central Department of Statistics and Information (CDSI)’ Statistical Yearbooks (available online at: https://www.stats.gov.sa/en/46).
Date of access: June 5th, 2013.
|
|
Saudis |
|
|
Non-Saudis |
|
|
Total |
|
| |
males |
females |
total |
males |
females |
total |
males |
females |
total |
| Never married |
808.827 |
135.272 |
944.099 |
744.453 |
100.018 |
844.471 |
1.553.280 |
235.290 |
1.788.570 |
| Married |
2.779.634 |
447.145 |
3.226.779 |
4.413.636 |
573.076 |
4.986.712 |
7.193.270 |
1.020.221 |
8.213.491 |
| Divorced |
32.931 |
25.117 |
58.048 |
17.809 |
13.762 |
31.571 |
50.740 |
38.879 |
89.619 |
| Widower |
10.751 |
12.046 |
22.797 |
10.707 |
11.209 |
21.916 |
21.458 |
23.255 |
44.713 |
| Total |
3.632.143 |
619.580 |
4.251.723 |
5.186.605 |
698.065 |
5.884.670 |
8.818.748 |
1.317.645 |
10.136.393 |
Source: Manpower Survey, 2012 (Round 1).
ANNEXED NOTE
1. Technical Notes and Definitions
Sampling frame of LFS 2012 Round 1: Population Census 2010.
Sample size: 29 000 households
Reference period: January 25th-February 17th, 2012
Population of reference: all individuals (nationals and non-nationals) residing in the Kingdom during the period of reference.
The ultimate sampling unit is the household.
(a) Household and household members: A person or group of persons, related or not related, who share housing and food.
Servants, drivers and similar categories are considered to be part of the household if they live in the same housing unit.
(b) Employed person: A person aged 15 years and above who worked during the reference week for at least one hour for pay or profit, or who had a job but were temporarily absent from work.
Employment refers to people who during the reference period:
– worked for one hour or more for wage or salary, in cash or in kind
– worked for one hour or more for profit or family gain, in cash or in kind
– worked for at least 15 hours without pay on a family business or farm
– did volunteer work
Reference period for employment: The seven days preceding the interview date.
2. Institution which provides data
Central Department of Statistics and Information (CDSI), Ministry and Economy and Planning
3. Data availability
Surveys conducted since 1999 are available on the website of the CDSI (http://www.cdsi.gov.sa/), in published form in PDF format. A selection of tables is also available in PDF or Excel format.
https://www.stats.gov.sa/en/814 (website English version) or https://www.stats.gov.sa/ar/814 (website Arabic version). The technical notes and tables of contents are in Arabic and the tables are in both languages.
Date of access: May 2013.
| Education Status |
|
|
Saudis |
|
|
Non-Saudis |
|
|
Total |
|
| |
year |
Males |
Females |
Total |
Males |
Females |
Total |
Males |
Females |
Total |
| |
2.006 |
164.316 |
19.233 |
183.549 |
372.188 |
33.636 |
405.824 |
536.504 |
52.869 |
589.373 |
| Illiterate |
2.009 |
137.675 |
10.609 |
148.284 |
292.873 |
35.409 |
328.282 |
430.548 |
46.018 |
476.566 |
| |
2.012 |
106.333 |
8.016 |
114.349 |
260.266 |
29.760 |
290.026 |
366.599 |
37.776 |
404.375 |
| |
2.006 |
130.914 |
5.495 |
136.409 |
888.176 |
271.520 |
1.159.696 |
1.019.090 |
277.015 |
1.296.105 |
| Read and Write |
2.009 |
107.377 |
3.728 |
111.105 |
611.386 |
186.619 |
798.005 |
718.763 |
190.347 |
909.110 |
| |
2.012 |
105.516 |
6.271 |
111.787 |
735.782 |
157.645 |
893.427 |
841.298 |
163.916 |
1.005.214 |
| |
2.006 |
475.582 |
5.684 |
481.266 |
516.636 |
79.366 |
596.002 |
992.218 |
85.050 |
1.077.268 |
| Primary |
2.009 |
407.884 |
7.945 |
415.829 |
659.435 |
152.710 |
812.145 |
1.067.319 |
160.655 |
1.227.974 |
| |
2.012 |
360.246 |
12.801 |
373.047 |
912.244 |
181.815 |
1.094.059 |
1.272.490 |
194.616 |
1.467.106 |
| |
2.006 |
596.652 |
11.027 |
607.679 |
669.582 |
79.831 |
749.413 |
1.266.234 |
90.858 |
1.357.092 |
| Intermediate |
2.009 |
667.227 |
16.846 |
684.073 |
883.136 |
118.471 |
1.001.607 |
1.550.363 |
135.317 |
1.685.680 |
| |
2.012 |
565.814 |
13.549 |
579.363 |
1.216.075 |
179.792 |
1.395.867 |
1.781.889 |
193.341 |
1.975.230 |
| |
2.006 |
728.586 |
63.348 |
791.934 |
432.114 |
31.656 |
463.770 |
1.160.700 |
95.004 |
1.255.704 |
| Secondary or |
2.009 |
1.060.649 |
52.573 |
1.113.222 |
593.319 |
38.318 |
631.637 |
1.653.968 |
90.891 |
1.744.859 |
| Equivalent |
2.012 |
1.261.843 |
61.437 |
1.323.280 |
830.792 |
56.229 |
887.021 |
2.092.635 |
117.666 |
2.210.301 |
| |
2.006 |
215.861 |
92.423 |
308.284 |
181.819 |
27.747 |
209.566 |
397.680 |
120.170 |
517.850 |
| Diploma |
2.009 |
263.143 |
87.128 |
350.271 |
159.382 |
15.550 |
174.932 |
422.525 |
102.678 |
525.203 |
| |
2.012 |
316.272 |
104.187 |
420.459 |
281.503 |
16.046 |
297.549 |
597.775 |
120.233 |
718.008 |
| |
2.006 |
564.366 |
286.095 |
850.461 |
404.301 |
35.896 |
440.197 |
968.667 |
321.991 |
1.290.658 |
| Bachelor Degree |
2.009 |
632.556 |
316.735 |
949.291 |
483.439 |
23.099 |
506.538 |
1.115.995 |
339.834 |
1.455.829 |
| |
2.012 |
849.773 |
400.196 |
1.249.969 |
831.998 |
64.695 |
896.693 |
1.681.771 |
464.891 |
2.146.662 |
| |
2.006 |
42.472 |
7.252 |
49.724 |
36.406 |
4.905 |
41.311 |
78.878 |
12.157 |
91.035 |
| Master Degree |
2.009 |
39.499 |
7.027 |
46.526 |
42.530 |
2.182 |
44.712 |
82.029 |
9.209 |
91.238 |
| |
2.012 |
46.799 |
7.980 |
54.779 |
71.392 |
5.312 |
76.704 |
118.191 |
13.292 |
131.483 |
| |
2.006 |
18.547 |
3.721 |
22.268 |
22.972 |
2.660 |
25.632 |
41.519 |
6.381 |
47.900 |
| Doctorate |
2.009 |
16.618 |
2.749 |
19.367 |
11.310 |
856 |
12.166 |
27.928 |
3.605 |
31.533 |
| |
2.012 |
19.547 |
5.143 |
24.690 |
46.553 |
6.771 |
53.324 |
66.100 |
11.914 |
78.014 |
| |
2.006 |
2.937.296 |
494.278 |
3.431.574 |
3.524.194 |
567.217 |
4.091.411 |
6.461.490 |
1.061.495 |
7.522.985 |
| Total |
2.009 |
3.332.628 |
505.340 |
3.837.968 |
3.736.810 |
573.214 |
4.310.024 |
7.069.438 |
1.078.554 |
8.147.992 |
| |
2.012 |
3.632.143 |
619.580 |
4.251.723 |
5.186.605 |
698.065 |
5.884.670 |
8.818.748 |
1.317.645 |
10.136.393 |
Source: Labour Force Surveys, 2006; 2009; 2012 (Round 1).
ANNEXED NOTE
1. Technical Notes and Definitions
| Manpower |
Sampling |
Sample size |
|
| Surveys |
frame |
(households) |
Reference period |
| 2006 |
Census |
23.000 |
May 2006 |
| 2009 |
2004 |
23.000 |
July 24th-August 22nd, 2009 |
| 2012 R1 |
Census 2010 |
29.000 |
January 25th-February 17th, 2012 |
Population of reference: all individuals (nationals and non-nationals) residing in the Kingdom during the period of reference.
The ultimate sampling unit is the household.
(a) Household and household members: A person or group of persons, related or not related, who share housing and food.
Servants, drivers and similar categories are considered to be part of the household if they live in the same housing unit.
(b) Employed person: A person aged 15 years and above who worked during the reference week for at least one hour for pay or profit, or who had a job but were temporarily absent from work.
Employment refers to people who during the reference period:
– worked for one hour or more for wage or salary, in cash or in kind
– worked for one hour or more for profit or family gain, in cash or in kind
– worked for at least 15 hours without pay on a family business or farm
– did volunteer work
Reference period for employment: The seven days preceding the interview date.
Classification used for education statuses is ISCED.
2. Institution which provides data
Central Department of Statistics and Information (CDSI), Ministry and Economy and Planning
3. Data availability
Surveys conducted since 1999 are available on the website of the CDSI (http://www.cdsi.gov.sa/), in published form in PDF format. A selection of tables is also available in PDF or Excel format.
https://www.stats.gov.sa/en/814 (website English version) or https://www.stats.gov.sa/ar/814 (website Arabic version). The technical notes and tables of contents are in Arabic and the tables are in both languages.
Since 2007, Statistical Yearbooks have introduced a section on “Labour Statistics”, which presents a selection of tables from Manpower Surveys.
https://www.stats.gov.sa/en/46
Date of access: May 2013.
| |
|
Saudis |
|
|
Non-Saudis |
|
|
TOTAL |
|
| |
Male |
Female |
Total |
Male |
Female |
Total |
Male |
Female |
Total |
| 19-15 |
14.894 |
1.488 |
16.382 |
21.946 |
5.048 |
26.994 |
36.840 |
6.536 |
43.376 |
| 24-20 |
281.771 |
35.867 |
317.638 |
178.347 |
38.932 |
217.279 |
460.118 |
74.799 |
534.917 |
| 29-25 |
649.314 |
122.239 |
771.553 |
517.004 |
93.258 |
610.262 |
1.166.318 |
215.497 |
1.381.815 |
| 34-30 |
672.524 |
148.530 |
821.054 |
1.047.817 |
188.694 |
1.236.511 |
1.720.341 |
337.224 |
2.057.565 |
| 39-35 |
595.580 |
144.694 |
740.274 |
1.143.157 |
203.722 |
1.346.879 |
1.738.737 |
348.416 |
2.087.153 |
| 44-40 |
500.886 |
90.652 |
591.538 |
903.965 |
108.829 |
1.012.794 |
1.404.851 |
199.481 |
1.604.332 |
| 49-45 |
384.031 |
42.264 |
426.295 |
642.481 |
31.963 |
674.444 |
1.026.512 |
74.227 |
1.100.739 |
| 54-50 |
245.434 |
20.881 |
266.315 |
395.464 |
15.799 |
411.263 |
640.898 |
36.680 |
677.578 |
| 59-55 |
146.464 |
9.956 |
156.420 |
214.514 |
6.740 |
221.254 |
360.978 |
16.696 |
377.674 |
| 64-60 |
59.047 |
1.493 |
60.540 |
86.161 |
2.927 |
89.088 |
145.208 |
4.420 |
149.628 |
| 65+ |
82.198 |
1.516 |
83.714 |
35.749 |
2.153 |
37.902 |
117.947 |
3.669 |
121.616 |
| Total |
3.632.143 |
619.580 |
4.251.723 |
5.186.605 |
698.065 |
5.884.670 |
8.818.748 |
1.317.645 |
10.136.393 |
source: Labour Force Survey 2012 (Round 1).
ANNEXED NOTE
1. Technical Notes and Definitions
Sampling frame of LFS 2012 Round 1: Population Census 2010.
Sample size: 29 000 households
Reference period: January 25th-February 17th, 2012
Population of reference: all individuals (nationals and non-nationals) residing in the Kingdom during the period of reference.
The ultimate sampling unit is the household.
(a) Household and household members: A person or group of persons, related or not related, who share housing and food.
Servants, drivers and similar categories are considered to be part of the household if they live in the same housing unit.
(b) Employed person: A person aged 15 years and above who worked during the reference week for at least one hour for pay or profit, or who had a job but were temporarily absent from work.
Employment refers to people who during the reference period:
– worked for one hour or more for wage or salary, in cash or in kind
– worked for one hour or more for profit or family gain, in cash or in kind
– worked for at least 15 hours without pay on a family business or farm
– did volunteer work
Reference period for employment: The seven days preceding the interview date.
2. Institution which provides data
Central Department of Statistics and Information (CDSI), Ministry and Economy and Planning
3. Data availability
Surveys conducted since 1999 are available on the website of the CDSI (http://www.cdsi.gov.sa/), in published form in PDF format. A selection of tables is also available in PDF or Excel format.
https://www.stats.gov.sa/en/814 (website English version) or https://www.stats.gov.sa/ar/814 (website Arabic version). The technical notes and tables of contents are in Arabic and the tables are in both languages.
Since 2007, Statistical Yearbooks have introduced a section on “Labour Statistics”, which presents a selection of tables from Manpower Surveys.
https://www.stats.gov.sa/en/46
Date of access: May 2013.
| |
Saudis |
Non-Saudis |
TOTAL |
| |
males |
females |
total |
males |
females |
total |
males |
females |
total |
| Agriculture, hunting, forestry and fishing |
158.539 |
1.626 |
160.165 |
280.737 |
1.443 |
282.180 |
439.276 |
3.069 |
442.345 |
| Mining and quarrying |
85.936 |
2.705 |
88.641 |
14.639 |
291 |
14.930 |
100.575 |
2.996 |
103.571 |
| Manufacturing |
127.820 |
6.199 |
134.019 |
572.738 |
4.022 |
576.760 |
700.558 |
10.221 |
710.779 |
| Electricity, gas and water supply |
57.711 |
0 |
57.711 |
38.161 |
149 |
38.310 |
95.872 |
149 |
96.021 |
| Construction |
112.218 |
483 |
112.701 |
1.354.610 |
3.234 |
1.357.844 |
1.466.828 |
3.717 |
1.470.545 |
| Wholesale and retail trade; repair of motor vehicles, |
282.848 |
10.999 |
293.847 |
1.394.703 |
9.213 |
1.403.916 |
1.677.551 |
20.212 |
1.697.763 |
| motorcycles and personal and household goods |
|
|
|
|
|
|
|
|
|
| Hotels and restaurants |
21.586 |
2.030 |
23.616 |
268.405 |
4.992 |
273.397 |
289.991 |
7.022 |
297.013 |
| Transport, storage and communications |
192.554 |
3.164 |
195.718 |
236.851 |
1.154 |
238.005 |
429.405 |
4.318 |
433.723 |
| Financial intermediation |
66.202 |
7.821 |
74.023 |
26.224 |
788 |
27.012 |
92.426 |
8.609 |
101.035 |
| Real estate, renting and business activities |
133.442 |
4.066 |
137.508 |
209.751 |
875 |
210.626 |
343.193 |
4.941 |
348.134 |
| Public administration and defence; compulsory social security |
1.568.555 |
34.253 |
1.602.808 |
39.322 |
673 |
39.995 |
1.607.877 |
34.926 |
1.642.803 |
| Education |
579.923 |
469.651 |
1.049.574 |
107.336 |
25.001 |
132.337 |
687.259 |
494.652 |
1.181.911 |
| Health and social work |
190.403 |
71.820 |
262.223 |
156.091 |
66.531 |
222.622 |
346.494 |
138.351 |
484.845 |
| Other community, social and personal service activities |
51.356 |
3.826 |
55.182 |
97.210 |
9.811 |
107.021 |
148.566 |
13.637 |
162.203 |
| Activities of private households as employers and undifferentiated … |
2.087 |
188 |
2.275 |
382.078 |
569.263 |
951.341 |
384.165 |
569.451 |
953.616 |
| Extraterritorial organizations and bodies |
963 |
749 |
1.712 |
7.749 |
625 |
8.374 |
8.712 |
1.374 |
10.086 |
| Total |
3.632.143 |
619.580 |
4.251.723 |
5.186.605 |
698.065 |
5.884.670 |
8.818.748 |
1.317.645 |
10.136.393 |
Source: Manpower Survey, 2012 (Round 1).
ANNEXED NOTE
1. Technical Notes and Definitions
Sampling frame of LFS 2012 Round 1: Population Census 2010.
Sample size: 29 000 households
Reference period: January 25th-February 17th, 2012
Population of reference: all individuals (nationals and non-nationals) residing in the Kingdom during the period of reference.
The ultimate sampling unit is the household.
(a) Household and household members: A person or group of persons, related or not related, who share housing and food.
Servants, drivers and similar categories are considered to be part of the household if they live in the same housing unit.
(b) Employed person: A person aged 15 years and above who worked during the reference week for at least one hour for pay or profit, or who had a job but were temporarily absent from work.
Employment refers to people who during the reference period:
– worked for one hour or more for wage or salary, in cash or in kind
– worked for one hour or more for profit or family gain, in cash or in kind
– worked for at least 15 hours without pay on a family business or farm
– did volunteer work
Reference period for employment: The seven days preceding the interview date.
Classification used for economic activity is ISIC 3.1
2. Institution which provides data
Central Department of Statistics and Information (CDSI), Ministry and Economy and Planning
3. Data availability
Surveys conducted since 1999 are available on the website of the CDSI (http://www.cdsi.gov.sa/), in published form in PDF format. A selection of tables is also available in PDF or Excel format.
https://www.stats.gov.sa/en/814 (website English version) or https://www.stats.gov.sa/ar/814(website Arabic version). The technical notes and tables of contents are in Arabic and the tables are in both languages.
Since 2007, Statistical Yearbooks have introduced a section on “Labour Statistics”, which presents a selection of tables from Manpower Surveys.
https://www.stats.gov.sa/en/46
Date of access: May 2013.
|
2006 |
2007 |
2008 |
2009 |
2010 |
2011 |
2012 * |
| remittances paid |
15.943 |
16.436 |
21.696 |
26.470 |
27.069 |
28.475 |
29.493 |
Source: SAMA Quarterly Statistical Bulletin, 1st quarter 2013.
* Preliminary
ANNEXED NOTE
1. Definition:
Personal remittances is the sum of “personal transfers” (which includes workers’ remittances) and “compensation of employees”, listed in the balance of payments.
2. Institution which provides data
Saudi Arabian Monetary Agency (SAMA), the Central Bank of the Kingdom of Saudi Arabia
3. Data availability
The balance of payments is published in SAMA Quarterly Statistical Bulletin, available online in English in PDF and Excel formats:
http://www.sama.gov.sa/sites/samaen/ReportsStatistics/statistics/Pages/QuarterlyStatistics.aspx
(no back issues and data prior to 2006 are available on the web site of SAMA).
| |
2006 |
2007 |
2008 |
2009 |
2010 |
2011 |
2012 * |
| remittances received |
106 |
123 |
216 |
214 |
236 |
244 |
246 |
Source: SAMA Quarterly Statistical Bulletin, 1st quarter 2013.
* Preliminary
ANNEXED NOTE
1. Definition:
Personal remittances is the sum of “personal transfers” (which includes workers’ remittances) and “compensation of employees”, listed in the balance of payments.
2. Institution which provides data
Saudi Arabian Monetary Agency (SAMA), the Central Bank of the Kingdom of Saudi Arabia
3. Data availability
The balance of payments is published in SAMA Quarterly Statistical Bulletin, available online in English in PDF and Excel formats:
http://www.sama.gov.sa/sites/samaen/ReportsStatistics/statistics/Pages/QuarterlyStatistics.aspx
(no back issues and data prior to 2006 are available on the web site of SAMA).
|
|
In the labour force |
|
|
Out of the labour force |
|
|
Total |
|
| |
Males |
Females |
Total |
Males |
Females |
Total |
Males |
Females |
Total |
| Qataris |
46.572 |
27.089 |
73.661 |
21.460 |
43.794 |
65.254 |
68.032 |
70.883 |
138.915 |
| non-Qataris |
1.067.753 |
130.024 |
1.197.777 |
21665 |
94677 |
116.342 |
1.089.418 |
224.701 |
1.314.119 |
| Total |
1.114.325 |
157.113 |
1.271.438 |
43.125 |
138.471 |
181.596 |
1.157.450 |
295.584 |
1.453.034 |
Source: census 2010, QSA
ANNEXED NOTE
1. Technical Notes and Definitions
Reference period for census 2010: the night of April 21st, 2010.
Implementation method: census is based on de jure method; i.e. registering people according to their usual place of residence at time of census.
Populations in transit or visiting Qatar as tourists, as well as residents of public housing or visitors staying in a household for less than two months after night of reference were excluded.
Populations away from usual residence in Qatar for reasons of duty, or on a visit abroad for less than two months, as well as individuals with no personal housing within Qatar staying with a household for more than two months, are counted in their usual/ present residence during census night.
Population of reference: all individuals (nationals and non-nationals) present within the State’s borders during time of reference, including in labour camps.
Relation with Labor Force:
(1) In labor force (for persons at the age of 15 or older):
a) Employed.
b) Unemployed. (2) Not in labor force.
(2) Outside labor force:
The persons capable, in terms of body and mind, to perform the economic activity but they do not practice it for reasons that keep them away from it, as follows:
a) Full time students.
b) Full time housewives.
c) Unemployed never worked before.
As for persons not classified as a source of labor force, they include:
1- Children below the specified age of labor force (less than 15 years old).
2- Old aged persons not engaged in productive work (65 years or more).
3- Disabled and invalids who are severely handicapped and cannot perform the economic activity
The working age population is defined as the population aged 15 to 65.
2. Institution which provides data
Qatar Statistics Authority (QSA)
(http://www.qsa.gov.qa/eng/index.htm for website in English; http://www.qsa.gov.qa/Ar/index.htm for website in Arabic)
3. Data availability
Released parts of census are available on the website of the QSA, in published form in PDF format.
https://www.mdps.gov.qa/en/statistics1/pages/topicslisting.aspx?parent=General&child=Census
Census 2010′ website:
https://www.mdps.gov.qa/en/statistics1/pages/topicslisting.aspx?parent=General&child=Census
2010′ census in Excel or PDF format individual tables:
http://www.qsa.gov.qa/QatarCensus/Census_Results.aspx
Date of access: June 2013.
| |
|
Qataris |
|
|
Non-Qataris |
|
|
TOTAL |
|
| |
males |
females |
total |
males |
females |
total |
males |
females |
total |
| Illiterate |
788 |
3.441 |
4.229 |
38.143 |
7.489 |
45.632 |
38.931 |
10.930 |
49.861 |
| Read and write-Night school |
3.008 |
4.806 |
7.814 |
284.068 |
48.058 |
332.126 |
287.076 |
52.864 |
339.940 |
| Primary |
7.645 |
5.786 |
13.431 |
270.161 |
26.547 |
296.708 |
277.806 |
32.333 |
310.139 |
| Preparatory |
16.794 |
13.012 |
29.806 |
121.648 |
26.561 |
148.209 |
138.442 |
39.573 |
178.015 |
| Vocational |
152 |
5 |
157 |
22.650 |
404 |
23.054 |
22.802 |
409 |
23.211 |
| Secondary |
22.321 |
22.010 |
44.331 |
202.699 |
46.015 |
248.714 |
225.020 |
68.025 |
293.045 |
| Post secondary |
2.282 |
1.696 |
3.978 |
29.292 |
9.931 |
39.223 |
31.574 |
11.627 |
43.201 |
| University and above |
15.021 |
20.104 |
35.125 |
120.724 |
59.671 |
180.395 |
135.745 |
79.775 |
215.520 |
| Other |
21 |
23 |
44 |
33 |
25 |
58 |
54 |
48 |
102 |
| TOTAL |
68.032 |
70.883 |
138.915 |
1.089.418 |
224.701 |
1.314.119 |
1.157.450 |
295.584 |
1.453.034 |
Source: census 2010, QSA
ANNEXED NOTE
1. Technical Notes and Definitions
Reference period for census 2010: the night of April 21st, 2010.
Implementation method: census is based on de jure method; i.e. registering people according to their usual place of residence at time of census.
Populations in transit or visiting Qatar as tourists, as well as residents of public housing or visitors staying in a household for less than two months after night of reference were excluded.
Populations away from usual residence in Qatar for reasons of duty, or on a visit abroad for less than two months, as well as individuals with no personal housing within Qatar staying with a household for more than two months, are counted in their usual/ present residence during census night.
Population of reference: all individuals (nationals and non-nationals) present within the State’s borders during time of reference, including in labour camps.
Data related to work force include individuals of 15 years old or more (born before April 1995) and refer to the week preceding the enumeration period.
The working age population is defined as the population aged 15 to 65.
2. Institution which provides data
Qatar Statistics Authority (QSA)
(http://www.qsa.gov.qa/eng/index.htm for website in English; http://www.qsa.gov.qa/Ar/index.htm for website in Arabic)
3. Data availability
Released parts of census are available on the website of the QSA, in published form in PDF format.
https://www.mdps.gov.qa/en/statistics1/pages/topicslisting.aspx?parent=General&child=Census
Census 2010′ website:
https://www.mdps.gov.qa/en/statistics1/pages/topicslisting.aspx?parent=General&child=Census
2010′ census in Excel or PDF format individual tables:
http://www.qsa.gov.qa/QatarCensus/Census_Results.aspx
Date of access: June 2013.
| |
|
Qataris |
|
|
Non-Qataris |
|
|
TOTAL |
|
| |
Males |
Females |
Total |
Males |
Females |
Total |
Males |
Females |
Total |
| 15-24 |
24.182 |
23.483 |
47.665 |
163.617 |
41.215 |
204.832 |
187.799 |
64.698 |
252.497 |
| 25-34 |
17.322 |
18.195 |
35.517 |
418.531 |
95.382 |
513.913 |
435.853 |
113.577 |
549.430 |
| 35-44 |
13.164 |
13.995 |
27.159 |
330.048 |
55.694 |
385.742 |
343.212 |
69.689 |
412.901 |
| 45-54 |
9.040 |
10.363 |
19.403 |
141.399 |
25.058 |
166.457 |
150.439 |
35.421 |
185.860 |
| 55-64 |
4.324 |
4.847 |
9.171 |
35.823 |
7.352 |
43.175 |
40.147 |
12.199 |
52.346 |
| Total |
68.032 |
70.883 |
138.915 |
1.089.418 |
224.701 |
1.314.119 |
1.157.450 |
295.584 |
1.453.034 |
Source: census 2010, QSA
ANNEXED NOTE
1. Technical Notes and Definitions
Reference period for census 2010: the night of April 21st, 2010.
Implementation method: census is based on de jure method; i.e. registering people according to their usual place of residence at time of census.
Populations in transit or visiting Qatar as tourists, as well as residents of public housing or visitors staying in a household for less than two months after night of reference were excluded.
Populations away from usual residence in Qatar for reasons of duty, or on a visit abroad for less than two months, as well as individuals with no personal housing within Qatar staying with a household for more than two months, are counted in their usual/ present residence during census night.
Population of reference: all individuals (nationals and non-nationals) present within the State’s borders during time of reference, including in labour camps.
Data related to work force include individuals of 15 years old or more (born before April 1995) and refer to the week preceding the enumeration period.
The working age population is defined as the population aged 15 to 65.
2. Institution which provides data
Qatar Statistics Authority (QSA)
(http://www.qsa.gov.qa/eng/index.htm for website in English; http://www.qsa.gov.qa/Ar/index.htm for website in Arabic)
3. Data availability
Released parts of census are available on the website of the QSA, in published form in PDF format.
https://www.mdps.gov.qa/en/statistics1/pages/topicslisting.aspx?parent=General&child=Census
Census 2010′ website:
https://www.mdps.gov.qa/en/statistics1/pages/topicslisting.aspx?parent=General&child=Census
2010′ census in Excel or PDF format individual tables:
http://www.qsa.gov.qa/QatarCensus/Census_Results.aspx
Date of access: June 2013.
| |
Qataris |
Non-Qataris |
TOTAL |
| Males |
68.032 |
1.089.418 |
1.157.450 |
| Females |
70.883 |
224.701 |
295.584 |
| Total |
138.915 |
1.314.119 |
1.453.034 |
Source: census 2010, QSA
ANNEXED NOTE
1. Technical Notes and Definitions
Reference period for census 2010: the night of April 21st, 2010.
Implementation method: census is based on de jure method; i.e. registering people according to their usual place of residence at time of census.
Populations in transit or visiting Qatar as tourists, as well as residents of public housing or visitors staying in a household for less than two months after night of reference were excluded.
Populations away from usual residence in Qatar for reasons of duty, or on a visit abroad for less than two months, as well as individuals with no personal housing within Qatar staying with a household for more than two months, are counted in their usual/ present residence during census night.
Population of reference: all individuals (nationals and non-nationals) present within the State’s borders during time of reference, including in labour camps.
Data related to work force include individuals of 15 years old or more (born before April 1995) and refer to the week preceding the enumeration period.
The working age population is defined as the population aged 15 to 65.
2. Institution which provides data
Qatar Statistics Authority (QSA)
(http://www.qsa.gov.qa/eng/index.htm for website in English; http://www.qsa.gov.qa/Ar/index.htm for website in Arabic)
3. Data availability
Released parts of census are available on the website of the QSA, in published form in PDF format.
https://www.mdps.gov.qa/en/statistics1/pages/topicslisting.aspx?parent=General&child=Census
Census 2010′ website:
https://www.mdps.gov.qa/en/statistics1/pages/topicslisting.aspx?parent=General&child=Census
2010′ census in Excel or PDF format individual tables:
http://www.qsa.gov.qa/QatarCensus/Census_Results.aspx
Date of access: June 2013.
| Educational Attainment |
|
QATARIS |
NON-QATARIS |
TOTAL POPULATION |
| |
15-24 |
25-34 |
35-44 |
45-54 |
>55 |
Total |
15-24 |
25-34 |
35-44 |
45-54 |
>55 |
Total |
15-24 |
25-34 |
35-44 |
45-54 |
>55 |
Total |
| |
Males |
12 |
12 |
11 |
0 |
0 |
35 |
2 |
0 |
0 |
1 |
0 |
3 |
14 |
12 |
11 |
1 |
0 |
38 |
| Illiterate |
Females |
6 |
7 |
10 |
1 |
0 |
24 |
0 |
0 |
0 |
0 |
0 |
0 |
6 |
7 |
10 |
1 |
0 |
24 |
| |
Total |
18 |
19 |
21 |
1 |
0 |
59 |
2 |
0 |
0 |
1 |
0 |
3 |
20 |
19 |
21 |
2 |
0 |
62 |
| |
Males |
38 |
33 |
15 |
0 |
0 |
86 |
3 |
21 |
13 |
4 |
0 |
41 |
41 |
54 |
28 |
4 |
0 |
127 |
| Read and Write & Night School |
Females |
29 |
31 |
21 |
0 |
0 |
81 |
0 |
1 |
3 |
0 |
0 |
4 |
29 |
32 |
24 |
0 |
0 |
85 |
| |
Total |
67 |
64 |
36 |
0 |
0 |
167 |
3 |
22 |
16 |
4 |
0 |
45 |
70 |
86 |
52 |
4 |
0 |
212 |
| |
Males |
126 |
70 |
26 |
5 |
0 |
227 |
39 |
29 |
11 |
3 |
0 |
82 |
165 |
99 |
37 |
8 |
0 |
309 |
| Primary |
Females |
63 |
32 |
23 |
3 |
0 |
121 |
1 |
1 |
0 |
3 |
0 |
5 |
64 |
33 |
23 |
6 |
0 |
126 |
| |
Total |
189 |
102 |
49 |
8 |
0 |
348 |
40 |
30 |
11 |
6 |
0 |
87 |
229 |
132 |
60 |
14 |
0 |
435 |
| |
Males |
134 |
60 |
13 |
1 |
0 |
208 |
19 |
39 |
15 |
0 |
0 |
73 |
153 |
99 |
28 |
1 |
0 |
281 |
| Preparatory |
Females |
147 |
75 |
25 |
3 |
0 |
250 |
13 |
7 |
2 |
0 |
0 |
22 |
160 |
82 |
27 |
3 |
0 |
272 |
| |
Total |
281 |
135 |
38 |
4 |
0 |
458 |
32 |
46 |
17 |
0 |
0 |
95 |
313 |
181 |
55 |
4 |
0 |
553 |
| |
Males |
0 |
3 |
0 |
0 |
0 |
3 |
0 |
0 |
0 |
0 |
0 |
0 |
0 |
3 |
0 |
0 |
0 |
3 |
| Vocational |
Females |
0 |
0 |
2 |
0 |
0 |
2 |
1 |
1 |
0 |
0 |
0 |
2 |
1 |
1 |
2 |
0 |
0 |
4 |
| |
Total |
0 |
3 |
2 |
0 |
0 |
5 |
1 |
1 |
0 |
0 |
0 |
2 |
1 |
4 |
2 |
0 |
0 |
7 |
| |
Males |
194 |
34 |
11 |
1 |
0 |
240 |
28 |
61 |
19 |
1 |
0 |
109 |
222 |
95 |
30 |
2 |
0 |
349 |
| Secondary |
Females |
596 |
276 |
93 |
6 |
0 |
971 |
66 |
92 |
24 |
3 |
0 |
185 |
662 |
368 |
117 |
9 |
0 |
1.156 |
| |
Total |
790 |
310 |
104 |
7 |
0 |
1.211 |
94 |
153 |
43 |
4 |
0 |
294 |
884 |
463 |
147 |
11 |
0 |
1.505 |
| |
Males |
1 |
2 |
0 |
2 |
0 |
5 |
0 |
0 |
0 |
0 |
0 |
0 |
1 |
2 |
0 |
2 |
0 |
5 |
| Post. Secondary |
Females |
18 |
17 |
3 |
6 |
0 |
44 |
17 |
35 |
6 |
2 |
0 |
60 |
35 |
52 |
9 |
8 |
0 |
104 |
| |
Total |
19 |
19 |
3 |
8 |
0 |
49 |
17 |
35 |
6 |
2 |
0 |
60 |
36 |
54 |
9 |
10 |
0 |
109 |
| |
Males |
1 |
3 |
2 |
0 |
0 |
6 |
4 |
386 |
20 |
4 |
0 |
414 |
5 |
389 |
22 |
4 |
0 |
420 |
| University and Above |
Females |
169 |
382 |
114 |
42 |
0 |
707 |
293 |
1.175 |
238 |
69 |
0 |
1.775 |
462 |
1.557 |
352 |
111 |
0 |
2.482 |
| |
Total |
170 |
385 |
116 |
42 |
0 |
713 |
297 |
1.561 |
258 |
73 |
0 |
2.189 |
467 |
1.946 |
374 |
115 |
0 |
2.902 |
| |
Males |
1 |
0 |
0 |
0 |
0 |
1 |
0 |
2 |
0 |
0 |
0 |
2 |
1 |
2 |
0 |
0 |
0 |
3 |
| Other |
Females |
0 |
0 |
0 |
0 |
0 |
0 |
0 |
0 |
0 |
0 |
0 |
0 |
0 |
0 |
0 |
0 |
0 |
0 |
|
Total |
1 |
0 |
0 |
0 |
0 |
1 |
0 |
2 |
0 |
0 |
0 |
2 |
1 |
2 |
0 |
0 |
0 |
3 |
|
Males |
507 |
217 |
78 |
9 |
0 |
811 |
95 |
538 |
78 |
13 |
0 |
724 |
602 |
755 |
156 |
22 |
0 |
1.535 |
| Total |
Females |
1.028 |
820 |
291 |
61 |
0 |
2.200 |
391 |
1.312 |
273 |
77 |
0 |
2.053 |
1.419 |
2.132 |
564 |
138 |
0 |
4.253 |
|
Total |
1.535 |
1.037 |
369 |
70 |
0 |
3.011 |
486 |
1.850 |
351 |
90 |
0 |
2.777 |
2021 |
2.887 |
720 |
160 |
0 |
5.788 |
Source: census 2010, QSA
ANNEXED NOTE
1. Technical Notes and Definitions
Reference period for census 2010: the night of April 21st, 2010.
Implementation method: census is based on de jure method; i.e. registering people according to their usual place of residence at time of census.
Populations in transit or visiting Qatar as tourists, as well as residents of public housing or visitors staying in a household for less than two months after night of reference were excluded.
Populations away from usual residence in Qatar for reasons of duty, or on a visit abroad for less than two months, as well as individuals with no personal housing within Qatar staying with a household for more than two months, are counted in their usual/ present residence during census night.
Population of reference: all individuals (nationals and non-nationals) present within the State’s borders during time of reference, including in labour camps.
Unemployed but worked before (old unemployed): The person (15 years or older) who is capable, prepared and searching for work, but not finding a job during the week ending on 20/04/2010, and he had worked in Qatar before.
Unemployed and never worked before (new unemployed): The person (15 years or older) who is capable, prepared and searching for work, but not finding a job during the week ending on 20/04/2010, and he had never worked in Qatar before.
2. Institution which provides data
Qatar Statistics Authority (QSA)
(http://www.qsa.gov.qa/eng/index.htm for website in English; http://www.qsa.gov.qa/Ar/index.htm for website in Arabic)
3. Data availability
None of Qatar censuses or other sources have ever disclosed figures of total population broken down by country of citizenship or even by nationality (Qatari/non-Qatari).
For 2010 data have been collected but remain withheld. The census only provides detailed data on population 15 years and above by nationality.
Released parts of census are available on the website of the QSA, in published form in PDF format.
https://www.mdps.gov.qa/en/statistics1/pages/topicslisting.aspx?parent=General&child=Census
Census 2010′ website:
https://www.mdps.gov.qa/en/statistics1/pages/topicslisting.aspx?parent=General&child=Census
2010′ census in Excel or PDF format individual tables:
http://www.qsa.gov.qa/QatarCensus/Census_Results.aspx
Date of access: June 2013.
| |
|
|
15-24 |
25-34 |
35-44 |
45-54 |
55-64 |
>65 |
Total |
| |
|
Males |
32 |
89 |
44 |
9 |
0 |
0 |
174 |
| |
Unemployed Worked Before |
Females |
63 |
105 |
94 |
61 |
0 |
0 |
323 |
| |
|
Total |
95 |
194 |
138 |
70 |
0 |
0 |
497 |
| |
|
Males |
475 |
128 |
34 |
0 |
0 |
0 |
637 |
| QATARIS |
Unemployed Never Worked Before |
Females |
965 |
715 |
197 |
0 |
0 |
0 |
1.877 |
| |
|
Total |
1440 |
843 |
231 |
0 |
0 |
0 |
2.514 |
| |
|
Males |
507 |
217 |
78 |
9 |
0 |
0 |
811 |
| |
Total Qataris unemployed |
Females |
1028 |
820 |
291 |
61 |
0 |
0 |
2200 |
| |
|
Total |
1535 |
1037 |
369 |
70 |
0 |
0 |
3011 |
| |
|
Males |
22 |
60 |
30 |
13 |
0 |
0 |
125 |
| |
Unemployed Worked Before |
Females |
52 |
334 |
184 |
77 |
0 |
0 |
647 |
| |
|
Total |
74 |
394 |
214 |
90 |
0 |
0 |
772 |
| |
|
Males |
73 |
478 |
48 |
0 |
0 |
0 |
599 |
| NON-QATARIS |
Unemployed Never Worked Before |
Females |
339 |
978 |
89 |
0 |
0 |
0 |
1406 |
| |
|
Total |
412 |
1456 |
137 |
0 |
0 |
0 |
2005 |
| |
|
Males |
95 |
538 |
78 |
13 |
0 |
0 |
724 |
| |
Total Non-Qataris unemployed |
Females |
391 |
1312 |
273 |
77 |
0 |
0 |
2053 |
| |
|
Total |
486 |
1850 |
351 |
90 |
0 |
0 |
2777 |
| |
|
Males |
54 |
149 |
74 |
22 |
0 |
0 |
299 |
| |
Total Unemployed Worked Before |
Females |
115 |
439 |
278 |
138 |
0 |
0 |
970 |
| |
|
Total |
169 |
588 |
352 |
160 |
0 |
0 |
1269 |
| |
|
Males |
548 |
606 |
82 |
0 |
0 |
0 |
1.236 |
| TOTAL |
Total Unemployed Never Worked Before |
Females |
1304 |
1693 |
286 |
0 |
0 |
0 |
3.283 |
| |
|
Total |
1852 |
2299 |
368 |
0 |
0 |
0 |
4.519 |
| |
|
Males |
602 |
755 |
156 |
22 |
0 |
0 |
1535 |
| |
TOTAL UNEMPLOYED |
Females |
1419 |
2132 |
564 |
138 |
0 |
0 |
4253 |
| |
|
Total |
2021 |
2887 |
720 |
160 |
0 |
0 |
5788 |
Source: census 2010, QSA
ANNEXED NOTE
1. Technical Notes and Definitions
Reference period for census 2010: the night of April 21st, 2010.
Implementation method: census is based on de jure method; i.e. registering people according to their usual place of residence at time of census.
Populations in transit or visiting Qatar as tourists, as well as residents of public housing or visitors staying in a household for less than two months after night of reference were excluded.
Populations away from usual residence in Qatar for reasons of duty, or on a visit abroad for less than two months, as well as individuals with no personal housing within Qatar staying with a household for more than two months, are counted in their usual/ present residence during census night.
Population of reference: all individuals (nationals and non-nationals) present within the State’s borders during time of reference, including in labour camps.
Unemployed but worked before (old unemployed): The person (15 years or older) who is capable, prepared and searching for work, but not finding a job during the week ending on 20/04/2010, and he had worked in Qatar before.
Unemployed and never worked before (new unemployed): The person (15 years or older) who is capable, prepared and searching for work, but not finding a job during the week ending on 20/04/2010, and he had never worked in Qatar before.
2. Institution which provides data
Qatar Statistics Authority (QSA)
(http://www.qsa.gov.qa/eng/index.htm for website in English; http://www.qsa.gov.qa/Ar/index.htm for website in Arabic)
3. Data availability
None of Qatar censuses or other sources have ever disclosed figures of total population broken down by country of citizenship or even by nationality (Qatari/non-Qatari).
For 2010 data have been collected but remain withheld. The census only provides detailed data on population 15 years and above by nationality.
Released parts of census are available on the website of the QSA, in published form in PDF format.
https://www.mdps.gov.qa/en/statistics1/pages/topicslisting.aspx?parent=General&child=Census
Census 2010′ website:
https://www.mdps.gov.qa/en/statistics1/pages/topicslisting.aspx?parent=General&child=Census
2010′ census in Excel or PDF format individual tables:
http://www.qsa.gov.qa/QatarCensus/Census_Results.aspx
Date of access: June 2013.
| |
|
Qataris |
Non-Qataris |
total |
| |
Males |
174 |
125 |
299 |
| Unemployed worked before |
Females |
323 |
647 |
970 |
| |
Total |
497 |
772 |
1.269 |
| |
Males |
637 |
599 |
1.236 |
| Unemployed never worked before |
Females |
1.877 |
1.406 |
3.283 |
| |
Total |
2.514 |
2.005 |
4.519 |
| |
Males |
811 |
724 |
1.535 |
| Total unemployed |
Females |
2.200 |
2.053 |
4.253 |
| |
Total |
3.011 |
2.777 |
5.788 |
Source: census 2010, QSA
ANNEXED NOTE
1. Technical Notes and Definitions
Reference period for census 2010: the night of April 21st, 2010.
Implementation method: census is based on de jure method; i.e. registering people according to their usual place of residence at time of census.
Populations in transit or visiting Qatar as tourists, as well as residents of public housing or visitors staying in a household for less than two months after night of reference were excluded.
Populations away from usual residence in Qatar for reasons of duty, or on a visit abroad for less than two months, as well as individuals with no personal housing within Qatar staying with a household for more than two months, are counted in their usual/ present residence during census night.
Population of reference: all individuals (nationals and non-nationals) present within the State’s borders during time of reference, including in labour camps.
Unemployed but worked before (old unemployed): The person (15 years or older) who is capable, prepared and searching for work, but not finding a job during the week ending on 20/04/2010, and he had worked in Qatar before.
Unemployed and never worked before (new unemployed): The person (15 years or older) who is capable, prepared and searching for work, but not finding a job during the week ending on 20/04/2010, and he had never worked in Qatar before.
2. Institution which provides data
Qatar Statistics Authority (QSA)
(http://www.qsa.gov.qa/eng/index.htm for website in English; http://www.qsa.gov.qa/Ar/index.htm for website in Arabic)
3. Data availability
None of Qatar censuses or other sources have ever disclosed figures of total population broken down by country of citizenship or even by nationality (Qatari/non-Qatari).
For 2010 data have been collected but remain withheld. The census only provides detailed data on population 15 years and above by nationality.
Released parts of census are available on the website of the QSA, in published form in PDF format.
https://www.mdps.gov.qa/en/statistics1/pages/topicslisting.aspx?parent=General&child=Census
Census 2010′ website:
https://www.mdps.gov.qa/en/statistics1/pages/topicslisting.aspx?parent=General&child=Census
2010′ census in Excel or PDF format individual tables:
http://www.qsa.gov.qa/QatarCensus/Census_Results.aspx
Date of access: June 2013.
|
in the labour force |
out of the labour force |
Total |
| |
Males |
Females |
total |
Males |
Females |
total |
Males |
Females |
Total |
| Qataris |
46.979 |
27.108 |
74.087 |
24.559 |
47.616 |
72.175 |
71.538 |
74.724 |
146.262 |
| Non-Qataris |
1.071.697 |
130.187 |
1.201.884 |
22.364 |
96.341 |
118.705 |
1.094.061 |
226.528 |
1.320.589 |
| Total |
1.118.676 |
157.295 |
1.275.971 |
46.923 |
143.957 |
190.880 |
1.165.599 |
301.252 |
1.466.851 |
Source: census 2010, QSA
ANNEXED NOTE
1. Technical Notes and Definitions
Reference period for census 2010: the night of April 21st, 2010.
Implementation method: census is based on de jure method; i.e. registering people according to their usual place of residence at time of census.
Populations in transit or visiting Qatar as tourists, as well as residents of public housing or visitors staying in a household for less than two months after night of reference were excluded.
Populations away from usual residence in Qatar for reasons of duty, or on a visit abroad for less than two months, as well as individuals with no personal housing within Qatar staying with a household for more than two months, are counted in their usual/ present residence during census night.
Population of reference: all individuals (nationals and non-nationals) present within the State’s borders during time of reference.
“2010′ census recorded all the residents. Eight questionnaires covering the key census areas were designed, in order to ensure that all units (establishments; buildings; residential units; houses and individuals) are covered by the census.”
The eight questionnaires are as follows:
1. Enumeration of buildings;
2. Enumeration of establishments, residential units and houses.
3. Survey of establishments (usage, et cetera);
4. Family living conditions;
5. Survey of labour camp residents;
6. Survey of public housing residents;
7. Survey of hotel residents and transit travellers through airports, ports and land border crossings;
8. Survey of Qataris living abroad.
2010′ census was the first conducted with the help of PDA devices (Personal Digital Assistant).
Relation with Labor Force:
(1) In labor force (for persons at the age of 15 or older):
a) Employed.
b) Unemployed. (2) Not in labor force.
(2) Outside labor force:
The persons capable, in terms of body and mind, to perform the economic activity but they do not practice it for reasons that keep them away from it, as follows:
a) Full time students.
b) Full time housewives.
c) Unemployed never worked before.
As for persons not classified as a source of labor force, they include:
1- Children below the specified age of labor force (less than 15 years old).
2- Old aged persons not engaged in productive work (65 years or more).
3- Disabled and invalids who are severely handicapped and cannot perform the economic activity
2. Institution which provides data
Qatar Statistics Authority (QSA)
(http://www.qsa.gov.qa/eng/index.htm for website in English; http://www.qsa.gov.qa/Ar/index.htm for website in Arabic)
3. Data availability
Released parts of census are available on the website of the QSA, in published form in PDF format.
https://www.mdps.gov.qa/en/statistics1/pages/topicslisting.aspx?parent=General&child=Census
Census 2010′ website:
https://www.mdps.gov.qa/en/statistics1/pages/topicslisting.aspx?parent=General&child=Census
2010′ census in Excel or PDF format individual tables:
http://www.qsa.gov.qa/QatarCensus/Census_Results.aspx
Date of access: June 2013.
|
QATARIS |
NON-QATARIS |
TOTAL POPULATION |
| |
10-14 |
15-24 |
25-34 |
35-44 |
45-54 |
55-64 |
>65 |
TOTAL |
10-14 |
15-24 |
25-34 |
35-44 |
45-54 |
55-64 |
>65 |
TOTAL |
10-14 |
15-24 |
25-34 |
35-44 |
45-54 |
55-64 |
>65 |
TOTAL |
| Males |
|
|
|
|
|
|
|
|
|
|
|
|
|
|
|
|
|
|
|
|
|
|
|
|
| Illiterate |
12 |
89 |
103 |
120 |
195 |
281 |
1010 |
1.810 |
21 |
6.815 |
14.286 |
9.878 |
4.855 |
2.309 |
719 |
38.883 |
33 |
6904 |
14389 |
9998 |
5050 |
2590 |
1729 |
40.693 |
| Read and write Night school |
6.691 |
543 |
414 |
474 |
807 |
770 |
1334 |
11.033 |
5.196 |
50.788 |
109.511 |
73.244 |
41.228 |
9.297 |
1.061 |
290.325 |
11.887 |
51331 |
109925 |
73718 |
42035 |
10067 |
2395 |
301.358 |
| Primary |
7.268 |
2.734 |
1.709 |
1.522 |
1.054 |
626 |
428 |
15.341 |
11.760 |
45.288 |
103.838 |
83.512 |
31.447 |
6.076 |
531 |
282.452 |
19.028 |
48.022 |
105.547 |
85.034 |
32.501 |
6702 |
959 |
297.793 |
| Preparatory |
305 |
10.415 |
2.989 |
1.703 |
1.188 |
499 |
224 |
17.323 |
1.902 |
19.320 |
44.536 |
44.655 |
10.982 |
2.155 |
225 |
123.775 |
2207 |
29.735 |
47.525 |
46.358 |
12.170 |
2654 |
449 |
141.098 |
| Vocational |
2 |
21 |
36 |
42 |
30 |
23 |
14 |
168 |
127 |
4.078 |
9.884 |
5.977 |
2.277 |
434 |
41 |
22.818 |
129 |
4099 |
9920 |
6019 |
2307 |
457 |
55 |
22986 |
| Secondary |
0 |
9.150 |
6.656 |
3.697 |
2.108 |
710 |
246 |
22.567 |
0 |
27.141 |
80.853 |
65.997 |
23.670 |
5.038 |
503 |
203.202 |
0 |
36.291 |
87.509 |
69.694 |
25.778 |
5748 |
749 |
225.769 |
| Post secondary |
0 |
506 |
556 |
557 |
459 |
204 |
43 |
2.325 |
0 |
3.618 |
11.517 |
8.733 |
4.161 |
1.263 |
157 |
29.449 |
0 |
4124 |
12073 |
9290 |
4620 |
1467 |
200 |
31.774 |
| University and above |
0 |
714 |
4.849 |
5.048 |
3.199 |
1211 |
206 |
15.227 |
0 |
6.547 |
44.096 |
38.052 |
22.778 |
9.251 |
1.406 |
122.130 |
0 |
7261 |
48.945 |
43.100 |
25.977 |
10462 |
1612 |
137.357 |
| Other |
3 |
10 |
10 |
1 |
0 |
0 |
1 |
25 |
8 |
22 |
10 |
0 |
1 |
0 |
0 |
41 |
11 |
32 |
20 |
1 |
1 |
0 |
1 |
66 |
| Total males |
14.281 |
24.182 |
17.322 |
13.164 |
9.040 |
4.324 |
3.506 |
85.819 |
19.014 |
163.617 |
418.531 |
330.048 |
141.399 |
35.823 |
4.643 |
1.113.075 |
33.295 |
187.799 |
435.853 |
343.212 |
150.439 |
40.147 |
8.149 |
1.198.894 |
| Females |
|
|
|
|
|
|
|
|
|
|
|
|
|
|
|
|
|
|
|
|
|
|
|
|
| Illiterate |
12 |
126 |
236 |
517 |
1042 |
1520 |
2320 |
5.773 |
21 |
999 |
2.398 |
1.981 |
1.337 |
774 |
602 |
8.112 |
33 |
1125 |
2634 |
2498 |
2379 |
2294 |
2922 |
13.885 |
| Read and write Night school |
6.258 |
522 |
583 |
811 |
1.440 |
1450 |
1190 |
12.254 |
4.966 |
6.005 |
19.458 |
13.649 |
7.215 |
1.731 |
449 |
53.473 |
11.224 |
6527 |
20041 |
14460 |
8.655 |
3181 |
1639 |
65.727 |
| Primary |
7.156 |
1.936 |
937 |
993 |
1.226 |
694 |
214 |
13.156 |
11.043 |
3.518 |
12.435 |
8.059 |
1.939 |
596 |
169 |
37.759 |
18.199 |
5.454 |
13372 |
9052 |
3.165 |
1290 |
383 |
50.915 |
| Preparatory |
306 |
8.863 |
1.448 |
1.217 |
1.152 |
332 |
45 |
13.363 |
1.926 |
9.876 |
11.902 |
3.003 |
1.388 |
392 |
95 |
28.582 |
2232 |
18.739 |
13.350 |
4.220 |
2.540 |
724 |
140 |
41.945 |
| Vocational |
0 |
0 |
1 |
4 |
0 |
0 |
0 |
5 |
0 |
49 |
172 |
117 |
52 |
14 |
5 |
409 |
0 |
49 |
173 |
121 |
52 |
14 |
5 |
414 |
| Secondary |
0 |
10.222 |
6.311 |
3.267 |
1.881 |
329 |
41 |
22.051 |
0 |
14.080 |
17.238 |
8.960 |
4.402 |
1.335 |
220 |
46.235 |
0 |
24.302 |
23.549 |
12.227 |
6.283 |
1664 |
261 |
68.286 |
| Post secondary |
0 |
539 |
539 |
299 |
235 |
84 |
7 |
1.703 |
0 |
1.305 |
4.135 |
2.741 |
1.354 |
396 |
55 |
9.986 |
0 |
1844 |
4674 |
3040 |
1589 |
480 |
62 |
11.689 |
| University and above |
0 |
1.266 |
8.133 |
6.883 |
3.386 |
436 |
22 |
20.126 |
0 |
5.371 |
27.638 |
17.179 |
7.369 |
2.114 |
232 |
59.903 |
0 |
6.637 |
35.771 |
24.062 |
10.755 |
2550 |
254 |
80.029 |
| Other |
4 |
9 |
7 |
4 |
1 |
2 |
2 |
29 |
4 |
12 |
6 |
5 |
2 |
0 |
0 |
29 |
8 |
21 |
13 |
9 |
3 |
2 |
2 |
58 |
| Total females |
13.736 |
23.483 |
18.195 |
13.995 |
10.363 |
4.847 |
3.841 |
88.460 |
17.960 |
41.215 |
95.382 |
55.694 |
25.058 |
7.352 |
1.827 |
244.488 |
31.696 |
64.698 |
113.577 |
69.689 |
35.421 |
12.199 |
5.668 |
332.948 |
| TOTAL |
|
|
|
|
|
|
|
|
|
|
|
|
|
|
|
|
|
|
|
|
|
|
|
|
| Illiterate |
24 |
215 |
339 |
637 |
1237 |
1801 |
3330 |
7.583 |
42 |
7.814 |
16.684 |
11.859 |
6.192 |
3.083 |
1.321 |
46.995 |
66 |
8029 |
17023 |
12496 |
7429 |
4884 |
4651 |
54.578 |
| Read and write Night school |
12.949 |
1.065 |
997 |
1.285 |
2.247 |
2220 |
2524 |
23.287 |
10.162 |
56.793 |
128.969 |
86.893 |
48.443 |
11.028 |
1.510 |
343.798 |
23.111 |
57.858 |
129966 |
88.178 |
50.690 |
13248 |
4034 |
367.085 |
| Primary |
14.424 |
4.670 |
2.646 |
2.515 |
2.280 |
1320 |
642 |
28.497 |
22.803 |
48.806 |
116.273 |
91.571 |
33.386 |
6.672 |
700 |
320.211 |
37.227 |
53.476 |
118.919 |
94.086 |
35.666 |
7992 |
1342 |
348.708 |
| Preparatory |
611 |
19.278 |
4.437 |
2.920 |
2.340 |
831 |
269 |
30.686 |
3.828 |
29.196 |
56.438 |
47.658 |
12.370 |
2.547 |
320 |
152.357 |
4439 |
48.474 |
60.875 |
50.578 |
14.710 |
3378 |
589 |
183.043 |
| Vocational |
2 |
21 |
37 |
46 |
30 |
23 |
14 |
173 |
127 |
4.127 |
10.056 |
6.094 |
2.329 |
448 |
46 |
23.227 |
129 |
4148 |
10093 |
6140 |
2359 |
471 |
60 |
23400 |
| Secondary |
0 |
19.372 |
12.967 |
6.964 |
3.989 |
1039 |
287 |
44.618 |
0 |
41.221 |
98.091 |
74.957 |
28.072 |
6.373 |
723 |
249.437 |
0 |
60.593 |
111.058 |
81.921 |
32.061 |
7412 |
1010 |
294.055 |
| Post secondary |
0 |
1.045 |
1.095 |
856 |
694 |
288 |
50 |
4.028 |
0 |
4.923 |
15.652 |
11.474 |
5.515 |
1.659 |
212 |
39.435 |
0 |
5.968 |
16.747 |
12330 |
6209 |
1947 |
262 |
43.463 |
| University and above |
0 |
1.980 |
12.982 |
11.931 |
6.585 |
1647 |
228 |
35.353 |
0 |
11.918 |
71.734 |
55.231 |
30.147 |
11.365 |
1.638 |
182.033 |
0 |
13.898 |
84.716 |
67.162 |
36.732 |
13012 |
1866 |
217.386 |
| Other |
7 |
19 |
17 |
5 |
1 |
2 |
3 |
54 |
12 |
34 |
16 |
5 |
3 |
0 |
0 |
70 |
19 |
53 |
33 |
10 |
4 |
2 |
3 |
124 |
| TOTAL |
28.017 |
47.665 |
35.517 |
27.159 |
19.403 |
9.171 |
7.347 |
174.279 |
36.974 |
204.832 |
513.913 |
385.742 |
166.457 |
43.175 |
6.470 |
1.357.563 |
64.991 |
252.497 |
549.430 |
412.901 |
185.860 |
52.346 |
13.817 |
1.531.842 |
Source: census 2010, QSA
ANNEXED NOTE
1. Technical Notes and Definitions
Reference period for census 2010: the night of April 21st, 2010.
Implementation method: census is based on de jure method; i.e. registering people according to their usual place of residence at time of census.
Populations in transit or visiting Qatar as tourists, as well as residents of public housing or visitors staying in a household for less than two months after night of reference were excluded.
Populations away from usual residence in Qatar for reasons of duty, or on a visit abroad for less than two months, as well as individuals with no personal housing within Qatar staying with a household for more than two months, are counted in their usual/ present residence during census night.
Population of reference: all individuals (nationals and non-nationals) present within the State’s borders during time of reference.
“2010′ census recorded all the residents. Eight questionnaires covering the key census areas were designed, in order to ensure that all units (establishments; buildings; residential units; houses and individuals) are covered by the census.”
The eight questionnaires are as follows:
1. Enumeration of buildings;
2. Enumeration of establishments, residential units and houses.
3. Survey of establishments (usage, et cetera);
4. Family living conditions;
5. Survey of labour camp residents;
6. Survey of public housing residents;
7. Survey of hotel residents and transit travellers through airports, ports and land border crossings;
8. Survey of Qataris living abroad.
2010′ census was the first conducted with the help of PDA devices (Personal Digital Assistant).
2. Institution which provides data
Qatar Statistics Authority (QSA)
(http://www.qsa.gov.qa/eng/index.htm for website in English; http://www.qsa.gov.qa/Ar/index.htm for website in Arabic)
3. Data availability
Released parts of census are available on the website of the QSA, in published form in PDF format.
https://www.mdps.gov.qa/en/statistics1/pages/topicslisting.aspx?parent=General&child=Census
Census 2010′ website:
https://www.mdps.gov.qa/en/statistics1/pages/topicslisting.aspx?parent=General&child=Census
2010′ census in Excel or PDF format individual tables:
http://www.qsa.gov.qa/QatarCensus/Census_Results.aspx
Date of access: June 2013.
| |
|
Qataris |
|
|
Non-Qataris |
|
|
TOTAL |
|
| |
Males |
Females |
Total |
Males |
Females |
Total |
Males |
Females |
Total |
| Illiterate |
1.810 |
5.773 |
7.583 |
38.883 |
8.112 |
46.995 |
40.693 |
13.885 |
54.578 |
| Read and Write; Night School |
11.033 |
12.254 |
23.287 |
290.325 |
53.473 |
343.798 |
301.358 |
65.727 |
367.085 |
| Primary |
15.341 |
13.156 |
28.497 |
282.452 |
37.759 |
320.211 |
297.793 |
50.915 |
348.708 |
| Preparatory |
17.323 |
13.363 |
30.686 |
123.775 |
28.582 |
152.357 |
141.098 |
41.945 |
183.043 |
| Vocational |
168 |
5 |
173 |
22.818 |
409 |
23.227 |
22.986 |
414 |
23.400 |
| Secondary |
22.567 |
22.051 |
44.618 |
203.202 |
46.235 |
249.437 |
225.769 |
68.286 |
294.055 |
| Post. Secondary |
2.325 |
1.703 |
4.028 |
29.449 |
9.986 |
39.435 |
31.774 |
11.689 |
43.463 |
| University and Above |
15.227 |
20.126 |
35.353 |
122.130 |
59.903 |
182.033 |
137.357 |
80.029 |
217.386 |
| Other |
25 |
29 |
54 |
41 |
29 |
70 |
66 |
58 |
124 |
| Total |
85.819 |
88.460 |
174.279 |
1.113.075 |
244.488 |
1.357.563 |
1.198.894 |
332.948 |
1.531.842 |
Source: census 2010, QSA
ANNEXED NOTE
1. Technical Notes and Definitions
Reference period for census 2010: the night of April 21st, 2010.
Implementation method: census is based on de jure method; i.e. registering people according to their usual place of residence at time of census.
Populations in transit or visiting Qatar as tourists, as well as residents of public housing or visitors staying in a household for less than two months after night of reference were excluded.
Populations away from usual residence in Qatar for reasons of duty, or on a visit abroad for less than two months, as well as individuals with no personal housing within Qatar staying with a household for more than two months, are counted in their usual/ present residence during census night.
Population of reference: all individuals (nationals and non-nationals) present within the State’s borders during time of reference.
“2010′ census recorded all the residents. Eight questionnaires covering the key census areas were designed, in order to ensure that all units (establishments; buildings; residential units; houses and individuals) are covered by the census.”
The eight questionnaires are as follows:
1. Enumeration of buildings;
2. Enumeration of establishments, residential units and houses.
3. Survey of establishments (usage, et cetera);
4. Family living conditions;
5. Survey of labour camp residents;
6. Survey of public housing residents;
7. Survey of hotel residents and transit travellers through airports, ports and land border crossings;
8. Survey of Qataris living abroad.
2010′ census was the first conducted with the help of PDA devices (Personal Digital Assistant).
2. Institution which provides data
Qatar Statistics Authority (QSA)
(http://www.qsa.gov.qa/eng/index.htm for website in English; http://www.qsa.gov.qa/Ar/index.htm for website in Arabic)
3. Data availability
Released parts of census are available on the website of the QSA, in published form in PDF format.
https://www.mdps.gov.qa/en/statistics1/pages/topicslisting.aspx?parent=General&child=Census
Census 2010′ website:
https://www.mdps.gov.qa/en/statistics1/pages/topicslisting.aspx?parent=General&child=Census
2010′ census in Excel or PDF format individual tables:
http://www.qsa.gov.qa/QatarCensus/Census_Results.aspx
Date of access: June 2013.
|
|
Qataris |
Non-Qataris |
Total |
| |
Males |
28.938 |
337.505 |
366.443 |
| Never Married |
Females |
28.141 |
61.775 |
89.916 |
| |
Total |
57.079 |
399.280 |
456.359 |
| |
Males |
41.422 |
744.877 |
786.299 |
| Married |
Females |
39.471 |
157.629 |
197.100 |
| |
Total |
80.893 |
902.506 |
983.399 |
| |
Males |
848 |
6.231 |
7.079 |
| Divorced |
Females |
2.515 |
3.314 |
5.829 |
| |
Total |
3.363 |
9.545 |
12.908 |
| |
Males |
330 |
5.448 |
5.778 |
| Widow |
Females |
4.597 |
3.810 |
8.407 |
| |
Total |
4.927 |
9.258 |
14.185 |
| |
Males |
71.538 |
1.094.061 |
1.165.599 |
| Total |
Females |
74.724 |
226.528 |
301.252 |
|
Total |
146.262 |
1.320.589 |
1.466.851 |
Source: census 2010, QSA
ANNEXED NOTE
1. Technical Notes and Definitions
Reference period for census 2010: the night of April 21st, 2010.
Implementation method: census is based on de jure method; i.e. registering people according to their usual place of residence at time of census.
Populations in transit or visiting Qatar as tourists, as well as residents of public housing or visitors staying in a household for less than two months after night of reference were excluded.
Populations away from usual residence in Qatar for reasons of duty, or on a visit abroad for less than two months, as well as individuals with no personal housing within Qatar staying with a household for more than two months, are counted in their usual/ present residence during census night.
Population of reference: all individuals (nationals and non-nationals) present within the State’s borders during time of reference.
“2010′ census recorded all the residents. Eight questionnaires covering the key census areas were designed, in order to ensure that all units (establishments; buildings; residential units; houses and individuals) are covered by the census.”
The eight questionnaires are as follows:
1. Enumeration of buildings;
2. Enumeration of establishments, residential units and houses.
3. Survey of establishments (usage, et cetera);
4. Family living conditions;
5. Survey of labour camp residents;
6. Survey of public housing residents;
7. Survey of hotel residents and transit travellers through airports, ports and land border crossings;
8. Survey of Qataris living abroad.
2010′ census was the first conducted with the help of PDA devices (Personal Digital Assistant).
2. Institution which provides data
Qatar Statistics Authority (QSA)
(http://www.qsa.gov.qa/eng/index.htm for website in English; http://www.qsa.gov.qa/Ar/index.htm for website in Arabic)
3. Data availability
Released parts of census are available on the website of the QSA, in published form in PDF format.
https://www.mdps.gov.qa/en/statistics1/pages/topicslisting.aspx?parent=General&child=Census
Census 2010′ website:
https://www.mdps.gov.qa/en/statistics1/pages/topicslisting.aspx?parent=General&child=Census
2010′ census in Excel or PDF format individual tables:
http://www.qsa.gov.qa/QatarCensus/Census_Results.aspx
Date of access: June 2013.
| POPULATION AGED 15 AND ABOVE |
TOTAL POPULATION |
| age |
|
Qataris |
|
Non-Qataris |
TOTAL |
MALES |
FEMALES |
TOTAL |
age |
| groups |
Males |
Females |
Total |
Males |
Females |
Total |
Males |
Females |
Total |
groups |
| |
|
|
|
|
|
|
|
|
|
10.042 |
9.523 |
19.565 |
< 1 |
| |
|
|
|
|
|
|
|
|
|
35.796 |
34.146 |
69.942 |
1-4 |
| |
|
|
|
|
|
|
|
|
|
40.007 |
38.079 |
78.086 |
5-9 |
| |
|
|
|
|
|
|
|
|
|
33.295 |
31.696 |
64.991 |
10-14 |
| 15-24 |
24.182 |
23.483 |
47.665 |
163.617 |
41.215 |
204.832 |
187.799 |
64.698 |
252.497 |
33.868 |
26.676 |
60.544 |
15-19 |
| |
|
|
|
|
|
|
|
|
|
153.931 |
38.022 |
191.953 |
20-24 |
| 25-34 |
17.322 |
18.195 |
35.517 |
418.531 |
95.382 |
513.913 |
435.853 |
113.577 |
549.430 |
219.575 |
59.612 |
279.187 |
25-29 |
| |
|
|
|
|
|
|
|
|
|
216.278 |
53.965 |
270.243 |
30-34 |
| 35-44 |
13.164 |
13.995 |
27.159 |
330.048 |
55.694 |
385.742 |
343.212 |
69.689 |
412.901 |
194.313 |
40.260 |
234.573 |
35-39 |
| |
|
|
|
|
|
|
|
|
|
148.899 |
29.429 |
178.328 |
40-44 |
| 45-54 |
9.040 |
10.363 |
19.403 |
141.399 |
25.058 |
166.457 |
150.439 |
35.421 |
185.860 |
95.688 |
21.252 |
116.940 |
45-49 |
| |
|
|
|
|
|
|
|
|
|
54.751 |
14.169 |
68.920 |
50-54 |
| 55-64 |
4.324 |
4.847 |
9.171 |
35.823 |
7.352 |
43.175 |
40.147 |
12.199 |
52.346 |
29.327 |
8.050 |
37.377 |
55-59 |
| |
|
|
|
|
|
|
|
|
|
10.820 |
4.149 |
14.969 |
60-64 |
| >65 |
3.506 |
3.841 |
7.347 |
4.643 |
1.827 |
6.470 |
8.149 |
5.668 |
13.817 |
4.075 |
2.379 |
6.454 |
65-69 |
| |
|
|
|
|
|
|
|
|
|
2.108 |
1.529 |
3.637 |
70-74 |
| |
|
|
|
|
|
|
|
|
|
1.966 |
1.760 |
3.726 |
>75 |
| TOTAL 15+ |
71.538 |
74.724 |
146.262 |
1.094.061 |
226.528 |
1.320.589 |
1.165.599 |
301.252 |
1.466.851 |
|
|
|
|
| TOTAL |
|
|
|
|
|
|
|
|
|
1.284.739 |
414.696 |
1.699.435 |
TOTAL |
Source: census 2010, QSA
ANNEXED NOTE
1. Technical Notes and Definitions
Reference period for census 2010: the night of April 21st, 2010.
Implementation method: census is based on de jure method; i.e. registering people according to their usual place of residence at time of census.
Populations in transit or visiting Qatar as tourists, as well as residents of public housing or visitors staying in a household for less than two months after night of reference were excluded.
Populations away from usual residence in Qatar for reasons of duty, or on a visit abroad for less than two months, as well as individuals with no personal housing within Qatar staying with a household for more than two months, are counted in their usual/ present residence during census night.
Population of reference: all individuals (nationals and non-nationals) present within the State’s borders during time of reference.
“2010′ census recorded all the residents. Eight questionnaires covering the key census areas were designed, in order to ensure that all units (establishments; buildings; residential units; houses and individuals) are covered by the census.”
The eight questionnaires are as follows:
1. Enumeration of buildings;
2. Enumeration of establishments, residential units and houses.
3. Survey of establishments (usage, et cetera);
4. Family living conditions;
5. Survey of labour camp residents;
6. Survey of public housing residents;
7. Survey of hotel residents and transit travellers through airports, ports and land border crossings;
8. Survey of Qataris living abroad.
2010′ census was the first conducted with the help of PDA devices (Personal Digital Assistant).
2. Institution which provides data
Qatar Statistics Authority (QSA)
(http://www.qsa.gov.qa/eng/index.htm for website in English; http://www.qsa.gov.qa/Ar/index.htm for website in Arabic)
3. Data availability
Released parts of census are available on the website of the QSA, in published form in PDF format.
https://www.mdps.gov.qa/en/statistics1/pages/topicslisting.aspx?parent=General&child=Census
Census 2010′ website:
https://www.mdps.gov.qa/en/statistics1/pages/topicslisting.aspx?parent=General&child=Census
2010′ census in Excel or PDF format individual tables:
http://www.qsa.gov.qa/QatarCensus/Census_Results.aspx
Date of access: June 2013.
|
Qataris |
Non-Qataris |
Total |
| Census |
males |
females |
total |
males |
females |
total |
males |
females |
total |
| 1986 |
49,684 |
50,070 |
99,754 |
200,641 |
72,997 |
273,638 |
250,325 |
123,067 |
373,392 |
| 1997 |
75,881 |
75,792 |
151,673 |
277,905 |
106,896 |
384,801 |
353,786 |
182,688 |
536,474 |
| 2004 |
95,703 |
96,883 |
192,586 |
450,411 |
155,064 |
605,475 |
546,114 |
251,947 |
798,061 |
| 2010 |
120,736 |
122,337 |
243,073 |
1,164,003 |
292,359 |
1,456,362 |
1,284,739 |
414,696 |
1,699,435 |
Source: GLMM calculations on the basis of QSA data
ANNEXED NOTE
1. Technical Notes and Definitions
Reference periods for each census: the nights of March 16th, 1986; March 1st, 1997; March 16th, 2004 and April 21st, 2010 respectively.
Implementation method: censuses are based on de jure method; i.e. registering people according to their usual place of residence at time of census.
Populations in transit or visiting Qatar as tourists, as well as residents of public housing or visitors staying in a household for less than two months after night of reference were excluded.
Populations away from usual residence in Qatar for reasons of duty, or on a visit abroad for less than two months, as well as individuals with no personal housing within Qatar staying with a household for more than two months, are counted in their usual/ present residence during census night.
Population of reference: all individuals (nationals and non-nationals) present within the State’s borders during time of reference.
Prior to 2010′ census, only a sample of foreign residents was covered in census.
“2010′ census recorded all the residents. Eight questionnaires covering the key census areas were designed, in order to ensure that all units (establishments; buildings; residential units; houses and individuals) are covered by the census.”
The eight questionnaires are as follows:
1. Enumeration of buildings;
2. Enumeration of establishments, residential units and houses.
3. Survey of establishments (usage, et cetera);
4. Family living conditions;
5. Survey of labour camp residents;
6. Survey of public housing residents;
7. Survey of hotel residents and transit travellers through airports, ports and land border crossings;
8. Survey of Qataris living abroad.
2010′ census was the first conducted with the help of PDA devices (Personal Digital Assistant).
2. Institution which provides data
Qatar Statistics Authority (QSA)
(http://www.qsa.gov.qa/eng/index.htm for website in English; http://www.qsa.gov.qa/Ar/index.htm for website in Arabic)
3. Data availability
Released parts of censuses (1986; 1997; 2004; 2010) are available on the website of the QSA, in published form in PDF format.
https://www.mdps.gov.qa/en/statistics1/pages/topicslisting.aspx?parent=General&child=Census
Census 2010′ website:
https://www.mdps.gov.qa/en/statistics1/pages/topicslisting.aspx?parent=General&child=Census
2010′ census in Excel or PDF format individual tables:
http://www.qsa.gov.qa/QatarCensus/Census_Results.aspx
Date of access: June 2013.
| Degree prepared |
Doctorate |
Master |
Bachelor |
Associate |
Diploma |
Other |
Total |
| Specialization |
Males |
Females |
Males |
Females |
Males |
Females |
Males |
Females |
Males |
Females |
Males |
Females |
Males |
Females |
| Economy and Administration |
|
|
|
|
|
|
|
|
|
|
|
|
|
|
| Business , Management, and Related Support Services |
0 |
0 |
3 |
6 |
36 |
11 |
0 |
0 |
0 |
0 |
0 |
0 |
39 |
17 |
| Public Administration and Social Service professions |
0 |
0 |
0 |
0 |
1 |
0 |
0 |
0 |
0 |
0 |
0 |
0 |
1 |
0 |
| Engineering |
|
|
|
|
|
|
|
|
|
|
|
|
|
|
| Architecture and Related Services |
0 |
0 |
0 |
0 |
1 |
1 |
0 |
0 |
0 |
0 |
0 |
0 |
1 |
1 |
| Engineering Technologies / Technicians |
0 |
0 |
0 |
0 |
2 |
1 |
0 |
0 |
0 |
0 |
0 |
0 |
2 |
1 |
| Engineering |
1 |
0 |
0 |
0 |
41 |
10 |
0 |
0 |
0 |
0 |
0 |
0 |
42 |
10 |
| Arts and Sciences |
|
|
|
|
|
|
|
|
|
|
|
|
|
|
| Biological and Biomedical Sciences |
0 |
1 |
0 |
0 |
1 |
2 |
0 |
0 |
0 |
0 |
0 |
0 |
1 |
3 |
| college preparation |
0 |
0 |
2 |
0 |
0 |
0 |
0 |
0 |
0 |
0 |
6 |
0 |
8 |
0 |
| Communication , Journalism, and Related Programs |
0 |
0 |
0 |
0 |
1 |
0 |
0 |
0 |
0 |
0 |
0 |
0 |
1 |
0 |
| Computer and information Sciences and Support Services |
0 |
0 |
0 |
1 |
1 |
1 |
0 |
0 |
0 |
0 |
0 |
0 |
1 |
2 |
| Education |
0 |
2 |
0 |
2 |
0 |
0 |
0 |
0 |
0 |
0 |
0 |
0 |
0 |
4 |
| English Language and Litterature/Humanities |
0 |
0 |
0 |
1 |
0 |
0 |
0 |
0 |
0 |
0 |
0 |
0 |
0 |
1 |
| Family and Consumer Sciences/Human sciences |
0 |
0 |
0 |
1 |
0 |
0 |
0 |
0 |
0 |
0 |
0 |
0 |
0 |
1 |
| Foreign Languages, litteratures and linguistics |
0 |
0 |
0 |
0 |
0 |
0 |
0 |
0 |
0 |
0 |
3 |
1 |
3 |
1 |
| Health Professions and Related Clinical Sciences |
0 |
0 |
0 |
1 |
3 |
2 |
0 |
0 |
0 |
0 |
0 |
0 |
3 |
3 |
| Liberal Art and Science, General Studies and Humanities |
0 |
0 |
0 |
1 |
1 |
1 |
0 |
0 |
0 |
0 |
0 |
0 |
1 |
2 |
| Library Science |
0 |
0 |
0 |
1 |
0 |
0 |
0 |
0 |
0 |
0 |
0 |
0 |
0 |
1 |
| Philosophy and Religious Studies |
1 |
0 |
6 |
1 |
0 |
0 |
0 |
0 |
0 |
0 |
0 |
0 |
7 |
1 |
| Physical Sciences |
0 |
0 |
0 |
0 |
1 |
0 |
0 |
0 |
0 |
0 |
0 |
0 |
1 |
0 |
| Social Sciences |
0 |
0 |
1 |
2 |
4 |
8 |
0 |
0 |
0 |
0 |
0 |
0 |
5 |
10 |
| Visual and Performing Arts |
0 |
0 |
0 |
0 |
1 |
0 |
0 |
0 |
0 |
0 |
0 |
0 |
1 |
0 |
| Other |
0 |
0 |
0 |
0 |
0 |
0 |
0 |
0 |
0 |
0 |
1 |
0 |
1 |
0 |
| Law and Political Science |
|
|
|
|
|
|
|
|
|
|
|
|
|
|
| legal Professions and Studies |
2 |
1 |
4 |
1 |
4 |
3 |
0 |
0 |
0 |
0 |
0 |
0 |
10 |
5 |
| GRAND TOTAL |
4 |
4 |
16 |
18 |
98 |
40 |
0 |
0 |
0 |
0 |
10 |
1 |
128 |
63 |
Source: Qatar Foundation, Supreme Council for Education, Universities
ANNEXED NOTE
Students on scholarship are sponsored by the State of Qatar or by another body. The figures presented here do not take into account Qatar students abroad, living on their own expense, if any.
Institution which provides data
Qatar Statistics Authority
Data availability
These data on education have been found in the “Education” chapter of 2012’s Statistical Yearbook.
https://www.mdps.gov.qa/en/statistics1/pages/topicslisting.aspx?parent=General&child=StatisticalAbstract
QSA publishes Statistical Yearbooks available online, in Excel (certain thematic chapters since 2010) and PDF format, up to 1980’s issue. However, recently they seem not to be published yearly as a complete volume and thematic chapters are published separately.
Issues 1980 to 2009 are available on the Qatar Information Exchange website, accessible from QSA’ website (English and Arabic website)
http://www.qix.gov.qa/portal/page/portal/QIXPOC/Documents/QIX%20Knowledge%20Base/Publication/General%20Statistics/Annual%20Abstract
Last date of access: June 27th, 2013.
| |
2008/2009 |
2009/2010 |
2010/2011 |
| |
|
Scholarships |
|
Graduates |
|
|
Scholarships |
|
Graduates |
|
|
Scholarships |
|
Graduates |
|
| |
Males |
Females |
Total |
Males |
Females |
Total |
Males |
Females |
Total |
Males |
Females |
Total |
Males |
Females |
Total |
Males |
Females |
Total |
| Doctorate |
4 |
3 |
7 |
2 |
5 |
7 |
3 |
0 |
3 |
5 |
4 |
9 |
4 |
4 |
8 |
3 |
5 |
8 |
| Master |
8 |
6 |
14 |
9 |
8 |
17 |
17 |
8 |
25 |
2 |
4 |
6 |
16 |
18 |
34 |
7 |
4 |
11 |
| Bachelor |
57 |
14 |
71 |
48 |
21 |
69 |
87 |
32 |
119 |
31 |
30 |
61 |
98 |
40 |
138 |
35 |
21 |
56 |
| Associate |
0 |
0 |
0 |
0 |
0 |
0 |
0 |
0 |
0 |
0 |
0 |
0 |
0 |
0 |
0 |
0 |
0 |
0 |
| Diploma |
0 |
0 |
0 |
0 |
0 |
0 |
0 |
0 |
0 |
0 |
0 |
0 |
0 |
0 |
0 |
0 |
0 |
0 |
| Other Degree |
4 |
0 |
4 |
0 |
2 |
2 |
6 |
2 |
8 |
7 |
0 |
7 |
10 |
1 |
11 |
3 |
0 |
3 |
| Total |
73 |
23 |
96 |
59 |
36 |
95 |
113 |
42 |
155 |
45 |
38 |
83 |
128 |
63 |
191 |
48 |
30 |
78 |
Source: Qatar Foundation, Supreme Council for Education, Universities
ANNEXED NOTE
Students on scholarship are sponsored by the State of Qatar or by another body. The figures presented here do not take into account Qatar students abroad, living on their own expense, if any.
Institution which provides data
Qatar Statistics Authority
Data availability
These data on education have been found in the “Education” chapter of 2012’s Statistical Yearbook.
https://www.mdps.gov.qa/en/statistics1/pages/topicslisting.aspx?parent=General&child=StatisticalAbstract
QSA publishes Statistical Yearbooks available online, in Excel (certain thematic chapters since 2010) and PDF format, up to 1980’s issue. However, recently they seem not to be published yearly as a complete volume and thematic chapters are published separately.
Issues 1980 to 2009 are available on the Qatar Information Exchange website, accessible from QSA’ website (English and Arabic website)
http://www.qix.gov.qa/portal/page/portal/QIXPOC/Documents/QIX%20Knowledge%20Base/Publication/General%20Statistics/Annual%20Abstract
Last date of access: June 27th, 2013.
| |
|
2008/2009 |
|
|
2009/2010 |
|
|
2010/2011 |
|
| |
Males |
Females |
Total |
Males |
Females |
Total |
Males |
Females |
Total |
| Saudi Arabia |
3 |
0 |
3 |
2 |
0 |
2 |
3 |
0 |
3 |
| United Arab Emirates |
0 |
0 |
0 |
0 |
0 |
0 |
1 |
0 |
1 |
| Egypt |
0 |
0 |
0 |
0 |
0 |
0 |
2 |
2 |
4 |
| Jordan |
0 |
0 |
0 |
0 |
0 |
0 |
1 |
1 |
2 |
| Lebanon |
0 |
0 |
0 |
0 |
0 |
0 |
1 |
1 |
2 |
| Malaysia |
0 |
0 |
0 |
0 |
0 |
0 |
2 |
0 |
2 |
| Singapore |
0 |
0 |
0 |
1 |
0 |
1 |
0 |
0 |
0 |
| United Kingdom |
23 |
13 |
36 |
39 |
29 |
68 |
66 |
49 |
115 |
| France |
5 |
0 |
5 |
2 |
0 |
2 |
6 |
0 |
6 |
| Germany |
0 |
0 |
0 |
0 |
0 |
0 |
2 |
1 |
3 |
| Italy |
0 |
0 |
0 |
0 |
0 |
0 |
1 |
0 |
1 |
| Ireland |
0 |
0 |
0 |
0 |
0 |
0 |
1 |
1 |
2 |
| Spain |
0 |
0 |
0 |
0 |
1 |
1 |
0 |
0 |
0 |
| Japan |
0 |
0 |
0 |
1 |
0 |
1 |
0 |
0 |
0 |
| United States |
36 |
9 |
45 |
67 |
11 |
78 |
34 |
6 |
40 |
| Canada |
1 |
1 |
2 |
0 |
0 |
0 |
3 |
2 |
5 |
| Australia |
4 |
0 |
4 |
0 |
1 |
1 |
3 |
0 |
3 |
| Other |
1 |
0 |
1 |
1 |
0 |
1 |
2 |
0 |
2 |
| TOTAL |
73 |
23 |
96 |
113 |
42 |
155 |
128 |
63 |
191 |
Source: Qatar Foundation, Supreme Council for Education, Universities
ANNEXED NOTE
Students on scholarship are sponsored by the State of Qatar or by another body. The figures presented here do not take into account Qatar students abroad, living on their own expense, if any.
Institution which provides data
Qatar Statistics Authority
Data availability
These data on education have been found in the “Education” chapter of 2012’s Statistical Yearbook.
https://www.mdps.gov.qa/en/statistics1/pages/topicslisting.aspx?parent=General&child=StatisticalAbstract
QSA publishes Statistical Yearbooks available online, in Excel (certain thematic chapters since 2010) and PDF format, up to 1980’s issue. However, recently they seem not to be published yearly as a complete volume and thematic chapters are published separately.
Issues 1980 to 2009 are available on the Qatar Information Exchange website, accessible from QSA’ website (English and Arabic website)
http://www.qix.gov.qa/portal/page/portal/QIXPOC/Documents/QIX%20Knowledge%20Base/Publication/General%20Statistics/Annual%20Abstract
Last date of access: June 27th, 2013.
| |
|
Qataris |
Non-Qataris |
| |
|
15-24 |
25-34 |
35-44 |
45-54 |
55-64 |
>65 |
Total |
15-24 |
25-34 |
35-44 |
45-54 |
55-64 |
>65 |
Total |
| |
Males |
14.035 |
674 |
2 |
0 |
0 |
0 |
14.711 |
18.060 |
1.102 |
5 |
0 |
0 |
0 |
19.167 |
| Student |
Females |
14.644 |
679 |
4 |
0 |
0 |
0 |
15.327 |
17.018 |
1.088 |
17 |
0 |
0 |
0 |
18.123 |
| |
Total |
28.679 |
1.353 |
6 |
0 |
0 |
0 |
30.038 |
35.078 |
2.190 |
22 |
0 |
0 |
0 |
37.290 |
| |
Males |
0 |
0 |
0 |
0 |
0 |
0 |
0 |
0 |
0 |
0 |
0 |
0 |
0 |
0 |
| Homemaker |
Females |
3.358 |
6.030 |
5.051 |
5.647 |
3.779 |
2.757 |
26.622 |
7.931 |
28.927 |
21.576 |
11.029 |
4.496 |
1.417 |
75.376 |
| |
Total |
3.358 |
6.030 |
5.051 |
5.647 |
3.779 |
2.757 |
26.622 |
7.931 |
28.927 |
21.576 |
11.029 |
4.496 |
1.417 |
75.376 |
| |
Males |
0 |
91 |
594 |
1.967 |
2.216 |
886 |
5.754 |
0 |
0 |
0 |
0 |
0 |
0 |
0 |
| Retired |
Females |
0 |
43 |
527 |
1.658 |
394 |
0 |
2.622 |
0 |
0 |
0 |
0 |
0 |
0 |
0 |
| |
Total |
0 |
134 |
1.121 |
3.625 |
2.610 |
886 |
8.376 |
0 |
0 |
0 |
0 |
0 |
0 |
0 |
| |
Males |
128 |
142 |
115 |
103 |
96 |
1.768 |
2.352 |
138 |
121 |
63 |
44 |
102 |
237 |
705 |
| Unable to Work |
Females |
70 |
65 |
72 |
148 |
267 |
706 |
1.328 |
57 |
57 |
34 |
27 |
55 |
139 |
369 |
| |
Total |
198 |
207 |
187 |
251 |
363 |
2.474 |
3.680 |
195 |
178 |
97 |
71 |
157 |
376 |
1.074 |
| |
Males |
436 |
216 |
141 |
154 |
183 |
443 |
1.573 |
192 |
119 |
54 |
111 |
242 |
333 |
1.051 |
| Not Seeking Work |
Females |
543 |
269 |
224 |
165 |
155 |
359 |
1.715 |
539 |
476 |
269 |
136 |
95 |
64 |
1.579 |
| |
Total |
979 |
485 |
365 |
319 |
338 |
802 |
3.288 |
731 |
595 |
323 |
247 |
337 |
397 |
2.630 |
| |
Males |
18 |
58 |
53 |
34 |
4 |
2 |
169 |
256 |
473 |
284 |
156 |
143 |
129 |
1.441 |
| Other |
Females |
0 |
2 |
0 |
0 |
0 |
0 |
2 |
111 |
305 |
196 |
138 |
100 |
44 |
894 |
| |
Total |
18 |
60 |
53 |
34 |
4 |
2 |
171 |
367 |
778 |
480 |
294 |
243 |
173 |
2.335 |
| |
Males |
14.617 |
1.181 |
905 |
2.258 |
2.499 |
3.099 |
24.559 |
18.646 |
1.815 |
406 |
311 |
487 |
699 |
22.364 |
| TOTAL |
Females |
18.615 |
7.088 |
5.878 |
7.618 |
4.595 |
3.822 |
47.616 |
25.656 |
30.853 |
22.092 |
11.330 |
4.746 |
1.664 |
96.341 |
| |
Total |
33.232 |
8.269 |
6.783 |
9.876 |
7.094 |
6.921 |
72.175 |
44.302 |
32.668 |
22.498 |
11.641 |
5.233 |
2.363 |
118.705 |
Source: census 2010, QSA
ANNEXED NOTE
1. Technical Notes and Definitions
Reference period for census 2010: the night of April 21st, 2010.
Implementation method: census is based on de jure method; i.e. registering people according to their usual place of residence at time of census.
Populations in transit or visiting Qatar as tourists, as well as residents of public housing or visitors staying in a household for less than two months after night of reference were excluded.
Populations away from usual residence in Qatar for reasons of duty, or on a visit abroad for less than two months, as well as individuals with no personal housing within Qatar staying with a household for more than two months, are counted in their usual/ present residence during census night.
Population of reference: all individuals (nationals and non-nationals) present within the State’s borders during time of reference, including in labour camps.
Inactive population:
Full-time student: The person (15 years or older) enrolled in any educational institution as a full-time persistent student with purpose of attaining an academic degree, irrespective of whether the schooling hours are in the morning or evening. Any trainee enrolled in vocational training institutes is regarded as a full-time student.
Full-time housewife: The female (15 years or older) who is fully engaged in home management and family care, and does not practice any other work
Retired: The person who is not working but capable of work, does not look for work during the week ending on 20/04/2010 and gets a fixed pension for work he had joined before
Disabled: The person (15 years or older) who is not capable of work due to illness, handicap or old age.
Not searching for work: The person (15 years or older) who is capable of work but not working or searching for work and he is not enrolled in any of the educational institutes. Such person is called “economically self-sufficient”.
Others: Any cases encountered by the enumerator other than the above mentioned e.g. inmates of jails, health resorts, hospitals, etc not engaged with work).
2. Institution which provides data
Qatar Statistics Authority (QSA)
(http://www.qsa.gov.qa/eng/index.htm for website in English; http://www.qsa.gov.qa/Ar/index.htm for website in Arabic)
3. Data availability
None of Qatar censuses or other sources have ever disclosed figures of total population broken down by country of citizenship or even by nationality (Qatari/non-Qatari).
For 2010 data have been collected but remain withheld. The census only provides detailed data on population 15 years and above by nationality.
Released parts of census are available on the website of the QSA, in published form in PDF format.
https://www.mdps.gov.qa/en/statistics1/pages/topicslisting.aspx?parent=General&child=Census
Census 2010′ website:
https://www.mdps.gov.qa/en/statistics1/pages/topicslisting.aspx?parent=General&child=Census
2010′ census in Excel or PDF format individual tables:
http://www.qsa.gov.qa/QatarCensus/Census_Results.aspx
Date of access: June 2013.
| |
|
Qataris |
|
|
Non-Qataris |
|
|
TOTAL |
|
| |
Males |
Females |
Total |
Males |
Females |
Total |
Males |
Females |
Total |
| 15-24 |
14.617 |
18615 |
33232 |
18.646 |
25.656 |
44.302 |
33.263 |
44.271 |
77.534 |
| 25-34 |
1.181 |
7088 |
8269 |
1.815 |
30.853 |
32.668 |
2.996 |
37.941 |
40.937 |
| 35-44 |
905 |
5878 |
6783 |
406 |
22.092 |
22.498 |
1.311 |
27.970 |
29.281 |
| 45-54 |
2.258 |
7618 |
9876 |
311 |
11.330 |
11.641 |
2.569 |
18.948 |
21.517 |
| 55-64 |
2.499 |
4595 |
7094 |
487 |
4.746 |
5.233 |
2.986 |
9.341 |
12.327 |
| >65 |
3.099 |
3822 |
6921 |
699 |
1.664 |
2.363 |
3.798 |
5.486 |
9.284 |
| Total |
24.559 |
47.616 |
72.175 |
22.364 |
96.341 |
118.705 |
46.923 |
143.957 |
190.880 |
Source: census 2010, QSA
ANNEXED NOTE
1. Technical Notes and Definitions
Reference period for census 2010: the night of April 21st, 2010.
Implementation method: census is based on de jure method; i.e. registering people according to their usual place of residence at time of census.
Populations in transit or visiting Qatar as tourists, as well as residents of public housing or visitors staying in a household for less than two months after night of reference were excluded.
Populations away from usual residence in Qatar for reasons of duty, or on a visit abroad for less than two months, as well as individuals with no personal housing within Qatar staying with a household for more than two months, are counted in their usual/ present residence during census night.
Population of reference: all individuals (nationals and non-nationals) present within the State’s borders during time of reference, including in labour camps.
Inactive population:
Full-time student: The person (15 years or older) enrolled in any educational institution as a full-time persistent student with purpose of attaining an academic degree, irrespective of whether the schooling hours are in the morning or evening. Any trainee enrolled in vocational training institutes is regarded as a full-time student.
Full-time housewife: The female (15 years or older) who is fully engaged in home management and family care, and does not practice any other work
Retired: The person who is not working but capable of work, does not look for work during the week ending on 20/04/2010 and gets a fixed pension for work he had joined before
Disabled: The person (15 years or older) who is not capable of work due to illness, handicap or old age.
Not searching for work: The person (15 years or older) who is capable of work but not working or searching for work and he is not enrolled in any of the educational institutes. Such person is called “economically self-sufficient”.
Others: Any cases encountered by the enumerator other than the above mentioned e.g. inmates of jails, health resorts, hospitals, etc not engaged with work).
2. Institution which provides data
Qatar Statistics Authority (QSA)
(http://www.qsa.gov.qa/eng/index.htm for website in English; http://www.qsa.gov.qa/Ar/index.htm for website in Arabic)
3. Data availability
None of Qatar censuses or other sources have ever disclosed figures of total population broken down by country of citizenship or even by nationality (Qatari/non-Qatari).
For 2010 data have been collected but remain withheld. The census only provides detailed data on population 15 years and above by nationality.
Released parts of census are available on the website of the QSA, in published form in PDF format.
https://www.mdps.gov.qa/en/statistics1/pages/topicslisting.aspx?parent=General&child=Census
Census 2010′ website:
https://www.mdps.gov.qa/en/statistics1/pages/topicslisting.aspx?parent=General&child=Census
2010′ census in Excel or PDF format individual tables:
http://www.qsa.gov.qa/QatarCensus/Census_Results.aspx
Date of access: June 2013.
| Sector of higher education |
Establishment |
|
Qatari |
|
|
Non-Qatari |
|
|
Total |
|
| Males |
Females |
Total |
Males |
Females |
Total |
Males |
Females |
Total |
| Public |
Qatar University and Community College |
1.089 |
4.920 |
6.009 |
1.250 |
2.534 |
3.784 |
2.339 |
7.454 |
9.793 |
| |
Qatar Foundation(a) |
272 |
557 |
829 |
581 |
482 |
1.063 |
853 |
1.039 |
1.892 |
| |
North Atlantic College |
1.252 |
470 |
1.722 |
443 |
327 |
770 |
1.695 |
797 |
2.492 |
| Private |
Stenden University Qatar |
74 |
136 |
210 |
125 |
147 |
272 |
199 |
283 |
482 |
| |
Calgary University Qatar |
2 |
64 |
66 |
15 |
98 |
113 |
17 |
162 |
179 |
| |
Qatar College of Aeronautics |
233 |
95 |
328 |
162 |
24 |
186 |
395 |
119 |
514 |
| |
Total |
1.833 |
1.322 |
3.155 |
1.326 |
1.078 |
2.404 |
3.159 |
2.400 |
5.559 |
| TOTAL |
2.922 |
6.242 |
9.164 |
2.576 |
3.612 |
6.188 |
5.498 |
9.854 |
15.352 |
Source: Qatar Foundation and Universities
ANNEXED NOTE
(a) Includes the Academic Bridge Program (a programme at Qatar Foundation which aims at preparing graduates of high schools in Qatar for admission to foreign English language universities);
Texas A&M; Virginia U.; Georgetown U.; Carnegie Mellon U.; Weill Cornell U.; Islamic studies; Northwestern U.
Institution which provides data
Qatar Statistics Authority
Data availability
These data on education have been found in the “Education” chapter of 2012’s Statistical Yearbook.
https://www.mdps.gov.qa/en/statistics1/pages/topicslisting.aspx?parent=General&child=StatisticalAbstract
QSA publishes Statistical Yearbooks available online, in Excel (certain thematic chapters since 2010) and PDF format, up to 1980’s issue. However, recently they seem not to be published yearly as a complete volume and thematic chapters are published separately.
Issues 1980 to 2009 are available on the Qatar Information Exchange website, accessible from QSA’ website (English and Arabic website)
http://www.qix.gov.qa/portal/page/portal/QIXPOC/Documents/QIX%20Knowledge%20Base/Publication/General%20Statistics/Annual%20Abstract
Last date of access: June 27th, 2013.
| Country of citizenship |
Males |
Females |
Total |
| Qatar |
1.089 |
4.920 |
6.009 |
| U.A.E. |
2 |
31 |
33 |
| Bahrain |
22 |
107 |
129 |
| Kuwait |
3 |
11 |
14 |
| Saudi Arabia |
32 |
117 |
149 |
| Oman |
40 |
142 |
182 |
| Gulf Countries |
1.188 |
5.328 |
6.516 |
| Iraq |
38 |
70 |
108 |
| Yemen |
98 |
270 |
368 |
| Palestine |
181 |
371 |
552 |
| Jordan |
141 |
285 |
426 |
| Egypt |
174 |
219 |
393 |
| Syria |
59 |
112 |
171 |
| Lebanon |
15 |
33 |
48 |
| Sudan |
89 |
189 |
278 |
| Somalia |
32 |
45 |
77 |
| Tunisia |
12 |
36 |
48 |
| Algeria |
14 |
39 |
53 |
| Mauritania |
23 |
12 |
35 |
| Other Arab countries |
19 |
48 |
67 |
| Arab Countries |
895 |
1.729 |
2.624 |
| United States |
11 |
29 |
40 |
| United Kingdom |
2 |
11 |
13 |
| Canada |
3 |
18 |
21 |
| Iran |
64 |
160 |
224 |
| Pakistan |
32 |
59 |
91 |
| India |
20 |
31 |
51 |
| Other |
124 |
89 |
213 |
| Other Countries |
256 |
397 |
653 |
| Total |
2.339 |
7.454 |
9.793 |
Source: Universities
ANNEXED NOTE
The table refers to the students in Qatar University and Community College
Institution which provides data
Qatar Statistics Authority
Data availability
These data on education have been found in the “Education” chapter of 2012’s Statistical Yearbook.
https://www.mdps.gov.qa/en/statistics1/pages/topicslisting.aspx?parent=General&child=StatisticalAbstract
QSA publishes Statistical Yearbooks available online, in Excel (certain thematic chapters since 2010) and PDF format, up to 1980’s issue. However, recently they seem not to be published yearly as a complete volume and thematic chapters are published separately.
Issues 1980 to 2009 are available on the Qatar Information Exchange website, accessible from QSA’ website (English and Arabic website)
http://www.qix.gov.qa/portal/page/portal/QIXPOC/Documents/QIX%20Knowledge%20Base/Publication/General%20Statistics/Annual%20Abstract
Last date of access: June 27th, 2013.
| |
|
Student |
Homemaker |
Retired |
Unable to Work |
Not Seeking Work |
Other |
Total |
| |
Males |
14.711 |
0 |
5.754 |
2.352 |
1.573 |
169 |
24.559 |
| Qataris |
Females |
15.327 |
26.622 |
2.622 |
1.328 |
1.715 |
2 |
47.616 |
| |
Total |
30.038 |
26.622 |
8.376 |
3.680 |
3.288 |
171 |
72.175 |
| |
Males |
19.167 |
0 |
0 |
705 |
1.051 |
1.441 |
22.364 |
| Non-Qataris |
Females |
18.123 |
75.376 |
0 |
369 |
1.579 |
894 |
96.341 |
| |
Total |
37.290 |
75.376 |
0 |
1.074 |
2.630 |
2.335 |
118.705 |
| |
Males |
33.878 |
0 |
5.754 |
3.057 |
2.624 |
1.610 |
46.923 |
| TOTAL |
Females |
33.450 |
101.998 |
2.622 |
1.697 |
3.294 |
896 |
143.957 |
| |
Total |
67.328 |
101.998 |
8.376 |
4.754 |
5.918 |
2.506 |
190.880 |
Source: census 2010, QSA
ANNEXED NOTE
1. Technical Notes and Definitions
Reference period for census 2010: the night of April 21st, 2010.
Implementation method: census is based on de jure method; i.e. registering people according to their usual place of residence at time of census.
Populations in transit or visiting Qatar as tourists, as well as residents of public housing or visitors staying in a household for less than two months after night of reference were excluded.
Populations away from usual residence in Qatar for reasons of duty, or on a visit abroad for less than two months, as well as individuals with no personal housing within Qatar staying with a household for more than two months, are counted in their usual/ present residence during census night.
Population of reference: all individuals (nationals and non-nationals) present within the State’s borders during time of reference, including in labour camps.
Inactive population:
Full-time student: The person (15 years or older) enrolled in any educational institution as a full-time persistent student with purpose of attaining an academic degree, irrespective of whether the schooling hours are in the morning or evening. Any trainee enrolled in vocational training institutes is regarded as a full-time student.
Full-time housewife: The female (15 years or older) who is fully engaged in home management and family care, and does not practice any other work
Retired: The person who is not working but capable of work, does not look for work during the week ending on 20/04/2010 and gets a fixed pension for work he had joined before
Disabled: The person (15 years or older) who is not capable of work due to illness, handicap or old age.
Not searching for work: The person (15 years or older) who is capable of work but not working or searching for work and he is not enrolled in any of the educational institutes. Such person is called “economically self-sufficient”.
Others: Any cases encountered by the enumerator other than the above mentioned e.g. inmates of jails, health resorts, hospitals, etc not engaged with work).
Data related to work force include individuals of 15 years old or more (born before April 1995) and refer to the week preceding the enumeration period.
2. Institution which provides data
Qatar Statistics Authority (QSA)
(http://www.qsa.gov.qa/eng/index.htm for website in English; http://www.qsa.gov.qa/Ar/index.htm for website in Arabic)
3. Data availability
None of Qatar censuses or other sources have ever disclosed figures of total population broken down by country of citizenship or even by nationality (Qatari/non-Qatari).
For 2010 data have been collected but remain withheld. The census only provides detailed data on population 15 years and above by nationality.
Released parts of census are available on the website of the QSA, in published form in PDF format.
https://www.mdps.gov.qa/en/statistics1/pages/topicslisting.aspx?parent=General&child=Census
Census 2010′ website:
https://www.mdps.gov.qa/en/statistics1/pages/topicslisting.aspx?parent=General&child=Census
2010′ census in Excel or PDF format individual tables:
http://www.qsa.gov.qa/QatarCensus/Census_Results.aspx
Date of access: June 2013.
| Degree prepared |
Doctorate |
Master |
Bachelor |
Associate |
Diploma |
Other |
Total |
| Specialization |
Males |
Females |
Males |
Females |
Males |
Females |
Males |
Females |
Males |
Females |
Males |
Females |
Males |
Females |
| Economy and Administration |
|
|
|
|
|
|
|
|
|
|
|
|
|
|
| Business , Management, and Related Support Services |
0 |
0 |
3 |
6 |
36 |
11 |
0 |
0 |
0 |
0 |
0 |
0 |
39 |
17 |
| Public Administration and Social Service professions |
0 |
0 |
0 |
0 |
1 |
0 |
0 |
0 |
0 |
0 |
0 |
0 |
1 |
0 |
| Engineering |
|
|
|
|
|
|
|
|
|
|
|
|
|
|
| Architecture and Related Services |
0 |
0 |
0 |
0 |
1 |
1 |
0 |
0 |
0 |
0 |
0 |
0 |
1 |
1 |
| Engineering Technologies / Technicians |
0 |
0 |
0 |
0 |
2 |
1 |
0 |
0 |
0 |
0 |
0 |
0 |
2 |
1 |
| Engineering |
1 |
0 |
0 |
0 |
41 |
10 |
0 |
0 |
0 |
0 |
0 |
0 |
42 |
10 |
| Arts and Sciences |
|
|
|
|
|
|
|
|
|
|
|
|
|
|
| Biological and Biomedical Sciences |
0 |
1 |
0 |
0 |
1 |
2 |
0 |
0 |
0 |
0 |
0 |
0 |
1 |
3 |
| college preparation |
0 |
0 |
2 |
0 |
0 |
0 |
0 |
0 |
0 |
0 |
6 |
0 |
8 |
0 |
| Communication , Journalism, and Related Programs |
0 |
0 |
0 |
0 |
1 |
0 |
0 |
0 |
0 |
0 |
0 |
0 |
1 |
0 |
| Computer and information Sciences and Support Services |
0 |
0 |
0 |
1 |
1 |
1 |
0 |
0 |
0 |
0 |
0 |
0 |
1 |
2 |
| Education |
0 |
2 |
0 |
2 |
0 |
0 |
0 |
0 |
0 |
0 |
0 |
0 |
0 |
4 |
| English Language and Litterature/Humanities |
0 |
0 |
0 |
1 |
0 |
0 |
0 |
0 |
0 |
0 |
0 |
0 |
0 |
1 |
| Family and Consumer Sciences/Human sciences |
0 |
0 |
0 |
1 |
0 |
0 |
0 |
0 |
0 |
0 |
0 |
0 |
0 |
1 |
| Foreign Languages, litteratures and linguistics |
0 |
0 |
0 |
0 |
0 |
0 |
0 |
0 |
0 |
0 |
3 |
1 |
3 |
1 |
| Health Professions and Related Clinical Sciences |
0 |
0 |
0 |
1 |
3 |
2 |
0 |
0 |
0 |
0 |
0 |
0 |
3 |
3 |
| Liberal Art and Science, General Studies and Humanities |
0 |
0 |
0 |
1 |
1 |
1 |
0 |
0 |
0 |
0 |
0 |
0 |
1 |
2 |
| Library Science |
0 |
0 |
0 |
1 |
0 |
0 |
0 |
0 |
0 |
0 |
0 |
0 |
0 |
1 |
| Philosophy and Religious Studies |
1 |
0 |
6 |
1 |
0 |
0 |
0 |
0 |
0 |
0 |
0 |
0 |
7 |
1 |
| Physical Sciences |
0 |
0 |
0 |
0 |
1 |
0 |
0 |
0 |
0 |
0 |
0 |
0 |
1 |
0 |
| Social Sciences |
0 |
0 |
1 |
2 |
4 |
8 |
0 |
0 |
0 |
0 |
0 |
0 |
5 |
10 |
| Visual and Performing Arts |
0 |
0 |
0 |
0 |
1 |
0 |
0 |
0 |
0 |
0 |
0 |
0 |
1 |
0 |
| Other |
0 |
0 |
0 |
0 |
0 |
0 |
0 |
0 |
0 |
0 |
1 |
0 |
1 |
0 |
| Law and Political Science |
|
|
|
|
|
|
|
|
|
|
|
|
|
|
| legal Professions and Studies |
2 |
1 |
4 |
1 |
4 |
3 |
0 |
0 |
0 |
0 |
0 |
0 |
10 |
5 |
| GRAND TOTAL |
4 |
4 |
16 |
18 |
98 |
40 |
0 |
0 |
0 |
0 |
10 |
1 |
128 |
63 |
Source: Qatar Foundation, Supreme Council for Education, Universities
ANNEXED NOTE
Students on scholarship are sponsored by the State of Qatar or by another body. The figures presented here do not take into account Qatar students abroad, living on their own expense, if any.
Institution which provides data
Qatar Statistics Authority
Data availability
These data on education have been found in the “Education” chapter of 2012’s Statistical Yearbook.
https://www.mdps.gov.qa/en/statistics1/pages/topicslisting.aspx?parent=General&child=StatisticalAbstract
QSA publishes Statistical Yearbooks available online, in Excel (certain thematic chapters since 2010) and PDF format, up to 1980’s issue. However, recently they seem not to be published yearly as a complete volume and thematic chapters are published separately.
Issues 1980 to 2009 are available on the Qatar Information Exchange website, accessible from QSA’ website (English and Arabic website)
http://www.qix.gov.qa/portal/page/portal/QIXPOC/Documents/QIX%20Knowledge%20Base/Publication/General%20Statistics/Annual%20Abstract
Last date of access: June 27th, 2013.
|
2008/2009 |
2009/2010 |
2010/2011 |
| |
|
Scholarships |
|
Graduates |
|
|
Scholarships |
|
Graduates |
|
|
Scholarships |
|
Graduates |
|
| |
Males |
Females |
Total |
Males |
Females |
Total |
Males |
Females |
Total |
Males |
Females |
Total |
Males |
Females |
Total |
Males |
Females |
Total |
| Doctorate |
4 |
3 |
7 |
2 |
5 |
7 |
3 |
0 |
3 |
5 |
4 |
9 |
4 |
4 |
8 |
3 |
5 |
8 |
| Master |
8 |
6 |
14 |
9 |
8 |
17 |
17 |
8 |
25 |
2 |
4 |
6 |
16 |
18 |
34 |
7 |
4 |
11 |
| Bachelor |
57 |
14 |
71 |
48 |
21 |
69 |
87 |
32 |
119 |
31 |
30 |
61 |
98 |
40 |
138 |
35 |
21 |
56 |
| Associate |
0 |
0 |
0 |
0 |
0 |
0 |
0 |
0 |
0 |
0 |
0 |
0 |
0 |
0 |
0 |
0 |
0 |
0 |
| Diploma |
0 |
0 |
0 |
0 |
0 |
0 |
0 |
0 |
0 |
0 |
0 |
0 |
0 |
0 |
0 |
0 |
0 |
0 |
| Other Degree |
4 |
0 |
4 |
0 |
2 |
2 |
6 |
2 |
8 |
7 |
0 |
7 |
10 |
1 |
11 |
3 |
0 |
3 |
| Total |
73 |
23 |
96 |
59 |
36 |
95 |
113 |
42 |
155 |
45 |
38 |
83 |
128 |
63 |
191 |
48 |
30 |
78 |
Source: Qatar Foundation, Supreme Council for Education, Universities
ANNEXED NOTE
Students on scholarship are sponsored by the State of Qatar or by another body. The figures presented here do not take into account Qatar students abroad, living on their own expense, if any.
Institution which provides data
Qatar Statistics Authority
Data availability
These data on education have been found in the “Education” chapter of 2012’s Statistical Yearbook.
https://www.mdps.gov.qa/en/statistics1/pages/topicslisting.aspx?parent=General&child=StatisticalAbstract
QSA publishes Statistical Yearbooks available online, in Excel (certain thematic chapters since 2010) and PDF format, up to 1980’s issue. However, recently they seem not to be published yearly as a complete volume and thematic chapters are published separately.
Issues 1980 to 2009 are available on the Qatar Information Exchange website, accessible from QSA’ website (English and Arabic website)
http://www.qix.gov.qa/portal/page/portal/QIXPOC/Documents/QIX%20Knowledge%20Base/Publication/General%20Statistics/Annual%20Abstract
Last date of access: June 27th, 2013.
|
|
2008/2009 |
|
|
2009/2010 |
|
|
2010/2011 |
|
|
Males |
Females |
Total |
Males |
Females |
Total |
Males |
Females |
Total |
| Saudi Arabia |
3 |
0 |
3 |
2 |
0 |
2 |
3 |
0 |
3 |
| United Arab Emirates |
0 |
0 |
0 |
0 |
0 |
0 |
1 |
0 |
1 |
| Egypt |
0 |
0 |
0 |
0 |
0 |
0 |
2 |
2 |
4 |
| Jordan |
0 |
0 |
0 |
0 |
0 |
0 |
1 |
1 |
2 |
| Lebanon |
0 |
0 |
0 |
0 |
0 |
0 |
1 |
1 |
2 |
| Malaysia |
0 |
0 |
0 |
0 |
0 |
0 |
2 |
0 |
2 |
| Singapore |
0 |
0 |
0 |
1 |
0 |
1 |
0 |
0 |
0 |
| United Kingdom |
23 |
13 |
36 |
39 |
29 |
68 |
66 |
49 |
115 |
| France |
5 |
0 |
5 |
2 |
0 |
2 |
6 |
0 |
6 |
| Germany |
0 |
0 |
0 |
0 |
0 |
0 |
2 |
1 |
3 |
| Italy |
0 |
0 |
0 |
0 |
0 |
0 |
1 |
0 |
1 |
| Ireland |
0 |
0 |
0 |
0 |
0 |
0 |
1 |
1 |
2 |
| Spain |
0 |
0 |
0 |
0 |
1 |
1 |
0 |
0 |
0 |
| Japan |
0 |
0 |
0 |
1 |
0 |
1 |
0 |
0 |
0 |
| United States |
36 |
9 |
45 |
67 |
11 |
78 |
34 |
6 |
40 |
| Canada |
1 |
1 |
2 |
0 |
0 |
0 |
3 |
2 |
5 |
| Australia |
4 |
0 |
4 |
0 |
1 |
1 |
3 |
0 |
3 |
| Other |
1 |
0 |
1 |
1 |
0 |
1 |
2 |
0 |
2 |
| TOTAL |
73 |
23 |
96 |
113 |
42 |
155 |
128 |
63 |
191 |
Source: Qatar Foundation, Supreme Council for Education, Universities
ANNEXED NOTE
Students on scholarship are sponsored by the State of Qatar or by another body. The figures presented here do not take into account Qatar students abroad, living on their own expense, if any.
Institution which provides data
Qatar Statistics Authority
Data availability
These data on education have been found in the “Education” chapter of 2012’s Statistical Yearbook.
https://www.mdps.gov.qa/en/statistics1/pages/topicslisting.aspx?parent=General&child=StatisticalAbstract
QSA publishes Statistical Yearbooks available online, in Excel (certain thematic chapters since 2010) and PDF format, up to 1980’s issue. However, recently they seem not to be published yearly as a complete volume and thematic chapters are published separately.
Issues 1980 to 2009 are available on the Qatar Information Exchange website, accessible from QSA’ website (English and Arabic website)
http://www.qix.gov.qa/portal/page/portal/QIXPOC/Documents/QIX%20Knowledge%20Base/Publication/General%20Statistics/Annual%20Abstract
Last date of access: June 27th, 2013.
| |
|
Qataris |
|
|
Qataris |
|
|
Total |
|
| |
Males |
Females |
Total |
Males |
Females |
Total |
Males |
Females |
Total |
| Never married |
12.488 |
8.379 |
20.867 |
316.943 |
40.423 |
357.366 |
329.431 |
48.802 |
378.233 |
| Married |
32.975 |
14.911 |
47.886 |
742.445 |
82.139 |
824.584 |
775.420 |
97.050 |
872.470 |
| Divorced |
631 |
1.234 |
1.865 |
6.206 |
3.031 |
9.237 |
6.837 |
4.265 |
11.102 |
| Widow |
74 |
384 |
458 |
5.379 |
2.541 |
7.920 |
5.453 |
2.925 |
8.378 |
| Total |
46.168 |
24.908 |
71.076 |
1.070.973 |
128.134 |
1.199.107 |
1.117.141 |
153.042 |
1.270.183 |
Source: census 2010, QSA
ANNEXED NOTE
1. Technical Notes and Definitions
Reference period for census 2010: the night of April 21st, 2010.
Implementation method: census is based on de jure method; i.e. registering people according to their usual place of residence at time of census.
Populations in transit or visiting Qatar as tourists, as well as residents of public housing or visitors staying in a household for less than two months after night of reference were excluded.
Populations away from usual residence in Qatar for reasons of duty, or on a visit abroad for less than two months, as well as individuals with no personal housing within Qatar staying with a household for more than two months, are counted in their usual/ present residence during census night.
Population of reference: all individuals (nationals and non-nationals) present within the State’s borders during time of reference, including in labour camps.
Data related to work force include individuals of 15 years old or more (born before April 1995) and refer to the week preceding the enumeration period.
The employed population here also includes paid trainees.
Employed: The person (15 years or older) engaged in work or who works for profit, whether for his own account, for wages or for a family without being paid, during the week ending on 20/04/2010 provided that working hours should not be less than one hour during that week, and the sick, regular or other temporary leave should not be counted in the absence days.
Trainee getting a salary: The person (15 years or older) who joins any of the training institutes, whether morning or evening study, and gets a salary during the training period
2. Institution which provides data
Qatar Statistics Authority (QSA)
(http://www.qsa.gov.qa/eng/index.htm for website in English; http://www.qsa.gov.qa/Ar/index.htm for website in Arabic)
3. Data availability
None of Qatar censuses or other sources have ever disclosed figures of total population broken down by country of citizenship or even by nationality (Qatari/non-Qatari).
For 2010 data have been collected but remain withheld. The census only provides detailed data on population 15 years and above by nationality.
Released parts of census are available on the website of the QSA, in published form in PDF format.
https://www.mdps.gov.qa/en/statistics1/pages/topicslisting.aspx?parent=General&child=Census
Census 2010′ website:
https://www.mdps.gov.qa/en/statistics1/pages/topicslisting.aspx?parent=General&child=Census
2010′ census in Excel or PDF format individual tables:
http://www.qsa.gov.qa/QatarCensus/Census_Results.aspx
Date of access: June 2013.
|
|
Qataris |
|
|
Non-Qataris |
|
|
TOTAL |
|
| Education level |
Males |
Females |
Total |
Males |
Females |
Total |
Males |
Females |
Total |
| Illiterate |
173 |
57 |
230 |
38.492 |
4.878 |
43.370 |
38.665 |
4.935 |
43.600 |
| Read and Write; Night School |
1.441 |
178 |
1.619 |
284.289 |
39.451 |
323.740 |
285.730 |
39.629 |
325.359 |
| Primary |
4.594 |
639 |
5.233 |
268.608 |
18.779 |
287.387 |
273.202 |
19.418 |
292.620 |
| Preparatory |
7.125 |
1.100 |
8.225 |
114.113 |
14.668 |
128.781 |
121.238 |
15.768 |
137.006 |
| Vocational |
111 |
2 |
113 |
22.497 |
230 |
22.727 |
22.608 |
232 |
22.840 |
| Secondary |
17.175 |
8.007 |
25.182 |
195.154 |
18.499 |
213.653 |
212.329 |
26.506 |
238.835 |
| Post. Secondary |
1.845 |
825 |
2.670 |
28.783 |
4.525 |
33.308 |
30.628 |
5.350 |
35.978 |
| University and Above |
13.702 |
14.100 |
27.802 |
119.037 |
27.104 |
146.141 |
132.739 |
41.204 |
173.943 |
| Other |
2 |
0 |
2 |
0 |
0 |
0 |
2 |
0 |
2 |
| Total |
46.168 |
24.908 |
71.076 |
1.070.973 |
128.134 |
1.199.107 |
1.117.141 |
153.042 |
1.270.183 |
Source: census 2010, QSA
ANNEXED NOTE
1. Technical Notes and Definitions
Reference period for census 2010: the night of April 21st, 2010.
Implementation method: census is based on de jure method; i.e. registering people according to their usual place of residence at time of census.
Populations in transit or visiting Qatar as tourists, as well as residents of public housing or visitors staying in a household for less than two months after night of reference were excluded.
Populations away from usual residence in Qatar for reasons of duty, or on a visit abroad for less than two months, as well as individuals with no personal housing within Qatar staying with a household for more than two months, are counted in their usual/ present residence during census night.
Population of reference: all individuals (nationals and non-nationals) present within the State’s borders during time of reference, including in labour camps.
Data related to work force include individuals of 15 years old or more (born before April 1995) and refer to the week preceding the enumeration period.
The employed population here also includes paid trainees.
Employed: The person (15 years or older) engaged in work or who works for profit, whether for his own account, for wages or for a family without being paid, during the week ending on 20/04/2010 provided that working hours should not be less than one hour during that week, and the sick, regular or other temporary leave should not be counted in the absence days.
Trainee getting a salary: The person (15 years or older) who joins any of the training institutes, whether morning or evening study, and gets a salary during the training period
2. Institution which provides data
Qatar Statistics Authority (QSA)
(http://www.qsa.gov.qa/eng/index.htm for website in English; http://www.qsa.gov.qa/Ar/index.htm for website in Arabic)
3. Data availability
None of Qatar censuses or other sources have ever disclosed figures of total population broken down by country of citizenship or even by nationality (Qatari/non-Qatari).
For 2010 data have been collected but remain withheld. The census only provides detailed data on population 15 years and above by nationality.
Released parts of census are available on the website of the QSA, in published form in PDF format.
https://www.mdps.gov.qa/en/statistics1/pages/topicslisting.aspx?parent=General&child=Census
Census 2010′ website:
https://www.mdps.gov.qa/en/statistics1/pages/topicslisting.aspx?parent=General&child=Census
2010′ census in Excel or PDF format individual tables:
http://www.qsa.gov.qa/QatarCensus/Census_Results.aspx
Date of access: June 2013.
| |
|
Qataris |
|
|
Non-Qataris |
|
|
Total |
|
| |
Males |
Females |
Total |
Males |
Females |
Total |
Males |
Females |
Total |
| 15-24 |
9.058 |
3.840 |
12.898 |
144.876 |
15.168 |
160.044 |
153.934 |
19.008 |
172.942 |
| 25-34 |
15.924 |
10.287 |
26.211 |
416.178 |
63.217 |
479.395 |
432.102 |
73.504 |
505.606 |
| 35-44 |
12.181 |
7.826 |
20.007 |
329.564 |
33.329 |
362.893 |
341.745 |
41.155 |
382.900 |
| 45-54 |
6.773 |
2.684 |
9.457 |
141.075 |
13.651 |
154.726 |
147.848 |
16.335 |
164.183 |
| 55-64 |
1.825 |
252 |
2.077 |
35.336 |
2.606 |
37.942 |
37.161 |
2.858 |
40.019 |
| >65 |
407 |
19 |
426 |
3.944 |
163 |
4.107 |
4.351 |
182 |
4.533 |
| Total |
46.168 |
24.908 |
71.076 |
1.070.973 |
128.134 |
1.199.107 |
1.117.141 |
153.042 |
1.270.183 |
Source: census 2010, QSA
ANNEXED NOTE
1. Technical Notes and Definitions
Reference period for census 2010: the night of April 21st, 2010.
Implementation method: census is based on de jure method; i.e. registering people according to their usual place of residence at time of census.
Populations in transit or visiting Qatar as tourists, as well as residents of public housing or visitors staying in a household for less than two months after night of reference were excluded.
Populations away from usual residence in Qatar for reasons of duty, or on a visit abroad for less than two months, as well as individuals with no personal housing within Qatar staying with a household for more than two months, are counted in their usual/ present residence during census night.
Population of reference: all individuals (nationals and non-nationals) present within the State’s borders during time of reference, including in labour camps.
Data related to work force include individuals of 15 years old or more (born before April 1995) and refer to the week preceding the enumeration period.
The employed population here also includes paid trainees.
Employed: The person (15 years or older) engaged in work or who works for profit, whether for his own account, for wages or for a family without being paid, during the week ending on 20/04/2010 provided that working hours should not be less than one hour during that week, and the sick, regular or other temporary leave should not be counted in the absence days.
Trainee getting a salary: The person (15 years or older) who joins any of the training institutes, whether morning or evening study, and gets a salary during the training period
2. Institution which provides data
Qatar Statistics Authority (QSA)
(http://www.qsa.gov.qa/eng/index.htm for website in English; http://www.qsa.gov.qa/Ar/index.htm for website in Arabic)
3. Data availability
None of Qatar censuses or other sources have ever disclosed figures of total population broken down by country of citizenship or even by nationality (Qatari/non-Qatari).
For 2010 data have been collected but remain withheld. The census only provides detailed data on population 15 years and above by nationality.
Released parts of census are available on the website of the QSA, in published form in PDF format.
https://www.mdps.gov.qa/en/statistics1/pages/topicslisting.aspx?parent=General&child=Census
Census 2010′ website:
https://www.mdps.gov.qa/en/statistics1/pages/topicslisting.aspx?parent=General&child=Census
2010′ census in Excel or PDF format individual tables:
http://www.qsa.gov.qa/QatarCensus/Census_Results.aspx
Date of access: June 2013.
| |
QATARIS |
| |
Non-paid family worker |
Employee |
Own account worker |
Employer |
Total |
| |
Males |
Females |
Total |
Males |
Females |
Total |
Males |
Females |
Total |
Males |
Females |
Total |
Males |
Females |
Total |
| 15 – 24 |
7 |
2 |
9 |
8.897 |
3.783 |
12.680 |
7 |
0 |
7 |
147 |
55 |
202 |
9.058 |
3.840 |
12.898 |
| 25 – 34 |
6 |
0 |
6 |
15.590 |
10.191 |
25.781 |
40 |
0 |
40 |
288 |
96 |
384 |
15.924 |
10.287 |
26.211 |
| 35 – 44 |
2 |
2 |
4 |
11.778 |
7.689 |
19.467 |
40 |
0 |
40 |
361 |
135 |
496 |
12.181 |
7.826 |
20.007 |
| 45 – 54 |
4 |
0 |
4 |
6.361 |
2.612 |
8.973 |
28 |
0 |
28 |
380 |
72 |
452 |
6.773 |
2.684 |
9.457 |
| 55 – 64 |
0 |
0 |
0 |
1.633 |
242 |
1.875 |
21 |
0 |
21 |
171 |
10 |
181 |
1.825 |
252 |
2.077 |
| 65 – 74 |
0 |
0 |
0 |
198 |
19 |
217 |
6 |
0 |
6 |
99 |
0 |
99 |
303 |
19 |
322 |
| 75 + |
0 |
0 |
0 |
37 |
0 |
37 |
5 |
0 |
5 |
62 |
0 |
62 |
104 |
0 |
104 |
| All ages |
19 |
4 |
23 |
44.494 |
24.536 |
69.030 |
147 |
0 |
147 |
1.508 |
368 |
1.876 |
46.168 |
24.908 |
71.076 |
| |
NON-QATARIS |
| |
|
Non-paid Family Worker |
|
|
Employee |
|
|
Own Account Worker |
|
|
Employer |
|
|
Total |
|
| |
Males |
Females |
Total |
Males |
Females |
Total |
Males |
Females |
Total |
Males |
Females |
Total |
Males |
Females |
Total |
| 15 – 24 |
0 |
0 |
0 |
144.628 |
15.159 |
159.787 |
221 |
1 |
222 |
27 |
8 |
35 |
144.876 |
15.168 |
160.044 |
| 25 – 34 |
0 |
0 |
0 |
415.357 |
63.166 |
478.523 |
673 |
13 |
686 |
148 |
38 |
186 |
416.178 |
63.217 |
479.395 |
| 35 – 44 |
1 |
0 |
1 |
329.030 |
33.283 |
362.313 |
391 |
9 |
400 |
142 |
37 |
179 |
329.564 |
33.329 |
362.893 |
| 45 – 54 |
2 |
0 |
2 |
140.727 |
13.630 |
154.357 |
219 |
5 |
224 |
127 |
16 |
143 |
141.075 |
13.651 |
154.726 |
| 55 – 64 |
0 |
0 |
0 |
35.121 |
2603 |
37.724 |
111 |
0 |
111 |
104 |
3 |
107 |
35.336 |
2606 |
37.942 |
| 65 – 74 |
0 |
0 |
0 |
3444 |
162 |
3606 |
34 |
0 |
34 |
39 |
0 |
39 |
3517 |
162 |
3679 |
| 75 + |
0 |
0 |
0 |
415 |
1 |
416 |
5 |
0 |
5 |
7 |
0 |
7 |
427 |
1 |
428 |
| All ages |
3 |
0 |
3 |
1.068.722 |
128.004 |
1.196.726 |
1654 |
28 |
1682 |
594 |
102 |
696 |
1.070.973 |
128.134 |
1.199.107 |
| |
TOTAL EMPLOYED POPULATION |
| |
Non-paid family worker |
Employee |
Own account worker |
Employer |
Total |
| |
Males |
Females |
Total |
Males |
Females |
Total |
Males |
Females |
Total |
Males |
Females |
Total |
Males |
Females |
Total |
| 15 – 24 |
7 |
2 |
9 |
153.525 |
18.942 |
172.467 |
228 |
1 |
229 |
174 |
63 |
237 |
153.934 |
19.008 |
172.942 |
| 25 – 34 |
6 |
0 |
6 |
430.947 |
73.357 |
504.304 |
713 |
13 |
726 |
436 |
134 |
570 |
432.102 |
73.504 |
505.606 |
| 35 – 44 |
3 |
2 |
5 |
340.808 |
40.972 |
381.780 |
431 |
9 |
440 |
503 |
172 |
675 |
341.745 |
41.155 |
382.900 |
| 45 – 54 |
6 |
0 |
6 |
147.088 |
16.242 |
163.330 |
247 |
5 |
252 |
507 |
88 |
595 |
147.848 |
16.335 |
164.183 |
| 55 – 64 |
0 |
0 |
0 |
36.754 |
2845 |
39.599 |
132 |
0 |
132 |
275 |
13 |
288 |
37.161 |
2858 |
40.019 |
| 65 – 74 |
0 |
0 |
0 |
3642 |
181 |
3823 |
40 |
0 |
40 |
138 |
0 |
138 |
3820 |
181 |
4001 |
| 75 + |
0 |
0 |
0 |
452 |
1 |
453 |
10 |
0 |
10 |
69 |
0 |
69 |
531 |
1 |
532 |
| All ages |
22 |
4 |
26 |
1.113.216 |
152.540 |
1.265.756 |
1.801 |
28 |
1.829 |
2.102 |
470 |
2.572 |
1.117.141 |
153.042 |
1.270.183 |
Source: census 2010, QSA
ANNEXED NOTE
1. Technical Notes and Definitions
Reference period for census 2010: the night of April 21st, 2010.
Implementation method: census is based on de jure method; i.e. registering people according to their usual place of residence at time of census.
Populations in transit or visiting Qatar as tourists, as well as residents of public housing or visitors staying in a household for less than two months after night of reference were excluded.
Populations away from usual residence in Qatar for reasons of duty, or on a visit abroad for less than two months, as well as individuals with no personal housing within Qatar staying with a household for more than two months, are counted in their usual/ present residence during census night.
Population of reference: all individuals (nationals and non-nationals) present within the State’s borders during time of reference, including in labour camps.
Data related to work force include individuals of 15 years old or more (born before April 1995) and refer to the week preceding the enumeration period.
The employed population here also includes paid trainees.
Employed: The person (15 years or older) engaged in work or who works for profit, whether for his own account, for wages or for a family without being paid, during the week ending on 20/04/2010 provided that working hours should not be less than one hour during that week, and the sick, regular or other temporary leave should not be counted in the absence days.
Trainee getting a salary: The person (15 years or older) who joins any of the training institutes, whether morning or evening study, and gets a salary during the training period
2. Institution which provides data
Qatar Statistics Authority (QSA)
(http://www.qsa.gov.qa/eng/index.htm for website in English; http://www.qsa.gov.qa/Ar/index.htm for website in Arabic)
3. Data availability
None of Qatar censuses or other sources have ever disclosed figures of total population broken down by country of citizenship or even by nationality (Qatari/non-Qatari).
For 2010 data have been collected but remain withheld. The census only provides detailed data on population 15 years and above by nationality.
Released parts of census are available on the website of the QSA, in published form in PDF format.
https://www.mdps.gov.qa/en/statistics1/pages/topicslisting.aspx?parent=General&child=Census
Census 2010′ website:
https://www.mdps.gov.qa/en/statistics1/pages/topicslisting.aspx?parent=General&child=Census
2010′ census in Excel or PDF format individual tables:
http://www.qsa.gov.qa/QatarCensus/Census_Results.aspx
Date of access: June 2013.
| |
|
Qataris |
|
|
Non-Qataris |
|
|
Total |
|
| |
Males |
Females |
Total |
Males |
Females |
Total |
Males |
Females |
Total |
| Non-paid family worker |
19 |
4 |
23 |
3 |
0 |
3 |
22 |
4 |
26 |
| Employee |
44.494 |
24.536 |
69.030 |
1.068.722 |
128.004 |
1.196.726 |
1.113.216 |
152.540 |
1.265.756 |
| Own account worker |
147 |
0 |
147 |
1654 |
28 |
1682 |
1801 |
28 |
1829 |
| Employer |
1.508 |
368 |
1.876 |
594 |
102 |
696 |
2.102 |
470 |
2.572 |
| Total |
46.168 |
24.908 |
71.076 |
1.070.973 |
128.134 |
1.199.107 |
1.117.141 |
153.042 |
1.270.183 |
Source: census 2010, QSA
ANNEXED NOTE
1. Technical Notes and Definitions
Reference period for census 2010: the night of April 21st, 2010.
Implementation method: census is based on de jure method; i.e. registering people according to their usual place of residence at time of census.
Populations in transit or visiting Qatar as tourists, as well as residents of public housing or visitors staying in a household for less than two months after night of reference were excluded.
Populations away from usual residence in Qatar for reasons of duty, or on a visit abroad for less than two months, as well as individuals with no personal housing within Qatar staying with a household for more than two months, are counted in their usual/ present residence during census night.
Population of reference: all individuals (nationals and non-nationals) present within the State’s borders during time of reference, including in labour camps.
Data related to work force include individuals of 15 years old or more (born before April 1995) and refer to the week preceding the enumeration period.
The employed population here also includes paid trainees.
Employed: The person (15 years or older) engaged in work or who works for profit, whether for his own account, for wages or for a family without being paid, during the week ending on 20/04/2010 provided that working hours should not be less than one hour during that week, and the sick, regular or other temporary leave should not be counted in the absence days.
Trainee getting a salary: The person (15 years or older) who joins any of the training institutes, whether morning or evening study, and gets a salary during the training period
2. Institution which provides data
Qatar Statistics Authority (QSA)
(http://www.qsa.gov.qa/eng/index.htm for website in English; http://www.qsa.gov.qa/Ar/index.htm for website in Arabic)
3. Data availability
None of Qatar censuses or other sources have ever disclosed figures of total population broken down by country of citizenship or even by nationality (Qatari/non-Qatari).
For 2010 data have been collected but remain withheld. The census only provides detailed data on population 15 years and above by nationality.
Released parts of census are available on the website of the QSA, in published form in PDF format.
https://www.mdps.gov.qa/en/statistics1/pages/topicslisting.aspx?parent=General&child=Census
Census 2010′ website:
https://www.mdps.gov.qa/en/statistics1/pages/topicslisting.aspx?parent=General&child=Census
2010′ census in Excel or PDF format individual tables:
http://www.qsa.gov.qa/QatarCensus/Census_Results.aspx
Date of access: June 2013.
| |
|
In the labour force |
|
|
Out of the labour force |
|
|
Non stated |
|
|
TOTAL |
|
| |
males |
females |
total |
males |
females |
total |
males |
females |
total |
males |
females |
total |
| Kuwaitis |
206783 |
180991 |
387774 |
124352 |
177757 |
302109 |
7430 |
24 |
7454 |
338565 |
358772 |
697337 |
| Non-Kuwaitis |
1380273 |
461705 |
1841978 |
77387 |
244985 |
322372 |
13245 |
5 |
13250 |
1470905 |
706695 |
2177600 |
| Total |
1.587.056 |
642.696 |
2.229.752 |
201.739 |
422.742 |
624.481 |
20.675 |
29 |
20.704 |
1.809.470 |
1.065.467 |
2.874.937 |
Source: PACI
ANNEXED NOTE
1. Characteristics of data and definitions
The source of data used here is the Public Authority for Civil Information (PACI), an independant government body in charge of :
1- centralising all population and labour force data in order to manage a fully computerised population register
2- issuing mandatory civil identification cards to every resident of the country, regardless of age and nationality.
The other source of demographic and socioeconomic data on Kuwait is the Central Statistical Office (CSO), operating within the Planning Ministry. The CSO has conducted ten population and housing censuses since its inception in 1957.
Since 1995 a marked discrepancy was witnessed between PACI’ and CSO’ population figures. PACI’ database is connected electronically with other administrations and bodies registering demographic events and professional/ residency issues (births and death; departures and arrivals; end of service, residency and ID deliveries, etc.).
PACI’s records of residents’ movements is thus regularly updated, which limits the risk of population overcount. Therefore, it is more likely that residents were undercounted during CSO- Ministry of Planning’s census operations (see: Shah, N. Population of Kuwait. Structure and Dynamics, Kuwait: Kuwait University Academic Publication Council, 2010, chapter 1).
(a) Kuwaiti: the Kuwaiti nationality rests upon a document of Kuwaiti nationality or a certificate proving Kuwaiti nationality issued by the Ministry of Interior of Kuwait.
(b) Non-Kuwaiti: his/ her nationality is determined by the name of the State which issued the passport. The foreign national also entered Kuwait legally and has a stamp of residence.
This category includes the Bidoon, a category of stateless persons living in the Emirate. Kuwait’s Bidoon population originates from three broad categories:
1) those whose ancestors failed to apply for nationality or lacked necessary documentation at the time of Kuwait’s independence in 1961;
2) those recruited to work in Kuwait’s army or police force during the 1960s who permanently settled in Kuwait, along with their families;
3) children of Kuwaiti mothers and stateless or foreign fathers (see Human Rights Watch. Prisoners of the Past. Kuwaiti Bidun and the Burden of Statelessness, June 2011, p. 3).
(c) Working age population: population aged 15 to 60.
(d) Population in the labour force: population aged 15 years and above, included in the labour market, either employed (in the government or private sector, as itinerant worker, employed in the domestic sector), or unemployed.
(e) Population out of the labour force: population aged 15 years and above, not contributing to any economic activity and not included in the labour market, among which the students, the housewives, the retired persons or self-sufficients.
2. Institution which provides data
The Public Authority for Civil Information (PACI)
3. Period of data coverage: December 2012
The database is updated three times a year and the website presents only the most recent data.
4. Data availability
The statistics section of PACI’s website (http://www.paci.gov.kw/en/ (English); http://www.paci.gov.kw/ (Arabic)) provides population and socio-economic data broken down by nationality (Kuwaiti/ non-Kuwaiti). Some data are displayed by nationality groups.
Analytical tables and data crosstabulations are available for download in PDF, html, .png and Excel (.csv) formats.
Date of access: June 2013.
|
|
|
|
Governorate |
|
|
|
|
| |
CAPITAL |
HAWALLI |
AHMADI |
JAHRA |
FARWANIYA |
MUBARAK AL-KABEER |
Non stated |
TOTAL |
| Kuwaiti |
142.006 |
124.832 |
136.947 |
83.820 |
123.579 |
86.015 |
138 |
697.337 |
| Non Kuwaiti |
255.969 |
486.269 |
427.410 |
254.368 |
666.952 |
84.358 |
2.274 |
2.177.600 |
| Total |
397.975 |
611.101 |
564.357 |
338.188 |
790.531 |
170.373 |
2.412 |
2.874.937 |
Source: PACI
ANNEXED NOTE
1. Characteristics of data and definitions
The source of data used here is the Public Authority for Civil Information (PACI), an independant government body in charge of :
1- centralising all population and labour force data in order to manage a fully computerised population register
2- issuing mandatory civil identification cards to every resident of the country, regardless of age and nationality.
The other source of demographic and socioeconomic data on Kuwait is the Central Statistical Office (CSO), operating within the Planning Ministry. The CSO has conducted ten population and housing censuses since its inception in 1957.
Since 1995 a marked discrepancy was witnessed between PACI’ and CSO’ population figures. PACI’ database is connected electronically with other administrations and bodies registering demographic events and professional/ residency issues (births and death; departures and arrivals; end of service, residency and ID deliveries, etc.).
PACI’s records of residents’ movements is thus regularly updated, which limits the risk of population overcount. Therefore, it is more likely that residents were undercounted during CSO- Ministry of Planning’s census operations (see: Shah, N. Population of Kuwait. Structure and Dynamics, Kuwait: Kuwait University Academic Publication Council, 2010, chapter 1).
(a) Kuwaiti: the Kuwaiti nationality rests upon a document of Kuwaiti nationality or a certificate proving Kuwaiti nationality issued by the Ministry of Interior of Kuwait.
(b) Non-Kuwaiti: his/ her nationality is determined by the name of the State which issued the passport. The foreign national also entered Kuwait legally and has a stamp of residence.
This category includes the Bidoon, a category of stateless persons living in the Emirate. Kuwait’s Bidoon population originates from three broad categories:
1) those whose ancestors failed to apply for nationality or lacked necessary documentation at the time of Kuwait’s independence in 1961;
2) those recruited to work in Kuwait’s army or police force during the 1960s who permanently settled in Kuwait, along with their families;
3) children of Kuwaiti mothers and stateless or foreign fathers (see Human Rights Watch. Prisoners of the Past. Kuwaiti Bidun and the Burden of Statelessness, June 2011, p. 3).
(c) Working age population: population aged 15 to 60.
2. Institution which provides data
The Public Authority for Civil Information (PACI)
3. Period of data coverage: December 2012
The database is updated three times a year and the website presents only the most recent data.
4. Data availability
The statistics section of PACI’s website (http://www.paci.gov.kw/en/ (English); http://www.paci.gov.kw/ (Arabic)) provides population and socio-economic data broken down by nationality (Kuwaiti/ non-Kuwaiti). Some data are displayed by nationality groups.
Analytical tables and data crosstabulations are available for download in PDF, html, .png and Excel (.csv) formats.
Date of access: June 2013.
| Age |
Nationality |
|
|
|
|
KUWAITIS |
|
|
|
|
|
|
|
|
|
NON KUWAITIS |
|
|
|
|
|
| group |
Education level |
Illiterate |
Reads and writes |
Elementary |
Intermediate |
High school diploma |
Diploma |
University degree |
Postgraduate |
NA |
Total K. |
Illiterate |
Reads and writes |
Elementary |
Intermediate |
High school diploma |
Diploma |
University degree |
Postgraduate |
NA |
Total N.-K. |
| 15-19 |
males |
8 |
1 |
24.408 |
35.717 |
3.983 |
3 |
0 |
0 |
2.660 |
66.780 |
115 |
2.240 |
18.245 |
14.813 |
914 |
1 |
0 |
0 |
6.877 |
43.205 |
| |
females |
13 |
1 |
17.805 |
36.840 |
7.498 |
2 |
0 |
0 |
2.112 |
64.271 |
78 |
1.798 |
15.776 |
13.854 |
1.147 |
6 |
0 |
0 |
5.045 |
37.704 |
| |
total |
21 |
2 |
42.213 |
72.557 |
11.481 |
5 |
0 |
0 |
4.772 |
131.051 |
193 |
4.038 |
34.021 |
28.667 |
2.061 |
7 |
0 |
0 |
11.922 |
80.909 |
| 20-24 |
males |
5 |
8 |
13.828 |
16.553 |
20.468 |
3.150 |
629 |
3 |
1.874 |
56.518 |
2.175 |
37.035 |
7.678 |
35.719 |
9.366 |
1.706 |
1.334 |
7 |
6.507 |
101.527 |
| |
females |
4 |
1 |
8.965 |
9.997 |
28.283 |
4.492 |
1.174 |
1 |
1.819 |
54.736 |
2.410 |
25.954 |
5.800 |
26.506 |
8.775 |
1.015 |
1.314 |
3 |
3.347 |
75.124 |
| |
total |
9 |
9 |
22.793 |
26.550 |
48.751 |
7.642 |
1.803 |
4 |
3.693 |
111.254 |
4.585 |
62.989 |
13.478 |
62.225 |
18.141 |
2.721 |
2.648 |
10 |
9.854 |
176.651 |
| 25-29 |
males |
5 |
7 |
4.264 |
16.210 |
16.383 |
5.751 |
4.957 |
40 |
1.499 |
49.116 |
7.055 |
101.394 |
9.279 |
73.983 |
27.152 |
5.787 |
9.668 |
75 |
9.406 |
243.799 |
| |
females |
5 |
13 |
2.265 |
7.870 |
15.230 |
11.042 |
11.563 |
44 |
1.852 |
49.884 |
5.363 |
60.183 |
6.478 |
40.323 |
17.675 |
3.092 |
8.083 |
79 |
4.660 |
145.936 |
| |
total |
10 |
20 |
6.529 |
24.080 |
31.613 |
16.793 |
16.520 |
84 |
3.351 |
99.000 |
12.418 |
161.577 |
15.757 |
114.306 |
44.827 |
8.879 |
17.751 |
154 |
14.066 |
389.735 |
| 30-34 |
males |
0 |
12 |
3.921 |
12.592 |
13.604 |
4.697 |
4.505 |
129 |
1.236 |
40.696 |
8.269 |
104.958 |
11.168 |
73.987 |
28.598 |
6.767 |
11.599 |
397 |
56.923 |
302.666 |
| |
females |
2 |
14 |
2.407 |
7.084 |
11.311 |
8.118 |
12.079 |
171 |
1.763 |
42.949 |
4.595 |
52.175 |
5.908 |
33.313 |
16.443 |
3.110 |
8.306 |
207 |
10.660 |
134.717 |
| |
total |
2 |
26 |
6.328 |
19.676 |
24.915 |
12.815 |
16.584 |
300 |
2.999 |
83.645 |
12.864 |
157.133 |
17.076 |
107.300 |
45.041 |
9.877 |
19.905 |
604 |
67.583 |
437.383 |
| 35-39 |
males |
2 |
39 |
5.208 |
10.878 |
9.352 |
3.980 |
4.455 |
181 |
1.104 |
35.199 |
7.888 |
82.335 |
11.436 |
57.642 |
25.176 |
6.218 |
10.154 |
514 |
51.956 |
253.319 |
| |
females |
5 |
29 |
2.913 |
9.356 |
6.934 |
5.441 |
12.477 |
92 |
2.117 |
39.364 |
4.894 |
41.243 |
5.624 |
27.938 |
11.878 |
2.830 |
6.425 |
203 |
11.884 |
112.919 |
| |
total |
7 |
68 |
8.121 |
20.234 |
16.286 |
9.421 |
16.932 |
273 |
3.221 |
74.563 |
12.782 |
123.578 |
17.060 |
85.580 |
37.054 |
9.048 |
16.579 |
717 |
63.840 |
366.238 |
| 40-44 |
males |
3 |
17 |
3.446 |
11.604 |
6.953 |
3.523 |
3.692 |
240 |
868 |
30.346 |
10.884 |
67.935 |
11.305 |
48.656 |
24.604 |
5.788 |
8.741 |
418 |
31.666 |
209.997 |
| |
females |
19 |
13 |
2.550 |
10.439 |
6.201 |
4.087 |
8.490 |
121 |
2.504 |
34.424 |
5.593 |
30.094 |
3.814 |
20.183 |
10.034 |
2.294 |
4.624 |
169 |
9.699 |
86.504 |
| |
total |
22 |
30 |
5.996 |
22.043 |
13.154 |
7.610 |
12.182 |
361 |
3.372 |
64.770 |
16.477 |
98.029 |
15.119 |
68.839 |
34.638 |
8.082 |
13.365 |
587 |
41.365 |
296.501 |
| 45-49 |
males |
1 |
8 |
1.689 |
8.537 |
6.788 |
3.436 |
4.244 |
322 |
676 |
25.701 |
12.531 |
46.208 |
11.318 |
31.178 |
20.097 |
4.831 |
9.310 |
428 |
17.999 |
153.900 |
| |
females |
56 |
23 |
2.409 |
7.701 |
5.034 |
3.951 |
6.873 |
120 |
3.599 |
29.766 |
5.817 |
19.359 |
2.822 |
11.778 |
8.090 |
1.940 |
3.793 |
133 |
6.471 |
60.203 |
| |
total |
57 |
31 |
4.098 |
16.238 |
11.822 |
7.387 |
11.117 |
442 |
4.275 |
55.467 |
18.348 |
65.567 |
14.140 |
42.956 |
28.187 |
6.771 |
13.103 |
561 |
24.470 |
214.103 |
| 50-54 |
males |
106 |
201 |
1.499 |
5.546 |
3.927 |
3.203 |
4.280 |
527 |
273 |
19.562 |
9.395 |
28.232 |
9.472 |
19.851 |
13.990 |
3.127 |
8.014 |
462 |
8.480 |
101.023 |
| |
females |
2.058 |
842 |
2.032 |
5.064 |
3.250 |
4.163 |
4.791 |
157 |
1.491 |
23.848 |
4.849 |
9.044 |
1.863 |
5.422 |
5.417 |
1.459 |
3.091 |
134 |
3.444 |
34.723 |
| |
total |
2.164 |
1.043 |
3.531 |
10.610 |
7.177 |
7.366 |
9.071 |
684 |
1.764 |
43.410 |
14.244 |
37.276 |
11.335 |
25.273 |
19.407 |
4.586 |
11.105 |
596 |
11.924 |
135.746 |
| 55-59 |
males |
166 |
390 |
1.435 |
4.282 |
2.329 |
2.307 |
2.944 |
673 |
121 |
14.647 |
6.032 |
15.333 |
6.224 |
10.727 |
9.629 |
2.412 |
6.491 |
485 |
4.136 |
61.469 |
| |
females |
4.114 |
1.443 |
1.942 |
3.876 |
1.880 |
3.069 |
2.765 |
219 |
222 |
19.530 |
3.433 |
3.849 |
1.087 |
2.499 |
3.112 |
1.206 |
2.262 |
126 |
1.291 |
18.865 |
| |
total |
4.280 |
1.833 |
3.377 |
8.158 |
4.209 |
5.376 |
5.709 |
892 |
343 |
34.177 |
9.465 |
19.182 |
7.311 |
13.226 |
12.741 |
3.618 |
8.753 |
611 |
5.427 |
80.334 |
| TOTAL |
males |
296 |
683 |
59.698 |
121.919 |
83.787 |
30.050 |
29.706 |
2.115 |
10.311 |
338.565 |
64.344 |
485.670 |
96.125 |
366.556 |
159.526 |
36.637 |
65.311 |
2.786 |
193.950 |
1.470.905 |
| |
females |
6.276 |
2.379 |
43.288 |
98.227 |
85.621 |
44.365 |
60.212 |
925 |
17.479 |
358.772 |
37.032 |
243.699 |
49.172 |
181.816 |
82.571 |
16.952 |
37.898 |
1.054 |
56.501 |
706.695 |
| |
total |
6.572 |
3.062 |
102.986 |
220.146 |
169.408 |
74.415 |
89.918 |
3.040 |
27.790 |
697.337 |
101.376 |
729.369 |
145.297 |
548.372 |
242.097 |
53.589 |
103.209 |
3.840 |
250.451 |
2.177.600 |
Source: PACI
ANNEXED NOTE
1. Characteristics of data and definitions
The source of data used here is the Public Authority for Civil Information (PACI), an independant government body in charge of :
1- centralising all population and labour force data in order to manage a fully computerised population register
2- issuing mandatory civil identification cards to every resident of the country, regardless of age and nationality.
The other source of demographic and socioeconomic data on Kuwait is the Central Statistical Office (CSO), operating within the Planning Ministry. The CSO has conducted ten population and housing censuses since its inception in 1957.
Since 1995 a marked discrepancy was witnessed between PACI’ and CSO’ population figures. PACI’ database is connected electronically with other administrations and bodies registering demographic events and professional/ residency issues (births and death; departures and arrivals; end of service, residency and ID deliveries, etc.).
PACI’s records of residents’ movements is thus regularly updated, which limits the risk of population overcount. Therefore, it is more likely that residents were undercounted during CSO- Ministry of Planning’s census operations (see: Shah, N. Population of Kuwait. Structure and Dynamics, Kuwait: Kuwait University Academic Publication Council, 2010, chapter 1).
(a) Kuwaiti: the Kuwaiti nationality rests upon a document of Kuwaiti nationality or a certificate proving Kuwaiti nationality issued by the Ministry of Interior of Kuwait.
(b) Non-Kuwaiti: his/ her nationality is determined by the name of the State which issued the passport. The foreign national also entered Kuwait legally and has a stamp of residence.
This category includes the Bidoon, a category of stateless persons living in the Emirate. Kuwait’s Bidoon population originates from three broad categories:
1) those whose ancestors failed to apply for nationality or lacked necessary documentation at the time of Kuwait’s independence in 1961;
2) those recruited to work in Kuwait’s army or police force during the 1960s who permanently settled in Kuwait, along with their families;
3) children of Kuwaiti mothers and stateless or foreign fathers (see Human Rights Watch. Prisoners of the Past. Kuwaiti Bidun and the Burden of Statelessness, June 2011, p. 3).
(c) Working age population: population aged 15 to 60.
2. Institution which provides data
The Public Authority for Civil Information (PACI)
3. Period of data coverage: December 2012
The database is updated three times a year and the website presents only the most recent data.
4. Data availability
The statistics section of PACI’s website (http://www.paci.gov.kw/en/ (English); http://www.paci.gov.kw/ (Arabic)) provides population and socio-economic data broken down by nationality (Kuwaiti/ non-Kuwaiti). Some data are displayed by nationality groups.
Analytical tables and data crosstabulations are available for download in PDF, html, .png and Excel (.csv) formats.
Date of access: June 2013.
|
|
|
|
KUWAITIS |
|
|
|
|
|
NON-KUWAITIS |
|
|
|
| Age group |
|
Never Married |
Married |
Divorced |
Widowed |
Not Stated |
Total |
Never Married |
Married |
Divorced |
Widowed |
Not Stated |
Total |
| 15-19 |
males |
66.249 |
451 |
38 |
0 |
42 |
66.780 |
36.869 |
392 |
3 |
1 |
5.940 |
43.205 |
| |
females |
60.099 |
3.882 |
256 |
4 |
30 |
64.271 |
30.076 |
1.945 |
68 |
3 |
5.612 |
37.704 |
| |
total |
126.348 |
4.333 |
294 |
4 |
72 |
131.051 |
66.945 |
2.337 |
71 |
4 |
11.552 |
80.909 |
| 20-24 |
males |
44.531 |
11.031 |
921 |
1 |
34 |
56.518 |
64.752 |
29.956 |
104 |
17 |
6.698 |
101.527 |
| |
females |
31.685 |
20.585 |
2.402 |
44 |
20 |
54.736 |
37.216 |
32.282 |
655 |
32 |
4.939 |
75.124 |
| |
total |
76.216 |
31.616 |
3.323 |
45 |
54 |
111.254 |
101.968 |
62.238 |
759 |
49 |
11.637 |
176.651 |
| 25-29 |
males |
17.696 |
28.995 |
2.372 |
10 |
43 |
49.116 |
144.656 |
98.437 |
565 |
54 |
87 |
243.799 |
| |
females |
13.174 |
32.068 |
4.497 |
112 |
33 |
49.884 |
56.563 |
87.854 |
1.403 |
89 |
27 |
145.936 |
| |
total |
30.870 |
61.063 |
6.869 |
122 |
76 |
99.000 |
201.219 |
186.291 |
1.968 |
143 |
114 |
389.735 |
| 30-34 |
males |
5.583 |
32.512 |
2.509 |
27 |
65 |
40.696 |
161.661 |
138.610 |
1.136 |
67 |
1.192 |
302.666 |
| |
females |
6.422 |
31.853 |
4.385 |
261 |
28 |
42.949 |
39.182 |
93.447 |
1.786 |
186 |
116 |
134.717 |
| |
total |
12.005 |
64.365 |
6.894 |
288 |
93 |
83.645 |
200.843 |
232.057 |
2.922 |
253 |
1.308 |
437.383 |
| 35-39 |
males |
2.747 |
30.184 |
2.161 |
63 |
44 |
35.199 |
113.941 |
136.735 |
1.286 |
114 |
1.243 |
253.319 |
| |
females |
4.503 |
29.921 |
4.330 |
575 |
35 |
39.364 |
28.206 |
82.510 |
1.721 |
330 |
152 |
112.919 |
| |
total |
7.250 |
60.105 |
6.491 |
638 |
79 |
74.563 |
142.147 |
219.245 |
3.007 |
444 |
1.395 |
366.238 |
| 40-44 |
males |
1.669 |
26.676 |
1.891 |
66 |
44 |
30.346 |
85.331 |
122.406 |
1.504 |
110 |
646 |
209.997 |
| |
females |
3.241 |
26.283 |
4.040 |
831 |
29 |
34.424 |
19.784 |
64.469 |
1.608 |
511 |
132 |
86.504 |
| |
total |
4.910 |
52.959 |
5.931 |
897 |
73 |
64.770 |
105.115 |
186.875 |
3.112 |
621 |
778 |
296.501 |
| 45-49 |
males |
1.071 |
22.934 |
1.551 |
114 |
31 |
25.701 |
50.722 |
101.206 |
1.513 |
110 |
349 |
153.900 |
| |
females |
2.373 |
22.310 |
3.648 |
1.388 |
47 |
29.766 |
11.310 |
46.769 |
1.354 |
693 |
77 |
60.203 |
| |
total |
3.444 |
45.244 |
5.199 |
1.502 |
78 |
55.467 |
62.032 |
147.975 |
2.867 |
803 |
426 |
214.103 |
| 50-54 |
males |
671 |
17.554 |
1.182 |
138 |
17 |
19.562 |
24.172 |
75.411 |
1.170 |
118 |
152 |
101.023 |
| |
females |
1.637 |
17.198 |
2.855 |
2.102 |
56 |
23.848 |
4.843 |
28.025 |
997 |
816 |
42 |
34.723 |
| |
total |
2.308 |
34.752 |
4.037 |
2.240 |
73 |
43.410 |
29.015 |
103.436 |
2.167 |
934 |
194 |
135.746 |
| 55-59 |
males |
379 |
13.283 |
740 |
229 |
16 |
14.647 |
8.383 |
52.047 |
819 |
139 |
81 |
61.469 |
| |
females |
1.084 |
13.171 |
2.021 |
3.220 |
34 |
19.530 |
1.695 |
15.583 |
604 |
970 |
13 |
18.865 |
| |
total |
1.463 |
26.454 |
2.761 |
3.449 |
50 |
34.177 |
10.078 |
67.630 |
1.423 |
1.109 |
94 |
80.334 |
| TOTAL |
males |
140.596 |
183.620 |
13.365 |
648 |
336 |
338.565 |
690.487 |
755.200 |
8.100 |
730 |
16.388 |
1.470.905 |
| |
females |
124.218 |
197.271 |
28.434 |
8.537 |
312 |
358.772 |
228.875 |
452.884 |
10.196 |
3.630 |
11.110 |
706.695 |
| |
total |
264.814 |
380.891 |
41.799 |
9.185 |
648 |
697.337 |
919.362 |
1.208.084 |
18.296 |
4.360 |
27.498 |
2.177.600 |
Source: PACI
ANNEXED NOTE
1. Characteristics of data and definitions
The source of data used here is the Public Authority for Civil Information (PACI), an independant government body in charge of :
1- centralising all population and labour force data in order to manage a fully computerised population register
2- issuing mandatory civil identification cards to every resident of the country, regardless of age and nationality.
The other source of demographic and socioeconomic data on Kuwait is the Central Statistical Office (CSO), operating within the Planning Ministry. The CSO has conducted ten population and housing censuses since its inception in 1957.
Since 1995 a marked discrepancy was witnessed between PACI’ and CSO’ population figures. PACI’ database is connected electronically with other administrations and bodies registering demographic events and professional/ residency issues (births and death; departures and arrivals; end of service, residency and ID deliveries, etc.).
PACI’s records of residents’ movements is thus regularly updated, which limits the risk of population overcount. Therefore, it is more likely that residents were undercounted during CSO- Ministry of Planning’s census operations (see: Shah, N. Population of Kuwait. Structure and Dynamics, Kuwait: Kuwait University Academic Publication Council, 2010, chapter 1).
(a) Kuwaiti: the Kuwaiti nationality rests upon a document of Kuwaiti nationality or a certificate proving Kuwaiti nationality issued by the Ministry of Interior of Kuwait.
(b) Non-Kuwaiti: his/ her nationality is determined by the name of the State which issued the passport. The foreign national also entered Kuwait legally and has a stamp of residence.
This category includes the Bidoon, a category of stateless persons living in the Emirate. Kuwait’s Bidoon population originates from three broad categories:
1) those whose ancestors failed to apply for nationality or lacked necessary documentation at the time of Kuwait’s independence in 1961;
2) those recruited to work in Kuwait’s army or police force during the 1960s who permanently settled in Kuwait, along with their families;
3) children of Kuwaiti mothers and stateless or foreign fathers (see Human Rights Watch. Prisoners of the Past. Kuwaiti Bidun and the Burden of Statelessness, June 2011, p. 3).
(c) Working age population: population aged 15 to 60.
2. Institution which provides data
The Public Authority for Civil Information (PACI)
3. Period of data coverage: December 2012
The database is updated three times a year and the website presents only the most recent data.
4. Data availability
The statistics section of PACI’s website (http://www.paci.gov.kw/en/ (English); http://www.paci.gov.kw/ (Arabic)) provides population and socio-economic data broken down by nationality (Kuwaiti/ non-Kuwaiti). Some data are displayed by nationality groups.
Analytical tables and data crosstabulations are available for download in PDF, html, .png and Excel (.csv) formats.
Date of access: June 2013.
| |
|
Kuwaitis |
|
|
|
|
|
|
|
|
|
|
|
Non-Kuwaitis |
|
|
|
|
|
|
|
|
|
|
|
|
|
|
GRAND |
|
| |
|
|
|
|
Arabs |
|
|
Asians |
|
|
Africans |
|
|
Europeans |
|
|
North Americans |
|
|
South Americans |
|
|
Australians- Oceanians |
|
|
TOTAL non-Kuwaitis |
|
|
TOTAL |
|
| Age group |
males |
females |
total |
males |
females |
total |
males |
females |
total |
males |
females |
total |
males |
females |
total |
males |
females |
total |
males |
females |
total |
males |
females |
total |
males |
females |
total |
males |
females |
total |
| 15-19 |
66.780 |
64.271 |
131.051 |
33.784 |
29.264 |
63.048 |
8.047 |
7.176 |
15.223 |
193 |
136 |
329 |
314 |
307 |
621 |
727 |
692 |
1.419 |
60 |
54 |
114 |
80 |
75 |
155 |
43.205 |
37.704 |
80.909 |
109.985 |
101.975 |
211.960 |
| 20-24 |
56.518 |
54.736 |
111.254 |
50.404 |
33.280 |
83.684 |
49.539 |
24.064 |
73.603 |
789 |
16.817 |
17.606 |
208 |
333 |
541 |
485 |
506 |
991 |
53 |
72 |
125 |
49 |
52 |
101 |
101.527 |
75.124 |
176.651 |
158.045 |
129.860 |
287.905 |
| 25-29 |
49.116 |
49.884 |
99.000 |
99.665 |
46.195 |
145.860 |
140.388 |
69.388 |
209.776 |
2.376 |
28.889 |
31.265 |
313 |
605 |
918 |
930 |
748 |
1.678 |
94 |
60 |
154 |
33 |
51 |
84 |
243.799 |
145.936 |
389.735 |
292.915 |
195.820 |
488.735 |
| 30-34 |
40.696 |
42.949 |
83.645 |
101.443 |
39.885 |
141.328 |
198.144 |
83.277 |
281.421 |
1.255 |
10.002 |
11.257 |
544 |
735 |
1.279 |
1.168 |
701 |
1.869 |
62 |
67 |
129 |
50 |
50 |
100 |
302.666 |
134.717 |
437.383 |
343.362 |
177.666 |
521.028 |
| 35-39 |
35.199 |
39.364 |
74.563 |
77.793 |
28.661 |
106.454 |
173.165 |
79.817 |
252.982 |
619 |
3.057 |
3.676 |
641 |
708 |
1.349 |
985 |
568 |
1.553 |
65 |
58 |
123 |
51 |
50 |
101 |
253.319 |
112.919 |
366.238 |
288.518 |
152.283 |
440.801 |
| 40-44 |
30.346 |
34.424 |
64.770 |
61.071 |
21.230 |
82.301 |
146.451 |
63.279 |
209.730 |
398 |
757 |
1.155 |
752 |
590 |
1.342 |
1.183 |
549 |
1.732 |
82 |
42 |
124 |
60 |
57 |
117 |
209.997 |
86.504 |
296.501 |
240.343 |
120.928 |
361.271 |
| 45-49 |
25.701 |
29.766 |
55.467 |
51.704 |
16.596 |
68.300 |
99.448 |
42.257 |
141.705 |
294 |
200 |
494 |
778 |
511 |
1.289 |
1.514 |
536 |
2.050 |
85 |
41 |
126 |
77 |
62 |
139 |
153.900 |
60.203 |
214.103 |
179.601 |
89.969 |
269.570 |
| 50-54 |
19.562 |
23.848 |
43.410 |
35.874 |
12.339 |
48.213 |
62.664 |
21.249 |
83.913 |
177 |
121 |
298 |
719 |
408 |
1.127 |
1.429 |
530 |
1.959 |
80 |
29 |
109 |
80 |
47 |
127 |
101.023 |
34.723 |
135.746 |
120.585 |
58.571 |
179.156 |
| 55-59 |
14.647 |
19.530 |
34.177 |
24.280 |
8.645 |
32.925 |
35.267 |
9.419 |
44.686 |
134 |
86 |
220 |
616 |
309 |
925 |
1.059 |
357 |
1.416 |
51 |
23 |
74 |
62 |
26 |
88 |
61.469 |
18.865 |
80.334 |
76.116 |
38.395 |
114.511 |
| TOTAL |
338.565 |
358.772 |
697.337 |
536.018 |
236.095 |
772.113 |
913.113 |
399.926 |
1.313.039 |
6.235 |
60.065 |
66.300 |
4.885 |
4.506 |
9.391 |
9.480 |
5.187 |
14.667 |
632 |
446 |
1.078 |
542 |
470 |
1.012 |
1.470.905 |
706.695 |
2.177.600 |
1.809.470 |
1.065.467 |
2.874.937 |
Source: PACI
ANNEXED NOTE
1. Characteristics of data and definitions
The source of data used here is the Public Authority for Civil Information (PACI), an independant government body in charge of :
1- centralising all population and labour force data in order to manage a fully computerised population register
2- issuing mandatory civil identification cards to every resident of the country, regardless of age and nationality.
The other source of demographic and socioeconomic data on Kuwait is the Central Statistical Office (CSO), operating within the Planning Ministry. The CSO has conducted ten population and housing censuses since its inception in 1957.
Since 1995 a marked discrepancy was witnessed between PACI’ and CSO’ population figures. PACI’ database is connected electronically with other administrations and bodies registering demographic events and professional/ residency issues (births and death; departures and arrivals; end of service, residency and ID deliveries, etc.).
PACI’s records of residents’ movements is thus regularly updated, which limits the risk of population overcount. Therefore, it is more likely that residents were undercounted during CSO- Ministry of Planning’s census operations (see: Shah, N. Population of Kuwait. Structure and Dynamics, Kuwait: Kuwait University Academic Publication Council, 2010, chapter 1).
(a) Kuwaiti: the Kuwaiti nationality rests upon a document of Kuwaiti nationality or a certificate proving Kuwaiti nationality issued by the Ministry of Interior of Kuwait.
(b) Non-Kuwaiti: his/ her nationality is determined by the name of the State which issued the passport. The foreign national also entered Kuwait legally and has a stamp of residence.
This category includes the Bidoon, a category of stateless persons living in the Emirate. Kuwait’s Bidoon population originates from three broad categories:
1) those whose ancestors failed to apply for nationality or lacked necessary documentation at the time of Kuwait’s independence in 1961;
2) those recruited to work in Kuwait’s army or police force during the 1960s who permanently settled in Kuwait, along with their families;
3) children of Kuwaiti mothers and stateless or foreign fathers (see Human Rights Watch. Prisoners of the Past. Kuwaiti Bidun and the Burden of Statelessness, June 2011, p. 3).
(c) Nationality group: collected according to the nationality of the head of the household.
Nationalities are grouped according to specific features common to certain population subgroups: language, geographic origin, etc. or according to internationally recognized categories such as: (Arab / non-Arab Asian countries / non-Arab African countries; European countries … etc.).
(d) Working age population: population aged 15 to 60.
2. Institution which provides data
The Public Authority for Civil Information (PACI)
3. Period of data coverage: December 2012
The database is updated three times a year and the website presents only the most recent data.
4. Data availability
The statistics section of PACI’s website (http://www.paci.gov.kw/en/ (English); http://www.paci.gov.kw/ (Arabic)) provides population and socio-economic data broken down by nationality (Kuwaiti/ non-Kuwaiti). Some data are displayed by nationality groups.
Analytical tables and data crosstabulations are available for download in PDF, html, .png and Excel (.csv) formats.
Date of access: June 2013.
| |
Kuwaitis |
|
|
|
Non-Kuwaitis |
|
|
|
|
GRAND |
| |
|
Arabs |
Asians |
Africans |
Europeans |
North Americans |
South Americans |
Australians- Oceanians |
TOTAL non-Kuwaitis |
TOTAL |
| males |
338.565 |
536.018 |
913.113 |
6.235 |
4.885 |
9.480 |
632 |
542 |
1.470.905 |
1.809.470 |
| females |
358.772 |
236.095 |
399.926 |
60.065 |
4.506 |
5.187 |
446 |
470 |
706.695 |
1.065.467 |
| Total |
697.337 |
772.113 |
1.313.039 |
66.300 |
9.391 |
14.667 |
1.078 |
1.012 |
2.177.600 |
2.874.937 |
Source: PACI
ANNEXED NOTE
1. Characteristics of data and definitions
The source of data used here is the Public Authority for Civil Information (PACI), an independant government body in charge of :
1- centralising all population and labour force data in order to manage a fully computerised population register
2- issuing mandatory civil identification cards to every resident of the country, regardless of age and nationality.
The other source of demographic and socioeconomic data on Kuwait is the Central Statistical Office (CSO), operating within the Planning Ministry. The CSO has conducted ten population and housing censuses since its inception in 1957.
Since 1995 a marked discrepancy was witnessed between PACI’ and CSO’ population figures. PACI’ database is connected electronically with other administrations and bodies registering demographic events and professional/ residency issues (births and death; departures and arrivals; end of service, residency and ID deliveries, etc.).
PACI’s records of residents’ movements is thus regularly updated, which limits the risk of population overcount. Therefore, it is more likely that residents were undercounted during CSO- Ministry of Planning’s census operations (see: Shah, N. Population of Kuwait. Structure and Dynamics, Kuwait: Kuwait University Academic Publication Council, 2010, chapter 1).
(a) Kuwaiti: the Kuwaiti nationality rests upon a document of Kuwaiti nationality or a certificate proving Kuwaiti nationality issued by the Ministry of Interior of Kuwait.
(b) Non-Kuwaiti: his/ her nationality is determined by the name of the State which issued the passport. The foreign national also entered Kuwait legally and has a stamp of residence.
This category includes the Bidoon, a category of stateless persons living in the Emirate. Kuwait’s Bidoon population originates from three broad categories:
1) those whose ancestors failed to apply for nationality or lacked necessary documentation at the time of Kuwait’s independence in 1961;
2) those recruited to work in Kuwait’s army or police force during the 1960s who permanently settled in Kuwait, along with their families;
3) children of Kuwaiti mothers and stateless or foreign fathers (see Human Rights Watch. Prisoners of the Past. Kuwaiti Bidun and the Burden of Statelessness, June 2011, p. 3).
(c) Nationality group: collected according to the nationality of the head of the household.
Nationalities are grouped according to specific features common to certain population subgroups: language, geographic origin, etc. or according to internationally recognized categories such as: (Arab / non-Arab Asian countries / non-Arab African countries; European countries … etc.).
(d) Working age population: population aged 15 to 60.
2. Institution which provides data
The Public Authority for Civil Information (PACI)
3. Period of data coverage: December 2012
The database is updated three times a year and the website presents only the most recent data.
4. Data availability
The statistics section of PACI’s website (http://www.paci.gov.kw/en/ (English); http://www.paci.gov.kw/ (Arabic)) provides population and socio-economic data broken down by nationality (Kuwaiti/ non-Kuwaiti). Some data are displayed by nationality groups.
Analytical tables and data crosstabulations are available for download in PDF, html, .png and Excel (.csv) formats.
Date of access: June 2013.
| Nationality |
|
KUWAITIS |
|
|
NON-KUWAITIS |
|
| Age group/ Place of birth |
Outside Kuwait |
In Kuwait |
Total |
Outside Kuwait |
In Kuwait |
Total |
| 15-19 |
5.096 |
125.955 |
131.051 |
31.362 |
49.547 |
80.909 |
| 20-24 |
9.242 |
102.012 |
111.254 |
137.142 |
39.509 |
176.651 |
| 25-29 |
3.133 |
95.867 |
99.000 |
344.844 |
44.891 |
389.735 |
| 30-34 |
3.670 |
79.975 |
83.645 |
401.695 |
35.688 |
437.383 |
| 35-39 |
3.661 |
70.902 |
74.563 |
342.635 |
23.603 |
366.238 |
| 40-44 |
3.758 |
61.012 |
64.770 |
279.692 |
16.809 |
296.501 |
| 45-49 |
3.372 |
52.095 |
55.467 |
202.977 |
11.126 |
214.103 |
| 50-54 |
3.065 |
40.345 |
43.410 |
130.370 |
5.376 |
135.746 |
| 55-59 |
3.321 |
30.856 |
34.177 |
78.068 |
2.266 |
80.334 |
| Total |
38.318 |
659.019 |
697.337 |
1.948.785 |
228.815 |
2.177.600 |
Source: PACI
ANNEXED NOTE
1. Characteristics of data and definitions
The source of data used here is the Public Authority for Civil Information (PACI), an independant government body in charge of :
1- centralising all population and labour force data in order to manage a fully computerised population register
2- issuing mandatory civil identification cards to every resident of the country, regardless of age and nationality.
The other source of demographic and socioeconomic data on Kuwait is the Central Statistical Office (CSO), operating within the Planning Ministry. The CSO has conducted ten population and housing censuses since its inception in 1957.
Since 1995 a marked discrepancy was witnessed between PACI’ and CSO’ population figures. PACI’ database is connected electronically with other administrations and bodies registering demographic events and professional/ residency issues (births and death; departures and arrivals; end of service, residency and ID deliveries, etc.).
PACI’s records of residents’ movements is thus regularly updated, which limits the risk of population overcount. Therefore, it is more likely that residents were undercounted during CSO- Ministry of Planning’s census operations (see: Shah, N. Population of Kuwait. Structure and Dynamics, Kuwait: Kuwait University Academic Publication Council, 2010, chapter 1).
(a) Kuwaiti: the Kuwaiti nationality rests upon a document of Kuwaiti nationality or a certificate proving Kuwaiti nationality issued by the Ministry of Interior of Kuwait.
(b) Non-Kuwaiti: his/ her nationality is determined by the name of the State which issued the passport. The foreign national also entered Kuwait legally and has a stamp of residence.
This category includes the Bidoon, a category of stateless persons living in the Emirate. Kuwait’s Bidoon population originates from three broad categories:
1) those whose ancestors failed to apply for nationality or lacked necessary documentation at the time of Kuwait’s independence in 1961;
2) those recruited to work in Kuwait’s army or police force during the 1960s who permanently settled in Kuwait, along with their families;
3) children of Kuwaiti mothers and stateless or foreign fathers (see Human Rights Watch. Prisoners of the Past. Kuwaiti Bidun and the Burden of Statelessness, June 2011, p. 3).
(c) Working age population: population aged 15 to 60.
2. Institution which provides data
The Public Authority for Civil Information (PACI)
3. Period of data coverage: December 2012
The database is updated three times a year and the website presents only the most recent data.
4. Data availability
The statistics section of PACI’s website (http://www.paci.gov.kw/en/ (English); http://www.paci.gov.kw/ (Arabic)) provides population and socio-economic data broken down by nationality (Kuwaiti/ non-Kuwaiti). Some data are displayed by nationality groups.
Analytical tables and data crosstabulations are available for download in PDF, html, .png and Excel (.csv) formats.
Date of access: June 2013.
| Nationality group |
TOTAL |
| Kuwaitis |
697.337 |
| Arabs |
772.113 |
| Asians |
1.313.039 |
| Africans |
66.300 |
| Europeans |
9.391 |
| North Americans |
14.667 |
| South Americans |
1.078 |
| Australians- Oceanians |
1.012 |
| TOTAL non-Kuwaitis |
2.177.600 |
| TOTAL |
2.874.937 |
Source: PACI
ANNEXED NOTE
1. Characteristics of data and definitions
The source of data used here is the Public Authority for Civil Information (PACI), an independant government body in charge of :
1- centralising all population and labour force data in order to manage a fully computerised population register
2- issuing mandatory civil identification cards to every resident of the country, regardless of age and nationality.
The other source of demographic and socioeconomic data on Kuwait is the Central Statistical Office (CSO), operating within the Planning Ministry. The CSO has conducted ten population and housing censuses since its inception in 1957.
Since 1995 a marked discrepancy was witnessed between PACI’ and CSO’ population figures. PACI’ database is connected electronically with other administrations and bodies registering demographic events and professional/ residency issues (births and death; departures and arrivals; end of service, residency and ID deliveries, etc.).
PACI’s records of residents’ movements is thus regularly updated, which limits the risk of population overcount. Therefore, it is more likely that residents were undercounted during CSO- Ministry of Planning’s census operations (see: Shah, N. Population of Kuwait. Structure and Dynamics, Kuwait: Kuwait University Academic Publication Council, 2010, chapter 1).
(a) Kuwaiti: the Kuwaiti nationality rests upon a document of Kuwaiti nationality or a certificate proving Kuwaiti nationality issued by the Ministry of Interior of Kuwait.
(b) Non-Kuwaiti: his/ her nationality is determined by the name of the State which issued the passport. The foreign national also entered Kuwait legally and has a stamp of residence.
This category includes the Bidoon, a category of stateless persons living in the Emirate. Kuwait’s Bidoon population originates from three broad categories:
1) those whose ancestors failed to apply for nationality or lacked necessary documentation at the time of Kuwait’s independence in 1961;
2) those recruited to work in Kuwait’s army or police force during the 1960s who permanently settled in Kuwait, along with their families;
3) children of Kuwaiti mothers and stateless or foreign fathers (see Human Rights Watch. Prisoners of the Past. Kuwaiti Bidun and the Burden of Statelessness, June 2011, p. 3).
(c) Nationality group: collected according to the nationality of the head of the household.
Nationalities are grouped according to specific features common to certain population subgroups: language, geographic origin, etc. or according to internationally recognized categories such as: (Arab / non-Arab Asian countries / non-Arab African countries; European countries … etc.).
(d) Working age population: population aged 15 to 60.
2. Institution which provides data
The Public Authority for Civil Information (PACI)
3. Period of data coverage: December 2012
The database is updated three times a year and the website presents only the most recent data.
4. Data availability
The statistics section of PACI’s website (http://www.paci.gov.kw/en/ (English); http://www.paci.gov.kw/ (Arabic)) provides population and socio-economic data broken down by nationality (Kuwaiti/ non-Kuwaiti). Some data are displayed by nationality groups.
Analytical tables and data crosstabulations are available for download in PDF, html, .png and Excel (.csv) formats.
Date of access: June 2013.
|
|
In the labour force |
|
|
Out of the labour force |
|
|
Non stated |
|
|
TOTAL |
|
| |
males |
females |
total |
males |
females |
total |
males |
females |
total |
males |
females |
total |
| Kuwaitis |
214.043 |
185.302 |
399.345 |
144.679 |
210.438 |
355.117 |
7.562 |
28 |
7.590 |
366.284 |
395.768 |
762.052 |
| Non-Kuwaitis |
1.427.690 |
469.220 |
1.896.910 |
77.867 |
259.116 |
336.983 |
14.214 |
7 |
14.221 |
1.519.771 |
728.343 |
2.248.114 |
| Total |
1.641.733 |
654.522 |
2.296.255 |
222.546 |
469.554 |
692.100 |
21.776 |
35 |
21.811 |
1.886.055 |
1.124.111 |
3.010.166 |
Source: PACI
ANNEXED NOTE
1. Characteristics of data and definitions
The source of data used here is the Public Authority for Civil Information (PACI), an independant government body in charge of :
1- centralising all population and labour force data in order to manage a fully computerised population register
2- issuing mandatory civil identification cards to every resident of the country, regardless of age and nationality.
The other source of demographic and socioeconomic data on Kuwait is the Central Statistical Office (CSO), operating within the Planning Ministry. The CSO has conducted ten population and housing censuses since its inception in 1957.
Since 1995 a marked discrepancy was witnessed between PACI’ and CSO’ population figures. PACI’ database is connected electronically with other administrations and bodies registering demographic events and professional/ residency issues (births and death; departures and arrivals; end of service, residency and ID deliveries, etc.).
PACI’s records of residents’ movements is thus regularly updated, which limits the risk of population overcount. Therefore, it is more likely that residents were undercounted during CSO- Ministry of Planning’s census operations (see: Shah, N. Population of Kuwait. Structure and Dynamics, Kuwait: Kuwait University Academic Publication Council, 2010, chapter 1).
(a) Kuwaiti: the Kuwaiti nationality rests upon a document of Kuwaiti nationality or a certificate proving Kuwaiti nationality issued by the Ministry of Interior of Kuwait.
(b) Non-Kuwaiti: his/ her nationality is determined by the name of the State which issued the passport. The foreign national also entered Kuwait legally and has a stamp of residence.
This category includes the Bidoon, a category of stateless persons living in the Emirate. Kuwait’s Bidoon population originates from three broad categories:
1) those whose ancestors failed to apply for nationality or lacked necessary documentation at the time of Kuwait’s independence in 1961;
2) those recruited to work in Kuwait’s army or police force during the 1960s who permanently settled in Kuwait, along with their families;
3) children of Kuwaiti mothers and stateless or foreign fathers (see Human Rights Watch. Prisoners of the Past. Kuwaiti Bidun and the Burden of Statelessness, June 2011, p. 3).
(c) Population in the labour force: population aged 15 years and above, included in the labour market, either employed (in the government or private sector, as itinerant worker, employed in the domestic sector), or unemployed.
(d) Population out of the labour force: population aged 15 years and above, not contributing to any economic activity and not included in the labour market, among which the students, the housewives, the retired persons or self-sufficients.
2. Institution which provides data
The Public Authority for Civil Information (PACI)
3. Period of data coverage: December 2012
The database is updated three times a year and the website presents only the most recent data.
4. Data availability
The statistics section of PACI’s website (http://www.paci.gov.kw/en/ (English); http://www.paci.gov.kw/ (Arabic)) provides population and socio-economic data broken down by nationality (Kuwaiti/ non-Kuwaiti). Some data are displayed by nationality groups.
Analytical tables and data crosstabulations are available for download in PDF, html, .png and Excel (.csv) formats.
Date of access: June 2013.
| |
Nationality group |
Kuwaitis |
Arabs |
Asians |
Africans |
Europeans |
North |
South |
Australians- |
Total |
GRAND |
| Governorate |
Sex |
|
|
|
|
|
Americans |
Americans |
Oceanians |
Non-Kuwaitis |
TOTAL |
| Capital |
males |
111.679 |
44.801 |
124.085 |
816 |
724 |
1.046 |
77 |
88 |
171.637 |
283.316 |
| |
females |
117.928 |
20.482 |
82.015 |
12.368 |
711 |
845 |
55 |
66 |
116.542 |
234.470 |
| |
total |
229.607 |
65.283 |
206.100 |
13.184 |
1.435 |
1.891 |
132 |
154 |
288.179 |
517.786 |
| Hawalli |
males |
102.623 |
200.055 |
145.450 |
1.006 |
3.962 |
5.825 |
316 |
487 |
357.101 |
459.724 |
| |
females |
105.489 |
122.741 |
124.862 |
13.088 |
3.890 |
4.572 |
287 |
457 |
269.897 |
375.386 |
| |
total |
208.112 |
322.796 |
270.312 |
14.094 |
7.852 |
10.397 |
603 |
944 |
626.998 |
835.110 |
| Ahmadi |
males |
126.535 |
89.858 |
256.070 |
1.277 |
1.566 |
5.635 |
202 |
140 |
354.748 |
481.283 |
| |
females |
128.752 |
47.862 |
77.823 |
8.349 |
864 |
2.168 |
154 |
110 |
137.330 |
266.082 |
| |
total |
255.287 |
137.720 |
333.893 |
9.626 |
2.430 |
7.803 |
356 |
250 |
492.078 |
747.365 |
| Jahra |
males |
77.630 |
109.296 |
79.682 |
1.448 |
137 |
238 |
94 |
64 |
190.959 |
268.589 |
| |
females |
81.474 |
87.147 |
31.185 |
9.409 |
122 |
180 |
33 |
50 |
128.126 |
209.600 |
| |
total |
159.104 |
196.443 |
110.867 |
10.857 |
259 |
418 |
127 |
114 |
319.085 |
478.189 |
| Farwaniya |
males |
107.812 |
236.433 |
337.376 |
1.975 |
558 |
689 |
104 |
79 |
577.214 |
685.026 |
| |
females |
112.914 |
87.117 |
113.221 |
11.063 |
369 |
544 |
63 |
52 |
212.429 |
325.343 |
| |
total |
220.726 |
323.550 |
450.597 |
13.038 |
927 |
1.233 |
167 |
131 |
789.643 |
1.010.369 |
| Mubarak Al Kabeer |
males |
68.951 |
8.469 |
41.824 |
229 |
226 |
203 |
32 |
11 |
50.994 |
119.945 |
| |
females |
70.381 |
6.796 |
25.854 |
6.255 |
348 |
186 |
28 |
11 |
39.478 |
109.859 |
| |
total |
139.332 |
15.265 |
67.678 |
6.484 |
574 |
389 |
60 |
22 |
90.472 |
229.804 |
| Not stated |
males |
135 |
1.969 |
734 |
36 |
34 |
35 |
2 |
5 |
2.815 |
2.950 |
| |
females |
133 |
1.581 |
330 |
44 |
23 |
42 |
1 |
1 |
2.022 |
2.155 |
| |
total |
268 |
3.550 |
1.064 |
80 |
57 |
77 |
3 |
6 |
4.837 |
5.105 |
| TOTAL |
males |
595.365 |
690.881 |
985.221 |
6.787 |
7.207 |
13.671 |
827 |
874 |
1.705.468 |
2.300.833 |
| |
females |
617.071 |
373.726 |
455.290 |
60.576 |
6.327 |
8.537 |
621 |
747 |
905.824 |
1.522.895 |
| |
total |
1.212.436 |
1.064.607 |
1.440.511 |
67.363 |
13.534 |
22.208 |
1.448 |
1.621 |
2.611.292 |
3.823.728 |
Source: PACI
ANNEXED NOTE
1. Characteristics of data and definitions
The source of data used here is the Public Authority for Civil Information (PACI), an independant government body in charge of :
1- centralising all population and labour force data in order to manage a fully computerised population register
2- issuing mandatory civil identification cards to every resident of the country, regardless of age and nationality.
The other source of demographic and socioeconomic data on Kuwait is the Central Statistical Office (CSO), operating within the Planning Ministry. The CSO has conducted ten population and housing censuses since its inception in 1957.
Since 1995 a marked discrepancy was witnessed between PACI’ and CSO’ population figures. PACI’ database is connected electronically with other administrations and bodies registering demographic events and professional/ residency issues (births and death; departures and arrivals; end of service, residency and ID deliveries, etc.).
PACI’s records of residents’ movements is thus regularly updated, which limits the risk of population overcount. Therefore, it is more likely that residents were undercounted during CSO- Ministry of Planning’s census operations (see: Shah, N. Population of Kuwait. Structure and Dynamics, Kuwait: Kuwait University Academic Publication Council, 2010, chapter 1).
(a) Kuwaiti: the Kuwaiti nationality rests upon a document of Kuwaiti nationality or a certificate proving Kuwaiti nationality issued by the Ministry of Interior of Kuwait.
(b) Non-Kuwaiti: his/ her nationality is determined by the name of the State having issued the passport. The foreign national also entered Kuwait legally and has a stamp of residence.
This category includes the Bidoon, a category of stateless persons living in the Emirate. Kuwait’s Bidoon population originates from three broad categories:
1) those whose ancestors failed to apply for nationality or lacked necessary documentation at the time of Kuwait’s independence in 1961;
2) those recruited to work in Kuwait’s army or police force during the 1960s who permanently settled in Kuwait, along with their families;
3) children of Kuwaiti mothers and stateless or foreign fathers (see Human Rights Watch. Prisoners of the Past. Kuwaiti Bidun and the Burden of Statelessness, June 2011, p. 3).
(c) Nationality group: collected according to the nationality of the head of the household.
Nationalities are grouped along specific features common to certain population subgroups: language, geographic origin, etc. or according to internationally recognized categories such as: (Arab / non-Arab Asian countries / non-Arab African countries; European countries … etc.).
2. Institution which provides data
The Public Authority for Civil Information (PACI)
3. Period of data coverage: December 2012
The database is updated three times a year and the website presents only the most recent data.
4. Data availability
The statistics section of PACI’s website (http://www.paci.gov.kw/en/ (English); http://www.paci.gov.kw/ (Arabic)) provides population and socio-economic data broken down by nationality (Kuwaiti/ non-Kuwaiti). Some data are displayed by nationality groups.
Analytical tables and data crosstabulations are available for download in PDF, html, .png and Excel (.csv) formats.
Date of access: June 2013.
| Nationality |
|
Kuwaitis |
|
|
Non-Kuwaitis |
|
|
TOTAL |
|
| Governorate |
males |
females |
Total |
males |
females |
Total |
males |
females |
Total |
| Capital |
111.679 |
117.928 |
229.607 |
171.637 |
116.542 |
288.179 |
283.316 |
234.470 |
517.786 |
| Hawalli |
102.623 |
105.489 |
208.112 |
357.101 |
269.897 |
626.998 |
459.724 |
375.386 |
835.110 |
| Ahmadi |
126.535 |
128.752 |
255.287 |
354.748 |
137.330 |
492.078 |
481.283 |
266.082 |
747.365 |
| Jahra |
77.630 |
81.474 |
159.104 |
190.959 |
128.126 |
319.085 |
268.589 |
209.600 |
478.189 |
| Farwaniya |
107.812 |
112.914 |
220.726 |
577.214 |
212.429 |
789.643 |
685.026 |
325.343 |
1.010.369 |
| Mubarak Al Kabeer |
68.951 |
70.381 |
139.332 |
50.994 |
39.478 |
90.472 |
119.945 |
109.859 |
229.804 |
| Not stated |
135 |
133 |
268 |
2.815 |
2.022 |
4.837 |
2.950 |
2.155 |
5.105 |
| TOTAL |
595.365 |
617.071 |
1.212.436 |
1.705.468 |
905.824 |
2.611.292 |
2.300.833 |
1.522.895 |
3.823.728 |
Source: PACI
ANNEXED NOTE
1. Characteristics of data and definitions
The source of data used here is the Public Authority for Civil Information (PACI), an independant government body in charge of :
1- centralising all population and labour force data in order to manage a fully computerised population register
2- issuing mandatory civil identification cards to every resident of the country, regardless of age and nationality.
The other source of demographic and socioeconomic data on Kuwait is the Central Statistical Office (CSO), operating within the Planning Ministry. The CSO has conducted ten population and housing censuses since its inception in 1957.
Since 1995 a marked discrepancy was witnessed between PACI’ and CSO’ population figures. PACI’ database is connected electronically with other administrations and bodies registering demographic events and professional/ residency issues (births and death; departures and arrivals; end of service, residency and ID deliveries, etc.).
PACI’s records of residents’ movements is thus regularly updated, which limits the risk of population overcount. Therefore, it is more likely that residents were undercounted during CSO- Ministry of Planning’s census operations (see: Shah, N. Population of Kuwait. Structure and Dynamics, Kuwait: Kuwait University Academic Publication Council, 2010, chapter 1).
(a) Kuwaiti: the Kuwaiti nationality rests upon a document of Kuwaiti nationality or a certificate proving Kuwaiti nationality issued by the Ministry of Interior of Kuwait.
(b) Non-Kuwaiti: his/ her nationality is determined by the name of the State which issued the passport. The foreign national also entered Kuwait legally and has a stamp of residence.
This category includes the Bidoon, a category of stateless persons living in the Emirate. Kuwait’s Bidoon population originates from three broad categories:
1) those whose ancestors failed to apply for nationality or lacked necessary documentation at the time of Kuwait’s independence in 1961;
2) those recruited to work in Kuwait’s army or police force during the 1960s who permanently settled in Kuwait, along with their families;
3) children of Kuwaiti mothers and stateless or foreign fathers (see Human Rights Watch. Prisoners of the Past. Kuwaiti Bidun and the Burden of Statelessness, June 2011, p. 3).
2. Institution which provides data
The Public Authority for Civil Information (PACI)
3. Period of data coverage: December 2012
The database is updated three times a year and the website presents only the most recent data.
4. Data availability
The statistics section of PACI’s website (http://www.paci.gov.kw/en/ (English); http://www.paci.gov.kw/ (Arabic)) provides population and socio-economic data broken down by nationality (Kuwaiti/ non-Kuwaiti). Some data are displayed by nationality groups.
Analytical tables and data crosstabulations are available for download in PDF, html, .png and Excel (.csv) formats.
Date of access: June 2013.
| Age |
Nationality |
|
|
|
|
KUWAITIS |
|
|
|
|
|
|
|
|
|
NON KUWAITIS |
|
|
|
|
|
| group |
Education level |
Illiterate |
Reads and writes |
Elementary |
Intermediate |
High school diploma |
Diploma |
University degree |
Postgraduate |
NA |
Total |
Illiterate |
Reads and writes |
Elementary |
Intermediate |
High school diploma |
Diploma |
University degree |
Postgraduate |
NA |
Total |
| 10-14 |
males |
2 |
32 |
36.734 |
0 |
0 |
0 |
0 |
0 |
31.611 |
68.379 |
145 |
6.857 |
18.319 |
0 |
0 |
0 |
0 |
0 |
21.543 |
46.864 |
| |
females |
1 |
23 |
36.145 |
0 |
0 |
0 |
0 |
0 |
29.451 |
65.620 |
157 |
6.315 |
18.102 |
0 |
0 |
0 |
0 |
0 |
20.041 |
44.615 |
| |
total |
3 |
55 |
72.879 |
0 |
0 |
0 |
0 |
0 |
61.062 |
133.999 |
302 |
13.172 |
36.421 |
0 |
0 |
0 |
0 |
0 |
41.584 |
91.479 |
| 15-19 |
males |
8 |
1 |
24.408 |
35.717 |
3.983 |
3 |
0 |
0 |
2.660 |
66.780 |
115 |
2.240 |
18.245 |
14.813 |
914 |
1 |
0 |
0 |
6.877 |
43.205 |
| |
females |
13 |
1 |
17.805 |
36.840 |
7.498 |
2 |
0 |
0 |
2.112 |
64.271 |
78 |
1.798 |
15.776 |
13.854 |
1.147 |
6 |
0 |
0 |
5.045 |
37.704 |
| |
total |
21 |
2 |
42.213 |
72.557 |
11.481 |
5 |
0 |
0 |
4.772 |
131.051 |
193 |
4.038 |
34.021 |
28.667 |
2.061 |
7 |
0 |
0 |
11.922 |
80.909 |
| 20-24 |
males |
5 |
8 |
13.828 |
16.553 |
20.468 |
3.150 |
629 |
3 |
1.874 |
56.518 |
2.175 |
37.035 |
7.678 |
35.719 |
9.366 |
1.706 |
1.334 |
7 |
6.507 |
101.527 |
| |
females |
4 |
1 |
8.965 |
9.997 |
28.283 |
4.492 |
1.174 |
1 |
1.819 |
54.736 |
2.410 |
25.954 |
5.800 |
26.506 |
8.775 |
1.015 |
1.314 |
3 |
3.347 |
75.124 |
| |
total |
9 |
9 |
22.793 |
26.550 |
48.751 |
7.642 |
1.803 |
4 |
3.693 |
111.254 |
4.585 |
62.989 |
13.478 |
62.225 |
18.141 |
2.721 |
2.648 |
10 |
9.854 |
176.651 |
| 25-29 |
males |
5 |
7 |
4.264 |
16.210 |
16.383 |
5.751 |
4.957 |
40 |
1.499 |
49.116 |
7.055 |
101.394 |
9.279 |
73.983 |
27.152 |
5.787 |
9.668 |
75 |
9.406 |
243.799 |
| |
females |
5 |
13 |
2.265 |
7.870 |
15.230 |
11.042 |
11.563 |
44 |
1.852 |
49.884 |
5.363 |
60.183 |
6.478 |
40.323 |
17.675 |
3.092 |
8.083 |
79 |
4.660 |
145.936 |
| |
total |
10 |
20 |
6.529 |
24.080 |
31.613 |
16.793 |
16.520 |
84 |
3.351 |
99.000 |
12.418 |
161.577 |
15.757 |
114.306 |
44.827 |
8.879 |
17.751 |
154 |
14.066 |
389.735 |
| 30-34 |
males |
0 |
12 |
3.921 |
12.592 |
13.604 |
4.697 |
4.505 |
129 |
1.236 |
40.696 |
8.269 |
104.958 |
11.168 |
73.987 |
28.598 |
6.767 |
11.599 |
397 |
56.923 |
302.666 |
| |
females |
2 |
14 |
2.407 |
7.084 |
11.311 |
8.118 |
12.079 |
171 |
1.763 |
42.949 |
4.595 |
52.175 |
5.908 |
33.313 |
16.443 |
3.110 |
8.306 |
207 |
10.660 |
134.717 |
| |
total |
2 |
26 |
6.328 |
19.676 |
24.915 |
12.815 |
16.584 |
300 |
2.999 |
83.645 |
12.864 |
157.133 |
17.076 |
107.300 |
45.041 |
9.877 |
19.905 |
604 |
67.583 |
437.383 |
| 35-39 |
males |
2 |
39 |
5.208 |
10.878 |
9.352 |
3.980 |
4.455 |
181 |
1.104 |
35.199 |
7.888 |
82.335 |
11.436 |
57.642 |
25.176 |
6.218 |
10.154 |
514 |
51.956 |
253.319 |
| |
females |
5 |
29 |
2.913 |
9.356 |
6.934 |
5.441 |
12.477 |
92 |
2.117 |
39.364 |
4.894 |
41.243 |
5.624 |
27.938 |
11.878 |
2.830 |
6.425 |
203 |
11.884 |
112.919 |
| |
total |
7 |
68 |
8.121 |
20.234 |
16.286 |
9.421 |
16.932 |
273 |
3.221 |
74.563 |
12.782 |
123.578 |
17.060 |
85.580 |
37.054 |
9.048 |
16.579 |
717 |
63.840 |
366.238 |
| 40-44 |
males |
3 |
17 |
3.446 |
11.604 |
6.953 |
3.523 |
3.692 |
240 |
868 |
30.346 |
10.884 |
67.935 |
11.305 |
48.656 |
24.604 |
5.788 |
8.741 |
418 |
31.666 |
209.997 |
| |
females |
19 |
13 |
2.550 |
10.439 |
6.201 |
4.087 |
8.490 |
121 |
2.504 |
34.424 |
5.593 |
30.094 |
3.814 |
20.183 |
10.034 |
2.294 |
4.624 |
169 |
9.699 |
86.504 |
| |
total |
22 |
30 |
5.996 |
22.043 |
13.154 |
7.610 |
12.182 |
361 |
3.372 |
64.770 |
16.477 |
98.029 |
15.119 |
68.839 |
34.638 |
8.082 |
13.365 |
587 |
41.365 |
296.501 |
| 45-49 |
males |
1 |
8 |
1.689 |
8.537 |
6.788 |
3.436 |
4.244 |
322 |
676 |
25.701 |
12.531 |
46.208 |
11.318 |
31.178 |
20.097 |
4.831 |
9.310 |
428 |
17.999 |
153.900 |
| |
females |
56 |
23 |
2.409 |
7.701 |
5.034 |
3.951 |
6.873 |
120 |
3.599 |
29.766 |
5.817 |
19.359 |
2.822 |
11.778 |
8.090 |
1.940 |
3.793 |
133 |
6.471 |
60.203 |
| |
total |
57 |
31 |
4.098 |
16.238 |
11.822 |
7.387 |
11.117 |
442 |
4.275 |
55.467 |
18.348 |
65.567 |
14.140 |
42.956 |
28.187 |
6.771 |
13.103 |
561 |
24.470 |
214.103 |
| 50-54 |
males |
106 |
201 |
1.499 |
5.546 |
3.927 |
3.203 |
4.280 |
527 |
273 |
19.562 |
9.395 |
28.232 |
9.472 |
19.851 |
13.990 |
3.127 |
8.014 |
462 |
8.480 |
101.023 |
| |
females |
2.058 |
842 |
2.032 |
5.064 |
3.250 |
4.163 |
4.791 |
157 |
1.491 |
23.848 |
4.849 |
9.044 |
1.863 |
5.422 |
5.417 |
1.459 |
3.091 |
134 |
3.444 |
34.723 |
| |
total |
2.164 |
1.043 |
3.531 |
10.610 |
7.177 |
7.366 |
9.071 |
684 |
1.764 |
43.410 |
14.244 |
37.276 |
11.335 |
25.273 |
19.407 |
4.586 |
11.105 |
596 |
11.924 |
135.746 |
| 55-59 |
males |
166 |
390 |
1.435 |
4.282 |
2.329 |
2.307 |
2.944 |
673 |
121 |
14.647 |
6.032 |
15.333 |
6.224 |
10.727 |
9.629 |
2.412 |
6.491 |
485 |
4.136 |
61.469 |
| |
females |
4.114 |
1.443 |
1.942 |
3.876 |
1.880 |
3.069 |
2.765 |
219 |
222 |
19.530 |
3.433 |
3.849 |
1.087 |
2.499 |
3.112 |
1.206 |
2.262 |
126 |
1.291 |
18.865 |
| |
total |
4.280 |
1.833 |
3.377 |
8.158 |
4.209 |
5.376 |
5.709 |
892 |
343 |
34.177 |
9.465 |
19.182 |
7.311 |
13.226 |
12.741 |
3.618 |
8.753 |
611 |
5.427 |
80.334 |
| 60-64 |
males |
176 |
516 |
1.281 |
2.270 |
1.186 |
1.464 |
1.640 |
514 |
88 |
9.135 |
3.285 |
6.441 |
3.194 |
4.073 |
4.310 |
1.291 |
4.591 |
470 |
1.415 |
29.070 |
| |
females |
4.350 |
1.316 |
1.543 |
2.248 |
846 |
1.697 |
1.173 |
168 |
165 |
13.506 |
2.412 |
1.700 |
601 |
1.193 |
1.508 |
738 |
1.216 |
102 |
582 |
10.052 |
| |
total |
4.526 |
1.832 |
2.824 |
4.518 |
2.032 |
3.161 |
2.813 |
682 |
253 |
22.641 |
5.697 |
8.141 |
3.795 |
5.266 |
5.818 |
2.029 |
5.807 |
572 |
1.997 |
39.122 |
| >65 |
males |
3.092 |
3.986 |
3.231 |
3.574 |
1.274 |
1.051 |
1.624 |
562 |
190 |
18.584 |
3.466 |
3.937 |
2.044 |
2.351 |
2.280 |
770 |
3.164 |
610 |
1.174 |
19.796 |
| |
females |
14.062 |
3.396 |
1.794 |
1.836 |
616 |
572 |
605 |
125 |
484 |
23.490 |
4.947 |
1.816 |
632 |
1.135 |
1.123 |
381 |
591 |
78 |
893 |
11.596 |
| |
total |
17.154 |
7.382 |
5.025 |
5.410 |
1.890 |
1.623 |
2.229 |
687 |
674 |
42.074 |
8.413 |
5.753 |
2.676 |
3.486 |
3.403 |
1.151 |
3.755 |
688 |
2.067 |
31.392 |
| TOTAL |
males |
3.566 |
5.217 |
100.944 |
127.763 |
86.247 |
32.565 |
32.970 |
3.191 |
42.200 |
434.663 |
71.240 |
502.905 |
119.682 |
372.980 |
166.116 |
38.698 |
73.066 |
3.866 |
218.082 |
1.566.635 |
| |
females |
24.689 |
7.114 |
82.770 |
102.311 |
87.083 |
46.634 |
61.990 |
1.218 |
47.579 |
461.388 |
44.548 |
253.530 |
68.507 |
184.144 |
85.202 |
18.071 |
39.705 |
1.234 |
78.017 |
772.958 |
| |
total |
28.255 |
12.331 |
183.714 |
230.074 |
173.330 |
79.199 |
94.960 |
4.409 |
89.779 |
896.051 |
115.788 |
756.435 |
188.189 |
557.124 |
251.318 |
56.769 |
112.771 |
5.100 |
296.099 |
2.339.593 |
Source: PACI
ANNEXED NOTE
1. Characteristics of data and definitions
The source of data used here is the Public Authority for Civil Information (PACI), an independant government body in charge of :
1- centralising all population and labour force data in order to manage a fully computerised population register
2- issuing mandatory civil identification cards to every resident of the country, regardless of age and nationality.
The other source of demographic and socioeconomic data on Kuwait is the Central Statistical Office (CSO), operating within the Planning Ministry. The CSO has conducted ten population and housing censuses since its inception in 1957.
Since 1995 a marked discrepancy was witnessed between PACI’ and CSO’ population figures. PACI’ database is connected electronically with other administrations and bodies registering demographic events and professional/ residency issues (births and death; departures and arrivals; end of service, residency and ID deliveries, etc.).
PACI’s records of residents’ movements is thus regularly updated, which limits the risk of population overcount. Therefore, it is more likely that residents were undercounted during CSO- Ministry of Planning’s census operations (see: Shah, N. Population of Kuwait. Structure and Dynamics, Kuwait: Kuwait University Academic Publication Council, 2010, chapter 1).
(a) Kuwaiti: the Kuwaiti nationality rests upon a document of Kuwaiti nationality or a certificate proving Kuwaiti nationality issued by the Ministry of Interior of Kuwait.
(b) Non-Kuwaiti: his/ her nationality is determined by the name of the State which issued the passport. The foreign national also entered Kuwait legally and has a stamp of residence.
This category includes the Bidoon, a category of stateless persons living in the Emirate. Kuwait’s Bidoon population originates from three broad categories:
1) those whose ancestors failed to apply for nationality or lacked necessary documentation at the time of Kuwait’s independence in 1961;
2) those recruited to work in Kuwait’s army or police force during the 1960s who permanently settled in Kuwait, along with their families;
3) children of Kuwaiti mothers and stateless or foreign fathers (see Human Rights Watch. Prisoners of the Past. Kuwaiti Bidun and the Burden of Statelessness, June 2011, p. 3).
2. Institution which provides data
The Public Authority for Civil Information (PACI)
3. Period of data coverage: December 2012
The database is updated three times a year and the website presents only the most recent data.
4. Data availability
The statistics section of PACI’s website (http://www.paci.gov.kw/en/ (English); http://www.paci.gov.kw/ (Arabic)) provides population and socio-economic data broken down by nationality (Kuwaiti/ non-Kuwaiti). Some data are displayed by nationality groups.
Analytical tables and data crosstabulations are available for download in PDF, html, .png and Excel (.csv) formats.
Date of access: June 2013.
| Age |
|
|
|
KUWAITIS |
|
|
|
|
|
NON-KUWAITIS |
|
|
|
| group |
|
Never Married |
Married |
Divorced |
Widowed |
Not Stated |
Total |
Never Married |
Married |
Divorced |
Widowed |
Not Stated |
Total |
| 15-19 |
males |
66.249 |
451 |
38 |
0 |
42 |
66.780 |
36.869 |
392 |
3 |
1 |
5.940 |
43.205 |
| |
females |
60.099 |
3.882 |
256 |
4 |
30 |
64.271 |
30.076 |
1.945 |
68 |
3 |
5.612 |
37.704 |
| |
total |
126.348 |
4.333 |
294 |
4 |
72 |
131.051 |
66.945 |
2.337 |
71 |
4 |
11.552 |
80.909 |
| 20-24 |
males |
44.531 |
11.031 |
921 |
1 |
34 |
56.518 |
64.752 |
29.956 |
104 |
17 |
6.698 |
101.527 |
| |
females |
31.685 |
20.585 |
2.402 |
44 |
20 |
54.736 |
37.216 |
32.282 |
655 |
32 |
4.939 |
75.124 |
| |
total |
76.216 |
31.616 |
3.323 |
45 |
54 |
111.254 |
101.968 |
62.238 |
759 |
49 |
11.637 |
176.651 |
| 25-29 |
males |
17.696 |
28.995 |
2.372 |
10 |
43 |
49.116 |
144.656 |
98.437 |
565 |
54 |
87 |
243.799 |
| |
females |
13.174 |
32.068 |
4.497 |
112 |
33 |
49.884 |
56.563 |
87.854 |
1.403 |
89 |
27 |
145.936 |
| |
total |
30.870 |
61.063 |
6.869 |
122 |
76 |
99.000 |
201.219 |
186.291 |
1.968 |
143 |
114 |
389.735 |
| 30-34 |
males |
5.583 |
32.512 |
2.509 |
27 |
65 |
40.696 |
161.661 |
138.610 |
1.136 |
67 |
1.192 |
302.666 |
| |
females |
6.422 |
31.853 |
4.385 |
261 |
28 |
42.949 |
39.182 |
93.447 |
1.786 |
186 |
116 |
134.717 |
| |
total |
12.005 |
64.365 |
6.894 |
288 |
93 |
83.645 |
200.843 |
232.057 |
2.922 |
253 |
1.308 |
437.383 |
| 35-39 |
males |
2.747 |
30.184 |
2.161 |
63 |
44 |
35.199 |
113.941 |
136.735 |
1.286 |
114 |
1.243 |
253.319 |
| |
females |
4.503 |
29.921 |
4.330 |
575 |
35 |
39.364 |
28.206 |
82.510 |
1.721 |
330 |
152 |
112.919 |
| |
total |
7.250 |
60.105 |
6.491 |
638 |
79 |
74.563 |
142.147 |
219.245 |
3.007 |
444 |
1.395 |
366.238 |
| 40-44 |
males |
1.669 |
26.676 |
1.891 |
66 |
44 |
30.346 |
85.331 |
122.406 |
1.504 |
110 |
646 |
209.997 |
| |
females |
3.241 |
26.283 |
4.040 |
831 |
29 |
34.424 |
19.784 |
64.469 |
1.608 |
511 |
132 |
86.504 |
| |
total |
4.910 |
52.959 |
5.931 |
897 |
73 |
64.770 |
105.115 |
186.875 |
3.112 |
621 |
778 |
296.501 |
| 45-49 |
males |
1.071 |
22.934 |
1.551 |
114 |
31 |
25.701 |
50.722 |
101.206 |
1.513 |
110 |
349 |
153.900 |
| |
females |
2.373 |
22.310 |
3.648 |
1.388 |
47 |
29.766 |
11.310 |
46.769 |
1.354 |
693 |
77 |
60.203 |
| |
total |
3.444 |
45.244 |
5.199 |
1.502 |
78 |
55.467 |
62.032 |
147.975 |
2.867 |
803 |
426 |
214.103 |
| 50-54 |
males |
671 |
17.554 |
1.182 |
138 |
17 |
19.562 |
24.172 |
75.411 |
1.170 |
118 |
152 |
101.023 |
| |
females |
1.637 |
17.198 |
2.855 |
2.102 |
56 |
23.848 |
4.843 |
28.025 |
997 |
816 |
42 |
34.723 |
| |
total |
2.308 |
34.752 |
4.037 |
2.240 |
73 |
43.410 |
29.015 |
103.436 |
2.167 |
934 |
194 |
135.746 |
| 55-59 |
males |
379 |
13.283 |
740 |
229 |
16 |
14.647 |
8.383 |
52.047 |
819 |
139 |
81 |
61.469 |
| |
females |
1.084 |
13.171 |
2.021 |
3.220 |
34 |
19.530 |
1.695 |
15.583 |
604 |
970 |
13 |
18.865 |
| |
total |
1.463 |
26.454 |
2.761 |
3.449 |
50 |
34.177 |
10.078 |
67.630 |
1.423 |
1.109 |
94 |
80.334 |
| 60-64 |
males |
200 |
8.242 |
470 |
214 |
9 |
9.135 |
1.811 |
26.630 |
472 |
138 |
19 |
29.070 |
| |
females |
655 |
7.907 |
1.235 |
3.682 |
27 |
13.506 |
628 |
8.046 |
336 |
1.037 |
5 |
10.052 |
| |
total |
855 |
16.149 |
1.705 |
3.896 |
36 |
22.641 |
2.439 |
34.676 |
808 |
1.175 |
24 |
39.122 |
| >65 |
males |
283 |
16.059 |
852 |
1.365 |
25 |
18.584 |
703 |
18.066 |
448 |
571 |
8 |
19.796 |
| |
females |
545 |
9.518 |
1.737 |
11.632 |
58 |
23.490 |
486 |
7.116 |
378 |
3.601 |
15 |
11.596 |
| |
total |
828 |
25.577 |
2.589 |
12.997 |
83 |
42.074 |
1.189 |
25.182 |
826 |
4.172 |
23 |
31.392 |
| TOTAL |
males |
141.079 |
207.921 |
14.687 |
2.227 |
370 |
366.284 |
693.001 |
799.896 |
9.020 |
1.439 |
16.415 |
1.519.771 |
| |
females |
125.418 |
214.696 |
31.406 |
23.851 |
397 |
395.768 |
229.989 |
468.046 |
10.910 |
8.268 |
11.130 |
728.343 |
| |
total |
266.497 |
422.617 |
46.093 |
26.078 |
767 |
762.052 |
922.990 |
1.267.942 |
19.930 |
9.707 |
27.545 |
2.248.114 |
Source: PACI
ANNEXED NOTE
1. Characteristics of data and definitions
The source of data used here is the Public Authority for Civil Information (PACI), an independant government body in charge of :
1- centralising all population and labour force data in order to manage a fully computerised population register
2- issuing mandatory civil identification cards to every resident of the country, regardless of age and nationality.
The other source of demographic and socioeconomic data on Kuwait is the Central Statistical Office (CSO), operating within the Planning Ministry. The CSO has conducted ten population and housing censuses since its inception in 1957.
Since 1995 a marked discrepancy was witnessed between PACI’ and CSO’ population figures. PACI’ database is connected electronically with other administrations and bodies registering demographic events and professional/ residency issues (births and death; departures and arrivals; end of service, residency and ID deliveries, etc.).
PACI’s records of residents’ movements is thus regularly updated, which limits the risk of population overcount. Therefore, it is more likely that residents were undercounted during CSO- Ministry of Planning’s census operations (see: Shah, N. Population of Kuwait. Structure and Dynamics, Kuwait: Kuwait University Academic Publication Council, 2010, chapter 1).
(a) Kuwaiti: the Kuwaiti nationality rests upon a document of Kuwaiti nationality or a certificate proving Kuwaiti nationality issued by the Ministry of Interior of Kuwait.
(b) Non-Kuwaiti: his/ her nationality is determined by the name of the State which issued the passport. The foreign national also entered Kuwait legally and has a stamp of residence.
This category includes the Bidoon, a category of stateless persons living in the Emirate. Kuwait’s Bidoon population originates from three broad categories:
1) those whose ancestors failed to apply for nationality or lacked necessary documentation at the time of Kuwait’s independence in 1961;
2) those recruited to work in Kuwait’s army or police force during the 1960s who permanently settled in Kuwait, along with their families;
3) children of Kuwaiti mothers and stateless or foreign fathers (see Human Rights Watch. Prisoners of the Past. Kuwaiti Bidun and the Burden of Statelessness, June 2011, p. 3).
2. Institution which provides data
The Public Authority for Civil Information (PACI)
3. Period of data coverage: December 2012
The database is updated three times a year and the website presents only the most recent data.
4. Data availability
The statistics section of PACI’s website (http://www.paci.gov.kw/en/ (English); http://www.paci.gov.kw/ (Arabic)) provides population and socio-economic data broken down by nationality (Kuwaiti/ non-Kuwaiti). Some data are displayed by nationality groups.
Analytical tables and data crosstabulations are available for download in PDF, html, .png and Excel (.csv) formats.
Date of access: June 2013.
|
|
Kuwaitis |
|
|
|
|
|
|
|
|
|
|
|
Non-Kuwaitis |
|
|
|
|
|
|
|
|
|
|
|
|
|
|
GRAND |
|
| |
|
|
|
|
Arabs |
|
|
Asians |
|
|
Africans |
|
|
Europeans |
|
|
North Americans |
|
|
South Americans |
|
|
Australians- Oceanians |
|
|
TOTAL non-Kuwaitis |
|
|
TOTAL |
|
| Age group |
males |
females |
total |
males |
females |
total |
males |
females |
total |
males |
females |
total |
males |
females |
total |
males |
females |
total |
males |
females |
total |
males |
females |
total |
males |
females |
total |
males |
females |
total |
| 0-4 |
82.384 |
79.748 |
162.132 |
50.985 |
49.107 |
100.092 |
22.045 |
21.390 |
43.435 |
200 |
195 |
395 |
580 |
530 |
1.110 |
1.160 |
1.042 |
2.202 |
52 |
66 |
118 |
100 |
78 |
178 |
75.122 |
72.408 |
147.530 |
157.506 |
152.156 |
309.662 |
| 5-9 |
78.318 |
75.935 |
154.253 |
44.077 |
41.688 |
85.765 |
17.755 |
16.986 |
34.741 |
141 |
132 |
273 |
580 |
518 |
1.098 |
1.012 |
1.000 |
2.012 |
60 |
46 |
106 |
86 |
88 |
174 |
63.711 |
60.458 |
124.169 |
142.029 |
136.393 |
278.422 |
| 10-14 |
68.379 |
65.620 |
133.999 |
33.709 |
32.326 |
66.035 |
11.482 |
10.782 |
22.264 |
122 |
107 |
229 |
425 |
384 |
809 |
998 |
902 |
1.900 |
46 |
40 |
86 |
82 |
74 |
156 |
46.864 |
44.615 |
91.479 |
115.243 |
110.235 |
225.478 |
| 15-19 |
66.780 |
64.271 |
131.051 |
33.784 |
29.264 |
63.048 |
8.047 |
7.176 |
15.223 |
193 |
136 |
329 |
314 |
307 |
621 |
727 |
692 |
1.419 |
60 |
54 |
114 |
80 |
75 |
155 |
43.205 |
37.704 |
80.909 |
109.985 |
101.975 |
211.960 |
| 20-24 |
56.518 |
54.736 |
111.254 |
50.404 |
33.280 |
83.684 |
49.539 |
24.064 |
73.603 |
789 |
16.817 |
17.606 |
208 |
333 |
541 |
485 |
506 |
991 |
53 |
72 |
125 |
49 |
52 |
101 |
101.527 |
75.124 |
176.651 |
158.045 |
129.860 |
287.905 |
| 25-29 |
49.116 |
49.884 |
99.000 |
99.665 |
46.195 |
145.860 |
140.388 |
69.388 |
209.776 |
2.376 |
28.889 |
31.265 |
313 |
605 |
918 |
930 |
748 |
1.678 |
94 |
60 |
154 |
33 |
51 |
84 |
243.799 |
145.936 |
389.735 |
292.915 |
195.820 |
488.735 |
| 30-34 |
40.696 |
42.949 |
83.645 |
101.443 |
39.885 |
141.328 |
198.144 |
83.277 |
281.421 |
1.255 |
10.002 |
11.257 |
544 |
735 |
1.279 |
1.168 |
701 |
1.869 |
62 |
67 |
129 |
50 |
50 |
100 |
302.666 |
134.717 |
437.383 |
343.362 |
177.666 |
521.028 |
| 35-39 |
35.199 |
39.364 |
74.563 |
77.793 |
28.661 |
106.454 |
173.165 |
79.817 |
252.982 |
619 |
3.057 |
3.676 |
641 |
708 |
1.349 |
985 |
568 |
1.553 |
65 |
58 |
123 |
51 |
50 |
101 |
253.319 |
112.919 |
366.238 |
288.518 |
152.283 |
440.801 |
| 40-44 |
30.346 |
34.424 |
64.770 |
61.071 |
21.230 |
82.301 |
146.451 |
63.279 |
209.730 |
398 |
757 |
1.155 |
752 |
590 |
1.342 |
1.183 |
549 |
1.732 |
82 |
42 |
124 |
60 |
57 |
117 |
209.997 |
86.504 |
296.501 |
240.343 |
120.928 |
361.271 |
| 45-49 |
25.701 |
29.766 |
55.467 |
51.704 |
16.596 |
68.300 |
99.448 |
42.257 |
141.705 |
294 |
200 |
494 |
778 |
511 |
1.289 |
1.514 |
536 |
2.050 |
85 |
41 |
126 |
77 |
62 |
139 |
153.900 |
60.203 |
214.103 |
179.601 |
89.969 |
269.570 |
| 50-54 |
19.562 |
23.848 |
43.410 |
35.874 |
12.339 |
48.213 |
62.664 |
21.249 |
83.913 |
177 |
121 |
298 |
719 |
408 |
1.127 |
1.429 |
530 |
1.959 |
80 |
29 |
109 |
80 |
47 |
127 |
101.023 |
34.723 |
135.746 |
120.585 |
58.571 |
179.156 |
| 55-59 |
14.647 |
19.530 |
34.177 |
24.280 |
8.645 |
32.925 |
35.267 |
9.419 |
44.686 |
134 |
86 |
220 |
616 |
309 |
925 |
1.059 |
357 |
1.416 |
51 |
23 |
74 |
62 |
26 |
88 |
61.469 |
18.865 |
80.334 |
76.116 |
38.395 |
114.511 |
| 60-64 |
9.135 |
13.506 |
22.641 |
13.887 |
5.675 |
19.562 |
14.042 |
3.852 |
17.894 |
62 |
63 |
125 |
420 |
200 |
620 |
600 |
232 |
832 |
21 |
10 |
31 |
38 |
20 |
58 |
29.070 |
10.052 |
39.122 |
38.205 |
23.558 |
61.763 |
| >65 |
18.584 |
23.490 |
42.074 |
12.205 |
8.835 |
21.040 |
6.784 |
2.354 |
9.138 |
27 |
14 |
41 |
317 |
189 |
506 |
421 |
174 |
595 |
16 |
13 |
29 |
26 |
17 |
43 |
11.519 |
5.189 |
16.708 |
18.328 |
14.938 |
33.266 |
| TOTAL |
595.365 |
617.071 |
1.212.436 |
690.881 |
373.726 |
1.064.607 |
985.221 |
455.290 |
1.440.511 |
6.787 |
60.576 |
67.363 |
7.207 |
6.327 |
13.534 |
13.671 |
8.537 |
22.208 |
827 |
621 |
1.448 |
874 |
747 |
1.621 |
1.705.468 |
905.824 |
2.611.292 |
2.300.833 |
1.522.895 |
3.823.728 |
Source: PACI
ANNEXED NOTE
1. Characteristics of data and definitions
The source of data used here is the Public Authority for Civil Information (PACI), an independant government body in charge of :
1- centralising all population and labour force data in order to manage a fully computerised population register
2- issuing mandatory civil identification cards to every resident of the country, regardless of age and nationality.
The other source of demographic and socioeconomic data on Kuwait is the Central Statistical Office (CSO), operating within the Planning Ministry. The CSO has conducted ten population and housing censuses since its inception in 1957.
Since 1995 a marked discrepancy was witnessed between PACI’ and CSO’ population figures. PACI’ database is connected electronically with other administrations and bodies registering demographic events and professional/ residency issues (births and death; departures and arrivals; end of service, residency and ID deliveries, etc.).
PACI’s records of residents’ movements is thus regularly updated, which limits the risk of population overcount. Therefore, it is more likely that residents were undercounted during CSO- Ministry of Planning’s census operations (see: Shah, N. Population of Kuwait. Structure and Dynamics, Kuwait: Kuwait University Academic Publication Council, 2010, chapter 1).
(a) Kuwaiti: the Kuwaiti nationality rests upon a document of Kuwaiti nationality or a certificate proving Kuwaiti nationality issued by the Ministry of Interior of Kuwait.
(b) Non-Kuwaiti: his/ her nationality is determined by the name of the State which issued the passport. The foreign national also entered Kuwait legally and has a stamp of residence.
This category includes the Bidoon, a category of stateless persons living in the Emirate. Kuwait’s Bidoon population originates from three broad categories:
1) those whose ancestors failed to apply for nationality or lacked necessary documentation at the time of Kuwait’s independence in 1961;
2) those recruited to work in Kuwait’s army or police force during the 1960s who permanently settled in Kuwait, along with their families;
3) children of Kuwaiti mothers and stateless or foreign fathers (see Human Rights Watch. Prisoners of the Past. Kuwaiti Bidun and the Burden of Statelessness, June 2011, p. 3).
(c) Nationality group: collected according to the nationality of the head of the household.
Nationalities are grouped according to specific features common to certain population subgroups: language, geographic origin, etc. or according to internationally recognized categories such as: (Arab / non-Arab Asian countries / non-Arab African countries; European countries … etc.).
2. Institution which provides data
The Public Authority for Civil Information (PACI)
3. Period of data coverage: December 2012
The database is updated three times a year and the website presents only the most recent data.
4. Data availability
The statistics section of PACI’s website (http://www.paci.gov.kw/en/ (English); http://www.paci.gov.kw/ (Arabic)) provides population and socio-economic data broken down by nationality (Kuwaiti/ non-Kuwaiti). Some data are displayed by nationality groups.
Analytical tables and data crosstabulations are available for download in PDF, html, .png and Excel (.csv) formats.
Date of access: June 2013.
| |
|
Kuwaitis |
|
|
Non-Kuwaitis |
|
|
Total |
|
| Age group |
males |
females |
total |
males |
females |
total |
males |
females |
total |
| 0-4 |
82.384 |
79.748 |
162.132 |
75.122 |
72.408 |
147.530 |
157.506 |
152.156 |
309.662 |
| 5-9 |
78.318 |
75.935 |
154.253 |
63.711 |
60.458 |
124.169 |
142.029 |
136.393 |
278.422 |
| 10-14 |
68.379 |
65.620 |
133.999 |
46.864 |
44.615 |
91.479 |
115.243 |
110.235 |
225.478 |
| 15-19 |
66.780 |
64.271 |
131.051 |
43.205 |
37.704 |
80.909 |
109.985 |
101.975 |
211.960 |
| 20-24 |
56.518 |
54.736 |
111.254 |
101.527 |
75.124 |
176.651 |
158.045 |
129.860 |
287.905 |
| 25-29 |
49.116 |
49.884 |
99.000 |
243.799 |
145.936 |
389.735 |
292.915 |
195.820 |
488.735 |
| 30-34 |
40.696 |
42.949 |
83.645 |
302.666 |
134.717 |
437.383 |
343.362 |
177.666 |
521.028 |
| 35-39 |
35.199 |
39.364 |
74.563 |
253.319 |
112.919 |
366.238 |
288.518 |
152.283 |
440.801 |
| 40-44 |
30.346 |
34.424 |
64.770 |
209.997 |
86.504 |
296.501 |
240.343 |
120.928 |
361.271 |
| 45-49 |
25.701 |
29.766 |
55.467 |
153.900 |
60.203 |
214.103 |
179.601 |
89.969 |
269.570 |
| 50-54 |
19.562 |
23.848 |
43.410 |
101.023 |
34.723 |
135.746 |
120.585 |
58.571 |
179.156 |
| 55-59 |
14.647 |
19.530 |
34.177 |
61.469 |
18.865 |
80.334 |
76.116 |
38.395 |
114.511 |
| 60-64 |
9.135 |
13.506 |
22.641 |
29.070 |
10.052 |
39.122 |
38.205 |
23.558 |
61.763 |
| 65-69 |
6.809 |
9.749 |
16.558 |
11.519 |
5.189 |
16.708 |
18.328 |
14.938 |
33.266 |
| 70-74 |
5.419 |
6.565 |
11.984 |
4.879 |
2.915 |
7.794 |
10.298 |
9.480 |
19.778 |
| 75-79 |
3.539 |
3.975 |
7.514 |
2.148 |
1.698 |
3.846 |
5.687 |
5.673 |
11.360 |
| 80-84 |
1.759 |
1.919 |
3.678 |
808 |
969 |
1.777 |
2.567 |
2.888 |
5.455 |
| >85 |
1.058 |
1.282 |
2.340 |
442 |
825 |
1.267 |
1.500 |
2.107 |
3.607 |
| TOTAL |
595.365 |
617.071 |
1.212.436 |
1.705.468 |
905.824 |
2.611.292 |
2.300.833 |
1.522.895 |
3.823.728 |
Source: PACI
ANNEXED NOTE
1. Characteristics of data and definitions
The source of data used here is the Public Authority for Civil Information (PACI), an independant government body in charge of :
1- centralising all population and labour force data in order to manage a fully computerised population register
2- issuing mandatory civil identification cards to every resident of the country, regardless of age and nationality.
The other source of demographic and socioeconomic data on Kuwait is the Central Statistical Office (CSO), operating within the Planning Ministry. The CSO has conducted ten population and housing censuses since its inception in 1957.
Since 1995 a marked discrepancy was witnessed between PACI’ and CSO’ population figures. PACI’ database is connected electronically with other administrations and bodies registering demographic events and professional/ residency issues (births and death; departures and arrivals; end of service, residency and ID deliveries, etc.).
PACI’s records of residents’ movements is thus regularly updated, which limits the risk of population overcount. Therefore, it is more likely that residents were undercounted during CSO- Ministry of Planning’s census operations (see: Shah, N. Population of Kuwait. Structure and Dynamics, Kuwait: Kuwait University Academic Publication Council, 2010, chapter 1).
(a) Kuwaiti: the Kuwaiti nationality rests upon a document of Kuwaiti nationality or a certificate proving Kuwaiti nationality issued by the Ministry of Interior of Kuwait.
(b) Non-Kuwaiti: his/ her nationality is determined by the name of the State which issued the passport. The foreign national also entered Kuwait legally and has a stamp of residence.
This category includes the Bidoon, a category of stateless persons living in the Emirate. Kuwait’s Bidoon population originates from three broad categories:
1) those whose ancestors failed to apply for nationality or lacked necessary documentation at the time of Kuwait’s independence in 1961;
2) those recruited to work in Kuwait’s army or police force during the 1960s who permanently settled in Kuwait, along with their families;
3) children of Kuwaiti mothers and stateless or foreign fathers (see Human Rights Watch. Prisoners of the Past. Kuwaiti Bidun and the Burden of Statelessness, June 2011, p. 3).
2. Institution which provides data
The Public Authority for Civil Information (PACI)
3. Period of data coverage: December 2012
The database is updated three times a year and the website presents only the most recent data.
4. Data availability
The statistics section of PACI’s website (http://www.paci.gov.kw/en/ (English); http://www.paci.gov.kw/ (Arabic)) provides population and socio-economic data broken down by nationality (Kuwaiti/ non-Kuwaiti). Some data are displayed by nationality groups.
Analytical tables and data crosstabulations are available for download in PDF, html, .png and Excel (.csv) formats.
Date of access: June 2013.
|
males |
females |
total |
| Kuwaitis |
595.365 |
617.071 |
1.212.436 |
| Arabs |
690.881 |
373.726 |
1.064.607 |
| Asians |
985.221 |
455.290 |
1.440.511 |
| Africans |
6.787 |
60.576 |
67.363 |
| Europeans |
7.207 |
6.327 |
13.534 |
| North Americans |
13.671 |
8.537 |
22.208 |
| South Americans |
827 |
621 |
1.448 |
| Australians- Oceanians |
874 |
747 |
1.621 |
| Total |
2.300.833 |
1.522.895 |
3.823.728 |
Source: PACI
ANNEXED NOTE
1. Characteristics of data and definitions
The source of data used here is the Public Authority for Civil Information (PACI), an independant government body in charge of :
1- centralising all population and labour force data in order to manage a fully computerised population register
2- issuing mandatory civil identification cards to every resident of the country, regardless of age and nationality.
The other source of demographic and socioeconomic data on Kuwait is the Central Statistical Office (CSO), operating within the Planning Ministry. The CSO has conducted ten population and housing censuses since its inception in 1957.
Since 1995 a marked discrepancy was witnessed between PACI’ and CSO’ population figures. PACI’ database is connected electronically with other administrations and bodies registering demographic events and professional/ residency issues (births and death; departures and arrivals; end of service, residency and ID deliveries, etc.).
PACI’s records of residents’ movements is thus regularly updated, which limits the risk of population overcount. Therefore, it is more likely that residents were undercounted during CSO- Ministry of Planning’s census operations (see: Shah, N. Population of Kuwait. Structure and Dynamics, Kuwait: Kuwait University Academic Publication Council, 2010, chapter 1).
(a) Kuwaiti: the Kuwaiti nationality rests upon a document of Kuwaiti nationality or a certificate proving Kuwaiti nationality issued by the Ministry of Interior of Kuwait.
(b) Non-Kuwaiti: his/ her nationality is determined by the name of the State which issued the passport. The foreign national also entered Kuwait legally and has a stamp of residence.
This category includes the Bidoon, a category of stateless persons living in the Emirate. Kuwait’s Bidoon population originates from three broad categories:
1) those whose ancestors failed to apply for nationality or lacked necessary documentation at the time of Kuwait’s independence in 1961;
2) those recruited to work in Kuwait’s army or police force during the 1960s who permanently settled in Kuwait, along with their families;
3) children of Kuwaiti mothers and stateless or foreign fathers (see Human Rights Watch. Prisoners of the Past. Kuwaiti Bidun and the Burden of Statelessness, June 2011, p. 3).
(c) Nationality group: collected according to the nationality of the head of the household.
Nationalities are grouped according to specific features common to certain population subgroups: language, geographic origin, etc. or according to internationally recognized categories such as: (Arab / non-Arab Asian countries / non-Arab African countries; European countries … etc.).
2. Institution which provides data
The Public Authority for Civil Information (PACI)
3. Period of data coverage: December 2012
The database is updated three times a year and the website presents only the most recent data.
4. Data availability
The statistics section of PACI’s website (http://www.paci.gov.kw/en/ (English); http://www.paci.gov.kw/ (Arabic)) provides population and socio-economic data broken down by nationality (Kuwaiti/ non-Kuwaiti). Some data are displayed by nationality groups.
Analytical tables and data crosstabulations are available for download in PDF, html, .png and Excel (.csv) formats.
Date of access: June 2013.
| Father’s Nationality |
|
|
|
Mother’s Nationality |
|
|
|
| |
Kuwaiti |
Arab |
Asian |
African |
N. American |
European |
S. American |
Australian-Oceanian |
| Kuwaiti |
28.102 |
4.722 |
303 |
15 |
47 |
60 |
11 |
3 |
| Arab |
1.596 |
15.199 |
284 |
25 |
25 |
50 |
4 |
4 |
| Asian |
69 |
59 |
7.433 |
2 |
5 |
8 |
– |
3 |
| N. American |
18 |
79 |
64 |
27 |
62 |
7 |
– |
2 |
| African |
1 |
14 |
4 |
60 |
1 |
– |
– |
– |
| S. American |
4 |
4 |
– |
– |
– |
– |
5 |
– |
| European |
10 |
37 |
18 |
4 |
5 |
77 |
– |
1 |
| Australian- Oceanian |
7 |
11 |
4 |
1 |
1 |
2 |
– |
3 |
Source: PACI
ANNEXED NOTE
1. Characteristics of data and definitions
The source of data used here is the Public Authority for Civil Information (PACI), an independant government body in charge of :
1- centralising all population and labour force data in order to manage a fully computerised population register
2- issuing mandatory civil identification cards to every resident of the country, regardless of age and nationality.
The other source of demographic and socioeconomic data on Kuwait is the Central Statistical Office (CSO), operating within the Planning Ministry. The CSO has conducted ten population and housing censuses since its inception in 1957.
Since 1995 a marked discrepancy was witnessed between PACI’ and CSO’ population figures. PACI’ database is connected electronically with other administrations and bodies registering demographic events and professional/ residency issues (births and death; departures and arrivals; end of service, residency and ID deliveries, etc.).
PACI’s records of residents’ movements is thus regularly updated, which limits the risk of population overcount. Therefore, it is more likely that residents were undercounted during CSO- Ministry of Planning’s census operations (see: Shah, N. Population of Kuwait. Structure and Dynamics, Kuwait: Kuwait University Academic Publication Council, 2010, chapter 1).
(a) Kuwaiti: the Kuwaiti nationality rests upon a document of Kuwaiti nationality or a certificate proving Kuwaiti nationality issued by the Ministry of Interior of Kuwait.
(b) Non-Kuwaiti: his/ her nationality is determined by the name of the State which issued the passport. The foreign national also entered Kuwait legally and has a stamp of residence.
This category includes the Bidoon, a category of stateless persons living in the Emirate. Kuwait’s Bidoon population originates from three broad categories:
1) those whose ancestors failed to apply for nationality or lacked necessary documentation at the time of Kuwait’s independence in 1961;
2) those recruited to work in Kuwait’s army or police force during the 1960s who permanently settled in Kuwait, along with their families;
3) children of Kuwaiti mothers and stateless or foreign fathers (see Human Rights Watch. Prisoners of the Past. Kuwaiti Bidun and the Burden of Statelessness, June 2011, p. 3).
(c) Nationality group: collected according to the nationality of the head of the household.
Nationalities are grouped according to specific features common to certain population subgroups: language, geographic origin, etc. or according to internationally recognized categories such as: (Arab / non-Arab Asian countries / non-Arab African countries; European countries … etc.).
2. Institution which provides data
The Public Authority for Civil Information (PACI)
3. Period of data coverage: December 2012
The database is updated three times a year and the website presents only the most recent data.
4. Data availability
The statistics section of PACI’s website (http://www.paci.gov.kw/en/ (English); http://www.paci.gov.kw/ (Arabic)) provides population and socio-economic data broken down by nationality (Kuwaiti/ non-Kuwaiti). Some data are displayed by nationality groups.
Analytical tables and data crosstabulations are available for download in PDF, html, .png and Excel (.csv) formats.
Date of access: June 2013.
| Nationality |
|
KUWAITIS |
|
|
NON-KUWAITIS |
|
| Age group/ Place of birth |
Outside Kuwait |
In Kuwait |
Total |
Outside Kuwait |
In Kuwait |
Total |
| 0-4 |
3.947 |
158.185 |
162.132 |
34.250 |
113.280 |
147.530 |
| 5-9 |
4.695 |
149.558 |
154.253 |
47.465 |
76.704 |
124.169 |
| 10-14 |
5.255 |
128.744 |
133.999 |
39.523 |
51.956 |
91.479 |
| 15-19 |
5.096 |
125.955 |
131.051 |
31.362 |
49.547 |
80.909 |
| 20-24 |
9.242 |
102.012 |
111.254 |
137.142 |
39.509 |
176.651 |
| 25-29 |
3.133 |
95.867 |
99.000 |
344.844 |
44.891 |
389.735 |
| 30-34 |
3.670 |
79.975 |
83.645 |
401.695 |
35.688 |
437.383 |
| 35-39 |
3.661 |
70.902 |
74.563 |
342.635 |
23.603 |
366.238 |
| 40-44 |
3.758 |
61.012 |
64.770 |
279.692 |
16.809 |
296.501 |
| 45-49 |
3.372 |
52.095 |
55.467 |
202.977 |
11.126 |
214.103 |
| 50-54 |
3.065 |
40.345 |
43.410 |
130.370 |
5.376 |
135.746 |
| 55-59 |
3.321 |
30.856 |
34.177 |
78.068 |
2.266 |
80.334 |
| 60-64 |
2.701 |
19.940 |
22.641 |
37.659 |
1.463 |
39.122 |
| >64 |
4.963 |
37.111 |
42.074 |
29.578 |
1.814 |
31.392 |
| Total |
59.879 |
1.152.557 |
1.212.436 |
2.137.260 |
474.032 |
2.611.292 |
Source: PACI
ANNEXED NOTE
1. Characteristics of data and definitions
The source of data used here is the Public Authority for Civil Information (PACI), an independant government body in charge of :
1- centralising all population and labour force data in order to manage a fully computerised population register
2- issuing mandatory civil identification cards to every resident of the country, regardless of age and nationality.
The other source of demographic and socioeconomic data on Kuwait is the Central Statistical Office (CSO), operating within the Planning Ministry. The CSO has conducted ten population and housing censuses since its inception in 1957.
Since 1995 a marked discrepancy was witnessed between PACI’ and CSO’ population figures. PACI’ database is connected electronically with other administrations and bodies registering demographic events and professional/ residency issues (births and death; departures and arrivals; end of service, residency and ID deliveries, etc.).
PACI’s records of residents’ movements is thus regularly updated, which limits the risk of population overcount. Therefore, it is more likely that residents were undercounted during CSO- Ministry of Planning’s census operations (see: Shah, N. Population of Kuwait. Structure and Dynamics, Kuwait: Kuwait University Academic Publication Council, 2010, chapter 1).
(a) Kuwaiti: the Kuwaiti nationality rests upon a document of Kuwaiti nationality or a certificate proving Kuwaiti nationality issued by the Ministry of Interior of Kuwait.
(b) Non-Kuwaiti: his/ her nationality is determined by the name of the State which issued the passport. The foreign national also entered Kuwait legally and has a stamp of residence.
This category includes the Bidoon, a category of stateless persons living in the Emirate. Kuwait’s Bidoon population originates from three broad categories:
1) those whose ancestors failed to apply for nationality or lacked necessary documentation at the time of Kuwait’s independence in 1961;
2) those recruited to work in Kuwait’s army or police force during the 1960s who permanently settled in Kuwait, along with their families;
3) children of Kuwaiti mothers and stateless or foreign fathers (see Human Rights Watch. Prisoners of the Past. Kuwaiti Bidun and the Burden of Statelessness, June 2011, p. 3).
2. Institution which provides data
The Public Authority for Civil Information (PACI)
3. Period of data coverage: December 2012
The database is updated three times a year and the website presents only the most recent data.
4. Data availability
The statistics section of PACI’s website (http://www.paci.gov.kw/en/ (English); http://www.paci.gov.kw/ (Arabic)) provides population and socio-economic data broken down by nationality (Kuwaiti/ non-Kuwaiti). Some data are displayed by nationality groups.
Analytical tables and data crosstabulations are available for download in PDF, html, .png and Excel (.csv) formats.
Date of access: June 2013.
| Place of birth |
|
In Kuwait |
|
|
Outside Kuwait |
|
|
TOTAL |
|
| Nationality group |
males |
females |
total |
males |
females |
total |
males |
females |
total |
| Kuwaitis |
574.871 |
577.686 |
1.152.557 |
20.494 |
39.385 |
59.879 |
595.365 |
617.071 |
1.212.436 |
| Arabs |
196.786 |
177.498 |
374.284 |
494.095 |
196.228 |
690.323 |
690.881 |
373.726 |
1.064.607 |
| Asians |
47.985 |
42.660 |
90.645 |
937.236 |
412.630 |
1.349.866 |
985.221 |
455.290 |
1.440.511 |
| Africans |
493 |
534 |
1.027 |
6.294 |
60.042 |
66.336 |
6.787 |
60.576 |
67.363 |
| Europeans |
1.188 |
979 |
2.167 |
6.019 |
5.348 |
11.367 |
7.207 |
6.327 |
13.534 |
| North Americans |
2.535 |
2.184 |
4.719 |
11.136 |
6.353 |
17.489 |
13.671 |
8.537 |
22.208 |
| South Americans |
350 |
241 |
591 |
477 |
380 |
857 |
827 |
621 |
1.448 |
| Australians- Oceanians |
328 |
264 |
592 |
546 |
483 |
1.029 |
874 |
747 |
1.621 |
| Total non-Kuwaitis |
249.665 |
224.360 |
474.025 |
1.455.803 |
681.464 |
2.137.267 |
1.705.468 |
905.824 |
2.611.292 |
| Grand total |
824.536 |
802.046 |
1.626.582 |
1.476.297 |
720.849 |
2.197.146 |
2.300.833 |
1.522.895 |
3.823.728 |
Source: PACI
ANNEXED NOTE
1. Characteristics of data and definitions
The source of data used here is the Public Authority for Civil Information (PACI), an independant government body in charge of :
1- centralising all population and labour force data in order to manage a fully computerised population register
2- issuing mandatory civil identification cards to every resident of the country, regardless of age and nationality.
The other source of demographic and socioeconomic data on Kuwait is the Central Statistical Office (CSO), operating within the Planning Ministry. The CSO has conducted ten population and housing censuses since its inception in 1957.
Since 1995 a marked discrepancy was witnessed between PACI’ and CSO’ population figures. PACI’ database is connected electronically with other administrations and bodies registering demographic events and professional/ residency issues (births and death; departures and arrivals; end of service, residency and ID deliveries, etc.).
PACI’s records of residents’ movements is thus regularly updated, which limits the risk of population overcount. Therefore, it is more likely that residents were undercounted during CSO- Ministry of Planning’s census operations (see: Shah, N. Population of Kuwait. Structure and Dynamics, Kuwait: Kuwait University Academic Publication Council, 2010, chapter 1).
(a) Kuwaiti: the Kuwaiti nationality rests upon a document of Kuwaiti nationality or a certificate proving Kuwaiti nationality issued by the Ministry of Interior of Kuwait.
(b) Non-Kuwaiti: his/ her nationality is determined by the name of the State which issued the passport. The foreign national also entered Kuwait legally and has a stamp of residence.
This category includes the Bidoon, a category of stateless persons living in the Emirate. Kuwait’s Bidoon population originates from three broad categories:
1) those whose ancestors failed to apply for nationality or lacked necessary documentation at the time of Kuwait’s independence in 1961;
2) those recruited to work in Kuwait’s army or police force during the 1960s who permanently settled in Kuwait, along with their families;
3) children of Kuwaiti mothers and stateless or foreign fathers (see Human Rights Watch. Prisoners of the Past. Kuwaiti Bidun and the Burden of Statelessness, June 2011, p. 3).
(c) Nationality group: collected according to the nationality of the head of the household.
Nationalities are grouped according to specific features common to certain population subgroups: language, geographic origin, etc. or according to internationally recognized categories such as: (Arab / non-Arab Asian countries / non-Arab African countries; European countries … etc.).
2. Institution which provides data
The Public Authority for Civil Information (PACI)
3. Period of data coverage: December 2012
The database is updated three times a year and the website presents only the most recent data.
4. Data availability
The statistics section of PACI’s website (http://www.paci.gov.kw/en/ (English); http://www.paci.gov.kw/ (Arabic)) provides population and socio-economic data broken down by nationality (Kuwaiti/ non-Kuwaiti). Some data are displayed by nationality groups.
Analytical tables and data crosstabulations are available for download in PDF, html, .png and Excel (.csv) formats.
Date of access: June 2013.
| Nationality group / Place of birth |
In Kuwait |
Outside Kuwait |
TOTAL |
| Kuwaitis |
1.152.557 |
59.879 |
1.212.436 |
| Arabs |
374.284 |
690.323 |
1.064.607 |
| Asians |
90.645 |
1.349.866 |
1.440.511 |
| Africans |
1.027 |
66.336 |
67.363 |
| Europeans |
2.167 |
11.367 |
13.534 |
| North Americans |
4.719 |
17.489 |
22.208 |
| South Americans |
591 |
857 |
1.448 |
| Australians- Oceanians |
592 |
1.029 |
1.621 |
| Total non-Kuwaitis |
474.025 |
2.137.267 |
2.611.292 |
| Grand total |
1.626.582 |
2.197.146 |
3.823.728 |
Source: PACI
ANNEXED NOTE
1. Characteristics of data and definitions
The source of data used here is the Public Authority for Civil Information (PACI), an independant government body in charge of :
1- centralising all population and labour force data in order to manage a fully computerised population register
2- issuing mandatory civil identification cards to every resident of the country, regardless of age and nationality.
The other source of demographic and socioeconomic data on Kuwait is the Central Statistical Office (CSO), operating within the Planning Ministry. The CSO has conducted ten population and housing censuses since its inception in 1957.
Since 1995 a marked discrepancy was witnessed between PACI’ and CSO’ population figures. PACI’ database is connected electronically with other administrations and bodies registering demographic events and professional/ residency issues (births and death; departures and arrivals; end of service, residency and ID deliveries, etc.).
PACI’s records of residents’ movements is thus regularly updated, which limits the risk of population overcount. Therefore, it is more likely that residents were undercounted during CSO- Ministry of Planning’s census operations (see: Shah, N. Population of Kuwait. Structure and Dynamics, Kuwait: Kuwait University Academic Publication Council, 2010, chapter 1).
(a) Kuwaiti: the Kuwaiti nationality rests upon a document of Kuwaiti nationality or a certificate proving Kuwaiti nationality issued by the Ministry of Interior of Kuwait.
(b) Non-Kuwaiti: his/ her nationality is determined by the name of the State which issued the passport. The foreign national also entered Kuwait legally and has a stamp of residence.
This category includes the Bidoon, a category of stateless persons living in the Emirate. Kuwait’s Bidoon population originates from three broad categories:
1) those whose ancestors failed to apply for nationality or lacked necessary documentation at the time of Kuwait’s independence in 1961;
2) those recruited to work in Kuwait’s army or police force during the 1960s who permanently settled in Kuwait, along with their families;
3) children of Kuwaiti mothers and stateless or foreign fathers (see Human Rights Watch. Prisoners of the Past. Kuwaiti Bidun and the Burden of Statelessness, June 2011, p. 3).
(c) Nationality group: collected according to the nationality of the head of the household.
Nationalities are grouped according to specific features common to certain population subgroups: language, geographic origin, etc. or according to internationally recognized categories such as: (Arab / non-Arab Asian countries / non-Arab African countries; European countries … etc.).
2. Institution which provides data
The Public Authority for Civil Information (PACI)
3. Period of data coverage: December 2012
The database is updated three times a year and the website presents only the most recent data.
4. Data availability
The statistics section of PACI’s website (http://www.paci.gov.kw/en/ (English); http://www.paci.gov.kw/ (Arabic)) provides population and socio-economic data broken down by nationality (Kuwaiti/ non-Kuwaiti). Some data are displayed by nationality groups.
Analytical tables and data crosstabulations are available for download in PDF, html, .png and Excel (.csv) formats.
Date of access: June 2013.
| |
|
Kuwaitis |
|
|
Non-Kuwaitis |
|
|
TOTAL |
|
| |
males |
females |
Total |
males |
females |
Total |
males |
females |
Total |
| Illiterate |
225 |
154 |
379 |
549 |
589 |
1.138 |
774 |
743 |
1.517 |
| Reads and writes |
104 |
62 |
166 |
2.775 |
6.043 |
8.818 |
2.879 |
6.105 |
8.984 |
| Elementary |
608 |
352 |
960 |
1.495 |
896 |
2.391 |
2.103 |
1.248 |
3.351 |
| Intermediate |
1.002 |
661 |
1.663 |
5.683 |
2.597 |
8.280 |
6.685 |
3.258 |
9.943 |
| High school diploma |
1.050 |
1.198 |
2.248 |
4.100 |
2.329 |
6.429 |
5.150 |
3.527 |
8.677 |
| Diploma |
420 |
1.339 |
1.759 |
517 |
834 |
1.351 |
937 |
2.173 |
3.110 |
| University degree |
369 |
1.057 |
1.426 |
652 |
776 |
1.428 |
1.021 |
1.833 |
2.854 |
| Postgraduate |
13 |
1 |
14 |
16 |
23 |
39 |
29 |
24 |
53 |
| Not stated |
1.728 |
1.918 |
3.646 |
1.181 |
1.664 |
2.845 |
2.909 |
3.582 |
6.491 |
| TOTAL |
5.519 |
6.742 |
12.261 |
16.968 |
15.751 |
32.719 |
22.487 |
22.493 |
44.980 |
Source: PACI
ANNEXED NOTE
1. Characteristics of data and definitions
The source of data used here is the Public Authority for Civil Information (PACI), an independant government body in charge of :
1- centralising all population and labour force data in order to manage a fully computerised population register
2- issuing mandatory civil identification cards to every resident of the country, regardless of age and nationality.
The other source of demographic and socioeconomic data on Kuwait is the Central Statistical Office (CSO), operating within the Planning Ministry. The CSO has conducted ten population and housing censuses since its inception in 1957.
Since 1995 a marked discrepancy was witnessed between PACI’ and CSO’ population figures. PACI’ database is connected electronically with other administrations and bodies registering demographic events and professional/ residency issues (births and death; departures and arrivals; end of service, residency and ID deliveries, etc.).
PACI’s records of residents’ movements is thus regularly updated, which limits the risk of population overcount. Therefore, it is more likely that residents were undercounted during CSO- Ministry of Planning’s census operations (see: Shah, N. Population of Kuwait. Structure and Dynamics, Kuwait: Kuwait University Academic Publication Council, 2010, chapter 1).
(a) Kuwaiti: the Kuwaiti nationality rests upon a document of Kuwaiti nationality or a certificate proving Kuwaiti nationality issued by the Ministry of Interior of Kuwait.
(b) Non-Kuwaiti: his/ her nationality is determined by the name of the State having issued the passport. The foreign national also entered Kuwait legally and has a stamp of residence.
This category includes the Bidoon, a category of stateless persons living in the Emirate. Kuwait’s Bidoon population originates from three broad categories:
1) those whose ancestors failed to apply for nationality or lacked necessary documentation at the time of Kuwait’s independence in 1961;
2) those recruited to work in Kuwait’s army or police force during the 1960s who permanently settled in Kuwait, along with their families;
3) children of Kuwaiti mothers and stateless or foreign fathers (see Human Rights Watch. Prisoners of the Past. Kuwaiti Bidun and the Burden of Statelessness, June 2011, p. 3).
(c) Population in the labour force: population aged 15 years and above, included in the labour market, either employed (in the government or private sector, as itinerant worker, employed in the domestic sector), or unemployed.
(d) Population out of the labour force: population aged 15 years and above, not contributing to any economic activity and not included in the labour market, among which the students, the housewives, the retired persons or self-sufficients.
(e) Unemployed population: population aged 15 years and over, able to work, looking for employment and unable to find one.
2. Institution which provides data
The Public Authority for Civil Information (PACI)
3. Period of data coverage: December 2012
The database is updated three times a year and the website presents only the most recent data.
4. Data availability
The statistics section of PACI’s website (http://www.paci.gov.kw/en/ (English); http://www.paci.gov.kw/ (Arabic)) provides population and socio-economic data broken down by nationality (Kuwaiti/ non-Kuwaiti). Some data are displayed by nationality groups.
Analytical tables and data crosstabulations are available for download in PDF, html, .png and Excel (.csv) formats.
Date of access: June 2013.
| |
|
Kuwaitis |
|
|
Non-Kuwaitis |
|
TOTAL |
|
| |
males |
females |
total |
males |
females |
total |
males |
females |
total |
| 15-19 |
422 |
420 |
842 |
795 |
586 |
1.381 |
1.217 |
1.006 |
2.223 |
| 20-24 |
1.115 |
839 |
1.954 |
920 |
1.684 |
2.604 |
2.035 |
2.523 |
4.558 |
| 25-29 |
1.552 |
2.011 |
3.563 |
3.459 |
4.455 |
7.914 |
5.011 |
6.466 |
11.477 |
| 30-34 |
638 |
1.663 |
2.301 |
4.138 |
3.539 |
7.677 |
4.776 |
5.202 |
9.978 |
| 35-39 |
360 |
686 |
1.046 |
3.170 |
2.115 |
5.285 |
3.530 |
2.801 |
6.331 |
| 40-44 |
335 |
312 |
647 |
2.285 |
1.430 |
3.715 |
2.620 |
1.742 |
4.362 |
| 45-49 |
297 |
212 |
509 |
936 |
872 |
1.808 |
1.233 |
1.084 |
2.317 |
| 50-54 |
231 |
136 |
367 |
414 |
457 |
871 |
645 |
593 |
1.238 |
| 55-59 |
175 |
286 |
461 |
249 |
232 |
481 |
424 |
518 |
942 |
| 60-64 |
108 |
148 |
256 |
145 |
129 |
274 |
253 |
277 |
530 |
| 65-69 |
286 |
29 |
315 |
457 |
252 |
709 |
743 |
281 |
1.024 |
| Total |
5.519 |
6.742 |
12.261 |
16.968 |
15.751 |
32.719 |
22.487 |
22.493 |
44.980 |
Source: PACI
ANNEXED NOTE
1. Characteristics of data and definitions
The source of data used here is the Public Authority for Civil Information (PACI), an independant government body in charge of :
1- centralising all population and labour force data in order to manage a fully computerised population register
2- issuing mandatory civil identification cards to every resident of the country, regardless of age and nationality.
The other source of demographic and socioeconomic data on Kuwait is the Central Statistical Office (CSO), operating within the Planning Ministry. The CSO has conducted ten population and housing censuses since its inception in 1957.
Since 1995 a marked discrepancy was witnessed between PACI’ and CSO’ population figures. PACI’ database is connected electronically with other administrations and bodies registering demographic events and professional/ residency issues (births and death; departures and arrivals; end of service, residency and ID deliveries, etc.).
PACI’s records of residents’ movements is thus regularly updated, which limits the risk of population overcount. Therefore, it is more likely that residents were undercounted during CSO- Ministry of Planning’s census operations (see: Shah, N. Population of Kuwait. Structure and Dynamics, Kuwait: Kuwait University Academic Publication Council, 2010, chapter 1).
(a) Kuwaiti: the Kuwaiti nationality rests upon a document of Kuwaiti nationality or a certificate proving Kuwaiti nationality issued by the Ministry of Interior of Kuwait.
(b) Non-Kuwaiti: his/ her nationality is determined by the name of the State having issued the passport. The foreign national also entered Kuwait legally and has a stamp of residence.
This category includes the Bidoon, a category of stateless persons living in the Emirate. Kuwait’s Bidoon population originates from three broad categories:
1) those whose ancestors failed to apply for nationality or lacked necessary documentation at the time of Kuwait’s independence in 1961;
2) those recruited to work in Kuwait’s army or police force during the 1960s who permanently settled in Kuwait, along with their families;
3) children of Kuwaiti mothers and stateless or foreign fathers (see Human Rights Watch. Prisoners of the Past. Kuwaiti Bidun and the Burden of Statelessness, June 2011, p. 3).
(c) Unemployed population: population aged 15 years and over, able to work, looking for employment and unable to find one.
2. Institution which provides data
The Public Authority for Civil Information (PACI)
3. Period of data coverage: December 2012
The database is updated three times a year and the website presents only the most recent data.
4. Data availability
The statistics section of PACI’s website (http://www.paci.gov.kw/en/ (English); http://www.paci.gov.kw/ (Arabic)) provides population and socio-economic data broken down by nationality (Kuwaiti/ non-Kuwaiti). Some data are displayed by nationality groups.
Analytical tables and data crosstabulations are available for download in PDF, html, .png and Excel (.csv) formats.
Date of access: June 2013.
| |
Kuwaitis |
Non-Kuwaitis |
| males |
5.519 |
16.968 |
| females |
6.742 |
15.751 |
| total |
12.261 |
32.719 |
Source: PACI
ANNEXED NOTE
1. Characteristics of data and definitions
The source of data used here is the Public Authority for Civil Information (PACI), an independant government body in charge of :
1- centralising all population and labour force data in order to manage a fully computerised population register
2- issuing mandatory civil identification cards to every resident of the country, regardless of age and nationality.
The other source of demographic and socioeconomic data on Kuwait is the Central Statistical Office (CSO), operating within the Planning Ministry. The CSO has conducted ten population and housing censuses since its inception in 1957.
Since 1995 a marked discrepancy was witnessed between PACI’ and CSO’ population figures. PACI’ database is connected electronically with other administrations and bodies registering demographic events and professional/ residency issues (births and death; departures and arrivals; end of service, residency and ID deliveries, etc.).
PACI’s records of residents’ movements is thus regularly updated, which limits the risk of population overcount. Therefore, it is more likely that residents were undercounted during CSO- Ministry of Planning’s census operations (see: Shah, N. Population of Kuwait. Structure and Dynamics, Kuwait: Kuwait University Academic Publication Council, 2010, chapter 1).
(a) Kuwaiti: the Kuwaiti nationality rests upon a document of Kuwaiti nationality or a certificate proving Kuwaiti nationality issued by the Ministry of Interior of Kuwait.
(b) Non-Kuwaiti: his/ her nationality is determined by the name of the State having issued the passport. The foreign national also entered Kuwait legally and has a stamp of residence.
This category includes the Bidoon, a category of stateless persons living in the Emirate. Kuwait’s Bidoon population originates from three broad categories:
1) those whose ancestors failed to apply for nationality or lacked necessary documentation at the time of Kuwait’s independence in 1961;
2) those recruited to work in Kuwait’s army or police force during the 1960s who permanently settled in Kuwait, along with their families;
3) children of Kuwaiti mothers and stateless or foreign fathers (see Human Rights Watch. Prisoners of the Past. Kuwaiti Bidun and the Burden of Statelessness, June 2011, p. 3).
(c) Unemployed population: population aged 15 years and over, able to work, looking for employment and unable to find one.
2. Institution which provides data
The Public Authority for Civil Information (PACI)
3. Period of data coverage: December 2012
The database is updated three times a year and the website presents only the most recent data.
4. Data availability
The statistics section of PACI’s website (http://www.paci.gov.kw/en/ (English); http://www.paci.gov.kw/ (Arabic)) provides population and socio-economic data broken down by nationality (Kuwaiti/ non-Kuwaiti). Some data are displayed by nationality groups.
Analytical tables and data crosstabulations are available for download in PDF, html, .png and Excel (.csv) formats.
Date of access: June 2013.
| |
2008 |
2009 |
2010 |
2011 |
| Entry permits for work* |
99.195 |
88.800 |
95.691 |
137.842 |
| Permits issued for the first time |
78.226 |
58.302 |
53.450 |
81.508 |
| Renewed permits |
544.396 |
484.085 |
516.718 |
558.099 |
| Transfer within the private sector |
162.612 |
167.395 |
183.822 |
185.950 |
| Transfers outside of private sector |
5.144 |
4.133 |
4.986 |
4.679 |
| Transfers from the governmental to the private sector |
645 |
303 |
515 |
712 |
| Transfers from invitation document to private sector |
10.623 |
9.437 |
13.645 |
14.127 |
| Transfers from dependant residency to private sector |
6.026 |
5.346 |
4.871 |
7.598 |
| Transfers from domestic worker permit to private sector |
7.115 |
7.164 |
8.186 |
8.338 |
| Final cancellations of permit |
65.062 |
67.763 |
55.512 |
28.918 |
| Cancellations of permission to work abroad** |
2.488 |
21.002 |
27.155 |
39.606 |
| Cancellations of permit due to death of holder |
764 |
533 |
423 |
706 |
| Adjustements of status*** |
182 |
149 |
1.060 |
n.a. |
Source: Ministry of Social Affairs and Labour
ANNEXED NOTE
1. Definitions
* Figure does not include cancelled entry permits.
Entry permit for work differs from labour permit.
** Pertains to holders of residence visas in the following situation:
“A residence visa is cancelled if the holder is absent abroad for a continuous period of six months. The only exceptions are for those who (a) are studying abroad, (b) are receiving necessary treatment abroad, or (c) are required by virtue of their work to be abroad, provided permission in all three cases is obtained before leaving Kuwait.
“
http://www.moi.gov.kw/portal/vEnglish/ShowPage.aspx?objectID={F186A875-71FA-44F6-BC5F-8CF9B386B9E1}#Out_of_country_Absentee_
*** Data has been included in above-mentioned categories of permits
2. Institution which provides data
Ministry of Social Affairs and Labour (MOSAL)
3. Period of data coverage
December 31st, given years.
4. Data availability
Published in the CSB’ Statistical Yearbooks, in Chapter “Labor Force”
Statistical Yearbooks are available online at: http://www.csb.gov.kw/Socan_Statistic_EN.aspx?ID=18 (website in English) and at http://www.csb.gov.kw/Socan_Statistic.aspx (Arabic website).
Volumes are bilingual (English and Arabic). Starting with 2000′ issue, yearbooks are published online in PDF format; a selection of 1964 to 1999 printed volumes is also available in one online publication.
Date of access: June 2013.
| |
|
Kuwaitis |
Non-Kuwaitis |
TOTAL |
| Age group |
Sex |
Student |
Housekeeper |
Retired/ with means |
Total |
Student |
Housekeeper |
Retired/ with means |
Total |
Student |
Housekeeper |
Retired/ with means |
Total |
| |
|
| |
males |
62.279 |
0 |
0 |
62.279 |
39.007 |
0 |
0 |
39.007 |
101.286 |
0 |
0 |
101.286 |
| 15-19 |
females |
62.050 |
1.294 |
0 |
63.344 |
33.204 |
3.834 |
0 |
37.038 |
95.254 |
5.128 |
0 |
100.382 |
| |
total |
124.329 |
1.294 |
0 |
125.623 |
72.211 |
3.834 |
0 |
76.045 |
196.540 |
5.128 |
0 |
201.668 |
| |
males |
25.191 |
0 |
30 |
25.221 |
22.635 |
0 |
6 |
22.641 |
47.826 |
0 |
36 |
47.862 |
| 20-24 |
females |
34.873 |
3.045 |
1 |
37.919 |
24.075 |
14.858 |
6 |
38.939 |
58.948 |
17.903 |
7 |
76.858 |
| |
total |
60.064 |
3.045 |
31 |
63.140 |
46.710 |
14.858 |
12 |
61.580 |
106.774 |
17.903 |
43 |
124.720 |
| |
males |
3.299 |
0 |
139 |
3.438 |
8.328 |
0 |
12 |
8.340 |
11.627 |
0 |
151 |
11.778 |
| 25-29 |
females |
5.073 |
2.871 |
25 |
7.969 |
11.947 |
35.445 |
3 |
47.395 |
17.020 |
38.316 |
28 |
55.364 |
| |
total |
8.372 |
2.871 |
164 |
11.407 |
20.275 |
35.445 |
15 |
55.735 |
28.647 |
38.316 |
179 |
67.142 |
| |
males |
1.136 |
0 |
417 |
1.553 |
3.531 |
0 |
35 |
3.566 |
4.667 |
0 |
452 |
5.119 |
| 30-34 |
females |
2.190 |
2.899 |
162 |
5.251 |
5.102 |
32.187 |
4 |
37.293 |
7.292 |
35.086 |
166 |
42.544 |
| |
total |
3.326 |
2.899 |
579 |
6.804 |
8.633 |
32.187 |
39 |
40.859 |
11.959 |
35.086 |
618 |
47.663 |
| |
males |
1.140 |
0 |
1.026 |
2.166 |
2.313 |
0 |
32 |
2.345 |
3.453 |
0 |
1.058 |
4.511 |
| 35-39 |
females |
2.819 |
3.296 |
458 |
6.573 |
2.893 |
23.835 |
6 |
26.734 |
5.712 |
27.131 |
464 |
33.307 |
| |
total |
3.959 |
3.296 |
1.484 |
8.739 |
5.206 |
23.835 |
38 |
29.079 |
9.165 |
27.131 |
1.522 |
37.818 |
| |
males |
1.488 |
0 |
3.384 |
4.872 |
1.100 |
0 |
15 |
1.115 |
2.588 |
0 |
3.399 |
5.987 |
| 40-44 |
females |
3.244 |
4.392 |
3.109 |
10.745 |
1.238 |
19.216 |
2 |
20.456 |
4.482 |
23.608 |
3.111 |
31.201 |
| |
total |
4.732 |
4.392 |
6.493 |
15.617 |
2.338 |
19.216 |
17 |
21.571 |
7.070 |
23.608 |
6.510 |
37.188 |
| |
males |
717 |
0 |
5.846 |
6.563 |
213 |
0 |
42 |
255 |
930 |
0 |
5.888 |
6.818 |
| 45-49 |
females |
1.268 |
8.207 |
6.090 |
15.565 |
244 |
16.008 |
0 |
16.252 |
1.512 |
24.215 |
6.090 |
31.817 |
| |
total |
1.985 |
8.207 |
11.936 |
22.128 |
457 |
16.008 |
42 |
16.507 |
2.442 |
24.215 |
11.978 |
38.635 |
| |
males |
0 |
0 |
9.284 |
9.284 |
0 |
0 |
44 |
44 |
0 |
0 |
9.328 |
9.328 |
| 50-54 |
females |
0 |
8.680 |
6.699 |
15.379 |
0 |
12.433 |
2 |
12.435 |
0 |
21.113 |
6.701 |
27.814 |
| |
total |
0 |
8.680 |
15.983 |
24.663 |
0 |
12.433 |
46 |
12.479 |
0 |
21.113 |
16.029 |
37.142 |
| |
males |
0 |
0 |
8.976 |
8.976 |
0 |
0 |
74 |
74 |
0 |
0 |
9.050 |
9.050 |
| 55-59 |
females |
0 |
9.317 |
5.695 |
15.012 |
0 |
8.442 |
1 |
8.443 |
0 |
17.759 |
5.696 |
23.455 |
| |
total |
0 |
9.317 |
14.671 |
23.988 |
0 |
8.442 |
75 |
8.517 |
0 |
17.759 |
14.746 |
32.505 |
| |
males |
0 |
0 |
6.223 |
6.223 |
0 |
0 |
257 |
257 |
0 |
0 |
6.480 |
6.480 |
| 60-64 |
females |
0 |
8.009 |
2.893 |
10.902 |
0 |
5.421 |
1 |
5.422 |
0 |
13.430 |
2.894 |
16.324 |
| |
total |
0 |
8.009 |
9.116 |
17.125 |
0 |
5.421 |
258 |
5.679 |
0 |
13.430 |
9.374 |
22.804 |
| |
males |
0 |
0 |
14.104 |
14.104 |
0 |
0 |
223 |
223 |
0 |
0 |
14.327 |
14.327 |
| >65 |
females |
0 |
19.942 |
1.837 |
21.779 |
0 |
8.703 |
6 |
8.709 |
0 |
28.645 |
1.843 |
30.488 |
| |
total |
0 |
19.942 |
15.941 |
35.883 |
0 |
8.703 |
229 |
8.932 |
0 |
28.645 |
16.170 |
44.815 |
| |
males |
95.250 |
0 |
49.429 |
144.679 |
77.127 |
0 |
740 |
77.867 |
172.377 |
0 |
50.169 |
222.546 |
| TOTAL |
females |
111.517 |
71.952 |
26.969 |
210.438 |
78.703 |
180.382 |
31 |
259.116 |
190.220 |
252.334 |
27.000 |
469.554 |
| |
total |
206.767 |
71.952 |
76.398 |
355.117 |
155.830 |
180.382 |
771 |
336.983 |
362.597 |
252.334 |
77.169 |
692.100 |
Source: PACI
ANNEXED NOTE
1. Characteristics of data and definitions
The source of data used here is the Public Authority for Civil Information (PACI), an independant government body in charge of :
1- centralising all population and labour force data in order to manage a fully computerised population register
2- issuing mandatory civil identification cards to every resident of the country, regardless of age and nationality.
The other source of demographic and socioeconomic data on Kuwait is the Central Statistical Office (CSO), operating within the Planning Ministry. The CSO has conducted ten population and housing censuses since its inception in 1957.
Since 1995 a marked discrepancy was witnessed between PACI’ and CSO’ population figures. PACI’ database is connected electronically with other administrations and bodies registering demographic events and professional/ residency issues (births and death; departures and arrivals; end of service, residency and ID deliveries, etc.).
PACI’s records of residents’ movements is thus regularly updated, which limits the risk of population overcount. Therefore, it is more likely that residents were undercounted during CSO- Ministry of Planning’s census operations (see: Shah, N. Population of Kuwait. Structure and Dynamics, Kuwait: Kuwait University Academic Publication Council, 2010, chapter 1).
(a) Kuwaiti: the Kuwaiti nationality rests upon a document of Kuwaiti nationality or a certificate proving Kuwaiti nationality issued by the Ministry of Interior of Kuwait.
(b) Non-Kuwaiti: his/ her nationality is determined by the name of the State having issued the passport. The foreign national also entered Kuwait legally and has a stamp of residence.
This category includes the Bidoon, a category of stateless persons living in the Emirate. Kuwait’s Bidoon population originates from three broad categories:
1) those whose ancestors failed to apply for nationality or lacked necessary documentation at the time of Kuwait’s independence in 1961;
2) those recruited to work in Kuwait’s army or police force during the 1960s who permanently settled in Kuwait, along with their families;
3) children of Kuwaiti mothers and stateless or foreign fathers (see Human Rights Watch. Prisoners of the Past. Kuwaiti Bidun and the Burden of Statelessness, June 2011, p. 3).
(c) Population in the labour force: population aged 15 years and above, included in the labour market, either employed (in the government or private sector, as itinerant worker, employed in the domestic sector), or unemployed.
(d) Population out of the labour force: population aged 15 years and above, not contributing to any economic activity and not included in the labour market, among which the students, the housewives, the retired persons or self-sufficients.
2. Institution which provides data
The Public Authority for Civil Information (PACI)
3. Period of data coverage: December 2012
The database is updated three times a year and the website presents only the most recent data.
4. Data availability
The statistics section of PACI’s website (http://www.paci.gov.kw/en/ (English); http://www.paci.gov.kw/ (Arabic)) provides population and socio-economic data broken down by nationality (Kuwaiti/ non-Kuwaiti). Some data are displayed by nationality groups.
Analytical tables and data crosstabulations are available for download in PDF, html, .png and Excel (.csv) formats.
Date of access: June 2013.
| |
|
Student |
Housekeeper |
Retired/ with means |
Total |
| |
|
| |
males |
95.250 |
0 |
49.429 |
144.679 |
| Kuwaitis |
females |
111.517 |
71.952 |
26.969 |
210.438 |
| |
total |
206.767 |
71.952 |
76.398 |
355.117 |
| |
males |
77.127 |
0 |
740 |
77.867 |
| Non-Kuwaitis |
females |
78.703 |
180.382 |
31 |
259.116 |
| |
total |
155.830 |
180.382 |
771 |
336.983 |
| |
males |
172.377 |
0 |
50.169 |
222.546 |
| TOTAL |
females |
190.220 |
252.334 |
27.000 |
469.554 |
| |
total |
362.597 |
252.334 |
77.169 |
692.100 |
Source: PACI
ANNEXED NOTE
1. Characteristics of data and definitions
The source of data used here is the Public Authority for Civil Information (PACI), an independant government body in charge of :
1- centralising all population and labour force data in order to manage a fully computerised population register
2- issuing mandatory civil identification cards to every resident of the country, regardless of age and nationality.
The other source of demographic and socioeconomic data on Kuwait is the Central Statistical Office (CSO), operating within the Planning Ministry. The CSO has conducted ten population and housing censuses since its inception in 1957.
Since 1995 a marked discrepancy was witnessed between PACI’ and CSO’ population figures. PACI’ database is connected electronically with other administrations and bodies registering demographic events and professional/ residency issues (births and death; departures and arrivals; end of service, residency and ID deliveries, etc.).
PACI’s records of residents’ movements is thus regularly updated, which limits the risk of population overcount. Therefore, it is more likely that residents were undercounted during CSO- Ministry of Planning’s census operations (see: Shah, N. Population of Kuwait. Structure and Dynamics, Kuwait: Kuwait University Academic Publication Council, 2010, chapter 1).
(a) Kuwaiti: the Kuwaiti nationality rests upon a document of Kuwaiti nationality or a certificate proving Kuwaiti nationality issued by the Ministry of Interior of Kuwait.
(b) Non-Kuwaiti: his/ her nationality is determined by the name of the State having issued the passport. The foreign national also entered Kuwait legally and has a stamp of residence.
This category includes the Bidoon, a category of stateless persons living in the Emirate. Kuwait’s Bidoon population originates from three broad categories:
1) those whose ancestors failed to apply for nationality or lacked necessary documentation at the time of Kuwait’s independence in 1961;
2) those recruited to work in Kuwait’s army or police force during the 1960s who permanently settled in Kuwait, along with their families;
3) children of Kuwaiti mothers and stateless or foreign fathers (see Human Rights Watch. Prisoners of the Past. Kuwaiti Bidun and the Burden of Statelessness, June 2011, p. 3).
(c) Population in the labour force: population aged 15 years and above, included in the labour market, either employed (in the government or private sector, as itinerant worker, employed in the domestic sector), or unemployed.
(d) Population out of the labour force: population aged 15 years and above, not contributing to any economic activity and not included in the labour market, among which the students, the housewives, the retired persons or self-sufficients.
2. Institution which provides data
The Public Authority for Civil Information (PACI)
3. Period of data coverage: December 2012
The database is updated three times a year and the website presents only the most recent data.
4. Data availability
The statistics section of PACI’s website (http://www.paci.gov.kw/en/ (English); http://www.paci.gov.kw/ (Arabic)) provides population and socio-economic data broken down by nationality (Kuwaiti/ non-Kuwaiti). Some data are displayed by nationality groups.
Analytical tables and data crosstabulations are available for download in PDF, html, .png and Excel (.csv) formats.
Date of access: June 2013.
| |
|
|
Kuwaitis |
|
|
Non-Kuwaitis |
|
|
TOTAL |
|
| |
|
Government sector |
Non-governmental sector |
Domestic services sector |
Government sector |
Non-governmental sector |
Domestic services sector |
Government sector |
Non-governmental sector |
Domestic services sector |
| |
|
| |
|
| 15-19 |
males |
775 |
1.490 |
0 |
26 |
108 |
51 |
801 |
1.598 |
51 |
| females |
19 |
488 |
0 |
3 |
26 |
49 |
22 |
514 |
49 |
| Total |
794 |
1.978 |
0 |
29 |
134 |
100 |
823 |
2.112 |
100 |
| 20-24 |
males |
17.622 |
10.352 |
0 |
714 |
51.878 |
21.966 |
18.336 |
62.230 |
21.966 |
| females |
9.424 |
6.554 |
0 |
728 |
3.931 |
29.842 |
10.152 |
10.485 |
29.842 |
| Total |
27.046 |
16.906 |
0 |
1.442 |
55.809 |
51.808 |
28.488 |
72.715 |
51.808 |
| 25-29 |
males |
33.088 |
9.779 |
0 |
6.090 |
175.606 |
47.374 |
39.178 |
185.385 |
47.374 |
| females |
30.722 |
9.181 |
0 |
6.362 |
18.874 |
68.850 |
37.084 |
28.055 |
68.850 |
| Total |
63.810 |
18.960 |
0 |
12.452 |
194.480 |
116.224 |
76.262 |
213.440 |
116.224 |
| 30-34 |
males |
32.067 |
5.337 |
0 |
10.802 |
222.251 |
60.100 |
42.869 |
227.588 |
60.100 |
| females |
28.662 |
7.373 |
0 |
9.877 |
23.742 |
60.266 |
38.539 |
31.115 |
60.266 |
| Total |
60.729 |
12.710 |
0 |
20.679 |
245.993 |
120.366 |
81.408 |
258.703 |
120.366 |
| 35-39 |
males |
28.750 |
3.551 |
0 |
12.419 |
184.598 |
50.055 |
41.169 |
188.149 |
50.055 |
| females |
25.145 |
6.960 |
0 |
9.118 |
19.289 |
55.663 |
34.263 |
26.249 |
55.663 |
| Total |
53.895 |
10.511 |
0 |
21.537 |
203.887 |
105.718 |
75.432 |
214.398 |
105.718 |
| 40-44 |
males |
22.712 |
2.188 |
0 |
11.592 |
154.136 |
40.413 |
34.304 |
156.324 |
40.413 |
| females |
17.871 |
5.496 |
0 |
5.410 |
16.310 |
42.898 |
23.281 |
21.806 |
42.898 |
| Total |
40.583 |
7.684 |
0 |
17.002 |
170.446 |
83.311 |
57.585 |
178.130 |
83.311 |
| 45-49 |
males |
16.984 |
1.669 |
0 |
12.013 |
116.308 |
24.119 |
28.997 |
117.977 |
24.119 |
| females |
11.239 |
2.750 |
0 |
3.110 |
11.666 |
28.303 |
14.349 |
14.416 |
28.303 |
| Total |
28.223 |
4.419 |
0 |
15.123 |
127.974 |
52.422 |
43.346 |
132.393 |
52.422 |
| 50-54 |
males |
8.311 |
1.568 |
0 |
11.134 |
77.398 |
11.788 |
19.445 |
78.966 |
11.788 |
| females |
6.594 |
1.721 |
0 |
2.268 |
8.040 |
11.521 |
8.862 |
9.761 |
11.521 |
| Total |
14.905 |
3.289 |
0 |
13.402 |
85.438 |
23.309 |
28.307 |
88.727 |
23.309 |
| 55-59 |
males |
3.657 |
1.758 |
0 |
9.922 |
46.712 |
4.334 |
13.579 |
48.470 |
4.334 |
| females |
3.356 |
871 |
0 |
2.160 |
4.340 |
3.689 |
5.516 |
5.211 |
3.689 |
| Total |
7.013 |
2.629 |
0 |
12.082 |
51.052 |
8.023 |
19.095 |
53.681 |
8.023 |
| 60-64 |
males |
1.616 |
1.140 |
0 |
5.851 |
21.380 |
1.279 |
7.467 |
22.520 |
1.279 |
| females |
1.818 |
635 |
0 |
1.341 |
2.008 |
1.150 |
3.159 |
2.643 |
1.150 |
| Total |
3.434 |
1.775 |
0 |
7.192 |
23.388 |
2.429 |
10.626 |
25.163 |
2.429 |
| >65 |
males |
2.402 |
1.708 |
0 |
4.096 |
13.724 |
485 |
6.498 |
15.432 |
485 |
| females |
804 |
877 |
0 |
779 |
1.251 |
605 |
1.583 |
2.128 |
605 |
| Total |
3.206 |
2.585 |
0 |
4.875 |
14.975 |
1.090 |
8.081 |
17.560 |
1.090 |
| TOTAL |
males |
167.984 |
40.540 |
0 |
84.659 |
1.064.099 |
261.964 |
252.643 |
1.104.639 |
261.964 |
| females |
135.654 |
42.906 |
0 |
41.156 |
109.477 |
302.836 |
176.810 |
152.383 |
302.836 |
| Total |
303.638 |
83.446 |
0 |
125.815 |
1.173.576 |
564.800 |
429.453 |
1.257.022 |
564.800 |
Source: PACI
ANNEXED NOTE
1. Characteristics of data and definitions
The source of data used here is the Public Authority for Civil Information (PACI), an independant government body in charge of :
1- centralising all population and labour force data in order to manage a fully computerised population register
2- issuing mandatory civil identification cards to every resident of the country, regardless of age and nationality.
The other source of demographic and socioeconomic data on Kuwait is the Central Statistical Office (CSO), operating within the Planning Ministry. The CSO has conducted ten population and housing censuses since its inception in 1957.
Since 1995 a marked discrepancy was witnessed between PACI’ and CSO’ population figures. PACI’ database is connected electronically with other administrations and bodies registering demographic events and professional/ residency issues (births and death; departures and arrivals; end of service, residency and ID deliveries, etc.).
PACI’s records of residents’ movements is thus regularly updated, which limits the risk of population overcount. Therefore, it is more likely that residents were undercounted during CSO- Ministry of Planning’s census operations (see: Shah, N. Population of Kuwait. Structure and Dynamics, Kuwait: Kuwait University Academic Publication Council, 2010, chapter 1).
(a) Kuwaiti: the Kuwaiti nationality rests upon a document of Kuwaiti nationality or a certificate proving Kuwaiti nationality issued by the Ministry of Interior of Kuwait.
(b) Non-Kuwaiti: his/ her nationality is determined by the name of the State having issued the passport. The foreign national also entered Kuwait legally and has a stamp of residence.
This category includes the Bidoon, a category of stateless persons living in the Emirate. Kuwait’s Bidoon population originates from three broad categories:
1) those whose ancestors failed to apply for nationality or lacked necessary documentation at the time of Kuwait’s independence in 1961;
2) those recruited to work in Kuwait’s army or police force during the 1960s who permanently settled in Kuwait, along with their families;
3) children of Kuwaiti mothers and stateless or foreign fathers (see Human Rights Watch. Prisoners of the Past. Kuwaiti Bidun and the Burden of Statelessness, June 2011, p. 3).
(c) Population in the labour force: population aged 15 years and above, included in the labour market, either employed (in the government or private sector, as itinerant worker, employed in the domestic sector), or unemployed.
(d) Government sector: any organization of the government (organizations, authority and departments), included within the state budget
(Ministries and government departments; authorities with attached budgets; authorities with independent budgets).
(e) Non-governmental sector: any part of the private sector (a company or an individual) or any authority of the non-governmental sector.
(f) Domestic services sector: the household/ family sector, where the work is associated with the residence and its inhabitants, their service and their comfort (including maids, nannies, cooks, drivers, etc.).
Note: figures of expatriates differ slightly between PACI’s various sources of data (database; tabulated data).
2. Institution which provides data
The Public Authority for Civil Information (PACI)
3. Period of data coverage: December 2012
The database is updated three times a year and the website presents only the most recent data.
4. Data availability
The statistics section of PACI’s website (http://www.paci.gov.kw/en/ (English); http://www.paci.gov.kw/ (Arabic)) provides population and socio-economic data broken down by nationality (Kuwaiti/ non-Kuwaiti). Some data are displayed by nationality groups.
Analytical tables and data crosstabulations are available for download in PDF, html, .png and Excel (.csv) formats.
Date of access: June 2013.
| Economic activities |
Kuwaitis |
Non-Kuwaitis |
Total |
| Males |
Females |
Total |
Males |
Females |
Total |
Males |
Females |
Total |
| Agriculture, hunting and forestry |
193 |
243 |
436 |
36410 |
591 |
37001 |
36603 |
834 |
37437 |
| Fishing |
5 |
1 |
6 |
37 |
7 |
44 |
42 |
8 |
50 |
| Mining and quarrying |
4431 |
874 |
5305 |
2015 |
80 |
2095 |
6446 |
954 |
7400 |
| Manufacturing |
7160 |
2250 |
9410 |
109664 |
6402 |
116066 |
116824 |
8652 |
125476 |
| Electricity, gas and water supply |
10864 |
2936 |
13800 |
1861 |
89 |
1950 |
12725 |
3025 |
15750 |
| Construction |
6246 |
5474 |
11720 |
178109 |
8798 |
186907 |
184355 |
14272 |
198627 |
| Wholesale and retail trade; repair of motor vehicles, motorcycles and personal and households goods |
6382 |
6632 |
13014 |
259253 |
22185 |
281438 |
265635 |
28817 |
294452 |
| Hotels and restaurants |
700 |
1330 |
2030 |
56352 |
7285 |
63637 |
57052 |
8615 |
65667 |
| Transport, storage and communications |
6534 |
2583 |
9117 |
56750 |
3230 |
59980 |
63284 |
5813 |
69097 |
| Financial intermediation |
5121 |
4182 |
9303 |
10721 |
2411 |
13132 |
15842 |
6593 |
22435 |
| Real estate, renting and business activities |
6888 |
3524 |
10412 |
77482 |
8341 |
85823 |
84370 |
11865 |
96235 |
| Public administration and defence; compulsory social security |
130524 |
97551 |
228075 |
60113 |
22217 |
82330 |
190637 |
119768 |
310405 |
| Education |
7435 |
24988 |
32423 |
16898 |
18078 |
34976 |
24333 |
43066 |
67399 |
| Health and social work |
3997 |
7863 |
11860 |
11273 |
17691 |
28964 |
15270 |
25554 |
40824 |
| Other community, social and personal service activities |
1782 |
2081 |
3863 |
66532 |
14204 |
80736 |
68314 |
16285 |
84599 |
| Private households with employed persons |
112 |
61 |
173 |
260173 |
290325 |
550498 |
260285 |
290386 |
550671 |
| Extra-territorial organizations and bodies |
8 |
17 |
25 |
2176 |
717 |
2893 |
2184 |
734 |
2918 |
| Not Stated |
15661 |
22712 |
38373 |
221871 |
46569 |
268440 |
237532 |
69281 |
306813 |
| Total |
214043 |
185302 |
399345 |
1427690 |
469220 |
1896910 |
1641733 |
654522 |
2296255 |
Source: PACI
ANNEXED NOTE
1. Characteristics of data and definitions
The source of data used here is the Public Authority for Civil Information (PACI), an independant government body in charge of :
1- centralising all population and labour force data in order to manage a fully computerised population register
2- issuing mandatory civil identification cards to every resident of the country, regardless of age and nationality.
The other source of demographic and socioeconomic data on Kuwait is the Central Statistical Office (CSO), operating within the Planning Ministry. The CSO has conducted ten population and housing censuses since its inception in 1957.
Since 1995 a marked discrepancy was witnessed between PACI’ and CSO’ population figures. PACI’ database is connected electronically with other administrations and bodies registering demographic events and professional/ residency issues (births and death; departures and arrivals; end of service, residency and ID deliveries, etc.).
PACI’s records of residents’ movements is thus regularly updated, which limits the risk of population overcount. Therefore, it is more likely that residents were undercounted during CSO- Ministry of Planning’s census operations (see: Shah, N. Population of Kuwait. Structure and Dynamics, Kuwait: Kuwait University Academic Publication Council, 2010, chapter 1).
(a) Kuwaiti: the Kuwaiti nationality rests upon a document of Kuwaiti nationality or a certificate proving Kuwaiti nationality issued by the Ministry of Interior of Kuwait.
(b) Non-Kuwaiti: his/ her nationality is determined by the name of the State having issued the passport. The foreign national also entered Kuwait legally and has a stamp of residence.
This category includes the Bidoon, a category of stateless persons living in the Emirate. Kuwait’s Bidoon population originates from three broad categories:
1) those whose ancestors failed to apply for nationality or lacked necessary documentation at the time of Kuwait’s independence in 1961;
2) those recruited to work in Kuwait’s army or police force during the 1960s who permanently settled in Kuwait, along with their families;
3) children of Kuwaiti mothers and stateless or foreign fathers (see Human Rights Watch. Prisoners of the Past. Kuwaiti Bidun and the Burden of Statelessness, June 2011, p. 3).
(c) Population in the labour force: population aged 15 years and above, included in the labour market, either employed (in the government or private sector, as itinerant worker, employed in the domestic sector), or unemployed.
Presented data include unemployed population.
Economic activities are categorised according to ISIC( Rev. 3) international classification of economic activity.
Note: figures of expatriates differ slightly between PACI’s various sources of data (database; tabulated data).
2. Institution which provides data
The Public Authority for Civil Information (PACI)
3. Period of data coverage: December 2012
The database is updated three times a year and the website presents only the most recent data.
4. Data availability
The statistics section of PACI’s website (http://www.paci.gov.kw/en/ (English); http://www.paci.gov.kw/ (Arabic)) provides population and socio-economic data broken down by nationality (Kuwaiti/ non-Kuwaiti). Some data are displayed by nationality groups.
Analytical tables and data crosstabulations are available for download in PDF, html, .png and Excel (.csv) formats.
Date of access: June 2013.
| Nationality group |
Kuwaitis |
|
Arabs |
|
Asians |
Africans |
|
Europeans |
|
North Americans |
South Americans |
Australians-Oceanians |
Total Non-Kuwaitis |
Grand total |
| Sector of economic Activity |
Govt. Sector |
Non-Govt Sector |
Total |
Govt. Sector |
Non-Govt Sector |
Total |
Govt. Sector |
Non-Govt Sector |
Total |
Govt. Sector |
Non-Govt Sector |
Total |
Govt. Sector |
Non-Govt Sector |
Total |
Govt. Sector |
Non-Govt Sector |
Total |
Govt. Sector |
Non-Govt Sector |
Total |
Govt. Sector |
Non-Govt Sector |
Total |
Govt. Sector |
Non-Govt Sector |
Total |
Govt. Sector |
Non-Govt Sector |
Total |
| Agriculture, hunting and forestry |
6 |
430 |
436 |
9 |
12.043 |
12.052 |
11 |
24.286 |
24.297 |
4 |
575 |
579 |
1 |
31 |
32 |
0 |
33 |
33 |
0 |
2 |
2 |
0 |
9 |
9 |
25 |
36.979 |
37.004 |
31 |
37.409 |
37.440 |
| Fishing |
0 |
6 |
6 |
0 |
18 |
18 |
0 |
26 |
26 |
0 |
0 |
0 |
0 |
0 |
0 |
0 |
0 |
0 |
0 |
0 |
0 |
0 |
0 |
0 |
0 |
44 |
44 |
0 |
50 |
50 |
| Mining and quarrying |
5.128 |
177 |
5.305 |
487 |
813 |
1.300 |
16 |
648 |
664 |
0 |
5 |
5 |
1 |
11 |
12 |
2 |
103 |
105 |
1 |
5 |
6 |
1 |
2 |
3 |
508 |
1.587 |
2.095 |
5.636 |
1.764 |
7.400 |
| Manufacturing |
5.719 |
3.691 |
9.410 |
524 |
33.490 |
34.014 |
782 |
80.684 |
81.466 |
5 |
150 |
155 |
4 |
172 |
176 |
8 |
214 |
222 |
1 |
17 |
18 |
4 |
16 |
20 |
1.328 |
114.743 |
116.071 |
7.047 |
118.434 |
125.481 |
| Electricity, gas and water supply |
13.801 |
0 |
13.801 |
1.005 |
77 |
1.082 |
800 |
28 |
828 |
25 |
0 |
25 |
10 |
0 |
10 |
2 |
1 |
3 |
1 |
0 |
1 |
1 |
0 |
1 |
1.844 |
106 |
1.950 |
15.645 |
106 |
15.751 |
| Construction |
85 |
11.635 |
11.720 |
25 |
70.952 |
70.977 |
33 |
111.527 |
111.560 |
0 |
284 |
284 |
1 |
898 |
899 |
0 |
3.033 |
3.033 |
0 |
95 |
95 |
0 |
63 |
63 |
59 |
186.852 |
186.911 |
144 |
198.487 |
198.631 |
| Wholesale and retail trade |
154 |
12.860 |
13.014 |
115 |
109.756 |
109.871 |
71 |
168.831 |
168.902 |
3 |
530 |
533 |
19 |
898 |
917 |
12 |
1.073 |
1.085 |
0 |
70 |
70 |
1 |
82 |
83 |
221 |
281.240 |
281.461 |
375 |
294.100 |
294.475 |
| Hotels and restaurants |
174 |
1.856 |
2.030 |
111 |
21.535 |
21.646 |
165 |
41.090 |
41.255 |
0 |
360 |
360 |
0 |
226 |
226 |
1 |
117 |
118 |
0 |
23 |
23 |
0 |
12 |
12 |
277 |
63.363 |
63.640 |
451 |
65.219 |
65.670 |
| Transport, storage and communications |
4.672 |
4.445 |
9.117 |
981 |
18.979 |
19.960 |
1.497 |
37.900 |
39.397 |
7 |
98 |
105 |
99 |
168 |
267 |
52 |
156 |
208 |
4 |
24 |
28 |
4 |
13 |
17 |
2.644 |
57.338 |
59.982 |
7.316 |
61.783 |
69.099 |
| Financial intermediation |
1.700 |
7.603 |
9.303 |
340 |
6.227 |
6.567 |
66 |
5.987 |
6.053 |
1 |
72 |
73 |
11 |
143 |
154 |
13 |
242 |
255 |
0 |
11 |
11 |
2 |
17 |
19 |
433 |
12.699 |
13.132 |
2.133 |
20.302 |
22.435 |
| Real estate, renting and business activities |
429 |
9.988 |
10.417 |
327 |
39.743 |
40.070 |
196 |
43.565 |
43.761 |
1 |
254 |
255 |
0 |
815 |
815 |
1 |
786 |
787 |
0 |
60 |
60 |
0 |
76 |
76 |
525 |
85.299 |
85.824 |
954 |
95.287 |
96.241 |
| Public administration and defence, compulsory social security |
228.066 |
10 |
228.076 |
58.482 |
5 |
58.487 |
22.100 |
78 |
22.178 |
280 |
0 |
280 |
695 |
1 |
696 |
590 |
0 |
590 |
57 |
0 |
57 |
44 |
0 |
44 |
82.248 |
84 |
82.332 |
310.314 |
94 |
310.408 |
| Education |
30.673 |
1.747 |
32.420 |
11.112 |
14.500 |
25.612 |
877 |
5.503 |
6.380 |
43 |
245 |
288 |
83 |
1.065 |
1.148 |
118 |
1.253 |
1.371 |
4 |
30 |
34 |
15 |
119 |
134 |
12.252 |
22.715 |
34.967 |
42.925 |
24.462 |
67.387 |
| Health and social work |
11.288 |
573 |
11.861 |
6.385 |
4.252 |
10.637 |
10.921 |
6.840 |
17.761 |
32 |
29 |
61 |
120 |
258 |
378 |
34 |
69 |
103 |
9 |
3 |
12 |
6 |
7 |
13 |
17.507 |
11.458 |
28.965 |
28.795 |
12.031 |
40.826 |
| Other community, social and personal service activities |
1.147 |
2.716 |
3.863 |
974 |
16.815 |
17.789 |
1.438 |
73.913 |
75.351 |
6 |
3.392 |
3.398 |
49 |
350 |
399 |
115 |
1.786 |
1.901 |
48 |
47 |
95 |
11 |
20 |
31 |
2.641 |
96.323 |
98.964 |
3.788 |
99.039 |
102.827 |
| Private households with employed persons |
3 |
170 |
173 |
47 |
3.300 |
3.347 |
147 |
491.257 |
491.404 |
2 |
55.603 |
55.605 |
1 |
13 |
14 |
0 |
10 |
10 |
0 |
3 |
3 |
0 |
0 |
0 |
197 |
550.186 |
550.383 |
200 |
550.356 |
550.556 |
| Extra-territorial organizations and bodies |
10 |
15 |
25 |
810 |
302 |
1.112 |
985 |
401 |
1.386 |
138 |
17 |
155 |
150 |
45 |
195 |
25 |
6 |
31 |
9 |
3 |
12 |
2 |
0 |
2 |
2.119 |
774 |
2.893 |
2.129 |
789 |
2.918 |
| Not Stated |
583 |
37.789 |
38.372 |
760 |
118.318 |
119.078 |
169 |
125.728 |
125.897 |
15 |
1.116 |
1.131 |
25 |
1.299 |
1.324 |
8 |
2.527 |
2.535 |
8 |
141 |
149 |
2 |
122 |
124 |
987 |
249.251 |
250.238 |
1.570 |
287.040 |
288.610 |
| Total |
303.638 |
95.711 |
399.349 |
82.494 |
471.125 |
553.619 |
40.274 |
1.218.292 |
1.258.566 |
562 |
62.730 |
63.292 |
1.269 |
6.393 |
7.662 |
981 |
11.409 |
12.390 |
142 |
534 |
676 |
93 |
558 |
651 |
125.815 |
1.771.041 |
1.896.856 |
429.453 |
1.866.752 |
2.296.205 |
Source: PACI
ANNEXED NOTE
1. Characteristics of data and definitions
The source of data used here is the Public Authority for Civil Information (PACI), an independant government body in charge of :
1- centralising all population and labour force data in order to manage a fully computerised population register
2- issuing mandatory civil identification cards to every resident of the country, regardless of age and nationality.
The other source of demographic and socioeconomic data on Kuwait is the Central Statistical Office (CSO), operating within the Planning Ministry. The CSO has conducted ten population and housing censuses since its inception in 1957.
Since 1995 a marked discrepancy was witnessed between PACI’ and CSO’ population figures. PACI’ database is connected electronically with other administrations and bodies registering demographic events and professional/ residency issues (births and death; departures and arrivals; end of service, residency and ID deliveries, etc.).
PACI’s records of residents’ movements is thus regularly updated, which limits the risk of population overcount. Therefore, it is more likely that residents were undercounted during CSO- Ministry of Planning’s census operations (see: Shah, N. Population of Kuwait. Structure and Dynamics, Kuwait: Kuwait University Academic Publication Council, 2010, chapter 1).
(a) Kuwaiti: the Kuwaiti nationality rests upon a document of Kuwaiti nationality or a certificate proving Kuwaiti nationality issued by the Ministry of Interior of Kuwait.
(b) Non-Kuwaiti: his/ her nationality is determined by the name of the State having issued the passport. The foreign national also entered Kuwait legally and has a stamp of residence.
This category includes the Bidoon, a category of stateless persons living in the Emirate. Kuwait’s Bidoon population originates from three broad categories:
1) those whose ancestors failed to apply for nationality or lacked necessary documentation at the time of Kuwait’s independence in 1961;
2) those recruited to work in Kuwait’s army or police force during the 1960s who permanently settled in Kuwait, along with their families;
3) children of Kuwaiti mothers and stateless or foreign fathers (see Human Rights Watch. Prisoners of the Past. Kuwaiti Bidun and the Burden of Statelessness, June 2011, p. 3).
(c) Population in the labour force: population aged 15 years and above, included in the labour market, either employed (in the government or private sector, as itinerant worker, employed in the domestic sector), or unemployed.
(d) Government sector: any organization of the government (organizations, authority and departments), included within the state budget
(Ministries and government departments; authorities with attached budgets; authorities with independent budgets).
(e) Non-governmental sector: any part of the private sector (a company or an individual) or any authority of the non-governmental sector.
(f) Domestic sector: the household/ family sector, where the work is associated with the residence and its inhabitants, their service and their comfort (including maids, nannies, cooks, drivers, etc.).
Presented data include unemployed population.
Economic activities are categorised according to ISIC( Rev. 3) international classification of economic activity.
Note: figures of expatriates differ slightly between PACI’s various sources of data (database; tabulated data).
2. Institution which provides data
The Public Authority for Civil Information (PACI)
3. Period of data coverage: December 2012
The database is updated three times a year and the website presents only the most recent data.
4. Data availability
The statistics section of PACI’s website (http://www.paci.gov.kw/en/ (English); http://www.paci.gov.kw/ (Arabic)) provides population and socio-economic data broken down by nationality (Kuwaiti/ non-Kuwaiti). Some data are displayed by nationality groups.
Analytical tables and data crosstabulations are available for download in PDF, html, .png and Excel (.csv) formats.
Date of access: June 2013.
| |
males |
females |
total |
| KUWAITIS |
208.523 |
178.560 |
387.083 |
| Arabs |
469.178 |
60.400 |
529.578 |
| Asians |
920.314 |
330.173 |
1.250.487 |
| Africans |
5.840 |
57.330 |
63.170 |
| Europeans |
5.058 |
2.374 |
7.432 |
| North Americans |
9.301 |
2.893 |
12.194 |
| South Americans |
522 |
120 |
642 |
| Aus.- Oceanians |
459 |
175 |
634 |
| TOTAL NON-KUWAITIS |
1.410.672 |
453.465 |
1.864.137 |
| TOTAL |
1.619.195 |
632.025 |
2.251.220 |
Source: PACI
ANNEXED NOTE
1. Characteristics of data and definitions
The source of data used here is the Public Authority for Civil Information (PACI), an independant government body in charge of :
1- centralising all population and labour force data in order to manage a fully computerised population register
2- issuing mandatory civil identification cards to every resident of the country, regardless of age and nationality.
The other source of demographic and socioeconomic data on Kuwait is the Central Statistical Office (CSO), operating within the Planning Ministry. The CSO has conducted ten population and housing censuses since its inception in 1957.
Since 1995 a marked discrepancy was witnessed between PACI’ and CSO’ population figures. PACI’ database is connected electronically with other administrations and bodies registering demographic events and professional/ residency issues (births and death; departures and arrivals; end of service, residency and ID deliveries, etc.).
PACI’s records of residents’ movements is thus regularly updated, which limits the risk of population overcount. Therefore, it is more likely that residents were undercounted during CSO- Ministry of Planning’s census operations (see: Shah, N. Population of Kuwait. Structure and Dynamics, Kuwait: Kuwait University Academic Publication Council, 2010, chapter 1).
(a) Kuwaiti: the Kuwaiti nationality rests upon a document of Kuwaiti nationality or a certificate proving Kuwaiti nationality issued by the Ministry of Interior of Kuwait.
(b) Non-Kuwaiti: his/ her nationality is determined by the name of the State having issued the passport. The foreign national also entered Kuwait legally and has a stamp of residence.
This category includes the Bidoon, a category of stateless persons living in the Emirate. Kuwait’s Bidoon population originates from three broad categories:
1) those whose ancestors failed to apply for nationality or lacked necessary documentation at the time of Kuwait’s independence in 1961;
2) those recruited to work in Kuwait’s army or police force during the 1960s who permanently settled in Kuwait, along with their families;
3) children of Kuwaiti mothers and stateless or foreign fathers (see Human Rights Watch. Prisoners of the Past. Kuwaiti Bidun and the Burden of Statelessness, June 2011, p. 3).
(c) Population in the labour force: population aged 15 years and above, included in the labour market, either employed (in the government or private sector, as itinerant worker, employed in the domestic sector), or unemployed.
Note: figures of expatriates differ slightly between PACI’s various sources of data (database; tabulated data).
2. Institution which provides data
The Public Authority for Civil Information (PACI)
3. Period of data coverage: December 2012
The database is updated three times a year and the website presents only the most recent data.
4. Data availability
The statistics section of PACI’s website (http://www.paci.gov.kw/en/ (English); http://www.paci.gov.kw/ (Arabic)) provides population and socio-economic data broken down by nationality (Kuwaiti/ non-Kuwaiti). Some data are displayed by nationality groups.
Analytical tables and data crosstabulations are available for download in PDF, html, .png and Excel (.csv) formats.
Date of access: June 2013.
| |
|
Kuwaitis |
|
|
Non-Kuwaitis |
|
| |
males |
females |
Total |
males |
females |
Total |
| 15-19 |
2.265 |
507 |
2.772 |
185 |
78 |
263 |
| 20-24 |
27.974 |
15.978 |
43.952 |
74.558 |
34.501 |
109.059 |
| 25-29 |
42.867 |
39.903 |
82.770 |
229.070 |
94.086 |
323.156 |
| 30-34 |
37.404 |
36.035 |
73.439 |
293.153 |
93.885 |
387.038 |
| 35-39 |
32.301 |
32.105 |
64.406 |
247.072 |
84.070 |
331.142 |
| 40-44 |
24.900 |
23.367 |
48.267 |
206.141 |
64.618 |
270.759 |
| 45-49 |
18.653 |
13.989 |
32.642 |
152.440 |
43.079 |
195.519 |
| 50-54 |
9.879 |
8.315 |
18.194 |
100.320 |
21.829 |
122.149 |
| 55-59 |
5.415 |
4.227 |
9.642 |
60.968 |
10.189 |
71.157 |
| 60-64 |
2.756 |
2.453 |
5.209 |
28.510 |
4.499 |
33.009 |
| >65 |
4.110 |
1.681 |
5.791 |
18.305 |
2.635 |
20.940 |
| TOTAL |
208.524 |
178.560 |
387.084 |
1.410.722 |
453.469 |
1.864.191 |
Source: PACI
ANNEXED NOTE
1. Characteristics of data and definitions
The source of data used here is the Public Authority for Civil Information (PACI), an independant government body in charge of :
1- centralising all population and labour force data in order to manage a fully computerised population register
2- issuing mandatory civil identification cards to every resident of the country, regardless of age and nationality.
The other source of demographic and socioeconomic data on Kuwait is the Central Statistical Office (CSO), operating within the Planning Ministry. The CSO has conducted ten population and housing censuses since its inception in 1957.
Since 1995 a marked discrepancy was witnessed between PACI’ and CSO’ population figures. PACI’ database is connected electronically with other administrations and bodies registering demographic events and professional/ residency issues (births and death; departures and arrivals; end of service, residency and ID deliveries, etc.).
PACI’s records of residents’ movements is thus regularly updated, which limits the risk of population overcount. Therefore, it is more likely that residents were undercounted during CSO- Ministry of Planning’s census operations (see: Shah, N. Population of Kuwait. Structure and Dynamics, Kuwait: Kuwait University Academic Publication Council, 2010, chapter 1).
(a) Kuwaiti: the Kuwaiti nationality rests upon a document of Kuwaiti nationality or a certificate proving Kuwaiti nationality issued by the Ministry of Interior of Kuwait.
(b) Non-Kuwaiti: his/ her nationality is determined by the name of the State having issued the passport. The foreign national also entered Kuwait legally and has a stamp of residence.
This category includes the Bidoon, a category of stateless persons living in the Emirate. Kuwait’s Bidoon population originates from three broad categories:
1) those whose ancestors failed to apply for nationality or lacked necessary documentation at the time of Kuwait’s independence in 1961;
2) those recruited to work in Kuwait’s army or police force during the 1960s who permanently settled in Kuwait, along with their families;
3) children of Kuwaiti mothers and stateless or foreign fathers (see Human Rights Watch. Prisoners of the Past. Kuwaiti Bidun and the Burden of Statelessness, June 2011, p. 3).
(c) Population in the labour force: population aged 15 years and above, included in the labour market, either employed (in the government or private sector, as itinerant worker, employed in the domestic sector), or unemployed.
Note: figures of expatriates differ slightly between PACI’s various sources of data (database; tabulated data).
2. Institution which provides data
The Public Authority for Civil Information (PACI)
3. Period of data coverage: December 31st, 2012
The database is updated three times a year and the website presents only the most recent data.
4. Data availability
The statistics section of PACI’s website (http://www.paci.gov.kw/en/ (English); http://www.paci.gov.kw/ (Arabic)) provides population and socio-economic data broken down by nationality (Kuwaiti/ non-Kuwaiti). Some data are displayed by nationality groups.
Analytical tables and data crosstabulations are available for download in PDF, html, .png and Excel (.csv) formats.
Date of access: June 2013.
| |
Kuwaitis |
Non-Kuwaitis |
Total |
|
males |
females |
total |
males |
females |
total |
males |
females |
total |
| Illiterate |
457 |
1.230 |
1.687 |
69.719 |
24.255 |
93.974 |
70.176 |
25.485 |
95.661 |
| Reads and writes |
959 |
621 |
1.580 |
487.088 |
193.546 |
680.634 |
488.047 |
194.167 |
682.214 |
| Elementary |
24.820 |
9.665 |
34.485 |
73.365 |
16.767 |
90.132 |
98.185 |
26.432 |
124.617 |
| Intermediate |
63.215 |
31.426 |
94.641 |
329.838 |
107.226 |
437.064 |
393.053 |
138.652 |
531.705 |
| High school diploma |
59.043 |
44.204 |
103.247 |
153.989 |
42.112 |
196.101 |
213.032 |
86.316 |
299.348 |
| Diploma |
25.432 |
34.225 |
59.657 |
37.142 |
12.124 |
49.266 |
62.574 |
46.349 |
108.923 |
| University degree |
27.229 |
50.870 |
78.099 |
71.778 |
25.359 |
97.137 |
99.007 |
76.229 |
175.236 |
| Postgraduate |
2.298 |
984 |
3.282 |
3.829 |
948 |
4.777 |
6.127 |
1.932 |
8.059 |
| NA |
5.071 |
5.335 |
10.406 |
183.974 |
31.132 |
215.106 |
189.045 |
36.467 |
225.512 |
| Total |
208.524 |
178.560 |
387.084 |
1.410.722 |
453.469 |
1.864.191 |
1.619.246 |
632.029 |
2.251.275 |
Source: PACI
ANNEXED NOTE
1. Characteristics of data and definitions
The source of data used here is the Public Authority for Civil Information (PACI), an independant government body in charge of :
1- centralising all population and labour force data in order to manage a fully computerised population register
2- issuing mandatory civil identification cards to every resident of the country, regardless of age and nationality.
The other source of demographic and socioeconomic data on Kuwait is the Central Statistical Office (CSO), operating within the Planning Ministry. The CSO has conducted ten population and housing censuses since its inception in 1957.
Since 1995 a marked discrepancy was witnessed between PACI’ and CSO’ population figures. PACI’ database is connected electronically with other administrations and bodies registering demographic events and professional/ residency issues (births and death; departures and arrivals; end of service, residency and ID deliveries, etc.).
PACI’s records of residents’ movements is thus regularly updated, which limits the risk of population overcount. Therefore, it is more likely that residents were undercounted during CSO- Ministry of Planning’s census operations (see: Shah, N. Population of Kuwait. Structure and Dynamics, Kuwait: Kuwait University Academic Publication Council, 2010, chapter 1).
(a) Kuwaiti: the Kuwaiti nationality rests upon a document of Kuwaiti nationality or a certificate proving Kuwaiti nationality issued by the Ministry of Interior of Kuwait.
(b) Non-Kuwaiti: his/ her nationality is determined by the name of the State having issued the passport. The foreign national also entered Kuwait legally and has a stamp of residence.
This category includes the Bidoon, a category of stateless persons living in the Emirate. Kuwait’s Bidoon population originates from three broad categories:
1) those whose ancestors failed to apply for nationality or lacked necessary documentation at the time of Kuwait’s independence in 1961;
2) those recruited to work in Kuwait’s army or police force during the 1960s who permanently settled in Kuwait, along with their families;
3) children of Kuwaiti mothers and stateless or foreign fathers (see Human Rights Watch. Prisoners of the Past. Kuwaiti Bidun and the Burden of Statelessness, June 2011, p. 3).
(c) Population in the labour force: population aged 15 years and above, included in the labour market, either employed (in the government or private sector, as itinerant worker, employed in the domestic sector), or unemployed.
Note: figures of expatriates differ slightly between PACI’s various sources of data (database; tabulated data).
3. Period of data coverage: December 31st, 2012
The database is updated three times a year and the website presents only the most recent data.
4. Data availability
The statistics section of PACI’s website (http://www.paci.gov.kw/en/ (English); http://www.paci.gov.kw/ (Arabic)) provides population and socio-economic data broken down by nationality (Kuwaiti/ non-Kuwaiti). Some data are displayed by nationality groups.
Analytical tables and data crosstabulations are available for download in PDF, html, .png and Excel (.csv) formats.
Date of access: June 2013.
| |
|
2008/2009 |
|
|
2009/2010 |
|
|
2010/2011 |
|
| |
Males |
Females |
Total |
Males |
Females |
Total |
Males |
Females |
Total |
| Saudi Arabia |
3 |
0 |
3 |
2 |
0 |
2 |
3 |
0 |
3 |
| United Arab Emirates |
0 |
0 |
0 |
0 |
0 |
0 |
1 |
0 |
1 |
| Egypt |
0 |
0 |
0 |
0 |
0 |
0 |
2 |
2 |
4 |
| Jordan |
0 |
0 |
0 |
0 |
0 |
0 |
1 |
1 |
2 |
| Lebanon |
0 |
0 |
0 |
0 |
0 |
0 |
1 |
1 |
2 |
| Malaysia |
0 |
0 |
0 |
0 |
0 |
0 |
2 |
0 |
2 |
| Singapore |
0 |
0 |
0 |
1 |
0 |
1 |
0 |
0 |
0 |
| United Kingdom |
23 |
13 |
36 |
39 |
29 |
68 |
66 |
49 |
115 |
| France |
5 |
0 |
5 |
2 |
0 |
2 |
6 |
0 |
6 |
| Germany |
0 |
0 |
0 |
0 |
0 |
0 |
2 |
1 |
3 |
| Italy |
0 |
0 |
0 |
0 |
0 |
0 |
1 |
0 |
1 |
| Ireland |
0 |
0 |
0 |
0 |
0 |
0 |
1 |
1 |
2 |
| Spain |
0 |
0 |
0 |
0 |
1 |
1 |
0 |
0 |
0 |
| Japan |
0 |
0 |
0 |
1 |
0 |
1 |
0 |
0 |
0 |
| United States |
36 |
9 |
45 |
67 |
11 |
78 |
34 |
6 |
40 |
| Canada |
1 |
1 |
2 |
0 |
0 |
0 |
3 |
2 |
5 |
| Australia |
4 |
0 |
4 |
0 |
1 |
1 |
3 |
0 |
3 |
| Other |
1 |
0 |
1 |
1 |
0 |
1 |
2 |
0 |
2 |
| TOTAL |
73 |
23 |
96 |
113 |
42 |
155 |
128 |
63 |
191 |
Source: Qatar Foundation, Supreme Council for Education, Universities
ANNEXED NOTE
Students on scholarship are sponsored by the State of Qatar or by another body. The figures presented here do not take into account Qatar students abroad, living on their own expense, if any.
Institution which provides data
Qatar Statistics Authority
Data availability
These data on education have been found in the “Education” chapter of 2012’s Statistical Yearbook.
https://www.mdps.gov.qa/en/statistics1/pages/topicslisting.aspx?parent=General&child=StatisticalAbstract
QSA publishes Statistical Yearbooks available online, in Excel (certain thematic chapters since 2010) and PDF format, up to 1980’s issue. However, recently they seem not to be published yearly as a complete volume and thematic chapters are published separately.
Issues 1980 to 2009 are available on the Qatar Information Exchange website, accessible from QSA’ website (English and Arabic website)
http://www.qix.gov.qa/portal/page/portal/QIXPOC/Documents/QIX%20Knowledge%20Base/Publication/General%20Statistics/Annual%20Abstract
Last date of access: June 27th, 2013.
| |
Saudis |
Non-Saudis |
TOTAL |
| Economic activity |
2007 |
2012 |
2007 |
2012 |
2007 |
2012 |
| Agriculture, hunting, forestry and fishing |
110,641 |
160,165 |
253,540 |
282,180 |
364,181 |
442,345 |
| Mining and quarrying |
90,727 |
88,641 |
12,079 |
14,930 |
102,806 |
103,571 |
| Manufacturing |
125,522 |
134,019 |
440,250 |
576,760 |
565,772 |
710,779 |
| Electricity, gas and water supply |
50,554 |
57,711 |
23,828 |
38,310 |
74,382 |
96,021 |
| Construction |
77,375 |
112,701 |
716,213 |
1,357,844 |
793,588 |
1,470,545 |
| Wholesale and retail trade; repair of motor vehicles, |
255,505 |
293,847 |
994,766 |
1,403,916 |
1,250,271 |
1,697,763 |
| motorcycles and personal and household goods |
|
|
|
|
|
|
| Hotels and restaurants |
21,402 |
23,616 |
227,299 |
273,397 |
248,701 |
297,013 |
| Transport, storage and communications |
208,116 |
195,718 |
135,434 |
238,005 |
343,550 |
433,723 |
| Financial intermediation |
68,333 |
74,023 |
15,454 |
27,012 |
83,787 |
101,035 |
| Real estate, renting and business activities |
111,305 |
137,508 |
138,941 |
210,626 |
250,246 |
348,134 |
| Public administration and defence; compulsory social security |
1,364,456 |
1,602,808 |
35,638 |
39,995 |
1,400,094 |
1,642,803 |
| Education |
830,799 |
1,049,574 |
98,399 |
132,337 |
929,198 |
1,181,911 |
| Health and social work |
200,240 |
262,223 |
135,678 |
222,622 |
335,918 |
484,845 |
| Other community, social and personal service activities |
60,497 |
55,182 |
115,380 |
107,021 |
175,877 |
162,203 |
| Activities of private households as employers and undifferentiated … |
8,088 |
2,275 |
830,039 |
951,341 |
838,127 |
953,616 |
| Extraterritorial organizations and bodies |
1,191 |
1,712 |
8,659 |
8,374 |
9,850 |
10,086 |
| Total |
3,584,751 |
4,251,723 |
4,181,597 |
5,884,670 |
7,766,348 |
10,136,393 |
Source: Manpower Surveys 2007 and 2012 (Rounds 1).
ANNEXED NOTE
1. Technical Notes and Definitions
Sampling frame of LFS 2007 and 2012 (Rounds 1): Population Census 2004 and 2010.
Sample size: 23 000 and 29 000 households respectively
Reference period: February 19th-March 20th, 2007 and January 25th-February 17th, 2012
Population of reference: all individuals (nationals and non-nationals) residing in the Kingdom during the period of reference.
The ultimate sampling unit is the household.
(a) Household and household members: A person or group of persons, related or not related, who share housing and food.
Servants, drivers and similar categories are considered to be part of the household if they live in the same housing unit.
(b) Employed person: A person aged 15 years and above who worked during the reference week for at least one hour for pay or profit, or who had a job but were temporarily absent from work.
Employment refers to people who during the reference period:
– worked for one hour or more for wage or salary, in cash or in kind
– worked for one hour or more for profit or family gain, in cash or in kind
– worked for at least 15 hours without pay on a family business or farm
– did volunteer work
Reference period for employment: The seven days preceding the interview date.
Classification used for economic activity is ISIC 3.1
2. Institution which provides data
Central Department of Statistics and Information (CDSI), Ministry and Economy and Planning
3. Data availability
Surveys conducted since 1999 are available on the website of the CDSI (http://www.cdsi.gov.sa/), in published form in PDF format. A selection of tables is also available in PDF or Excel format.
https://www.stats.gov.sa/en/814 (website English version) or https://www.stats.gov.sa/ar/814 (website Arabic version). The technical notes and tables of contents are in Arabic and the tables are in both languages.
Date of access: May 2013.
Since 2007, Statistical Yearbooks have introduced a section on “Labour Statistics”, which presents a selection of tables from Manpower Surveys.
https://www.stats.gov.sa/en/46
Date of access: May 2013.
| Year |
|
|
2006 |
|
|
2009 |
|
|
|
Government |
Private |
Total |
Government |
Private |
Total |
|
|
sector |
sector |
|
sector |
sector |
|
|
males |
2,074,265 |
863,031 |
2,937,296 |
2,235,942 |
1,096,686 |
3,332,628 |
| Saudis |
females |
424,461 |
69,818 |
494,279 |
424,579 |
80,761 |
505,340 |
| |
total |
2,498,726 |
932,849 |
3,431,575 |
2,660,521 |
1,177,447 |
3,837,968 |
| |
males |
189,337 |
2,263,602 |
2,452,939 |
115,724 |
3,621,086 |
3,736,810 |
| Non-Saudis |
females |
36,308 |
460,769 |
497,077 |
19,967 |
553,247 |
573,214 |
| |
total |
225,645 |
2,724,371 |
2,950,016 |
135,691 |
4,174,333 |
4,310,024 |
| |
males |
2,263,602 |
3,126,633 |
5,390,235 |
2,351,666 |
4,717,772 |
7,069,438 |
| Total |
females |
460,769 |
530,587 |
991,356 |
444,546 |
634,008 |
1,078,554 |
| |
total |
2,724,371 |
3,657,220 |
6,381,591 |
2,796,212 |
5,351,780 |
8,147,992 |
Source: Labour Force Surveys, given dates.
1. Technical Notes and Definitions
Sampling frame of 2006 and 2009 Labour Force Surveys: Population Census 2004.
Sample size: 23 000 households
Reference period: May 2006; July 24th-August 22nd, 2009
Population of reference: all individuals (nationals and non-nationals) residing in the Kingdom during the period of reference.
The ultimate sampling unit is the household.
(a) Household and household members: A person or group of persons, related or not related, who share housing and food.
Servants, drivers and similar categories are considered to be part of the household if they live in the same housing unit.
(b) Employed person: A person aged 15 years and above who worked during the reference week for at least one hour for pay or profit, or who had a job but were temporarily absent from work.
Employment refers to people who during the reference period:
– worked for one hour or more for wage or salary, in cash or in kind
– worked for one hour or more for profit or family gain, in cash or in kind
– worked for at least 15 hours without pay on a family business or farm
– did volunteer work
Reference period for employment: The seven days preceding the interview date.
(c) Government and private sector: No definitions available.
2. Institution which provides data
Central Department of Statistics and Information (CDSI), Ministry and Economy and Planning
3. Data availability
Data of employment by sector and nationality are not published in CDSI Labour Force Surveys volumes.
However, they are made available for the years 2006 to 2009 by the Statistical section of the Gulf Cooperation Council’s General Secretariat (Statistics of the GCC Countries for 2010, Population and Labour Force, tab. 6).
http://sites.gcc-sg.org/Statistics/index.php?SID=226
Date of access: May 22nd, 2013.
| |
|
|
Specialists in Scientific, |
Technicians in Scientific, |
|
|
|
Agriculture, |
Industrial, |
|
|
| |
|
Managers and |
Technical and |
Technical and |
Clerical Workers |
Sales |
Service |
Animal Husbandry |
Chemical |
Engineering |
TOTAL |
| |
Year |
Business Managers |
Humanities Fields |
Humanities Fields |
|
Persons |
Persons |
and Fishing |
and Food Industries |
Support |
|
| |
2006 |
222,692 |
312,151 |
651,274 |
444,248 |
189,522 |
1,252,678 |
92,634 |
39,549 |
226,826 |
3,431,574 |
| |
2007 R1 |
263,244 |
315,085 |
705,746 |
483,319 |
200,089 |
1,222,257 |
124,062 |
31,304 |
239,647 |
3,584,753 |
| SAUDIS |
2008 R1 |
263,810 |
332,250 |
692,838 |
505,918 |
189,461 |
1,327,051 |
95,253 |
33,753 |
238,266 |
3,678,600 |
| |
2009 |
246,640 |
347,732 |
704,855 |
571,944 |
234,721 |
1,345,867 |
103,903 |
37,697 |
244,609 |
3,837,968 |
| |
2011 |
245,819 |
438,597 |
854,588 |
579,075 |
216,414 |
1,362,707 |
176,188 |
27,638 |
242,045 |
4,143,071 |
| |
2012 R1 |
243,308 |
466,838 |
889,580 |
608,651 |
208,973 |
1,427,740 |
168,289 |
30,927 |
207,417 |
4,251,723 |
| |
2006 |
48,030 |
277,567 |
194,899 |
103,001 |
508,706 |
1,154,026 |
225,569 |
143,894 |
1,435,726 |
4,091,418 |
| |
2007 R1 |
72,308 |
298,857 |
178,625 |
94,956 |
513,706 |
1,185,231 |
269,013 |
172,321 |
1,396,572 |
4,181,589 |
| NON-SAUDIS |
2008 R1 |
72,445 |
332,676 |
176,613 |
102,394 |
579,387 |
1,232,552 |
267,782 |
154,773 |
1,359,610 |
4,278,232 |
| |
2009 |
78,641 |
307,027 |
183,910 |
121,670 |
597,762 |
1,141,424 |
235,693 |
160,228 |
1,483,669 |
4,310,024 |
| |
2011 |
106,823 |
524,541 |
302,325 |
134,664 |
743,770 |
1,427,226 |
262,976 |
174,515 |
2,115,623 |
5,792,463 |
| |
2012 R1 |
102,888 |
627,182 |
292,498 |
128,110 |
707,574 |
1,399,758 |
273,644 |
157,607 |
2,195,409 |
5,884,670 |
R= round
Source: Labour Force Surveys, given dates and rounds.
ANNEXED NOTE
1. Technical Notes and Definitions
| Manpower |
Sampling |
Sample size |
|
| Surveys |
frame |
(households) |
Reference period |
| 2006 |
Population |
23,000 |
May 2006 |
| 2007 R1 |
Census |
23,000 |
February 19th-March 20th, 2007 |
| 2008 R1 |
2004 |
23,000 |
February 2008 |
| 2009 |
|
23,000 |
July 24th-August 22nd, 2009 |
| 2011 |
Population |
29,000 |
October 2011 |
| 2012 R1 |
Census 2010 |
29,000 |
January 25th-February 17th, 2012 |
Population of reference: all individuals (nationals and non-nationals) residing in the Kingdom during the period of reference.
The ultimate sampling unit is the household.
(a) Household and household members: A person or group of persons, related or not related, who share housing and food.
Servants, drivers and similar categories are considered to be part of the household if they live in the same housing unit.
(b) Employed person: A person aged 15 years and above who worked during the reference week for at least one hour for pay or profit, or who had a job but were temporarily absent from work.
Employment refers to people who during the reference period:
– worked for one hour or more for wage or salary, in cash or in kind
– worked for one hour or more for profit or family gain, in cash or in kind
– worked for at least 15 hours without pay on a family business or farm
– did volunteer work
Reference period for employment: The seven days preceding the interview date.
Classification used for occupations is adapted from ISCO 1988.
2. Institution which provides data
Central Department of Statistics and Information (CDSI), Ministry and Economy and Planning
3. Data availability
Surveys conducted since 1999 are available on the website of the CDSI (http://www.cdsi.gov.sa/), in published form in PDF format. A selection of tables is also available in PDF or Excel format.
https://www.stats.gov.sa/en/814 (website English version) or https://www.stats.gov.sa/ar/814 (website Arabic version). The technical notes and tables of contents are in Arabic and the tables are in both languages.
Date of access: May 2013.
Since 2007, Statistical Yearbooks have introduced a section on “Labour Statistics”, which presents a selection of tables from Manpower Surveys.
https://www.stats.gov.sa/en/46
Date of access: May 2013.
| Citizenship |
|
Saudis |
|
|
Non-Saudis |
|
|
TOTAL |
|
| years |
Male |
Female |
Total |
Male |
Female |
Total |
Male |
Female |
Total |
| 1999 |
2,247,720 |
347,370 |
2,595,090 |
2,552,901 |
444,863 |
2,997,764 |
4,800,621 |
792,233 |
5,592,854 |
| 2000 |
2,352,092 |
351,279 |
2,703,371 |
2,591,426 |
418,548 |
3,009,974 |
4,943,518 |
769,827 |
5,713,345 |
| 2001 |
2,413,780 |
363,193 |
2,776,973 |
2,613,943 |
417,699 |
3,031,642 |
5,027,723 |
780,892 |
5,808,615 |
| 2002 |
2,480,225 |
364,366 |
2,844,591 |
2,635,599 |
432,817 |
3,068,416 |
5,115,824 |
797,183 |
5,913,007 |
| 2006 |
2,937,295 |
494,279 |
3,431,574 |
3,524,194 |
567,218 |
4,091,412 |
6,461,489 |
1,061,497 |
7,522,986 |
| 2007 R1 |
3,082,301 |
502,456 |
3,584,757 |
3,581,716 |
599,868 |
4,181,584 |
6,664,017 |
1,102,324 |
7,766,341 |
| 2007 R2 |
3,096,972 |
503,879 |
3,600,851 |
3,598,598 |
545,002 |
4,143,600 |
6,695,570 |
1,048,881 |
7,744,451 |
| 2008 R1 |
3,185,417 |
493,183 |
3,678,600 |
3,651,823 |
626,409 |
4,278,232 |
6,837,240 |
1,119,592 |
7,956,832 |
| 2008 R2 |
3,274,356 |
482,313 |
3,756,669 |
3,677,482 |
583,149 |
4,260,631 |
6,951,838 |
1,065,462 |
8,017,300 |
| 2009 |
3,332,628 |
505,340 |
3,837,968 |
3,736,810 |
573,214 |
4,310,024 |
7,069,438 |
1,078,554 |
8,147,992 |
| 2011 |
3,538,669 |
604,402 |
4,143,071 |
5,094,771 |
697,692 |
5,792,463 |
8,633,440 |
1,302,094 |
9,935,534 |
| 2012 R1 |
3,632,143 |
619,580 |
4,251,723 |
5,186,605 |
698,065 |
5,884,670 |
8,818,748 |
1,317,645 |
10,136,393 |
| 2012 R2 |
3,750,781 |
646,590 |
4,397,371 |
5,310,039 |
682,914 |
5,992,953 |
9,060,820 |
1,329,504 |
10,390,324 |
| 2013 R1 |
3,951,255 |
679,862 |
4,631,117 |
5,362,127 |
641,489 |
6,003,616 |
9,313,382 |
1,321,351 |
10,634,733 |
R= Round
source: Labour Force Surveys (1999 to 2002; 2006 to 2009; 2011 to 2013 R1)
ANNEXED NOTE
1. Technical Notes and Definitions
|
sampling |
sample size |
|
|
frame |
(households) |
reference period |
| 1999 |
Population Census1992 |
15,000 |
April 16th-May 16th, 1999 |
| 2000 |
15,000 |
April 2000 |
| 2001 |
15,000 |
March 2001 |
| 2002 |
15,000 |
April 2002 |
| 2006 |
Population Census2004 |
23,000 |
May 2006 |
| 2007 R1 |
23,000 |
February 19th-March 20th, 2007 |
| 2007 R2 |
23,000 |
August 15th-September 13th, 2007 |
| 2008 R1 |
23,000 |
February 2008 |
| 2008 R2 |
23,000 |
August 2008 |
| 2009 |
23,000 |
July 24th-August 22nd, 2009 |
| 2011 |
Population Census2010 |
29,000 |
October 2011 |
| 2012 R1 |
29,000 |
January 25th-February 17th, 2012 |
| 2012 R2 |
|
|
| 2013 R1 |
33,500 |
January 13th-February 5th, 2013 |
Population of reference: all individuals (nationals and non-nationals) residing in the Kingdom during the period of reference.
The ultimate sampling unit is the household.
(a) Household and household members: A person or group of persons, related or not related, who share housing and food.
Servants, drivers and similar categories are considered to be part of the household if they live in the same housing unit.
(b) Employed person: A person aged 15 years and above who worked during the reference week for at least one hour for pay or profit, or who had a job but were temporarily absent from work.
Employment refers to people who during the reference period:
– worked for one hour or more for wage or salary, in cash or in kind
– worked for one hour or more for profit or family gain, in cash or in kind
– worked for at least 15 hours without pay on a family business or farm
– did volunteer work
Reference period for employment: The seven days preceding the interview date.
2. Institution which provides data
Central Department of Statistics and Information (CDSI), Ministry and Economy and Planning
3. Data availability
Surveys conducted since 1999 are available on the website of the CDSI, in published form in PDF format. A selection of tables is also available in PDF or Excel format.
https://www.stats.gov.sa/en/814
https://www.stats.gov.sa/ar/814
The technical notes and tables of contents are in Arabic and the tables are in both languages.
Date of access: May 2013.
Since 2007, Statistical Yearbooks have introduced a section on “Labour Statistics”, which presents a selection of tables from Manpower Surveys.
https://www.stats.gov.sa/en/46
Date of access: May 2013.
| Economic activity |
|
Qataris |
Non-Qataris |
TOTAL EMPLOYED POPULATION |
| |
Males |
44 |
17,026 |
17,070 |
| 01-03 Agriculture and fishing |
Females |
2 |
44 |
46 |
| |
Total |
46 |
17,070 |
17,116 |
| |
Males |
4,356 |
79,160 |
83,516 |
| 05-09 Mining and quarrying |
Females |
705 |
1,494 |
2,199 |
| |
Total |
5,061 |
80,654 |
85,715 |
| |
Males |
722 |
99,321 |
100,043 |
| 10-33 Manufacturing |
Females |
56 |
550 |
606 |
| |
Total |
778 |
99,871 |
100,649 |
| |
Males |
1,410 |
3,265 |
4,675 |
| 35-39 Electricity, gas, water supply and waste management |
Females |
239 |
45 |
284 |
| |
Total |
1,649 |
3,310 |
4,959 |
| |
Males |
533 |
503,113 |
503,646 |
| 41-43 Construction |
Females |
74 |
2,608 |
2,682 |
| |
Total |
607 |
505,721 |
506,328 |
| |
Males |
1,507 |
135,646 |
137,153 |
| 45-47 Wholesale and retail trade; repair of motor vehicles |
Females |
352 |
5,294 |
5,646 |
| |
Total |
1,859 |
140,940 |
142,799 |
| |
Males |
525 |
29,204 |
29,729 |
| 49-53 Transportation and storage |
Females |
169 |
4,045 |
4,214 |
| |
Total |
694 |
33,249 |
33,943 |
| |
Males |
34 |
26,152 |
26,186 |
| 55-56 Accommodation and food service activities |
Females |
10 |
2,809 |
2,819 |
| |
Total |
44 |
28,961 |
29,005 |
| |
Males |
1,602 |
5,808 |
7,410 |
| 58-63 Information and communication |
Females |
635 |
1,069 |
1,704 |
| |
Total |
2,237 |
6,877 |
9,114 |
| |
Males |
1,187 |
6,351 |
7,538 |
| 64-66 Financial and insurance activities |
Females |
1,265 |
1,560 |
2,825 |
| |
Total |
2,452 |
7,911 |
10,363 |
| |
Males |
351 |
7,816 |
8,167 |
| 68 Real estate activities |
Females |
143 |
316 |
459 |
| |
Total |
494 |
8,132 |
8,626 |
| |
Males |
218 |
18,928 |
19,146 |
| 69-75 Professional, scientific and technical activities |
Females |
93 |
1,139 |
1,232 |
| |
Total |
311 |
20,067 |
20,378 |
| |
Males |
310 |
36,431 |
36,741 |
| 77-82 Administrative and support service activities |
Females |
76 |
2,364 |
2,440 |
| |
Total |
386 |
38,795 |
39,181 |
| |
Males |
29,884 |
28,484 |
58,368 |
| 84 Public administration and defence |
Females |
11,960 |
1,640 |
13,600 |
| |
Total |
41,844 |
30,124 |
71,968 |
| |
Males |
1,623 |
8,944 |
10,567 |
| 85 Education |
Females |
6,540 |
9,227 |
15,767 |
| |
Total |
8,163 |
18,171 |
26,334 |
| |
Males |
1,124 |
7,573 |
8,697 |
| 86-88 Human health and social work activities |
Females |
2,252 |
7,997 |
10,249 |
| |
Total |
3,376 |
15,570 |
18,946 |
| |
Males |
636 |
3,897 |
4,533 |
| 90-93 Arts, entertainment and recreation |
Females |
246 |
453 |
699 |
| |
Total |
882 |
4,350 |
5,232 |
| |
Males |
37 |
4,262 |
4,299 |
| 94-96 Other service activities |
Females |
77 |
1,045 |
1,122 |
| |
Total |
114 |
5,307 |
5,421 |
| |
Males |
55 |
48,237 |
48,292 |
| 97-98 Activities of households as employers |
Females |
5 |
84,164 |
84,169 |
| |
Total |
60 |
132,401 |
132,461 |
| |
Males |
10 |
1,355 |
1,365 |
| 99 Activities of extraterritorial organizations and bodies |
Females |
9 |
271 |
280 |
| |
Total |
19 |
1,626 |
1,645 |
| |
Males |
46,168 |
1,070,973 |
1,117,141 |
| TOTAL |
Females |
24,908 |
128,134 |
153,042 |
| |
Total |
71,076 |
1,199,107 |
1,270,183 |
Source: census 2010, QSA
ANNEXED NOTE
1. Technical Notes and Definitions
Reference period for census 2010: the night of April 21st, 2010.
Implementation method: census is based on de jure method; i.e. registering people according to their usual place of residence at time of census.
Populations in transit or visiting Qatar as tourists, as well as residents of public housing or visitors staying in a household for less than two months after night of reference were excluded.
Populations away from usual residence in Qatar for reasons of duty, or on a visit abroad for less than two months, as well as individuals with no personal housing within Qatar staying with a household for more than two months, are counted in their usual/ present residence during census night.
Population of reference: all individuals (nationals and non-nationals) present within the State’s borders during time of reference, including in labour camps.
Data related to work force include individuals of 15 years old or more (born before April 1995) and refer to the week preceding the enumeration period.
The employed population here also includes paid trainees.
Employed: The person (15 years or older) engaged in work or who works for profit, whether for his own account, for wages or for a family without being paid, during the week ending on 20/04/2010 provided that working hours should not be less than one hour during that week, and the sick, regular or other temporary leave should not be counted in the absence days.
Trainee getting a salary: The person (15 years or older) who joins any of the training institutes, whether morning or evening study, and gets a salary during the training period
Economic activities are categorised according to ISIC( Rev. 4) international classification of industries.
2. Institution which provides data
Qatar Statistics Authority (QSA)
(http://www.qsa.gov.qa/eng/index.htm for website in English; http://www.qsa.gov.qa/Ar/index.htm for website in Arabic)
3. Data availability
None of Qatar censuses or other sources have ever disclosed figures of total population broken down by country of citizenship or even by nationality (Qatari/non-Qatari).
For 2010 data have been collected but remain withheld. The census only provides detailed data on population 15 years and above by nationality.
Released parts of census are available on the website of the QSA, in published form in PDF format.
https://www.mdps.gov.qa/en/statistics1/pages/topicslisting.aspx?parent=General&child=Census
Census 2010′ website:
https://www.mdps.gov.qa/en/statistics1/pages/topicslisting.aspx?parent=General&child=Census
2010′ census in Excel or PDF format individual tables:
http://www.qsa.gov.qa/QatarCensus/Census_Results.aspx
Date of access: June 2013.
| |
|
Qataris |
|
|
Non-Qataris |
|
|
TOTAL |
|
| Activity sector |
Males |
Females |
Total |
Males |
Females |
Total |
Males |
Females |
Total |
| Household |
55 |
5 |
60 |
48,237 |
84,164 |
132,401 |
48,292 |
84,169 |
132,461 |
Diplomatic
/Non-Profit |
38 |
46 |
84 |
1,696 |
352 |
2,048 |
1,734 |
398 |
2,132 |
| Private |
3,746 |
1,815 |
5,561 |
922,909 |
23,759 |
946,668 |
926,655 |
25,574 |
952,229 |
| Mixed |
3,033 |
975 |
4,008 |
34,316 |
5,115 |
39,431 |
37,349 |
6,090 |
43,439 |
| Governement est./ company |
6,559 |
2,845 |
9,404 |
25,765 |
7,682 |
33,447 |
32,324 |
10,527 |
42,851 |
| Government |
32,737 |
19,222 |
51,959 |
38,050 |
7,062 |
45,112 |
70,787 |
26,284 |
97,071 |
| Total |
46,168 |
24,908 |
71,076 |
1,070,973 |
128,134 |
1,199,107 |
1,117,141 |
153,042 |
1,270,183 |
Source: census 2010, QSA
ANNEXED NOTE
1. Technical Notes and Definitions
Reference period for census 2010: the night of April 21st, 2010.
Implementation method: census is based on de jure method; i.e. registering people according to their usual place of residence at time of census.
Populations in transit or visiting Qatar as tourists, as well as residents of public housing or visitors staying in a household for less than two months after night of reference were excluded.
Populations away from usual residence in Qatar for reasons of duty, or on a visit abroad for less than two months, as well as individuals with no personal housing within Qatar staying with a household for more than two months, are counted in their usual/ present residence during census night.
Population of reference: all individuals (nationals and non-nationals) present within the State’s borders during time of reference, including in labour camps.
The employed population here also includes paid trainees.
Employed: The person (15 years or older) engaged in work or who works for profit, whether for his own account, for wages or for a family without being paid, during the week ending on 20/04/2010 provided that working hours should not be less than one hour during that week, and the sick, regular or other temporary leave should not be counted in the absence days.
Trainee getting a salary: The person (15 years or older) who joins any of the training institutes, whether morning or evening study, and gets a salary during the training period
Public/Governmental Establishment: Included are the establishments practicing a productive activity and the State owns its capital completely such as Qatar Oil, Central Bank of Qatar, etc.).
Mixed (Joint Sector): It is the sector that includes establishments that the government contributes in their capitals together with another entity, whether national or foreign.
Private: Included are the establishments owned by a person or group of persons, whether Qatari or Non-Qatari, natural or legal (excluded are the corporations contributed by the government).
Diplomatic / Regional: The establishments that practice a diplomatic or consulate activity for other countries such as the embassies, consulates, etc. as well as the establishments that follow regional and international organizations.
Non Profit institutions: Included are the establishments that do not aim at profit such as charity associations, etc.
2. Institution which provides data
Qatar Statistics Authority (QSA)
(https://www.mdps.gov.qa/en/Pages/default.aspx for website in English; https://www.mdps.gov.qa/ar/pages/default.aspx for website in Arabic)
3. Data availability
None of Qatar censuses or other sources have ever disclosed figures of total population broken down by country of citizenship or even by nationality (Qatari/non-Qatari).
For 2010 data have been collected but remain withheld. The census only provides detailed data on population 15 years and above by nationality.
Released parts of census are available on the website of the QSA, in published form in PDF format.
https://www.mdps.gov.qa/en/statistics1/pages/topicslisting.aspx?parent=General&child=Census
Census 2010′ website:
https://www.mdps.gov.qa/en/statistics1/pages/topicslisting.aspx?parent=General&child=Census
2010′ census in Excel or PDF format individual tables:
http://www.qsa.gov.qa/QatarCensus/Census_Results.aspx
Date of access: June 2013.
| Occupation group |
|
Qataris |
Non-Qataris |
TOTAL EMPLOYED POPULATION |
| |
|
15-24 |
25-34 |
35-44 |
45-54 |
55-64 |
>65 |
Total |
15-24 |
25-34 |
35-44 |
45-54 |
55-64 |
>65 |
Total |
15-24 |
25-34 |
35-44 |
45-54 |
55-64 |
>65 |
Total |
| |
Males |
180 |
1,059 |
1,780 |
1,639 |
507 |
88 |
5,253 |
413 |
5,473 |
7,065 |
5,281 |
2,452 |
448 |
21,132 |
593 |
6,532 |
8,845 |
6,920 |
2,959 |
536 |
26,385 |
| 1 LEGISLATORS, SENIOR OFFICIALS AND MANAGERS |
Females |
43 |
397 |
314 |
209 |
31 |
4 |
998 |
82 |
903 |
712 |
375 |
116 |
9 |
2,197 |
125 |
1,300 |
1,026 |
584 |
147 |
13 |
3,195 |
| |
Total |
223 |
1,456 |
2,094 |
1,848 |
538 |
92 |
6,251 |
495 |
6,376 |
7,777 |
5,656 |
2,568 |
457 |
23,329 |
718 |
7,832 |
9,871 |
7,504 |
3,106 |
549 |
29,580 |
| |
Males |
444 |
3,191 |
2,832 |
1,131 |
321 |
29 |
7,948 |
3,013 |
27,529 |
24,292 |
14,309 |
5,798 |
828 |
75,769 |
3,457 |
30,720 |
27,124 |
15,440 |
6,119 |
857 |
83,717 |
| 2 PROFESSIONALS |
Females |
662 |
5,602 |
4,717 |
1,177 |
73 |
2 |
12,233 |
931 |
7,708 |
5,529 |
2,630 |
682 |
55 |
17,535 |
1,593 |
13,310 |
10,246 |
3,807 |
755 |
57 |
29,768 |
| |
Total |
1,106 |
8,793 |
7,549 |
2,308 |
394 |
31 |
20,181 |
3,944 |
35,237 |
29,821 |
16,939 |
6,480 |
883 |
93,304 |
5,050 |
44,030 |
37,370 |
19,247 |
6,874 |
914 |
113,485 |
| |
Males |
2,453 |
3,914 |
2,685 |
1,330 |
290 |
37 |
10,709 |
3,672 |
15,548 |
12,107 |
6,155 |
1,993 |
167 |
39,642 |
6,125 |
19,462 |
14,792 |
7,485 |
2,283 |
204 |
50,351 |
| 3 TECHNICIANS AND ASSOCIATE PROFESSIONALS |
Females |
900 |
1,563 |
850 |
251 |
25 |
0 |
3,589 |
336 |
2,656 |
1,606 |
762 |
195 |
4 |
5,559 |
1,236 |
4,219 |
2,456 |
1,013 |
220 |
4 |
9,148 |
| |
Total |
3,353 |
5,477 |
3,535 |
1,581 |
315 |
37 |
14,298 |
4,008 |
18,204 |
13,713 |
6,917 |
2,188 |
171 |
45,201 |
7,361 |
23,681 |
17,248 |
8,498 |
2,503 |
208 |
59,499 |
| |
Males |
3,949 |
5,046 |
2,977 |
1,410 |
308 |
58 |
13,748 |
4,093 |
12,368 |
7,818 |
4,641 |
1,714 |
243 |
30,877 |
8,042 |
17,414 |
10,795 |
6,051 |
2,022 |
301 |
44,625 |
| 4 CLERKS |
Females |
2,161 |
2,569 |
1,708 |
811 |
66 |
3 |
7,318 |
874 |
3,831 |
1,796 |
676 |
126 |
11 |
7,314 |
3,035 |
6,400 |
3,504 |
1,487 |
192 |
14 |
14,632 |
| |
Total |
6,110 |
7,615 |
4,685 |
2,221 |
374 |
61 |
21,066 |
4,967 |
16,199 |
9,614 |
5,317 |
1,840 |
254 |
38,191 |
11,077 |
23,814 |
14,299 |
7,538 |
2,214 |
315 |
59,257 |
| |
Males |
474 |
736 |
432 |
267 |
94 |
97 |
2,100 |
13,201 |
28,720 |
17,733 |
8,184 |
2,006 |
318 |
70,162 |
13,675 |
29,456 |
18,165 |
8,451 |
2,100 |
415 |
72,262 |
| 5 SERVICE WORKERS AND SHOP AND MARKET SALES WORKERS |
Females |
67 |
122 |
140 |
102 |
18 |
9 |
458 |
2,024 |
5,821 |
1,814 |
673 |
137 |
21 |
10,490 |
2,091 |
5,943 |
1,954 |
775 |
155 |
30 |
10,948 |
| |
Total |
541 |
858 |
572 |
369 |
112 |
106 |
2,558 |
15,225 |
34,541 |
19,547 |
8,857 |
2,143 |
339 |
80,652 |
15,766 |
35,399 |
20,119 |
9,226 |
2,255 |
445 |
83,210 |
| |
Males |
2 |
7 |
9 |
7 |
2 |
4 |
31 |
2,237 |
4,316 |
3,049 |
1,580 |
400 |
90 |
11,672 |
2,239 |
4,323 |
3,058 |
1,587 |
402 |
94 |
11,703 |
| 6 SKILLED AGRICULTURAL AND FISHERY WORKERS |
Females |
0 |
0 |
0 |
0 |
0 |
0 |
0 |
0 |
0 |
0 |
1 |
0 |
0 |
1 |
0 |
0 |
0 |
1 |
0 |
0 |
1 |
| |
Total |
2 |
7 |
9 |
7 |
2 |
4 |
31 |
2,237 |
4,316 |
3,049 |
1,581 |
400 |
90 |
11,673 |
2,239 |
4,323 |
3,058 |
1,588 |
402 |
94 |
11,704 |
| |
Males |
157 |
295 |
347 |
229 |
74 |
28 |
1,130 |
63,948 |
194,429 |
153,276 |
50,828 |
7,784 |
665 |
470,930 |
64,105 |
194,724 |
153,623 |
51,057 |
7,858 |
693 |
472,060 |
| 7 CRAFT AND RELATED TRADES WORKERS |
Females |
0 |
0 |
7 |
0 |
1 |
0 |
8 |
10 |
36 |
27 |
17 |
13 |
0 |
103 |
10 |
36 |
34 |
17 |
14 |
0 |
111 |
| |
Total |
157 |
295 |
354 |
229 |
75 |
28 |
1,138 |
63,958 |
194,465 |
153,303 |
50,845 |
7,797 |
665 |
471,033 |
64,115 |
194,760 |
153,657 |
51,074 |
7,872 |
693 |
472,171 |
| |
Males |
206 |
291 |
318 |
212 |
58 |
22 |
1,107 |
15,023 |
50,125 |
39,246 |
27,995 |
8,800 |
629 |
141,818 |
15,229 |
50,416 |
39,564 |
28,207 |
8,858 |
651 |
142,925 |
| 8 PLANT AND MACHINE OPERATORS AND ASSEMBLERS |
Females |
0 |
0 |
0 |
0 |
0 |
0 |
0 |
51 |
170 |
115 |
61 |
8 |
1 |
406 |
51 |
170 |
115 |
61 |
8 |
1 |
406 |
| |
Total |
206 |
291 |
318 |
212 |
58 |
22 |
1,107 |
15,074 |
50,295 |
39,361 |
28,056 |
8,808 |
630 |
142,224 |
15,280 |
50,586 |
39,679 |
28,268 |
8,866 |
652 |
143,331 |
| |
Males |
1,193 |
1,385 |
801 |
548 |
171 |
44 |
4,142 |
39,276 |
77,670 |
64,978 |
22,102 |
4,389 |
556 |
208,971 |
40,469 |
79,055 |
65,779 |
22,650 |
4,560 |
600 |
213,113 |
| 9 ELEMENTARY OCCUPATIONS |
Females |
7 |
34 |
90 |
134 |
38 |
1 |
304 |
10,860 |
42,092 |
21,730 |
8,456 |
1,329 |
62 |
84,529 |
10,867 |
42,126 |
21,820 |
8,590 |
1,367 |
63 |
84,833 |
| |
Total |
1,200 |
1,419 |
891 |
682 |
209 |
45 |
4,446 |
50,136 |
119,762 |
86,708 |
30,558 |
5,718 |
618 |
293,500 |
51,336 |
121,181 |
87,599 |
31,240 |
5,927 |
663 |
297,946 |
| |
Males |
9,058 |
15,924 |
12,181 |
6,773 |
1,825 |
407 |
46,168 |
144,876 |
416,178 |
329,564 |
141,075 |
35,336 |
3,944 |
1,070,973 |
153,934 |
432,102 |
341,745 |
147,848 |
37,161 |
4,351 |
1,117,141 |
| TOTAL |
Females |
3,840 |
10,287 |
7,826 |
2,684 |
252 |
19 |
24,908 |
15,168 |
63,217 |
33,329 |
13,651 |
2,606 |
163 |
128,134 |
19,008 |
73,504 |
41,155 |
16,335 |
2,858 |
182 |
153,042 |
| |
Total |
12,898 |
26,211 |
20,007 |
9,457 |
2,077 |
426 |
71,076 |
160,044 |
479,395 |
362,893 |
154,726 |
37,942 |
4,107 |
1,199,107 |
172,942 |
505,606 |
382,900 |
164,183 |
40,019 |
4,533 |
1,270,183 |
Source: census 2010, QSA
ANNEXED NOTE
1. Technical Notes and Definitions
Reference period for census 2010: the night of April 21st, 2010.
Implementation method: census is based on de jure method; i.e. registering people according to their usual place of residence at time of census.
Populations in transit or visiting Qatar as tourists, as well as residents of public housing or visitors staying in a household for less than two months after night of reference were excluded.
Populations away from usual residence in Qatar for reasons of duty, or on a visit abroad for less than two months, as well as individuals with no personal housing within Qatar staying with a household for more than two months, are counted in their usual/ present residence during census night.
Population of reference: all individuals (nationals and non-nationals) present within the State’s borders during time of reference, including in labour camps.
The employed population here also includes paid trainees.
Employed: The person (15 years or older) engaged in work or who works for profit, whether for his own account, for wages or for a family without being paid, during the week ending on 20/04/2010 provided that working hours should not be less than one hour during that week, and the sick, regular or other temporary leave should not be counted in the absence days.
Trainee getting a salary: The person (15 years or older) who joins any of the training institutes, whether morning or evening study, and gets a salary during the training period
Occupations are categorised according to ISCO 88 international classification of occupations (major (1-digit) group titles).
2. Institution which provides data
Qatar Statistics Authority (QSA)
(http://www.qsa.gov.qa/eng/index.htm for website in English; http://www.qsa.gov.qa/Ar/index.htm for website in Arabic)
3. Data availability
None of Qatar censuses or other sources have ever disclosed figures of total population broken down by country of citizenship or even by nationality (Qatari/non-Qatari).
For 2010 data have been collected but remain withheld. The census only provides detailed data on population 15 years and above by nationality.
Released parts of census are available on the website of the QSA, in published form in PDF format.
https://www.mdps.gov.qa/en/statistics1/pages/topicslisting.aspx?parent=General&child=Census
Census 2010′ website:
https://www.mdps.gov.qa/en/statistics1/pages/topicslisting.aspx?parent=General&child=Census
2010′ census in Excel or PDF format individual tables:
http://www.qsa.gov.qa/QatarCensus/Census_Results.aspx
Date of access: June 2013.
| Occupation group |
|
Qataris |
Non-Qataris |
Total |
| |
Males |
5,253 |
21,132 |
26,385 |
| 1 LEGISLATORS, SENIOR OFFICIALS AND MANAGERS |
Females |
998 |
2,197 |
3,195 |
| |
Total |
6,251 |
23,329 |
29,580 |
| |
Males |
7,948 |
75,769 |
83,717 |
| 2 PROFESSIONALS |
Females |
12,233 |
17,535 |
29,768 |
| |
Total |
20,181 |
93,304 |
113,485 |
| |
Males |
10,709 |
39,642 |
50,351 |
| 3 TECHNICIANS AND ASSOCIATE PROFESSIONALS |
Females |
3,589 |
5,559 |
9,148 |
| |
Total |
14,298 |
45,201 |
59,499 |
| |
Males |
13,748 |
30,877 |
44,625 |
| 4 CLERKS |
Females |
7,318 |
7,314 |
14,632 |
| |
Total |
21,066 |
38,191 |
59,257 |
| |
Males |
2,100 |
70,162 |
72,262 |
| 5 SERVICE WORKERS AND SHOP AND MARKET SALES WORKERS |
Females |
458 |
10,490 |
10,948 |
| |
Total |
2,558 |
80,652 |
83,210 |
| |
Males |
31 |
11,672 |
11,703 |
| 6 SKILLED AGRICULTURAL AND FISHERY WORKERS |
Females |
0 |
1 |
1 |
| |
Total |
31 |
11,673 |
11,704 |
| |
Males |
1,130 |
470,930 |
472,060 |
| 7 CRAFT AND RELATED TRADES WORKERS |
Females |
8 |
103 |
111 |
| |
Total |
1,138 |
471,033 |
472,171 |
| |
Males |
1,107 |
141,818 |
142,925 |
| 8 PLANT AND MACHINE OPERATORS AND ASSEMBLERS |
Females |
0 |
406 |
406 |
| |
Total |
1,107 |
142,224 |
143,331 |
| |
Males |
4,142 |
208,971 |
213,113 |
| 9 ELEMENTARY OCCUPATIONS |
Females |
304 |
84,529 |
84,833 |
| |
Total |
4,446 |
293,500 |
297,946 |
| |
Males |
46,168 |
1,070,973 |
1,117,141 |
| TOTAL |
Females |
24,908 |
128,134 |
153,042 |
| |
Total |
71,076 |
1,199,107 |
1,270,183 |
Source: census 2010, QSA
ANNEXED NOTE
1. Technical Notes and Definitions
Reference period for census 2010: the night of April 21st, 2010.
Implementation method: census is based on de jure method; i.e. registering people according to their usual place of residence at time of census.
Populations in transit or visiting Qatar as tourists, as well as residents of public housing or visitors staying in a household for less than two months after night of reference were excluded.
Populations away from usual residence in Qatar for reasons of duty, or on a visit abroad for less than two months, as well as individuals with no personal housing within Qatar staying with a household for more than two months, are counted in their usual/ present residence during census night.
Population of reference: all individuals (nationals and non-nationals) present within the State’s borders during time of reference, including in labour camps.
The employed population here also includes paid trainees.
Employed: The person (15 years or older) engaged in work or who works for profit, whether for his own account, for wages or for a family without being paid, during the week ending on 20/04/2010 provided that working hours should not be less than one hour during that week, and the sick, regular or other temporary leave should not be counted in the absence days.
Trainee getting a salary: The person (15 years or older) who joins any of the training institutes, whether morning or evening study, and gets a salary during the training period
Data related to work force include individuals of 15 years old or more (born before April 1995) and refer to the week preceding the enumeration period.
Occupations are categorised according to ISCO 88 international classification of occupations (major (1-digit) group titles).
2. Institution which provides data
Qatar Statistics Authority (QSA)
(http://www.qsa.gov.qa/eng/index.htm for website in English; http://www.qsa.gov.qa/Ar/index.htm for website in Arabic)
3. Data availability
None of Qatar censuses or other sources have ever disclosed figures of total population broken down by country of citizenship or even by nationality (Qatari/non-Qatari).
For 2010 data have been collected but remain withheld. The census only provides detailed data on population 15 years and above by nationality.
Released parts of census are available on the website of the QSA, in published form in PDF format.
https://www.mdps.gov.qa/en/statistics1/pages/topicslisting.aspx?parent=General&child=Census
Census 2010′ website:
https://www.mdps.gov.qa/en/statistics1/pages/topicslisting.aspx?parent=General&child=Census
2010′ census in Excel or PDF format individual tables:
http://www.qsa.gov.qa/QatarCensus/Census_Results.aspx
Date of access: June 2013.
| |
|
Government |
Non- |
Domestic |
|
| |
|
sector |
governmental |
services |
TOTAL |
| |
|
|
sector |
sector |
|
| Kuwaitis |
males |
167,984 |
40,540 |
0 |
208,524 |
| females |
135,654 |
42,906 |
0 |
178,560 |
| Total |
303,638 |
83,446 |
0 |
387,084 |
| Non-Kuwaitis |
males |
84,659 |
1,064,099 |
261,964 |
1,410,722 |
| females |
41,156 |
109,477 |
302,836 |
453,469 |
| Total |
125,815 |
1,173,576 |
564,800 |
1,864,191 |
| Total |
males |
252,643 |
1,104,639 |
261,964 |
1,619,246 |
| females |
176,810 |
152,383 |
302,836 |
632,029 |
| Total |
429,453 |
1,257,022 |
564,800 |
2,251,275 |
Source: PACI
ANNEXED NOTE
1. Characteristics of data and definitions
The source of data used here is the Public Authority for Civil Information (PACI), an independant government body in charge of :
1- centralising all population and labour force data in order to manage a fully computerised population register
2- issuing mandatory civil identification cards to every resident of the country, regardless of age and nationality.
The other source of demographic and socioeconomic data on Kuwait is the Central Statistical Office (CSO), operating within the Planning Ministry. The CSO has conducted ten population and housing censuses since its inception in 1957.
Since 1995 a marked discrepancy was witnessed between PACI’ and CSO’ population figures. PACI’ database is connected electronically with other administrations and bodies registering demographic events and professional/ residency issues (births and death; departures and arrivals; end of service, residency and ID deliveries, etc.).
PACI’s records of residents’ movements is thus regularly updated, which limits the risk of population overcount. Therefore, it is more likely that residents were undercounted during CSO- Ministry of Planning’s census operations (see: Shah, N. Population of Kuwait. Structure and Dynamics, Kuwait: Kuwait University Academic Publication Council, 2010, chapter 1).
(a) Kuwaiti: the Kuwaiti nationality rests upon a document of Kuwaiti nationality or a certificate proving Kuwaiti nationality issued by the Ministry of Interior of Kuwait.
(b) Non-Kuwaiti: his/ her nationality is determined by the name of the State having issued the passport. The foreign national also entered Kuwait legally and has a stamp of residence.
This category includes the Bidoon, a category of stateless persons living in the Emirate. Kuwait’s Bidoon population originates from three broad categories:
1) those whose ancestors failed to apply for nationality or lacked necessary documentation at the time of Kuwait’s independence in 1961;
2) those recruited to work in Kuwait’s army or police force during the 1960s who permanently settled in Kuwait, along with their families;
3) children of Kuwaiti mothers and stateless or foreign fathers (see Human Rights Watch. Prisoners of the Past. Kuwaiti Bidun and the Burden of Statelessness, June 2011, p. 3).
(c) Population in the labour force: population aged 15 years and above, included in the labour market, either employed (in the government or private sector, as itinerant worker, employed in the domestic sector), or unemployed.
(d) Government sector: any organization of the government (organizations, authority and departments), included within the state budget
(Ministries and government departments; authorities with attached budgets; authorities with independent budgets).
(e) Non-governmental sector: any part of the private sector (a company or an individual) or any authority of the non-governmental sector.
(f) Domestic sector: the household/ family sector, where the work is associated with the residence and its inhabitants, their service and their comfort (including maids, nannies, cooks, drivers, etc.).
Note: figures of expatriates differ slightly between PACI’s various sources of data (database; tabulated data).
2. Institution which provides data
The Public Authority for Civil Information (PACI)
3. Period of data coverage: December 2012
The database is updated three times a year and the website presents only the most recent data.
4. Data availability
The statistics section of PACI’s website (http://www.paci.gov.kw/en/ (English); http://www.paci.gov.kw/ (Arabic)) provides population and socio-economic data broken down by nationality (Kuwaiti/ non-Kuwaiti). Some data are displayed by nationality groups.
Analytical tables and data crosstabulations are available for download in PDF, html, .png and Excel (.csv) formats.
Date of access: June 2013.
|
Kuwaitis |
Arabs |
Asians |
Africans |
Europeans |
North Americans |
South Americans |
Aus.- Oceanians |
Total N.-K. |
Grand total |
| Occupation |
males |
females |
males |
females |
males |
females |
males |
females |
males |
females |
males |
females |
males |
females |
males |
females |
males |
females |
males |
females |
| Legislators, senior officials and managers |
7,522 |
2,973 |
34,327 |
2,998 |
21,458 |
1,869 |
197 |
53 |
1,103 |
245 |
1,392 |
244 |
99 |
20 |
117 |
22 |
58,693 |
5,451 |
66,215 |
8,424 |
| Professionals |
25,033 |
45,889 |
55,969 |
17,238 |
22,610 |
4,275 |
216 |
79 |
1,485 |
603 |
1,508 |
585 |
118 |
38 |
171 |
54 |
82,077 |
22,872 |
107,110 |
68,761 |
| Technicians and associate professionals |
30,858 |
26,365 |
13,837 |
4,927 |
20,601 |
19,411 |
84 |
45 |
364 |
287 |
1,722 |
541 |
48 |
7 |
22 |
13 |
36,678 |
25,231 |
67,536 |
51,596 |
| Clerks |
66,129 |
91,921 |
51,795 |
12,994 |
29,688 |
12,592 |
199 |
269 |
313 |
300 |
293 |
268 |
52 |
15 |
24 |
20 |
82,364 |
26,458 |
148,493 |
118,379 |
| Service workers and shop and market sales workers |
63,826 |
3,629 |
87,931 |
8,162 |
217,779 |
271,350 |
2,070 |
55,690 |
312 |
338 |
689 |
121 |
75 |
14 |
36 |
10 |
308,892 |
335,685 |
372,718 |
339,314 |
| Skilled agricultural and fishery workers |
131 |
5 |
4,200 |
1 |
7,499 |
4 |
363 |
0 |
2 |
0 |
0 |
0 |
0 |
0 |
0 |
0 |
12,064 |
5 |
12,195 |
10 |
| Craft and related trades workers |
8,818 |
1,067 |
44,375 |
419 |
107,738 |
1,882 |
137 |
21 |
257 |
8 |
417 |
28 |
35 |
0 |
11 |
1 |
152,970 |
2,359 |
161,788 |
3,426 |
| Production supervisors and foremen |
4,659 |
480 |
54,757 |
278 |
247,525 |
1,367 |
715 |
21 |
349 |
18 |
2,084 |
360 |
46 |
2 |
12 |
0 |
305,488 |
2,046 |
310,147 |
2,526 |
| Regular work professionals |
95 |
31 |
95,525 |
619 |
202,232 |
10,062 |
1,128 |
324 |
172 |
24 |
380 |
66 |
18 |
2 |
11 |
0 |
299,466 |
11,097 |
299,561 |
11,128 |
| Not Stated |
1,452 |
6,200 |
26,462 |
12,764 |
43,184 |
7,361 |
731 |
828 |
701 |
551 |
816 |
680 |
31 |
22 |
55 |
55 |
71,980 |
22,261 |
73,432 |
28,461 |
| Total |
208,523 |
178,560 |
469,178 |
60,400 |
920,314 |
330,173 |
5,840 |
57,330 |
5,058 |
2,374 |
9,301 |
2,893 |
522 |
120 |
459 |
175 |
1,410,672 |
453,465 |
1,619,195 |
632,025 |
Source: PACI
ANNEXED NOTE
1. Characteristics of data and definitions
The source of data used here is the Public Authority for Civil Information (PACI), an independant government body in charge of :
1- centralising all population and labour force data in order to manage a fully computerised population register
2- issuing mandatory civil identification cards to every resident of the country, regardless of age and nationality.
The other source of demographic and socioeconomic data on Kuwait is the Central Statistical Office (CSO), operating within the Planning Ministry. The CSO has conducted ten population and housing censuses since its inception in 1957.
Since 1995 a marked discrepancy was witnessed between PACI’ and CSO’ population figures. PACI’ database is connected electronically with other administrations and bodies registering demographic events and professional/ residency issues (births and death; departures and arrivals; end of service, residency and ID deliveries, etc.).
PACI’s records of residents’ movements is thus regularly updated, which limits the risk of population overcount. Therefore, it is more likely that residents were undercounted during CSO- Ministry of Planning’s census operations (see: Shah, N. Population of Kuwait. Structure and Dynamics, Kuwait: Kuwait University Academic Publication Council, 2010, chapter 1).
(a) Kuwaiti: the Kuwaiti nationality rests upon a document of Kuwaiti nationality or a certificate proving Kuwaiti nationality issued by the Ministry of Interior of Kuwait.
(b) Non-Kuwaiti: his/ her nationality is determined by the name of the State having issued the passport. The foreign national also entered Kuwait legally and has a stamp of residence.
This category includes the Bidoon, a category of stateless persons living in the Emirate. Kuwait’s Bidoon population originates from three broad categories:
1) those whose ancestors failed to apply for nationality or lacked necessary documentation at the time of Kuwait’s independence in 1961;
2) those recruited to work in Kuwait’s army or police force during the 1960s who permanently settled in Kuwait, along with their families;
3) children of Kuwaiti mothers and stateless or foreign fathers (see Human Rights Watch. Prisoners of the Past. Kuwaiti Bidun and the Burden of Statelessness, June 2011, p. 3).
(c) Population in the labour force: population aged 15 years and above, included in the labour market, either employed (in the government or private sector, as itinerant worker, employed in the domestic sector), or unemployed.
Occupations are categorised according to (slightly adapted) ISCO 88 international classification of occupations (major (1-digit) group titles).
Note: figures of expatriates differ slightly between PACI’s various sources of data (database; tabulated data).
2. Institution which provides data
The Public Authority for Civil Information (PACI)
3. Period of data coverage: December 2012
The database is updated three times a year and the website presents only the most recent data.
4. Data availability
The statistics section of PACI’s website (http://www.paci.gov.kw/en/ (English); http://www.paci.gov.kw/ (Arabic)) provides population and socio-economic data broken down by nationality (Kuwaiti/ non-Kuwaiti). Some data are displayed by nationality groups.
Analytical tables and data crosstabulations are available for download in PDF, html, .png and Excel (.csv) formats.
Date of access: June 2013.
| Occupation |
Kuwaitis |
Arabs |
Asians |
Africans |
Europeans |
North Americans |
South Americans |
Aus.- Oceanians |
Total N.-K. |
Grand total |
| Legislators, senior officials and managers |
10,495 |
37,325 |
23,327 |
250 |
1,348 |
1,636 |
119 |
139 |
64,144 |
74,639 |
| Professionals |
70,922 |
73,207 |
26,885 |
295 |
2,088 |
2,093 |
156 |
225 |
104,949 |
175,871 |
| Technicians and associate professionals |
57,223 |
18,764 |
40,012 |
129 |
651 |
2,263 |
55 |
35 |
61,909 |
119,132 |
| Clerks |
158,050 |
64,789 |
42,280 |
468 |
613 |
561 |
67 |
44 |
108,822 |
266,872 |
| Service workers and shop and market sales workers |
67,455 |
96,093 |
489,129 |
57,760 |
650 |
810 |
89 |
46 |
644,577 |
712,032 |
| Skilled agricultural and fishery workers |
136 |
4,201 |
7,503 |
363 |
2 |
0 |
0 |
0 |
12,069 |
12,205 |
| Craft and related trades workers |
9,885 |
44,794 |
109,620 |
158 |
265 |
445 |
35 |
12 |
155,329 |
165,214 |
| Production supervisors and foremen |
5,139 |
55,035 |
248,892 |
736 |
367 |
2,444 |
48 |
12 |
307,534 |
312,673 |
| Regular work professionals |
126 |
96,144 |
212,294 |
1,452 |
196 |
446 |
20 |
11 |
310,563 |
310,689 |
| Not Stated |
7,652 |
39,226 |
50,545 |
1,559 |
1,252 |
1,496 |
53 |
110 |
94,241 |
101,893 |
| Total |
387,083 |
529,578 |
1,250,487 |
63,170 |
7,432 |
12,194 |
642 |
634 |
1,864,137 |
2,251,220 |
Source: PACI
ANNEXED NOTE
1. Characteristics of data and definitions
The source of data used here is the Public Authority for Civil Information (PACI), an independant government body in charge of :
1- centralising all population and labour force data in order to manage a fully computerised population register
2- issuing mandatory civil identification cards to every resident of the country, regardless of age and nationality.
The other source of demographic and socioeconomic data on Kuwait is the Central Statistical Office (CSO), operating within the Planning Ministry. The CSO has conducted ten population and housing censuses since its inception in 1957.
Since 1995 a marked discrepancy was witnessed between PACI’ and CSO’ population figures. PACI’ database is connected electronically with other administrations and bodies registering demographic events and professional/ residency issues (births and death; departures and arrivals; end of service, residency and ID deliveries, etc.).
PACI’s records of residents’ movements is thus regularly updated, which limits the risk of population overcount. Therefore, it is more likely that residents were undercounted during CSO- Ministry of Planning’s census operations (see: Shah, N. Population of Kuwait. Structure and Dynamics, Kuwait: Kuwait University Academic Publication Council, 2010, chapter 1).
(a) Kuwaiti: the Kuwaiti nationality rests upon a document of Kuwaiti nationality or a certificate proving Kuwaiti nationality issued by the Ministry of Interior of Kuwait.
(b) Non-Kuwaiti: his/ her nationality is determined by the name of the State having issued the passport. The foreign national also entered Kuwait legally and has a stamp of residence.
This category includes the Bidoon, a category of stateless persons living in the Emirate. Kuwait’s Bidoon population originates from three broad categories:
1) those whose ancestors failed to apply for nationality or lacked necessary documentation at the time of Kuwait’s independence in 1961;
2) those recruited to work in Kuwait’s army or police force during the 1960s who permanently settled in Kuwait, along with their families;
3) children of Kuwaiti mothers and stateless or foreign fathers (see Human Rights Watch. Prisoners of the Past. Kuwaiti Bidun and the Burden of Statelessness, June 2011, p. 3).
(c) Population in the labour force: population aged 15 years and above, included in the labour market, either employed (in the government or private sector, as itinerant worker, employed in the domestic sector), or unemployed.
Occupations are categorised according to (slightly adapted) ISCO 88 international classification of occupations (major (1-digit) group titles).
Note: figures of expatriates differ slightly between PACI’s various sources of data (database; tabulated data).
2. Institution which provides data
The Public Authority for Civil Information (PACI)
3. Period of data coverage: December 2012
The database is updated three times a year and the website presents only the most recent data.
4. Data availability
The statistics section of PACI’s website (http://www.paci.gov.kw/en/ (English); http://www.paci.gov.kw/ (Arabic)) provides population and socio-economic data broken down by nationality (Kuwaiti/ non-Kuwaiti). Some data are displayed by nationality groups.
Analytical tables and data crosstabulations are available for download in PDF, html, .png and Excel (.csv) formats.
Date of access: June 2013.
| Nationality groups |
Employed population |
| Kuwaitis |
387,083 |
| Arabs |
529,578 |
| Asians |
1,250,487 |
| Africans |
63,170 |
| Europeans |
7,432 |
| North Americans |
12,194 |
| South Americans |
642 |
| Aus.- Oceanians |
634 |
| Total N.-K. |
1,864,137 |
| TOTAL |
2,251,220 |
Source: PACI
ANNEXED NOTE
1. Characteristics of data and definitions
The source of data used here is the Public Authority for Civil Information (PACI), an independant government body in charge of :
1- centralising all population and labour force data in order to manage a fully computerised population register
2- issuing mandatory civil identification cards to every resident of the country, regardless of age and nationality.
The other source of demographic and socioeconomic data on Kuwait is the Central Statistical Office (CSO), operating within the Planning Ministry. The CSO has conducted ten population and housing censuses since its inception in 1957.
Since 1995 a marked discrepancy was witnessed between PACI’ and CSO’ population figures. PACI’ database is connected electronically with other administrations and bodies registering demographic events and professional/ residency issues (births and death; departures and arrivals; end of service, residency and ID deliveries, etc.).
PACI’s records of residents’ movements is thus regularly updated, which limits the risk of population overcount. Therefore, it is more likely that residents were undercounted during CSO- Ministry of Planning’s census operations (see: Shah, N. Population of Kuwait. Structure and Dynamics, Kuwait: Kuwait University Academic Publication Council, 2010, chapter 1).
(a) Kuwaiti: the Kuwaiti nationality rests upon a document of Kuwaiti nationality or a certificate proving Kuwaiti nationality issued by the Ministry of Interior of Kuwait.
(b) Non-Kuwaiti: his/ her nationality is determined by the name of the State having issued the passport. The foreign national also entered Kuwait legally and has a stamp of residence.
This category includes the Bidoon, a category of stateless persons living in the Emirate. Kuwait’s Bidoon population originates from three broad categories:
1) those whose ancestors failed to apply for nationality or lacked necessary documentation at the time of Kuwait’s independence in 1961;
2) those recruited to work in Kuwait’s army or police force during the 1960s who permanently settled in Kuwait, along with their families;
3) children of Kuwaiti mothers and stateless or foreign fathers (see Human Rights Watch. Prisoners of the Past. Kuwaiti Bidun and the Burden of Statelessness, June 2011, p. 3).
(c) Population in the labour force: population aged 15 years and above, included in the labour market, either employed (in the government or private sector, as itinerant worker, employed in the domestic sector), or unemployed.
Note: figures of expatriates differ slightly between PACI’s various sources of data (database; tabulated data).
2. Institution which provides data
The Public Authority for Civil Information (PACI)
3. Period of data coverage: December 2012
The database is updated three times a year and the website presents only the most recent data.
4. Data availability
The statistics section of PACI’s website (http://www.paci.gov.kw/en/ (English); http://www.paci.gov.kw/ (Arabic)) provides population and socio-economic data broken down by nationality (Kuwaiti/ non-Kuwaiti). Some data are displayed by nationality groups.
Analytical tables and data crosstabulations are available for download in PDF, html, .png and Excel (.csv) formats.
Date of access: June 2013.


