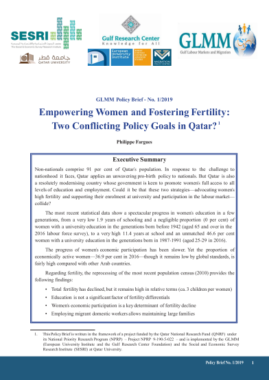
Qatar: Economically active population aged 15 and above by nationality (Qatari/ non-Qatari), sex and sector of economic activity (2016)
| Qatari | Non-Qatari | Total | |||||||
| Males | Females | Total | Males | Females | Total | Males | Females | Total | |
| Agriculture, forestry and fishing | 28 | 0 | 28 | 24,888 | 0 | 24,888 | 24,916 | 0 | 24,916 |
| Mining and quarrying | 8,140 | 1,989 | 10,129 | 85,761 | 4,650 | 90,411 | 93,901 | 6,639 | 100,540 |
| Manufacturing | 882 | 350 | 1,232 | 140,968 | 1,843 | 142,811 | 141,850 | 2,193 | 144,043 |
| Electricity, gas, steam and air conditioning supply | 1,555 | 980 | 2,535 | 14,289 | 545 | 14,834 | 15,844 | 1,525 | 17,369 |
| Water supply; sewerage, waste management and remediation activities | 308 | 350 | 658 | 8,270 | 254 | 8,524 | 8,578 | 604 | 9,182 |
| Construction | 1,359 | 126 | 1,485 | 839,461 | 6,306 | 845,767 | 840,820 | 6,432 | 847,252 |
| Wholesale and retail trade; repair of motor vehicles and motorcycles | 1,148 | 1,204 | 2,352 | 226,232 | 26,348 | 252,580 | 227,380 | 27,552 | 254,932 |
| Transportation and storage | 1,080 | 759 | 1,839 | 47,547 | 9,733 | 57,280 | 48,627 | 10,492 | 59,119 |
| Accommodation and food service activities | 336 | 504 | 840 | 55,072 | 16,770 | 71,842 | 55,408 | 17,274 | 72,682 |
| Information and communication | 2,143 | 812 | 2,955 | 11,010 | 1,648 | 12,658 | 13,153 | 2,460 | 15,613 |
| Financial and insurance activities | 1,976 | 2,212 | 4,188 | 7,910 | 3,640 | 11,550 | 9,886 | 5,852 | 15,738 |
| Real estate activities | 476 | 168 | 644 | 10,929 | 604 | 11,533 | 11,405 | 772 | 12,177 |
| Professional, scientific and technical activities | 210 | 140 | 350 | 25,248 | 3,221 | 28,469 | 25,458 | 3,361 | 28,819 |
| Administrative and support service activities | 616 | 448 | 1,064 | 78,433 | 5,352 | 83,785 | 79,049 | 5,800 | 84,849 |
| Public administration and defence; compulsory social security | 39,455 | 12,064 | 51,519 | 32,401 | 3,361 | 35,762 | 71,856 | 15,425 | 87,281 |
| Education | 2,186 | 10,059 | 12,245 | 11,285 | 23,523 | 34,808 | 13,471 | 33,582 | 47,053 |
| Human health and social work activities | 1,834 | 3,403 | 5,237 | 11,899 | 12,823 | 24,722 | 13,733 | 16,226 | 29,959 |
| Arts, entertainment and recreation | 812 | 504 | 1,316 | 4,584 | 380 | 4,964 | 5,396 | 884 | 6,280 |
| Other service activities | 379 | 266 | 645 | 11,045 | 4,502 | 15,547 | 11,424 | 4,768 | 16,192 |
| Activities of households as employers; undifferentiated goods- and services-producing activities of households for own use | 0 | 0 | 0 | 66,121 | 107,621 | 173,742 | 66,121 | 107,621 | 173,742 |
| Activities of extraterritorial organizations and bodies | 128 | 56 | 184 | 3,306 | 1,459 | 4,765 | 3,434 | 1,515 | 4,949 |
| Total | 65,051 | 36,394 | 101,445 | 1,716,659 | 234,583 | 1,951,242 | 1,781,710 | 270,977 | 2,052,687 |
Source: Annual Bulletin of Labor Force Sample survey 2016
ANNEXED NOTE
1. Technical Notes and Definitions
The data is taken from 2016 Labour Force Survey (yearly synthesis)
Sampling frame of LFS 2016: Population Census 2010.
Sample size: 60,016 persons, in 9,199 households: 1- Qatari households; 2- Non-Qatari regular (non-collective) households;
3- Non-Qatari small collective households or labour gatherings (2 – 6 persons); 4- Non-Qatari large collective households or large labour gatherings (7 persons or more).
Data Collection: The sample was divided into equal parts to collect data monthly. Each month 1/3 of the quarterly data were collected during the first two weeks of the month.
Reference period for the labour force data: the week prior to data collection day.
Population of reference: all Qatari and non-Qatari households present in Qatar on the night of survey, living in normal and collective households.
The collective households are a group of persons not related to each other and sharing living conditions in a residential unit, I.e. labour camps, students living boarding
schools, nurses in hospitals… etc. The survey covered the small collective households (includes less than 7 persons) and large collective households (includes 7 persons or more).
The survey did not cover short periods accommodation, i.e. hotels.
The present data includes active population, i.e. employed and unemployed. It does not include persons seeking work for the first time
Relation to labour force (for persons aged 15 and above)
In the labour force (= economically active).
1) Employed.
All persons aged 15 years and above, who during the week preceding the survey:
a) Perform a work for a wage, salary, profits or household gains, whether it was in cash or in kind.
b) Are temporarily not employed, however, they still have an official relation with their work
2) Unemployed.
All persons aged 15 years and over who were, during the week preceding the survey, without employment, willing to work and looking seriously for a job.
There is a distinction between two kinds of unemployed persons:
a) First time unemployed: They are the persons who never worked previously, and were during the week preceding the survey looking actively for work.
b) Unemployed who previously worked: They are the persons with a work experience, who during the week preceding the survey were actively looking for a job
Classification of economic activities: ISIC Rev. 4.
2. Institution which provides data
Ministry of Development Planning and Statistics
(http://www.mdps.gov.qa/en/pages/default.aspx)
3. Data availability
The Statistics Authority conducted the first labour Force Sample Survey in 2001. Starting from 2006, the execution of these surveys came to be on annual basis, and on a quarterly basis since 2013.
Labour Force Surveys (yearly and quarterly data) can be downloaded from MDPS’s website, in PDF and Excel format:
http://www.mdps.gov.qa/en/statistics1/pages/topicslisting.aspx?parent=Social&child=LaborForce
Last date of access: May 2018.
Similar Posts:
- Qatar: Economically active population aged 15 and above by nationality (Qatari/ non-Qatari), sex and age group (2017)
- Qatar: Economically active population aged 15 and above by nationality (Qatari/ non-Qatari), sex and employment status (2017)
- Qatar: Economically active population aged 15 and above by nationality (Qatari/ non-Qatari), sex and education level (2017)
- Qatar: Economically active population aged 15 and above by nationality (Qatari/ non-Qatari), sex and activity sector (2016)
- Qatar: Economically active population aged 15 and above by nationality (Qatari/ non-Qatari), sex and activity sector (2017)
Tags: Employment, Female Employment, Foreign Labour, Labour Market, National & Foreign Labour, National Labour, Qatar
