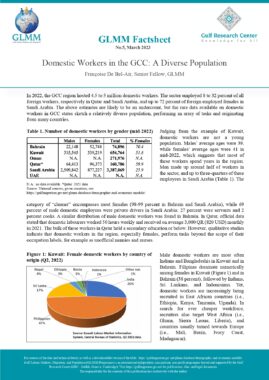
Saudi Arabia: Private sector employees by nationality (Saudi / Non-Saudi), sex and occupation category (2017)
| Saudis | Non-Saudis | Total | |||||||
| Males | Females | Total | Males | Females | Total | Males | Females | Total | |
| Directors and managers | 111,553 | 47,992 | 159,545 | 68,676 | 955 | 69,631 | 180,229 | 48,947 | 229,176 |
| Specialists in professional, technical and humanitarian fields | 85,324 | 43,616 | 128,940 | 635,610 | 27,962 | 663,572 | 720,934 | 71,578 | 792,512 |
| Technicians in professional, technical and humanitarian fields | 109,312 | 71,596 | 180,908 | 602,430 | 56,142 | 658,572 | 711,742 | 127,738 | 839,480 |
| Clerical occupations | 297,834 | 239,842 | 537,676 | 55,366 | 2,356 | 57,722 | 353,200 | 242,198 | 595,398 |
| Sales occupations | 137,330 | 128,209 | 265,539 | 503,214 | 1,968 | 505,182 | 640,544 | 130,177 | 770,721 |
| Service occupations | 292,194 | 44,484 | 336,678 | 2,640,641 | 117,213 | 2,757,854 | 2,932,835 | 161,697 | 3,094,532 |
| Agriculture, animal husbandry, fishing | 2,949 | 633 | 3,582 | 501,986 | 104 | 502,090 | 504,935 | 737 | 505,672 |
| Supporting basic engineering occupations | 202,381 | 20,485 | 222,866 | 2,888,491 | 551 | 2,889,042 | 3,090,872 | 21,036 | 3,111,908 |
| Industrial and chemical processes and food industries occupations | 24,159 | 8,110 | 32,269 | 190,713 | 12,654 | 203,367 | 214,872 | 20,764 | 235,636 |
| Other occupations | 30,036 | 888 | 30,924 | 4,849 | 393 | 5,242 | 34,885 | 1,281 | 36,166 |
| Total | 1,293,072 | 605,855 | 1,898,927 | 8,091,976 | 220,298 | 8,312,274 | 9,385,048 | 826,153 | 10,211,201 |
Source: Ministry of Labour and Social Development, Data section
ANNEXED NOTE
1. Technical Notes and Definitions
Ministry of Labour’s records of employed labourers.
Classification used for occupations is adapted from ISCO 1988.
2. Institution which provides data
Ministry of Labour and Social Development (MLSD).
https://mlsd.gov.sa/en/
https://mlsd.gov.sa/
3. Data availability
Ministry of Labour’s records of employees and job-seekers in the private sector are published in chapter “Labour and Social Security” of GAStat’s Annual Yearbooks (in Arabic and English, Excel format):
https://www.stats.gov.sa/en/940
The data is also published in the Saudi Arabian Monetary Authority (SAMA) Annual Statistics (“miscellaneous statistics” section) (Excel format)
http://www.sama.gov.sa/en-US/EconomicReports/Pages/YearlyStatistics.aspx
Last date of access: July 2018.
Similar Posts:
- Saudi Arabia: Private sector employees by nationality (Saudi / Non-Saudi) and sex (2005-2017)
- Saudi Arabia: Public sector employees by nationality (Saudi / Non-Saudi) and sex (1970-2017)
- Saudi Arabia: Work permits issued by occupation category (private sector, 2005-2016)
- Saudi Arabia: Number of work permits issued by year (private sector) (2000-2016)
- Saudi Arabia: Employed population (aged 15 and over) by nationality (Saudi / Non-Saudi), sex and main occupation group (August 2016)
Tags: Employment, Female Employment, Foreign Labour, Highly- Skilled Labour, Labour Market, Low-skilled Labour, National & Foreign Labour, National Labour, Saudi Arabia
