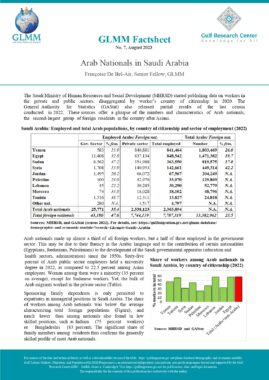
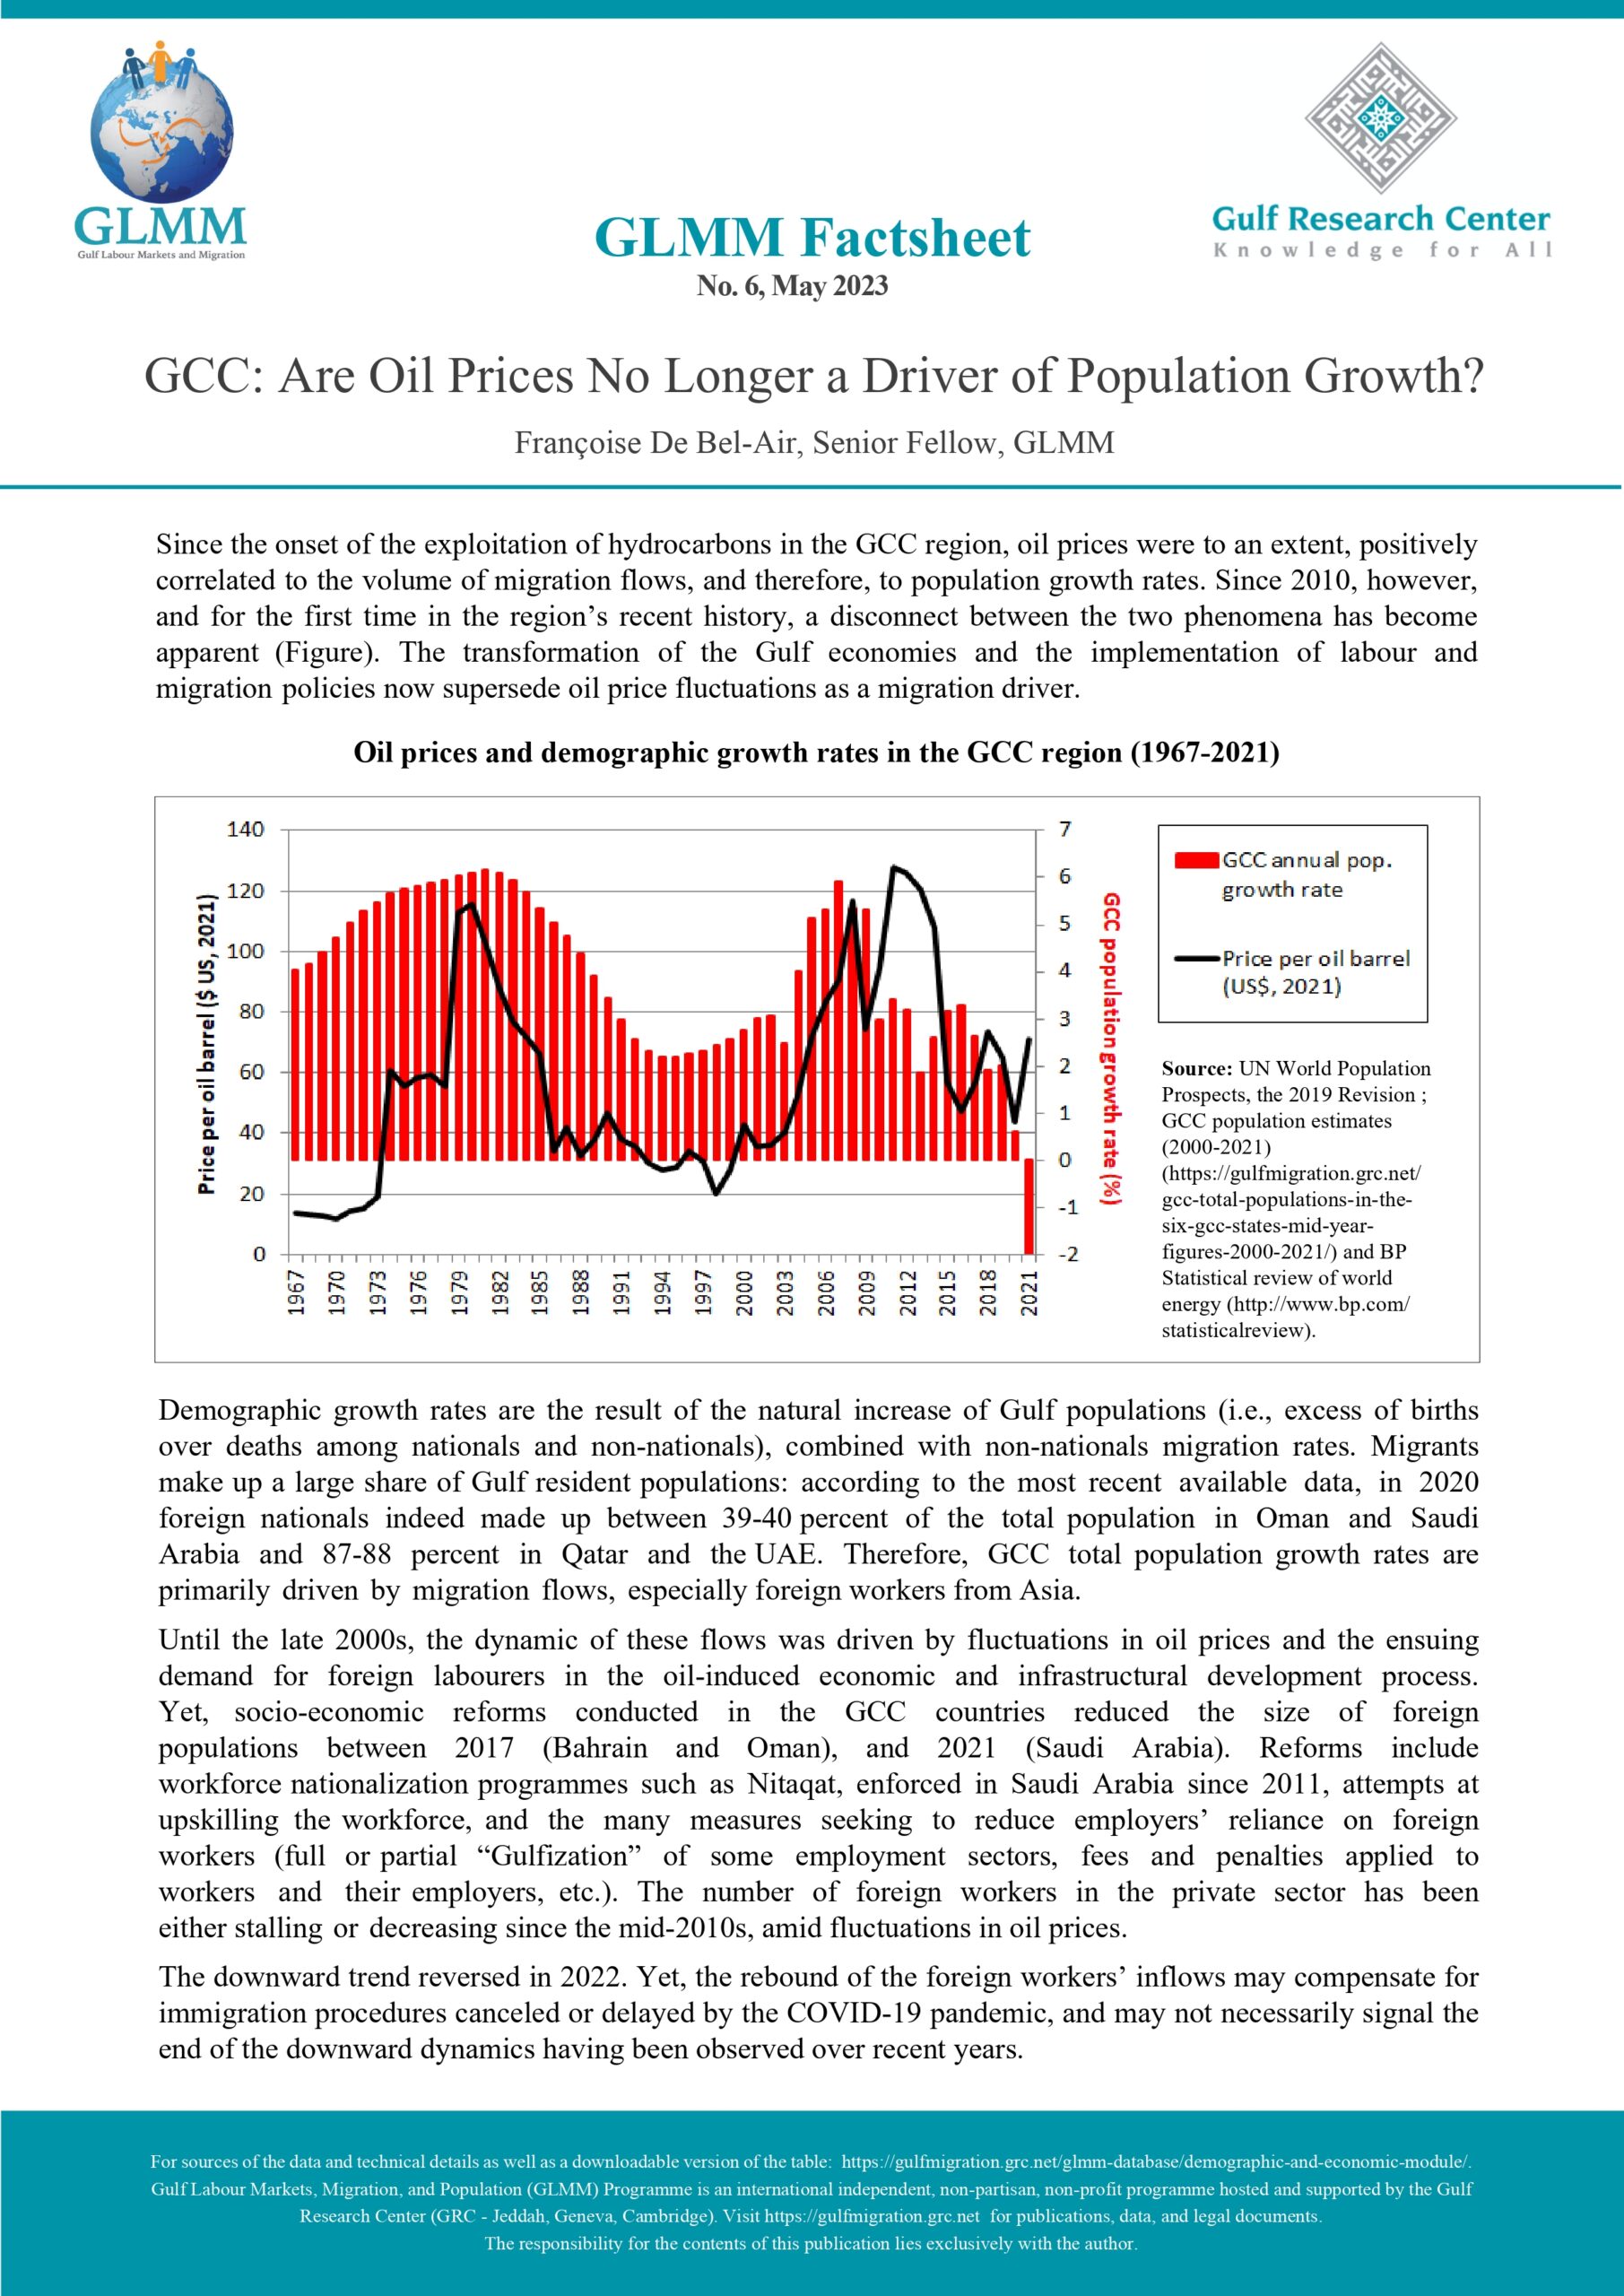
Saudi Arabia: Percent distribution of the Saudi and non-Saudi employed populations by sector of employment (Q2 2016-Q2 2023)
|
|
Public Sector* |
Private Sector |
Domestic sector |
Other*** |
Total employed |
||||||||||||||
|
Private business sector** |
Agricultural sector |
||||||||||||||||||
|
Saudis |
non-Saudis |
Total |
Saudis |
non-Saudis |
Total |
Saudis |
non-Saudis |
Total |
Saudis |
non-Saudis |
Total |
Saudis |
non-Saudis |
Total |
Saudis |
non-Saudis |
Total |
||
|
2016 Q2 |
69.0 |
3.4 |
31.5 |
30.7 |
74.4 |
55.7 |
0.0 |
0.0 |
0.0 |
0.0 |
21.7 |
12.4 |
0.3 |
0.6 |
0.4 |
N.A. |
N.A. |
N.A. |
|
|
2016 Q3 |
69.6 |
2.7 |
29.8 |
30.1 |
83.9 |
62.1 |
0.0 |
0.0 |
0.0 |
0.0 |
13.1 |
7.8 |
0.3 |
0.3 |
0.3 |
N.A. |
N.A. |
N.A. |
|
|
2016 Q4 |
68.8 |
3.2 |
29.6 |
30.7 |
78.7 |
59.4 |
0.0 |
0.0 |
0.0 |
0.0 |
17.6 |
10.5 |
0.5 |
0.5 |
0.4 |
N.A. |
N.A. |
N.A. |
|
|
2017 Q1 |
69.7 |
3.9 |
29.8 |
29.9 |
79.0 |
59.7 |
0.0 |
0.0 |
0.0 |
0.0 |
16.8 |
10.2 |
0.4 |
0.3 |
0.4 |
3,038,945 |
10,850,192 |
13,889,137 |
|
|
2017 Q2 |
71.4 |
4.0 |
31.0 |
28.3 |
81.5 |
60.2 |
0.0 |
0.0 |
0.0 |
0.0 |
14.1 |
8.4 |
0.2 |
0.4 |
0.3 |
3,052,449 |
10,788,709 |
13,841,158 |
|
|
2017 Q3 |
70.7 |
2.6 |
29.7 |
28.9 |
80.5 |
60.0 |
0.0 |
0.0 |
0.0 |
0.0 |
16.5 |
9.9 |
0.3 |
0.4 |
0.4 |
3,063,744 |
10,694,320 |
13,758,064 |
|
|
2017 Q4 |
70.3 |
3.7 |
30.5 |
29.3 |
78.9 |
58.9 |
0.0 |
0.0 |
0.0 |
0.0 |
16.9 |
10.1 |
0.4 |
0.5 |
0.5 |
3,163,846 |
10,417,295 |
13,581,141 |
|
|
2018 Q1 |
69.3 |
3.4 |
29.9 |
30.4 |
78.8 |
59.3 |
0.0 |
0.0 |
0.0 |
0.0 |
17.4 |
10.4 |
0.3 |
0.4 |
0.4 |
3,150,409 |
10,183,104 |
13,333,513 |
|
|
2018 Q2 |
70.7 |
3.5 |
30.2 |
28.9 |
77.0 |
57.8 |
0.0 |
0.0 |
0.0 |
0.0 |
19.2 |
11.5 |
0.4 |
0.4 |
0.4 |
3,125,343 |
9,892,723 |
13,018,066 |
|
|
2018 Q3 |
N.A |
N.A |
N.A |
N.A |
N.A |
N.A |
N.A |
N.A |
N.A |
N.A |
N.A |
N.A |
N.A |
N.A |
N.A |
3,109,987 |
9,578,055 |
12,688,042 |
|
|
2018 Q4 |
N.A |
N.A |
N.A |
N.A |
N.A |
N.A |
N.A |
N.A |
N.A |
N.A |
N.A |
N.A |
N.A |
N.A |
N.A |
3,111,199 |
9,429,419 |
12,540,618 |
|
|
2019 Q1 |
65.5 |
3.7 |
28.4 |
34.0 |
76.7 |
59.7 |
0.0 |
0.0 |
0.0 |
0.0 |
19.0 |
11.4 |
0.4 |
0.6 |
0.6 |
3,112,029 |
9,653,212 |
12,765,241 |
|
|
2019 Q2 |
64.2 |
3.8 |
28.7 |
35.5 |
77.3 |
60.0 |
0.0 |
0.0 |
0.0 |
0.0 |
18.4 |
10.8 |
0.3 |
0.5 |
0.5 |
3,090,248 |
9,766,784 |
12,857,032 |
|
|
2019 Q3 |
62.1 |
2.9 |
27.5 |
37.6 |
78.3 |
61.4 |
0.0 |
0.0 |
0.0 |
0.0 |
18.5 |
10.8 |
0.3 |
0.4 |
0.3 |
3,100,812 |
9,827,096 |
12,927,908 |
|
|
2019 Q4 |
61.6 |
3.2 |
28.0 |
38.0 |
75.9 |
59.8 |
0.0 |
0.0 |
0.0 |
0.0 |
20.4 |
11.8 |
0.3 |
0.4 |
0.4 |
3,170,272 |
10,220,703 |
13,390,975 |
|
|
2020 Q1 |
60.0 |
2.9 |
27.3 |
39.7 |
76.8 |
61.0 |
0.0 |
0.0 |
0.0 |
0.0 |
19.9 |
11.4 |
0.3 |
0.3 |
0.3 |
3,203,423 |
10,432,189 |
13,635,612 |
|
|
2020 Q2 |
59.3 |
4.3 |
28.6 |
40.4 |
70.9 |
57.5 |
0.0 |
0.0 |
0.0 |
0.0 |
24.5 |
13.7 |
0.2 |
0.3 |
0.3 |
3,171,422 |
10,459,032 |
13,630,454 |
|
|
2020 Q3 |
59.1 |
4.8 |
28.9 |
40.7 |
70.7 |
57.4 |
0.0 |
0.0 |
0.0 |
0.0 |
24.2 |
13.5 |
0.2 |
0.3 |
0.2 |
3,253,276 |
10,201,862 |
13,455,138 |
|
|
2020 Q4 |
54.0 |
4.7 |
27.3 |
45.8 |
71.4 |
59.6 |
0.0 |
0.0 |
0.0 |
0.0 |
23.6 |
12.8 |
0.2 |
0.3 |
0.2 |
3,252,198 |
10,066,500 |
13,318,698 |
|
|
2021 Q1 |
53.8 |
4.1 |
26.2 |
44.0 |
58.9 |
52.3 |
1.7 |
2.6 |
2.2 |
0.0 |
33.9 |
18.9 |
0.5 |
0.5 |
0.5 |
3,306,598 |
10,177,215 |
13,483,813 |
|
|
2021 Q2 |
54.8 |
3.8 |
26.6 |
43.4 |
60.8 |
53.0 |
1.0 |
2.3 |
1.7 |
0.0 |
32.5 |
18.0 |
0.8 |
0.7 |
0.7 |
3,280,014 |
9,619,874 |
12,899,888 |
|
|
2021 Q3 |
53.3 |
5.7 |
27.1 |
44.1 |
59.0 |
52.3 |
1.7 |
2.3 |
2.0 |
0.0 |
32.4 |
17.8 |
0.8 |
0.6 |
0.7 |
3,342,838 |
9,362,807 |
12,705,645 |
|
|
2021 Q4 |
52.8 |
4.1 |
26.7 |
45.2 |
65.0 |
55.8 |
1.4 |
2.8 |
2.2 |
0.0 |
27.5 |
14.7 |
0.7 |
0.5 |
0.7 |
3,450,057 |
9,595,181 |
13,045,238 |
|
|
2022 Q1 |
53.9 |
4.0 |
27.1 |
44.6 |
64.5 |
55.3 |
1.2 |
2.5 |
1.9 |
0.0 |
28.5 |
15.3 |
0.4 |
0.5 |
0.3 |
3,571,876 |
10,158,773 |
13,730,649 |
|
|
2022 Q2 |
52.5 |
3.6 |
27.2 |
45.8 |
67.4 |
56.9 |
1.3 |
2.6 |
2.0 |
0.0 |
26.2 |
13.5 |
0.5 |
0.2 |
0.3 |
3,638,144 |
10,531,619 |
14,169,763 |
|
|
2022 Q3 |
51.7 |
3.9 |
27.0 |
46.7 |
66.3 |
56.8 |
1.3 |
2.9 |
2.1 |
0.0 |
26.5 |
13.7 |
0.3 |
0.4 |
0.3 |
3,692,486 |
10,898,457 |
14,590,943 |
|
|
2022 Q4 |
53.1 |
4.3 |
28.1 |
45.3 |
69.3 |
57.6 |
1.3 |
2.3 |
1.8 |
0.0 |
23.7 |
12.1 |
0.3 |
0.4 |
0.5 |
3,770,631 |
10,987,727 |
14,758,358 |
|
|
2023 Q1 |
52.6 |
3.7 |
27.4 |
45.5 |
65.8 |
55.9 |
1.5 |
2.3 |
1.9 |
0.0 |
27.7 |
14.2 |
0.4 |
0.6 |
0.4 |
3,870,481 |
11,492,891 |
15,363,372 |
|
|
2023 Q2 |
52.1 |
3.7 |
27.2 |
45.9 |
67.1 |
56.8 |
1.4 |
3.0 |
2.2 |
0.0 |
25.7 |
13.2 |
0.6 |
0.5 |
0.6 |
3,857,097 |
11,597,971 |
15,455,068 |
|
Source: Labour Market Statistics, Statistical Database, General Authority for Statistics (GAStat)
1. Data collection methodology and definitions used
* Public sector: government, institution or company wholly owned by the government
**Private business sector or an activity owned by the individual (non-agricultural)
***Other: Non-profit organizations (non-profit organizations, non-governmental organizations, mosques); international organisations, other and unspecified employment sector.
LFS were first conducted in 2001 and became bi-annual after 2006. Data were collected through nationally representative household sample surveys, which sampling was based on most recent censuses.
Since 2016, Labour Force Surveys have been conducted and published on a quarterly basis, based on the following sources:
1. Household telephone surveys conducted by GAStat.
2. Employment data extracted from administrative records, introduced as a complement to the results of Labour Force Surveys in Labour Market Statistics’ publications, starting on Q1 2017.
Types of data by source:
1. Household Telephone Surveys:
Estimates of labor force, unemployed individuals, and indicators of labor force.
2. Administrative records:
– Ministry of Human Resources and Social Development (MHRSD)
(formerly Ministry of Labour and Social Development):
Supplies data on:
Government sector’s workers and private sector visas.
– General Organization of Social Insurance (GOSI):
Supplies data on:
a. contributors on the job who are subject to social insurance laws and regulations in the private and government sectors;
b. workers who terminated their contribution to social insurance during the quarter.
– National Information Center (NIC):
Supplies data on:
a. job seekers in the public and private sectors from the data of (Jadara and Sa’ed) in the MHRSD, at (Taqat) portal of the HRDF;
b. government sector and individuals’ visas;
c. numbers of domestic workers.
Figures of workers in Labor Market statistics which were derived from administrative records do not include the following categories:
1-Workers in the military and security sectors;
2- Workers who are not registered in the civil service and social insurance records, which include:
– Saudis working for their own businesses and are not subjected to the labor regulations, also, not registered in social insurance, such as those who work in delivery through electronic apps;
– Saudi employers who work in establishments and not registered in the social insurance;
– Non-Saudi staff working in foreign international, political or military missions.
3- Non-Saudi employees who come to the Kingdom for work that normally takes less than three months to be completed.
Definitions and categories used by GAStat in Labour Markets Statistics (employment; unemployment; occupation and activity sectors, etc.) are based on international standards.
For LFS methodology and definitions, see:
https://www.stats.gov.sa/en/node/9787
2. Institution which provides data
General Authority for Statistics (GAStat)
3. Data availability
The percent time series were taken from GAStat’s statistical database:
Report Link:
https://database.stats.gov.sa/home/report/239
The numerical time-series (total employed) was taken from the Register-based Labour Market Statistics- Q4, 2022 (English and Arabic versions):
https://www.stats.gov.sa/sites/default/files/LMS_2022_Q4_EN_1.xlsx
https://www.stats.gov.sa/sites/default/files/LMS_2022_Q4_AR_1.xlsx
and from relevant quarterly Register-based Labour Market Statistics reports for 2023, accessible from:
https://www.stats.gov.sa/en/814
https://www.stats.gov.sa/ar/814
Date of access: 30 March 2024.
Keywords: Employment, Female Employment, Saudi Arabia, National & Foreign Labour; Domestic Workers
GLMM and GRC cannot guarantee that the link to access the source will not change; that the information will not be removed from the website it was obtained from; that no geo-blockages will be imposed; or that the information will not be available for any another reason.
Similar Posts:
- Saudi Arabia: Total employed population (aged 15 and above) by nationality (Saudi / Non-Saudi), sex and sector of employment (governmental, private, domestic labour) (Q3, 2018)
- Saudi Arabia: Workers who discontinued their registration with the General Organisation for Social Insurance (GOSI), by nationality (Saudi/non-Saudi) and sex (Q1 2020-Q2 2024)
- Saudi Arabia: Employed population by nationality (Saudi / non-Saudi) and sex (Q1 2017 – Q3 2021)
- Saudi Arabia: Employed population by nationality (Saudi /non-Saudi) and sex (Q1 2017-Q3 2023)
- Saudi Arabia: Percent distribution of the Saudi employed population by sex and sector of employment (Q2 2016-Q2 2023)
Tags: Domestic Workers, Employment, Female Employment, National and Foreign Labour, Saudi Arabia
